Embed Size (px)
Citation preview
Shoreline change analysis and insight into the sedimenttransport path along Santa Catarina Island north shore,Brazil
Author
da Silva, Guilherme Vieira, Muler, Mariela, Prado, Michel FV, Short, Andrew D, da FontouraKlein, Antonio Henrique, Toldo, Elirio E
Published
2016
Journal Title
Journal of Coastal Research
Version
Version of Record (VoR)
DOI
https://doi.org/10.2112/JCOASTRES-D-15-00164.1
Copyright Statement
© 2016 CERF. The attached file is reproduced here in accordance with the copyright policyof the publisher. Please refer to the journal's website for access to the definitive, publishedversion.
Downloaded from
http://hdl.handle.net/10072/370457
Griffith Research Online
https://research-repository.griffith.edu.au
Journal of Coastal Research 32 4 863-874 Coconut Creek, Florida July 2016
Shoreline Change Analysis and Insight into the Sediment Transport Path along Santa Catarina Island North Shore, Brazil
Guilherme Meira da Silva***, Mariela Muler5, Michel F.V. Prado**, Andrew D. Short**, Antonio Henrique da Fontoura Klein**, and Elírio E. Toldo Jr.*
+CECO ^School of Earth and Environmental Sciences Instituto de Geociências University of Wollongong Universidade Federal do Rio Grande do Sul Wollongong, NSW, Australia Porto Alegre, RS, Brazil
§CETESB nLaboratório de Oceanografia Costeira Companhia Ambiental do Estado de São Departamento de Geociências Paulo Universidade Federal de Santa Catarina
Taubaté, SP, Brazil Florianópolis, SC, Brazil
**School of Geosciences University of Sydney Sydney, NSW, Australia
Vieira da Silva, G.; Muler, M.; Prado, M.F.V.; Short, A.D.; Klein, A.H.F., and Toldo, E.E., Jr., 2016. Shoreline change analysis and insight into the sediment transport path along Santa Catarina Island north shore, Brazil. Journal of Coastal Research, 32(4), 863-874. Coconut Creek (Florida), ISSN 0749-0208.
This paper presents a shoreline change analysis applied to identify the sediment transport path involving nine adjoining beaches, including dunes and spits, located along the microtidal eastern and northern shores of Santa Catarina Island (Brazil) and extending 50 km from Barra-Moçambique to Daniela. A data set was comprised of aerial images from 1957, 1978, 1998, 2002, 2007, and 2010, and the 2012 shoreline position measured with real-time kinematic GPS, topobathymetric data set, and a 60-year water-level time series. The images were rectified and the shoreline position for each year was extracted. The average errors (ranging from 1 to 9.8 m) of the rectification process as well as the horizontal tide-related errors (varying from 8.3 ± 2.6 m to 14.9 ± 0.6 m) were calculated within a confidence level of 95%. Two complementary approaches were used: (1) general trends analysis using linear regression rate method and (2) shoreline behaviour statistically analysed by Euclidean distance and year-to-year analysis. The results indicate an anticlockwise longshore transport between a series of beaches with variable orientation and separated by headlands, including a dune overpassing from Santinho delivering ~ 10,000 m3 y1 to Ingleses, and headland bypassing leading to the development of three spits along the protected part of the study area that have possibly been nourished by subaqueous sand transport from the updrift beaches. During its development the Ponta das Canas spit grew ~7000 m3 y_1, controlling the sediment availability downdrift. As the spit grows it traps sediment and the downdrift area retreats; on the other hand, when the spit merges to the coast the sand spreads and the downdrift beaches prograde.
ADDITIONAL INDEX WORDS: Shoreline evolution , historical trends , headland bypassing , spits, beach rotation, pocket beaches.
INTRODUCTION
Beaches are natural environments that fluctuate in response to changing physical processes. The knowledge of their fluctuations has evolved beyond an academic and scientific exercise to become a common objective of most coastal management programs (Moore, Ruggiero, and List, 2006) such as setback lines definition (Ferreira et al., 2006). An effective approach to understanding these processes is through exami- nation of historical shoreline change (Dolan et al ., 1980) to determine shoreline stability, setback and hazards lines. It has been shown that shoreline changes analysis provides a good indication of erosion/accretion rates (Absalonsen and Dean, 2011; Farris and List, 2007; Jones et al ., 2009) as well as being used as regional and historical data points for calculating the sediment budget (Toldo et al ., 2013).
DOI: 10.2112 / JCOASTRES-D-15-00164.1 received 1 September 2015; accepted in revision 11 November 2015 ; corrected proofs received 15 December 2015; published pre-print online 1 February 2016. ^Corresponding author: [email protected] ®Coastal Education and Research Foundation, Inc. 2016
Despite being bounded by headlands or man-made struc- tures, embayed beaches are very dynamic, presenting a seasonal or event-related variation in width, morphodynamic state and orientation (beach rotation process) (Harley et al ., 2014; Klein, Benedet Filho, and Schumacher, 2002; Masselink and Pattiaratch, 2001; Ojeda and Guillen, 2008; Ranasinghe et al ., 2004; Short et al.y 1995; Short and Masselink, 1999; Turki et al., 2013). Because of their physical limits, embayed beaches and beaches bounded by hydrodynamic obstacles (such as inlets) have frequently been considered closed systems (with- out significant input/output of sediment), although several studies have reported obstacles bypassing and overpassing (Ab Razak et al ., 2013; Boeyinga et al ., 2010; Cheung, Gerritsen, and Cleveringa, 2007; Eslami et al., 2010; Fitzgerald, Krauss, and Hands, 2000; FitzGerald and Pendleton, 2002; Goodwin, Freeman, and Blackmore, 2013; Mariani, Carley, and Miller, 2010; Short and Masselink, 1999; Silvester, 1985). A conceptual model of headland bypassing was presented by Short and Masselink (1999). According to the authors the process begins with the beach rotation when sand is accumulated on the
w www.cerf-jcr.org
www.JCRonline.org
864 da Silva et al.
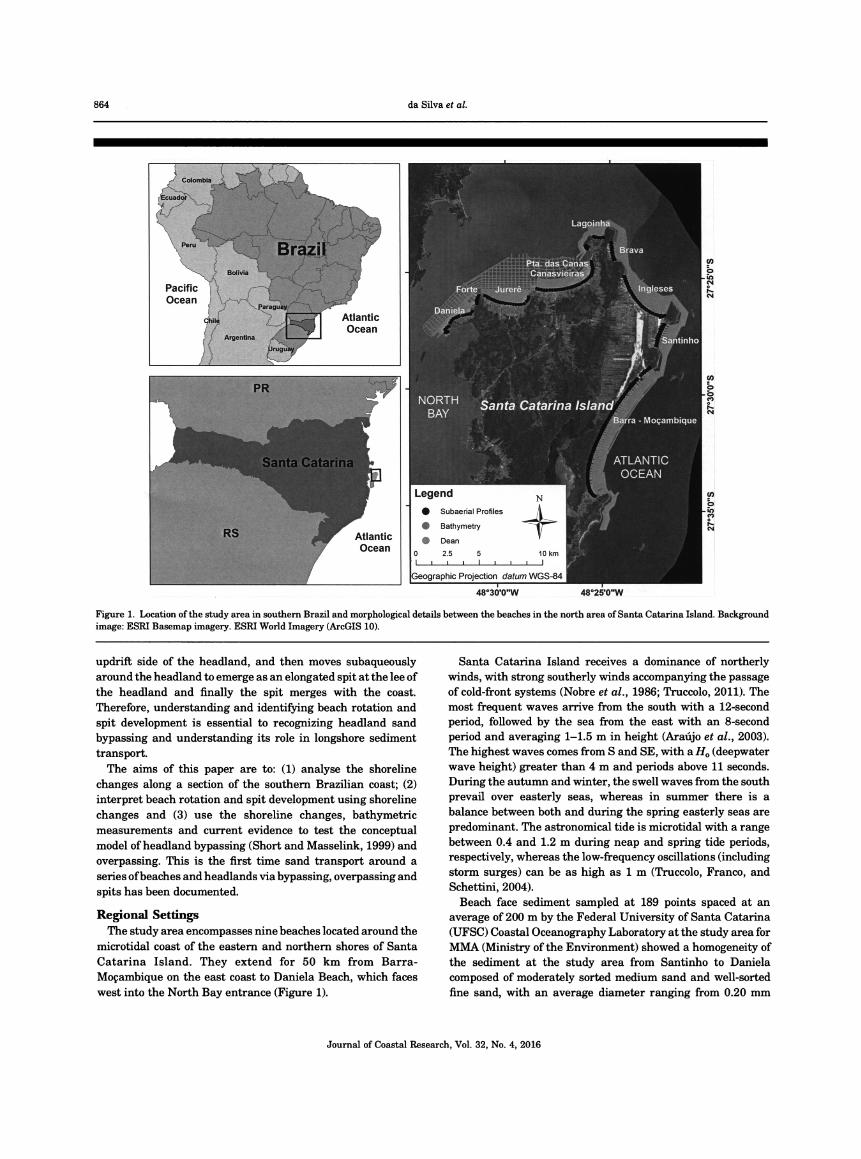
Figure 1. Location of the study area in southern Brazil and morphological details between the beaches in the north area of Santa Catarina Island. Background image: ESRI Basemap imagery. ESRI World Imagery (ArcGIS 10).
updrift side of the headland, and then moves subaqueously around the headland to emerge as an elongated spit at the lee of the headland and finally the spit merges with the coast. Therefore, understanding and identifying beach rotation and spit development is essential to recognizing headland sand bypassing and understanding its role in longshore sediment transport.
The aims of this paper are to: (1) analyse the shoreline changes along a section of the southern Brazilian coast; (2) interpret beach rotation and spit development using shoreline changes and (3) use the shoreline changes, bathymétrie measurements and current evidence to test the conceptual model of headland bypassing (Short and Masselink, 1999) and overpassing. This is the first time sand transport around a series of beaches and headlands via bypassing, overpassing and spits has been documented.
Regional Settings The study area encompasses nine beaches located around the
microtidal coast of the eastern and northern shores of Santa
Catarina Island. They extend for 50 km from Barra- Moçambique on the east coast to Daniela Beach, which faces west into the North Bay entrance (Figure 1).
Santa Catarina Island receives a dominance of northerly winds, with strong southerly winds accompanying the passage of cold-front systems (Nobre et al., 1986; Truccolo, 2011). The most frequent waves arrive from the south with a 12-second period, followed by the sea from the east with an 8-second period and averaging 1-1.5 m in height (Araújo et al ., 2003). The highest waves comes from S and SE, with a H0 (deepwater wave height) greater than 4 m and periods above 11 seconds. During the autumn and winter, the swell waves from the south prevail over easterly seas, whereas in summer there is a balance between both and during the spring easterly seas are predominant. The astronomical tide is microtidal with a range between 0.4 and 1.2 m during neap and spring tide periods, respectively, whereas the low-frequency oscillations (including storm surges) can be as high as 1 m (Truccolo, Franco, and Schettini, 2004).
Beach face sediment sampled at 189 points spaced at an average of 200 m by the Federal University of Santa Catarina (UFSC) Coastal Oceanography Laboratory at the study area for MMA (Ministry of the Environment) showed a homogeneity of the sediment at the study area from Santinho to Daniela composed of moderately sorted medium sand and well-sorted fine sand, with an average diameter ranging from 0.20 mm
Journal of Coastal Research, Vol. 32, No. 4, 2016
Shoreline Changes and Sediment Transport Path 865
Table 1. Images sources, resolution and scale.
Scanning Resolution
Year Source Scale (dots per inch)
1957 Secretaria de Planejamento e Gestão do 1:25,000 600 Estado
1978 Departamento Nacional de Produção 1:25,000 600 Mineral
1998 Centrais Elétricas de Santa Catarina 1:15,000 400 S.A.
2002 Instituto de Planejamento Urbano de 1:8,000 600 Florianópolis (IPUF)
2007 IPUF 1:8,000 600 2010 Secretaria de Desenvolvimento 1:10,000 600
Sustentável - Diretoria de Recursos
Hídricos - Coordenação de Cartografia
(near the southern Ingleses) and 0.30 mm (near the southern Brava). Barra-Moçambique Beach had the greatest variations. In the southern sector 65% of the samples are composed of fine sand (0.20 mm to 0.25 mm) and 35% of medium sand (0.26 mm
to 0.41 mm), ranging from moderately to well sorted. The central sector ranged from moderately to well sorted with 48% fine sand (0.23 mm to 0.25 mm), 48% medium sand (0.26 mm to 0.43mm) and only one sample (4%) classified as coarse sand (0.52mm), with a slight increase in grain diameter from south to north. In the northern sector grain size decreased northward, with 32% of the samples classified as fine sand (0.21 mm to 0.25 mm), 64% as medium sand (0.25 mm to 0.44 mm) and 4% as coarse sand, all ranging from moderately sorted to well sorted.
The beaches in the study area vary from sheltered reflective beaches in the north to predominantly rip-dominated trans- verse bar and rip to rhythmic bar and beach, also including a double bar system at Moçambique (Klein, Short, and Bonetti, 2016) in the east.
Porpilho et al. (2015) used interferometrie and current meter data to identify an intensification of the current in front of the headland between Moçambique and Santinho leading to a net northward sediment transport. CPE (2010) conducted a numerical modeling study at the study area and the results indicate that the intensification of currents near the headlands
of the study area (the results cover from Daniela to Brava beaches) was observed in Brava-Lagoinha and Lagoinha-Ponta das Canas headlands during flood tide condition. During ebb tides this intensification is not observed, suggesting a net transport toward North Bay.
METHODS
This section is divided into four subsections. The first
subsection will present the data set used; the second defines the shoreline indicator; the third describes the shoreline position error quantification; and finally the fourth presents the shoreline changes analysis.
Data Set
A set of aerial photos from 1957, 1978, 1998, 2002, 2007 and 2010 from multiple sources (Table 1), as well as a real-time kinematic (RTK) GPS field survey from 2012, were used to analyse the decadal shoreline changes along the north shore of
Santa Catarina Island. The images were digitalized in variable resolution to standardize the pixel size representation of at least ~1 m as suggested by Araujo et al. (2009).
Image rectification was performed in a GIS environment by relating the image to actual coordinates. The coordinates can be obtained in the field or in digital cartographic databases. In this case, a digital 1:2000 base map (Instituto de Planejamento Urbano de Florianópolis [IPUF]) was used, with its accuracy calculated by Muler et al. (2014) at 1.63 m. As the error was a systematic displacement of the base map it was corrected by subtracting the error of both east and north directions; the corrected base map error tended to zero.
Beside the shorelines digitalized from aerial photos, a set of in situ data was measured and is presented in Figure 1. It comprises subaerial beach profiles and a bathymétrie survey, as well as a shoreline position measured with a RTK-GPS.
Beach profiling and a bathymétrie survey were carried out by UFSC Coastal Oceanography Laboratory at the study area for a MMA in 2013. The beach profiling survey consisted of 189 transect lines perpendicular to the shoreline, spaced an average of 200 m apart encompassing all the studied beaches. It was conducted using a RTK-GPS Trimble R6 from the most onshore to the most offshore position where the RTK-GPS antenna was safe and dry. The data were real- time corrected by a base station set in a known position. The bathymétrie survey was conducted with interferometer Edge Tech® 4600 at a frequency of 540 kHz and a swath of 400 beams with 0.2-m diameter, resulting in a coverage swath corresponding to three times the water depth. The system has an integrated sound velocity sensor Teledyne Odom Hydrographie Digibar Pro for postprocessing the bathyme- try and two differential GPS (DGPS) using an Omnistar XP to correct its position and identify the boat heading, as well as a ship motion control inertial movement unit (SMC IMU- 108) motion sensor to correct the boat movements (pitch, roll and heave), all linked to a processing unit. A total of 865 km was mapped, covering the whole study area from the most onshore depth the boat could safely navigate to below the closure depth. The gap between the subaerial beach profiles and the bathymétrie data was completed using the equilib- rium profile presented by Bruun (1954) and Dean (1977). For each measured profile an iterative process was used to identify the "A" factor that best fits the study area. This procedure was necessary because we found that at the swash zone and very shallow waters {i.e. <1 m) the beach slope varies considerably and the A parameter should be adapted for each case, so the gap between subaerial profiles and bathymetry was a smooth transition, avoiding abrupt bathymétrie changes.
A 60-year (1948-2008) water-level series developed by SMC- Brasil (MMA and Instituto de Hidráulica Ambiental of Universidade de Cantábria) was used to analyze the range of the high water line (HWL) in a timescale compatible to the shoreline change analysis. The series is composed of both astronomical (from TPXO [Egbert, Bennett, and Foreman, 1994; Egbert and Erofeeva, 2002]) and meteorological effects from numerical simulations using wind and pressure fields as input.
Journal of Coastal Research, Vol. 32, No. 4, 2016
866 da Silva et al.
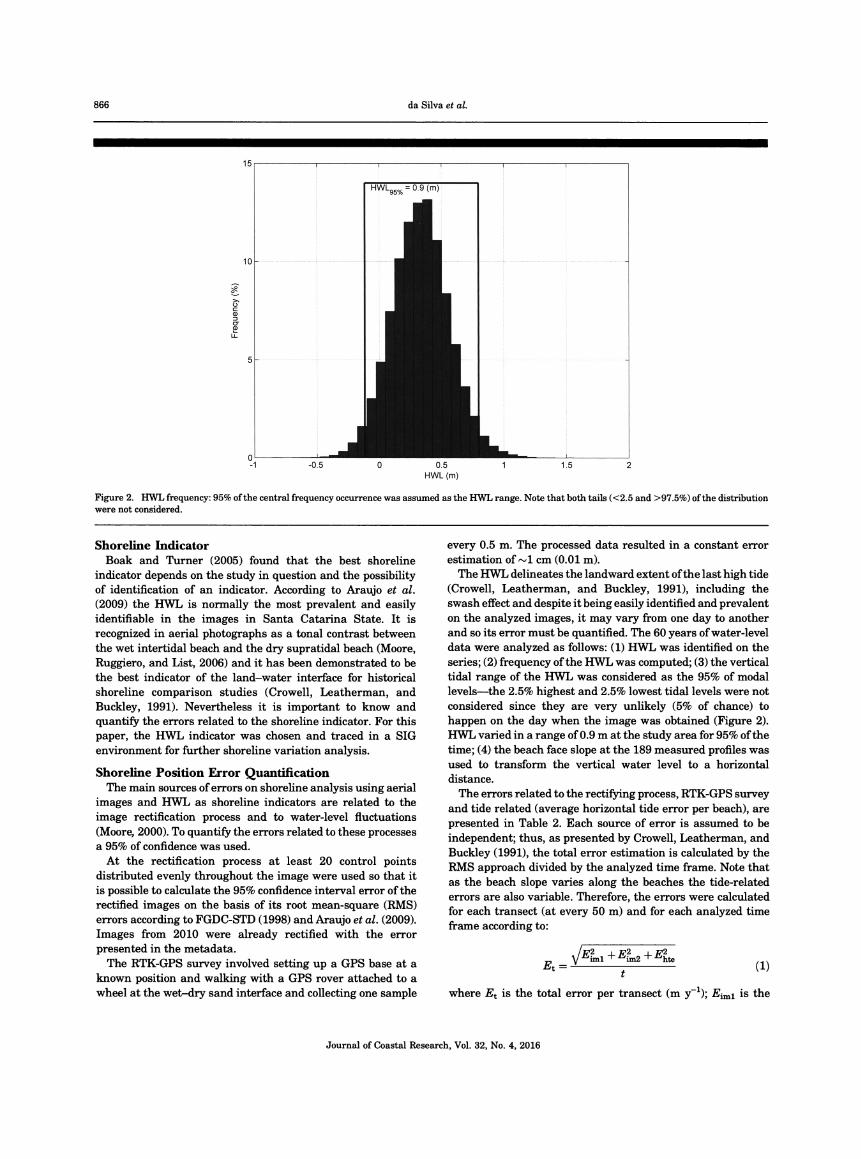
Figure 2. HWL frequency: 95% of the central frequency occurrence was assumed as the HWL range. Note that both tails (<2.5 and >97.5%) of the distribution were not considered.
Shoreline Indicator
Boak and Turner (2005) found that the best shoreline indicator depends on the study in question and the possibility of identification of an indicator. According to Araujo et al. (2009) the HWL is normally the most prevalent and easily identifiable in the images in Santa Catarina State. It is recognized in aerial photographs as a tonal contrast between the wet intertidal beach and the dry supratidal beach (Moore, Ruggiero, and List, 2006) and it has been demonstrated to be the best indicator of the land-water interface for historical
shoreline comparison studies (Crowell, Leatherman, and Buckley, 1991). Nevertheless it is important to know and quantify the errors related to the shoreline indicator. For this paper, the HWL indicator was chosen and traced in a SIG environment for further shoreline variation analysis.
Shoreline Position Error Quantification The main sources of errors on shoreline analysis using aerial
images and HWL as shoreline indicators are related to the image rectification process and to water-level fluctuations (Moore, 2000). To quantify the errors related to these processes a 95% of confidence was used.
At the rectification process at least 20 control points distributed evenly throughout the image were used so that it is possible to calculate the 95% confidence interval error of the rectified images on the basis of its root mean-square (RMS) errors according to FGDC-STD (1998) and Araujo et al. (2009). Images from 2010 were already rectified with the error presented in the metadata.
The RTK-GPS survey involved setting up a GPS base at a known position and walking with a GPS rover attached to a wheel at the wet-dry sand interface and collecting one sample
every 0.5 m. The processed data resulted in a constant error estimation of ~1 cm (0.01 m).
The HWL delineates the landward extent of the last high tide (Crowell, Leatherman, and Buckley, 1991), including the swash effect and despite it being easily identified and prevalent on the analyzed images, it may vary from one day to another and so its error must be quantified. The 60 years of water-level data were analyzed as follows: (1) HWL was identified on the series; (2) frequency of the HWL was computed; (3) the vertical tidal range of the HWL was considered as the 95% of modal levels - the 2.5% highest and 2.5% lowest tidal levels were not considered since they are very unlikely (5% of chance) to happen on the day when the image was obtained (Figure 2). HWL varied in a range of 0.9 m at the study area for 95% of the time; (4) the beach face slope at the 189 measured profiles was used to transform the vertical water level to a horizontal
distance.
The errors related to the rectifying process, RTK-GPS survey and tide related (average horizontal tide error per beach), are presented in Table 2. Each source of error is assumed to be independent; thus, as presented by Crowell, Leatherman, and Buckley (1991), the total error estimation is calculated by the RMS approach divided by the analyzed time frame. Note that as the beach slope varies along the beaches the tide-related errors are also variable. Therefore, the errors were calculated for each transect (at every 50 m) and for each analyzed time frame according to:
„ y/mU+nU+zL Et= „
where Et is the total error per transect (m y-1); Eim i is the
Journal of Coastal Research, Vol. 32, No. 4, 2016
Shoreline Changes and Sediment Transport Path 867
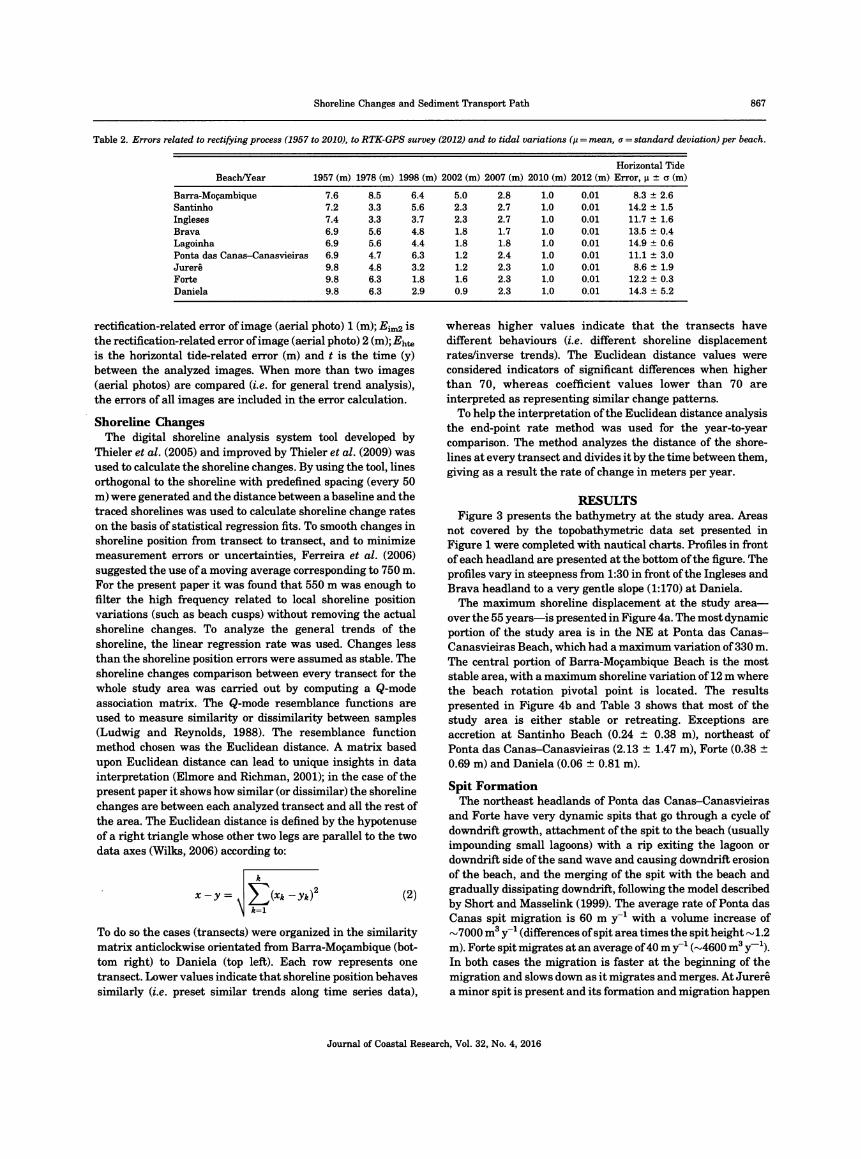
Table 2. Errors related to rectifying process (1957 to 2010), to RTK-GPS survey (2012) and to tidal variations (ļi = mean, a = standard deviation) per beach.
Horizontal Tide
Beach/Year 1957 (m) 1978 (m) 1998 (m) 2002 (m) 2007 (m) 2010 (m) 2012 (m) Error, 'l ± ct (m)
Barra-Moçambique 7.6 8.5 6.4 5.0 2.8 1.0 0.01 8.3 ± 2.6 Santinho 7.2 3.3 5.6 2.3 2.7 1.0 0.01 14.2 ± 1.5
Ingleses 7.4 3.3 3.7 2.3 2.7 1.0 0.01 11.7 ± 1.6 Brava 6.9 5.6 4.8 1.8 1.7 1.0 0.01 13.5 ± 0.4
Lagoinha 6.9 5.6 4.4 1.8 1.8 1.0 0.01 14.9 ± 0.6 Ponta das Canas-Canasvieiras 6.9 4.7 6.3 1.2 2.4 1.0 0.01 11.1 ± 3.0
Jurerê 9.8 4.8 3.2 1.2 2.3 1.0 0.01 8.6 ± 1.9
Forte 9.8 6.3 1.8 1.6 2.3 1.0 0.01 12.2 ± 0.3
Daniela 9.8 6.3 2.9 0.9 2.3 1.0 0.01 14.3 ± 5.2
rectification-related error of image (aerial photo) 1 (m); Eim2 is the rectification-related error of image (aerial photo) 2 (m); 2?hte is the horizontal tide-related error (m) and t is the time (y) between the analyzed images. When more than two images (aerial photos) are compared (i.e. for general trend analysis), the errors of all images are included in the error calculation.
Shoreline Changes The digital shoreline analysis system tool developed by Thieler et al. (2005) and improved by Thieler et al. (2009) was used to calculate the shoreline changes. By using the tool, lines orthogonal to the shoreline with predefined spacing (every 50 m) were generated and the distance between a baseline and the traced shorelines was used to calculate shoreline change rates on the basis of statistical regression fits. To smooth changes in shoreline position from transect to transect, and to minimize measurement errors or uncertainties, Ferreira et al. (2006) suggested the use of a moving average corresponding to 750 m. For the present paper it was found that 550 m was enough to filter the high frequency related to local shoreline position variations (such as beach cusps) without removing the actual shoreline changes. To analyze the general trends of the shoreline, the linear regression rate was used. Changes less than the shoreline position errors were assumed as stable. The shoreline changes comparison between every transect for the whole study area was carried out by computing a Q-mode association matrix. The Q-mode resemblance functions are used to measure similarity or dissimilarity between samples (Ludwig and Reynolds, 1988). The resemblance function method chosen was the Euclidean distance. A matrix based
upon Euclidean distance can lead to unique insights in data interpretation (Elmore and Richman, 2001); in the case of the present paper it shows how similar (or dissimilar) the shoreline changes are between each analyzed transect and all the rest of the area. The Euclidean distance is defined by the hypotenuse of a right triangle whose other two legs are parallel to the two data axes (Wilks, 2006) according to:
k
x-y = , ^(**-;y*)2 (2) ' *= i
To do so the cases (transects) were organized in the similarity matrix anticlockwise orientated from Barra-Moçambique (bot- tom right) to Daniela (top left). Each row represents one transect. Lower values indicate that shoreline position behaves similarly (i.e. preset similar trends along time series data),
whereas higher values indicate that the transects have different behaviours (i.e. different shoreline displacement rates/inverse trends). The Euclidean distance values were considered indicators of significant differences when higher than 70, whereas coefficient values lower than 70 are interpreted as representing similar change patterns.
To help the interpretation of the Euclidean distance analysis the end-point rate method was used for the year-to-year comparison. The method analyzes the distance of the shore- lines at every transect and divides it by the time between them, giving as a result the rate of change in meters per year.
RESULTS
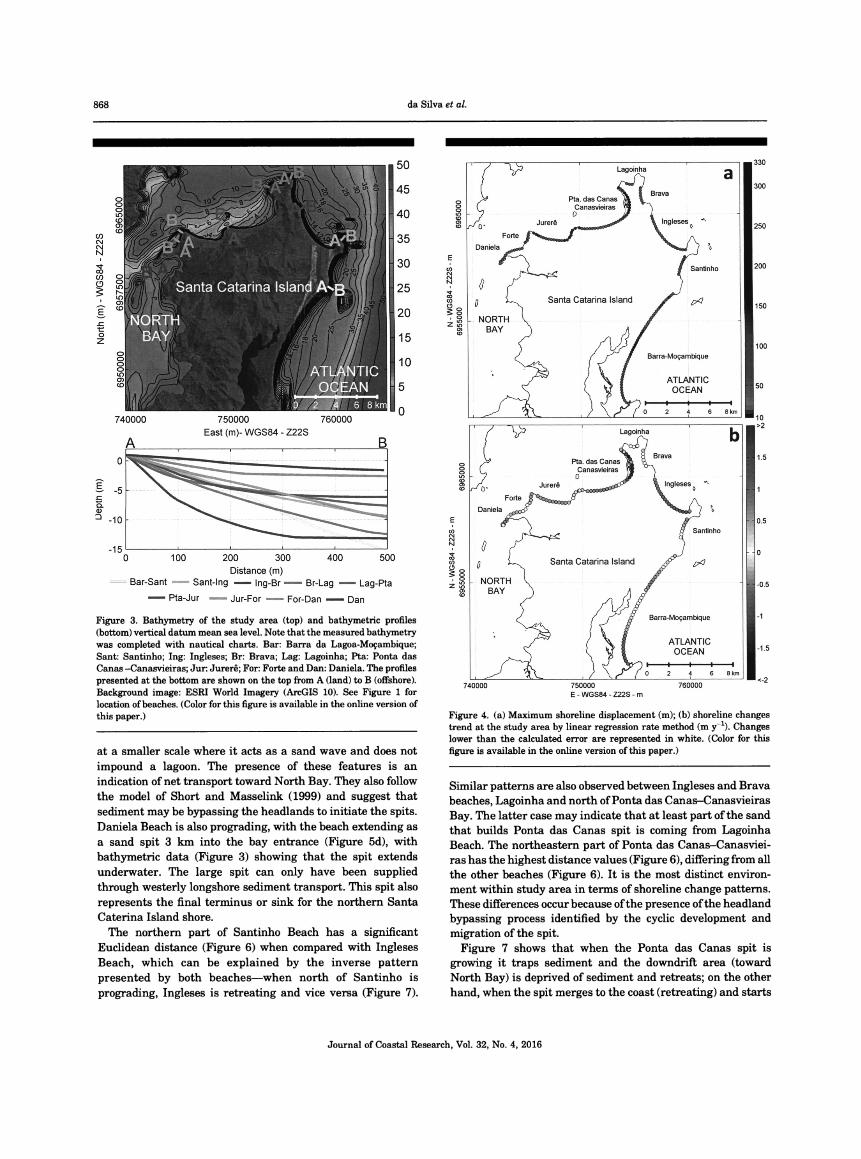
Figure 3 presents the bathymetry at the study area. Areas not covered by the topobathymetric data set presented in Figure 1 were completed with nautical charts. Profiles in front of each headland are presented at the bottom of the figure. The profiles vary in steepness from 1:30 in front of the Ingleses and Brava headland to a very gentle slope (1:170) at Daniela. The maximum shoreline displacement at the study area -
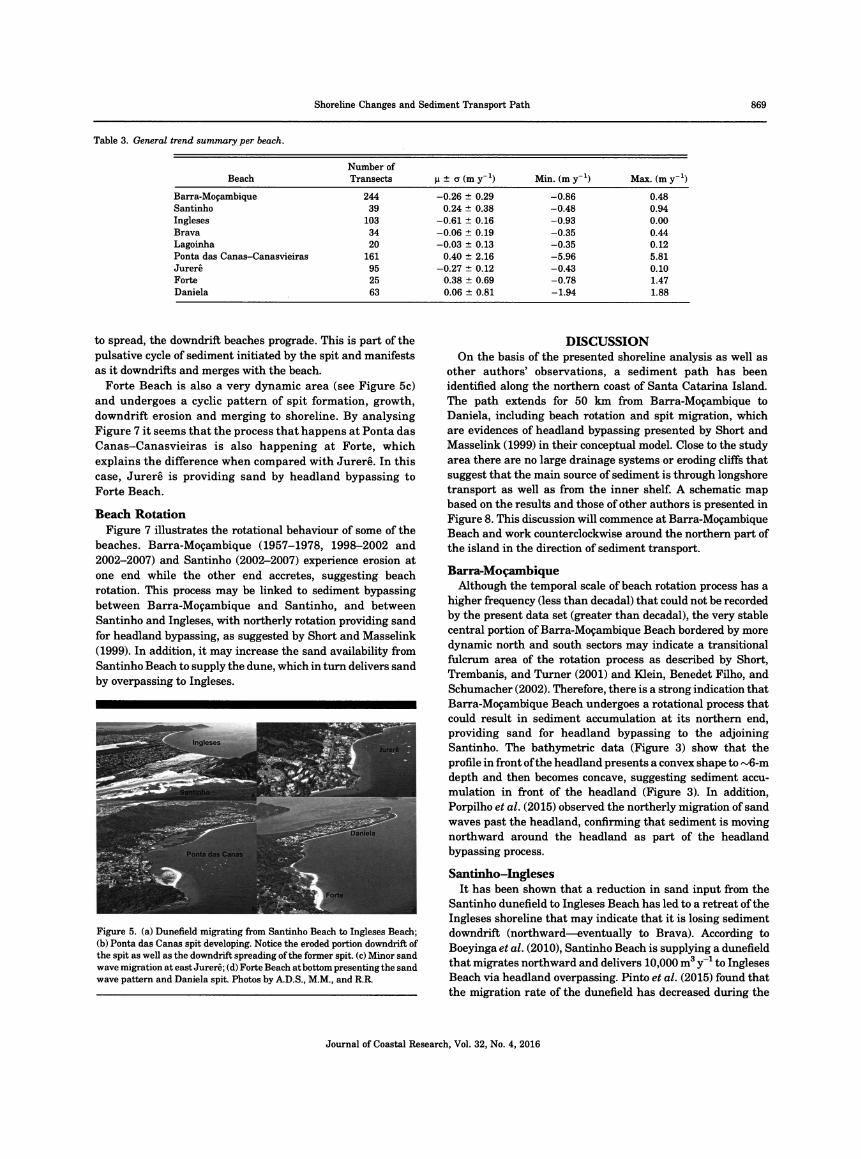
over the 55 years - is presented in Figure 4a. The most dynamic portion of the study area is in the NE at Ponta das Canas- Canasvieiras Beach, which had a maximum variation of 330 m. The central portion of Barra-Moçambique Beach is the most stable area, with a maximum shoreline variation of 12 m where the beach rotation pivotal point is located. The results presented in Figure 4b and Table 3 shows that most of the study area is either stable or retreating. Exceptions are accretion at Santinho Beach (0.24 ± 0.38 m), northeast of Ponta das Canas-Canasvieiras (2.13 ± 1.47 m), Forte (0.38 ± 0.69 m) and Daniela (0.06 ± 0.81 m).
Spit Formation The northeast headlands of Ponta das Canas-Canasvieiras
and Forte have very dynamic spits that go through a cycle of downdrift growth, attachment of the spit to the beach (usually impounding small lagoons) with a rip exiting the lagoon or downdrift side of the sand wave and causing downdrift erosion of the beach, and the merging of the spit with the beach and gradually dissipating downdrift, following the model described by Short and Masselink (1999). The average rate of Ponta das Canas spit migration is 60 m y-1 with a volume increase of ~7000 m3 y_1 (differences of spit area times the spit height ~1.2 m). Forte spit migrates at an average of 40 m y-1 (~4600 m3 y-1). In both cases the migration is faster at the beginning of the migration and slows down as it migrates and merges. At Jurerê a minor spit is present and its formation and migration happen
Journal of Coastal Research, Vol. 32, No. 4, 2016
868 da Silva et al.
Figure 3. Bathymetry of the study area (top) and bathymétrie profiles (bottom) vertical datum mean sea level. Note that the measured bathymetry was completed with nautical charts. Bar: Barra da Lagoa-Moçambique; Sant: Santinho; Ing: Ingleses; Br: Brava; Lag: Lagoinha; Pta: Ponta das Canas -Canasvieiras; Jur: Jurerê; For: Forte and Dan: Daniela. The profiles presented at the bottom are shown on the top from A (land) to B (offshore). Background image: ESRI World Imagery (ArcGIS 10). See Figure 1 for location of beaches. (Color for this figure is available in the online version of this paper.)
at a smaller scale where it acts as a sand wave and does not
impound a lagoon. The presence of these features is an indication of net transport toward North Bay. They also follow the model of Short and Masselink (1999) and suggest that sediment may be bypassing the headlands to initiate the spits. Daniela Beach is also prograding, with the beach extending as a sand spit 3 km into the bay entrance (Figure 5d), with bathymétrie data (Figure 3) showing that the spit extends underwater. The large spit can only have been supplied through westerly longshore sediment transport. This spit also represents the final terminus or sink for the northern Santa Caterina Island shore.
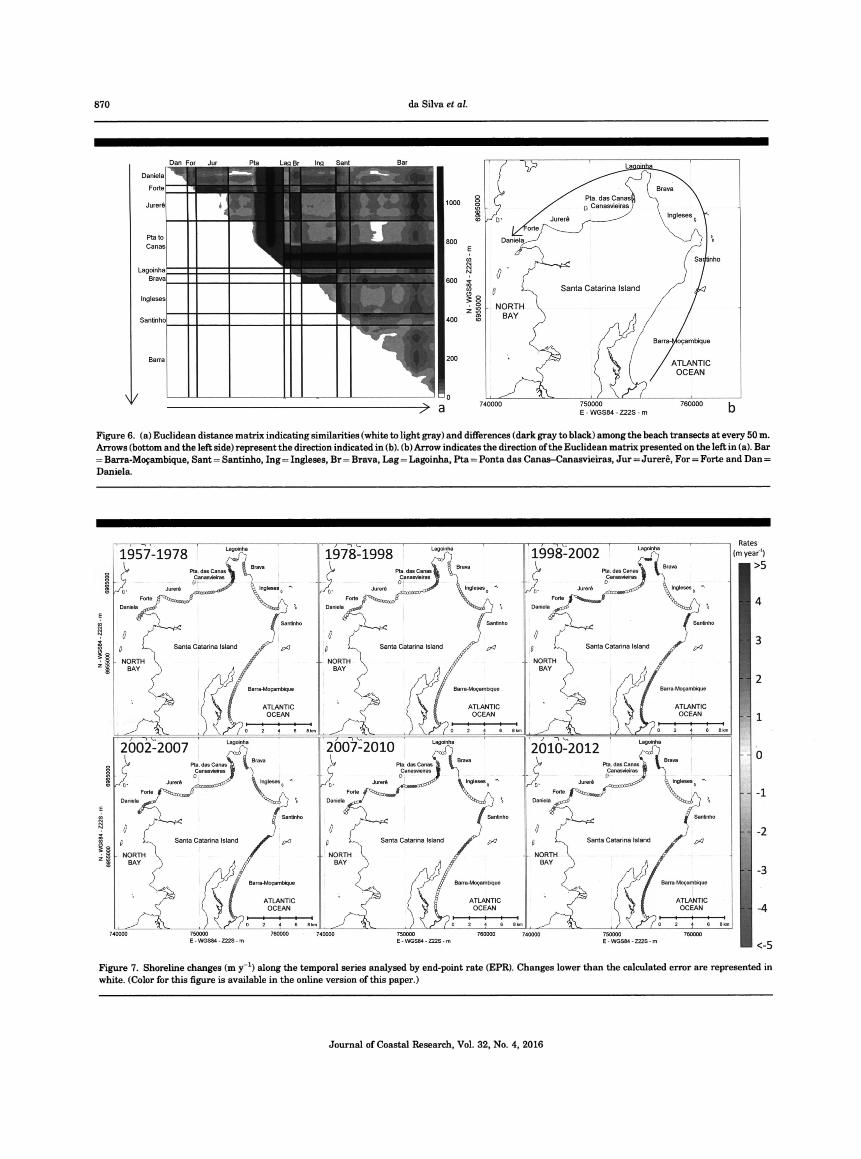
The northern part of Santinho Beach has a significant Euclidean distance (Figure 6) when compared with Ingleses Beach, which can be explained by the inverse pattern presented by both beaches - when north of Santinho is prograding, Ingleses is retreating and vice versa (Figure 7).
Figure 4. (a) Maximum shoreline displacement (m); (b) shoreline changes trend at the study area by linear regression rate method (m y 1). Changes lower than the calculated error are represented in white. (Color for this figure is available in the online version of this paper.)
Similar patterns are also observed between Ingleses and Brava beaches, Lagoinha and north of Ponta das Canas-Canasvieiras Bay. The latter case may indicate that at least part of the sand that builds Ponta das Canas spit is coming from Lagoinha Beach. The northeastern part of Ponta das Canas-Canasviei- ras has the highest distance values (Figure 6), differing from all the other beaches (Figure 6). It is the most distinct environ- ment within study area in terms of shoreline change patterns. These differences occur because of the presence of the headland bypassing process identified by the cyclic development and migration of the spit.
Figure 7 shows that when the Ponta das Canas spit is growing it traps sediment and the downdrift area (toward North Bay) is deprived of sediment and retreats; on the other hand, when the spit merges to the coast (retreating) and starts
Journal of Coastal Research, Vol. 32, No. 4, 2016
Shoreline Changes and Sediment Transport Path 869
Table 3. General trend summary per beach.
Number of
Beach Transects n ± a (m y-1) Min. (m y-1) Max. (m y-1)
Barra-Moçambique 244 -0.26 ± 0.29 -0.86 0.48 Santinho 39 0.24 ± 0.38 -0.48 0.94
Ingleses 103 -0.61 ± 0.16 -0.93 0.00 Brava 34 -0.06 ± 0.19 -0.35 0.44
Lagoinha 20 -0.03 ± 0.13 -0.35 0.12 Ponta das Canas-Canasvieiras 161 0.40 ± 2.16 -5.96 5.81
Jurerê 95 -0.27 ± 0.12 -0.43 0.10 Forte 25 0.38 ± 0.69 -0.78 1.47
Daniela 63 0.06 ± 0.81 -1.94 1.88
to spread, the downdrift beaches prograde. This is part of the pulsative cycle of sediment initiated by the spit and manifests as it downdrifts and merges with the beach. Forte Beach is also a very dynamic area (see Figure 5c) and undergoes a cyclic pattern of spit formation, growth, downdrift erosion and merging to shoreline. By analysing Figure 7 it seems that the process that happens at Ponta das Canas-Canasvieiras is also happening at Forte, which explains the difference when compared with Jurerê. In this case, Jurerê is providing sand by headland bypassing to Forte Beach.
Beach Rotation
Figure 7 illustrates the rotational behaviour of some of the beaches. Barra-Moçambique (1957-1978, 1998-2002 and 2002-2007) and Santinho (2002-2007) experience erosion at one end while the other end accretes, suggesting beach rotation. This process may be linked to sediment bypassing between Barra-Moçambique and Santinho, and between Santinho and Ingleses, with northerly rotation providing sand for headland bypassing, as suggested by Short and Masselink (1999). In addition, it may increase the sand availability from Santinho Beach to supply the dune, which in turn delivers sand by overpassing to Ingleses.
Figure 5. (a) Dunefield migrating from Santinho Beach to Ingleses Beach; (b) Ponta das Canas spit developing. Notice the eroded portion downdrift of the spit as well as the downdrift spreading of the former spit, (c) Minor sand wave migration at east Jurerê; (d) Forte Beach at bottom presenting the sand wave pattern and Daniela spit. Photos by A.D.S., M.M., and R.R.
DISCUSSION
On the basis of the presented shoreline analysis as well as other authors' observations, a sediment path has been identified along the northern coast of Santa Catarina Island. The path extends for 50 km from Barra-Moçambique to Daniela, including beach rotation and spit migration, which are evidences of headland bypassing presented by Short and Masselink (1999) in their conceptual model. Close to the study area there are no large drainage systems or eroding cliffs that suggest that the main source of sediment is through longshore transport as well as from the inner shelf. A schematic map based on the results and those of other authors is presented in Figure 8. This discussion will commence at Barra-Moçambique Beach and work counterclockwise around the northern part of the island in the direction of sediment transport.
Barra-Moçambique Although the temporal scale of beach rotation process has a
higher frequency (less than decadal) that could not be recorded by the present data set (greater than decadal), the very stable central portion of Barra-Moçambique Beach bordered by more dynamic north and south sectors may indicate a transitional fulcrum area of the rotation process as described by Short, Trembanis, and Turner (2001) and Klein, Benedet Filho, and Schumacher (2002). Therefore, there is a strong indication that Barra-Moçambique Beach undergoes a rotational process that could result in sediment accumulation at its northern end, providing sand for headland bypassing to the adjoining Santinho. The bathymétrie data (Figure 3) show that the profile in front of the headland presents a convex shape to ~6-m depth and then becomes concave, suggesting sediment accu- mulation in front of the headland (Figure 3). In addition, Porpilho et al. (2015) observed the northerly migration of sand waves past the headland, confirming that sediment is moving northward around the headland as part of the headland bypassing process.
Santinho-Ingleses It has been shown that a reduction in sand input from the
Santinho dunefield to Ingleses Beach has led to a retreat of the Ingleses shoreline that may indicate that it is losing sediment downdrift (northward - eventually to Brava). According to Boeyinga et al. (2010), Santinho Beach is supplying a dunefield that migrates northward and delivers 10,000 m3 y_1 to Ingleses Beach via headland overpassing. Pinto et al. (2015) found that the migration rate of the dunefield has decreased during the
Journal of Coastal Research, Vol. 32, No. 4, 2016
870 da Silva et al.
Figure 6. (a) Euclidean distance matrix indicating similarities (white to light gray) and differences (dark gray to black) among the beach transects at every 50 m. Arrows (bottom and the left side) represent the direction indicated in (b). (b) Arrow indicates the direction of the Euclidean matrix presented on the left in (a). Bar = Barra-Moçambique, Sant = Santinho, Ing = Ingleses, Br = Brava, Lag = Lagoinha, Pta = Ponta das Canas-Canasvieiras, Jur = Jurerê, For = Forte and Dan = Daniela.
Figure 7. Shoreline changes (m y x) along the temporal series analysed by end-point rate (EPR). Changes lower than the calculated error are represented in white. (Color for this figure is available in the online version of this paper.)
Journal of Coastal Research, Vol. 32, No. 4, 2016
Shoreline Changes and Sediment Transport Path 871
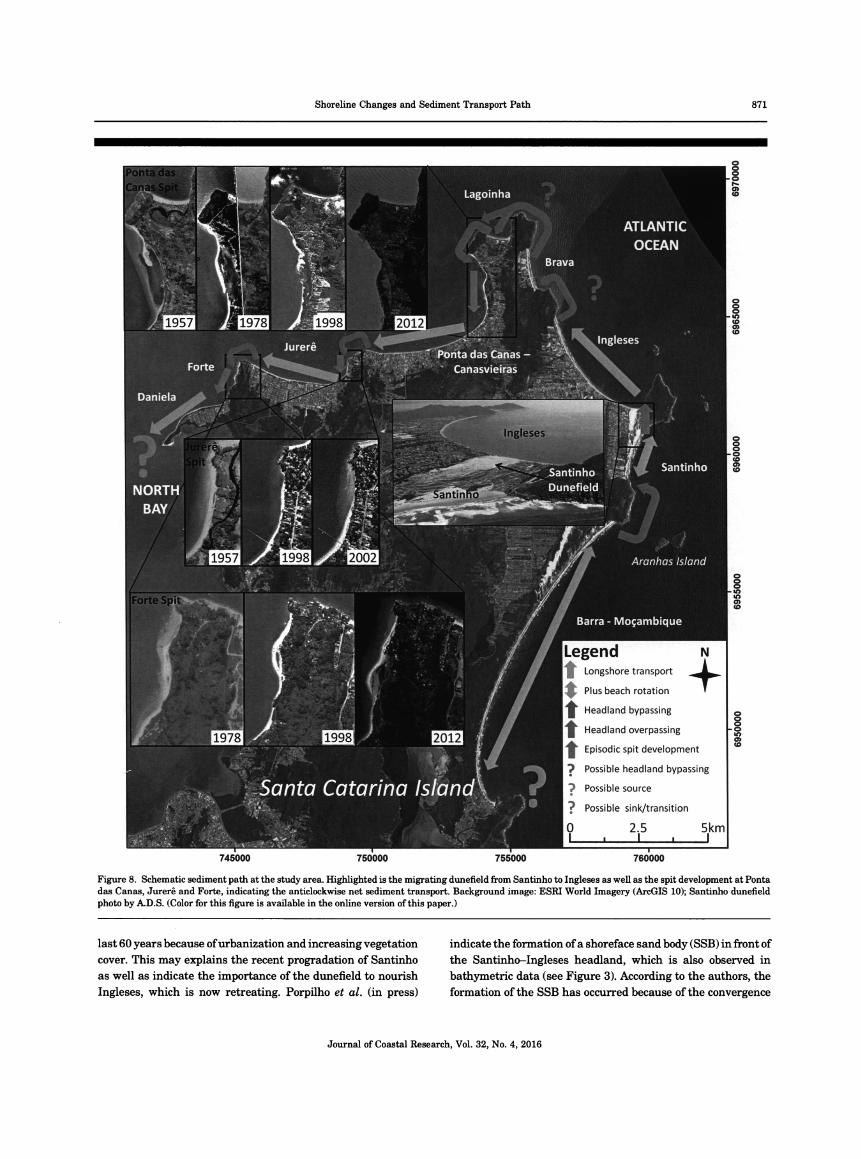
Figure 8. Schematic sediment path at the study area. Highlighted is the migrating dunefìeld from Santinho to Ingleses as well as the spit development at Ponta das Canas, Jurerê and Forte, indicating the anticlockwise net sediment transport. Background image: ESRI World Imagery (ArcGIS 10); Santinho dunefield photo by A.D.S. (Color for this figure is available in the online version of this paper.)
last 60 years because of urbanization and increasing vegetation
cover. This may explains the recent progradation of Santinho as well as indicate the importance of the dunefield to nourish Ingleses, which is now retreating. Porpilho et al. (in press)
indicate the formation of a shoreface sand body (SSB) in front of
the Santinho-Ingleses headland, which is also observed in bathymétrie data (see Figure 3). According to the authors, the formation of the SSB has occurred because of the convergence
Journal of Coastal Research, Vol. 32, No. 4, 2016
872 da Silva et al.
of bidirectional currents and associated sediment transport. Therefore, although the beach experiences beach rotation (Figure 7), no significant headland bypassing is expected to occur around this headland and the main path of sediment is via dunefield.
Ingleses-Brava Although the headland between Ingleses and Brava has the
steepest profile (Figure 3), the first 70 m from the headland lies in depths shallower than 5 m where sand can be transported by waves. The more energetic southerly waves (Araujo et al., 2003) may be able to transport sand around this headland. Also, Ingleses and adjoining Brava beaches behave differently (see Figures 6 and 7) with unrelated rates of shoreline changes (i.e. Brava prograding and Ingleses stable between 1998 and 2002 as well as 2010 and 2012). However, sediment transport between the beaches has not been verified.
Brava-Lagoinha There is no evidence of sediment bypassing between Brava
and Lagoinha and they show similar behaviour as shown in Figure 6 (Euclidean distance <70) and Figure 7 (i.e. Brava and Lagoinha retreating between 1957 and 1978, stable between 1978 and 1998 and prograding between 1998 and 2002); however, the bathymetry in front of the headland (Figure 3) indicates that at least a 150-m-wide strip close to the headland lies in depths less than 5 m where wave-driven sediment transport may be occurring. Between Ingleses and Lagoinha is a gap in our knowledge of the sediment path, although it is possible that the sand bypasses both headlands and finally reaches Lagoinha. CPE (2010) and Porpilho et al. (2015) showed that the intensification of the currents and associated
shore perpendicular to northward-migrating megaripples around the headlands of the study area may indicate sediment transport in these areas and contribute to sand bypassing around both headlands.
Lagoinha-Ponta das Canas Sand is apparently moving from Lagoinha to the Ponta das
Canas spit through headland bypassing. The Ponta das Canas spit controls the sediment availability downdrift as far as Daniela. In front of the headland between Lagoinha and Ponta das Canas (Figure 3) a gentle bathymetry (~ 1:100) is observed, indicating an accumulation of sand. The average rate of spit migration is 60 m y-1 and represents an increase of 7000 m3 y_1 (on the basis of the spit height of 1.2 m). The spit undergoes initial rapid accumulation, then slows down as it migrates. As the spit grows it traps sediment and the downdrift area (toward Daniela) retreats; on the other hand, when the spit merges to the coast (retreating) and starts to spread, the downdrift beaches prograde. The cyclic development and migration of the spit corroborates with the Short and Masselink (1999) model of headland sand bypassing.
Jurerê and Forte Spits Besides the major spit formation at Ponta das Canas, two
minor spits were identified at Jurerê and Forte beaches. The shoreline changes presented in Figure 4 also support the hypothesis of sediment bypassing at both Jurerê and Forte beaches, which are prograding because of sediment accumula- tion and westward migration as indicated by Almeida et al.
(1991), CPE (2010), and Diehl (1997). From the aerial photos (Figure 5) as well as the bathymetry (Figure 3) the presence of sandbars close to the headlands and spits (Ponta das Canas, Jurerê and Forte) is apparent and it is clear that the headlands are not capable of trapping all sediment but they are part of the longshore transport path. The small spit at Jurerê is nourished by longshore sediment transport from Ponta das Canas- Canasvieiras. The Jurerê spit is also the main source of sediment to Forte spit that in its turn delivers sand to Daniela. The average migration rate of Forte spit is 40 m y-1, representing a volume increase rate of 4600 m3 y"1.
Daniela Spit According to Almeida et al. (1991), westerly longshore drift is
responsible for developing the sandy spit at Daniela. In addition, the bathymetry at the end of Daniela spit (Figure 3) has a very gentle slope, indicating sediment accumulation. According to Diehl (1997), this development is due to net sediment transport from the exposed area of the island westward toward North Bay. On the basis of its plan form, Silveira, Klein, and Tessler (2010) classified Daniela Beach as being in dynamic equilibrium, with the coastline being seaward of its equilibrium position, which may lead the shoreline to migrate toward its equilibrium as the sediment supply reduces. This would explain the erosional trend along the western part of Daniela Beach - as the sediment is trapped at Forte, the eastern part of Daniela Beach is presently prograding, while the western part of Daniela retreats. The development of the sandy spits are strong indicators of sediment transport into North Bay, and the process of sediment bypass on updrift beaches is therefore an important mechanism for such development.
The spit formation and migration are strong indicators of the direction of the net sediment transport and support the anticlockwise path of sediment presented in this paper. Also the formation and migration of spits are dependent on sediment availability. Considering that the prevailing direction of the longshore transport is anticlockwise as well as the episodic formation of the spits along the study area, it is very likely that headland bypassing is the main source of spit formation and growth. The anticlockwise transport is supply- ing sediment downdrift of the study area - either a sink of sediment or a transitional area to the continuation of the
sediment path.
CONCLUSIONS
This paper presented a shoreline change analysis used to identify the sediment transport path and headland bypassing involving nine beaches, extending 50 km from Barra- Moçambique to Daniela and including dunes and spits located along the microtidal coast of eastern and northern shores of Santa Catarina Island, Brazil. Although longshore sand transport is well documented and headland bypassing and overpassing have been reported, this is the first time sand transport around a series of beaches and headlands via bypassing, overpassing and spits has been documented.
Beach rotation was identified at Barra-Moçambique and Santinho beaches. The accumulation of sand by beach rotation may be the first step to sand bypassing. It was also
Journal of Coastal Research, Vol. 32, No. 4, 2016
Shoreline Changes and Sediment Transport Path 873
demonstrated that Santinho Beach is prograding while Ingleses is retreating, indicating the importance of the dune- field to supply sediment to Ingleses.
It was not possible to identify a sediment transport (bypassing) between Ingleses and Brava beaches as well as between Brava and Lagoinha. The stretch of the coast between Ingleses and Lagoinha is therefore the main gap in our knowledge of the sediment path.
A major spit develops NE of Ponta das Canas and cyclically grows, migrates, merges and releases the sediment to down- drift areas, indicating the occurrence of a headland bypassing process. As the Ponta das Canas spit grows it traps sediment and the downdrift beaches (west of Ponta das Canas- Canasvieiras, Jurerê, Forte and Daniela) retreat. On the other hand, when the spit erodes, releasing the trapped sediment, the downdrift areas prograde.
An anticlockwise longshore transport was identified and described between a series of beaches with variable orientation
and separated by headlands, including evidence of beach rotation (Barra-Moçambique and Santinho), headland over- passing (Santinho-Ingleses dunefield), together with three locations (Ponta das Canas, Jurerê and Forte) with cyclical spit formation. The estimated volume input from Ingleses (10,000 m3 y-1) is similar to the volume trapped at Ponta das Canas spit as it grows (7000 m3 y-1), whereas a smaller volume is trapped as Forte spit grows (4600 m3 y-1). It is very likely that headland bypassing is the main source of sand for the spit formation and growth. Studies using in situ sediment transport data (such as sediment traps or tracers) or modeling tools may fill the gap of sediment transport knowledge between Ingleses and Lagoinha beaches as well quantify the volume of sediment bypassing the headlands.
ACKNOWLEDGMENTS
The authors thank Prof. Carla Bonetti, Rafael Sartori, Diego Porpilho, Fundo Clima-MMA (process number: 3520120), Conselho Nacional de Desenvolvimento Científico e Tecnológico [process numbers: 400302/2012-8, 303550/2012- 0 and 140738/2012-6], Programa de Formação de Recursos Humanos Petrobrás (process number: 48610.002443/2013- 14), Coordenação de Aperfeiçoamento de Pessoal de Nível Superior (process number: 005809/2014-02), Sistema de Modelagem Costeira-BRASIL (MMA-IHC) and the Journal of Coastal Research reviewers for their suggestions.
LITERATURE CITED
Ab Razak, M.S.; Dastgheib, A., and Roelvink, D., 2013. Sand bypassing and shoreline evolution near coastal structure compar- ing analytical solution and XBeach numerical modelling. Proceed- ings of the 12th International Coastal Symposium (Plymouth, England). Journal of Coastal Research , Special Issue No. 65, pp. 2083-2088.
Absalonsen, L. and Dean, R.G., 2011. Characteristics of the shoreline change along Florida sandy beaches with an example for Palm Beach County. Journal of Coastal Research , 27(6A), 16-26.
Almeida, E.S.; Abreu de Castilhos, J.J.; Simon, A.F.; Avila, E.L.; Aumond, J.J.; Pinto, N.L.C. ; Dal Santo, N.A., and Infante, N., 1991. Observações geomorfológicas na praia do Forte-Ilha da Santa Catarina, município de Florianópolis-SC. Geosul, 11(4), 38-54.
Araújo, C.E.S.; Franco, D.; Melo Filho, E., and Pimenta, F., 2003. Wave regime characteristics of southern Brazilian coast. Proceed-
ings of the 6th International Conference on Coastal and Port Engineering in Developing Countries, COPEDEC (Colombo, Sri Lanka), Paper 97, 15p.
Araujo, R.S.; Silva, G.V.; Freitas, D., and Klein, A.H.F., 2009. Georreferenciamento de fotografias aéreas e análise da variação da linha de costa. In: Alcántara-Carrió, J.; Correa, I.D.; Isla, F.; Alvarando, M.; Klein, A.H.F., and Cabrera, J.A. (eds.), Metodologías en Teledetección Aplicada a la Prevención de Amenazas Naturales en el Litoral. Valencia, Spain: Programa Iberoamericano de Ciencia y Tecnología para el Desarrollo (PICTD), pp. 237-257.
Boak, E.H. and Turner, I.L., 2005. Shoreline definition and detection: A review. Journal of Coastal Research , 21(4), 688-703.
Boeyinga, J.; Dusseljee, D.W.; Pool, A.D.; Schoutens, P.; Verduin, F.; Van Zwicht, B.N.M., and Klein, A.H.F., 2010. The effects of a bypass dunefield on the stability of a headland bay beach: A case study. Coastal Engineering, 57(1), 152-159.
Bruun, P., 1954. Coast Erosion and the Development of Beach Profiles. Washington, D.C.: U.S. Army Corps of Engineers, Technical Memorandum No. 44 , 79p.
Cheung, K.F.; Gerritsen, F., and Cleveringa, J., 2007. Morphody- namics and sand bypassing at Ameland Inlet, The Netherlands. Journal of Coastal Research , 23(1), 106-118.
CPE (Coastal Planning and Engineering) Staff, 2010. Análise de alternativas para o terminal de cruzeiros de Florinaópolis - possíveis alterações nos padrões de circulação e taxa de sedimenta- do no canal de acesso ao porto de canasvieiras . Florianópolis, SC, Brazil: Coastal Planning and Engineering do Brazil, 55p.
Crowell, M.; Leatherman, S.P., and Buckley, M.K., 1991. Historical shoreline change: Error analysis and mapping accuracy. Journal of Coastal Research , 7(3), 839-852.
Dean, R.G., 1977. Equilibrium Beach Profiles: U.S. Atlantic and Gulf Coasts. Newark, Delaware: University of Delaware, Department of Civil Engineering, Ocean Engineering Report No. 12 , 45p.
Diehl, F.L., 1997. Aspectos Geo evolutivos, Morfodinâmicos e Ambi- entais do Pontal da Daniela, Ilha de Santa Catarina, Brasil. Florianópolis, Santa Catarina: Universidade Federal de Santa Catarina, Master's thesis, 111p.
Dolan, R.; Hayden, B.P.; May, P., and May, S., 1980. The reliability of shoreline change measurements from aerial photographs. Shore & Beach , 48(4), 22-29.
Egbert, G.D.; Bennett, A., and Foreman, M., 1994. TOPEX/ Poseidon tides estimated using global inverse model. Journal of Geophysical Research , 99(12), 821-852.
Egbert, G.D. and. Erofeeva, S.Y., 2002. Efficient inverse modelling of barotropic ocean tides. Journal of Atmospheric Oceanic Technolo- gy , 19(1), 183-204.
Elmore, K.L. and Richman, M.B., 2001. Euclidean distance as a similarity metric for principal component analysis. Monthly Weather Review , 129(3), 540-549.
Eslami, S.; Van Rijn, L.; Walstra, D.; Luijendijk, A., and Stive, M., 2010. A numerical study on design of coastal groins. Proceedings of International Conference on Scour and Erosion (San Francisco, California), pp. 501-510.
Farris, A.S. and List J.H., 2007. Shoreline change as a proxy for subaerial beach volume change. Journal of Coastal Research , 23(3), 740-748.
Ferreira, O.; Gargia, T.; Matías, A.; Taborda, R., and Alveririnho Dias, J. 2006. An integrated method for the determination of set- back lines for coastal erosion hazards on sandy beaches. Continen- tal Shelf Research, 26(1), 1030-1044.
FGDC-STD (Federal Geographic Data Committee) Staff, 1998. Geo- spatial Positioning Accuracy Standards (Part 3): National Stan- dard for Spatial Data Accuracy. Washington, D.C.: Federal Geographic Data Committee, FGDC-STD-007.3-1998, 25p.
Fitzgerald, D.M. and Pendleton, E., 2002. Inlet formation and evolution of the sediment bypassing system: New Inlet Cape Cod, Massachusetts. In: Cooper, J.A.G. and Jackson, D.W.T. (eds.), Proceedings of International Coastal Symposium. Journal of Coastal Research , Special Issue No. 36, pp. 290-299.
Fitzgerald, D.M.; Krauss, N.C., and Hands, E.B., 2000. Natural Mechanisms of Sediment Bypassing at Tidal Inlets. Vicksburg,
Journal of Coastal Research, Vol. 32, No. 4, 2016
874 da Silva et al.
Mississippi: U.S. Army Corps of Engineering, Report ERDC/CGL CHETN-IV-30 , 10p. Goodwin, I.D.; Freeman, R., and Blackmore, K., 2013. An insight into
headland sand bypassing and wave climate variability from shoreface bathymétrie change at Byron Bay, New South Wales, Australia. Marine Geology , 341(1), 29-45.
Harley, M.D.; Turner, I.L.; Short, A.D., Ranasinghe, R., 2011. A réévaluation of coastal embayment rotation: The dominance of cross-shore versus alongshore sediment transport processes, Callaroy-Narrabeen Beach, southeast Australia. Journal of Geo- physical Research , 116 (F04033), 16p.
Jones, B.M.; Arp, C.D.; Jorgenson, M.T.; Hinkel, K.M.; Schmutz, J. A., and Flint, P.L., 2009. Increase in rate and uniformity of coastline erosion in arctic Alaska. Geophysical Research Letters, 36(1), 5p.
Klein, A.H.F.; Benedet Filho, L., and Schumacher, D.H., 2002. Short- term beach rotation processes in distinct headland bay beach systems. Journal of Coastal Research , 18(3), 442-458.
Klein, A.H.F., Short, A.D., Bonetti, J., 2016. Santa Catarina beach systems. In: Short, A.D. and Klein, A.H.F. (eds.), Brazilian Beach Systems. Dordrecht, The Netherlands: Springer Coastal Research Library. In press.
Ludwig, J. A. and Reynold, J.F. 1988. Statistical Ecology: A Primer in Methods and Computing. New York: John Wiley & Sons, 368p.
Mariani, A.; Carley, J.T., and Miller, B.M., 2010, Infilling and sand bypassing of coastal structures and headlands by littoral drift. Proceedings of 19th NSW Coastal Conference (Batemans Bay, NSW, Australia), 8p.
Masselink, G. and Pattiaratchi, C.B., Seasonal changes in beach morphology along the sheltered coastline of Perth, Western Australia. Marine Geology , 172, 243-263.
Moore, L.J. 2000. Shoreline mapping techniques. Journal of Coastal Research , 16(1), 111-124.
Moore, L.J.; Ruggiero, P., and List, J.H., 2006. Comparing mean high water and high water line shorelines: Should proxy-datum offsets be incorporated into shoreline change analysis? Journal of Coastal Research , 22(4), 894-905.
Muler, M.; Prado, M.F.V.; Rocha, R.S.; Camargo, R.S.V., and Klein, A.H.F. 2014. Verificação da Precisão de Bases Cartográficas da Região de Florianópolis, SC. Proceedings of Congresso Brasileiro de Cartografia (Gramado, RS, Brazil), 15p.
Nobre, C.A.; Cavalcanti, M.A.G.; Nobre, P.; Kayano, M.T.; Rao, V.B.; Bonatti, J.P.; Satyamurti, P.; Uvo, C.B., and Cohen, J.C. 1986. Aspectos da climatologia dinâmica do Brasil. Climandlise Special Issue, 124p.
Ojeda, E. and Guillen, J. 2008. Shoreline dynamics and beach rotation on artificial embayed beaches. Marine Geology , 253, 51-62.
Pinto, M.W.; Meireles, R.; Cooper, A., and Klein, A.H.F. 2015. Santinho/Ingleses transgressive dunefield system - Santa Catarina Island (Brazil): Temporal variability in vegetation, manmade structures and dune migration. Proceedings of Coastal Sediments '15 (San Diego, California), 14p.
Porpilho, D.; Klein, A.H.F.; de Camargo, R.S.V.; Prado, M.F.V.; Short, A.D.; Vieira da Silva, G., and Toldo, E.E., Jr., 2015. Bedform classification in front of Santinho headland, Santinho Beach - Santa Catarina Island, Brazil. Proceedings of Coastal Sediments '15 (San Diego, California), 10p.
Porpilho, D.; Klein, A.H.F.; de Camargo, R.S.V.; Prado, M.F.V.; Short, A.D., and Vieira da Silva, G. Ingleses headland bedform charac- terization through interferometrie data, Santa Catarina Island, southern Brazil. In: Vila-Concejo, A.; Bruce, E.; Kennedy, D.M., and McCarroll, R.J. (eds.), Proceedings of the 14th International Coastal Symposium (Sydney, Australia). Journal of Coastal Research , Special Issue No. 75, In press.
Ranashinghe, R.; McLoughlin, R.; Short, A., and Symonds, G., 2004. Southern Oscillation Index, wave climate and beach rotation. Marine Geology , 204, 273-287.
Short, A.D.; Cowell, P.J.; Cadee, M.; Hall, W., and Van Dijr, B., 1995. Beach rotation and possible relation to Southern Oscillation. In: Aung, T.H. (ed.), Proceedings of Ocean Atmosphere Pacific Conference (Adelaide, SA, Australia), 329-334.
Short, A.D. and Masselink, G. (eds.), 1999. Embayed and structurally controlled beaches. In: Handbooks of Beach and Shoreface Hydrodynamics. New York: John Wiley and Sons, pp. 230-249.
Short, A.; Trembanis, A., and Turner, I., 2001. Beach oscillation, rotation and the Southern Oscillation, Narrabeen Beach, Australia. Proceedings of the 27th International Conference on Coastal Engineering (Sydney, NSW, Australia), pp. 2439-2452.
Silveira, L.F.; Klein, A.H.F., and Tessler, M.G., 2010. Headland-bay beach planform stability of Santa Catarina state and of the northern coast of São Paulo state. Brazilian Journal of Oceanog- raphy , 58(2), 101-122.
Silvester, R., 1985. Sediment by-passing across coastal inlets by natural means. Coastal Engineering , 9, 327-346.
Thieler, E.R.; Himmelstoss, E.A.; Zichichi, J.L., and Miller, T.L., 2005. Digital Shoreline Analysis System (DSAS) version 3.0: An ArcGIS Extension for Calculating Shoreline Change. U.S. Geolog- ical Survey Open- file Report 1304.
Thieler, E.R., Himmelstoss, E.A., Zichichi, J.L., and Ayhan, E., 2009. Digital Shoreline Analysis System (DSAS) version 4.0 - An ArcGIS Extension for Calculating Shoreline Change. U.S. Geological Survey Open-File Report 2008-1278.
Toldo, E.E., Jr.; Motta, L.M.; Almeida, L.E.S.B., and Nunes, J.C.R., 2013. Large morphological change linked to sediment budget in the Rio Grande do Sul coast. Proceedings of Coastal Dynamics 2013 (Arcachon, France), pp. 1687-1696.
Truccolo, E.C., 2011. Assessment of the wind behaviour in the northern coast of Santa Catarina. Revista Brasileira de Meteoro-
logia, 26(3), 450-460. Truccolo, E.C.; Franco, D., and Schettini, C.A.F., 2004. The low
frequency sea level oscillations in the northern coast of Santa Catarina, Brazil. In: Klein, A.H.F.; Finkl, C.W.; Sperb, R.M.; Beaumord, A.C.; Diehl, F.L.; Barreto, A.S.; Abreu, J.C.N.; Bellotto, V.R.; Kuroshima, K.N.; Carvalho, J.L.B.; Resgaļa, C., Jr., and Fernandes, A.M.R. (eds.), Proceedings of International Coastal Symposium. Journal of Coastal Research , Special Issue No. 39, pp. 547-552.
Turki, I., Medina, R., Gonzales, M. and Coco, G., 2013. Natural variability of shoreline position: Observations at three pocket beaches. Marine Geology , 338, 67-89.
Wilks, D.S., 2006. Statistical Methods in the Atmospheric Sciences. San Diego, California: Elsevier, 704p.
Journal of Coastal Research, Vol. 32, No. 4, 2016