Embed Size (px)
Citation preview

Short and Long-Run Performance of
Initial Public Offerings
in the Austrian Stock Market
First Draft: March 1996
This Draft: August 1997
Wolfgang Aussenegg
Department of Finance
Vienna University of Technology
Favoritenstraße 9-11, A-1040 Vienna, Austria
Phone: ++43 1 58801 - 33082
Fax: ++43 1 58801 - 33098
E-Mail: [email protected].

Abstract
This paper investigates the price behaviour of initial public offerings (IPOs) of equities listed on
the Vienna Stock Exchange during the period from 1984 to 1996. In accordance with the findings
for other markets, the average initial returns of Austrian IPOs are significantly positive. For a total
sample of 67 IPOs, an average first day return of 6.5 per cent is documented, which is lower than
for most other IPO markets. More than 30 per cent of all IPOs are overpriced with negative initial
returns. The cross-section of initial abnormal returns can best be explained by the ex-ante uncer-
tainty about the value of the issue and the existence of "hot-issue" and "cold-issue" periods. In the
long-run (first five years) Austrian IPOs underperform benchmark firms by a significant 73.9 per
cent (average buy-and-hold abnormal return) with a wealth relative of 0.64. An investor would
have had to invest 56 per cent more money in IPOs than in non-IPO firms of similar size to have the
same wealth five years after the first aftermarket trading day. This phenomenon can best be ex-
plained by cross-sectional differences in the ownership structure: While the underperformance of
family-owned IPOs is very poor, no positive or negative abnormal performance can be detected for
privatized enterprises or other non family-owned firms going public.
Key words: Going public, initial public offerings, Austrian Stock Market, underpricing, long-run performance
JEL classification: G12, G15, G32
Acknowledgements:
The author would like to thank Jos van Bommel, Martin Holmen, Roger M. Kunz, Alexander Ljungqvist, Stefan
Pichler, Jay R. Ritter, Laura O. Robinson and Helmut Uhlir, participants of the 1996 Berlin IPO Conference, the
1997 French Finance Association meeting, the 1997 European Financial Management Association meeting as well
as seminar participants at the Vienna Institute of Advanced Studies for helpful suggestions.
1
1. Introduction
Numerous studies have investigated unseasoned new issues, especially in the United States, but
also in many other countries and financial markets. They mainly document two phenomena: The
first one is that initial public offerings (IPOs) show significant positive average first-day returns.
This underpricing, as it is often called, varies from country to country and is documented as a per-
manent and cyclical phenomenon. Loughran et al. (1994) for example show that the average initial
return can be as low as 4.2 per cent for French IPOs and as high as 80 per cent for Malaysian IPOs.
Many theories and models have been developed to explain the level of underpricing and the cross-
sectional differences among IPO firms. One of the most well-known models was established by
Rock (1986) who introduced the concept of the winner’s curse in the IPO-market. According to this
model, a positive underpricing must exist because underpriced IPOs are rationed to a larger extent
than overpriced ones and uninformed investors are, in contrast to informed investors, not able to
distinguish between over- und underpriced issues.
The second phenomenon is that in the long-run IPOs tend to underperform benchmark firms. Using a
sample of 1,526 IPOs that went public in the U.S. during the 1975-1984 period, Ritter (1991) found
a significant underperformance of 29.1 per cent in the first three years of public listing. Similar
results for a sample of 4,753 IPOs subsequently listed on NASDAQ, the American Stock Exchange
(AMEX) or the New York Stock Exchange (NYSE) were reported by Loughran and Ritter (1995).
For most non-US stock markets this long-run underperformance exists as well. Compared to the All
Share Financial Times Index, for example Levis (1993) finds evidence that UK-IPOs underperform
in the first 36 trading months by 26.3 per cent. The negative long-run performance of IPOs is, for
example, also documented for Germany (Uhlir (1989a, 1989b) and Ljungqvist (1993)) and Finland
(Keloharju (1993)).1
1 See Loughran et al. (1994) for a recent survey reviewing the international empirical evidence of IPOs.

2
Aggarwal and Rivoli (1990) suggest that a reason for this underperformance is a possible over-
valuation in early aftermarket trading. Ritter (1991) argues that issuing firms choose to go public
when investors are overoptimistic about the firm’s future growth potential. As Jain and Kini (1994)
document, US IPOs experienced a significant decline in operating performance following the IPO
for the period 1976-88. They conclude that in the course of the initial issue the investors may have
too high expectations with regard to the future growth in earnings which are not fulfilled subse-
quently. This could finally lead to a negative performance in the aftermarket. It is puzzling that the
market obviously does not account for this negative operating performance in the short-term after-
market. Another explanation offered for the long-run underperformance is that only good informati-
on about the issuing firms is circulated when a firm goes public and that therefore the prices in the
early aftermarket are distorted (Uhlir (1989b)).
In contrast to the empirical findings for the initial return, the empirical evidence for the long-run
aftermarket performance is not as clear. There are a few recent non-US studies which document a
non-negative long-run aftermarket performance. Among these is the study by Kunz and Aggarwal
(1994), who report for the Swiss-IPO market non-significant two- and three- year abnormal after-
market performances of +1.8 and -6.1 per cent respectively. A really extreme result is reported by
Kim et al. (1995) for Korean IPOs, where a 3-year buy-and-hold abnormal performance of +91.6
% is documented. This indicates that in Korea IPOs outperform benchmark firms, which is in clear
contrast to the empirical evidence of a long-run underperformance in most countries. Table 1 pro-
vides a short summary of recent empirical studies measuring the short- and long-run performance of
IPOs in different markets.
Given the above background, the present study has four major objectives. First, to record the level
of first-day returns for Austrian IPOs over a recent and long period. The investigation focuses on
the cross-sectional distribution of these returns and Rock's (1986) winner's curse hypothesis. The
second objective is to explain the level of underpricing recorded. Several explanation models de-

3
rived from the theoretical and empirical literature will be used to formulate testable hypotheses.
The third objective is to measure the short-run and long-run aftermarket performance. The aim is to
detect whether it has been possible to earn significant positive abnormal returns by purchasing the
issues on the first day of aftermarket trading and holding them for up to five years. The fourth ob-
jective is to give some explanations for the documented long-run aftermarket performance.
The following section describes the main features of the Austrian new issue market. The third sec-
tion presents the sampling data, and section four shows the empirical results for the initial returns.
After an analysis of the distribution of the initial returns and the possible effects due to rationing,
several testable hypotheses to explain the level of underpricing and the cross-sectional differences
in the initial returns across firms will be formulated and tested. The fifth section first describes the
methodology used to calculate abnormal returns to evaluate the aftermarket performance and then,
documents the empirical evidence regarding the aftermarket performance of IPO firms. Explana-
tions for the observed long-run performance conclude this section. Finally, section six will give a
summary of the findings.
2. The New Issue Market in Austria
The Vienna Stock Exchange (VSE) is the only stock exchange in Austria and is grouped into three
market segments: the Official Market („Amtlicher Handel“), the Semi-Official Market („Geregelter
Freiverkehr“) and the Unregulated Market ( „Sonstiger Wertpapierhandel“). By the end of 1996,
118 companies were listed on the Vienna Stock Exchange: 94 in the Official Market, 12 in the Se-
mi-Official Market and 12 in the Unregulated Market. Firms trading in the Official Market account
for about 95 per cent of the total market value of all stocks and more than 99 per cent of the total
trading volume. The Official Market is therefore the main segement of the stock exchange, where

4
the most liquid and the biggest Austrian stocks are listed. By contrast stocks listed in the Semi-
Official or the Unregulated Market are characterized by considerably thin trading.
In addition to trading volume and market value, the three types of markets also differ with regard to
the admission requirements for security listing. The basic listing requirements for the Official and
Semi-Official Market can be summarized as follows: (i) Every company has to publish a pro-
spectus containing all information necessary to judge it’s assets and liabilities, the earnings and
future prospects and their legal position. (ii) The nominal value of the total share capital has to be
at least 40 million ATS (10 million ATS for the Semi-Official Market). (iii) The company must
have existed for at least three years (one year for the Semi-Official Market) and must have pub-
lished annual accounts for the most recent three years (one year for the Semi-Official Market). In
addition, for shares traded in the Official Market, a minimum of 10 per cent of the share capital has
to be widely scattered and the investors have to be informed about the business on a regular basis.
No such listing requirements exist for the Unregulated Market. Despite the fact that the listing re-
quirements for the Official Market are the most rigorous, only a minority of all IPOs apply for li-
sting in the Semi-Official Market or the Unregulated Market. Especially the Unregulated Market,
which was not established until 1990 to reduce the requirements for admittance to the capital mar-
ket for smaller companies, has not fullfilled the expectations.
Most IPOs use a firm commitment contract, where the offer price and the issue volume (number of
shares issued) are fixed in advance. Several weeks before the offering period starts, a preliminary
prospectus containing all relevant information about the economic condition and perspectives of
the firm, the possible offer price and the possible number of shares to be sold is circulated among
potential institutional as well as private investors.2 After having collected the state of demand for a
given IPO, the final offer price and the number of shares are normally fixed just before the offering
2 In recent years a bookbuilding procedure is used to get information about the state of the demand before the
offer price and the issue volume is fixed for the subscription period.
5
period starts. In most cases this official subscription period lasts 2 to 5 days. If the offer is heavily
oversubscribed, the subscription period often finishes as early as at the end of the first subscription
day. The average time between the first day of the subscription period and the first trading day in
the aftermarket is about two weeks. This is in line with other (larger) IPO markets but differs for
example from the findings of Keloharju (1993) for the Finnish IPO market, where this time period
is approximately three months. Some firm commitment offers also include an overallotment option
in which the underwriter has the option to sell additional shares at the offer price because of a lar-
ge demand during the official subscription period.
3. Data Description
In 1984, after a time of more than 18 years with only delistings, the going public wave in Austria
started with two initial public offerings. In the thirteen-year period from 1984 to 1996, the number
of all firms listed in the VSE more than doubled from 58 to 118. In total 98 companies went public
during this period, 67 of which were listed in the Official Market, 11 in the Semi-Official Market
and 20 in the Unregulated Market. In order to secure a homogeneous sample of IPOs with similar
listing requirements and a liquid aftermarket trading, the data sample used only consists of all 67
IPOs first listed in the Official Market between 1984 and 1996.3 This long time period allows stu-
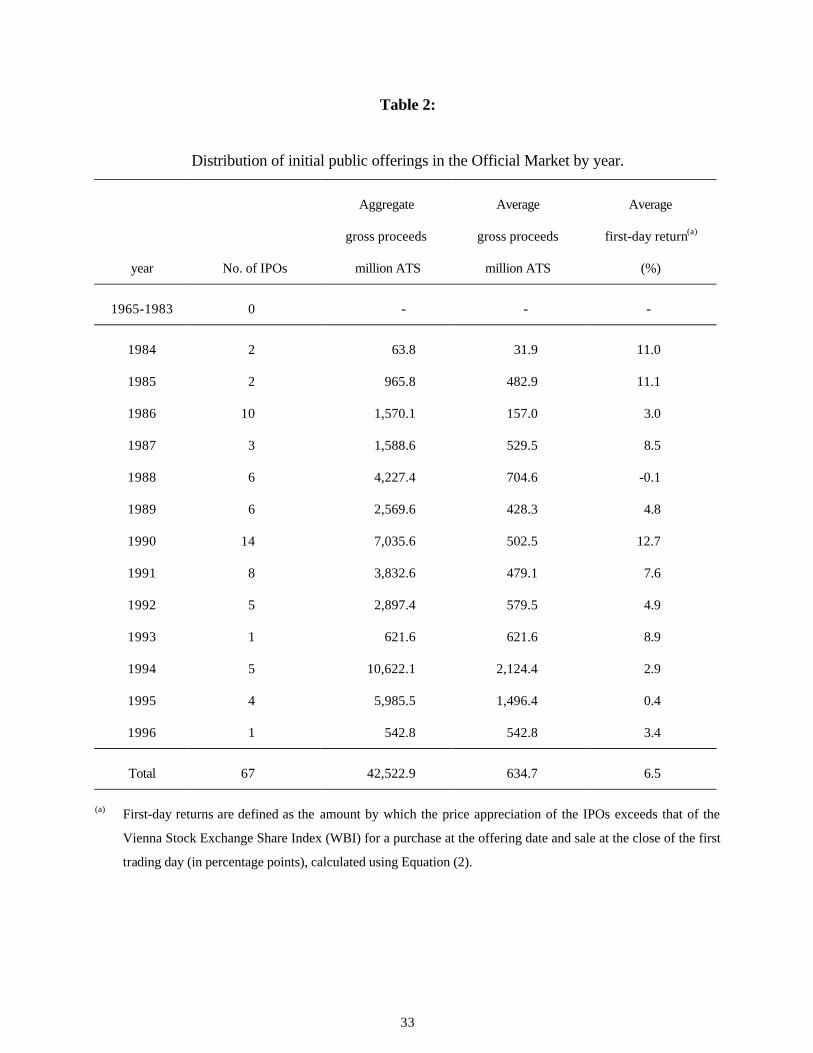
dying the long-run performance in bull as well as bear markets. Table 2 summarizes the distributi-
on of the sample of 67 IPOs by years. Most firms went public after the two big bull markets in
1986 (10 IPOs) and 1990 (14 IPOs), whereas the highest total as well as average gross proceeds
were earned in 1994.
3 IPO-firms which changed from the Semi-Official or the Unregulated Market into the Official Market are not in-
cluded.
6
One special feature of the Austrian new issues market is the distribution of the former owners or
sellers of the IPO firms. Nearly 60 per cent of all IPOs in the sample are family-owned (see Table
3). Family-owned IPOs are defined as firms exclusively controlled by a family or by private per-
sons before going public. A second group of IPOs are privatizations. 13 out of 67 IPOs in the Offi-
cial Market are former (100 per cent) state-owned enterprises. Privatizations have taken place in
almost every country where a stock market exists. The main objectives for the Austrian government
to execute privatizations are (as in many other countries) (i) to raise revenue for the budget, (ii) to
increase the operating efficiency of the privatized enterprise, (iii) to reduce governmental interfe-
rence in the economy, (iv) to increase the portion of share ownership in the population and (v) to
introduce competition. To investigate the long-run aftermarket performance of Austrian IPOs in
relation to the ownership structure, the following groups of IPOs are formed: family-owned firms,
privatized enterprises and other non family-owned firms.4
4. Initial Returns
4.1 Research methodology
To measure the first-day return abnormal returns are calculated for each IPO. The abnormal return
for an IPO i is defined as the difference between the observed return of the IPO and the "normal"
return, which can be expected from an investment in IPO i:
[ ]ar R E Ri i i= − , (1)
4 Other non family-owned firms are defined as firms which are neither controlled by a family or by private per-
sons nor are privatized enterprises. In most cases such firms are owned by banks or other big companies.

7
where ari is the abnormal return of IPO i, Ri is the observed return and E[Ri] is the expected return.
Brown and Warner (1980, 1985) present several alternatives to determine the ex-ante expectations.
In the empirical IPO literature, the market-adjusted return method is commonly used. The initial
(first day) return for each IPO is then defined as the difference between its (observed) return and
the corresponding return on the market index:
IRP P
P
I I
Ii ti i
i
i i
i,
, ,
,
, ,
,=
−−
−1 0
0
1 0
0, (2)
where IRi,t is the market index-adjusted initial return of IPO i; Pi,1 is the closing price of IPO i at the
end of the first trading day; Pi,0 is the offer price of IPO i (the time index 0 refers to the first day of
the subscription period); Ii,1 is the Vienna Stock Exchange Share Index (WBI) at the end of the first
trading day of IPO i and Ii,0 is the WBI on the first day of the subscription period of IPO i.5
4.2 Distribution
The first part of the empirical section investigates the question as to whether an investor who
purchased every IPO of the sample issued at the offer price and sold it on the first day of public
listing earned a significant average abnormal return. This implies a strategy of investing a similar
amount of money in each IPO. Therefore, we test the null hypothesis that the average abnormal re-
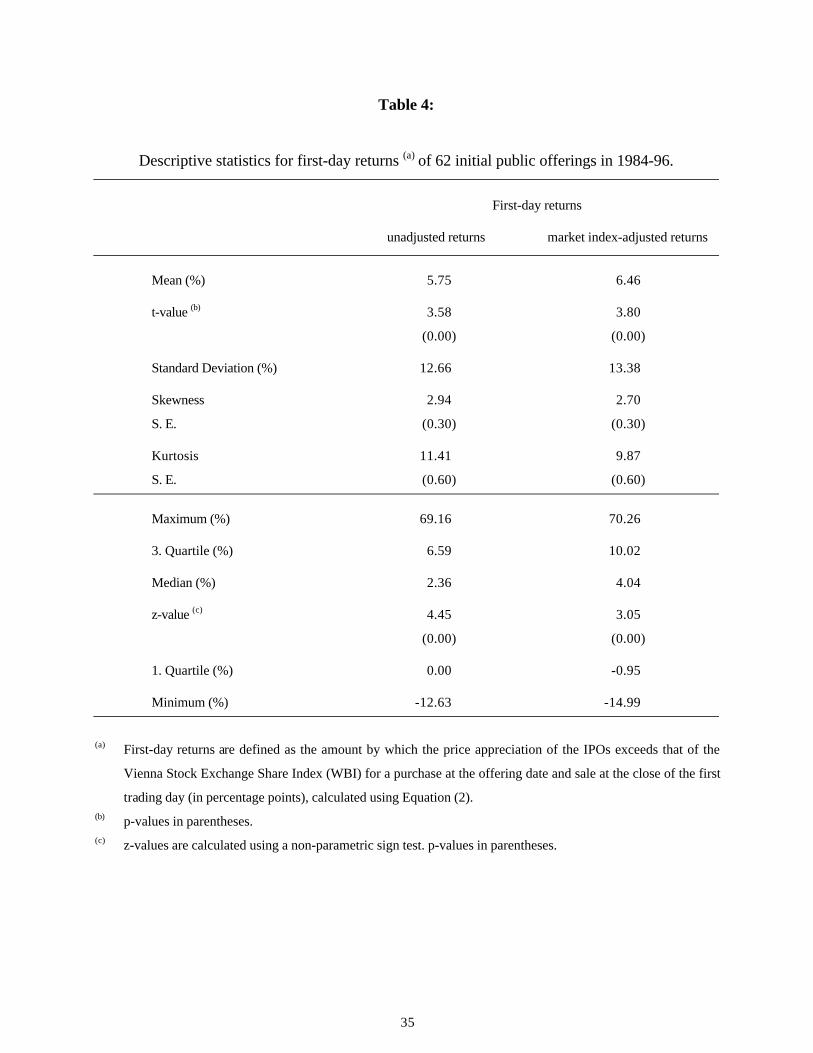
turn is not significantly different from zero. Table 4 reports average first-day returns for a sample
of 62 IPOs issued during the period 1984-96 and the main distribution parameters.6
5 Since the subscription period is very often closed prematurely, the first-day of the subscription period is used
for the computation of the market-adjusted returns.6 For 5 firms which went public using a tender procedure, no initial return is observable. Therefore the total
sample of 67 IPOs is reduced to 62 in investigating the initial return.
8
The average raw (unadjusted) initial return is 5.75 per cent (with an associated t-statistic of 3.58)
and the average market index-adjusted initial return is 6.46 per cent (with an associated t-statistic
of 3.80). The null hypothesis of no significant average abnormal initial return can therefore be re-
jected at the one per cent significance level. This evidence indicates that Austrian IPOs, as is
documented for nearly all IPO markets in different countries, are also underpriced, although their
underpricing level is lower than reported in most studies. As the distribution of initial returns is not
symmetric (positive skewness), the t-statistic must be interpreted with caution. Using a non-
parametric sign test, the initial return in both cases is also significantly different from zero at the
one per cent level. This supports the rejection of the null hypothesis. As in other studies7, the dis-
tribution of initial returns is skewed to the right and peaked. Column 5 of Table 2 documents the
fact that the initial returns for Austrian IPOs are not constant over time. Especially during the first
years and in the „hot issue“ period of 1990 the observable underpricing is above average.
4.3 Hypotheses to expain the level of underpricing
Many theories have been put forward to explain the underpricing of initial public offerings. In or-
der to formulate hypotheses to explain the first-day return levels of Austrian IPOs, the most com-
mon explanations will be examined.
Allocation (winner's curse) hypothesis: In Rock’s model (1986) underpricing is a necessary
equilibrium condition in a world of informational asymmetry between groups of informed and un-
informed investors. Initially, all investors are uninformed about the true value of the issuing firm
and its future prospects. This is termed ex-ante uncertainty. However, investors can, for a cost,
acquire firm-specific information and become informed. An informed investor can distinguish bet-
ween underpriced and overpriced new issues and will therefore submit purchase orders only if the
7 See for example Miller and Reilly (1987), Levis (1993) or Ruud (1993).

9
offer price is less than the true value of the stock. If, on the other hand, the issue is overpriced only
uninformed investors submit purchase orders and they subsequently receive a 100 per cent alloca-
tion. For underpriced issues, both uninformed and informed investors submit purchase orders and
the allocation is subsequently rationed between the two groups. This creates a situation where the
average first-day return conditional upon receiving shares is lower than the average first-day return
conditional upon submitting a purchase order. Therefore, uninformed investors face a "winner's
curse": The chance of being allocated shares in overpriced new issues is greater than in underpri-
ced issues. To keep uninformed investors participating in the IPO market, investment banks under-
price to ensure them a non-negative, market-adjusted rate of return.
To test whether Rock's (1986) winner's curse hypothesis holds for the sample under investigation,
it is necessary to calculate allocation-adjusted abnormal returns. This would require information of
the amount of rationing. As in many other countries, there are no standardized rationing principles
in Austria. The percentage allocation an investor receives depends not only on the size of the order
or the average oversubscribtion rate. It can differ between banks and can also depend on the relati-
onship between the customer and the investment bank. Sometimes even lotteries are used in the
allocation of very oversubscribed shares.8 More than 30 per cent of all Austrian IPOs are overpri-
ced with a mean initial return of -3.70 per cent, whereas underpriced IPOs experienced an average
first day return of +10.94 per cent.
Similar to other markets, there is a tendency in Austria that underpriced IPOs are oversubscribed
and that investors submitting purchasing orders for underpriced IPOs receive less than the number
of shares they ordered. On the other hand, overpriced IPOs are not usually oversubscribed and
investors submitting purchasing orders for these IPOs are allocated up to 100 per cent.
8 By contrast, Keloharju (1993) describes the allocation system in Finland as much more transparent.

10
Therefore, the average return available to an uninformed investor who uses a simple stagging stra-
tegy (always buy at the offer price and sell on the first trading day in the aftermarket) is reduced
due to rationing. This suggests that at least part of the observable unconditional abnormal return of
6.46 per cent can be put down to the phenomenon of the winner's curse.9
Ex-ante uncertainty hypothesis: One testable implication of the Rock model (1986) is that the
level of underpricing required to attract uninformed investors into the market increases with the ex-
ante uncertainty about the true value of the firm. The greater the ex-ante uncertainty, the greater is
the advantage of becoming an informed investor. Beatty and Ritter (1986) suggest that there should
be a positive relationship between the underpricing and the non-observable ex-ante uncertainty. In
order to test their proposition it is necessary to use a proxy for the ex-ante uncertainty. As recom-
mended in the empirical literature10 the volatility (standard deviation) of daily returns between the
second and the forty-second day of trading (first two trading months) is used as a proxy.
Underwriter reputation hypothesis: Another explanation for the level of underpricing is the re-
putation of the underwriter. Since an investment bank underwrites many offerings in the course of
time and in their business with potential investors, an investment bank can develop reputation and
earn more on this reputation than on "cheating" by underpricing too much or too little. A systemati-
cally too high or too low underpricing would subsequently be followed by a loss in market share.
Empirical studies investigating the relationship between the underpricing level and the un-
derwriter's reputation have found that high reputation investment banks underprice less than non-
prestigious banks.11 This is because high reputation underwriters issue firms with lower ex-ante
uncertainty.
9 Keloharju (1993a), for example, reports for Finland negative initial returns for around 41 per cent of an entire
sample of 80 IPOs. For a subscription of FIM 100,000, the difference between the unconditional return and the
allocation-weighted return is approximately 11 percentage points.10 See for example Ritter (1984) and McGuinnes (1992).11 See for example Johnson and Miller (1988).
11
Carter and Manaster (1990) postulate that the prestige of an investment bank provides a signal for
the market about the risk of the issue. They show that, on average, less prestigious investment banks
underwrite riskier IPOs than more prestigious banks. The less risky an issue is, the less is the in-
centive for investors to acquire information to become informed. If an issuing firm is less risky, the
ex-ante uncertainty is lower and according to Beatty and Ritter (1986) the underpricing should be
lower. Carter and Manaster (1990) suggest that one of the reasons why prestigious investment
banks issue low risk firms is that they want to increase the expected present value of subsequent
offerings. Low-risk IPO firms are more likely to survive and make subsequent offerings than high-
risk IPO firms. Carter (1992) provides empirical evidence that firms with no subsequent offerings
have a greater standard deviation of aftermarket returns and are therefore riskier.
To test explanations of underpricing focusing on the reputation of the underwriter, we use the log-
arithm of the cumulative gross proceeds of all issues an investment bank has already underwritten
as lead manager since 1984. This implies that, firstly, the reputation level of an investment bank
increases (in a non-linear way) with the total gross proceeds of all IPOs the bank has already is-
sued and that, secondly, the building up of reputation starts in 1984 for all banks. The latter as-
sumption seems to be admissible because no initial public offering took place in Austria in the 18
years before 1984.
Signalling Hypothesis: Studies by Allen and Faulhaber (1989), Grinblatt and Hwang (1989) and
Welch (1989) suggest that underpricing may itself be a costly signal of the intrinsic value of the
issuing firm. In the Welch signalling approach (1989) for example, high-quality firms deliberately
choose an offer price below the intrinsic value to signal their quality to investors. This under-
pricing is motivated by the possibility of achieving higher offer prices in subsequent seasoned is-
sues. Underpricing is therefore supposed to be a sort of "appetizer" for following issues in the af-
12
termarket.12 The investors know that only high-quality firms can afford the costs of underpricing.
The main assumption is that low quality firms only have the choice to imitate high-quality firms or
to disclose their true quality. The former results in imitation costs and involves the danger of losing
part of the imitation expenses if the true quality is recognized after the IPO but before a seasoned
offering. The latter creates no imitation costs but it forgoes the possibility of achieving higher pri-
ces at the IPO and in subsequent seasoned offerings. High-quality firms (= high underpricing)
should therefore only offer a smaller part of their share capital at the initial issue and make subse-
quent issues in the aftermarket. Advocates of the signalling hypothesis argue therefore that enterpri-
ses with a high credit standing deliberately use underpricing as a means of signalling their quality
to investors. If this explanation model applies, the level of underpricing should be proportional to
the freqency of seasoned issues and inversely proportional to the percentage fraction issued from
the share capital.
4.4 Regression analysis
To explain the observed underpricing of Austrian IPOs, the following hypotheses are tested:
Hypothesis H1: Ex-ante uncertainty hypothesis: there exists no significant relationship be-
tween the level of underpricing and the ex-ante uncertainty measured by the
standard deviation (volatility) of the first 42 daily aftermarket trading returns
(variable Vola).
Hypothesis H2: Underwriter reputation hypothesis: There exists no significant relationship
between the level of underpricing and the reputation of the underwriter mea-
12 Slovin, Sushka and Bendeck (1994) for example report a non-negative long-run aftermarket performance for
IPOs with seasoned equity offerings.
13
sured by the logarithm of the cumulative gross proceeds of issues an invest-
ment bank has already launched as lead manager since 1984 (variable Rep).
Hypothesis H3: Signalling Hypothesis: There exists no significant relationship between the
level of underpricing and the fraction of the share capital sold (variable Frac
in per cent) and the seasoned equity offering activity during the first two years
of aftermarket trading (dummy variable SEO, which is coded one if a sesoned
equity offering is made within 24 months of the IPO).
In order to examine the relationship between the state of the market and the level of underpricing
the performance of the market in the three months before the IPO is also considered.
Hypothesis H4: Market Climate Hypothesis: There exists no significant relationship between
the level of underpricing and the performance of the stock market (Vienna
Stock Exchange Share Index) in the three month period before the beginning of
the subscription period (variable Market).
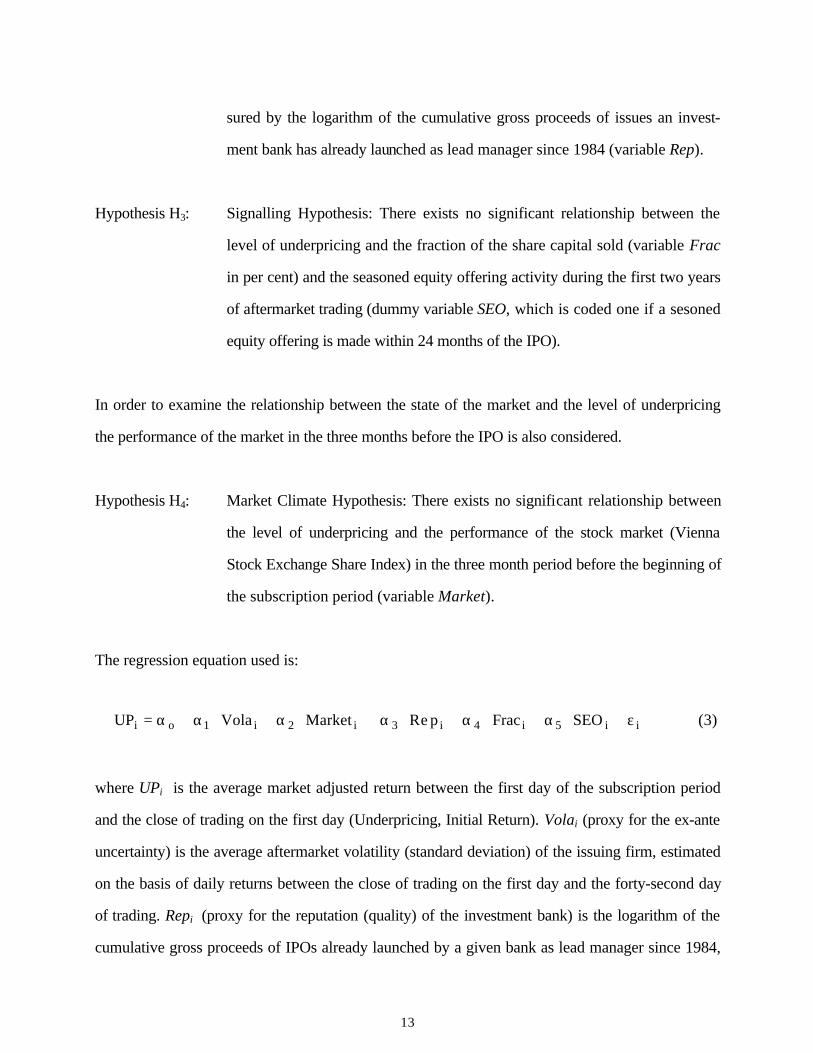
The regression equation used is:
UP Vola Market p Frac SEOi o i i i i i i= + ⋅ + ⋅ + ⋅ + ⋅ + ⋅ +α α α α α α ε1 2 3 4 5Re (3)
where UPi is the average market adjusted return between the first day of the subscription period
and the close of trading on the first day (Underpricing, Initial Return). Volai (proxy for the ex-ante
uncertainty) is the average aftermarket volatility (standard deviation) of the issuing firm, estimated
on the basis of daily returns between the close of trading on the first day and the forty-second day
of trading. Repi (proxy for the reputation (quality) of the investment bank) is the logarithm of the
cumulative gross proceeds of IPOs already launched by a given bank as lead manager since 1984,
14
and Fraci is the percentage portion (fraction) issued from the share capital. Marketi (market per-
formance prior to the issue) is the percentage change in the Vienna Stock Exchange Share Index for
the three-month period prior to the subscription period, and SEOi (seasoned equity offering) is a
dummy variable coded one if a seasoned issue of equities is made within 24 months of the IPO.
Table 5 shows the results of the multivariate regression analysis. First, a significant and positive
relation can be detected between the variable UP (undepricing) and the variable Vola (ex-ante un-
certainty). This supports the Beatty and Ritter (1986) argumentation. A higher ex-ante uncertainty
implies a higher underpricing. Second, the relation between UP and the variable Market (market
performance prior to issue) is also significantly positive. This finding suggests that Austrian IPOs
issued after an upswing in the stock market experienced a higher underpricing than IPOs following
a falling market. This finding is consistent with the existence of "hot-issue" and "cold-issue" mar-
kets.13 After the bear market of 1987 the average initial return in 1988 was -0.14 per cent whereas
in the year after the bull market of 1989 the average initial return in 1990 was 12.72 per cent. As
the underpricing of an IPO is high following a rising market and increases with the ex-ante uncer-
tainty, this suggests that IPOs which are unknown to investors and therefore more difficult to be
evaluated (higher ex-ante uncertainty) are more frequently issued following a rising stock market.
Third, there is no significantly negative relationship between the underpricing level and the repu-
tation of the investment bank (no significant association between UP and Rep), which is in clear
contrast to the reputation hypothesis. In Austria only three banks launched more than 5 issues from
1984 to 1996. They were, however, responsible for more than three quarters of all the IPOs and
had an average underpricing of 7.92 per cent. All other banks launched less than five issues in the
period considered and jointly accounted for less than one quarter of the IPOs. Surprisingly, their
13 The positive relationship between underpricing and the market climate is also reported for other markets (see
for example Ritter (1984) for the US, Uhlir (1989a, 1989b) for Germany and McGuinness (1992) for Hong
Kong).
15
underpricing level averaged at 1.86 per cent. It could be that the rejection of the reputation hypo-
thesis for the Austrian IPO market is due to the fact that the market structure is oligopolistic and
thus not very competitive.
Fourth, no significant relationship can be detected between the underpricing and the fraction of the
share capital sold (Frac) which is in contrast to the suggestion of the signalling hypothesis that high
quality (= high underpricing) firms sell less at the initial offering and more in the aftermarket. In
addition, the dummy variable SEO, which controls for seasoned equity offerings in the first two
years following the IPO is neither positive nor significantly related to the underpricing level. This
implies that the view cannot be supported that firms making secondary offerings in the 24 months
following an IPO underprice initial public offerings significantly more than others.14
5. Aftermarket Performance
5.1 Research methodology
To measure the abnormal performance of IPOs in the aftermarket it is first necessary to specify
appropriate benchmarks. This task is of particular importance because it can affect the measured
aftermarket performance. One possibility is to use a matching firm adjustment procedure, in which
for each IPO firm a non-IPO firm of approximately similar size and the same industry is chosen.15
Another possibility, which is used for markets in which the number of potential bench-mark firms
is low, is to use one or more indices, e.g. a market index, as a benchmark.16 To account for the fact
14 This is in contrast to the finding by McGuinness (1992) for the Hong Kong IPO market. He detects a significant
relation between the underpricing level and secondary offerings in the twelve months following an IPO.15 See e.g. Ritter (1991), Loughran and Ritter (1995) or Kim et al. (1995).16 See e.g. Keloharju (1993) for the Finnish IPO market or Kunz and Aggarwal (1994) for the Swiss IPO market.

16
that the Austrian stock market is small and the average number of IPO firms is about the same as for
non-IPO firms, a market index is not used as a benchmark. Otherwise IPOs would be compared
with a portfolio of IPOs and non-IPOs and a measured abnormal performance would be biased.
Instead portfolios of only non-IPO firms (all firms listed in the Official Market of the VSE exclusi-
ve of IPOs for their first five years after going public) are formed.
Starting with 1984, all non-IPO firms listed at the beginning of each calendar year are sorted by
their market capitalization as of the last trading day of the prior calendar year and grouped into
three reference portfolios, each containing an equal number of non-IPO firms. If a non-IPO firm is
delisted before the end of the calendar year, its last price before delisting is used till the end of the
year. Dependent on its market capitalization at the end of the first trading day, each IPO firm is then
assigned to one of these three reference portfolios. On the first trading day of each calendar year,
this assignment procedure is repeated to account for size changes in the IPO firms and the firms in
the reference portfolios.17
The basis for the evaluation of the aftermarket performance of Austrian IPOs are the following ex-
ante implementable trading strategies: (a) Purchase each IPO on its first aftermarket trading day18,
(b) purchase each IPO’s corresponding reference portfolio on the IPO’s first aftermarket trading
day, and (c) sell each IPO and its corresponding reference portfolio on the earlier of the last day
before the IPO’s delisting and (1) the 22nd (i.e. after one month of aftermarket trading), (2) the
125th (after six months), (3) the 251st (after twelve months), (4) the 751st (after three years) and (5)
17 This procedure ensures that IPO firms are compared with (a portfolio of) non-IPO firms of approximately si-
milar size. This is important because there is evidence of size-related performance differences in the Austrian
Stock Market (see Aussenegg and Grünbichler (1996)). Classifying the reference portfolios by industries is not
done because the overall number of non-IPOs is small and only a few publicly traded companies are available in
most industries.18 It is not difficult to buy shares of Austrian IPOs on the first trading day. Only purchase orders to buy at the offer
price are often rationed.
17
the 1251st trading day (after five years). As the number and size of future IPOs is ex-ante unknown,
it is assumed that an equal amount of money is invested in each IPO or each corresponding refe-
rence portfolio.
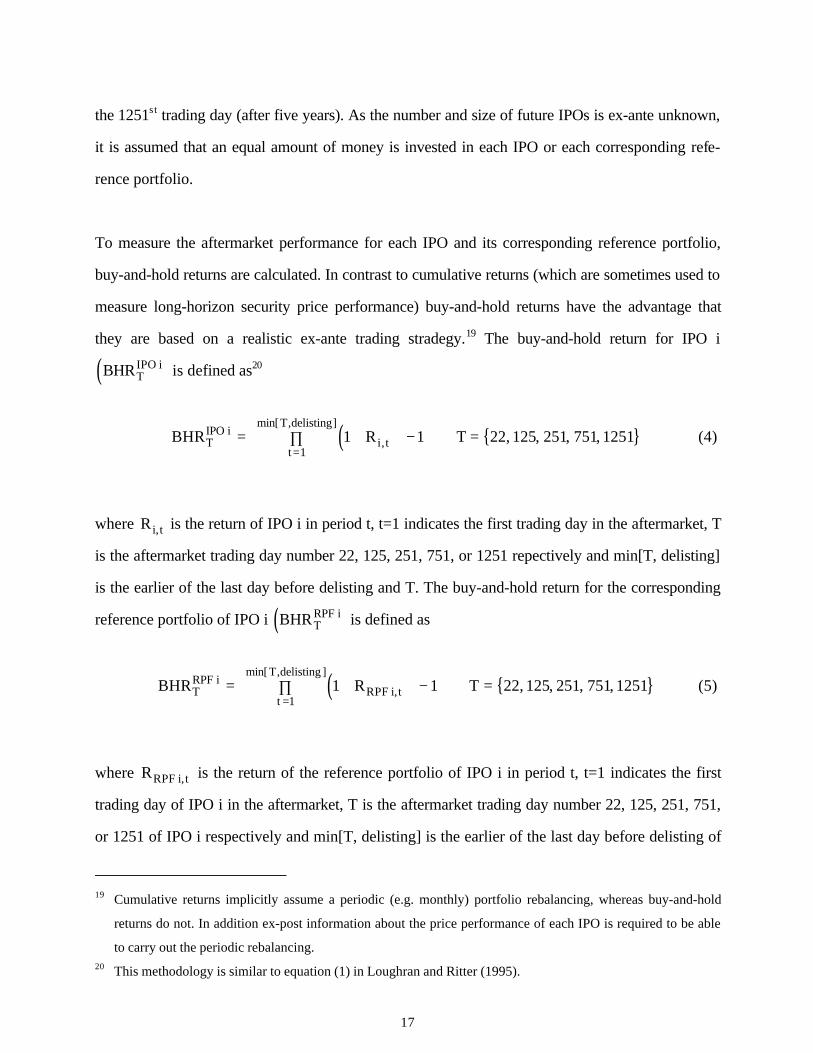
To measure the aftermarket performance for each IPO and its corresponding reference portfolio,
buy-and-hold returns are calculated. In contrast to cumulative returns (which are sometimes used to
measure long-horizon security price performance) buy-and-hold returns have the advantage that
they are based on a realistic ex-ante trading stradegy.19 The buy-and-hold return for IPO i
( )BHRTIPO i is defined as20
( ) { }BHR R TTIPO i
i tt
T delisting= +∏
− =
=1 1 22 125 251 751 1251
1,
min[ , ], , , , (4)
where R i t, is the return of IPO i in period t, t=1 indicates the first trading day in the aftermarket, T
is the aftermarket trading day number 22, 125, 251, 751, or 1251 repectively and min[T, delisting]
is the earlier of the last day before delisting and T. The buy-and-hold return for the corresponding
reference portfolio of IPO i ( )BHRTRPF i is defined as
( ) { }BHR R TTRPF i
RPF i tt
T delisting= +∏
− =
=1 1 22 125 251 751 1251
1,
min[ , ], , , , (5)
where RRPF i t, is the return of the reference portfolio of IPO i in period t, t=1 indicates the first
trading day of IPO i in the aftermarket, T is the aftermarket trading day number 22, 125, 251, 751,
or 1251 of IPO i respectively and min[T, delisting] is the earlier of the last day before delisting of
19 Cumulative returns implicitly assume a periodic (e.g. monthly) portfolio rebalancing, whereas buy-and-hold
returns do not. In addition ex-post information about the price performance of each IPO is required to be able
to carry out the periodic rebalancing.20 This methodology is similar to equation (1) in Loughran and Ritter (1995).

18
IPO i and T. Therefore, buy-and-hold returns over identical intervals are calculated for each IPO
and its corresponding reference portfolio. This procedure introduces no survivorship bias or look-
ahead bias. The average buy-and-hold return for a sample of n IPOs ( )BHRTIPO and corresponding
reference portfolios ( )BHRTRPF is then measured as
BHRn
BHRTIPO
TIPO i
i
n= ∑
=
1
1(6.1)
BHRn
BHRTRPF
TRPF i
i
n= ∑
=
1
1(6.2)
where n is the number of IPOs. To measure the abnormal performance for the above described tra-
ding strategies buy-and-hold abnormal returns are calculated for each IPO i as
BHAR BHR BHRTIPO i
TIPO i
TRPF i= − (7)
where BHRTIPO i is the buy-and-hold return of IPO i and BHRT
RPF i is the buy-and-hold return of
the corresponding reference portfolio of IPO i. Then, the average buy-and-hold abnormal return is
given by
[ ]BHARn
BHART TIPO i
i
n= ∑
=
1
1(8)
A positive (negative) average buy-and-hold abnormal return can be interpreted as an outperfor-
mance (underperformance) of the IPO sample relative to the reference portfolios. Following Ritter
(1991), the relative aftermarket performance is also evaluated using wealth relatives. The wealth
relative for a portfolio of n IPOs for the described trading strategies is defined as
WRBHRBHRT
TIPO
TRPF=
++
11
(9)

19
where BHRTIPO is the average buy-and-hold return of n IPOs and BHRT
RPF is the average buy-
and-hold return of the corresponding reference portfolios. A wealth relative greater than (below)
one indicates that the IPO sample has outperformed (underperformed) a portfolio of benchmark
firms.
Another important point in measuring the long-horizon abnormal performance of security prices is
the usage of appropriate test statistics. As the simulation results of Kothari and Warner (1997),
Barbar and Lyon (1997) and Barbar, Lyon and Tsai (1996) show, conventional tests of long-run
abnormal security returns are often misspecified. They find that conventional parametric test stati-
stics often indicate a long-run abnormal performance when none is present (i.e. p-values are too
low and the null hypothesis of no abnormal performance is overrejected). They mention especially
three main reasons for potential misspecifications: (a) survival-related biases, which occur if fai-
ling firms are excluded, (b) rebalancing biases, which arise if cumulative return procedures are
used and (c) biases because long-run abnormal performance measures are typically skewed.
To minimize the first two sources of misspecification, this study also includes all firms delisted on
the VSE during the investigation period and uses buy-and-hold returns to calculate the long-run
performance. In addition, to account for the skewness bias, a skewness-adjusted t statistic with
bootstrapped p-values (as suggested by Barbar, Lyon and Tsai (1996)) and a non parametric sign
test are used to test the null hypothesis of no abnormal long-run performance.21
21 As a result of their simulation analyses concerning the long-horizon security price performance, Kothari and
Warner (1997) recommend using nonparametric and bootstrap tests to reduce misspecification.
20
5.2 Short-run performance
As the underpricing of Austrian IPOs is relatively low compared to other markets, an explanation
for this could be that the price adjustment process did not finish at the end of the first trading day. If
this is true, a significant abnormal performance should be observable during the first trading days
of aftermarket trading. For example Kim et al. (1995) document for 169 Korean firms that went
public from 1985-89 a significant and huge matching-firm adjusted average buy-and-hold return of
more than 31 per cent during the first month of trading in the aftermarkt (exclusive of the first-day
return). Table 6 reports the aftermarket performance for the total sample of Austrian IPOs exclusi-
ve of the initial return. The first three columns show that the short-run aftermarket performance is
neither significantly negative nor significantly positive. At the first anniversary, for example, 36 out
of 66 IPOs have a negative and 30 a positive buy-and-hold abnormal return. This evidence suggests
that, at least for the short term, the average initial return does not disappear and that the tendency
for full price adjustment to occur on the first trading day is apparent for the Austrian IPO market.
This is in line with other studies (see e.g. Miller and Reilly (1987) for the USA, Finn and Higham
(1988) for Australia, Uhlir (1989a, 1989b) for Germany and Kunz and Aggarwal (1994) for Swit-
zerland).

21
5.3 Long-run performance
Besides the initial return and the short-run performance of unseasoned new issues, the long-run
aftermarket return is also important for underwriters, issuing firms and investors. Significant ab-
normal returns in the long-run would suggest that IPOs are not priced at true values in the early
aftermarket. This would call into question the aftermarket efficiency in valuing newly listed firms.22
The last two columns of Table 6 report the long-run performance for the first 36 and 60 months
following the first day of public trading. 57 (51) firms, which went public during the period 1984-
93 (1984-91) are utilized in measuring the three-year (five-year) performance.
Focusing first on the three year performance, an investor purchasing each IPO for an equal amount
of money on its first aftermarket trading day would have earned a mean return of 26.02 % (or an
average annual return of 8.01 %) holding these IPOs until the third anniversary of public trading.
An alternative investment in the corresponding reference portfolio would have yielded a much hig-
her average return of 73.44 % (or an average annual return of 20.15 %) over the same time inter-
val. The mean and median buy-and-hold abnormal return of -47.42 % and -18.75 % respectively
are both significantly different from zero at the one per cent level.23 The null hypothesis of no ab-
normal three-year performance therefore has to be rejected. The wealth relative of 0.73 implies
that an investor would have had to invest 37 % more in each IPO than in each corresponding refe-
rence portfolio to achieve the same wealth after three-years of public trading.
Column 5 of Table 6 also shows the results based upon five-year holding periods. The perfor-
mance of IPOs continues to be poor in the years 4 and 5, with a significantly negative mean and
median buy-and-hold abnormal return of -73.95 % and -42.42 % respectively. Only 23 % of the
22 See Aggarwal and Rivoli (1990).23 The difference in the mean and median values reflects the skewness in the distribution of the buy-and-hold ab-
normal returns.
22
sample of 51 IPOs experienced a positive buy-and-hold abnormal return on their fifth anniversary.
The wealth relative of 0.64 also documents a severe underperformance of the average Austrian
IPO.
This finding, which is in contrast to the observation of a non-negative long-run aftermarket per-
formance for Swiss IPOs (see Kunz and Aggarwal (1994)) and Korean IPOs (see Kim et al.
(1995)), is in line with the empirical evidence for the IPO markets in the USA (see e.g. Ritter
(1991) and Loughran and Ritter (1995)), in Finland (see e.g. Keloharju (1993)), in Germany (see
e.g. Ljungqvist (1993)) or in the UK (see e.g. Levis (1993)).
5.4 Possible explanations for the observed long-run performance
As mentioned in section 3, about 60 per cent of all Austrian IPOs are firms which are exclusively
controlled by a family or by private persons before going public. On the other hand about 20 per
cent of all Austrian IPOs are enterprises owned by the state before going public. One main diffe-
rence between these two groups is that in state-owned companies ownership and management are
separated, whereas in family-owned firms this is not the case. In the latter the owners are also the
managers and in most cases sell part of their company to the public mainly to raise money for their
own pocket.24 The crucial question which arises is: does the long-run aftermarket performance of
an IPO depend on its pre-issue ownership structure ?
The ownership structure of family-owned firms going public might fit into one implication of the
agency theory: as managerial ownership in a firm is reduced, the managers’ incentives to maximize
the firms’ value decreases. As a consequence, the operating performance after going public should
be poor.
24 The mean fraction issued from the share capital by family-owned firms is 31.1 %.

23
Concerning the operating performance, Jain and Kini (1994) document a significant operating un-
derperformance for a sample of (non-privatized) US-IPOs. In contrast to their findings, Megginson
et al. (1994 and 1996) analyse the operating performance of privatized firms. They compare the
operating performance of 61 companies from 18 countries before and after privatization over the
period 1961-91 and document that the profitability and operating efficiency as well as real sales
and capital investment spending increased significantly after privatization. This raises the question
as to whether a positive operating performance after going public might lead to a non-negative or
perhaps positive long-run aftermarket performance of former state-owned enterprises. This would
imply at least a better long-run aftermarket performance for privatized enterprizes in comparison to
family-owned firms.
Table 7 reports the five-year abnormal performance of family-owned IPOs, privatized firms and
the group of other IPOs. Several interesting findings can be observed: first, by implementing a tra-
ding strategy to invest an equal amount of money in each family-owned IPO on the first trading day
in the aftermarket investors would not only have experienced a poor performance in relation to the
alternative strategy of investing in corresponding reference portfolios. In addition they would ac-
tually have lost money. The average buy-and-hold return on the fifth anniversary is -19.69 %
(or an average annual return of -4.29 %). This clear evidence of extremely poor performing family-
owned IPOs also shows up in the average and median buy-and-hold abnormal returns of -118.60 %
and -51.56 % respectively (both are significantly different from zero at the one per cent level).
Only 4 out of 31 IPOs managed to outperform non-IPOs or in other words 87 % of all family-
owned IPOs underperformed their corresponding benchmark firms over the first five years of
seasoning. The wealth relative of 0.40 implies the necessity for an investor to invest 150 % (!)
more in family-owned IPOs than in non-IPOs of (approximately) similar size to have the same
wealth on the fifth anniversary after going public.
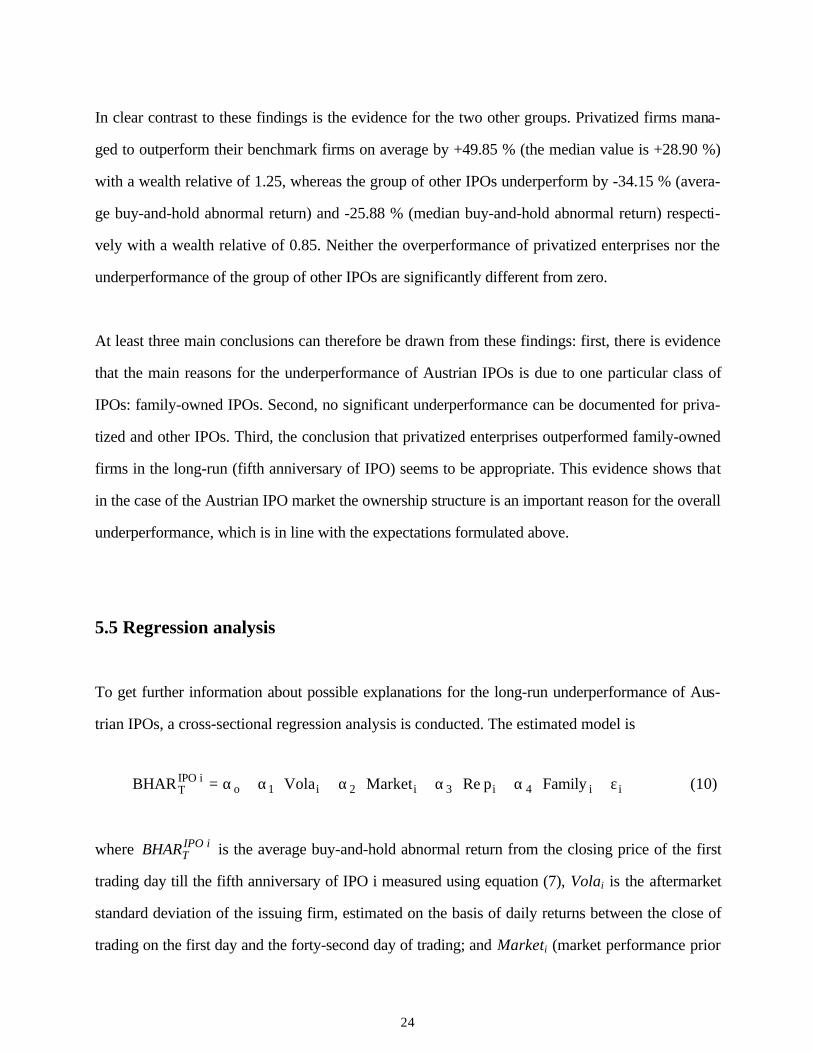
24
In clear contrast to these findings is the evidence for the two other groups. Privatized firms mana-
ged to outperform their benchmark firms on average by +49.85 % (the median value is +28.90 %)
with a wealth relative of 1.25, whereas the group of other IPOs underperform by -34.15 % (avera-
ge buy-and-hold abnormal return) and -25.88 % (median buy-and-hold abnormal return) respecti-
vely with a wealth relative of 0.85. Neither the overperformance of privatized enterprises nor the
underperformance of the group of other IPOs are significantly different from zero.
At least three main conclusions can therefore be drawn from these findings: first, there is evidence
that the main reasons for the underperformance of Austrian IPOs is due to one particular class of
IPOs: family-owned IPOs. Second, no significant underperformance can be documented for priva-
tized and other IPOs. Third, the conclusion that privatized enterprises outperformed family-owned
firms in the long-run (fifth anniversary of IPO) seems to be appropriate. This evidence shows that
in the case of the Austrian IPO market the ownership structure is an important reason for the overall
underperformance, which is in line with the expectations formulated above.
5.5 Regression analysis
To get further information about possible explanations for the long-run underperformance of Aus-
trian IPOs, a cross-sectional regression analysis is conducted. The estimated model is
BHAR Vola Market p FamilyTIPO i
o i i i i i= + ⋅ + ⋅ + ⋅ + ⋅ +α α α α α ε1 2 3 4Re (10)
where BHARTIPO i is the average buy-and-hold abnormal return from the closing price of the first
trading day till the fifth anniversary of IPO i measured using equation (7), Volai is the aftermarket
standard deviation of the issuing firm, estimated on the basis of daily returns between the close of
trading on the first day and the forty-second day of trading; and Marketi (market performance prior

25
to the issue) is the percentage change in the Vienna Stock Exchange Share Index for the three-month
period prior to the subscription period. Repi (proxy for the reputation (quality) of the underwriter)
is the logarithm of the cumulative gross proceeds of issues already launched by a bank as lead ma-
nager since 1984 and Familyi is a dummy variable coded one if IPO i is family-owned prior to the
issue and zero otherwise.
The variable Volai is included to test whether higher price fluctuations in the short term aftermarket
are associated with a worse long-run performance as the heterogeneous expectation hypothesis
would imply.25 The variable Marketi is used to test the windows of opportunity hypothesis. This
hypothesis states that firms time their IPO and go public when investors are overoptimistic. The
latter is mostly the case after stock market booms. About 50 per cent of all Austrian IPOs are cu-
mulated after the two stock market booms in 1985 and in 1989/90.
The results presented in Table 8 confirm in essence the above results for the long-run underper-
formance of Austrian IPOs. Whilst the variable Vola has no explanatory power, it is shown up that
the long-run performance is the worse, the better the stock market performance prior to the issue is.
This would testify for the windows of opportunity hypothesis, but we have to consider that the va-
riable market is only different from zero at the 10 per cent level. More pronounced are the results
for the reputation and the ownership structure hypotheses: First, the higher the reputation of the
underwriter, the better is the long-run performance (and vice versa). This is in line with the fin-
dings of Nanda, Yi and Yun (1995) who observed significant differences in the average long-run
performance of US-IPOs based on the reputation of the underwriter (lead manager). They show that
the long-run underperformance is a phenomenon which is primarily associated with IPOs done by
less established underwriters with a lower reputation. In addition they document that those un-
derwriters whose IPOs experienced the poorest long-run performance suffered a significant loss of
market share. On the other hand, IPOs underwritten by investment banks with a high reputation do
25 See e.g. Jenkinson and Ljungqvist (1996), p. 102.
26
not experience a long-run underperformance. Second, the very poor performance of family-owned
IPOs is also confirmed by the regression results. The variable Familyi is signficantly different from
zero at the one per cent level and has a negative sign.
6. Conclusion
This study examines the price behaviour of 67 Austrian IPOs going public in the Official Market of
the Vienna Stock Exchange (VSE) over the period 1984-1996. After more than 18 years with only
delistings, in every year of the thirteen-year investigation period firms went public. In accordance
with the findings for other markets, the average initial returns of Austrian IPOs are significantly
positive. At an average level of 6.5 per cent, however, the initial returns are lower than for most
other IPO markets. More than 30 per cent of all IPOs are overpriced with negative initial returns.
Several hypotheses to explain the observed unterpricing of Austrian IPOs are tested. The empirical
findings only show support for the ex-ante uncertainty and the market climate hypothesis. The un-
derpricing level is significantly positive in relation to the return standard deviation in the short-
term aftermarket and to the stock market performance in the last three months prior to the IPO. This
supports both the Beatty and Ritter (1986) argument that the underpricing increases with the ex-ante
uncertainty and the existence of "hot-issue" and "cold-issue" periods. On the other hand, the un-
derwriter reputation as well as the signalling hypothesis do not explain the cross-sectional diffe-
rences in the level of underpricing. An additional explanation for the observed underpricing could
be Rock's (1986) winner's curse hypothesis. Although it is not possible to directly test this hypo-
thesis due to the lack of a standardized rationing procedure, there is a tendency that the allocation is
lower for underpriced issues than for overpriced ones, so that the allocation-adjusted average in-
itial return should be smaller than the unadjusted 6.5 per cent.

27
In contrast to the findings for the Swiss and Korean IPO markets (see Kunz and Aggarwal (1994)
and Kim et. al. (1995) respectively), but in line with the evidence for the US (see e.g. Loughran and
Ritter (1995)), Finland (see e.g. Keloharju (1993)), the UK (see e.g. Levis (1993)) and Germany
(see e.g. Ljungqvist (1993)) Austrian IPOs significantly underperform in the long-run. An investor
purchasing each IPO for an equal amount of money on its first aftermarket trading day would have
earned a mean buy-and-hold return of 31.42 per cent till the fifth anniversary, whereas an alternati-
ve investment in corresponding reference portfolios of non-IPO firms of approximately similar
market capitalization would have yielded a much higher average buy-and-hold return of 105.38 per
cent over the same time interval. The mean buy-and-hold abnormal return of -73.95 per cent is si-
gnificantly different from zero and the wealth relative amounts to 0.64.
The main explanation for the observed severe long-run underperformance are cross-sectional diffe-
rences in the ownership structure of Austrian IPOs: nearly 60 per cent of all IPOs are firms which
are exclusively controlled by a family or by private persons (family-owned IPOs), whereas priva-
tized and other non family-owned firms account for around 20 per cent each. In state-owned and
non family-owned companies ownership and management are separated, whereas in family-owned
firms this is not the case. In the latter the owners are also the managers and in most cases sell part
of their company to the public mainly to raise money for their own pocket. In addition, their going
public is clustered after stock market booms, which suggests that they are best able to time an IPO
and take advantage of „windows of opportunity“.
For family-owned firms going public the average five-year buy-and-hold return is -19.69 per cent
which implies that an investor with a simple (ex-ante implementable) trading strategy to purchase
only family-owned IPOs would have lost money over the first five aftermarket trading years. The
wealth relative of 0.40 implies the necessity for an investor to invest 150 per cent (!) more money
in family-owned IPOs than in non-IPOs of (approximately) similar size to have the same wealth at
the fifth anniversary after going public. In contrast to this extreme underperformance, no significant

28
positive or negative abnormal performance can be detected for privatized enterprizes or other non
family-owned IPOs.
References
Aggarwal, R., Rivoli, P. (1990): Fads in the Initial Public Offering Market?, Financial Mana-
gement, Winter 1990, pp. 45 - 57.
Allen, F., Faulhaber, G. R. (1989): Signalling by Underpricing in the IPO Market, Journal of
Financial Economics, Vol. 23, 1989, pp. 303 - 323.
Aussenegg, W. (1994): Underpricing und Initial Public Offerings - Eine empirische Untersuchung
von Erstemissionen am Österreichischen Aktienmarkt: 1984-1992, in Helmut Uhlir (Hrsg.):
Arbeitspapiere der Bankwissenschaftlichen Gesellschaft, Band 3, Vienna 1994, S. 1-28.
Aussenegg, W., Grünbichler, A. (1996): The Size Effect in the Austrian Stock Market, Working
Paper, Vienna University of Technology and University of St. Gallen, June 1996.
Barber, B. M., Lyon, J. D. (1997): Detecting long-run abnormal stock returns: The empirical po-
wer and specification of test statistics, Journal of Financial Economics, Vol. 43, 1997, pp.
341-372.
Barber, B. M., Lyon, J. D., Tsai, C. L. (1996): Holding Size while Improving Power in Tests of
Long-Run Abnormal Stock Returns, Working Paper, Graduate School of Management, Uni-
versity of California Davis, October 1996.
Beatty, R. P., Ritter, J. R. (1986): Investment Banking, Reputation, and the Underpricing of Initi-
al Public Offerings, Journal of Financial Economics, Vol. 15, 1986, pp. 213 - 232.
Brown, S. J., Warner, J. B. (1980): Measuring Security Price Performance, Journal of Financial
Economics, Vol. 8, 1980, pp. 205 - 258.

29
Brown, S. J., Warner, J. B. (1985): Using Daily Stock Returns. The Case of Event Studies, Jour-
nal of Financial Economics, Vol. 14, 1985, pp. 3 - 31.
Carter, R. B. (1992): Underwriter Reputation and Repetitive Public Offerings, The Journal of
Financial Research, Vol. XV, No. 4, Winter 1992, pp. 341 - 354.
Carter, R. B., Manaster, S. (1990): Initial Public Offerings and Underwriter Reputation, The
Journal of Finance, Vol. XLV, No. 4, Sep. 1990, pp. 1045 - 1067.
Finn, F. J., Higham, R. (1988): The Performance of Unseasoned New Equity Issues-Cum-Stock
Exchange Listings in Australia, Journal of Banking and Finance, Vol. 12, 1988, pp. 333 -
351.
Grinblatt, M., Hwang, C. Y. (1989): Signalling and the Pricing of New Issues, The Journal of
Finance, Vol. XLIV, No. 2, June 1989, pp. 393 - 420.
Ibbotson, R. G., Ritter, J. R. (1995): Initial Public Offerings, in: Jarrow, R. (Eds.), Handbooks
in OR & MS, Vol. 9, Elsevier Science B.V., 1995, pp. 993-1016.
Jenkinson, T., Ljungqvist, A. (1996): Going Public - The Theory and Evidence on How Compa-
nies Raise Equity Finance, Oxford and New York, Oxford University Press, 1996.
Jain, B. A., Kini, O. (1994): The Post-Issue Operating Performance of IPO Firms, The Journal of
Finance, Vol. XLIX, No. 5, Dec. 1994, pp. 1699 - 1726.
Johnson, J. M., Miller, R. E. (1988): Investment Banker Prestige and the Underpricing of Initial
Public Offerings, Financial Management, Summer 1988, pp. 19 - 29.
Keloharju, M. (1993): Winner’s curse, legal liability, and the long-run price performance of initi-
al public offerings in Finland, Journal of Financial Economics, Vol. 34, 1993, pp. 251-
277.
Kim, J., Krinsky, I., Lee, J. (1995): The aftermarket performance of initial public offerings in
Korea, Pacific-Basin Finance Journal, Vol. 3, 1995, pp. 429 - 448.
30
Kothari, S. P., Warner, J. B. (1997): Measuring long-horizon security price performance, Journal
of Financial Economics, Vol. 43, 1997, pp. 301-339.
Kunz, R. M., Aggarwal, R. (1994): Why initial public offerings are underpriced: Evidence from
Switzerland, Journal of Banking and Finance, Vol. 18, 1994. pp. 705 - 723.
Levis, M. (1993): The Long-Run Performance of Initial Public Offerings: The UK Experience
1980 - 1988, Financial Management, Vol. 22, pp. 22-41.
Ljungqvist, A.P. (1993): Underpricing and long-term performance of German initial public offe-
rings, 1978-92, Working Paper, Nuffield College, Oxford.
Loughran, T., Ritter, J. R. (1995): The New Issues Puzzle, The Journal of Finance, Vol. L, No.
1, March 1995, pp. 23 - 51.
Loughran, T., Ritter, J. R., Rydqvist, K (1994): Initial public offerings: International insights,
Pacific-Basin Finance Journal, Vol. 2, 1994, pp. 165 - 199.
McGuinness, P. (1992): An Examination of the Underpricing of Initial Public Offerings in Hong
Kong 1980 - 90. Journal of Business Finance & Accounting, 19 (2), Jan. 1992, pp. 165 -
186.
Megginson, W. L., Nash, R. C., Van Randenborgh, M. (1994): The Financial and Operating
Performance of Newly Privatized Firms: An International Empirical Analysis, The Journal
of Finance, Vol. XLIX, No. 2, June 1994, pp. 403 - 452.
Megginson, W. L., Nash, R. C., Van Randenborgh, M. (1996): The Record on Privatization,
Journal of Applied Corporate Finance, Vol. 9, No. 1, Spring 1996, pp. 23 - 34.
Miller, R. E., Reilly, F. K. (1987): An Examination of Mispricing, Returns, and Uncertainty for
Initial Public Offerings, Financial Management, Summer 1987, pp. 33 - 38.
Nanda, V., Yi, J.-H., Yun, Y. (1995): IPO long run Performance and Underwriter Reputation,
Working Paper 95-22, School of Business Administration, The University of Michigan.

31
Ritter, J. R. (1984): The „Hot Issue“ Market of 1980, Journal of Business, Vol. 57, No. 2, 1984,
pp. 215 - 240.
Ritter, J. R. (1987): The Costs of Going Public, Journal of Financial Economics, Vol. 19, 1987,
pp. 269 - 281.
Ritter, J. R. (1991): The Long-Run Performance of Initial Public Offerings, The Journal of
Finance, Vol. XLVI, No. 1, March 1991, pp. 3 - 27.
Rock, K. (1986): Why New Issues Are Underpriced, Journal of Financial Economics, Vol. 15,
1986, pp. 187 - 212.
Ruud, J. S. (1993): Underwriter price support and the IPO underpricing puzzle, Journal of Finan-
cial Economics, Vol. 34, 1993, pp. 135 - 151.
Slovin, M. B., Sushka, M. E., Bendeck, Y. M. (1994): Seasoned common stock issuance fol-
lowing an IPO, Journal of Banking and Finance, Vol. 18, 1994, pp. 207 - 226.
Uhlir, H. (1989a): Der Gang an die Börse und das Underpricing-Phänomen. Eine empirische Un-
tersuchung deutscher Emissionen (1977 - 1987), Zeitschrift für Bankrecht und Bank-
wirtschaft, January 1989, pp. 2 - 16.
Uhlir, H. (1989b): Going Public in the F.R.G., NATO ASI Series, Vol F54, A Reappraisal of the
Efficiency of Financial Markets, edited by Rui M. C. Guimarães et al., Springer-Verlag,
Berlin 1989, pp. 369-393.
Vienna Stock Exchange (1997): Annual report 1996, Vienna 1997.
Welch, I. (1989): Seasoned Offerings, Imitation Costs, and the Underpricing of Initial Public Offe-
rings, The Journal of Finance, Vol. XLIV, No. 2, June 1989, pp. 421 - 449.

32
Table 1:
Initial returns and aftermarket performance of initial public offerings in some recent studies.
country study Time period Average 3-year aftermarket perfor-
mance(a)
initial return Return (%) wealth relative
US Ritter (1991)(d) 1975-84 +14.1 % -29.1 (b) 0.83
US Loughran and Ritter (1995)(d) 1970-90 +10.0 % -26.9 (c) 0.80
UK Levis (1993)(e) 1980-88 +14.1 % -26.3 (b) 0.92
Finland Keloharju (1993)(e) 1984-89 +8.7 % -26.4 (b) 0.79
Schweden Loughran et al. (1994) 1980-90 +38.2 % +2.0(c) 1.01
Switzerland Kunz and Aggarwal (1994)(e) 1983-89 +35.8 % -6.1(b) n.a.
Korea Kim et al. (1995)(d) 1985-89 +57.6 % +91.6 (b) 1.56
Germany Ljungqvist (1993)(f) 1978-89 +12.4 % -18.2 (c) 0.87
(a) Exclusive of the initial return.(b) Cumulative abnormal return.(c) Buy-and-hold abnormal return.(d) Matching firm adjusted.(e) Market index adjusted.(f) GSC100 Index adjusted.
33
Table 2:
Distribution of initial public offerings in the Official Market by year.
year No. of IPOs
Aggregate
gross proceeds
million ATS
Average
gross proceeds
million ATS
Average
first-day return(a)
(%)
1965-1983 0 - - -
1984 2 63.8 31.9 11.0
1985 2 965.8 482.9 11.1
1986 10 1,570.1 157.0 3.0
1987 3 1,588.6 529.5 8.5
1988 6 4,227.4 704.6 -0.1
1989 6 2,569.6 428.3 4.8
1990 14 7,035.6 502.5 12.7
1991 8 3,832.6 479.1 7.6
1992 5 2,897.4 579.5 4.9
1993 1 621.6 621.6 8.9
1994 5 10,622.1 2,124.4 2.9
1995 4 5,985.5 1,496.4 0.4
1996 1 542.8 542.8 3.4
Total 67 42,522.9 634.7 6.5
(a) First-day returns are defined as the amount by which the price appreciation of the IPOs exceeds that of the
Vienna Stock Exchange Share Index (WBI) for a purchase at the offering date and sale at the close of the first
trading day (in percentage points), calculated using Equation (2).

34
Table 3:
Initial public offerings categorized by ownership, 1984-96.
No. of IPOs
Aggregate
gross proceeds,
million ATS
Average
gross proceeds,
million ATS
No of IPOs
%
Aggregate
gross proceeds
%
Family(a) 40 16,910.17 422.75 59.70 39.77
Priv(b) 13 22,139.30 1,703.02 19.40 52.06
Others(c) 14 3,473.39 248.10 20.90 8.17
Total 67 42,522.86 634.67 100.00 100.00
(a) Former family-owned firms. Family-owned IPOs are defined as firms controlled by a family or by private per-
sons before going public.(b) Privatized enterprises.(c) Other firms. They are defined as firms which are neither controlled by a family or by private persons nor are
privatized enterprises. In most cases such firms are owned by banks or other big companies.
35
Table 4:
Descriptive statistics for first-day returns (a) of 62 initial public offerings in 1984-96.
First-day returns
unadjusted returns market index-adjusted returns
Mean (%) 5.75 6.46
t-value (b) 3.58 3.80
(0.00) (0.00)
Standard Deviation (%) 12.66 13.38
Skewness 2.94 2.70
S. E. (0.30) (0.30)
Kurtosis 11.41 9.87
S. E. (0.60) (0.60)
Maximum (%) 69.16 70.26
3. Quartile (%) 6.59 10.02
Median (%) 2.36 4.04
z-value (c) 4.45 3.05
(0.00) (0.00)
1. Quartile (%) 0.00 -0.95
Minimum (%) -12.63 -14.99
(a) First-day returns are defined as the amount by which the price appreciation of the IPOs exceeds that of the
Vienna Stock Exchange Share Index (WBI) for a purchase at the offering date and sale at the close of the first
trading day (in percentage points), calculated using Equation (2).(b) p-values in parentheses.(c) z-values are calculated using a non-parametric sign test. p-values in parentheses.

36
Table 5:
Multivariate regression analysis of initial returns against several explanatory variables
for 62 IPOs from 1984-96.
Intercept Vola Market Rep Frac SEO F(a) R2adj
(b) DW(c)
-0.109 5.082 0.349 0.107 -0.094 -0.036 0.261 1.861
(-0.019) (3.385) (3.130) (0.151) (-1.196) (-0.010) 5.300
[0.985] [0.001] [0.003] [0.880] [0.237] [0.992] [0.000]
(a) The F-statistic tests the null hypothesis that the explanatory variable coefficients are equal to zero.(b) Adjusted R2
(c) Durbin-Watson Statistic
t-values (•) and p-values [•] in parentheses.
The model is:
UP Vola Market p Frac SEOi o i i i i i i= + ⋅ + ⋅ + ⋅ + ⋅ + ⋅ +α α α α α α ε1 2 3 4 5Re
where UPi (Underpricing, Initial Return) is the average market adjusted return between the first day of the subscrip-
tion period and the close of trading on the first day. Volai (proxy for the ex-ante uncertainty) is the aftermarket
standard deviation of the issuing firm, estimated on the basis of daily returns between the close of trading on the
first day and the forty-second day of trading. Repi (proxy for the reputation (quality) of the underwriter) is the
logarithm of the cumulative gross proceeds of issues already launched by a given bank as lead manager since 1984.
Fraci is the percentage portion (fraction) issued from the share capital und Marketi (market performance prior to
the issue) is the percentage change in the Vienna Stock Exchange Share Index for the three-month period prior to
the subscription period. SEOi (seasoned equity offering) is a dummy variable coded one if a seasoned issue of
equities is made within 24 months of the IPO.

37
Table 6:
Short- and long-run aftermarket performance (exclusive of initial return).
Month relative to IPO
1 6 12 36 60
short-run aftermarket long-run aftermarket
Average BHRIPOs (%) (a) 2.09 4.11 16.23 26.02 31.42
Geometric Mean p.a. (%) 8.01 5.62
Average BHRRef PF (%) (b) 1.33 5.12 18.85 73.44 105.38
Geometric Mean p.a. (%) 20.15 15.48
Wealth relative (c) 1.01 0.99 0.98 0.73 0.64
Average BHAR (%) (d) 0.76 -1.02 -2.62 -47.42‡ -73.95‡
t-value (e) (0.45) (-0.25) (-0.29) (-3.64) (-3.14)
Median BHAR (%) -0.59 -1.28 -5.28 -18.75‡ -42.42‡
z-value (f) (-1.10) (-0.25) (-0.74) (-2.78) (-3.78)
No. of positive BHAR 29 32 30 18 12
No. of negative BHAR 38 34 36 39 39
No. of IPOs (total) 67 66 66 57 51
‡ Significant different from zero at the one per cent level.† Significant different from zero at the five per cent level.
(a) Average buy-and-holding return for the sample of IPOs.(b) Average buy-and-holding return for the corresponding reference portfolios.(c) Wealth relative for the sample of IPOs, calculated using equation (9).(d) Average buy-and-hold abnormal return for the sample of IPOs, calculated using equation (7) and (8).(e) Bootstrapped skewness-adjusted t-statistics (as suggested by Barber, Lyon and Tsai (1996)).(f) z-values are calculated using a non-parametric sign test.

38
Table 7:
Long-run aftermarket performance: first trading day till the fifth anniversary
(exclusive of initial return) for all issues, family-owned issues (Family),
privatized firms (Privatized) and other issues (Others), 1984-91.
All issues Family Privatized Others
Average BHRIPOs (%) (a) 31.42 -19.69 152.03 88.36
Geometric Mean p.a. (%) 5.62 -4.29 20.31 13.50
Average BHRRef PF (%) (b) 105.38 98.92 102.17 122.51
Geometric Mean p.a. (%) 15.48 14.75 15.12 17.35
Wealth relative (c) 0.64 0.40 1.25 0.85
Average BHAR (%) (d) -73.95‡ -118.60‡ 49.85 -34.15
t-value (e) -3.14 -6.12 0.86 -0.62
Median BHAR (%) -42.42‡ -51.56‡ 28.90 -25.88
z-value (f) -3.78 -4.13 0.38 -1.39
No. of positive BHAR 12 4 4 4
No. of negative BHAR 39 27 3 9
No. of IPOs (total) 51 31 7 13
Family-owned IPOs are defined as firms exclusively controlled by a family or by private persons before going
public, privatized firms are former (100 per cent) state-owned enterprises and other firms are firms exclusively
controlled by a bank or another big company (not controlled by a family).
‡ Significant different from zero at the one per cent level.† Significant different from zero at the five per cent level.(a) Average buy-and-holding return for the sample of IPOs.(b) Average buy-and-holding return for the corresponding reference portfolios.(c) Wealth relative for the sample of IPOs, calculated using equation (9).(d) Average buy-and-hold abnormal return for the sample of IPOs, calculated using equation (7) and (8).(e) Bootstrapped skewness-adjusted t-statistics (as suggested by Barber, Lyon and Tsai (1996)).(f) z-values are calculated using a non-parametric sign test.

39
Table 8:
Multivariate regression analysis of five-year buy-and-hold abnormal returns (BHART)
against several explanatory variables, all issues from 1984-91 (51 IPOs).
Intercept Vola Market Rep Family F(a) R2adj
(b) DW(c)
-117.098 20.699 -2.649 19.054 -161.026 0.235 2.135
(-2.243) (1.060) (-1.834) (2.646) (-3.624) 4.842
[0.030] [0.295] [0.073] [0.011] [0.001] [0.002]
(a) The F-statistic tests the null hypothesis that the explanatory variable coefficients are equal to zero.(b) Adjusted R2
(c) Durbin-Watson Statistic
t-values (•) and p-values [•] in parentheses.
The model is:
BHAR Vola Market p FamilyTIPO i
o i i i i i= + ⋅ + ⋅ + ⋅ + ⋅ +α α α α α ε1 2 3 4Re
where BHARTIPO i is the average buy-and-hold abnormal return from the closing price of the first trading day till
the fifth anniversary of IPO i measured using equation (7), Volai is the aftermarket standard deviation of the issuing
firm, estimated on the basis of daily returns between the close of trading on the first day and the forty-second day
of trading; and Marketi (market performance prior to the issue) is the percentage change in the Vienna Stock Ex-
change Share Index for the three-month period prior to the subscription period. Repi (proxy for the reputation
(quality) of the underwriter) is the logarithm of the cumulative gross proceeds of issues already launched by a bank
as lead manager since 1984 and Familyi is a dummy variable coded one if an IPO is family-owned prior to the issue
and zero otherwise.