Embed Size (px)
Citation preview
STSM: Dendrometers and LVDT-sensors De Belder Aline
1
Short Term Scientific Mission:
Dendrometers and LVDT-sensors
Selecting the one that truly captures the heartbeat of the tree
COST STSM Reference Number: COST-STSM-ECOST-STSM-FP1106-140714-047022
Period: July 14 – August 22 2014
STSM Applicant: De Belder Aline, Ghent University, Ghent, Belgium
Host: Mayr Stefan, Institut für Botanik, Universität Innsbruck, Innsbruck, Austria
Introduction In the past few years many dendrometers and LVDT-sensors (Linear Variable Displacement Transducer)
have been developed and introduced into scientific research. These sensors ensure high-resolution
temporal data in comparison to the temporal information that can be derived from growth ring
analysis. The accurate measurements of these sensors deliver daily information on radial stem growth
and allow detection of stress conditions (De Swaef et al. 2009). However, the challenge remains to
unambiguously interpret the sensor signal because different components contribute to it (Daudet et
al. 2005).
Topic Group 8 (TG8) aims at a wide European study and collection of dendrometer and LVDT-data, but
when different sensors are used also different outputs might be obtained. To succeed in the long-term
goal of TG8, a comparison between different types of dendrometers is crucial.
The aim of this Short Term Scientific Mission (STSM) was to simultaneously compare different types of
dendrometers and LVDT-sensors in two different experimental settings. The first setting was a
temperature chamber where temperature was controlled and non-living test material was used. The
second one was the Botanical Garden in Innsbruck where tests were performed on an intact transpiring
tree, Picea abies.
Outline To be able to investigate the temperature dependence of the different sensors they were mounted on
a concrete block with a diameter of approximately twenty centimeters and placed in a temperature
chamber (Binder GmbH). The concrete block and sensors were then subjected to an air temperature
program, changing temperature from twenty to zero, from zero to thirty and from thirty to twenty
degrees Celsius every two hours with steps of ten degrees Celsius.
Because there are many different factors (e.g. expansion or shrinkage of the frame, temperature effect
on the sensor) affecting the output of the sensors, which may hinder correct growth measurement
interpretation, the temperature response of the whole sensor construction was investigated.
The comparison between the different types of sensors was performed on an intact tree Picea abies
and on a dead trunk of the same species at the Botanical Garden in Innsbruck (47° 16′ N, 11° 23′ E).
Twelve sensors were installed on the intact tree: three band dendrometers, four point dendrometers
and five LVDT sensors. Four different types were available in double, which were mounted on the dead
STSM: Dendrometers and LVDT-sensors De Belder Aline
2
trunk (Table 1). One sensor had a small sensor body, which made installation on the intact tree
impossible. Therefore this specific type could only be fixed on the dead trunk (Rathgeber).
Table 1 Description of all different sensor types. If a different name was used during the study then this is mentioned between brackets.
Name Type Manufacturer Remark
Homemade (Vinicio) Potentiometer (point) Uni Padova LPS Potentiometer (point) Natkon DF 2831 Potentiometer (point) Ecomatik DR Potentiometer (point) Ecomatik Homemade (Rathgeber) Potentiometer (point) LERFoB DC 1 Potentiometer (band) Ecomatik DRL 26 Potentiometer (band) EMS double E300 (Biondi) LVDT Agricultural Electronics double LBB 315/375 (LVDT) LVDT Schaevitz Eng. double MTN (Monitran) LVDT Monitran DF 5.0 LVDT Solartron Metrology DG 25 LVDT Solartron Metrology double D6 Strain-gage full-bridge (band) UMS
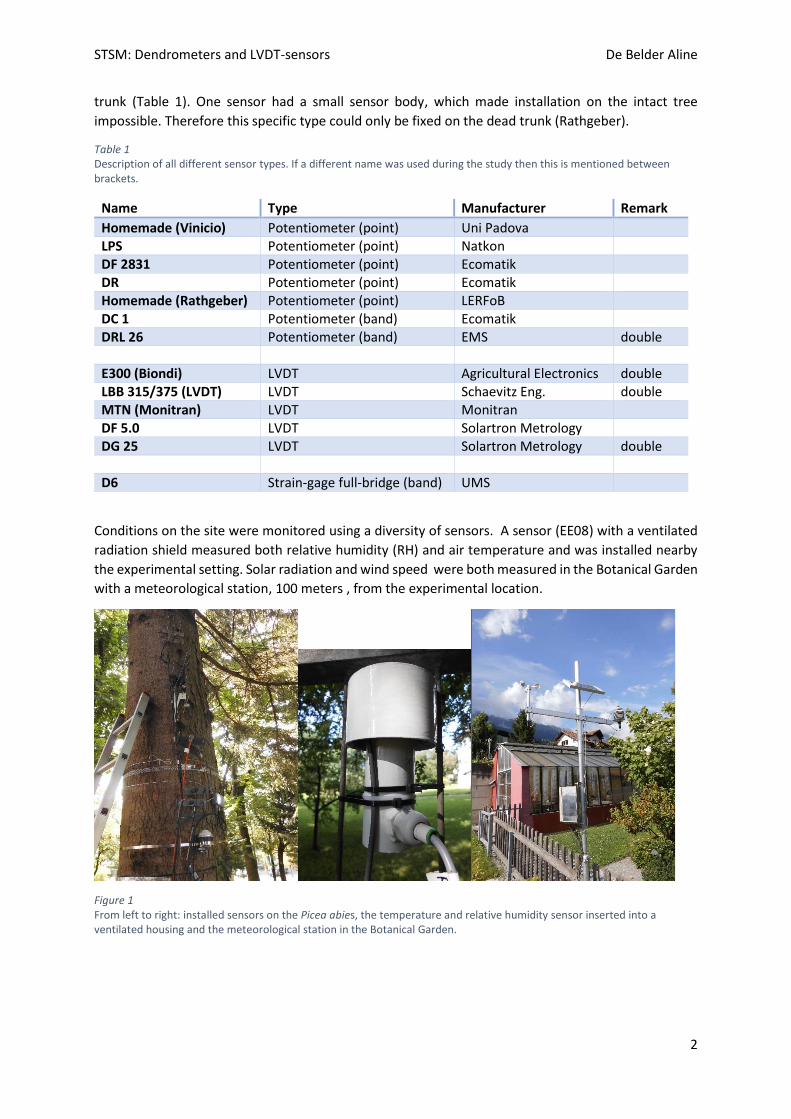
Conditions on the site were monitored using a diversity of sensors. A sensor (EE08) with a ventilated
radiation shield measured both relative humidity (RH) and air temperature and was installed nearby
the experimental setting. Solar radiation and wind speed were both measured in the Botanical Garden
with a meteorological station, 100 meters , from the experimental location.
Figure 1 From left to right: installed sensors on the Picea abies, the temperature and relative humidity sensor inserted into a ventilated housing and the meteorological station in the Botanical Garden.
STSM: Dendrometers and LVDT-sensors De Belder Aline
3
First results
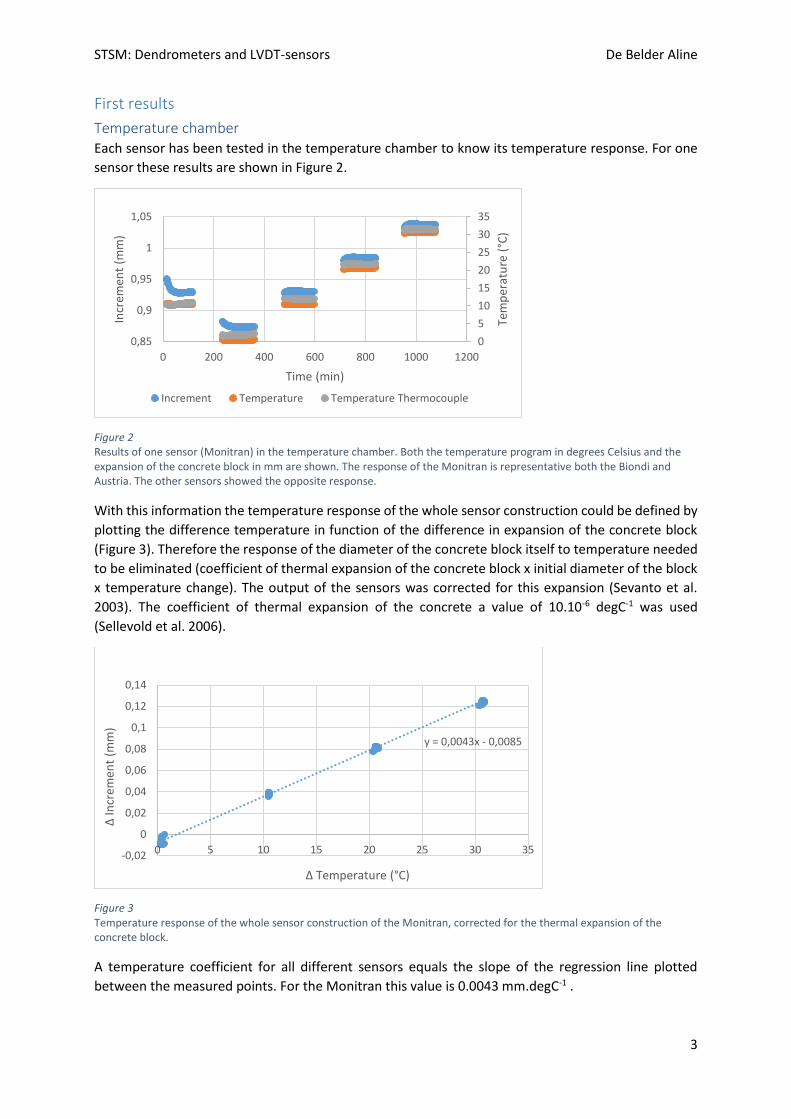
Temperature chamber Each sensor has been tested in the temperature chamber to know its temperature response. For one
sensor these results are shown in Figure 2.
Figure 2 Results of one sensor (Monitran) in the temperature chamber. Both the temperature program in degrees Celsius and the expansion of the concrete block in mm are shown. The response of the Monitran is representative both the Biondi and Austria. The other sensors showed the opposite response.
With this information the temperature response of the whole sensor construction could be defined by
plotting the difference temperature in function of the difference in expansion of the concrete block
(Figure 3). Therefore the response of the diameter of the concrete block itself to temperature needed
to be eliminated (coefficient of thermal expansion of the concrete block x initial diameter of the block
x temperature change). The output of the sensors was corrected for this expansion (Sevanto et al.
2003). The coefficient of thermal expansion of the concrete a value of 10.10-6 degC-1 was used
(Sellevold et al. 2006).
Figure 3 Temperature response of the whole sensor construction of the Monitran, corrected for the thermal expansion of the concrete block.
A temperature coefficient for all different sensors equals the slope of the regression line plotted
between the measured points. For the Monitran this value is 0.0043 mm.degC-1 .
0
5
10
15
20
25
30
35
0,85
0,9
0,95
1
1,05
0 200 400 600 800 1000 1200
Tem
per
atu
re (
°C)
Incr
emen
t (m
m)
Time (min)
Increment Temperature Temperature Thermocouple
y = 0,0043x - 0,0085
-0,02
0
0,02
0,04
0,06
0,08
0,1
0,12
0,14
0 5 10 15 20 25 30 35
ΔIn
crem
ent
(mm
)
Δ Temperature (°C)
STSM: Dendrometers and LVDT-sensors De Belder Aline
4
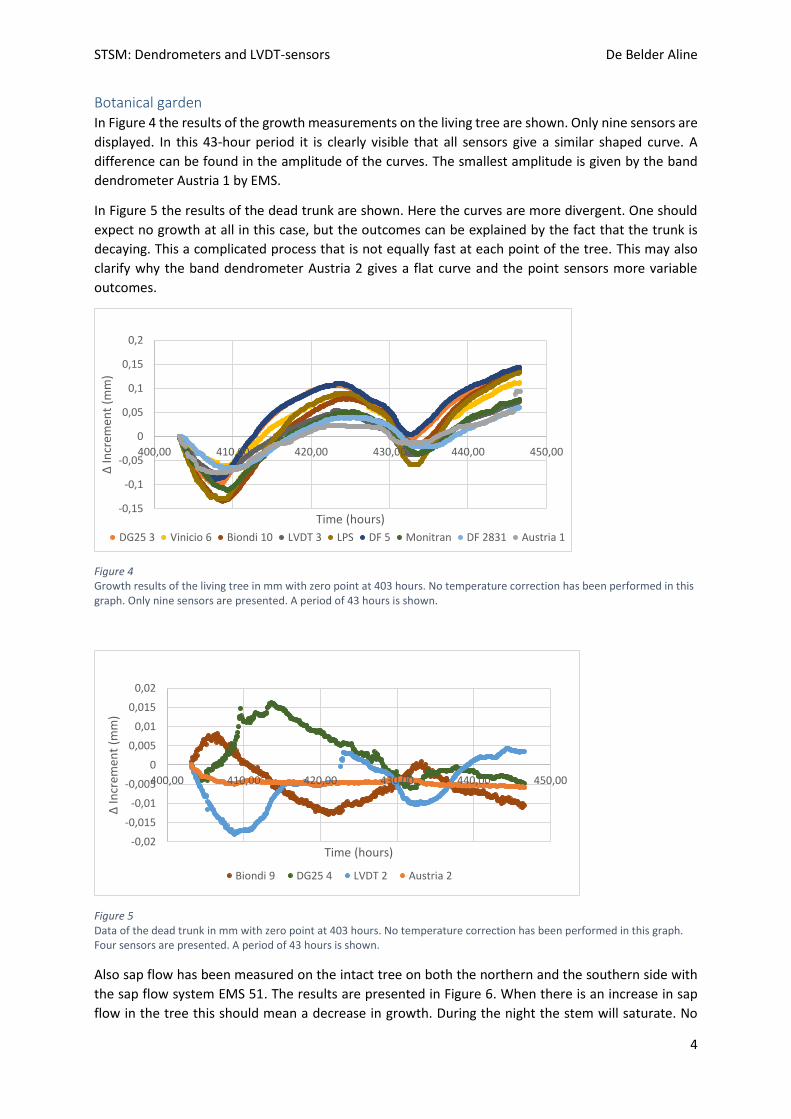
Botanical garden In Figure 4 the results of the growth measurements on the living tree are shown. Only nine sensors are
displayed. In this 43-hour period it is clearly visible that all sensors give a similar shaped curve. A
difference can be found in the amplitude of the curves. The smallest amplitude is given by the band
dendrometer Austria 1 by EMS.
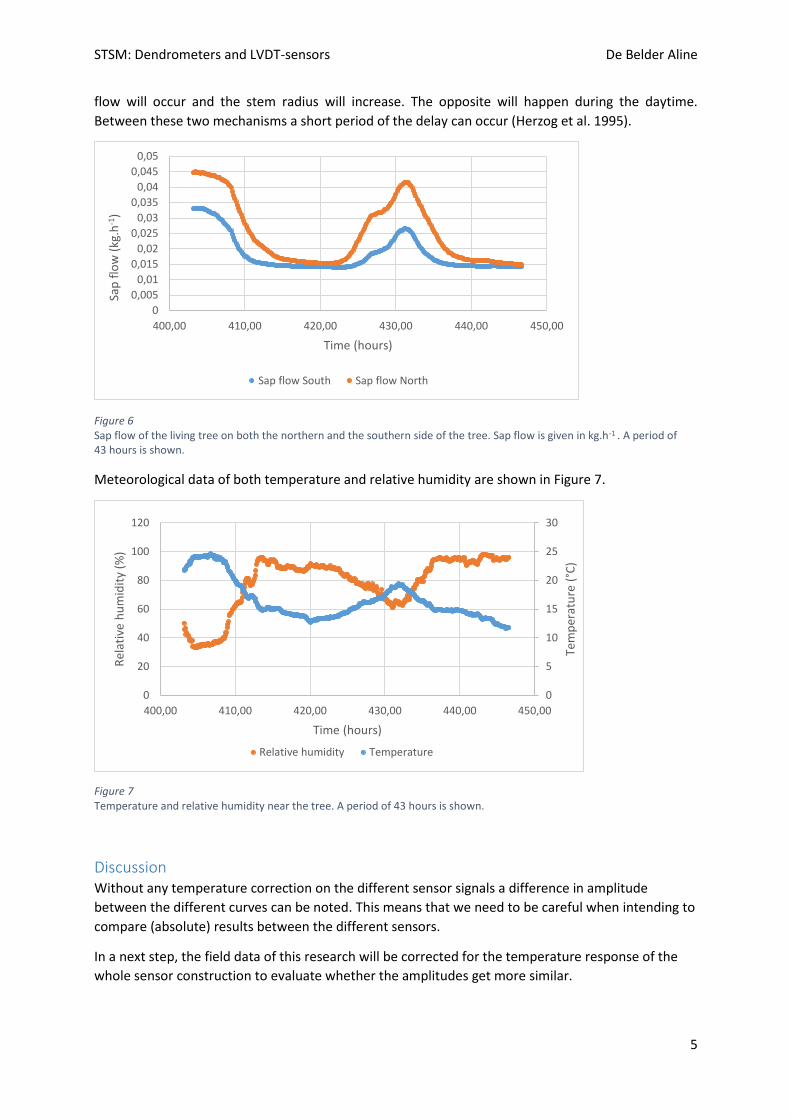
In Figure 5 the results of the dead trunk are shown. Here the curves are more divergent. One should
expect no growth at all in this case, but the outcomes can be explained by the fact that the trunk is
decaying. This a complicated process that is not equally fast at each point of the tree. This may also
clarify why the band dendrometer Austria 2 gives a flat curve and the point sensors more variable
outcomes.
Figure 4 Growth results of the living tree in mm with zero point at 403 hours. No temperature correction has been performed in this graph. Only nine sensors are presented. A period of 43 hours is shown.
Figure 5 Data of the dead trunk in mm with zero point at 403 hours. No temperature correction has been performed in this graph. Four sensors are presented. A period of 43 hours is shown.
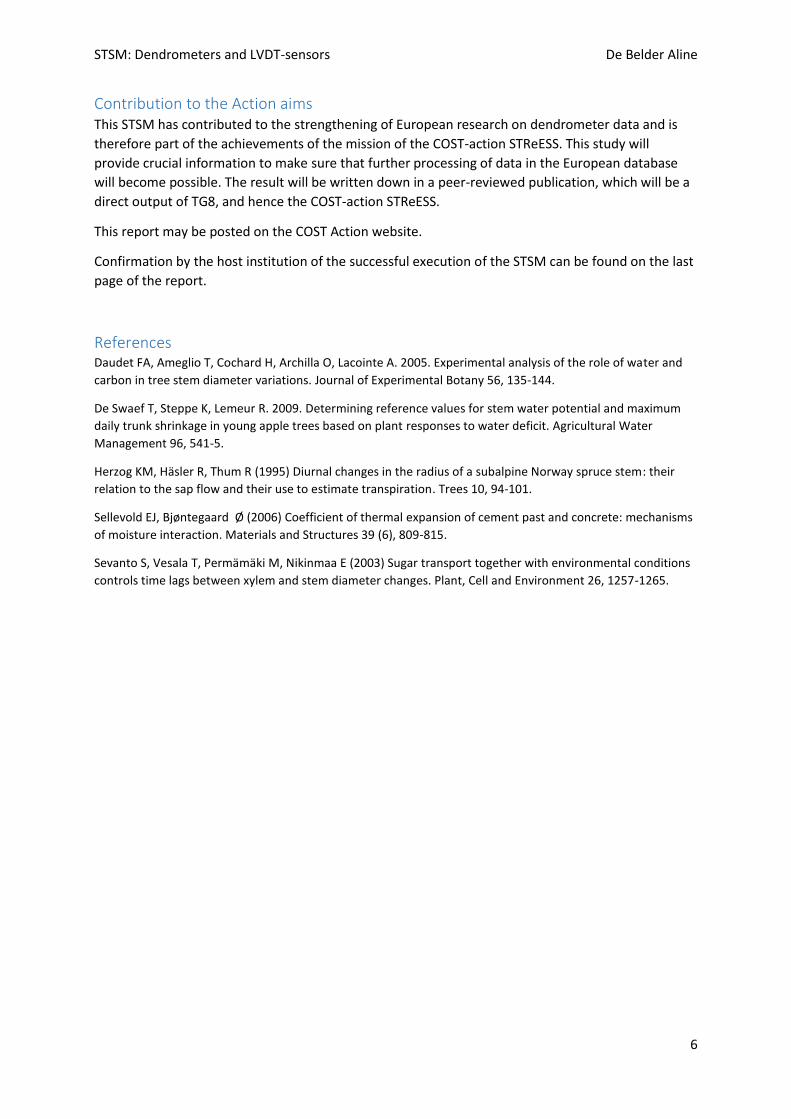
Also sap flow has been measured on the intact tree on both the northern and the southern side with
the sap flow system EMS 51. The results are presented in Figure 6. When there is an increase in sap
flow in the tree this should mean a decrease in growth. During the night the stem will saturate. No
-0,15
-0,1
-0,05
0
0,05
0,1
0,15
0,2
400,00 410,00 420,00 430,00 440,00 450,00
ΔIn
crem
ent
(mm
)
Time (hours)
DG25 3 Vinicio 6 Biondi 10 LVDT 3 LPS DF 5 Monitran DF 2831 Austria 1
-0,02
-0,015
-0,01
-0,005
0
0,005
0,01
0,015
0,02
400,00 410,00 420,00 430,00 440,00 450,00
ΔIn
crem
ent
(mm
)
Time (hours)
Biondi 9 DG25 4 LVDT 2 Austria 2
STSM: Dendrometers and LVDT-sensors De Belder Aline
5
flow will occur and the stem radius will increase. The opposite will happen during the daytime.
Between these two mechanisms a short period of the delay can occur (Herzog et al. 1995).
Figure 6 Sap flow of the living tree on both the northern and the southern side of the tree. Sap flow is given in kg.h-1 . A period of 43 hours is shown.
Meteorological data of both temperature and relative humidity are shown in Figure 7.
Figure 7 Temperature and relative humidity near the tree. A period of 43 hours is shown.
Discussion Without any temperature correction on the different sensor signals a difference in amplitude
between the different curves can be noted. This means that we need to be careful when intending to
compare (absolute) results between the different sensors.
In a next step, the field data of this research will be corrected for the temperature response of the
whole sensor construction to evaluate whether the amplitudes get more similar.
0
0,005
0,01
0,015
0,02
0,025
0,03
0,035
0,04
0,045
0,05
400,00 410,00 420,00 430,00 440,00 450,00
Sap
flo
w (
kg.h
-1)
Time (hours)
Sap flow South Sap flow North
0
5
10
15
20
25
30
0
20
40
60
80
100
120
400,00 410,00 420,00 430,00 440,00 450,00
Tem
per
atu
re (
°C)
Rel
ativ
e h
um
idit
y (%
)
Time (hours)
Relative humidity Temperature
STSM: Dendrometers and LVDT-sensors De Belder Aline
6
Contribution to the Action aims This STSM has contributed to the strengthening of European research on dendrometer data and is
therefore part of the achievements of the mission of the COST-action STReESS. This study will
provide crucial information to make sure that further processing of data in the European database
will become possible. The result will be written down in a peer-reviewed publication, which will be a
direct output of TG8, and hence the COST-action STReESS.
This report may be posted on the COST Action website.
Confirmation by the host institution of the successful execution of the STSM can be found on the last
page of the report.
References Daudet FA, Ameglio T, Cochard H, Archilla O, Lacointe A. 2005. Experimental analysis of the role of water and
carbon in tree stem diameter variations. Journal of Experimental Botany 56, 135-144.
De Swaef T, Steppe K, Lemeur R. 2009. Determining reference values for stem water potential and maximum
daily trunk shrinkage in young apple trees based on plant responses to water deficit. Agricultural Water
Management 96, 541-5.
Herzog KM, Häsler R, Thum R (1995) Diurnal changes in the radius of a subalpine Norway spruce stem: their
relation to the sap flow and their use to estimate transpiration. Trees 10, 94-101.
Sellevold EJ, Bjøntegaard Ø (2006) Coefficient of thermal expansion of cement past and concrete: mechanisms
of moisture interaction. Materials and Structures 39 (6), 809-815.
Sevanto S, Vesala T, Permämäki M, Nikinmaa E (2003) Sugar transport together with environmental conditions
controls time lags between xylem and stem diameter changes. Plant, Cell and Environment 26, 1257-1265.