Embed Size (px)
Citation preview

J. Fluid Mech. (2006), vol. 553, pp. 283–322. c© 2006 Cambridge University Press
doi:10.1017/S0022112006008883 Printed in the United Kingdom
283
Short-wavelength instability and decay of avortex pair in a stratified fluid
By KEIKO K. NOMURA, HIDEAKI TSUTSUI,DANIEL MAHONEY AND JAMES W. ROTTMANDepartment of Mechanical and Aerospace Engineering, University of California,
San Diego, La Jolla, CA 92093-0411, USA
(Received 12 August 2004 and in revised form 31 October 2005)
The evolution of a counter-rotating vortex pair in a stably stratified fluid is investigatedusing direct numerical simulations. The study focuses on the short-wavelength ellipticinstability occurring in this flow and the subsequent decay of the vortices. Dependingon the level of stratification, as characterized by the Froude number which indicatesthe time scale of buoyancy to that of the instability, and the stage of evolution,stratification effects may significantly alter the behaviour of the flow. In the case ofweak to moderate stratification, the elliptic instability develops qualitatively in thesame manner as in unstratified fluid. The primary effect of stratification is to reduce thevortex separation distance which enhances the mutually induced strain. Consequently,the instability has an earlier onset and higher growth rate with increasing stratification.The behaviour is essentially described by linear stability theory for unstratified flowif the varying separation distance is taken into account. On the other hand, the finalbreakdown and decay of the flow may be greatly modified by stratification sincebuoyancy effects eventually emerge after sufficient time has elapsed. The decay isenhanced owing to additional mechanisms not present in unstratified flow. Secondaryvertical vortex structures form between the primary vortices promoting fluid exchangein the transverse direction. Detrainment of fluid from the primary vortices by thegenerated baroclinic torque also contributes to the more rapid breakdown of theflow. In the case of strong stratification, in which the time scale of buoyancy iscomparable to that of the instability, the flow is significantly altered. As a result ofstrong baroclinic torque, the primary vortices are brought together and detrainmentoccurs earlier. The associated reduction in radii of the vortices results in a higheraxial wave mode and a more complex radial structure of the instability. Detrainmentand mixing accelerate their decay. Late time evolution is dominated by the successivegeneration of alternate signed baroclinic torque which results in an oscillation of thetotal flow circulation at the buoyancy frequency.
1. IntroductionA counter-rotating vortex pair is a model flow of both practical and fundamental
significance. Such a flow may occur in the wake of an aircraft and can be hazardousto following aircraft (Spalart 1998). Knowledge of the rate of decay of these vorticeswhich includes the effects of atmospheric conditions such as density stratification andturbulence is critical for air traffic control. More relevant to the present study is thefundamental interest in elementary vortex flows; the knowledge of which is prerequisitefor understanding the interaction and behaviour of vortices in more complex flows.
284 K. K. Nomura, H. Tsutsui, D. Mahoney and J. W. Rottman
For example, in fully developed turbulence, coherent vortex structures are found tooccur at small scales (She, Jackson & Orszag 1991; Jimenez et al. 1993; Nomura &Post 1998) and may play a significant role in the dynamics and statistical propertiesof the flow. In stably stratified turbulence, counter-rotating vortices can generateoverturns with regions of high diapycnal mixing in between them (Diamessis &Nomura 2004). Accordingly, it is of interest to determine what effect stratification hason these vortices.
In an unstratified fluid, a pair of counter-rotating parallel vortices is known toexhibit two types of (three-dimensional) instabilities, a long-wavelength and a short-wavelength instability. The long-wavelength (Crow) instability (Crow 1970) results ina symmetric sinusoidal deformation of the vortex cores. According to Crow’s linearstability theory, the wavelength with the maximum growth rate depends on the vortexdipole aspect ratio, defined in this case as the ratio of the vortex core radius rc tothe initial vortex separation distance b0. For a Rankine vortex with rc/b0 = 0.0985(presumed characteristic of aircraft trailing wing vortices), Crow calculated that thismost amplified wavelength is approximately 8.6b0. According to Han et al. (2000),laboratory experiments, numerical simulations and field measurements have foundthat for aircraft trailing wing vortices, the most amplified wavelength is in the range5b0 to 10b0. The variation about the expected value is attributed to differences inrc/b0 and vorticity distribution in the various studies, and the effects of ambientturbulence in the atmospheric observations. Detailed studies have shown that theCrow instability leads to vortex reconnection and the formation of vortex rings whichmay persist for long times (Leweke & Williamson 1998a, b).
A short-wavelength instability has also been observed in both laboratory experi-ments (Sarpkaya & Suthon 1991; Thomas & Auerbach 1994; Leweke & Williamson1998a) and numerical simulations (Orlandi et al. 1998; Laporte & Corjon 2000).Leweke & Williamson 1998a , here in after referred to as LW98) identified theinstability as a cooperative elliptic instability associated with the ellipticity of thestreamlines in the vortex cores owing to the strain induced by one vortex on the other(Tsai & Widnall 1976; Waleffe 1990). An antisymmetric sinusoidal deformation ofthe cores is observed. Experimental studies report a range of wavelengths 0.6b0 to0.8b0 (Thomas & Auerbach 1994; LW98). A stability analysis of the Lamb–Chaplyginvortex pair performed by Billant, Brancher & Chomaz (1999) showed the existence ofboth symmetric and antisymmetric short-wavelength instabilities, the latter exhibitinghigher growth rates. Sipp & Jacquin (2003) showed that the growth rates depend onthe dipole aspect ratio and the preference for the antisymmetric mode increases withincreasing aspect ratio. They also considered the effects of viscosity which damp theperturbation growth rate and also increase the vortex radii and hence, the aspect ratio(see § 3.3.3). The predicted growth rate is in good agreement with the experimentsof LW98. In the later stages of flow development, the short-wave instability givesrise to secondary transverse vortex structures which lead to rapid vortex decay andtransition to turbulence (LW98; Laporte & Corjon 2000).
The interaction of the Crow and short-wavelength instabilities has also been con-sidered (LW98; Laporte & Corjon 2000). The behaviour of the flow is found todepend on the relative significance of the initial energy of each instability mode(Laporte & Corjon 2000). When the Crow instability dominates, the short-waveinstability is locally enhanced where the deformation of the Crow instability bringsthe vortices close together. This is due to the increase in mutually induced strain asthe separation distance decreases (LW98). Long-term evolution is sensitive to bothinstabilities (Laporte & Corjon 2000).
Short-wavelength instability and decay of a vortex pair 285
The effects of stable density stratification on two-dimensional vortex pairs have beenconsidered in a number of studies (Scorer & Davenport 1970; Crow 1974; Spalart1996). In an unstratified fluid, a two-dimensional counter-rotating vortex pair des-cends, owing to its mutually induced velocity, at a constant speed while maintaininga constant separation distance. Results from these studies indicate that ambientstratification with Fr 1, where Fr = W0/Nb0, and W0 is the initial advection velocityand N is the buoyancy frequency, causes a decrease in separation distance and sub-sequent acceleration of vertical motion. This disagrees with experimentalobservations (Sarpkaya 1983; Delisi & Robins 2000) and three-dimensional simu-lations (Robins & Delisi 1998; Garten et al. 2001) which indicate a simultaneousdecrease in separation distance and deceleration. A two-dimensional analysis byHolzapfel & Gerz (1999) shows early deceleration followed by acceleration. It wassuggested that the acceleration phase is not observed in actual flows since beyond theearly phase, the dynamics are dominated by three-dimensional instabilities. As thevortices descend in a stratified fluid, opposite signed vorticity is generated throughbaroclinic torque (see figure 8). The associated flow drives the vortices towards eachother (Spalart 1996). As shown by Holzapfel & Gerz (1999), the induced velocity fieldof the baroclinic torque also causes a reduced descent speed and detrainment of fluidfrom the vortex pair oval.
The effect of ambient stratification on the Crow instability has been investigatedusing numerical simulations (Robins & Delisi 1998; Garten et al. 2001). Robins &Delisi (1998) find that increasing stratification accelerates linking and ring formation.For strong stratification (Fr 2), the formation of rings is suppressed and instead,‘puffs’ are formed. Garten et al. (2001) find a critical Froude number, Frcr ≈ 2/3, suchthat for Fr > Frcr , the reduced separation distance results in a faster growth of theCrow instability. For Fr< Frcr , the separation distance increases, retarding instabilitygrowth and preventing significant vortex reconnection to occur. The symmetryboundary conditions used in the transverse direction precluded the developmentof any antisymmetric instabilities in their simulations.
An experimental and numerical study by Delisi & Robins (2000) reported thedevelopment of a short-wavelength instability in stably stratified fluid. The circulationReynolds number, ReΓ =Γ/ν where Γ is the vortex circulation and ν is the kinematicviscosity, is 24 000 in the experiments and 1465 in the simulations, and the Frvalues are 0.73 Fr 1.1. The wavelength of the instability is longer (approximatelyb0 to 2b0) than that observed in the unstratified flows (b0). The instability alsoexhibits an earlier onset and a more rapid growth, apparently at the expense of theCrow instability. Results from large-eddy simulations (LES) of vortex pairs in stablystratified fluid at high ReΓ (ReΓ ∼ 107) (Switzer & Proctor 2000) indicate that the levelof ambient stratification and turbulence determine whether the long-wave or short-wave instability dominates. Holzapfel, Gerz & Baumann (2001) performed LES forReΓ = 7400 and report that in the case of a quiescent atmosphere and stratificationlevels 1 Fr 3, the decay of the vortices is controlled by the interaction of theshort-wave instability and baroclinic vorticity. Increasing stratification accelerates theshort-wave instability which they suggest is due to the reduced vortex spacing. Intensevertical vortex structures are induced by baroclinic torque. These structures result inlateral transport and turbulent mixing of the primary vorticity which promotes arapid decay of the vortex pair.
These previous studies indicate that a short-wavelength instability occurs in stablystratified flows and that it can dominate with significant stratification. There is alsoan enhancement of the instability with increasing levels of stratification. However,
286 K. K. Nomura, H. Tsutsui, D. Mahoney and J. W. Rottman
quantitative assessment of the instability is limited. Growth rates have not beenevaluated and the variation in wavelength has not been verified. In general, it has notbeen clearly established whether the observed instability in the stratified flows is thecooperative elliptic instability occurring in unstratified flow (Delisi & Robins 2000).At present, there are no corresponding three-dimensional linear stability analyses forthe stratified flow.
The objective of the present study is to investigate further the short-wavelengthinstability and subsequent decay of a vortex pair in a stably stratified fluid usingdirect numerical simulation. Here, we consider only the short-wave instability byrestricting the development of the Crow instability in the simulations. The Reynoldsnumber ReΓ is fixed at a value comparable to the experiments of LW98 and weconsider a greater range of stratification levels (1 Fr 10, Fr= ∞) than in previousstudies. A more thorough and quantitative assessment of the instability and influenceof stratification is performed. Details of the instability, not provided in previousstudies, are examined and compared with those of unstratified flow. Growth ratesare evaluated. Energy spectra are computed and show the evolution of the primaryinstability, development of harmonics, and late-time behaviour. Detailed analysis iscarried out in order to understand the development of structural features and thephysical mechanisms involved in the decay of the vortex pair.
The results provide a more comprehensive description of the effects of stablestratification in this flow. Depending on Fr, which indicates the time scale ofbuoyancy to that of the instability, and the stage of evolution, stratification effects maysignificantly alter the behaviour of the flow. For weak to moderately stratified flows(∞ >Fr 2), the time scale of buoyancy is relatively large. Thus, at early times whenthe instability develops, stratification results only in a variation of the unstratifiedflow (decreasing separation distance) and the behaviour of the instability is essentiallydescribed by linear theory for unstratified flow with appropriate scaling. On theother hand, the final breakdown and decay of the flow may be greatly modified bystratification since buoyancy effects eventually emerge after sufficient time has elapsed.For strongly stratified flow, Fr ∼ 1, the time scales of the instability and stratificationare comparable and the associated processes interact significantly. We consider Fr ∼ 1to be a limit for our analysis of the short-wavelength instability, corresponding toa transition between convective dominated and stratification dominated flow. Thetwo-dimensional base flow is significantly altered and the instability does not developin the same manner, or to the extent, as in the weak to moderately stratified flows.We note that very strongly stratified flows, Fr < 1, exhibit different behaviour and theelliptic instability is not expected to be realized. These flows are outside the mainscope of this study.
The numerical simulations are described in § 2. Results are presented in § 3: theoverall behaviour of the flows is first described and details of the (linear) instabilityand (nonlinear) late-time decay are then presented and discussed. Conclusions aregiven in § 4.
2. Direct numerical simulationsDirect numerical simulations of a counter-rotating vortex pair in an initially uniform
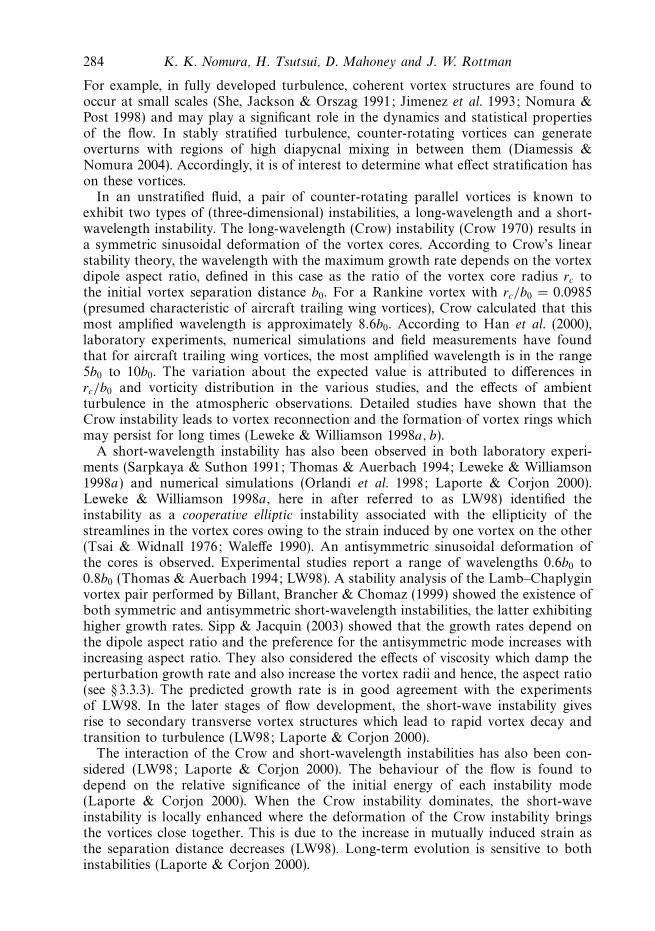
stably stratified fluid are performed for this study. Figure 1 shows the initial flowgeometry and the coordinate system. Here, the spatial coordinates, x, y, z, correspondto the transverse, axial and vertical directions, respectively.
Short-wavelength instability and decay of a vortex pair 287
W0
b0+Γ0 –Γ0
W0
z
z(b)(a)
ρ = ρ(z)
ρ
y
x
Figure 1. Coordinate system and initial conditions for counter-rotating vortex pair anduniform stable stratification. (a) Initial vortices of circulation, ±Γ0, with centres separatedby a distance, b0, moving with downward induced velocity, W0 = Γ0/2πb0. (b) Backgroundlinear density profile ρ(z).
The governing equations with the Boussinesq approximation are:
∇ · v = 0, (2.1)
∂v
∂t+ v · ∇v = − 1
ρ0
∇p + ν∇2v − αT T g, (2.2)
∂T
∂t+ v · ∇(T (z) + T ) = κ∇2T , (2.3)
where ρ0 is a constant reference density, ν is the kinematic viscosity, g = (0, 0, −g) isthe acceleration due to gravity, and κ is the thermal diffusivity. In the above equations,v =(u, v, w) is the instantaneous velocity, p is the deviation of the pressure from itshydrostatic value and T is the deviation of the temperature from the background
temperature, i.e. the instantaneous temperature is T = T0 + T (z) + T (x, y, z, t), whereT (z) is the imposed background temperature. The volumetric expansion coefficient,
αT , is defined as, αT = −(1/ρ0)(∂ρ/∂T ). The corresponding density field is ρ = ρ0 +ρ(z) + ρ(x, y, z, t), where the imposed uniform stable stratification corresponds todρ/dz.
The initial base flow consists of a pair of two-dimensional counter-rotating vortices.The flow is represented by a superposition of two Lamb–Oseen vortices whichwas found to fit well the experimental data of LW98. The corresponding vorticitydistribution is given by,
ωy(x, z, t0) = Ω0 exp
(−((x − x1)
2 + (z − z1)2)
a20
)− Ω0 exp
(−((x − x2)
2 + (z − z2)2)
a20
),
(2.4)
where Ω0 =Γ/πa20 is the peak vorticity, a0 is the initial value of the vortex radius and
(x1, z1) and (x2, z2) are the initial coordinates of the two vortex centroids (z1 = z2).Note that here, the vortex radius is based on the vorticity polar moment and givenby a2 = 〈r2ωy〉/〈ωy〉, where r is the radial distance from a vortex centroid and 〈〉indicates an area average in x − z. The intial separation distance is b0 = |x1 − x2|. Thevortex dipole aspect ratio for all simulations performed here is a0/b0 = 0.177. This iscomparable to the estimated value a0/b0 = 0.15 for the experiments of LW98. We also
288 K. K. Nomura, H. Tsutsui, D. Mahoney and J. W. Rottman
note that a0/b0 = 0.177 corresponds to rc/b0 = 0.2, where rc is defined as the radiusfrom the centre of one vortex to where the tangential velocity is maximum (rc =1.12a
for a Lamb–Oseen vortex).Superimposed on the base vortex flow, (2.4), is a three-dimensional random pertur-
bation velocity field. The amplitude of the perturbations does not exceed 0.001Wmax
and is comparable to that used in previous simulations (Laporte & Corjon 2000).The corresponding vorticity perturbations are approximately 0.2 % of Ω0. The initialtemperature field corresponds to a uniform gradient (dT /dz > 0) with no initialperturbations. We note that additional simulations were performed in which thevelocity perturbation level was increased by a factor of 5. Results showed no significantchange in growth rates of the linear instability. Use of different random fields, e.g.different random number generator seed, yielded variations in growth rate of up to7%.
The relevant non-dimensional parameters are now defined. The characteristic lengthscale is the initial vortex separation, b0. The geometry is characterized by the dipoleaspect ratio, a0/b0. The velocity scale is the initial advection velocity of the vortices,W0 = Γ0/2πb0, where Γ0 is the initial vortex circulation (figure 1). The convective timescale of the vortex flow is therefore b0/W0 = 2πb0
2/Γ0 which, as will be shown in§ 3.3.3, is the time scale of the instability. The circulation Reynolds number is givenby,
ReΓ =Γ0
ν=
2πb0W0
ν. (2.5)
The Froude number is defined as,
Fr =W0
Nb0
, (2.6)
where N is the buoyancy frequency,
N2 = − g
ρ0
dρ
dz= αT g
dT
dz. (2.7)
Thus, Fr can be considered as the ratio of the buoyancy time scale to the instabilitytime scale. The Prandtl number is Pr = ν/κ .
For all simulations performed, the Reynolds number of the vortex pair is ReΓ =2400. This is comparable to the experiments of LW98 in which ReΓ ranges from2400 to 2750. The Prandtl number is Pr =0.7. The Froude numbers considered areFr = 1, 2, 5 and 10 which cover a range of conditions corresponding to strong (Fr = 1),moderate (Fr = 2) and weak (Fr = 5, 10) stratification. In addition, Fr = ∞ correspond-ing to an unstratified flow is considered. Since the values of ReΓ and a0/b0 are com-parable to those of LW98 and also to the simulations of Laporte & Corjon (2000)who use ReΓ =2400 and rc/b0 = 0.2, the unstratified flow serves as a validation forthe simulations in addition to providing a reference flow from which to study theeffects of stratification.
As indicated earlier, our study is directed at the fundamental flow problem andnot the practical application. We note that the simulated vortices do not adequatelyrepresent those in typical aircraft wakes which are characterized by much smalleraspect ratios, of order 0.01 (Delisi et al. 2003), and much higher ReΓ . Simulations oftight core vortices would require very high resolution and/or appropriate subgrid-scalemodelling (Holzapfel 2004). However, it has been reported that LES results of highReΓ (∼107) show higher growth rates, but otherwise similar dynamics to the low ReΓ

Short-wavelength instability and decay of a vortex pair 289
flows (Laporte & Leweke 2002). With regard to Fr, the range of values we consider isrepresentative of stratification levels in the lower atmosphere (Switzer & Proctor 2000).
The numerical solution procedure is based on a second-order finite-differencescheme with second-order Adams–Bashforth time integration (Gerz, Schumann &Elghobashi 1989). The dimensions of the computational domain are Lx = 6b0, Ly =6b0, Lz = 18b0, with resolution of 192 × 192 × 576 (uniform) grid points, respectively.This allows approximately 13 grid points across the core of each vortex. Preliminarystudies of simulations with differing numbers of grid points showed a reasonably grids-independent solution for this resolution. In addition, energy spectra (see figure 15)show no energy accumulation at the highest wavenumbers further demonstratingadequate resolution.
Periodic boundary conditions are employed in all three directions. The transverselength, Lx = 6b0, is sufficient to minimize the effects of neighbouring vortices throughthe linear instability phase in all flows. Based on linear internal wave theory (see § 3.2),we expect the generated waves to reach the boundary at the end of the linear phaseonly for the Fr = 1 case. Still further time would be required for the waves to interactwith the neighbouring vortices and thus we do not expect significant interaction forthe extent of the simulations, except perhaps in the late stages of the Fr = 1 flow(§ 3.4). Additional test simulations using Lx =12b0 showed no significant change inwavelength or growth rate (values of growth rate σ differed by less than 0.1 %). Thevertical length, Lz = 18b0, is extended to accommodate the downward descent of thevortices and associated wake, and to prevent the vortices and wake from encounteringimage vortices and their wakes.
The axial length, Ly =6b0, is selected to minimize the Crow instability. UsingCrow’s linear stability theory (neglecting the differences between Rankine and Oseenvortices), we have computed the most amplified wavelength for rc/b0 = 0.2 to be7.4b0. However, this theory predicts that there will be non-zero growth rates forwavelengths greater than about 4.8b0. Since the axial length of our computationaldomain is 6b0, we have excluded the instability with maximum growth rate, but wemight expect to see some slow growth of a Crow instability with a wavelength nearthe axial length of our computational domain. In our simulations, we observed someaxial variations with a scale larger than predicted for the short-wave instability, butthese variations showed none of the properties characteristic of the Crow instability.Results from simulations using different axial lengths indicate Ly =6b0 to be a goodcompromise in minimizing the development of the Crow instability while retaininga sufficient number of short-wave periods for evaluating statistics and spectra (see§ 3.3.2). Additional simulations suggest that the observed axial and vortex-to-vortexvariability in the instability amplitudes are due to sensitivity of the flow to the initialperturbation field. For the case of Fr= 1, some competition between neighbouringwave modes is exhibited (§ 3.3.2).
3. ResultsIn the results presented, the non-dimensional time is t∗ = tW0/b0 and non-
dimensional spatial coordinates are X = x/b0, Y = y/b0 and Z = z/b0.
3.1. Flow visualizations
Figures 2–5 show the development of the three-dimensional vortex structures in theunstratified (Fr = ∞) and stratified (Fr= 5, 2, 1) flows. The structures are visualized byisosurfaces of the second invariant of the velocity gradient tensor, II =(ω2/2 − S2)/2,

290 K. K. Nomura, H. Tsutsui, D. Mahoney and J. W. Rottman
(a)
(c)
(e) (f )
(d )
(b)
Figure 2. Three-dimensional visualizations of isosurfaces of the second invariant of velocitygradient tensor, II∗ for Fr = ∞ at (a) t∗ = 10.5, (b) 12.0, (c) 13.5, (d) 15.0, (e) 16.5, (f ) 18.0.(a) II∗ = 40, (b–f ) 30.
where ω is the vorticity vector and S is the strain rate tensor (Nomura & Post 1998).
Here, it is non-dimensionalized as, II∗ = II/(ω20/4), where ω0 is the initial vorticity.
High-amplitude positive values of II thus correspond to strong rotation-dominatedregions which effectively characterize the dominant vortex structures in the flow(Diamessis & Nomura 2000).
In the unstratified flow (figure 2), following an initial flow adjustment period (see§ 3.2), the short-wave instability is initiated. A dominant wavelength is selected andamplified deforming the vortices in a sinusoidal manner that is antisymmetric withrespect to the dividing plane between the vortices (figure 2a, b; t∗ 12.0). As the flowdevelops further, the geometry becomes more complex. Secondary structures develop
Short-wavelength instability and decay of a vortex pair 291
(a) (b)
(c) (d)
(e) ( f )
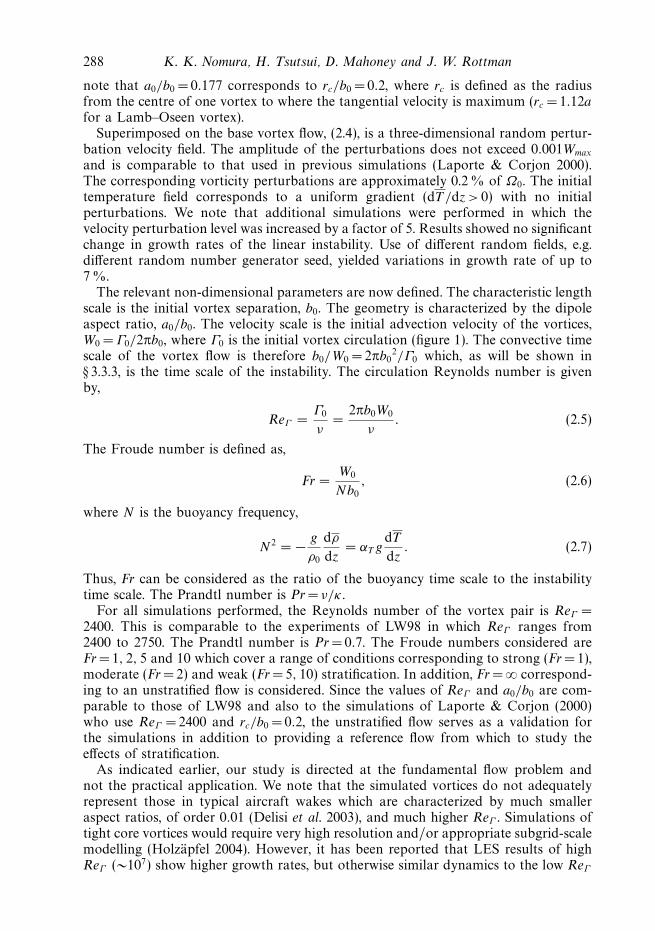
Figure 3. Three-dimensional visualizations of isosurfaces of the second invariant of velocitygradient tensor, II∗ for Fr =5 at (a) t∗ = 8.25, (b) 9.0, (c) 9.75, (d) 10.5, (e) 11.25, (f ) 12.0.(a) II∗ = 55, (b–e) 50, (f ) 45.
in the transverse direction (figure 2d, e; t∗ 15.0) and eventually dominate the flowas the primary vortices breakdown and weaken (figure 2f ).
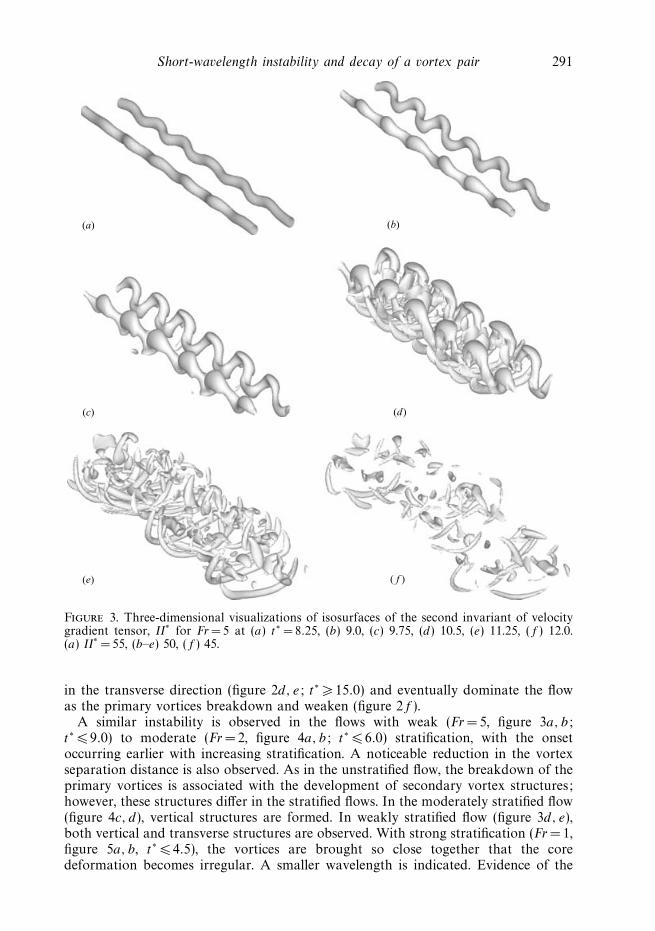
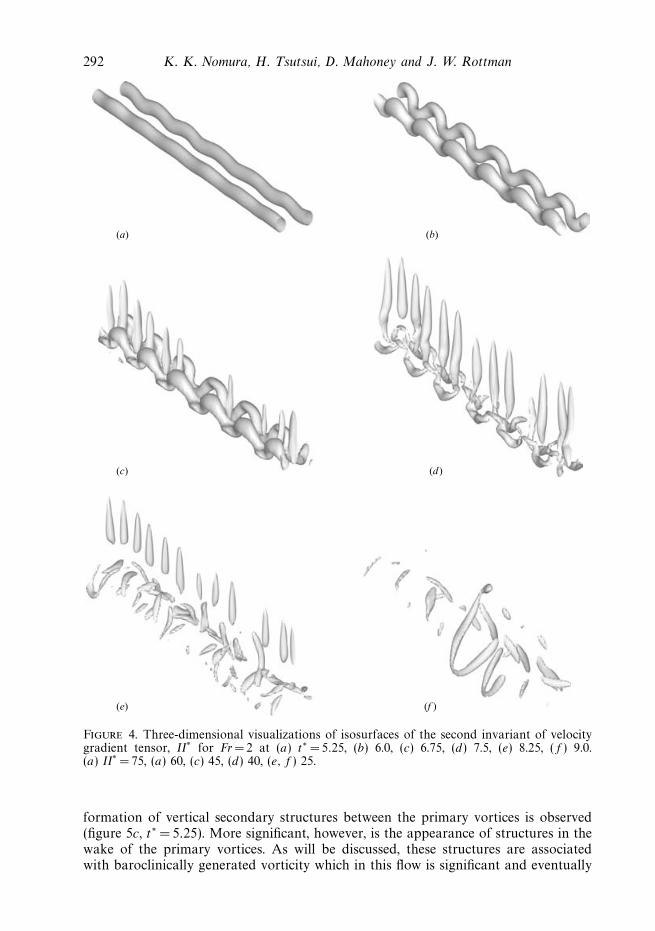
A similar instability is observed in the flows with weak (Fr = 5, figure 3a, b;t∗ 9.0) to moderate (Fr =2, figure 4a, b; t∗ 6.0) stratification, with the onsetoccurring earlier with increasing stratification. A noticeable reduction in the vortexseparation distance is also observed. As in the unstratified flow, the breakdown of theprimary vortices is associated with the development of secondary vortex structures;however, these structures differ in the stratified flows. In the moderately stratified flow(figure 4c, d), vertical structures are formed. In weakly stratified flow (figure 3d, e),both vertical and transverse structures are observed. With strong stratification (Fr = 1,figure 5a, b, t∗ 4.5), the vortices are brought so close together that the coredeformation becomes irregular. A smaller wavelength is indicated. Evidence of the
292 K. K. Nomura, H. Tsutsui, D. Mahoney and J. W. Rottman
(a)
(c)
(e) (f )
(d)
(b)
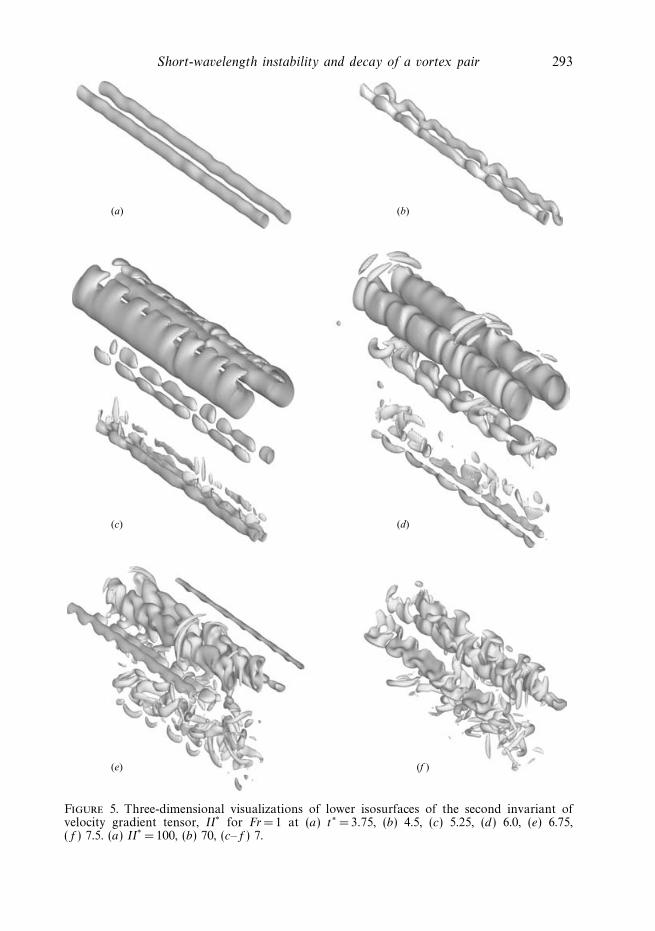
Figure 4. Three-dimensional visualizations of isosurfaces of the second invariant of velocitygradient tensor, II∗ for Fr = 2 at (a) t∗ = 5.25, (b) 6.0, (c) 6.75, (d) 7.5, (e) 8.25, (f ) 9.0.(a) II∗ = 75, (a) 60, (c) 45, (d) 40, (e, f ) 25.
formation of vertical secondary structures between the primary vortices is observed(figure 5c, t∗ = 5.25). More significant, however, is the appearance of structures in thewake of the primary vortices. As will be discussed, these structures are associatedwith baroclinically generated vorticity which in this flow is significant and eventually
Short-wavelength instability and decay of a vortex pair 293
(a)
(c)
(e) (f )
(d )
(b)
(c) (d)
Figure 5. Three-dimensional visualizations of lower isosurfaces of the second invariant ofvelocity gradient tensor, II∗ for Fr = 1 at (a) t∗ = 3.75, (b) 4.5, (c) 5.25, (d) 6.0, (e) 6.75,(f ) 7.5. (a) II∗ = 100, (b) 70, (c–f ) 7.

294 K. K. Nomura, H. Tsutsui, D. Mahoney and J. W. Rottman
t*100 5 15 20
100
10–1
10–2
10–3
Γx—Γy0
Figure 6. Time development of normalized average transverse vorticity magnitudes, Γx/Γy,0.Symbols: , Fr = ∞; , 10; , 5; , 2; , 1.
dominates the flow (figure 5f , t∗ = 7.5). Note the relatively low level of II associatedwith these regions, which is consistent with the sheet-like geometry of these structures.
Details of the observed flow structure and associated dynamics are presented in§ § 3.3 and 3.4. We first consider basic aspects of the overall evolution of the flow.
3.2. General behaviour
Since the initial flow is dominated by axial vorticity, ωy , the development of theoff-axial components of ω provides an indicator of the instability and change fromtwo-dimensional to three-dimensional flow. Following Laporte & Corjon (2000), aglobal measure of the transverse vorticity, ωx , is given by,
Γx =1
Lx
∫Lx
(∫Ly
∫Lz
|ωx(x, y, z)| dy dz
)dx. (3.1)
Figure 6 shows the time development of Γx (normalized with the initial value of theaxial vorticity magnitude Γy,0). Γx characterizes the evolution of the flow which canbe considered to consist of three phases: adjustment, linear and nonlinear (Laporte& Corjon 2000). The adjustment phase (0< t∗ 3.4 for Fr = ∞) corresponds to theinitial decrease in Γx . During this phase, the flow adjusts from its initial conditions asit develops under the Navier–Stokes equations. The vortices adapt to the presence ofeach other and owing to the induced velocity, they propagate downwards and developan elliptic shape due to the mutually induced strain. The perturbation field decaysowing to viscous diffusion and the flow remains two-dimensional. In the linear phase(3.4 t∗ 13.5 for Fr= ∞), Γx increases, although Γx Γy . This phase correspondsto the development of the three-dimensional short-wave instability with growth of theperturbation amplitudes. The linear phase is limited to times in which the perturbationamplitudes remain small in comparison with the base flow and the core displacementexhibits an exponential growth as indicated by linear stability theory (see § 3.3.2).
Short-wavelength instability and decay of a vortex pair 295
t* Nt
1.0
(a) (b)
0.5
0
–0.5
–1.0
–1.5
1.0
0.5
0
–0.5
–1.0
–1.50 5 10 15 20 0 5 10 15 20
Γ—Γ0
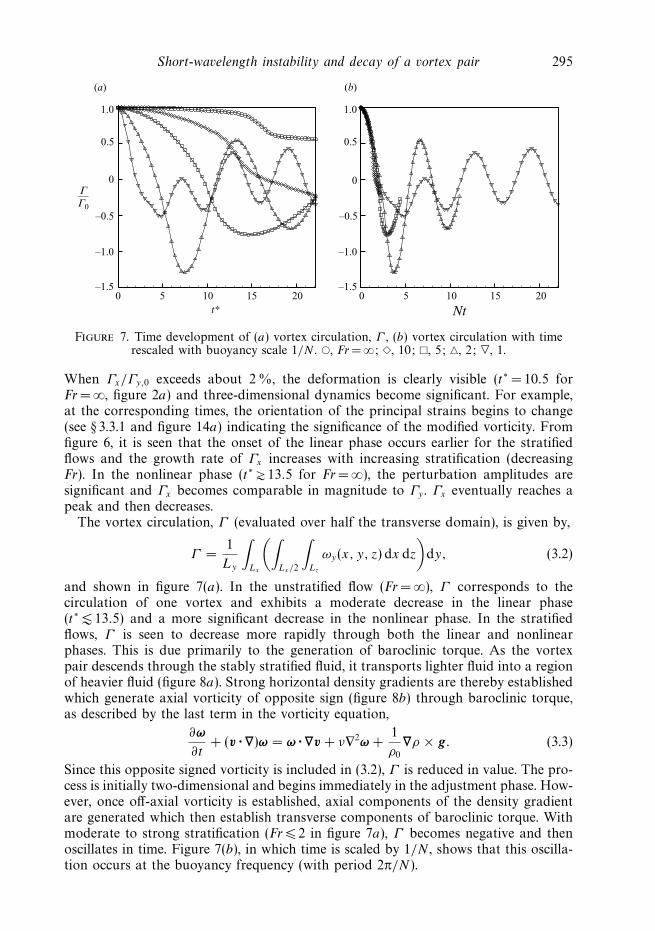
Figure 7. Time development of (a) vortex circulation, Γ , (b) vortex circulation with timerescaled with buoyancy scale 1/N . , Fr = ∞; , 10; , 5; , 2; , 1.
When Γx/Γy,0 exceeds about 2 %, the deformation is clearly visible (t∗ = 10.5 forFr = ∞, figure 2a) and three-dimensional dynamics become significant. For example,at the corresponding times, the orientation of the principal strains begins to change(see § 3.3.1 and figure 14a) indicating the significance of the modified vorticity. Fromfigure 6, it is seen that the onset of the linear phase occurs earlier for the stratifiedflows and the growth rate of Γx increases with increasing stratification (decreasingFr). In the nonlinear phase (t∗ 13.5 for Fr= ∞), the perturbation amplitudes aresignificant and Γx becomes comparable in magnitude to Γy . Γx eventually reaches apeak and then decreases.
The vortex circulation, Γ (evaluated over half the transverse domain), is given by,
Γ =1
Ly
∫Lx
(∫Lx/2
∫Lz
ωy(x, y, z) dx dz
)dy, (3.2)
and shown in figure 7(a). In the unstratified flow (Fr = ∞), Γ corresponds to thecirculation of one vortex and exhibits a moderate decrease in the linear phase(t∗ 13.5) and a more significant decrease in the nonlinear phase. In the stratifiedflows, Γ is seen to decrease more rapidly through both the linear and nonlinearphases. This is due primarily to the generation of baroclinic torque. As the vortexpair descends through the stably stratified fluid, it transports lighter fluid into a regionof heavier fluid (figure 8a). Strong horizontal density gradients are thereby establishedwhich generate axial vorticity of opposite sign (figure 8b) through baroclinic torque,as described by the last term in the vorticity equation,
∂ω
∂t+ (v · ∇)ω = ω · ∇v + ν∇2ω +
1
ρ0
∇ρ × g. (3.3)
Since this opposite signed vorticity is included in (3.2), Γ is reduced in value. The pro-cess is initially two-dimensional and begins immediately in the adjustment phase. How-ever, once off-axial vorticity is established, axial components of the density gradientare generated which then establish transverse components of baroclinic torque. Withmoderate to strong stratification (Fr 2 in figure 7a), Γ becomes negative and thenoscillates in time. Figure 7(b), in which time is scaled by 1/N , shows that this oscilla-tion occurs at the buoyancy frequency (with period 2π/N).

296 K. K. Nomura, H. Tsutsui, D. Mahoney and J. W. Rottman
7.2
7.8
8.4z
9.0
10.8
(a) (b)
7.2
7.8
8.4
9.0
10.8
1.2 1.8 2.4 3.0x x
3.6 4.2 4.8 1.2 1.8 2.4 3.0 3.6 4.2 4.8
Figure 8. Contours in (x, y)-plane for Fr = 2 at t∗ = 2.25 of (a) density, ρ and (b) axialvorticity, ωy (solid: ωy > 0, dashed: ωy < 0) showing generation of opposite signed vorticityby baroclinic torque (b) due to horizontal density gradients (a).
6(a) (b)
4
2
0
–2
–4
–6–6 –4 –2 0 2 4 6
6
4
2
0
–2
–4
–6–6 –4 –2 0 2 4 6
z—b0
x/b0 x/b0
1.0
0.8
0.6
0.4
0.2
0
–0.2
–0.4
–0.6
–0.8
–1.0
1.0
0.8
0.6
0.4
0.2
0
–0.2
–0.4
–0.6
–0.8
–1.0
Figure 9. The non-dimensional temperature perturbation field showing internal wavegeneration and propagation from the vortex pair. The wave amplitudes have been normalizedto have a maximum value of unity in each plot. (a) Linear analysis for Nt = 10, (b) simulation(extended domain) result for Fr = 1 at Nt= 10.
As discussed in Meng & Rottman (1988), a counter-rotating vortex pair generatesan internal wave field that resembles an approximately two-dimensional fan of raysemanating from the region occupied by the vortex pair. This is illustrated in figure 9(a)which shows the perturbation temperature (T ) field computed using linear theory(Meng & Rottman 1988). Figure 9(b) shows T in an (x, z)-plane from our nonlinearsimulations for Fr = 1 at t∗ = Nt = 10 (t∗ = FrNt). Although linear theory, in whichthe amplitudes of the waves are proportional to Fr, is strictly valid for Fr 1, thetwo plots show similar qualitative features in the region away from the origin wherethe flow is dominated by the vortices.
We can use linear internal wave theory to estimate the time it takes for the internalwaves generated by the vortex pair to reach the boundaries of the computationaldomain. As described in Meng & Rottman (1988), the radial position r with respect

Short-wavelength instability and decay of a vortex pair 297
t*
Γ—Γ0
5 10 15 200
0.1
0.2
0.3
0.4
0.5
0.6
0.7
0.8
0.9
1.0
Figure 10. Time development of conditional vortex circulation, 〈Γ 〉ωy+(conditioned by
ωy > 0). , Fr = ∞; , 10; , 5; , 2; , 1.
to the origin and angular position θ with respect to the x-axis of the internal wavewith wavenumber magnitude K and wavenumber angle φ is given by
r
b0
=Nt
Kb0
|cos θ |. (3.4)
Since the wavenumber vector is perpendicular to the group velocity vector for internalwaves, θ = φ + π/2. The dominant waves generated by the vortex pair have Kb0 ≈ 1,so the maximum radial distance travelled by these waves from the origin at time t
is r/b0 ≈ Nt. Based on this estimate, we expect the dominant internal waves to reachthe boundaries of the computational domain at t∗ =FrLx/(2b0). For Lx = 6b0, thisgives t∗ ≈ 3, 6, 15 and 30 for Fr= 1, 2, 5 and 10, respectively. Thus, as discussed in § 2,we do not expect significant contamination by waves entering through the periodicboundaries during the linear phase of these flows. There may, however, be somecontamination during the nonlinear phase of the strongly stratified (Fr ∼ 1) flows.
Figure 10 shows a conditional vortex circulation 〈Γ 〉ωy+(conditioned on ωy > 0)
which effectively excludes the baroclinic vorticity and provides a measure of thecirculation of the primary vortex, at early times in the flow. A more moderate reductionduring the linear phase followed by an enhanced decay during the nonlinear phaseis revealed. The rate of decay increases with increasing stratification. At late times,this simple conditional averaging is no longer meaningful owing to the complexityof the flow. As discussed in § 3.4, during the late stages of strongly stratified flows,there is successive generation of opposite signed baroclinic torque (for Fr = 1, thisoccurs for t∗ > 5). Secondary baroclinic torque will have the same sign as the primaryvortices and therefore be retained in 〈Γ 〉ωy+
, thus rendering the conditional averagingineffective.
Figure 11 shows the time development of the vortex pair descent height, H . Since H
is defined with respect to the core centre (vorticity maximum), it can be evaluated onlyduring the linear phase when the primary vortices are identifiable. During the earlystages of development, the unstratified and weakly stratified flows exhibit a nearlyconstant descent speed. In the moderate to strongly stratified flows, the influence ofstratification is observed. In the Fr= 1 flow, the descent is arrested for a period oftime before it resumes. In general, the duration of the linear phase decreases with
298 K. K. Nomura, H. Tsutsui, D. Mahoney and J. W. Rottman
0 5 10 15–14
–12
–10
–8
–6
–4
–2
0
t*
H—b0
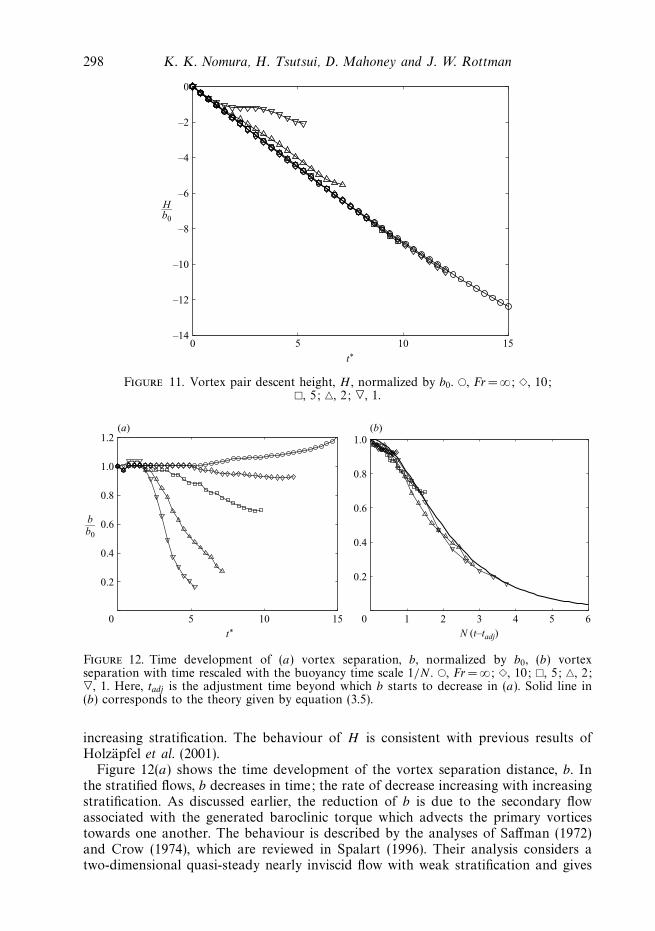
Figure 11. Vortex pair descent height, H , normalized by b0. , Fr = ∞; , 10;, 5; , 2; , 1.
5 10 150
0.2
0.4
0.6
0.8
1.0
1.2
b—b0
t*
(a)
1 2 3 4 5 60
0.2
0.4
0.6
0.8
1.0
N (t–tadj)
(b)
Figure 12. Time development of (a) vortex separation, b, normalized by b0, (b) vortexseparation with time rescaled with the buoyancy time scale 1/N . , Fr = ∞; , 10; , 5; , 2;, 1. Here, tadj is the adjustment time beyond which b starts to decrease in (a). Solid line in(b) corresponds to the theory given by equation (3.5).
increasing stratification. The behaviour of H is consistent with previous results ofHolzapfel et al. (2001).
Figure 12(a) shows the time development of the vortex separation distance, b. Inthe stratified flows, b decreases in time; the rate of decrease increasing with increasingstratification. As discussed earlier, the reduction of b is due to the secondary flowassociated with the generated baroclinic torque which advects the primary vorticestowards one another. The behaviour is described by the analyses of Saffman (1972)and Crow (1974), which are reviewed in Spalart (1996). Their analysis considers atwo-dimensional quasi-steady nearly inviscid flow with weak stratification and gives
Short-wavelength instability and decay of a vortex pair 299
the following result for b(t):
b(t) =b0
cosh((A/2π)1/2 Nt
) , (3.5)
where A= 2.85 (Saffman 1972). This solution is shown in figure 12(b) along with thesimulation results which are scaled by N(t − tadj). Here, tadj is the adjustment timebeyond which b starts to decrease (figure 12a) and b is rescaled with the separationdistance at the corresponding time. As figure 12(b) shows, the simulation results arein reasonable agreement with the theory, indicating that the behaviour of b(t) isprimarily controlled by two-dimensional dynamics.
We note that in strongly stratified flow (Fr ∼ 1), the effects of baroclinic torquesignificantly alter the flow early in time, i.e. during the linear phase. The reductionin separation distance b is so significant that the primary vortices are broughttogether (see figure 26b, t∗ 4.5). Mutual diffusion of opposite sign vorticity reducestheir strength (as observed in figure 10) and size. In addition, as also indicated infigure 26(b), baroclinic torque causes detrainment of the primary vortices furtherreducing their size.
Details of the linear and nonlinear phases are presented in the following sections.
3.3. Linear phase
3.3.1. Geometric features of short-wave instability
As discussed in LW98, the three-dimensional short-wave instability is an ellipticinstability which evolves in the vortex pair in a coupled ‘cooperative’ manner. Closeexamination of the vortices reveals the distinct geometry associated with this instabilitywhich is also exhibited in the weak to moderately stratified flows.
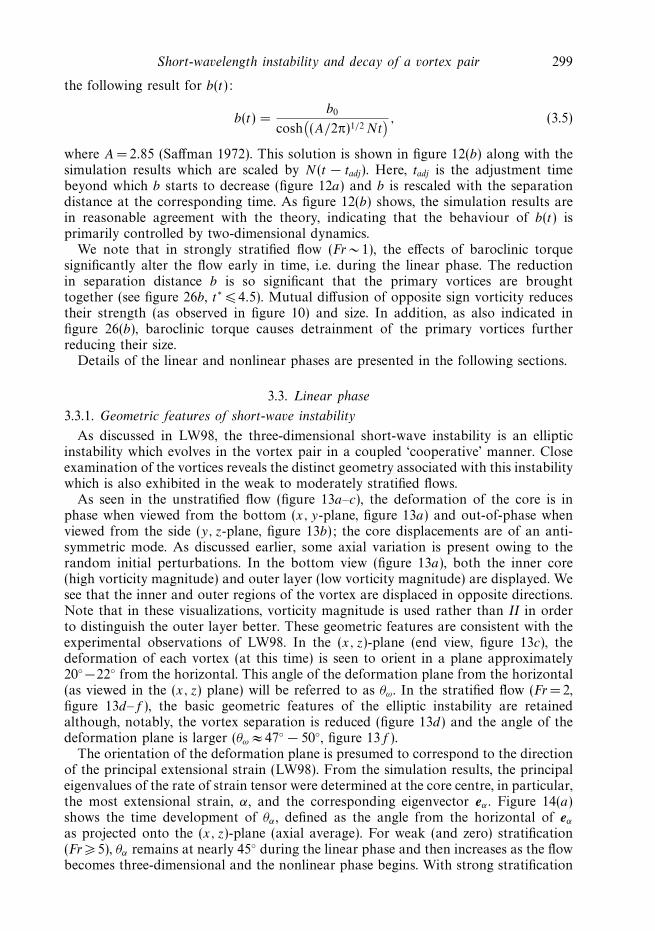
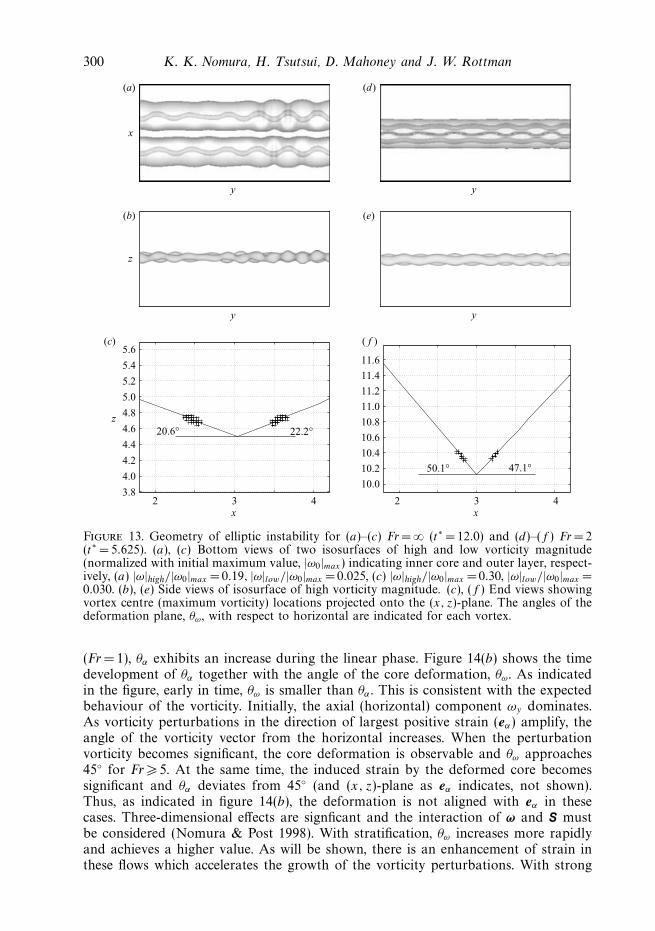
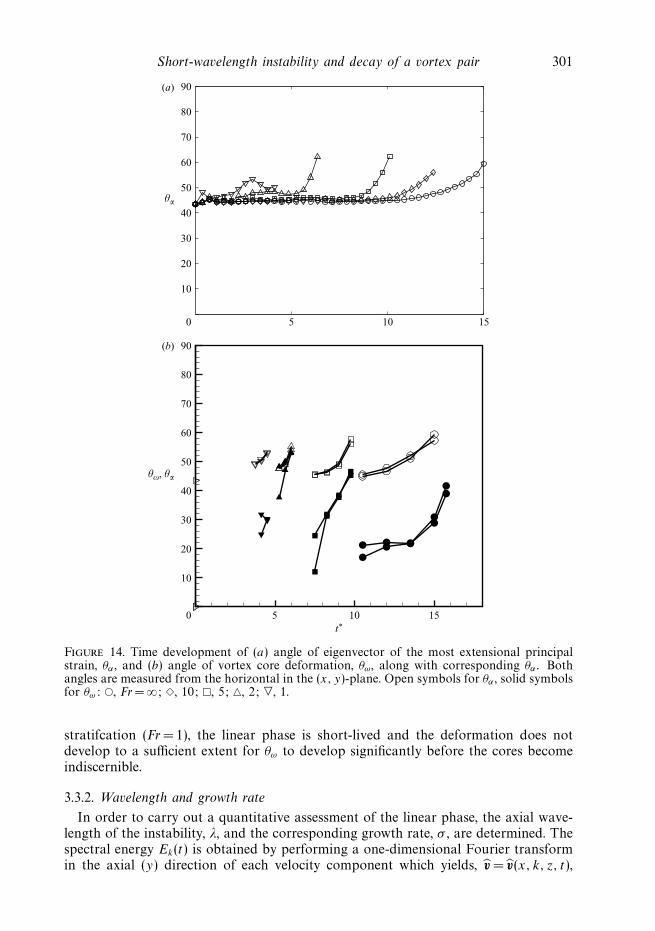
As seen in the unstratified flow (figure 13a–c), the deformation of the core is inphase when viewed from the bottom (x, y-plane, figure 13a) and out-of-phase whenviewed from the side (y, z-plane, figure 13b); the core displacements are of an anti-symmetric mode. As discussed earlier, some axial variation is present owing to therandom initial perturbations. In the bottom view (figure 13a), both the inner core(high vorticity magnitude) and outer layer (low vorticity magnitude) are displayed. Wesee that the inner and outer regions of the vortex are displaced in opposite directions.Note that in these visualizations, vorticity magnitude is used rather than II in orderto distinguish the outer layer better. These geometric features are consistent with theexperimental observations of LW98. In the (x, z)-plane (end view, figure 13c), thedeformation of each vortex (at this time) is seen to orient in a plane approximately20 −22 from the horizontal. This angle of the deformation plane from the horizontal(as viewed in the (x, z) plane) will be referred to as θω. In the stratified flow (Fr = 2,figure 13d–f ), the basic geometric features of the elliptic instability are retainedalthough, notably, the vortex separation is reduced (figure 13d) and the angle of thedeformation plane is larger (θω ≈ 47 − 50, figure 13f ).
The orientation of the deformation plane is presumed to correspond to the directionof the principal extensional strain (LW98). From the simulation results, the principaleigenvalues of the rate of strain tensor were determined at the core centre, in particular,the most extensional strain, α, and the corresponding eigenvector eα . Figure 14(a)shows the time development of θα , defined as the angle from the horizontal of eα
as projected onto the (x, z)-plane (axial average). For weak (and zero) stratification(Fr 5), θα remains at nearly 45 during the linear phase and then increases as the flowbecomes three-dimensional and the nonlinear phase begins. With strong stratification
300 K. K. Nomura, H. Tsutsui, D. Mahoney and J. W. Rottman
y
z
y
2 3 43.8
4.0
4.2
4.4
4.6
4.8
5.0
5.2
5.4
5.6
x2 3 4
x
z20.6° 22.2°
10.0
10.2
10.4
10.6
10.8
11.0
11.2
11.4
11.6
50.1° 47.1°
y
x
y
(a) (d)
(b) (e)
(c) ( f )
Figure 13. Geometry of elliptic instability for (a)–(c) Fr = ∞ (t∗ = 12.0) and (d)–(f ) Fr = 2(t∗ = 5.625). (a), (c) Bottom views of two isosurfaces of high and low vorticity magnitude(normalized with initial maximum value, |ω0|max) indicating inner core and outer layer, respect-ively, (a) |ω|high/|ω0|max = 0.19, |ω|low/|ω0|max = 0.025, (c) |ω|high/|ω0|max =0.30, |ω|low/|ω0|max =0.030. (b), (e) Side views of isosurface of high vorticity magnitude. (c), (f ) End views showingvortex centre (maximum vorticity) locations projected onto the (x, z)-plane. The angles of thedeformation plane, θω , with respect to horizontal are indicated for each vortex.
(Fr = 1), θα exhibits an increase during the linear phase. Figure 14(b) shows the timedevelopment of θα together with the angle of the core deformation, θω. As indicatedin the figure, early in time, θω is smaller than θα . This is consistent with the expectedbehaviour of the vorticity. Initially, the axial (horizontal) component ωy dominates.As vorticity perturbations in the direction of largest positive strain (eα) amplify, theangle of the vorticity vector from the horizontal increases. When the perturbationvorticity becomes significant, the core deformation is observable and θω approaches45 for Fr 5. At the same time, the induced strain by the deformed core becomessignificant and θα deviates from 45 (and (x, z)-plane as eα indicates, not shown).Thus, as indicated in figure 14(b), the deformation is not aligned with eα in thesecases. Three-dimensional effects are signficant and the interaction of ω and S mustbe considered (Nomura & Post 1998). With stratification, θω increases more rapidlyand achieves a higher value. As will be shown, there is an enhancement of strain inthese flows which accelerates the growth of the vorticity perturbations. With strong
Short-wavelength instability and decay of a vortex pair 301
5 10 150
10
20
30
40
50
60
70
80
90
θα
(a)
t*
θω, θα
5 10 150
10
20
30
40
50
60
70
80
90(b)
Figure 14. Time development of (a) angle of eigenvector of the most extensional principalstrain, θα , and (b) angle of vortex core deformation, θω , along with corresponding θα . Bothangles are measured from the horizontal in the (x, y)-plane. Open symbols for θα , solid symbolsfor θω: , Fr = ∞; , 10; , 5; , 2; , 1.
stratifcation (Fr = 1), the linear phase is short-lived and the deformation does notdevelop to a sufficient extent for θω to develop significantly before the cores becomeindiscernible.
3.3.2. Wavelength and growth rate
In order to carry out a quantitative assessment of the linear phase, the axial wave-length of the instability, λ, and the corresponding growth rate, σ , are determined. Thespectral energy Ek(t) is obtained by performing a one-dimensional Fourier transformin the axial (y) direction of each velocity component which yields, v = v(x, k, z, t),

302 K. K. Nomura, H. Tsutsui, D. Mahoney and J. W. Rottman
100 101 102
10–15
10–10
10–5
100(a)
kb0
Ek
100 101 102
10–15
10–10
10–5
100(b)
Ek
Figure 15(a–d). For caption see facing page.
and then evaluating the average of v · v∗in the transverse (x, z)-plane,
Ek(t) =1
LxLz
∫x
∫z
v · v∗dx dz, (3.6)
where v∗
denotes the complex conjugate. Since the base flow is two-dimensional inthe (x, z)-plane, Ek(t) for k > 0 corresponds to the perturbation kinetic energy. Thewavenumber, k =2π/λ, is non-dimensionalized by b0 and related to the Fourier mode
Short-wavelength instability and decay of a vortex pair 303
100 101 102
10–15
10–10
10–5
100(c)
kb0
Ek
100 101 102
10–15
10–10
10–5
100(d)
Ek
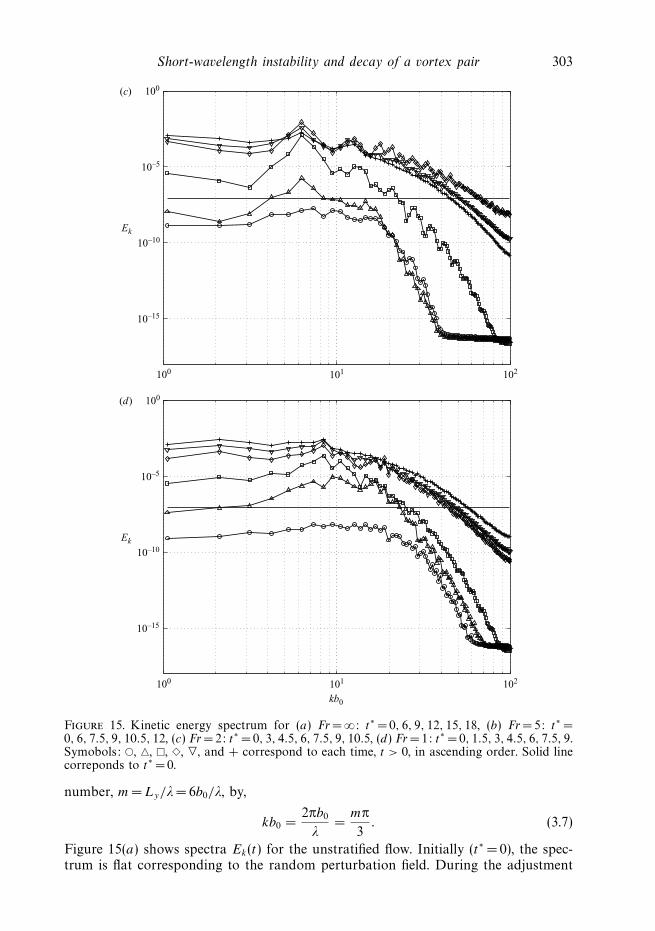
Figure 15. Kinetic energy spectrum for (a) Fr = ∞: t∗ = 0, 6, 9, 12, 15, 18, (b) Fr = 5: t∗ =0, 6, 7.5, 9, 10.5, 12, (c) Fr = 2: t∗ = 0, 3, 4.5, 6, 7.5, 9, 10.5, (d) Fr =1: t∗ = 0, 1.5, 3, 4.5, 6, 7.5, 9.Symobols: , , , , , and + correspond to each time, t > 0, in ascending order. Solid linecorreponds to t∗ = 0.
number, m = Ly/λ= 6b0/λ, by,
kb0 =2πb0
λ=
mπ
3. (3.7)
Figure 15(a) shows spectra Ek(t) for the unstratified flow. Initially (t∗ = 0), the spec-trum is flat corresponding to the random perturbation field. During the adjustment

304 K. K. Nomura, H. Tsutsui, D. Mahoney and J. W. Rottman
0 2 4 6 8 10 12 14 16 18 20 2210–10
10–9
10–8
10–7
10–6
10–5
10–4
10–3
10–2
10–1
t*
Ekmax
Figure 16. Evolution of perturbation energy of most amplified mode, k = kmax (where kmax
corresponds to the dominant peak in Ek(t) in figure 15). , Fr = ∞; , 10; , 5; , 2; , 1.
phase (not shown), all axial wave modes decay owing to viscous diffusion, and energyat the high wavenumbers decays more quickly. Beyond the adjustment phase, theperturbation energy increases at the low wavenumbers. A dominant wavenumber,kmaxb0 = 6π/3 = 6.3, is identified (figure 15a, t∗ 9) indicating that the most amplifiedwavelength is λ/b0 = 1.0. This compares reasonably well with the reported wavelengthof λ/b0 = 0.77 (kmaxb0 = 8.16) in the experiments of LW98 and λ/b0 = 0.85 ± 0.05 inthe simulations of Laporte & Corjon (2000). We note that some discrepancy will arisefrom the finite computational domain of the simulations which requires approximat-ing the Fourier transform with a discrete Fourier transform which allows only discretewavenumbers. This limits the possible values of wavelength to λ/b0 = 6/m, m =1, 2, . . . , Ny/2, where Ny is the number of grid points in the axial direction. Form =6, the actual wavelength could have a value in the range of 0.86 < λ/b0 < 1.2. Asdiscussed earlier, Ly is limited in order to minimize the effects of the Crow instability.Although varying Ly slightly might yield a better estimate of λ, there are other factorsto be considered in assessing the results (see § 3.3.3).
Figure 16 shows the time development of Ekmax(t). The growth rate, σ , of the most
amplified mode energy is obtained from σ = 1/2(d lnEkmax/dt). For Fr = ∞, the non-
dimensional growth rate is σ ∗ = σ/(Γ/2πb02) = 0.83. This is in agreement with the
growth rates reported in LW98 (σ ∗ = 0.94 ± 0.12) and in Laporte & Corjon (2000)(σ ∗ = 0.96 ± 0.3).
In the stratified flows (figure 15b–d), Ek(t) develops in a qualitatively similar mannerto the unstratified flow during the adjustment and linear phases. In weak to moderatestratification (Fr = 5, 2, figure 15b, c) the same dominant wavenumber, kmaxb0 = 6.3,is exhibited. In strong stratification (Fr = 1, figure 15d), the peak occurs at a higherwavenumber, kmaxb0 = 8π/3 = 8.4. In general, the behaviour of Ekmax
(t) in figure 16suggests that the growth rate increases with increasing stratification. However, in
Short-wavelength instability and decay of a vortex pair 305
Fr ∞ 10 5 2 1
λ/b0 1.0 1.0 1.0 1.0 0.75
σ ∗ = σ/(Γ/2πb02) Right vortex 0.74 0.89 1.26 1.60 2.09
Left vortex 0.70 0.89 1.42 1.99 1.62
σ ∗b = σ/(W0/b) (Right vortex) 0.80 0.82 0.88 0.64 0.73
(Left vortex) 0.76 0.82 0.99 0.80 0.57
Table 1. Computed wavelength and growth rates.
the stratified flows, the perturbation energy also includes that associated with thesecondary flow due to the baroclinic torque. Thus for these flows, λ/b0 and σ ∗ aredetermined using an alternative method based on the measured growth of the vortexcore displacement (Mahoney 2002; Tsutsui 2003). A one-dimensional discrete Fouriertransform is applied in the axial direction to the measured core displacements. Thegrowth rate is determined by an exponential fit to the time development of theamplitude of the most amplified mode. It should be noted that the exponentialfunction fits the simulation data well, indicating the existence and extent of thelinear phase. Results are presented in table 1. As discussed earlier, there is somevortex-to-vortex variability in the instability amplitudes owing to sensitivity of theflow to the initial perturbation field. Note that the average growth rate for Fr= ∞ isσ ∗ =0.72 which is in reasonable agreement with that obtained from Ek(t). For weakto moderate stratification (∞ > Fr 2), λ/b0 = 1.0 as in the unstratified flow. However,as the stratification increases, σ ∗ increases. As will be discussed in § 3.3.3, this is dueto the enhanced strain in the vortices resulting from the reduced vortex separationdistance.
In the case of strong stratification (Fr = 1), both Ek(t) (figure 15d) and thecore displacement spectrum indicate that the most amplified wave mode isassociated with a higher wavenumber, kmaxb0 = 8π/3 = 8.4 which corresponds to ashorter wavelength, λ/b0 = 0.75. Results from additional simulations (different initialconditions, domain size) indicate comparable growth rates for wave modes in therange 6π/3 kmaxb0 10π/3.
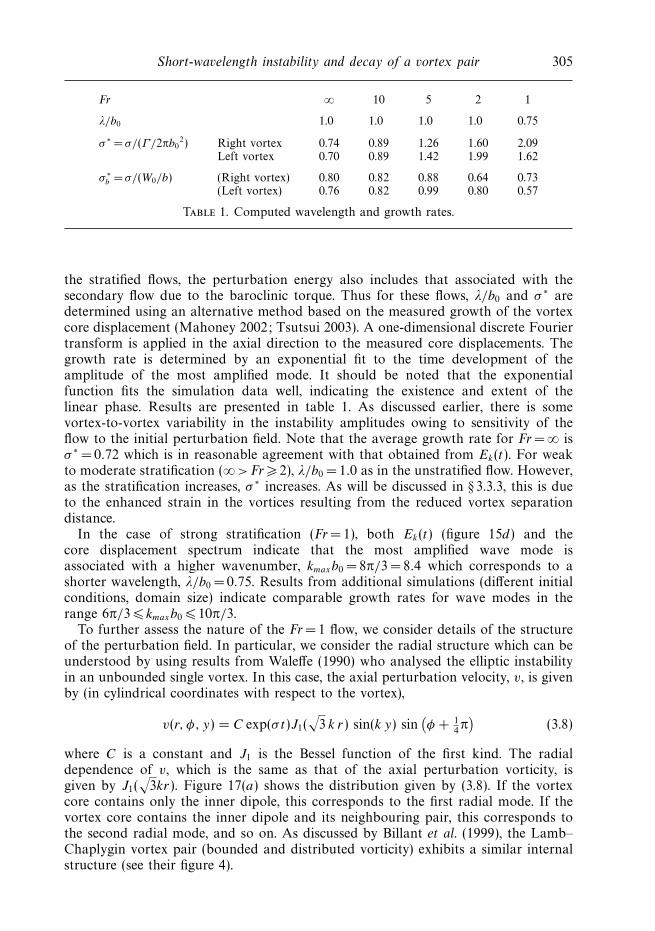
To further assess the nature of the Fr =1 flow, we consider details of the structureof the perturbation field. In particular, we consider the radial structure which can beunderstood by using results from Waleffe (1990) who analysed the elliptic instabilityin an unbounded single vortex. In this case, the axial perturbation velocity, v, is givenby (in cylindrical coordinates with respect to the vortex),
v(r, φ, y) = C exp(σ t)J1(√
3 k r) sin(k y) sin(φ + 1
4π)
(3.8)
where C is a constant and J1 is the Bessel function of the first kind. The radialdependence of v, which is the same as that of the axial perturbation vorticity, isgiven by J1(
√3kr). Figure 17(a) shows the distribution given by (3.8). If the vortex
core contains only the inner dipole, this corresponds to the first radial mode. If thevortex core contains the inner dipole and its neighbouring pair, this corresponds tothe second radial mode, and so on. As discussed by Billant et al. (1999), the Lamb–Chaplygin vortex pair (bounded and distributed vorticity) exhibits a similar internalstructure (see their figure 4).
306 K. K. Nomura, H. Tsutsui, D. Mahoney and J. W. Rottman
x
z
(a)
x1.8 3.0 4.2
3.6
4.8
6.0
(b)
Figure 17. Axial component of perturbation velocity (a) theoretical prediction for singlevortex (Waleffe 1990). The innermost pair corresponds to the first radial mode, the twoinnermost pairs correspond to the second radial mode, and so on. (b) DNS results forFr = ∞, t∗ =12.0. The distribution indicates the first radial mode. Dashed-line shows axialvorticity contour corresponding to |ω|/|ω|max = 1/e.
x
z
1.8 3.0 4.2
12.3
13.5
14.7
(a)
x1.8 3.0 4.2
12.3
13.5
14.7
(b)
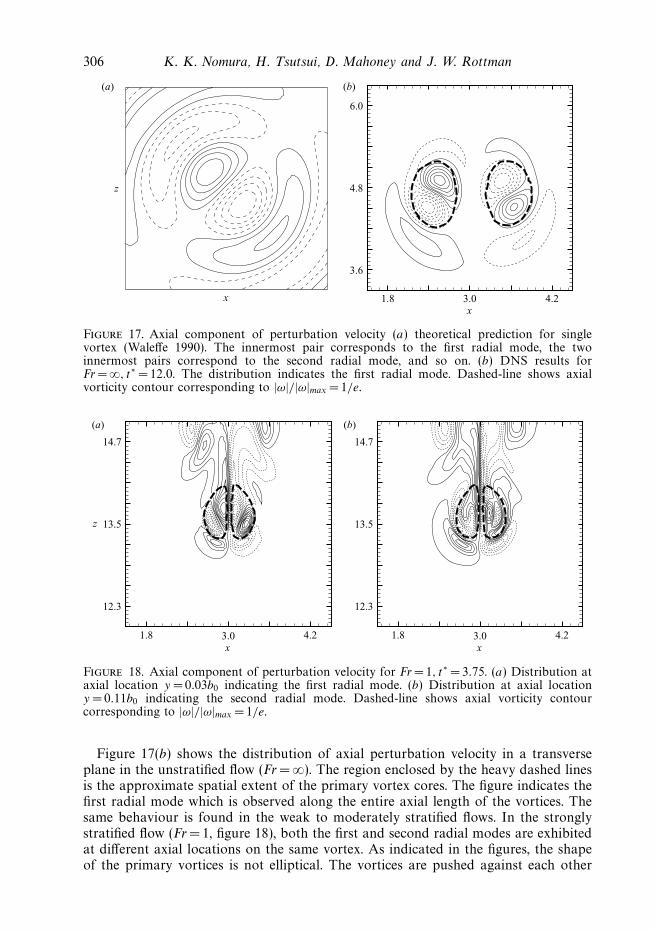
Figure 18. Axial component of perturbation velocity for Fr =1, t∗ = 3.75. (a) Distribution ataxial location y = 0.03b0 indicating the first radial mode. (b) Distribution at axial locationy = 0.11b0 indicating the second radial mode. Dashed-line shows axial vorticity contourcorresponding to |ω|/|ω|max = 1/e.
Figure 17(b) shows the distribution of axial perturbation velocity in a transverseplane in the unstratified flow (Fr = ∞). The region enclosed by the heavy dashed linesis the approximate spatial extent of the primary vortex cores. The figure indicates thefirst radial mode which is observed along the entire axial length of the vortices. Thesame behaviour is found in the weak to moderately stratified flows. In the stronglystratified flow (Fr = 1, figure 18), both the first and second radial modes are exhibitedat different axial locations on the same vortex. As indicated in the figures, the shapeof the primary vortices is not elliptical. The vortices are pushed against each other

Short-wavelength instability and decay of a vortex pair 307
and deform into a flattened tear-drop shape. As previously indicated, the combinedaction of mutual diffusion and detrainment reduces the size of the vortices.
3.3.3. Discussion
In order to understand and interpret the simulation results better, we review theexisting theory for the short-wavelength instability in the unstratified vortex pair. Asindicated in § 1, there are no stability analysis results for the stratified flow; thus,a reasonable approach is to consider first relatively weak stratification and how itwill affect the known instability in unstratified flow. We will first consider the resultsof inviscid linear stability analysis. In this case, the fundamental parameter is thedipole aspect ratio, a/b, and both the vortex radius, a, and the vortex separation,b, are constant in the two-dimensional base flow. We will then consider resultsfrom a linear stability analysis in which viscous effects, characterized by ReΓ , areconsidered. As discussed in Sipp & Jacquin (2003), viscosity will not only affect theperturbation growth rate, but also the base flow vortex radii, a. We will then discussthe present results for a vortex pair in a stably stratified fluid, in which the baseflow also changes in time. Stratification is characterized by Fr which indicates thetime scale of stratification to that of the flow instability. As our results indicate, two-dimensional effects of stratification may cause both a and b to vary in time. In thecase of weak to moderate stratification, characteristics of the observed instability arefundamentally similar to that in unstratified flow. However, for strong stratification(Fr ∼ 1), significant differences are observed and the existing theory for unstratifiedflow may no longer be applicable.
A number of theoretical studies have been carried out on the short-wave ellipticinstability of a single vortex (e.g. Tsai & Widnall 1976; Waleffe 1990; Eloy & Le Dizes1999). These studies showed that the axial wavenumber scales with a and the growthrate with strain rate. As the wavenumber increases, the radial structure becomesmore complex. More relevant to the present work are the linear stability analysesperformed for a vortex pair (Billant et al. 1999; Sipp & Jacquin 2003), which directlyconsider the parameter a/b. The inviscid analysis of Sipp & Jacquin (2003) consideredthe Lamb–Oseen vortex pair with two values of the dipole aspect ratio, a/b =0.208and 0.288. They found that the antisymmetric instability mode occupies bands ofwavenumbers with a local maximum growth rate in each band. The wavenumberscorresponding to the maximum growth rate in the first three bands are: ka = 2.26, 3.96and 5.61, corresponding to the first, second and third radial modes, respectively. Fora/b = 0.288, the maximum growth rate of the first radial mode is higher than thatof the second radial mode. Similar results were found by Billant et al. (1999) in alinear stability analysis of a Lamb–Chaplygin vortex pair with a/b =0.4478. Theseresults indicate that for sufficiently high a/b, the antisymmetric mode with the firstradial mode will be selected. This is consistent with experimental observations andour Fr = ∞ results. The analysis of Sipp & Jacquin (2003) gives the correspondingwavenumber and growth rate as ka = 2.26 and σ ∗ = 1.38, respectively. LW98 reportka = 1.6 ± 0.2 and σ ∗ = 0.94.
As discussed in Sipp & Jacquin (2003), viscosity will not only reduce the perturba-tion growth rate, but also increase the vortex radius, a, and hence a/b. The diffusivegrowth of an Oseen vortex, with the scaling defined in § 2, can be expressed as,(
a
b0
)2
=
(a0
b0
)2
+8π t∗
ReΓ
, (3.9)
308 K. K. Nomura, H. Tsutsui, D. Mahoney and J. W. Rottman
where t∗ = tΓ /(2πb20) is non-dimensional time. Using (3.9) and data from LW98, the
change in a/b in their experiments can be estimated. As stated earlier, at the start oftheir experiments, a/b = 0.15. For the time interval over which their σ ∗ is evaluated(see figure 14b in LW98), a/b varies in the range 0.24 <a/b < 0.31. Thus, a/b increasesby approximately 33 % during this time and by 100 % during the evolution from initialgeneration through the linear phase. As discussed by Sipp & Jacquin (2003), simplyrescaling the wavenumber with an appropriate a will not account for the differencebetween the predicted ka = 2.26 and measured ka = 1.6 (e.g. ka = kb × a/b =8.16 ×0.24 =1.96).
Sipp & Jacquin (2003) also performed a linear stability analysis which accountsfor the effects of viscosity on both the perturbation field and the base flow radius,a = a(t). In this case, the perturbation growth rates depend on ReΓ , kb and a/b. Sincea/b now varies in time, the growth rates for each kb also vary in time. The solution isdetermined by integrating in time a non-autonomous amplitude equation. Results areobtained for ReΓ = 2750 in order to match LW98. The growth rate corresponding tothe wavenumber kb = 8.16 of LW98 is determined to be σ ∗ = 0.99 which agrees wellwith the value σ ∗ = 0.94 determined by LW98. In general, since the kb dependencyof the growth rate develops in time, the wavenumber associated with the maximumgrowth rate and the wavenumber bands associated with the radial modes are nolonger explicitly indicated. Although the analytical results indicate a wavenumbernear kb = 8.16 with a local maximum growth rate, wavenumbers kb > 8.16 appear tohave comparable growth rates and initiate growth earlier in time. The determinationof which kb is selected is not clear.
In regards to our Fr= ∞ results, for which ReΓ =2400, the most amplified wave-number is found to be kmaxb0 = 6.3 (with some uncertainty associated with the finitedomain) and the corresponding growth rate is σ ∗ = 0.83. The lower kmaxb0 and σ ∗
are consistent with the lower ReΓ . Using (3.9), we estimate for the linear phase(3.4 < t∗ < 12.0 over which σ ∗ is determined) a range of a/b values, 0.23 <a/b < 0.38.The values are comparable to the values in LW98. However, since the wavelengthand growth rates are time dependent, there may be greater sensitivity to initialconditions and this is what we observe in our simulations. With these considerations,the differences between our results and those of LW98 are reasonable.
We now consider the effects of stratification in which both a and b may vary. In thecase of weak to moderate stratification (Fr 2), the most amplified wavelength is thesame as that of the unstratified flow, i.e. kmaxb0 = 6.3. However, as indicated in table 1,σ ∗ increases with increasing stratification. Under these conditions, stratification doesnot significantly affect the vortex radius, a, but does affect the vortex separation, b,as indicated in figure 12(a). Thus, if the wavenumber scales with a, but growth ratesvary with a/b, we expect the observed behaviour. While viscosity acts to increasea, stratification causes a reduction in b, thereby enhancing the increase of a/b intime. For the Fr range considered, the reduction in b increases with increasingstratification. For Fr= 2, using (3.9) to estimate the variation of a and results fromfigure 12(a) to evaluate b, we obtain a range of values, 0.19 <a/b < 0.53 for theestimated duration of the linear phase (2< t∗ < 5.25). Although both viscosity andstratification act to increase a/b, the physical effects on the perturbation field differ.While viscosity acts to damp the growth of the perturbations, the reduction in b causedby stratification results in an enhanced amplification of the perturbations. It shouldbe noted that even in unstratified flow, a smaller b results in greater amplification ofthe perturbations. Details of the variation of the growth rate with b will be discussedbelow.
Short-wavelength instability and decay of a vortex pair 309
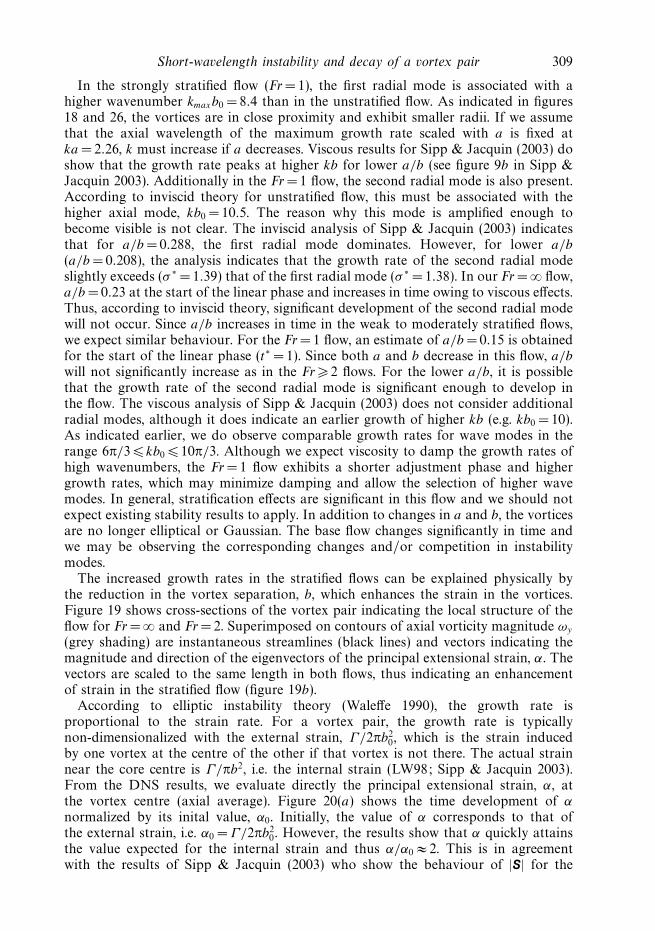
In the strongly stratified flow (Fr = 1), the first radial mode is associated with ahigher wavenumber kmaxb0 = 8.4 than in the unstratified flow. As indicated in figures18 and 26, the vortices are in close proximity and exhibit smaller radii. If we assumethat the axial wavelength of the maximum growth rate scaled with a is fixed atka = 2.26, k must increase if a decreases. Viscous results for Sipp & Jacquin (2003) doshow that the growth rate peaks at higher kb for lower a/b (see figure 9b in Sipp &Jacquin 2003). Additionally in the Fr= 1 flow, the second radial mode is also present.According to inviscid theory for unstratified flow, this must be associated with thehigher axial mode, kb0 = 10.5. The reason why this mode is amplified enough tobecome visible is not clear. The inviscid analysis of Sipp & Jacquin (2003) indicatesthat for a/b = 0.288, the first radial mode dominates. However, for lower a/b
(a/b =0.208), the analysis indicates that the growth rate of the second radial modeslightly exceeds (σ ∗ = 1.39) that of the first radial mode (σ ∗ = 1.38). In our Fr = ∞ flow,a/b = 0.23 at the start of the linear phase and increases in time owing to viscous effects.Thus, according to inviscid theory, significant development of the second radial modewill not occur. Since a/b increases in time in the weak to moderately stratified flows,we expect similar behaviour. For the Fr = 1 flow, an estimate of a/b = 0.15 is obtainedfor the start of the linear phase (t∗ = 1). Since both a and b decrease in this flow, a/b
will not significantly increase as in the Fr 2 flows. For the lower a/b, it is possiblethat the growth rate of the second radial mode is significant enough to develop inthe flow. The viscous analysis of Sipp & Jacquin (2003) does not consider additionalradial modes, although it does indicate an earlier growth of higher kb (e.g. kb0 = 10).As indicated earlier, we do observe comparable growth rates for wave modes in therange 6π/3 kb0 10π/3. Although we expect viscosity to damp the growth rates ofhigh wavenumbers, the Fr= 1 flow exhibits a shorter adjustment phase and highergrowth rates, which may minimize damping and allow the selection of higher wavemodes. In general, stratification effects are significant in this flow and we should notexpect existing stability results to apply. In addition to changes in a and b, the vorticesare no longer elliptical or Gaussian. The base flow changes significantly in time andwe may be observing the corresponding changes and/or competition in instabilitymodes.
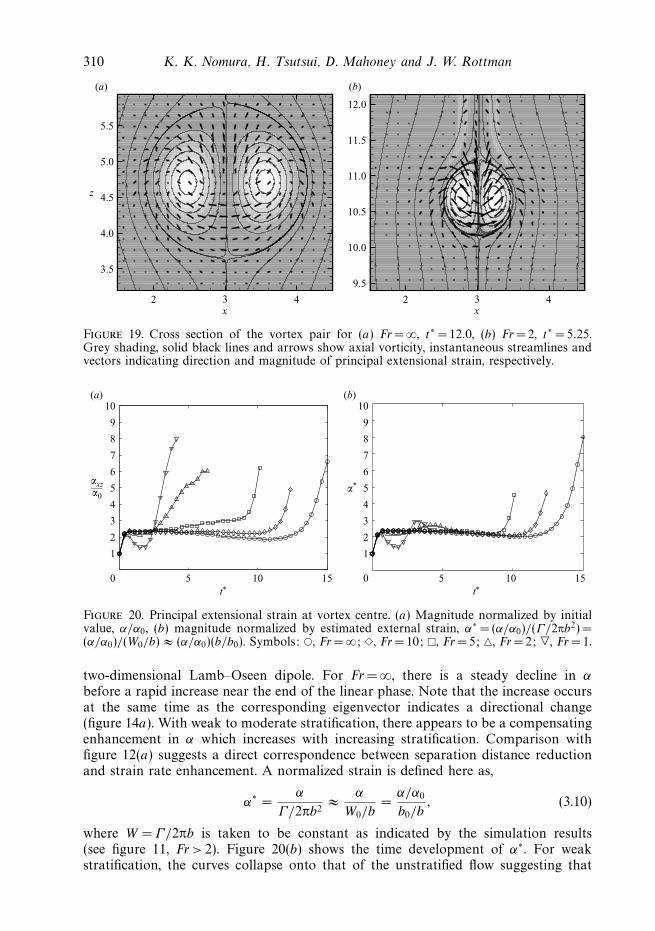
The increased growth rates in the stratified flows can be explained physically bythe reduction in the vortex separation, b, which enhances the strain in the vortices.Figure 19 shows cross-sections of the vortex pair indicating the local structure of theflow for Fr = ∞ and Fr= 2. Superimposed on contours of axial vorticity magnitude ωy
(grey shading) are instantaneous streamlines (black lines) and vectors indicating themagnitude and direction of the eigenvectors of the principal extensional strain, α. Thevectors are scaled to the same length in both flows, thus indicating an enhancementof strain in the stratified flow (figure 19b).
According to elliptic instability theory (Waleffe 1990), the growth rate isproportional to the strain rate. For a vortex pair, the growth rate is typicallynon-dimensionalized with the external strain, Γ/2πb2
0, which is the strain inducedby one vortex at the centre of the other if that vortex is not there. The actual strainnear the core centre is Γ/πb2, i.e. the internal strain (LW98; Sipp & Jacquin 2003).From the DNS results, we evaluate directly the principal extensional strain, α, atthe vortex centre (axial average). Figure 20(a) shows the time development of α
normalized by its inital value, α0. Initially, the value of α corresponds to that ofthe external strain, i.e. α0 = Γ/2πb2
0. However, the results show that α quickly attainsthe value expected for the internal strain and thus α/α0 ≈ 2. This is in agreementwith the results of Sipp & Jacquin (2003) who show the behaviour of |S| for the
310 K. K. Nomura, H. Tsutsui, D. Mahoney and J. W. Rottman
x
z
2
3.5
4.0
4.5
5.0
5.5
(a) (b)
9.5
10.0
10.5
11.0
11.5
12.0
3 4x
2 3 4
Figure 19. Cross section of the vortex pair for (a) Fr = ∞, t∗ = 12.0, (b) Fr = 2, t∗ = 5.25.Grey shading, solid black lines and arrows show axial vorticity, instantaneous streamlines andvectors indicating direction and magnitude of principal extensional strain, respectively.
5 10 150
1
2
3
4
5
6
7
8
9
10
αxz—α0
t*
(a)
5 10 150
1
2
3
4
5
6
7
8
9
10
t*
(b)
α*
Figure 20. Principal extensional strain at vortex centre. (a) Magnitude normalized by initialvalue, α/α0, (b) magnitude normalized by estimated external strain, α∗ = (α/α0)/(Γ/2πb2) =(α/α0)/(W0/b) ≈ (α/α0)(b/b0). Symbols: , Fr = ∞; , Fr = 10; , Fr = 5; , Fr = 2; , Fr = 1.
two-dimensional Lamb–Oseen dipole. For Fr= ∞, there is a steady decline in α
before a rapid increase near the end of the linear phase. Note that the increase occursat the same time as the corresponding eigenvector indicates a directional change(figure 14a). With weak to moderate stratification, there appears to be a compensatingenhancement in α which increases with increasing stratification. Comparison withfigure 12(a) suggests a direct correspondence between separation distance reductionand strain rate enhancement. A normalized strain is defined here as,
α∗ =α
Γ/2πb2≈ α
W0/b=
α/α0
b0/b, (3.10)
where W = Γ/2πb is taken to be constant as indicated by the simulation results(see figure 11, Fr > 2). Figure 20(b) shows the time development of α∗. For weakstratification, the curves collapse onto that of the unstratified flow suggesting that
Short-wavelength instability and decay of a vortex pair 311
the strain rate is not distinctly altered by stratification, but only enhanced througha reduced separation distance. For Fr 2, however, the effects of stratification aresignificant and change the behaviour of the strain rate. In fact, for Fr = 1, the strainrate shows a decrease at the onset of the instability. This may explain the changingtrends in σ ∗ for Fr =1 (table 1).
We can consider a modified non-dimensional growth rate, σ ∗b , which accounts for
the change in b,
σ ∗b =
σ
W0/b, (3.11)
where b is a representative value during the time interval that σ is evaluated. Theresults are given in table 1. Values of σ ∗
b for weak to moderately stratified flows(10 Fr > 2), are comparable to that of the unstratified flow. However, for strongstratification (Fr < 2), σ ∗
b actually decreases.We now consider the results reported by Delisi & Robins (2000). Recall that they
peformed both experiments (ReΓ = 24 000) and simulations (ReΓ = 1465) with Frranging from 0.73 to 1.10; thus, our strongly stratified flow (ReΓ = 2400, Fr= 1) fallswithin their range of flow conditions. Our results are consistent with their qualitativeobservations of an earlier onset and more rapid growth of the instability in the strati-fied flows. However, they observe longer wavelengths (1 λ/b0 2) than in the un-stratified flows (λ/b0 1). They also observe the wavelength increasing in time, whichis not indicated in the present results. The reasons for these differences are not clear.Delisi & Robins (2000) indicate an initial vortex radius of 0.16b0 in their simulationsand smaller radii in their experiments. A smaller a would, however, produce shorterwavelengths and thus does not explain the observed difference with our results.Since ReΓ =24 000 in their experiments, the differences should not be attributed toviscous effects. In comparing their simulations with those of the present study, a keydifference is their axial domain length which is 10b0. This allows the developmentof the Crow instability which may influence the short-wavelength instability and inparticular, modify the development of the wavelength. Another, related, differenceis their initialization of the perturbation field which consists of a superposition ofsinusoidal deformations of the vortices. The axial phase of each mode is randomand the wavenumbers include the low-frequency range, which is not included in oursimulations owing to the shorter axial length. These additional modes could develop,at a slower rate, and interact with the short wave, resulting in their growth. In theirexperiments, although the development of the Crow instability was not observed, it islikely that the associated modes are present and growing in time. In addition, the rangeof Fr considered in their study, 0.73−1.10, includes Fr< 1 which represents very strongstratification. At Fr less than some critical value, Frcr (where Frcr < 1), the separationdistance increases and the flow behaves fundamentally differently (Mahoney 2002).Thus, Fr ∼ 1 may correspond to the transition between two distinct flow regimes. Asindicated by our results, Fr =1 shows significantly different characteristics from thosein the unstratified and moderately stratified flows. The condition of Fr ∼ 1 alongwith the possible presence of the Crow instability may have caused the short-waveinstability to be susceptible to variation in their flows.
In summary, the present results show that in the case of weak to moderate strati-fication (∞ > Fr 2), the elliptic short-wave instability is exhibited and fundamentallysimilar to that in unstratified flow. In this case, the time scale of buoyancy is greaterthan that of the flow instability. Although stratification effects are present, they donot interact significantly with the instability. The principal effect is to reduce the
312 K. K. Nomura, H. Tsutsui, D. Mahoney and J. W. Rottman
separation distance which enhances the strain rate thereby increasing the growth rateof the instability. This is consistent with linear stability theory for unstratified flow.In the case of strong stratification (Fr = 1), the time scale of buoyancy is comparableto that of the instability. The effects of stratification interact significantly with theinstability growth. The two-dimensional base flow changes considerably and altersthe three-dimensional development of the flow.
3.4. Nonlinear phase
We now consider the development of the flow during the nonlinear phase in which theperturbation amplitudes are significant and, as seen in the flow visualizations (figures2–4), secondary structures are formed which lead to the breakdown of the vortex pair.
In the unstratified flow, the early stage of the nonlinear phase is marked by the form-ation of ‘knobs’ which appear at the peaks of the sinusoidal deformation (figure 2c,t∗ = 13.5). Vorticity concentrates within the knobs as indicated at the subsequent time(figure 2d , t∗ = 15.0). Transverse secondary structures develop at the leading edge,i.e. the bottom of the descending vortex pair oval, and eventually dominate the flow(figure 2e, f , t∗ 16.5). These structures consist primarily of transverse vorticity, ωx .During this time period, the vortex circulation Γ (figure 7a), exhibits an enhanceddecay while the perturbation energy spectrum shows the development of harmonicsof the primary instability (figure 15a).
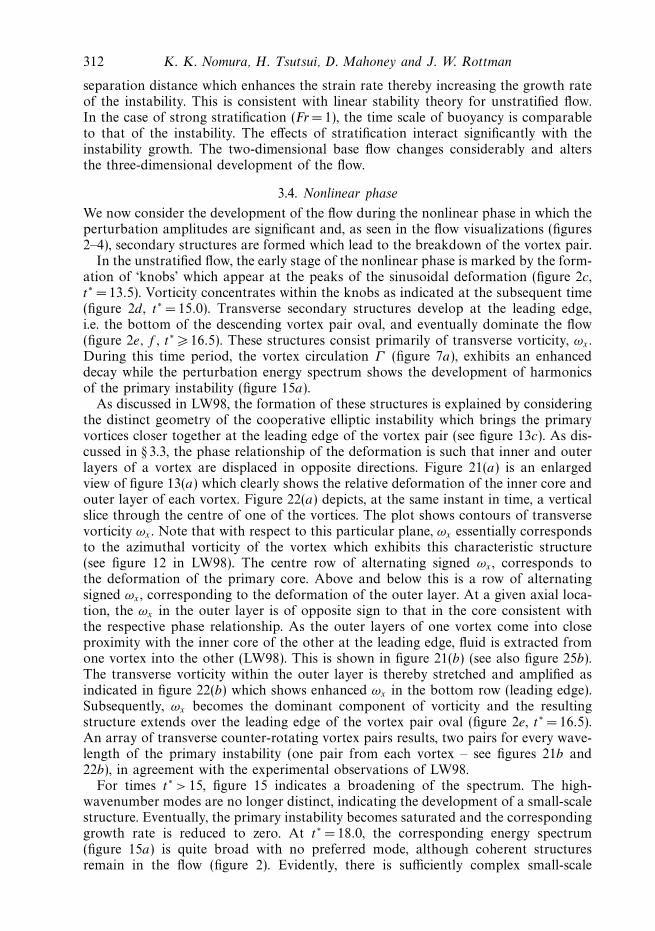
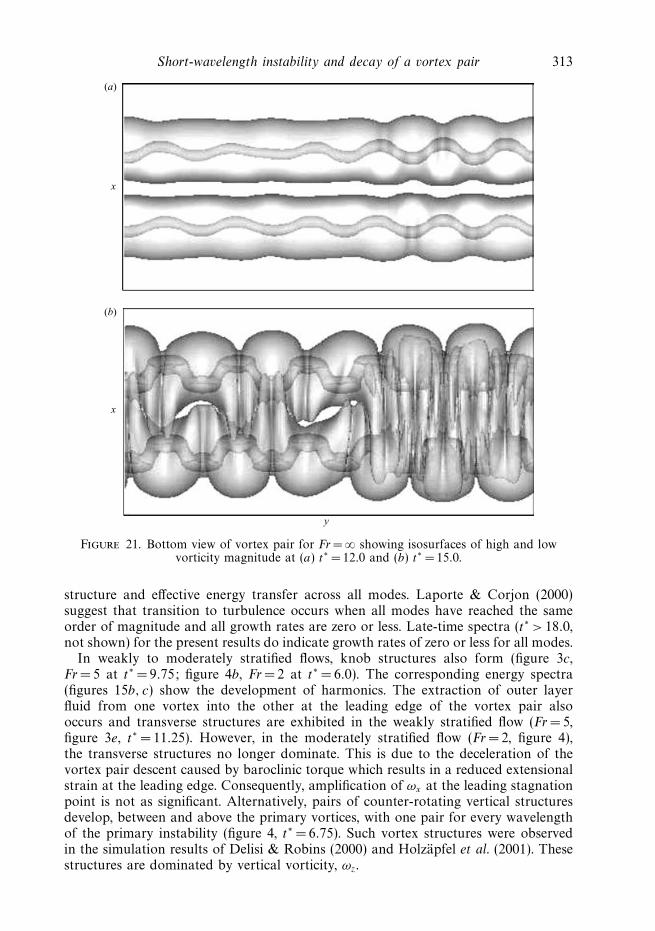
As discussed in LW98, the formation of these structures is explained by consideringthe distinct geometry of the cooperative elliptic instability which brings the primaryvortices closer together at the leading edge of the vortex pair (see figure 13c). As dis-cussed in § 3.3, the phase relationship of the deformation is such that inner and outerlayers of a vortex are displaced in opposite directions. Figure 21(a) is an enlargedview of figure 13(a) which clearly shows the relative deformation of the inner core andouter layer of each vortex. Figure 22(a) depicts, at the same instant in time, a verticalslice through the centre of one of the vortices. The plot shows contours of transversevorticity ωx . Note that with respect to this particular plane, ωx essentially correspondsto the azimuthal vorticity of the vortex which exhibits this characteristic structure(see figure 12 in LW98). The centre row of alternating signed ωx , corresponds tothe deformation of the primary core. Above and below this is a row of alternatingsigned ωx , corresponding to the deformation of the outer layer. At a given axial loca-tion, the ωx in the outer layer is of opposite sign to that in the core consistent withthe respective phase relationship. As the outer layers of one vortex come into closeproximity with the inner core of the other at the leading edge, fluid is extracted fromone vortex into the other (LW98). This is shown in figure 21(b) (see also figure 25b).The transverse vorticity within the outer layer is thereby stretched and amplified asindicated in figure 22(b) which shows enhanced ωx in the bottom row (leading edge).Subsequently, ωx becomes the dominant component of vorticity and the resultingstructure extends over the leading edge of the vortex pair oval (figure 2e, t∗ = 16.5).An array of transverse counter-rotating vortex pairs results, two pairs for every wave-length of the primary instability (one pair from each vortex – see figures 21b and22b), in agreement with the experimental observations of LW98.
For times t∗ > 15, figure 15 indicates a broadening of the spectrum. The high-wavenumber modes are no longer distinct, indicating the development of a small-scalestructure. Eventually, the primary instability becomes saturated and the correspondinggrowth rate is reduced to zero. At t∗ = 18.0, the corresponding energy spectrum(figure 15a) is quite broad with no preferred mode, although coherent structuresremain in the flow (figure 2). Evidently, there is sufficiently complex small-scale
Short-wavelength instability and decay of a vortex pair 313
x
x
y
(a)
(b)
Figure 21. Bottom view of vortex pair for Fr = ∞ showing isosurfaces of high and lowvorticity magnitude at (a) t∗ = 12.0 and (b) t∗ =15.0.
structure and effective energy transfer across all modes. Laporte & Corjon (2000)suggest that transition to turbulence occurs when all modes have reached the sameorder of magnitude and all growth rates are zero or less. Late-time spectra (t∗ > 18.0,not shown) for the present results do indicate growth rates of zero or less for all modes.
In weakly to moderately stratified flows, knob structures also form (figure 3c,Fr = 5 at t∗ = 9.75; figure 4b, Fr= 2 at t∗ = 6.0). The corresponding energy spectra(figures 15b, c) show the development of harmonics. The extraction of outer layerfluid from one vortex into the other at the leading edge of the vortex pair alsooccurs and transverse structures are exhibited in the weakly stratified flow (Fr = 5,figure 3e, t∗ = 11.25). However, in the moderately stratified flow (Fr =2, figure 4),the transverse structures no longer dominate. This is due to the deceleration of thevortex pair descent caused by baroclinic torque which results in a reduced extensionalstrain at the leading edge. Consequently, amplification of ωx at the leading stagnationpoint is not as significant. Alternatively, pairs of counter-rotating vertical structuresdevelop, between and above the primary vortices, with one pair for every wavelengthof the primary instability (figure 4, t∗ = 6.75). Such vortex structures were observedin the simulation results of Delisi & Robins (2000) and Holzapfel et al. (2001). Thesestructures are dominated by vertical vorticity, ωz.
314 K. K. Nomura, H. Tsutsui, D. Mahoney and J. W. Rottman
z
y
z
(a)
(b)
Figure 22. Vertical slice through one vortex core showing contours of transverse vorticity, ωx ,associated with the deformation of inner core and outer layer for Fr = ∞. (a) t∗ =12.0, Contourlevel increments ωx/ωyo = ±0.0125. (b) t∗ =15.0, Contour level increments ωx/ωyo =±0.025.
Figure 23(a) shows contours of vertical vorticity, ωz, in a horizontal slice ((x, y)-plane) through the vortex pair in the unstratified flow. Analogous to figure 22, ωz
effectively corresponds to the azimuthal vorticity with respect to this particular plane.There are two rows of alternating signed ωz corresponding to the deformation of thetwo primary vortex cores. On either side of each core is a row of alternating signedωz corresponding to the deformation of the outer layers. Figure 23(b) shows thecorresponding plot for the moderately stratified flow, Fr= 2. Owing to the reducedseparation distance, the outer layers with like-signed vorticity overlap in betweenthe cores, resulting in locally enhanced ωz (at the end of the linear phase, ωz isapproximately twice the magnitude of that in the outermost rows). Figure 24 displaysvertical slices ((x, z)-plane) of the vortex pair showing vorticity magnitude (contourlevels) and the magnitude and orientation of the principal extensional strain (vectors).In the unstratified flow (figure 24a), there is no significant stretching in the verticaldirection between the vortices and thus, there is no significant development of ωz andassociated vertical structures. In the stratified flow (figure 24b), there is significantvertical strain between and above the vortices. The already enhanced ωz therebybecomes further amplified. The vertical strain is due to both the reduced separationdistance and the baroclinically generated secondary vortices which pulls fluid upward
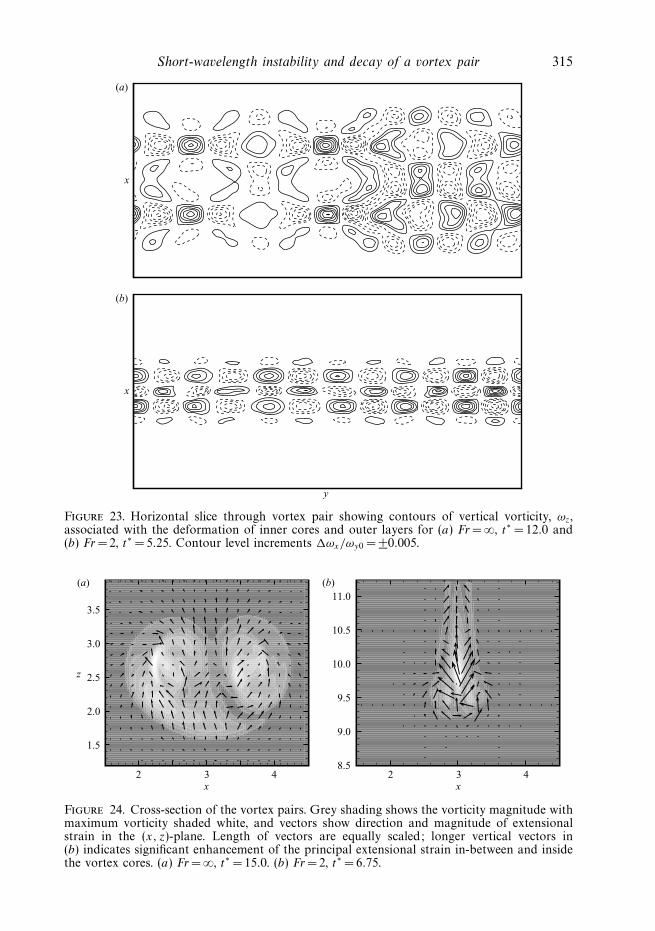
Short-wavelength instability and decay of a vortex pair 315
x
y
x
(a)
(b)
Figure 23. Horizontal slice through vortex pair showing contours of vertical vorticity, ωz,associated with the deformation of inner cores and outer layers for (a) Fr = ∞, t∗ = 12.0 and(b) Fr =2, t∗ =5.25. Contour level increments ωx/ωy0 = ±0.005.
z
x2 3 4
x2 3 4
1.5
2.0
2.5
3.0
3.5
(a) (b)
8.5
9.0
9.5
10.0
10.5
11.0
Figure 24. Cross-section of the vortex pairs. Grey shading shows the vorticity magnitude withmaximum vorticity shaded white, and vectors show direction and magnitude of extensionalstrain in the (x, z)-plane. Length of vectors are equally scaled; longer vertical vectors in(b) indicates significant enhancement of the principal extensional strain in-between and insidethe vortex cores. (a) Fr = ∞, t∗ = 15.0. (b) Fr = 2, t∗ = 6.75.
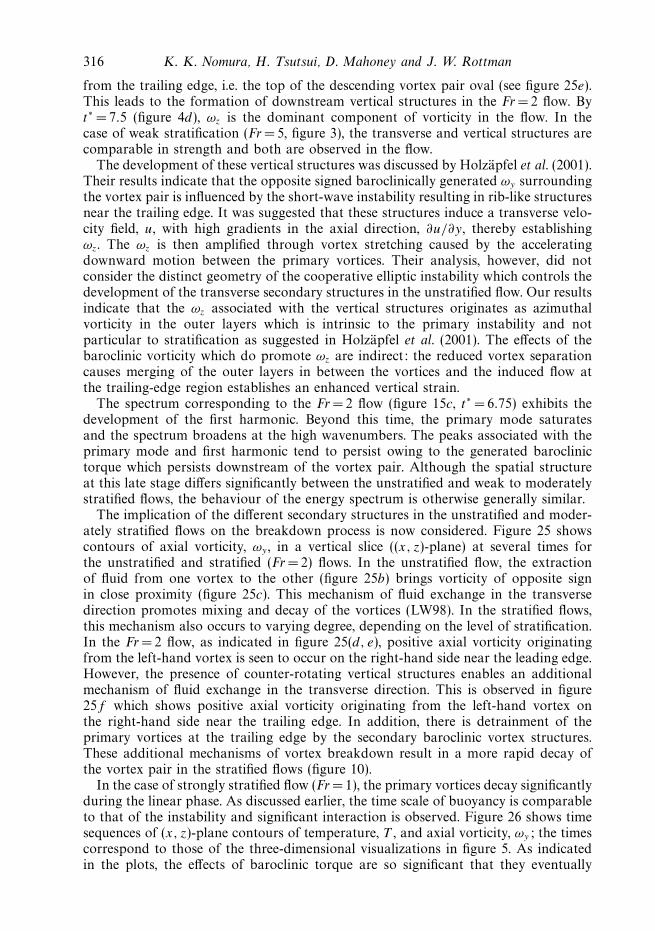
316 K. K. Nomura, H. Tsutsui, D. Mahoney and J. W. Rottman
from the trailing edge, i.e. the top of the descending vortex pair oval (see figure 25e).This leads to the formation of downstream vertical structures in the Fr = 2 flow. Byt∗ = 7.5 (figure 4d), ωz is the dominant component of vorticity in the flow. In thecase of weak stratification (Fr = 5, figure 3), the transverse and vertical structures arecomparable in strength and both are observed in the flow.
The development of these vertical structures was discussed by Holzapfel et al. (2001).Their results indicate that the opposite signed baroclinically generated ωy surroundingthe vortex pair is influenced by the short-wave instability resulting in rib-like structuresnear the trailing edge. It was suggested that these structures induce a transverse velo-city field, u, with high gradients in the axial direction, ∂u/∂y, thereby establishingωz. The ωz is then amplified through vortex stretching caused by the acceleratingdownward motion between the primary vortices. Their analysis, however, did notconsider the distinct geometry of the cooperative elliptic instability which controls thedevelopment of the transverse secondary structures in the unstratified flow. Our resultsindicate that the ωz associated with the vertical structures originates as azimuthalvorticity in the outer layers which is intrinsic to the primary instability and notparticular to stratification as suggested in Holzapfel et al. (2001). The effects of thebaroclinic vorticity which do promote ωz are indirect: the reduced vortex separationcauses merging of the outer layers in between the vortices and the induced flow atthe trailing-edge region establishes an enhanced vertical strain.
The spectrum corresponding to the Fr = 2 flow (figure 15c, t∗ =6.75) exhibits thedevelopment of the first harmonic. Beyond this time, the primary mode saturatesand the spectrum broadens at the high wavenumbers. The peaks associated with theprimary mode and first harmonic tend to persist owing to the generated baroclinictorque which persists downstream of the vortex pair. Although the spatial structureat this late stage differs significantly between the unstratified and weak to moderatelystratified flows, the behaviour of the energy spectrum is otherwise generally similar.
The implication of the different secondary structures in the unstratified and moder-ately stratified flows on the breakdown process is now considered. Figure 25 showscontours of axial vorticity, ωy , in a vertical slice ((x, z)-plane) at several times forthe unstratified and stratified (Fr = 2) flows. In the unstratified flow, the extractionof fluid from one vortex to the other (figure 25b) brings vorticity of opposite signin close proximity (figure 25c). This mechanism of fluid exchange in the transversedirection promotes mixing and decay of the vortices (LW98). In the stratified flows,this mechanism also occurs to varying degree, depending on the level of stratification.In the Fr = 2 flow, as indicated in figure 25(d, e), positive axial vorticity originatingfrom the left-hand vortex is seen to occur on the right-hand side near the leading edge.However, the presence of counter-rotating vertical structures enables an additionalmechanism of fluid exchange in the transverse direction. This is observed in figure25f which shows positive axial vorticity originating from the left-hand vortex onthe right-hand side near the trailing edge. In addition, there is detrainment of theprimary vortices at the trailing edge by the secondary baroclinic vortex structures.These additional mechanisms of vortex breakdown result in a more rapid decay ofthe vortex pair in the stratified flows (figure 10).
In the case of strongly stratified flow (Fr = 1), the primary vortices decay significantlyduring the linear phase. As discussed earlier, the time scale of buoyancy is comparableto that of the instability and significant interaction is observed. Figure 26 shows timesequences of (x, z)-plane contours of temperature, T , and axial vorticity, ωy; the timescorrespond to those of the three-dimensional visualizations in figure 5. As indicatedin the plots, the effects of baroclinic torque are so significant that they eventually

Short-wavelength instability and decay of a vortex pair 317
(a)
(b)
(c)
(d)
(e)
( f )
Figure 25. Contours of axial vorticity, ωy , in (x, z)-plane for (a)–(c) Fr = ∞ at t∗ = 13.5, 15.0,16.5 and (d)–(f ) Fr = 2 at t∗ =6.0, 6.75, 7.5 (solid line: ωy > 0, dashed line: ωy < 0).
dominate the flow. At early times (t∗ 4.5, linear phase), as a result of these effects,the primary vortices are brought together and interdiffuse. In addition, there isdetrainment of the primary vortices at the trailing edge. These mechanisms result inrapid decay of the primary vortex pair (figure 10) before significant development ofthe three-dimensional instability and associated secondary structures (figure 5a, b).At subsequent times, there is some indication of the secondary vertical structures
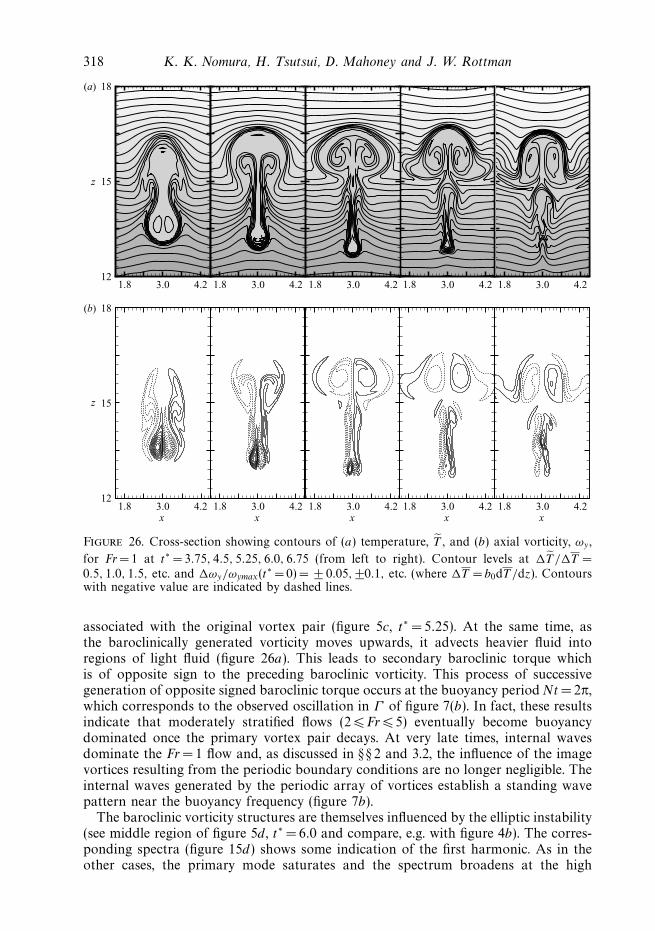
318 K. K. Nomura, H. Tsutsui, D. Mahoney and J. W. Rottman
z
1.8 3.0 4.2 1.8 3.0 4.2 1.8 3.0 4.2 1.8 3.0 4.2 1.8 3.0 4.212
15
18(a)
(b)
x
z
1.8 3.0 4.2x
1.8 3.0 4.2x
1.8 3.0 4.2x
1.8 3.0 4.2x
1.8 3.0 4.212
15
18
Figure 26. Cross-section showing contours of (a) temperature, T , and (b) axial vorticity, ωy ,
for Fr = 1 at t∗ = 3.75, 4.5, 5.25, 6.0, 6.75 (from left to right). Contour levels at T /T =0.5, 1.0, 1.5, etc. and ωy/ωymax(t
∗ = 0) = ± 0.05, ±0.1, etc. (where T = b0dT /dz). Contourswith negative value are indicated by dashed lines.
associated with the original vortex pair (figure 5c, t∗ = 5.25). At the same time, asthe baroclinically generated vorticity moves upwards, it advects heavier fluid intoregions of light fluid (figure 26a). This leads to secondary baroclinic torque whichis of opposite sign to the preceding baroclinic vorticity. This process of successivegeneration of opposite signed baroclinic torque occurs at the buoyancy period Nt = 2π,which corresponds to the observed oscillation in Γ of figure 7(b). In fact, these resultsindicate that moderately stratified flows (2 Fr 5) eventually become buoyancydominated once the primary vortex pair decays. At very late times, internal wavesdominate the Fr =1 flow and, as discussed in § § 2 and 3.2, the influence of the imagevortices resulting from the periodic boundary conditions are no longer negligible. Theinternal waves generated by the periodic array of vortices establish a standing wavepattern near the buoyancy frequency (figure 7b).
The baroclinic vorticity structures are themselves influenced by the elliptic instability(see middle region of figure 5d , t∗ = 6.0 and compare, e.g. with figure 4b). The corres-ponding spectra (figure 15d) shows some indication of the first harmonic. As in theother cases, the primary mode saturates and the spectrum broadens at the high
Short-wavelength instability and decay of a vortex pair 319
wavenumbers. The primary mode peak persists throughout the times shown in figure 5.We also observe evidence of the two-dimensional instabilities reported by Garten et al.(1998). One instability, which Garten et al. refer to as the ‘vortex head instability’,is associated with the primary vortex pair which exhibits sinusoidal motion as itpropagates. This is a result of preferential detrainment of the primary vortices bythe baroclinic torque which alternates from one vortex to the other. There is someindication of this in our Fr= 2 flow (figure 25d–f ). The other instability is a jetinstability of the baroclinically generated vorticity (which corresponds to a jet flow).In the strongly stratified flow Fr= 1, there is some indication of a sinuous mode inthe vertical vortex structures at the later times (figure 26b, t∗ = 6.75). Both of theseinstabilities result in asymmetry in the two-dimensional flow (Garten et al. 1998).
4. ConclusionsThe effects of stable stratification on the development of the short-wavelength
instability and subsequent decay of a counter-rotating vortex pair have been investi-gated using direct numerical simulations. A range of Froude numbers, 1 Fr ∞, isconsidered. A more quantitative assessment of the flow is carried out than in previousstudies. Depending on the level of stratification, as characterized by Fr which indicatesthe ratio of the time scale of buoyancy to that of the instability, and the stage ofevolution, stratification effects may significantly alter the behaviour of the flow. Theevolution of the flow is described in terms of the adjustment phase, in which thevortices adjust to the presence of each other and develop a mutually induced strainfield, the linear phase, in which perturbation amplitudes grow and the instabilitydevelops, and the nonlinear phase, in which perturbation amplitudes are significantand secondary vortex structures dominate the flow. This study considers the linearand nonlinear phases where three-dimensional effects are significant.
In the linear phase of evolution, the vortex pair in unstratified fluid (Fr = ∞)exhibits the elliptic short-wavelength instability with characteristics and behaviour inagreement with the experiments of LW98.
In weak to moderately stratified flows (∞ >Fr > 2), in which the time scale ofbuoyancy is greater than that of the flow instability, the observed instability is funda-mentally similar to that in unstratified flow. Although stratification effects are present,they do not affect the qualitative characteristics of the instability. The principal effect isto reduce the separation distance which enhances the induced strain, thereby increasingthe growth rate of the instability. Consequently, the instability exhibits an earlier onsetand higher growth rate with increasing stratification. The behaviour is essentially de-scribed by linear stability theory for unstratified flow if the varying separation distanceis taken into account. Our analysis suggests the growth rate scaling as Γ/2πb2 =W0/b
where b = b(t) is given by two-dimensional theory (Saffman 1972; Crow 1974).In the case of strong stratification (Fr = 1), the time scale of buoyancy effects is
comparable to that of the instability. The effects of stratification interact significantlywith the development of the instability and alter its characteristics and behaviour.As a result of strong baroclinic torque, the primary vortices are brought togetherand interdiffuse. In addition, there is detrainment by the baroclinically generatedvorticity. The associated reduction in radii of the vortices results in a higher axialwave mode and a more complex radial structure of the instability. Since the shapeof the vortices is significantly altered, it may be that the observed instability can nolonger be considered an elliptic instability.
320 K. K. Nomura, H. Tsutsui, D. Mahoney and J. W. Rottman
Our results of an earlier onset and more rapid growth of the instability in thestratified flows is in agreement with previous studies (Delisi & Robins 2000; Holzapfelet al. 2001). However, the longer wavelengths which increase in time, reported byDelisi & Robins (2000), are not consistent with our results. This may be due to thepresence of the Crow instability in their flows. Additionally, the range of Fr consideredin their study, 0.73−1.10, may correspond to the transition between two distinct flowregimes. As indicated by our results, Fr = 1 shows significantly different characteristicsfrom those in the unstratified and moderately stratified flows. Detailed features such asthe presence of the second radial mode would be difficult to determine experimentally.Further experiments over a greater range of Fr would be valuable.
Overall, our analysis of the linear phase provides more quantitative informationthan in previous studies of the short-wave instability in the presence of stratification.Although the behaviour of weak to moderately stratified flows can be explained usingstability analysis results for unstratified flow, this is not the case for the stronglystratified flow. In general, a linear stability analysis is required to obtain accurateestimates of the growth rates and axial wavelengths of the fastest growing short-waveinstabilities in stratified conditions. This requires an analysis of the type developed byBillant et al. (1999) and Sipp & Jacquin (2003), but generalized to include the effectsof stratification. Such an analysis would have to account for the time-varying effects ofboth viscous diffusion, which acts to increase the size of the vortex radii and damp theperturbation growth rates, and stratification, which decreases the separation distancethereby amplifying growth rates and may also decrease the vortex radii. In this case,the reduction in vortex radii represents a combined effect of viscosity and stratification.
In the nonlinear phase of evolution, the early stages of development in unstratifiedand weak to moderately stratified flows are controlled by the distinct geometry ofthe short-wave instability. The phase relationship of the initial deformation resultsin periodic extraction of outer-layer fluid from one vortex into the other at theleading edge of the vortex pair. This initiates the vortex breakdown process in theunstratified flow. The azimuthal vorticity in the outer layers of the primary vorticesare amplified owing to the extensional strain at the leading stagnation point andtransverse secondary vortex structures are formed.
In weak to moderately stratified flows (∞ >Fr 2), although buoyancy effectsdo not significantly alter the nature of the linear phase, they can dominate in thenonlinear and late stages of evolution. In these flows, vortex decay is enhanced owingto additional mechanisms not present in unstratified flow. The effects of baroclinictorque result in the amplification of azimuthal vorticity in between the primary vorticesleading to the formation of vertical vortex structures. These structures provide anadditional mechanism of fluid exchange in the transverse direction. Detrainment of theprimary vortices by the generated baroclinic torque also contributes to the breakdownof the vortices. These additional mechanisms lead to a more rapid breakdown anddecay of vortex pair.
In the case of strong stratification (Fr= 1), the significant reduction in vortex separa-tion along with detrainment, results in an accelerated decay of the primary vortices.Late-time evolution is dominated by the successive generation of alternate signedbaroclinic torque which results in an oscillation of the total flow circulation at thebuoyancy frequency.
The authors would like to acknowledge Julie Vanderhoff and Laura Brandt for theirassistance with the numerical simulations. We also thank Professor Stefan LlewellynSmith, Don Delisi and Bob Robins for helpful comments.

Short-wavelength instability and decay of a vortex pair 321
REFERENCES
Billant, P., Brancher, P. & Chomaz, J. 1999 Three-dimensional stability of a vortex pair. Phys.Fluids 11, 2069–2077.
Crow, S. C. 1970 Stability theory for a pair of trailing vortices. AIAA J. 8, 2172–2179.
Crow, S. C. 1974 Motion of a vortex pair in a stably stratified fluid. Poseidon Research Report 1,Santa Monica, CA, pp. 1–48.
Delisi, D., Greene, G., Robins, R., Vicroy, D. & Wang, F. 2003 Aircraft wake vortex core sizemeasurements. 21st AIAA Applied Aerodynamics Conference, Orlando, Florida , AIAA-2003-3811.
Delisi, D. P. & Robins, R. E. 2000 Short-scale instabilities in trailing wake vortices in a stratifiedfluid. AIAA J. 38, 1916–1923.
Diamessis, P. J. & Nomura, K. K. 2000 Interaction of vorticity, rate-of-strain and scalar gradientin stratified homogeneous sheared turbulence. Phys. Fluids 12, 1166–88.
Diamessis, P. J. & Nomura, K. K. 2004 The structure and dynamics of overturns in stably stratifiedhomogeneous turbulence. J. Fluid Mech. 499, 197–229.
Eloy, E. & Le Dizes, S. 1999 Three-dimensional instability of Burgers and Lamb–Oseen vorticesin a strain field. J. Fluid Mech. 378, 145–166.
Garten, J. F., Arendt, S., Fritts, D. C. & Werne, J. 1998 Dynamics of counter-rotating vortexpairs in stratified and sheared environments. J. Fluid Mech. 361, 189–236.
Garten, J. F., Werne, J., Fritts, D. C. & Arendt, S. 2001 Direct numerical simulations of theCrow instability and subsequent vortex reconnection in a stratified fluid. J. Fluid Mech. 426,1–45.
Gerz, T., Schumann, U. & Elghobashi, S. 1989 Direct simulation of stably stratified homogeneousturbulent shear flows. J. Fluid Mech. 200, 563–594.
Han, J., Lin, Y.-L., Schowalter, D., Arya, S. & Proctor, F. 2000 Large eddy simulation of aircraftwake vortices within homogeneous turbulence: Crow instability. J. Aircraft 38, 292–300.
Holzapfel, F. 2004 Adjustment of subgrid-scale parametrizations to strong streamline curvature.AIAA J. 42, 1369–1377.
Holzapfel, F. & Gerz, T. 1999 Two-dimensional wake vortex physics in the stably stratifiedatmosphere. Aerosp. Sci. Technol. 5, 261–270.
Holzapfel, F., Gerz, T. & Baumann, R. 2001 The turbulent decay of trailing vortex pairs in stablystratified environments. Aerosp. Sci. Technol. 5, 95–108.
Jimenez, J., Wray, A. A., Saffman, P. G. & Rogallo, R. S. 1993 The structure of intense vorticityin isotropic turbulence. J. Fluid Mech. 255, 65–90.
Laporte, F. & Corjon, A. 2000 Direct numerical simulations of the elliptic instability of a vortexpair. Phys. Fluids 12, 1016–1031.
Laporte, F. & Leweke, T. 2002 Elliptic instability of counter-rotating vortices: experiment anddirect numerical simulations. AIAA J. 40, 2843–2494.
Leweke, T. & Williamson, C. H. K. 1998a Cooperative elliptic instability of a vortex pair. J. FluidMech. 360, 85–119.
Leweke, T. & Williamson, C. H. K. 1998b Long-wavelength instability and reconnection ofa vortex pair. In Proceedings of the IUTAM Symposium on Dynamics of Slender Vortices ,pp. 225–234. Kluwer.
Mahoney, D. 2002 A numerical study of the effects of stratification on the short wave instabilityin a vortex pair. MS thesis, University of California, San Diego.
Meng, J. C. S. & Rottman, J. W. 1988 Linear internal waves generated by density and velocityperturbations in a linearly stratified fluid. J. Fluid Mech. 186, 419–444.
Nomura, K. K. & Post, G. K. 1998 The structure and dynamics of vorticity and rate of strain inincompressible homogeneous turbulence. J. Fluid Mech. 377, 65–97.
Orlandi, P., Carnevale, G. F., Lele, S. K. & Shariff, K. 1998 DNS study of stability oftrailing vortices. In Proceedings of the Summer Program 1998, Center for Turbulence Research ,pp. 187–208.
Robins, R. E. & Delisi, D. P. 1998 Numerical simulations of three-dimensional trailing vortexevolution in stratified fluid. AIAA J. 36, 981–985.
Saffman, P. G. 1972 The motion of a vortex pair in a stratified atmosphere. SIAM L1, 2, 107–119.

322 K. K. Nomura, H. Tsutsui, D. Mahoney and J. W. Rottman
Sarpkaya, T. 1983 Trailing vortices in homogeneous and density-stratified media. J. Fluid Mech.136, 85–109.
Sarpkaya, T. & Suthon, P. 1991 Interaction of a vortex couple with a free surface. Exps. Fluids 11,205–217.
Scorer, R. S. & Davenport, L. J. 1970 Contrails and aircraft downwash. J. Fluid Mech. 43, 451–464.
She, Z.-S., Jackson, E. & Orszag, S. A. 1991 Structure and dynamics of homogeneous turbulence:models and simulations. Proc. R. Soc. Lond. A 434, 101–124.
Sipp, D. & Jacquin, L. 2003 Widnall instabilities in vortex pairs. Phys. Fluids 15, 1861–1874.
Spalart, P. R. 1996 On the motion of laminar wing wakes in a stratified fluid. J. Fluid Mech. 327,139–160.
Spalart, P. R. 1998 Airplane trailing vortices. Annu. Rev. Fluid Mech. 30, 107–138.
Switzer, G. & Proctor, F. 2000 Numerical study of wake vortex behavior in turbulent domainswith ambient stratification. 38th Aerospace Sciences Meeting & Exhibit, Reno, NV , AIAA2000-0755.
Thomas, P. J. & Auerbach, D. 1994 The observation of the simultaneous development of a long-and a short-wave instability mode on a vortex pair. J. Fluid Mech. 265, 289–302.
Tsai, C.-Y. & Widnall, S. E. 1976 The stability of short waves on a straight vortex filament in aweak externally imposed strain field. J. Fluid Mech. 73, 721–733.
Tsutsui, H. 2003 Evolution of a counter-rotating vortex pair in a stably stratified fluid. MS thesis,University of California, San Diego.
Waleffe, F. 1990 On the three-dimensional instability of strained vortices. Phys. Fluids A 2, 76–80.