Embed Size (px)
Citation preview

2012 Cambridge Business & Economics Conference ISBN : 9780974211428
Should Companies Increase Size or Improve their CSR Profile in order to Improve their
Performance?
Evidence from UK listed Firms
Iordanis Kalaitzoglou
Coventry University, Business School, Priory Street, Coventry CV1 5FB
e-mail: [email protected], Tel: (+)44 (24) 7688 8418
Lanre Fagbe
Coventry University, Business School, Priory Street, Coventry CV1 5FB
e-mail: [email protected]
Jacek Niklewski
Coventry University, Business School, Priory Street, Coventry CV1 5FB
e-mail: [email protected], Tel: (+)44 (24) 7688 7187
June 27-28, 2012Cambridge, UK 1

2012 Cambridge Business & Economics Conference ISBN : 9780974211428
Should Companies Increase Size or Improve their CSR Profile in order to Improve their
Performance?
Evidence from UK listed Firms
ABSTRACT
This study proposes an empirical model to investigate the inter-relations among Corporate
Social Responsibility (CSR), Corporate Financial Performance (CFP) and size, while
accounting for liquidity and exposure to financial default risk. The analytical focus lies on
potential endogeneity issues, which are investigated employing a system of equations,
estimated using the Generalized Method of Moments (GMM) technique. A non-industry-
specific sample is employed, consisting of 233 companies included in FTSE 250, from 2003 to
2010. In addition, a broad measure of CSR is employed to allow for generalization. The main
findings strongly indicate that UK market is sensitive to firms’ social profiles, which are found
to be endogenous related to both size and performance. CSR is asymmetrically related to
performance, where excessive or no investment in CSR are the most rewarding financially.
Larger and more profitable companies are more likely to invest in CSR, which in turns
contributes to further to both, probably due to increased visibility. Finally, higher borrowing
improves the financial profile, the size and the profitability of the companies in the pre-crisis
period, while it has a rather decreasing impact in the post-crisis period.
Key words: Corporate Social Responsibility (CSR), Corporate Financial Performance (CFP),
Generalized Method of Moments (GMM), Endogeneity, Simultaneous Equations.
June 27-28, 2012Cambridge, UK 2

2012 Cambridge Business & Economics Conference ISBN : 9780974211428
1. INTRODUCTION
After the introduction of Corporate Social Responsibility (CSR) scheme in 2000 and its
disclosure requirement, the impact of corporate profile on the value of listed companies is
undeniable.i A positively regarded company, at least compared to its competitors, significantly
increases its intangible assets. Cohen et al. (2011) emphasizes the importance of non-financial
information on the long term. However, this definitely comes at a cost, either in the form of
excessive liabilities or as a decrease in other assets. In addition, the funds required to create and
sustain a socially responsible corporate profile are deprived from other investments that could
create economic value. Therefore, the question that arises naturally in the literature (Barney
(1991) & Barney et al. (2001) & Bragdon and Marlin (1972) & Moskowitz (1972) & Vance
(1975)) is whether the value of these intangible assets is marginally higher than the marginal cost
of their acquisition in the form of opportunity costs in order to enhance performance and create
value.
Naturally, the interest has focused on the sign and the direction of the relationship between CSR
and performance.ii Several studies have empirically tested this relationship, providing conflicting
results, both in terms of the sign and direction of causality, as well as in terms of market stylized
facts. A significant branch of literature (Anderson and Frankle (1980) & Belkaoui (1976) &
Bowman (1978) & Fry and Hock (1976) & Preston (1978)) reports that CSR has a positive
impact on performance. According to Solomon and Hanson (1985), the cost of CSR is
outweighed by the benefit from employee morale and productivity. On the contrary, several
studies (Aupperle et al. (1985) & Freedman and Jaggi (1982) & Ingram and Frazier (1980))
argue that the marginal costs associated with CSR are higher than the benefits and therefore
reduce firm’s performance.
June 27-28, 2012Cambridge, UK 3

2012 Cambridge Business & Economics Conference ISBN : 9780974211428
Brammer and Millington (2008) maintain that these contradictions arise because of a non linear
relationship. They purport that the positive association between CSR and performance follows
diminishing and decreasing returns. Consequently, if the scope of social responsibility
participation strays beyond the management in addressing the social concerns (e.g., with little or
no impact with relation to stakeholders of the firm), the net effect is declining financial
performance. They also argue that the correlation between CSR and performance is highest at the
extremes, showing that financial performance is high at both very high and very low CSR levels.
This is consistent with Porter (1980) who supports that low cost or differentiated strategies
outperform mediocre approaches, as well as with Bhattacharya and Sen (2004) who show that
price sensitive customers are not ready to pay the higher prices of more socially active
responsible firms. However, these studies, although they partially explain variations in CSR-
performance relationship, they do not examine potential endogeneity issues.
Bragdon and Marlin (1972) Bowman and Haire (1975) and Heinz (1976) report that companies
with higher performance invest more in CSR. More precisely, Bowman and Haire (1975)
maintain that the U-shaped relationship holds on the opposite direction as well. However, their
results are industry specific and they focus only on particular aspects of CSR, such as pollution
or environmental index.iii According to Dean (1998) and Waddock and Graves (1997) there are
two main approaches in describing the direction of causality between CSR and CFP.iv The slack
resource hypothesis states that a company ought to maintain and sustain its financial
performance first, before thinking of engaging into social responsibilities. The good management
hypothesis supports that a company that is perceived to have good reputation and better
association with its non financial stakeholders will find it easier to perform well. This is
confirmed by Jackson and Apostolakou (2010) who show that CSR is now used as a strategic
June 27-28, 2012Cambridge, UK 4

2012 Cambridge Business & Economics Conference ISBN : 9780974211428
tool to boost performance in Western Europe. This argument focuses on a marketing perspective,
considering CSR as an intangible asset that impacts and enhances performance (Hillman and
Keim (2001) & Orlitzky et al., (2003)). Surroca et al. (2010) provide evidence of endogeneity
between CSR and performance, but it is rather direct through intangible assets of innovation,
human capital, reputation and culture. This is a key idea further examined in this paper. In
contrast, Makni et al. (2009) provide evidence of no significant association. Waddock and
Graves (1997) maintain that financial performance and CSR are synergetic and that their inter-
relation is rather an empirical issue.
Another branch of literature focuses on the relation between size and CSR. Chih et al., (2010)
purports that firms with larger size tend to invest more in CSR, especially where there is an
intrinsic value that increases their competitive advantage. Dierkes and Coppock (1978), Fombrun
and Shanley (1990), Trotman and Bradley (1981) provide evidence of positive relationship
between size and CSR, corporate reputation index. Watts and Zimmerman (1986) postulate that
large firms are likely to be more affected by CSR performance impacts due to increased
visibility. Adams et al. (1998), Clarke and Gibson-Sweet (1999), Gray et al. (1995) and Ness and
Mirza (1991) argue that size related costs reduce by CSR disclosure, or that CSR disclosure is
the outcome of increased social pressure (Aguilera et al. 2007). In addition, Orlitzky (2001)
investigates whether companies that embrace CSR increase in size, suggesting an endogenous
relationship between size, performance and CSR. In contrast, Stanwick and Stanwick (1998)
maintain that size is exogenous to both CSR and performance. Furthermore, Artiach et al. (2010)
investigate whether leverage is related to CSR and report that firms will prioritize financial
stakeholder claims over social stakeholders. Therefore, highly leveraged firms should be less
likely to improve their CSR profiles, even though it would further decrease their tax liability.
June 27-28, 2012Cambridge, UK 5

2012 Cambridge Business & Economics Conference ISBN : 9780974211428
Most of the studies have been industry specific and that has also contributed to the
inconsistencies in the relationship between corporate social responsibility and performance
(Rowley and Berman (2000)). Empirical studies (e.g., Gray et al. (1995), (2001) & Hackston and
Milne (1996)) have shown that CSR disclosure activism varies across companies, industries, and
time. CSR is determined by the industry and firm characteristics (Reverte (2009)), while firms
operating in the same industry develop common practices. In addition, Higgins and Currie
(2004) argue that corporate social responsibility can be driven by ethical and legal matters that
cannot be accurately measured.v Chih et al. (2010) and Margolis and Walsh (2003) suggest a
parsimonious and an extended model, respectively. They provide contradicting results,
confirming Ullmann (1985), who suggests that the relationship between CSR and performance of
the firm is so complex and there is currently no true model that exhibits this relationship.
Consequently, this study does not aim at an exhaustive investigation of the concept of CSR and
its impact on financial performance. The analytical focus lies on the empirical investigation of
the inter-relations between CSR, financial performance and size, on a non-industry-specific
setting, defining CSR multi-dimensionally.vi In more detail, an empirical model of simultaneous
equations is proposed, to empirically examine a non-asymmetric impact of CSR on performance.
An endogenous relationship between CSR and performance is also investigated, taking into
account variant effects due to size of the company. The sample selected, consists of 233
companies, included in FTSE 250 from 2003 till 2010. This constitutes a non-industry-specific
setting that allows for generalization. Finally, a wider measure of CSR is employed in order to
avoid sector-bias.
The findings strongly indicate that UK market is sensitive to companies’ social profiles, to cost
efficiency, and that CSR activities, performance and size are endogenously related. Companies
June 27-28, 2012Cambridge, UK 6

2012 Cambridge Business & Economics Conference ISBN : 9780974211428
that are highly ranked in CSR index and companies that do not embrace CSR policies,
consistently perform better than companies that are in between. This is further enhanced when
companies are already performing well, probably because their liquidity allows them to invest
more in CSR activities. In addition, large companies are found to invest more in CSR and they
further increase their size because of a positive CSR impact. Large companies enjoy higher
visibility and they are found to be more influenced by their social profiles. Finally, higher
exposure to default risk seems to have a negative impact on CSR investments and consequently
on profitability. Excessive borrowing, prioritize financial stakeholders’ needs over social
stakeholders’ interests, and this seems to be a crucial factor in the UK, which is found to be
socially sensitive market.
The remainder of this paper is organized as follows. The following section presents the data
collection process and the methodology employed. Empirical findings are discussed in Section 3,
while Section 4 concludes.
2. METHODOLOGY
2.1. Data
The aim of this study is to investigate the relationship between CSR, performance, size and
leverage in UK companies. According to the literature, these inter-relations are more profound in
large companies, due to increased visibility. Therefore, the sample employed, consist of all
companies included in the FTSE 250 in the years from 2003 to 2010, subjected to availability of
data and continuity of operation. The data set consist of 1762 observations. The variables under
investigation are Return on Equity, Total Assets, liquidity, Debt to equity ratio and the CSR
ranking on annual basis.vii
June 27-28, 2012Cambridge, UK 7

2012 Cambridge Business & Economics Conference ISBN : 9780974211428
2.2. Model
Foundations of the model
Literature poses five key issues that are relevant to this study. First, the impact of CSR on CFP is
extensively investigated, and empirical evidence suggests that the importance depends on
country specific factors (see inter alia, Anderson and Frankle (1980) & Belkaoui (1976) &
Bowman (1978) & Fry and Hock (1976) & Preston (1978)). Second, CSR might asymmetrically
affect CFP (Bowman and Haire (1975)). Profitability is higher in cost efficient companies that do
not invest in CSR activity, or in companies that score high in CSR indexes. In contrast, a
mediocre approach seems is rather ineffective. Third, there is no clear indication on the direction
of the relation, which again is found to be sample depended (Surroca et al. (2010)). Fourth, the
impact of size on CSR and the direction of their relationship is not extensively incorporated and
has not yet been studied simultaneously (Chih et al. (2010)). Finally, the relationship between
financial exposure (i.e., excessive lending) should further be investigated (Artiach et al. (2010)).
The model below, proposes an easy and flexible way to investigate the above issues. It provides
the framework for an empirical investigation of the sign, the direction and the inter-relation of
key variables related to CSR. It can also be further extended by introducing other factors that
affect each individual relationship, or factors that might be endogenously related. In addition, it
can be applied in different settings, either more specific (e.g., industry, sector, country), or more
general (e.g., comparison between sectors, countries).
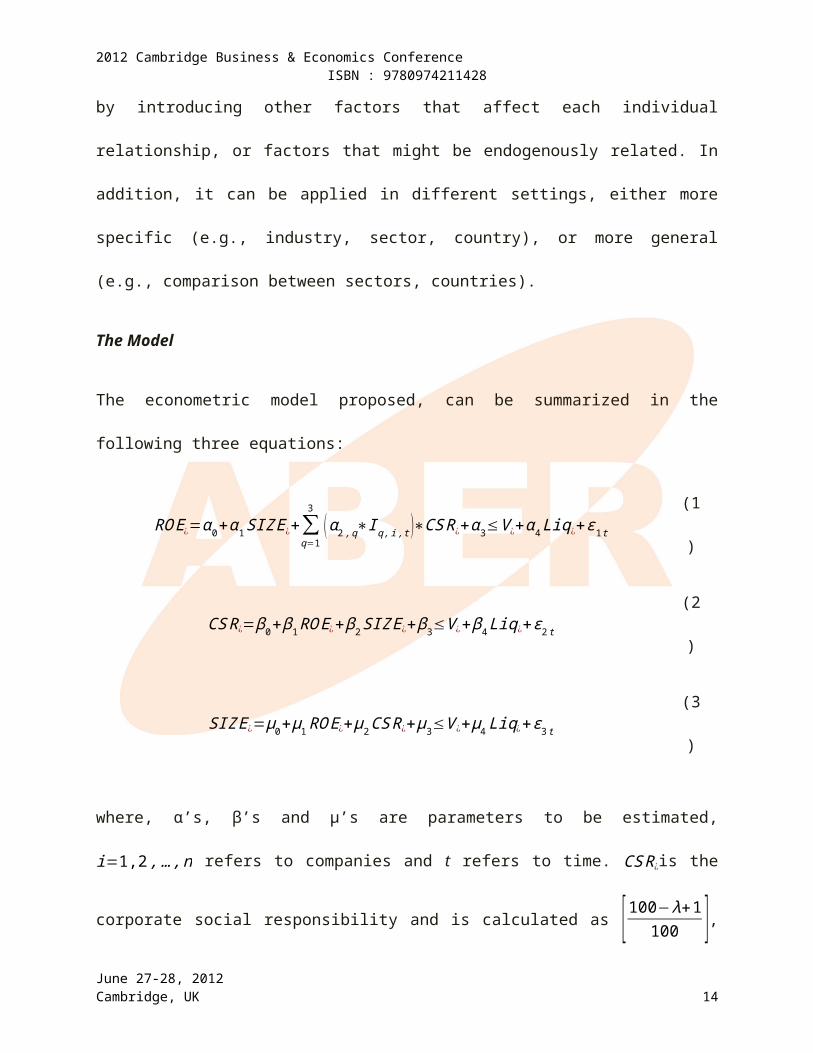
The Model
The econometric model proposed, can be summarized in the following three equations:
June 27-28, 2012Cambridge, UK 8

2012 Cambridge Business & Economics Conference ISBN : 9780974211428
RO E ¿=α0+α 1 SIZ E¿+∑q=1
3
( α2 , q∗I q , i ,t )∗CS R¿+α3≤V ¿+α 4 Liq¿+ε1 t (1)
CS R¿=β0+ β1 RO E¿+ β2 SIZ E ¿+β3≤V ¿+β4 Liq¿+ε2 t (2)
SIZ E¿=μ0+μ1 RO E¿+μ2CS R¿+μ3≤V ¿+μ4 Liq¿+ε3 t (3)
where, α’s, β’s and μ’s are parameters to be estimated, i=1,2 , …, n refers to companies and t
refers to time. CS R¿is the corporate social responsibility and is calculated as [100−λ+1100 ], where
λ is the rank number for the i-th firm at time t.viii RO E ¿ is the return on equity, computed as net
income over total equity, SIZ E¿ is the natural logarithm of total assets, Liq¿ is liquidity,
measured as total assets turnover and ¿V ¿ is leverage, measured by the Debt to Equity ratio, for
firm i and at time t. ε p ,t p=1,2,3 is the error term. Then I is a dummy variable that differentiates
the level of CSR engagement and q=1,2,3
I 1 ,i ,t={1 w h enCSRi ,t=00 elsew h ere
(4)
I 2 ,i ,t={1 w hen0<CSRi ,t ≤ 50 %0 elsew h ere
(5)
I 3 ,i ,t={1 w hen CSRi ,t>50 %0 elsew here
(6)
This model examines the following issues. First, Eq. (1) investigates a potential asymmetric
impact of CSR on performance. Coefficient α 2,1 captures the impact of non CSR policies on
performance. A positive estimated would indicate that companies that do not engage on CSR
policies perform better because of decreased costs. Coefficient α 2,2 captures the impact of CSR
June 27-28, 2012Cambridge, UK 9

2012 Cambridge Business & Economics Conference ISBN : 9780974211428
on CFP when companies embrace CSR practices, but it is not central to their financial
management. A negative coefficient would indicate negative relation to CFP. Coefficient α 2,3
captures the impact of CSR on CFP when the social profile is a main strategic objective for the
company. In Eq. (1) and Eq.(2) Coefficients α 2 ,q and β1 investigate whether there is any
endogenous relationship between CSR and CFP. Coefficients β2 and β3 capture the impact of
Size and Leverage on CSR. Eq. (3) examines potential endogeneity among CSR, CFP and Size,
captured in coefficients μ1 and μ2.
The method chosen for estimation is the Generalized Method of Moments (GMM). In this
method, the selection of appropriate orthogonality conditions is essential. ix
3. EMPIRICAL RESULTS
Section 3 presents the empirical findings. Section 3.1 in particular focuses on non-parametric
analysis, while section 3.2 discusses the estimation results.
3.1. Non Parametric Analysis
UK is leading the initiative of incorporating CSR into strategic planning of the company, in order
to increase the value of intangible assets. The contribution of the country to the total CSR
activities is increasing over the years.
-----------------------------Figure 1: about here
-----------------------------
Figure 1 presents the number of FTSE 250 companies that are included in the BITC index among
the best 100 companies in terms of CSR policies. The number of UK companies that are
included constantly (e.g., from 83 companies in 2003 to 91 companies in 2010) increases and it
June 27-28, 2012Cambridge, UK 10
2012 Cambridge Business & Economics Conference ISBN : 9780974211428
dominates the list. This high figure is an initial indication that UK is a sensitive market towards
corporate social profile. In addition, intangible assets appear to be an important part of corporate
investments and that social responsibility is an integral part of financial management strategy.
-----------------------------Figure 2: about here
-----------------------------
Figure 2 shows the best performing sectors in the UK in terms of CSR. The individual bars
reveal that the best performing sectors are the Energy, Financial Services, Oil and gas and Real
estate, with a 13%, 13%, 8% and 8% respectively. Furthermore, this figure shows that companies
that are negatively regarded, due to various reasons, they try to compensate the negative impact
with socially responsible policies. This is better shown in Figure 3.
-----------------------------Figure 3: about here
-----------------------------
Figure 3 dissects the CSR performance of each sector into Community, Environment,
Marketplace and Workplace activities. It is becoming obvious that each sector invests on
improving its negatively regarded side, or to enhance its competitive advantage. For example, the
Energy and the Mining sectors perform really well in Environment and Community. This way
these companies probably try to improve their profile towards their major drawback, which is
their environmental impact. In contrast, General retailers invest more on improving their
network. They try to improve on the Community and Marketplace aspects of their activity. That
could improve an aspect of their corporate activity that they already perform well.
-----------------------------Table 1: about here
-----------------------------
-----------------------------
June 27-28, 2012Cambridge, UK 11

2012 Cambridge Business & Economics Conference ISBN : 9780974211428
Table 2: about here-----------------------------
Furthermore, Table 1 and Table 2 report the basic descriptive statistics and the correlation of the
variables employed in this study, respectively. In more detail Table 1 presents the median, the
standard deviation, the mean, the quartiles and the minimum and maximum values of each
variable over the years 2003-2008. One of the most profound results is that ROE consistently
increases over the years, with an exemption of 2008 and 2009, when the collapse of Lehman
Brothers triggered the current financial crisis. The average value is 18.69% in 2003 and it
reaches 30.37% in 2010. However, this increase is followed by an increase (e.g., 54.50 in 2003
and 90.03 in 2010) in standard deviation as well. ROE appears to be over-dispersed (standard
deviation is larger than the mean), and this effect worsens in 2008 (standard deviation is 84.51,
compared to a mean of 9.34%).
D/E ratio appears to be over-dispersed as well, and this becomes more obvious after 2008. The
average value significantly increases over the years, especially after 2008. Given that financial
institutions have been more reluctant to lend, this increase has probably been caused by a shrink
of equity capital. Total assets consistently increase over the years and, similar to all other
variables, standard deviation is larger than the mean (e.g., mean £860,614 and std £1,058,515 in
2003 and mean £2,064,216 and std £7,977,155 in 2010). In contrast, Liquidity decreases over the
years, especially after 2008, while volatility does not significantly change (e.g., mean 1.92 std
5.58 in 2003 and mean 1.80 std 3.16 in 2010). Table 3 fails to report a significant correlation
(i.e., in a degree that would cause multicollinearity problems) between the variables employed.
June 27-28, 2012Cambridge, UK 12

2012 Cambridge Business & Economics Conference ISBN : 9780974211428
3.2. Estimation Results
-----------------------------Table 3: about here
-----------------------------
Finally, Table 3 presents the estimation results for the simultaneous equations model in Eqs (1),
(2) and (3). The first panel reports the estimates, along with the associated t-statistics. The
bottom panel reports the Adj.-R2 and the J-stats, along with the associated p-values.
The estimates of Eq. (1), presented in the first column, reveal that CSR, Leverage and Liquidity
have a significant impact on performance, while size fails to provide statistically significant
results. In more detail, CSR appears to have an asymmetric effect on performance, similar to
Bhattacharya and Sen (2004), Bowman and Haire (1975) and Brammer and Millington (2008).
CSR appears to have a positive impact on performance when companies embrace social
responsibility in their core strategies (0.3548, (3.92)) and when they ignore it (0.8357, (4.78)). A
mediocre approach seems to have a negative (-0.1785), marginally significant (-1.97) impact on
CFP. In addition, High D/E ratios seem to have a negative (-0.0692, (-4.08)) impact on
performance. However, that can be compensated if they lead to higher liquidity, which is found
to positively (0.0673, (2.54)) affect performance.
The second column reports the estimates of Eq. (2). A profound finding here is the bidirectional
relationship between CSR and CFP, which is consistent with Surroca et al. (2010). Coefficient β1
is positive (0.6636) and statistically significant (4.59). This means that, not only CSR increases
CFP but, performance has a positive influence on CSR. Similar to Bowman and Haire (1975),
Bragdon and Marlin (1972) and Heinz (1976) the investment in CSR depends on the profitability
levels of the company. Firms that generate more cash can afford higher investments in CSR. This
June 27-28, 2012Cambridge, UK 13
2012 Cambridge Business & Economics Conference ISBN : 9780974211428
is consistent with Liquidity as well. An estimate of 0.7868 (2.73) shows that higher liquidity
provides more opportunities for further investments in CSR. According to the findings from Eq.
(1), this results in better performance. Consequently, liquidity is found to have an direct (Eq.
(1)), as well as an indirect (Eq. (2)) positive impact on performance.
In addition, larger firms tend to invest more in CSR. The positive estimate of 0.0566 (3.40)
shows that companies with higher total assets, consistently perform better in CSR and the score
higher in the comparative analysis. This is consistent with Chih et al. (2010), Dierkes and
Coppock (1978), Fombrun and Shanley (1990) and Trotman and Bradley (1981), who provide
evidence of positive relation and opposes to Stanwick and Stanwick (1998). However,
considering the empirical findings in Eq. (1), large companies invest more in CSR and this
increased investment further increases their profitability. Consequently, Size has an indirect
positive impact on performance, although no direct impact can be identified. This finding is to be
expected, since large companies have increased visibility, and according to Watts and
Zimmerman (1986) are affected more by CSR. Therefore, they need to actively improve their
social profile.
A closer inspection of Table 3, and especially on the third column, where the estimation results
for Eq. (3) are presented, reveals an endogenous relationship of Size with CSR and performance.
Similar to Orlitzky (2001), both CFP (0.4956, (5.13)) and CSR (4.22, (6.91)) are found to
increase the size of the company, but as Eq. (2) shows, size directly increases CSR and indirectly
CFP. This adds to Ullmann (1985) who argues that the relation between CSR and performance is
complex and it is rather an empirical issue. Consequently, large companies are more likely to
invest in CSR. This investment increases performance, which increases the size of the firm (CSR
increases Size both directly and indirectly through CFP). This way, firms that improve their
June 27-28, 2012Cambridge, UK 14

2012 Cambridge Business & Economics Conference ISBN : 9780974211428
social profile, seem to create an intangible asset that increases the value of the company. This is
a strong indication of increased sensitivity of the market towards CSR.
However, that does not appear to hold when the firm is heavily financed using external
financing. Excessive borrowing seems to have a negative influence on both financial
performance and CSR (-0.0213, (-2.83)). In consistence with Artiach et al. (2010) highly
leveraged firms should be less likely to improve their CSR profiles, even though it would further
decrease their tax liability. According to Pecking Order theory financial shareholders’ needs are
prioritized over social stakeholders’ interests. Consequently, excessive borrowing will decrease
the value of intangible assets and CFP and indirectly the size of the company.
Table 4 provides a further insight on the previous findings. The first panel reports the estimates
of the models for the period 2003-2007, which corresponds to the pre-crisis period. The second
panel reports the estimates for the post-crisis period, i.e. 2008-2010. One of the most profound
findings is the reverse relation among leverage, size and profitability before and after the
financial crisis following the collapse of Lehman Brothers in October 2008. A positive estimate
(0.0124 (2.05)) shows that size has an increasing impact on profitability before 2008, revealing
that larger companies could return higher profits to their shareholders. It appears that this was
backed up by higher D/E ratios, since leverage seems to have an increasing effect on profitability
(0.0161 (2.13)) and on size (0.0149 (2.85)). Companies appear to keep higher borrowing levels,
which assists them in increasing their size and their profitability. On the contrary, in the period
after 2008, leverage has a reverse impact. Companies that maintain higher D/E ratios appear to
have lower profitability (-0.0772 (-4.11)), probably because of higher default risk. Although
more profitable companies increase (0.4890 (4.99)) in size, larger companies do not appear to be
more profitable.
June 27-28, 2012Cambridge, UK 15

2012 Cambridge Business & Economics Conference ISBN : 9780974211428
CSR policies appear to be affected as well. Following previous findings, before 2008, larger
(0.1051 (3.49)), more profitable (0.8076 (5.49)) companies invest more in CSR activities,
especially when they maintain high liquidity ratios (0.7764 (2.77)). Leverage further encourages
(0.0012 (2.03)) improvements in CSR profiles, which in turn have a significant, positive impact
on size (4.77 (7.01)). Furthermore, the impact of CSR on performance appears to be non-linear
and companies with significant resources invested in CSR appear to be significantly more
profitable (0.6134 (4.17)). In contrast, companies with little or no engagement perform better
(0.6315 (2.88)) than companies with mediocre policies (-0.1707 (-1.84)). In the period following
the financial crisis, this relation weakens. Profitability is improved by significant CSR
investments, but the impact is considerably smaller (0.2745 (2.45)). Companies with high D/E
ratios reduce their investments in CSR (-0.1017 (-2.89)), probably due to higher financial
distress, while companies that base their operations in high Assets Turnover, such as retailers,
invest more (0.8011 (2.74), compared to 0.7764 (2.77)). Large (0.0531 (2.40)) and more
profitable (0.3963 (3.19)) companies continue to invest in CSR activities, but their engagement
seems to be constraint by higher financial costs. In contrast, companies that are not engaged in
CSR activities appear to significantly outperform (0.8736 (5.02)) their counterparts, probably
due to more cost efficient operations. However, higher investments in CSR still increases the size
of operations (2.9500 (4.44)), but not as much as it used to before 2008.
4. CONCLUSION
This study focuses on the potentially endogenous relationship among CSR, financial
performance and Size, on a general setting that includes companies from FTSE 250 for a period
of 8 years (i.e., 2003-2010). A broad measure of CSR is used to account for all major aspects of
social profiles. Further, the inter-relations are investigated using a system of equations that are
June 27-28, 2012Cambridge, UK 16

2012 Cambridge Business & Economics Conference ISBN : 9780974211428
estimated using the Generalized Method of Moments (GMM) method. This way the model
addresses the following issues. First, the impact of CSR on CFP is examined. Second, the
direction of the relationship (if any) is investigated. Third, the model accounts for size, which is
allowed to endogenously affect both CSR and CFP. Finally, the impact of excessive borrowing
on performance, CSR and Size is taken into account. The proposed model, suggests an easy and
flexible way to investigate the above issues. It provides the framework for an empirical
investigation of the sign, the direction and the inter-relation of key variables related to CSR. It
can also be further extended by introducing other factors that affect each individual relationship,
or factors that might be endogenously related. In addition, it can be applied in different settings,
either more specific (e.g., industry, sector, country), or more general (e.g., comparison between
sectors, countries).
The most profound finding is that UK market is very sensitive to CSR activities. Listed
companies appear to be exposed to public and slight changes in their social profiles can
significantly affect their performance and size, by creating or diminishing the value of intangible
assets. In more detail large, profitable companies are more likely to invest in CSR activities,
probably due to increased visibility, especially before the financial crisis in 2008. This
investment increases significantly financial performance and size, indicating that these figures
are endogenously related. This is a strong indication of market sensitivity towards CSR. This
sensitivity decreases in the post-crisis period, but it is still present. In contrast, companies that do
not engage in CSR activities seem to be more cost efficient and thus more profitable. This
relation is stronger in the post-crisis period. Mediocre policies appear to be rather insignificant
and negative. Finally, excessive borrowing is found to increase size, investment in CSR and
June 27-28, 2012Cambridge, UK 17
2012 Cambridge Business & Economics Conference ISBN : 9780974211428
performance before 2008, but it negatively affects investments in CSR and performance in the
post crisis period. This indirectly results in size limitations, even if it reduces tax liabilities.
June 27-28, 2012Cambridge, UK 18

2012 Cambridge Business & Economics Conference ISBN : 9780974211428
REFERENCES
Adams, C. A., & Hill, W. Y., & Roberts, C. B. (1998). Corporate social reporting practices in Western Europe: Legitimating corporate behaviour. The British Accounting Review, 30(1), 1-21.
Aguilera, R., & Rupp, D., & Williams, C., & Ganapathi, J. (2007). Putting the s back in corporate social responsibility: A multilevel theory of social change in organizations. Academy of Management Review, 32(3), 836-863.
Allouche, J., & Laroche, P. (2005). A meta-analytical investigation of the relationship between corporate social and financial performance. Revue de Gestion des Resources Humaines, 57, 18-41.
Anderson, J. G., & Frankle, A. W. (1980). Voluntary social reporting: An iso-beta portfolio analysis. Accounting Review, 55(3), 468-479.
Artiach, T., & Lee, D., & Nelson, D., & Walker, J. (2010). The determinants of corporate sustainability performance. Accounting and Finance, 50(1), 31-51.
Aupperle, K. E., & Carroll, A. B., & Hatfield, J. D. (1985). An empirical examination of the relationship between corporate social responsibility and profitability. Academy of Management Journal, 28(2), 446-463.
Barney, J. (1991). Firm resources and sustained competitive advantage. Journal of Management, 17(1), 99-120.
Barney, J. B., & Wright, M., & Ketchen Jr., D. J. (2001). The resource-based view of the firm: Ten years after 1991. Journal of Management, 27(6), 625-641.
Belkaoui, A. (1976). The impact of the disclosure of the environmental effects of organizational behavior on the market. Financial Management, 5(4), 26-31.
Bhattacharya, C. B., & Sen, S. (2004). Doing better at doing good: When, why, and how consumers respond to corporate social initiatives. California Management Review, 47(1), 9-24.
Bowman, E. H. (1978). Strategy, annual reports, and alchemy. California Management Review, 20(3), 64-71.
Bowman, E. H., & Haire, M. (1975). A strategic posture toward corporate responsibility. California Management Review, 18(2), 49-58.
Bradgon, J. H., & Marlin, J. T. (1972). Is pollution profitable?. Risk Management, 19(4), 9-18.
June 27-28, 2012Cambridge, UK 19

2012 Cambridge Business & Economics Conference ISBN : 9780974211428
Brammer, S., & Millington, A. (2008). Does it pay to be different? An analysis of the relationship between corporate social and financial performance. Strategic Management Journal, 29(12), 1325-1343.
Chih, H. L., & Chih, H. H., & Chen, T. Y. (2010). On the determinants of corporate social responsibility: International evidence on the financial industry. Journal of Business Ethics, 93(1), 115-135.
Clarke, J., & Gibson-Sweet, M. (1999). The use of corporate social disclosures in the management of reputation and legitimacy: A cross sectoral analysis of UK top 100 companies. Business Ethics European Review, 8(1), 5-13.
Cohen, J., & Holder-Webb, L., & Wood, D., & Nath, L. (2011). Retail investors’ perceptions of the decision-usefulness of economic performance governance, and corporate social responsibility disclosures. Behavioural Research in Accounting, 23(1), 109-129.
Coombs, J. E., & Gilley, K. M. (2005). Stakeholder management as a predictor of CEO compensation: Main effects and interactions with financial performance. Strategic Management Journal, 26(9), 827-840.
Dean, K. L. (1988). The chicken and the egg revisited: Ties between corporate social performance and the financial bottom line. Academy of Management Executive, 2, 99–100.
Dierkes, M., & Coppock, R. (1978). Europe tries the corporate social report. Business and Society Review, 25, 21-24.
Fombrun, C., & Shanley, M. (1990). What’s in a name? Reputation building and corporate strategy. Academy of Management Journal, 33(2), 233-258.
Freedman, M., & Jaggi, B. (1982). Pollution disclosures, pollution performance and economic performance. Omega, 10(2), 167-176.
Freeman, R. E. (1984). Strategic management. A stakeholder approach. Marshfield, MA: Pitman.
Friedman, M. (1962). Capitalism and freedom. Chicago: University of Chicago Press.
Friedman, M. (1970). The social responsibility of business is to increase its profits. New York Times Magazine, September 13.
Fry, F. L., & Hock, R. J. (1976). Who claims corporate responsibility? The biggest and the worst. Business and Society Review, 18, 62-65.
Godfrey, P., & Hatch, N. (2007). Researching corporate social responsibility: An agenda for the 21st century. Journal of Business Ethics, 70(1), 87-98.
June 27-28, 2012Cambridge, UK 20

2012 Cambridge Business & Economics Conference ISBN : 9780974211428
Gray, R., & Javad, M., & Power, D. M., & Sinclair, C. D. (2001). Social and environmental disclosure and corporate characteristics: A research note and extension. Journal of Business Finance & Accounting, 28(3/4), 327–356.
Gray, R., & Kouhy, R., & Lavers, S. (1995). Corporate social and environmental reporting: A review of the literature and a longitudinal study of UK disclosure. Accounting, Auditing & Accountability Journal, 8(2), 47-77.
Griffin, J. J., & Mahon, J. F. (1997). The corporate social performance and corporate financial performance debate: Twenty-five years of incomparable research. Business & Society, 36, 5-31.
Hackston, D., & Milne, M. J. (1996). Some determinants of social and environmental disclosures in New Zealand companies. Accounting, Auditing & Accountability Journal, 9(1), 77-108.
Heinz, D. C. (1976). Financial correlates of a social measure. Akron Business Economic Review, 7(1), 48-51.
Higgins, J. M., & Currie, D. M. (2004). It’s time to rebalance the scorecard. Business and Society Review, 109(3), 297-309.
Hillman, A. J., & Keim, G. D. (2001). Shareholder value, stakeholder management and social issues: What’s the bottom line?. Strategic Management Journal, 22(2), 125-139.
Ingram, R. W., & Frazier, K. B. (1980). Environmental performance and corporate disclosure. Journal of Accounting Research, 18(2), 614-622.
Jackson, G., & Apostolakou, A. (2010). Corporate social responsibility in Western Europe: An institutional mirror or substitute?. Journal of Business Ethics, 94(3), 371-394.
Jauch, L. R, & Osborn, R. N., & Glueck, W. F. (1980). Short term financial success in large business organization: The environment-strategy connection. Strategic Management Journal, 1, 49-63.
Jones, M. T. (1999). The institutional determinants of social responsibility. Journal of Business Ethics, 20(2), 163-179.
Jones, T. M. (1995). Instrumental stakeholder theory: A synthesis of ethics and economics. Academy of Management Review, 20(2), 404-437.
Makni, R., & Francoeur, C., & Bellavance, F. (2009). Causality between corporate social performance and financial performance: Evidence from Canadian firms. Journal of Business Ethics, 89(3), 409-422.
Margolis, J. D., & Walsh, J. P. (2003). Misery loves companies: rethinking social initiatives by business. Administrative Science Quarterly, 48(2), 268–305.
June 27-28, 2012Cambridge, UK 21

2012 Cambridge Business & Economics Conference ISBN : 9780974211428
McWilliams, A., & Siegel, D. (2000). Corporate social responsibility and financial performance: correlation or misspecifiction?. Strategic Management Journal, 21(5), 603-609.
McWilliams, A., & Siegel, D. (2001). Corporate social responsibility: A theory of the firm perspective. Academy of Management Review, 26(1), 117-127.
Moskowitz, M. R. (1972). Choosing socially responsible stocks. Business and Society Review, 1, 71-75.
Ness, K., & Mirza, A. (1991). Corporate social disclosure: a note on the test of agency theory. The British Accounting Review, 23(3), 211–217.
Orlitzky, M. (2001). Does firm size confound the relationship between corporate social performance and firm financial performance?. Journal of Business Ethics, 33(2), 167-180.
Orlitzky, M., & Schmidt, F. L., & Rynes, S. L. (2003). Corporate social and financial performance: A meta-analysis. Organization Studies, 24(3), 403-441.
Parket, I. R., & Eilbirt, H. (1975). Social responsibility: The underlying factors. Business Horizons, 18(4), 5-10.
Pava, M. L., & Krausz, J. (1996). The association between corporate social-responsibility and financial performance: The paradox of social cost. Journal of Business Ethics, 15(3), 321-357.
Porter, M. E. (1980). Competitive strategy. New York: Free Press.
Preston, L. (1978). Analyzing corporate social Performance: Methods and results. Journal of Contemporary Business, 7(1), 135-150.
Reverte, C. (2009). Determinants of corporate social responsibility: Disclosure ratings by Spanish listed firms. Journal of Business Ethics, 88(2), 351-366.
Roberts, P. W., & Dowling, G. R. (2002). Corporate reputation and sustained superior financial performance. Strategic Management Journal, 23(12), 1077-1093.
Rowley, T., & Berman, S. (2000). A brand new brand of corporate social performance. Business & Society, 39(4), 397-418.
Simpson, W., & Kohers, T. (2002). The link between social and financial performance: Evidence from the banking industry. Journal of Business Ethics, 35(2), 97-109.
Solomon, R., & Hanson, K. (1985). It’s good business. New York: Atheneum.
Stanwick, P., & Stanwick, S. (1998). The relationship between corporate social performance, and organizational size, financial performance and environmental performance: An empirical examination. Journal of Business Ethics. 17(2), 195-204.
June 27-28, 2012Cambridge, UK 22

2012 Cambridge Business & Economics Conference ISBN : 9780974211428
Surroca, J., & Tribo, J., & Waddock, S. (2010). Corporate responsibility and financial performance: The role of intangible resources. Strategic Management Journal, 31(5), 463-490.
Tan, J. J., & Litschert, R. J. (1994). Environment-strategy relationship and its performance implications: An empirical study of the chinese electronic industry. Strategic Management Journal, 15(1), 1-20.
Trotman, K., & Bradley, G. (1981). Associations between social responsibility disclosure and characteristics of companies. Accounting, Organizations and Society, 6(4), 355-362.
Ullmann, A. (1985). Data in search of a theory: A critical examination of the relationships among social performance, social disclosure, and economic performance of U.S. firms. Academy of Management Review, 10(3), 540-577.
Vance, S. G. (1975). Are socially responsible corporations good investment risks? Management Review, 64(8), 19-24.
Waddock, S. A., & Graves, S. B. (1997). The corporate social performance-financial performance link. Strategic Management Journal, 18(4), 303-319.
Walsh, J. P., & Weber, K., & Margolis, J. D. (2003) Social issues and management: Our lost cause found. Journal of Management, 29(6), 859-881.
Watts, R., & Zimmerman, J. (1986). Positive accounting theory. Englewood Cliffs, NJ: Prentice Hall.
Weidenbaum, M., & Vogt S. (1987). Takeovers and stockholders: Winners and losers. California Management Review, 29(4), 57-168.
Williamson, O. E. (1967). The economics of discretionary behaviour: Managerial objectives in a theory of the firm. Chicago: Markham.
Williamson, O. E. (1985). The economic institutions of capitalism. New York: Free Press.
June 27-28, 2012Cambridge, UK 23

2012 Cambridge Business & Economics Conference ISBN : 9780974211428
APPENDIX
Table 1: Basic statistics
2010 ROE D/E TA Liq 2009 ROE D/E TA LiqMedian 13.55 48.94 947,859 1.00 Median 14.98 51.37 809,165 1.03Std 90.03 116.02 7,977,155 3.16 Std 31.56 147.31 5,970,027 7.80Average 30.37 83.16 2,064,216 1.80 Average 16.30 104.88 1,829,543 2.84First quartile 4.30 16.42 509,150 0.68 First quartile 3.28 18.43 444,947 0.66Second quartile 13.55 48.94 947,859 1.00 Second quartile 14.98 51.37 809,165 1.03Third quartile 27.65 100.23 1,758,587 1.65 Third quartile 26.84 122.26 1,720,718 1.80Lower Limit -27.10 0.62 50,743 0.03 Lower Limit -132.40 0.07 40,500 0.03Upper Limit 991.34 872.14 118,057,000 38.34 Upper Limit 190.96 995.86 86,194,000 83.19
2008 ROE D/E TA Liq 2007 ROE D/E TA LiqMedian 10.62 64.40 764,900 1.04 Median 21.22 56.96 747,007 1.04Std 84.51 144.64 3,167,243 7.52 Std 67.51 129.83 2,310,039 8.33Average 9.34 109.96 1,640,586 2.93 Average 25.24 96.11 1,483,071 2.81First quartile -14.23 23.36 423,275 0.69 First quartile 9.51 16.40 401,279 0.70Second quartile 10.62 64.40 764,900 1.04 Second quartile 21.22 56.96 747,007 1.04Third quartile 29.29 136.70 1,731,553 1.70 Third quartile 34.48 115.33 1,496,850 1.64Lower Limit -540.01 0.00 40,090 0.04 Lower Limit -692.60 0.04 34,221 0.12Upper Limit 556.99 949.26 37,614,000 80.23 Upper Limit 354.23 815.28 19,553,000 76.88
2006 ROE D/E TA Liq 2005 ROE D/E TA LiqMedian 23.45 51.79 663,198 1.10 Median 21.94 64.69 630,910 1.09Std 65.79 123.25 1,761,452 6.56 Std 37.19 132.88 1,572,833 5.93Average 33.69 93.44 1,212,301 2.37 Average 25.20 106.11 1,094,005 2.39First quartile 14.60 15.75 295,190 0.73 First quartile 12.42 17.41 228,590 0.80Second quartile 23.45 51.79 663,198 1.10 Second quartile 21.94 64.69 630,910 1.09Third quartile 32.89 114.52 1,430,750 1.72 Third quartile 31.76 140.73 1,418,300 1.81Lower Limit -64.64 0.05 0 0.03 Lower Limit -182.24 0.02 0 0.06Upper Limit 564.29 702.66 13,434,000 78.26 Upper Limit 289.19 659.20 12,825,000 66.43
2004 ROE D/E TA Liq 2003 ROE D/E TA LiqMedian 18.32 43.88 539,148 1.16 Median 18.62 50.81 501,906 1.07Std 36.56 108.23 1,130,223 6.31 Std 54.50 104.76 1,058,515 5.58Average 18.50 82.72 902,247 2.03 Average 18.96 79.71 860,614 1.92First quartile 9.15 14.88 210,738 0.71 First quartile 6.09 13.10 205,395 0.67Second quartile 18.32 43.88 539,148 1.16 Second quartile 18.62 50.81 501,906 1.07Third quartile 27.58 114.60 1,176,678 1.64 Third quartile 29.31 106.11 1,064,900 1.53Lower Limit -274.60 0.08 0 0.04 Lower Limit -157.74 0.13 4,979 0.10Upper Limit 198.26 725.69 7,913,600 81.18 Upper Limit 617.78 812.16 6,651,700 67.47
Table 1 presents the basic statistics for the variables employed. In more detail, the median, the standard deviation, the mean the quartiles, the maximum and the minimum values are reported. The table is dissected in 8 sections, one for each year.
June 27-28, 2012Cambridge, UK 24

2012 Cambridge Business & Economics Conference ISBN : 9780974211428
Table 2: Correlation matrix
Lev ROE Size Liq1 0.473 0.0036 0.1304 Lev
1 0.0799 0.231 ROE1 -0.3019 Size
1 Liq
Table 3: Regression results-full sample
ROE CSR SIZE
α0 0.0512 β0 0.0768 μ0 2.4551(0.17) (2.01) (3.66)
size α1 -0.0072 roe β1 0.6636 roe μ1 0.4956(-0.55) (4.59) (5.13)
csr α2,1 0.8357 size β2 0.0566 csr μ2 4.22(4.78) (3.40) (6.91)
α2,2 -0.1785(-1.97)
α2,3 0.3548(3.92)
lev α3 -0.0692 lev β3 -0.0213 lev μ3 -0.0482(-4.08) (-2.83) (-0.29)
liq α4 0.0673 liq β4 0.7868 liq μ4 0.3008(2.54) (2.73) (0.83)
J-stats 8.32(0.22)
Full Sample
Table 3 presents the estimation results for the model in Eqs (1), (2) and (3) for the full sample. The first section presents the estimates for the parameters. The values in parentheses are t-statistics. The bottom section reports the Adjusted-R-squared and the J-statistics. The values in parentheses are the associated p-values.
June 27-28, 2012Cambridge, UK 25

2012 Cambridge Business & Economics Conference ISBN : 9780974211428
Table 4: Regression results-before and after 2008
ROE CSR SIZE
α0 0.0491 β0 0.0809 μ0 2.0755(1.94) (2.11) (3.05)
size α1 0.0124 roe β1 0.8076 roe μ1 0.5017(2.05) (5.49) (5.01)
csr α2,1 0.6315 size β2 0.1051 csr μ2 4.77(2.88) (3.49) (7.01)
α2,2 -0.1707(-1.84)
α2,3 0.6134(4.17)
lev α3 0.0161 lev β3 0.0012 lev μ3 0.0149(2.13) (2.03) (2.85)
liq α4 0.0709 liq β4 0.7764 liq μ4 0.2930(2.58) (2.77) (0.88)
J-stats 8.41(0.21)
ROE CSR SIZEα0 0.0542 β0 0.0692 μ0 2.6146
(0.10) (1.81) (3.84)size α1 -0.0047 roe β1 0.3963 roe μ1 0.4890
(-0.51) (3.19) (4.99)csr α2,1 0.8736 size β2 0.0531 csr μ2 2.9500
(5.02) (2.40) (4.44)α2,2 -0.1815
(-1.98)α2,3 0.2745
(2.32)lev α3 -0.0772 lev β3 -0.1017 lev μ3 -0.0242
(-4.11) (-2.89) (-0.22)liq α4 0.0666 liq β4 0.8011 liq μ4 0.3534
(3.15) (2.74) (0.99)J-stats 8.30
(0.22)
Before 2008
After 2008
Table 4 presents the estimation results for the model in Eqs (1), (2) and (3) for two sub-samples. The first panel (Before 2008) reports the estimates of the models for the period 2003-2007, while the second panel for the period 2008-2010). The first section of each panel presents the estimates for the parameters. The values in parentheses are t-statistics. The bottom section reports the Adjusted-R-squared and the J-statistics. The values in parentheses are the associated p-values.
June 27-28, 2012Cambridge, UK 26

2012 Cambridge Business & Economics Conference ISBN : 9780974211428
Figure 1: Number of FTSE 250 companies in the BITC index
0
10
20
30
40
50
60
70
80
90
100
20102009200820072006200520042003
Number of FTSE 250 companies in BITC index
Figure 1 shows the number of companies included in FTSE 250 that they are ranked among the first 100 companies that have embraced CSR practices, according to BITC index.
Figure 2: Top 10 sectors in CSR
0%
2%
4%
6%
8%
10%
12%
14%
Sector
Top 10 sectors in CSR
Leve
l of p
artic
ipati
on
Figure 2 shows the 10 best performing sectors in terms of CSR performance, according to BITC index.
June 27-28, 2012Cambridge, UK 27

2012 Cambridge Business & Economics Conference ISBN : 9780974211428
Figure 3: Top 10 Sectors in CSR detailed
All sect
ors
AutomobileEn
ergy
Finan
cial Se
rvice
Genera
l retai
lers
Mining
Oil and Gas
Real es
tate
Teleco
mmunication
Transport
Trave
l and lei
sure
0%2%4%6%8%
10%12%14%16%18%20%
Top 10 Sectors-Detailed
Community Environment Marketplace Workplace
Perf
orm
ance
Figure 3 shows detailed CSR activities per sector, for the top 10 sectors in CSR, according to BITC index
June 27-28, 2012Cambridge, UK 28

2012 Cambridge Business & Economics Conference ISBN : 9780974211428
ENDNOTES
June 27-28, 2012Cambridge, UK 29

Corresponding author.
i CSR is used to measure how a firm embraces economic, environmental, social and governance factors into its operations and society at large. Godfrey and Hatch (2007) defines CSR as a concept of integrating social and environmental concerns in the business operations and their stakeholders on a voluntary basis.United Kingdom has been chosen because the European business network for CSR reports that 38% of CSR Europe’s web users identified the United Kingdom as the most progressive country in terms of CSR initiatives (followed by Sweden with 11%, the Netherlands with 7% and Denmark with only 6%) Source: <http:// www.csreurope.org/press_releases.php?action=show_press_release&press_id=5> [20.08.11]
ii The majority of studies (Bragdon and Marlin (1972) & Heinz (1976) & Moskowitz (1972) & Parket and Eilbirt (1975) & Vance (1975)) uses Return on Equity (ROE) to measure performance, as opposes to Tobin’s Q and Market to Book ratio, which measure market value.However, several studies, although they examine the relationship between social corporate responsibility and performance (Coombs and Gilley (2005) & Griffin and Mahon (1997) & Hillman and Keim (2001) & McWilliams and Siegel (2000), (2001) & Pava and Krausz (1996) & Roberts and Dowling (2002) & Rowley and Berman (2000) & Simpson and Kohers (2002) & Waddock and Graves (1997) & Walsh et al. (2003)), Jones (1999) argues that they fail to systematically address the fundamental determinants of social responsibility.
iii The index reported by “The Business in the Community” covers all aspects of social responsibility, such as community investments and noise pollution, and it is not restricted in terms of industrial or geographical aspects.
iv Six main approaches have been developed. According to the Social Impact Hypothesis (Freeman (1984) & Jones (1995)), if a firm satisfies the needs and demands of its corporate stakeholders, a favourable financial performance will follow. According to the Slack Resource Hypothesis (Waddock and Graves (1997)), the direction is exactly the opposite, because only a company that generates profits can further invest in its social profile improvement. On the contrary according to the Trade-off Hypothesis increased CSR investments shrink investors wealth and therefore result in limited performance. Similar, according to Managerial Opportunism Hypothesis (Weidenbaum and Vogt (1987) & Willliamson (1967), (1985)), firms only invest in improving their social profile when they do not have other valuable intangible assets. Therefore a high performance negatively affects CSR. On the contrary the Positive (Allouche and Laroche (2005) & Waddock and Graves (1997)) and the Negative (Friedman (1962), (1970)) Synergy hypothesis recognize the endogenous relationship between CSR and performance, without though stating the facts that determine the positive or negative sign.
v Jauch et al. (1980) and Tan and Litschert (1994) who assert that the institutional environment alone is becoming broader and more close to the stakeholder concept. It involves components like competitors, customers, suppliers, technology, regulatory bodies, economics, social-cultural and international.
vi CSR is measured using the Business In The Community (BITC) index, which provides a ranking according to company’s engagement in various aspects of social responsibility.
vii The data bases used are “FAME” and Business In The Community (BITC). BITC Corporate Responsibility Index is the leading UK voluntary benchmark for corporate responsibility. BITC Index was established in 1982 and now has 830 members. The index is a voluntary and self assessment survey providing an annual benchmark on the management, measurement and reporting of firms’ corporate responsibility. The index uses ranking from 1 to 100 where 1 denotes the worst corporate social responsibility attribution and values close to 1 denotes lower levels of CSR performance. A rank of 100 shows the best exhibition of corporate social responsibility.
viii For example, a firm with a rank of 1, which is the best result, has a CSR of 100. The higher the ranking, the higher is the CSR Index. All companies that are not in the BITC index, are treated as being the last in the list. Consequently they have a score CSR=1.
ix First, let β=( αm, q , βm , μm )' ,where m=0 ,…, 4 and q=1,2 , 3 in the special case of a2, be a vector of the parameters
to be estimated, υι ,t a vector of all variables of company i at time t , z1 ,tυ =¿¿ is a vector of the instrumental variables for
Eq. (1), z2 ,tυ =¿¿ is a vector of instrumental variables for Eq. (2) and z3 ,t
υ =( ROE t , Levt , Liqt ,CSRt )'is a vector of
instrumental variables for Eq. (3). The ^ sign indicates industry averages. This variables are correlated to the regressors but they are expected to be uncorrelated to the error term, since they are not company specific.

e1 ,t=ROEi , t−E [ ROE i ,t∨H i ,t ] is the error term in Eq. (1), e2 ,t=CSRi ,t−E [CSRi ,t∨H i ,t ] is the error term in Eq. (2) and e3 ,t=¿¿ i ,t−E ¿¿ is the error term in Eq. (3). H i ,t is the available set of information. Then, the following moment conditions can be implied. First, the forecasting error, er , t , r=1 , 2, 3 in Eqs. (1), (2) and (3), is assumed to have a
zero mean (i.e., E [ f r , ti ( β , υi ,t ) ]=E [er , t ]=0) and be uncorrelated (i.e., E [ f r , t
c ( β ,υi ,t ) ]=E [er , t er ,t−1 ]=0). Second, all
independent variables are assumed to be uncorrelated with er , t (i.e., E [ f r , tυ ( β , υr ,t ) ]=E [er ,t∗zr , t
υ ]=0). Summarizing, the joint model is estimated using the following moment conditions:
E { er ,t
er ,t er , t−1
er , t zr ,tυ }=0 .
The GMM disturbances are then gathered in a vector ( β , υi , t )=¿ f r ,tυ ( β , υr ,t )'¿ ' .
The sample means are defined as: g ( β ; SI ,T )= 1T
1I ∑i=1
I
∑t=1
T
f ( β , υi , t ), where S I ,T contains the observations of
υi ,t− j , j=1 ,…,T of a sample T. The idea behind GMM is to choose parameter values for β , such that the sample moments, g ( β ; S I ,T ) , closely approximate the population moments, f ( β , υi , t ), or else to make g ( β ; S I ,T ) as close to
zero as possible. By the “Law of Large Numbers” g ( β ; S I ,T ) ≈ f ( β ,υi ,t ) for large values of T, so an appropriate estimate,
β , of the population parameter β makes g ( β ; S I ,T ) ≈ 0. When the number of moment conditions, K, is larger than the number of parameters, L, then the GMM estimator can be written as:
β=argminβ
(g ( β ;S I ,T )'∗W t∗g ( β ; SI ,T )) ,
where W t is a KxK semi-definite “weighting” matrix, such as that limT → ∞
W t →W (population). The approach employed
for the estimation of β is the “iterative” GMM, with a heteroskedasticity consistent covariance matrix (Newey and West,
1987), when computing an estimate for W t=Ω−1 (where Ω= limT → ∞
T∗E [ g ( β ; ST )∗g ( β ;ST ) ' ]).In the above specification, K>L and, therefore, the model is over-identified. Hansen (1982) proposes J-statistics to test the validity of the model, i.e., whether the implied moment conditions fit the data well. Ho is that they do. J-statistic is asymptotically Chi-squared with K−L degrees of freedom.
J ≡ (g ( β ;SI ,T ) '∗W t∗g ( β ; SI ,T ))→ χK −L2 .