Embed Size (px)
Citation preview
Supplementary Material (ESI) for Chemical Communications This journal is (c) The Royal Society of Chemistry 2010
Supporting information
A stable molecular nickel catalyst for homogeneous photogeneration of hydrogen in aqueous solution
Matthew P. McLaughlin, Theresa M. McCormick, Richard Eisenberg,* Patrick L.
Holland*
Department of Chemistry, University of Rochester, Rochester, New York 14627, USA. E‐mail: [email protected]; [email protected]
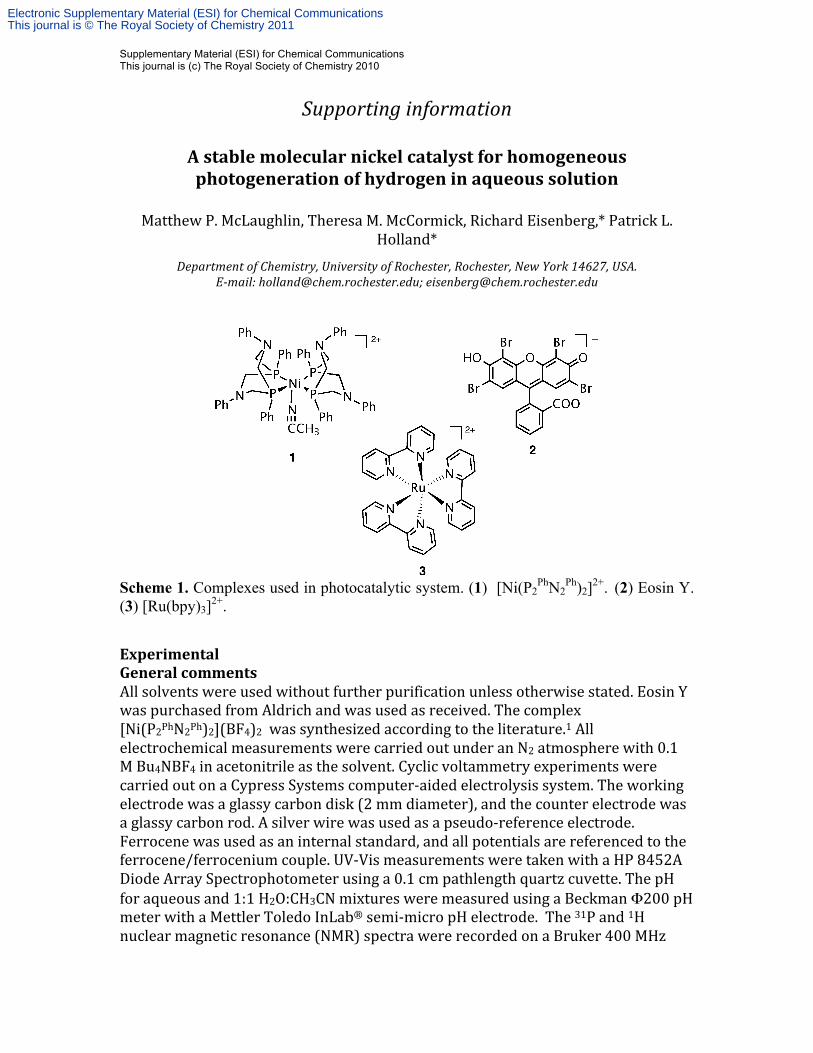
Scheme 1. Complexes used in photocatalytic system. (1) [Ni(P2
PhN2Ph)2]2+. (2) Eosin Y.
(3) [Ru(bpy)3]2+.
Experimental General comments All solvents were used without further purification unless otherwise stated. Eosin Y was purchased from Aldrich and was used as received. The complex [Ni(P2PhN2Ph)2](BF4)2 was synthesized according to the literature.1 All electrochemical measurements were carried out under an N2 atmosphere with 0.1 M Bu4NBF4 in acetonitrile as the solvent. Cyclic voltammetry experiments were carried out on a Cypress Systems computer‐aided electrolysis system. The working electrode was a glassy carbon disk (2 mm diameter), and the counter electrode was a glassy carbon rod. A silver wire was used as a pseudo‐reference electrode. Ferrocene was used as an internal standard, and all potentials are referenced to the ferrocene/ferrocenium couple. UV‐Vis measurements were taken with a HP 8452A Diode Array Spectrophotometer using a 0.1 cm pathlength quartz cuvette. The pH for aqueous and 1:1 H2O:CH3CN mixtures were measured using a Beckman Φ200 pH meter with a Mettler Toledo InLab® semi‐micro pH electrode. The 31P and 1H nuclear magnetic resonance (NMR) spectra were recorded on a Bruker 400 MHz
Electronic Supplementary Material (ESI) for Chemical CommunicationsThis journal is © The Royal Society of Chemistry 2011
Supplementary Material (ESI) for Chemical Communications This journal is (c) The Royal Society of Chemistry 2010
spectrometer. The 31P NMR spectra were all referenced to an external H3PO4 reference sample. Hydrogen evolution studies. Stock solutions were prepared, for photosensitizer (PS) 2 in water and PS 3 in acetonitrile. Both PS stock solutions were made to a 3×10⁻³ M concentration. A 4.5×10⁻³ M catalyst 1 solution was prepared in acetonitrile. A 0.50 M solution of ascorbic acid was made in H2O and adjusted to the correct pH by the addition of either 0.1 M NaOH or HBF4. Solutions were mixed under an inert atmosphere with CH3CN and H2O in a 20 mL test tube, with varying amounts of PS, catalyst, and ascorbate solutions to an end volume of 4 mL. A septum was placed on the test tubes and secured with a copper wire. One mL of the headspaces were replaced with methane at 760 torr to serve as an internal gas chromatography (GC) standard. Samples were placed on a rotating carousel to ensure equal light intensity reaching the six samples. Samples were irradiated with a 200 W mercury lamp using a cut-off filter to remove light with λ < 410 nm. The samples were stirred with magnetic stir bars during irradiation. The amounts of hydrogen evolved were determined by GC using a Shimadzu GC-17A chromatograph with a 5Å molecular sieve column (30 m - 0.53 mm) and a TCD detector, by injecting 100 µL of headspace into the GC, quantified by a calibration plot to the internal CH4 standard. LED photolysis set-up. Samples of 5 mL were prepared in 40 mL scintillation vials. For catalyst 1 a 4.5x10⁻³ M solution in H2O was prepared. A 3.0x10⁻³ M solution of PS 2 in acetonitrile was prepared. A 0.50 M solution of ascorbic acid was made in H2O and adjusted to the correct pH by the addition of either 0.1 M NaOH or HBF4. Stock solutions were mixed under an inert atmosphere with CH3CN and H2O to bring the final ratio to 1:1. The samples were placed into a temperature controlled block at 15°C and sealed with an air tight cap fitted with a pressure transducer and septa. The samples were degassed by bubbling with a 20% mixture of CH4 in N2, where the CH4 was later used as the internal standard for GC analysis. The cells were irradiated from below with high power Philips LumiLED Luxeon Star Hex green (520 nm) 700 mA LEDs. The light power of each LED was set to 0.15 W measured with a L30 A Thermal sensor and Nova II Power meter (Ophir-Spiricon LLC). The samples were continuously mixed by placing the apparatus on an orbital shaker. The pressure changes in the vials were recorded using a Labview S3 program read from a Freesale semiconductor pressure sensor (MPX4250A series). At the end of the irradiation the headspace of each vial was sampled by the GC to ensure that the pressure change was caused by H2 generation, and to double check that the amount of generated hydrogen calculated by the change in pressure corresponded to the amount determined by the GC. Control experiments Carrying out the hydrogen generation experiment without any one of the three system components (catalyst, donor, or PS) resulted in no detectable hydrogen generation by GC. Additionally, carrying out the hydrogen production experiments at pH ≥ 7.0, with either triethanolamine or ascorbate as the sacrificial electron donors, resulted in no detectable hydrogen generation by GC.
Electronic Supplementary Material (ESI) for Chemical CommunicationsThis journal is © The Royal Society of Chemistry 2011
Supplementary Material (ESI) for Chemical Communications This journal is (c) The Royal Society of Chemistry 2010
Irradiation power variation. Since a reliable initial rate could not be determined at low PS concentrations because of system instability, the influence of PS on the rate was evaluated by varying the irradiation power of the lamp. The irradiation power was determined with a L30 A Thermal sensor and Nova II Power meter (Ophir-Spiricon LLC). Following the procedure outlined above in the “Hydrogen evolution studies,” nine samples were prepared and irradiated at 100, 75 and 50% of the maximum irradiation power. Each experiment yielded identical rates of hydrogen production for 1 hour, 18.3±0.9 turnovers by catalyst. This indicated that the initial rate for the photocatalytic system is independent of the PS under the experimental conditions studied. Fluorescence Quenching Solutions of 2×10⁻⁵ M dye 2 and 4.0×10⁻⁵ M dye 3 in 1:1 mixtures of CH3CN:H2O ( w
s pH = 3.81 ) were prepared and deoxygenated by bubbling N2 in quartz cuvette fitted with a septum cap. Aliquots of a solution of ascorbate/ascorbic acid ( w
s pH = 3.81 ) were added and the intensity of the fluorescence was monitored by steady state fluorescence exciting at 498 nm for 2 and 504 nm for 3 on a Spex Fluoromax-P fluorimeter with a photomultiplier tube detector. The quencher solutions were made with either 2×10⁻⁵ M dye 2 and 4.0×10⁻⁵ M dye 3 in order to maintain a constant PS concentration. Sample Calculations
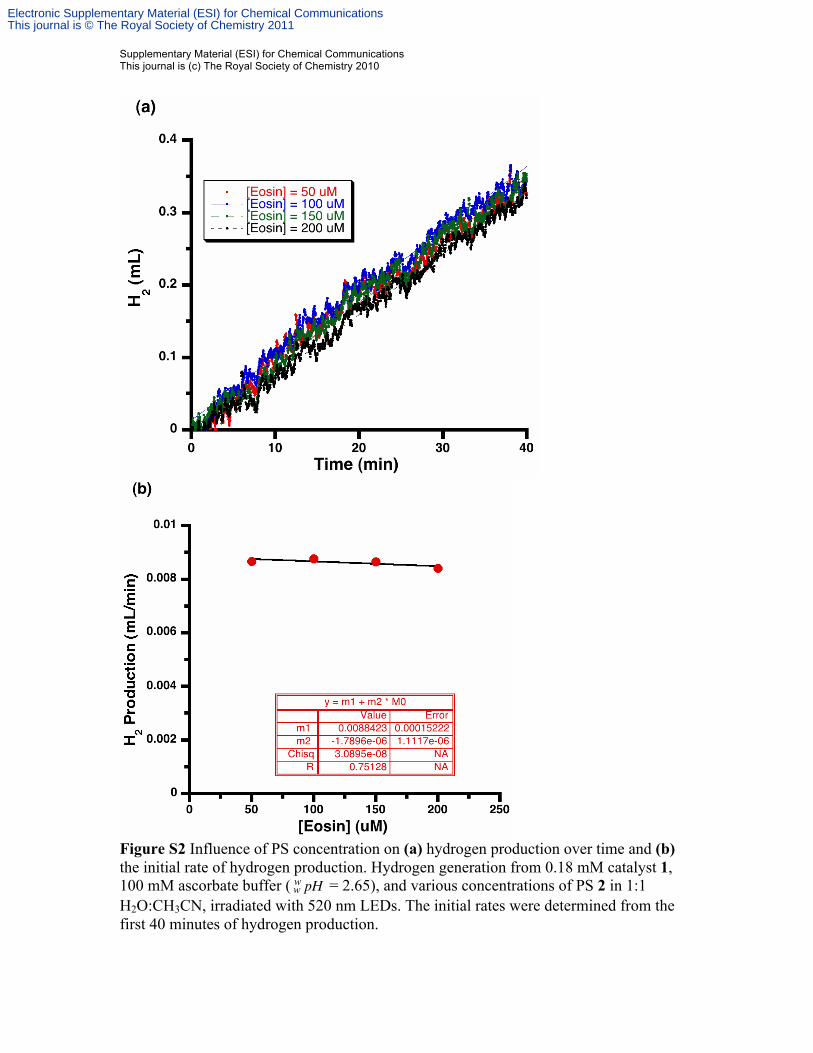
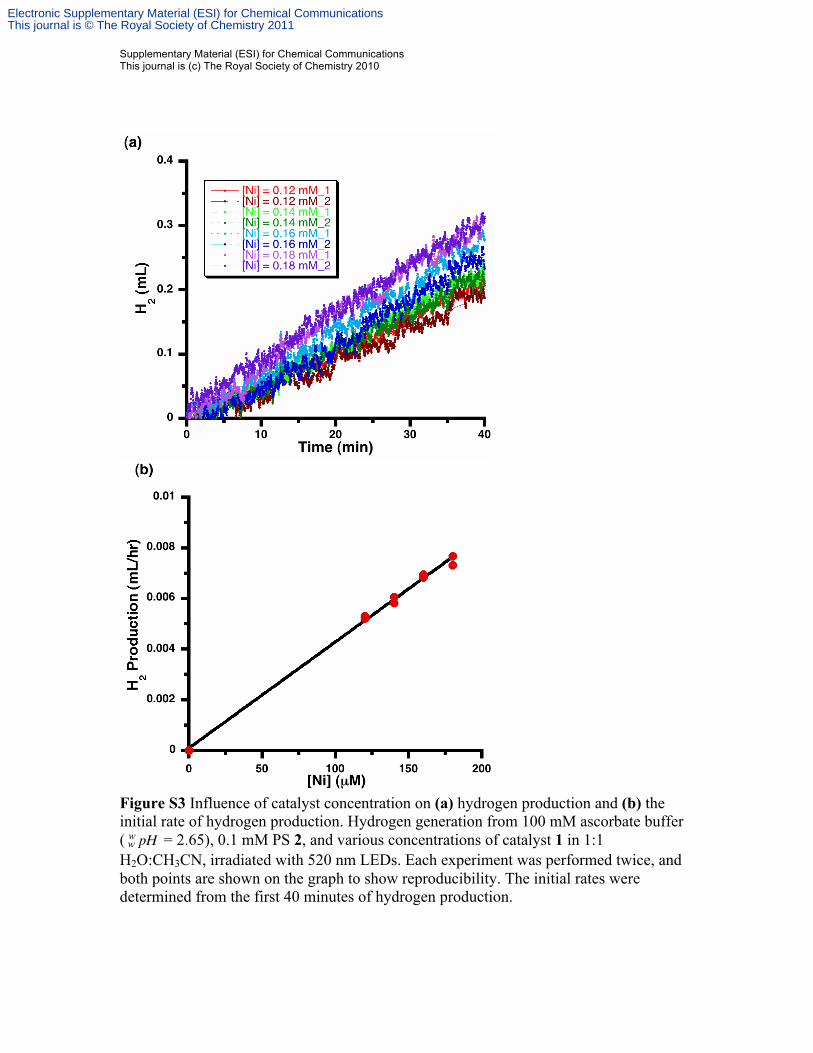
Rate Prediction: Dubois and coworkers previously reported a rate law for their catalyst at high acid concentrations, rate = k2[H+]2[Ni] where k2 = 1.3×10⁴ M-2s-1.1 The electrochemical results obtained in 1:1 CH3CN:H2O were in good agreement with the previously observed rate law. If the proton and catalyst concentrations used for the photocatalytic experiments were substituted in Dubois’ rate law, the resulting rate was rate = (1.3×10⁴ M-2s-1)(1.0×10⁻³ M)2(1.8×10⁻⁴ M)×3600 s/hr = 1.0×10⁻³ hr-1. Because this rate is much slower than observed from the photocatalytic experiments, it is clear that the rate difference is not solely due to the change in solvent and pH. This comparison supports the idea that the rate-limiting step (or the mechanism) is different in the photocatalytic system. Rate Law for hydrogen production: In order to determine the phenomenological rate law presented in the text, rate = k1[Ni][H+], it was possible to find consistent rate constants by varying either [Ni] or [H+]. For example, the slope from Figure S3b is 89.8 mLmin-1M-1 = k1[Ni], which gives k1 = 3.7×10⁵ M-2s-1. Alternatively, the slope for S2b is 41.0 mLmin-1M-1 = k1[Ni], which gives k1 = 3.6×10⁵ M-2s-1.
Electronic Supplementary Material (ESI) for Chemical CommunicationsThis journal is © The Royal Society of Chemistry 2011
Supplementary Material (ESI) for Chemical Communications This journal is (c) The Royal Society of Chemistry 2010
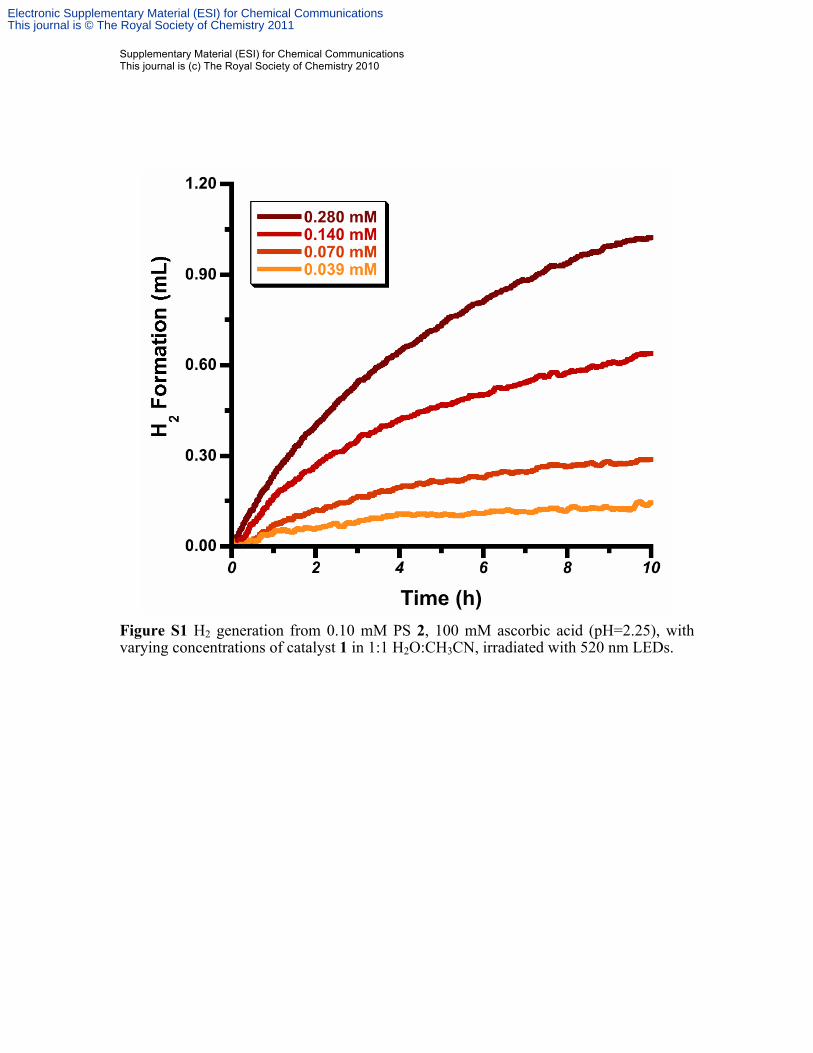
Figure S1 H2 generation from 0.10 mM PS 2, 100 mM ascorbic acid (pH=2.25), with varying concentrations of catalyst 1 in 1:1 H2O:CH3CN, irradiated with 520 nm LEDs.
Electronic Supplementary Material (ESI) for Chemical CommunicationsThis journal is © The Royal Society of Chemistry 2011
Supplementary Material (ESI) for Chemical Communications This journal is (c) The Royal Society of Chemistry 2010
Figure S2 Influence of PS concentration on (a) hydrogen production over time and (b) the initial rate of hydrogen production. Hydrogen generation from 0.18 mM catalyst 1, 100 mM ascorbate buffer (
!
ww pH = 2.65), and various concentrations of PS 2 in 1:1
H2O:CH3CN, irradiated with 520 nm LEDs. The initial rates were determined from the first 40 minutes of hydrogen production.
Electronic Supplementary Material (ESI) for Chemical CommunicationsThis journal is © The Royal Society of Chemistry 2011
Supplementary Material (ESI) for Chemical Communications This journal is (c) The Royal Society of Chemistry 2010
Figure S3 Influence of catalyst concentration on (a) hydrogen production and (b) the initial rate of hydrogen production. Hydrogen generation from 100 mM ascorbate buffer (
!
ww pH = 2.65), 0.1 mM PS 2, and various concentrations of catalyst 1 in 1:1
H2O:CH3CN, irradiated with 520 nm LEDs. Each experiment was performed twice, and both points are shown on the graph to show reproducibility. The initial rates were determined from the first 40 minutes of hydrogen production.
Electronic Supplementary Material (ESI) for Chemical CommunicationsThis journal is © The Royal Society of Chemistry 2011
Supplementary Material (ESI) for Chemical Communications This journal is (c) The Royal Society of Chemistry 2010
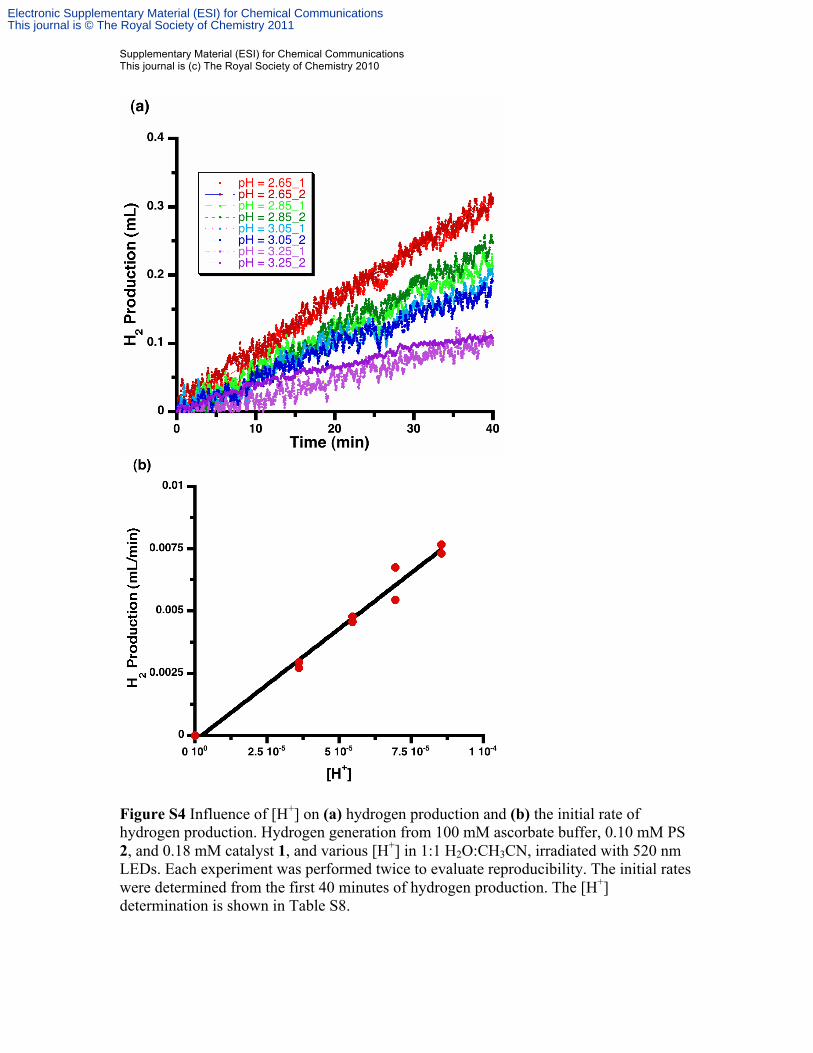
Figure S4 Influence of [H+] on (a) hydrogen production and (b) the initial rate of hydrogen production. Hydrogen generation from 100 mM ascorbate buffer, 0.10 mM PS 2, and 0.18 mM catalyst 1, and various [H+] in 1:1 H2O:CH3CN, irradiated with 520 nm LEDs. Each experiment was performed twice to evaluate reproducibility. The initial rates were determined from the first 40 minutes of hydrogen production. The [H+] determination is shown in Table S8.
Electronic Supplementary Material (ESI) for Chemical CommunicationsThis journal is © The Royal Society of Chemistry 2011
Supplementary Material (ESI) for Chemical Communications This journal is (c) The Royal Society of Chemistry 2010
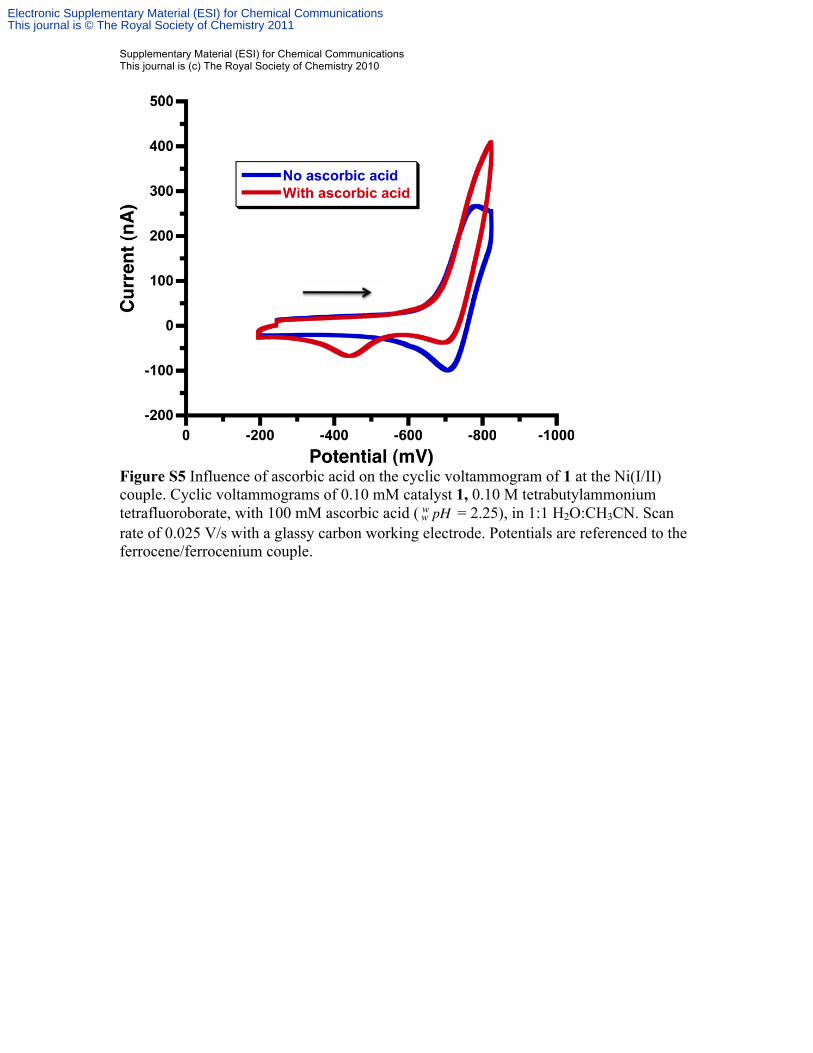
Figure S5 Influence of ascorbic acid on the cyclic voltammogram of 1 at the Ni(I/II) couple. Cyclic voltammograms of 0.10 mM catalyst 1, 0.10 M tetrabutylammonium tetrafluoroborate, with 100 mM ascorbic acid (
!
ww pH = 2.25), in 1:1 H2O:CH3CN. Scan
rate of 0.025 V/s with a glassy carbon working electrode. Potentials are referenced to the ferrocene/ferrocenium couple.
Electronic Supplementary Material (ESI) for Chemical CommunicationsThis journal is © The Royal Society of Chemistry 2011
Supplementary Material (ESI) for Chemical Communications This journal is (c) The Royal Society of Chemistry 2010
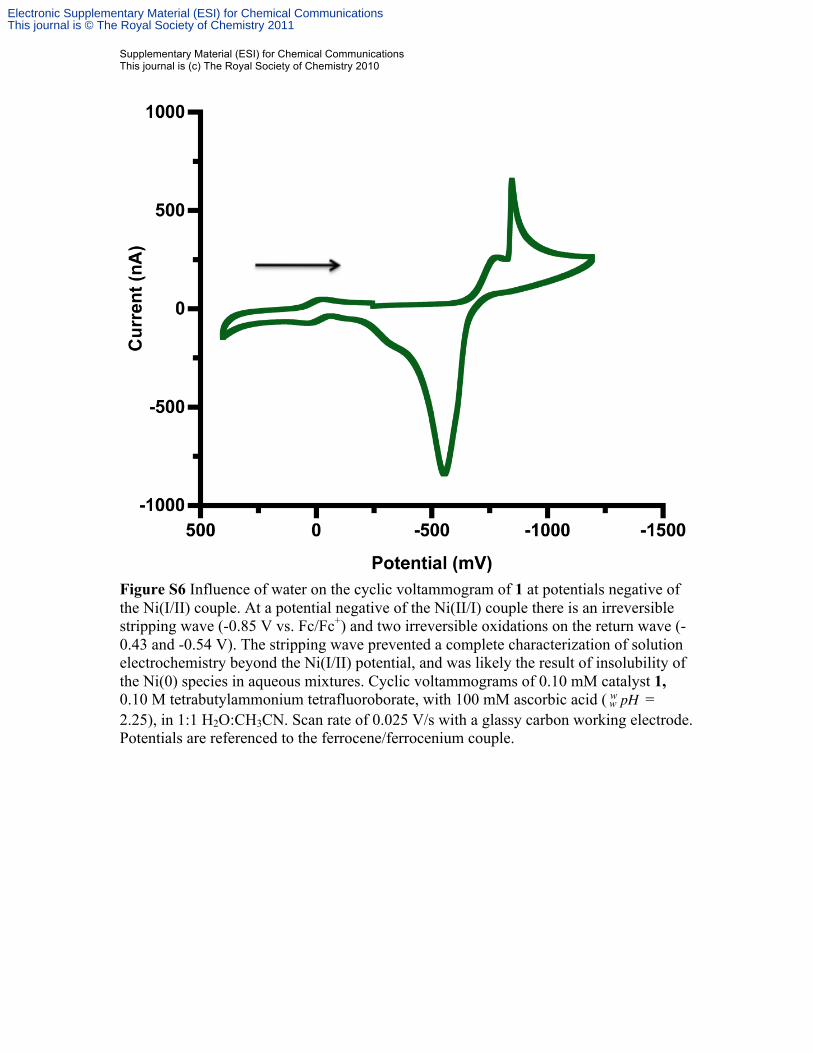
Figure S6 Influence of water on the cyclic voltammogram of 1 at potentials negative of the Ni(I/II) couple. At a potential negative of the Ni(II/I) couple there is an irreversible stripping wave (-0.85 V vs. Fc/Fc+) and two irreversible oxidations on the return wave (-0.43 and -0.54 V). The stripping wave prevented a complete characterization of solution electrochemistry beyond the Ni(I/II) potential, and was likely the result of insolubility of the Ni(0) species in aqueous mixtures. Cyclic voltammograms of 0.10 mM catalyst 1, 0.10 M tetrabutylammonium tetrafluoroborate, with 100 mM ascorbic acid (
!
ww pH =
2.25), in 1:1 H2O:CH3CN. Scan rate of 0.025 V/s with a glassy carbon working electrode. Potentials are referenced to the ferrocene/ferrocenium couple.
Electronic Supplementary Material (ESI) for Chemical CommunicationsThis journal is © The Royal Society of Chemistry 2011
Supplementary Material (ESI) for Chemical Communications This journal is (c) The Royal Society of Chemistry 2010
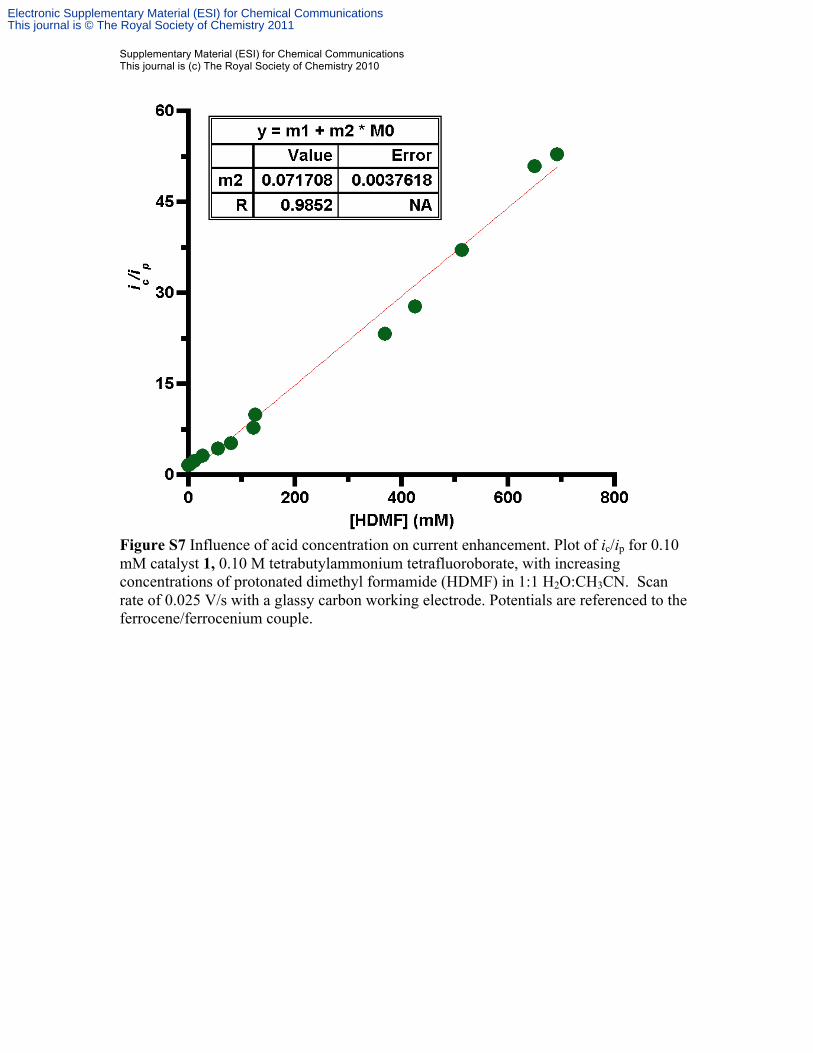
Figure S7 Influence of acid concentration on current enhancement. Plot of ic/ip for 0.10 mM catalyst 1, 0.10 M tetrabutylammonium tetrafluoroborate, with increasing concentrations of protonated dimethyl formamide (HDMF) in 1:1 H2O:CH3CN. Scan rate of 0.025 V/s with a glassy carbon working electrode. Potentials are referenced to the ferrocene/ferrocenium couple.
Electronic Supplementary Material (ESI) for Chemical CommunicationsThis journal is © The Royal Society of Chemistry 2011
Supplementary Material (ESI) for Chemical Communications This journal is (c) The Royal Society of Chemistry 2010
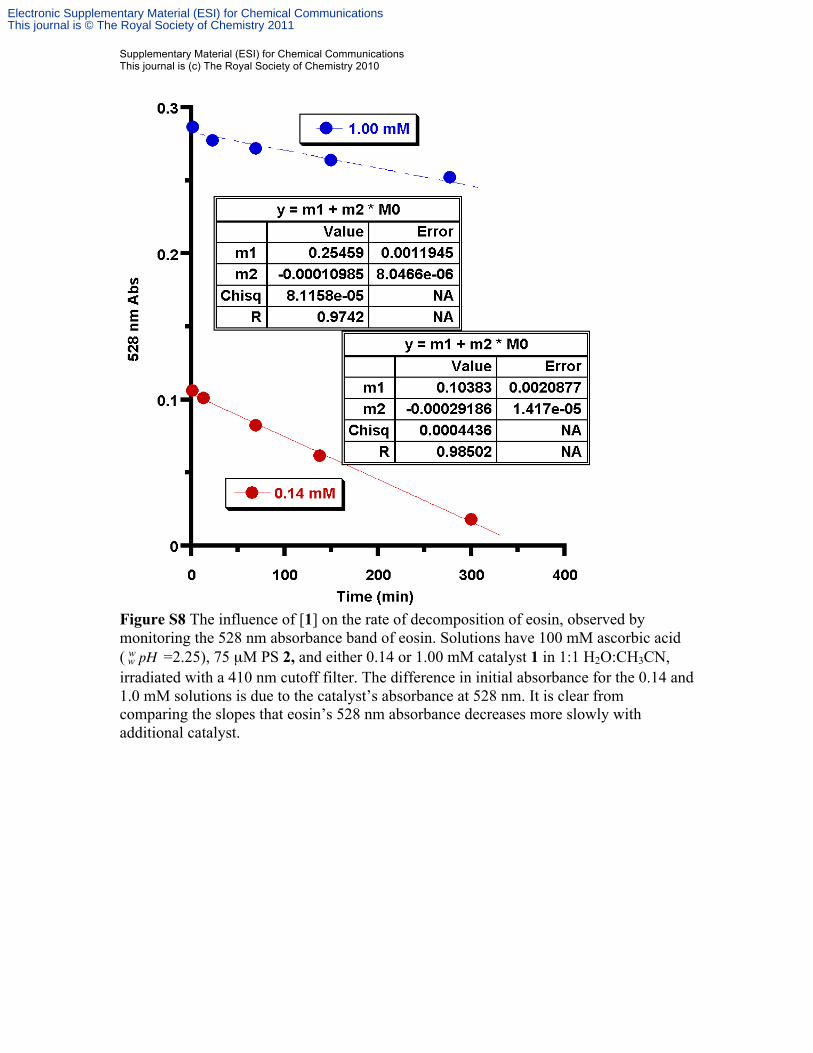
Figure S8 The influence of [1] on the rate of decomposition of eosin, observed by monitoring the 528 nm absorbance band of eosin. Solutions have 100 mM ascorbic acid (
!
ww pH =2.25), 75 µM PS 2, and either 0.14 or 1.00 mM catalyst 1 in 1:1 H2O:CH3CN,
irradiated with a 410 nm cutoff filter. The difference in initial absorbance for the 0.14 and 1.0 mM solutions is due to the catalyst’s absorbance at 528 nm. It is clear from comparing the slopes that eosin’s 528 nm absorbance decreases more slowly with additional catalyst.
Electronic Supplementary Material (ESI) for Chemical CommunicationsThis journal is © The Royal Society of Chemistry 2011
Supplementary Material (ESI) for Chemical Communications This journal is (c) The Royal Society of Chemistry 2010
!
ww pH (H2O)
!
ws pH (H2O:CH3CN)
!
ss pH (H2O:CH3CN) [H+]
2.65 3.81 4.07 8.55E-05
2.85 3.90 4.16 6.94E-05
3.05 4.01 4.26 5.46E-05
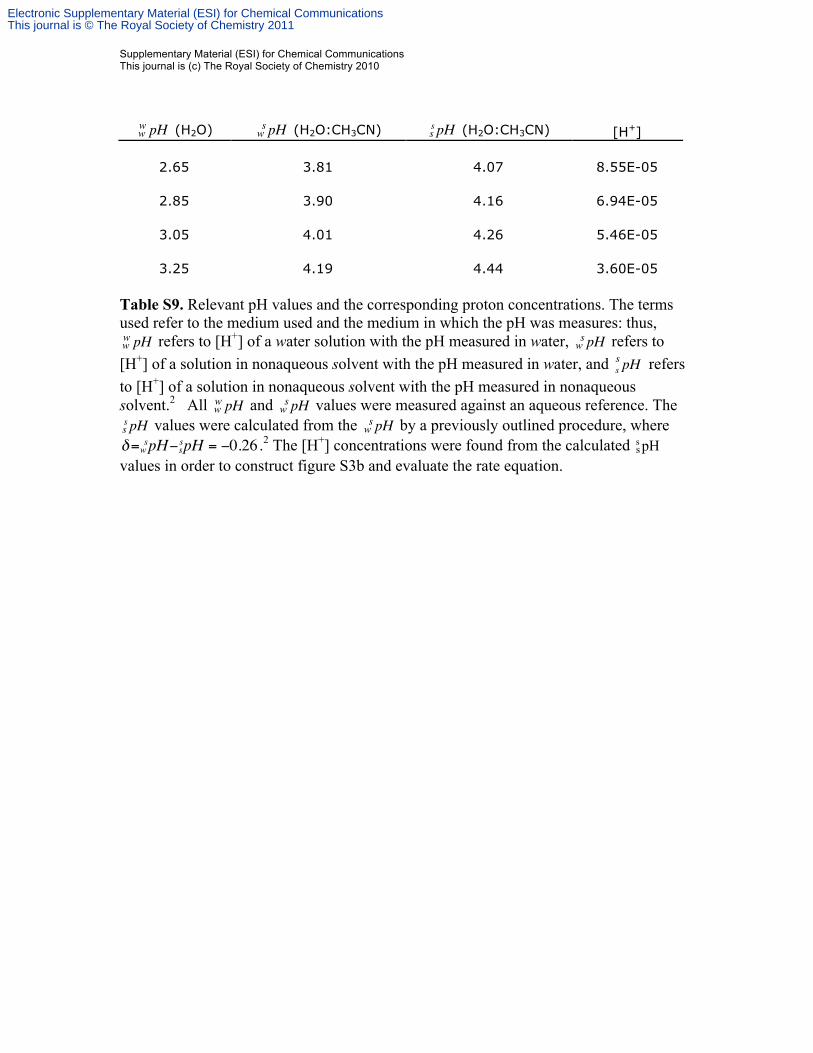
3.25 4.19 4.44 3.60E-05 Table S9. Relevant pH values and the corresponding proton concentrations. The terms used refer to the medium used and the medium in which the pH was measures: thus,
!
ww pH refers to [H+] of a water solution with the pH measured in water,
!
ws pH refers to
[H+] of a solution in nonaqueous solvent with the pH measured in water, and s
spH refers
to [H+] of a solution in nonaqueous solvent with the pH measured in nonaqueous solvent.2 All
!
ww pH and
!
ws pH values were measured against an aqueous reference. The
!
ss pH values were calculated from the
!
ws pH by a previously outlined procedure, where
!
"=wspH#sspH = #0.26 .2 The [H+] concentrations were found from the calculated
!
ss pH
values in order to construct figure S3b and evaluate the rate equation.
Electronic Supplementary Material (ESI) for Chemical CommunicationsThis journal is © The Royal Society of Chemistry 2011
Supplementary Material (ESI) for Chemical Communications This journal is (c) The Royal Society of Chemistry 2010
0
0.1
0.2
0.3
0.4
0 1 2 3 4
H2 P
rod
uctio
n (
mL
/hr)
pH
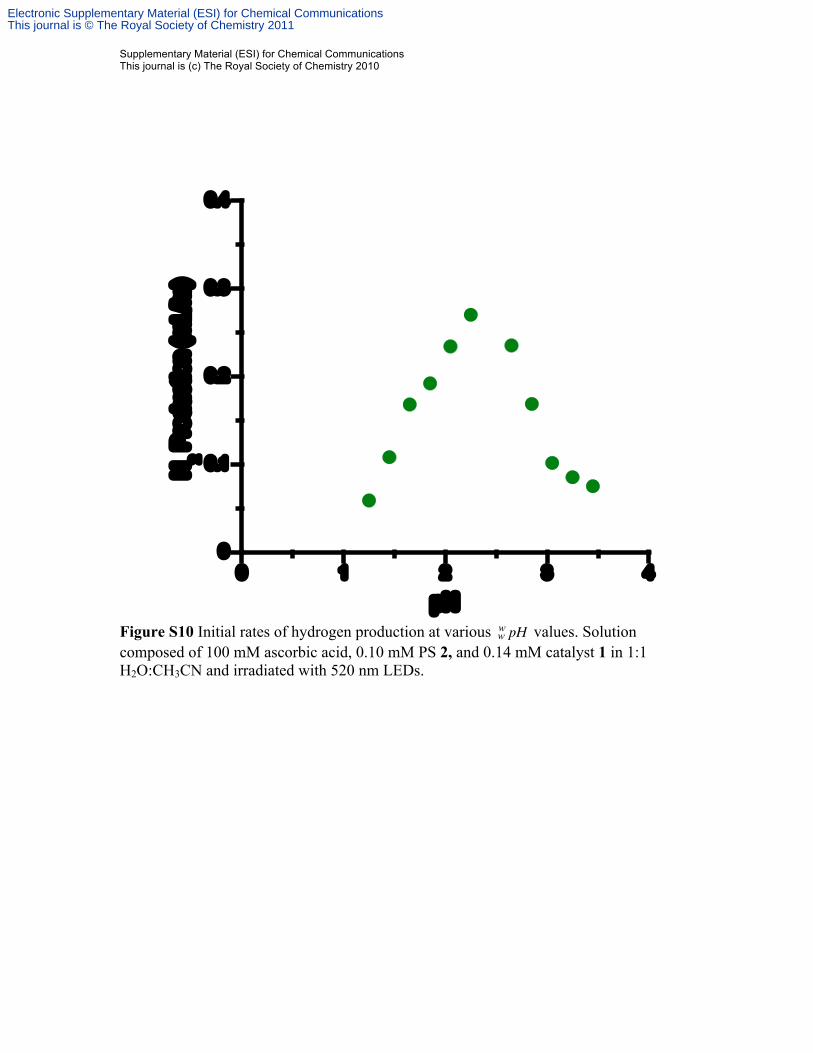
Figure S10 Initial rates of hydrogen production at various
!
ww pH values. Solution
composed of 100 mM ascorbic acid, 0.10 mM PS 2, and 0.14 mM catalyst 1 in 1:1 H2O:CH3CN and irradiated with 520 nm LEDs.
Electronic Supplementary Material (ESI) for Chemical CommunicationsThis journal is © The Royal Society of Chemistry 2011
Supplementary Material (ESI) for Chemical Communications This journal is (c) The Royal Society of Chemistry 2010
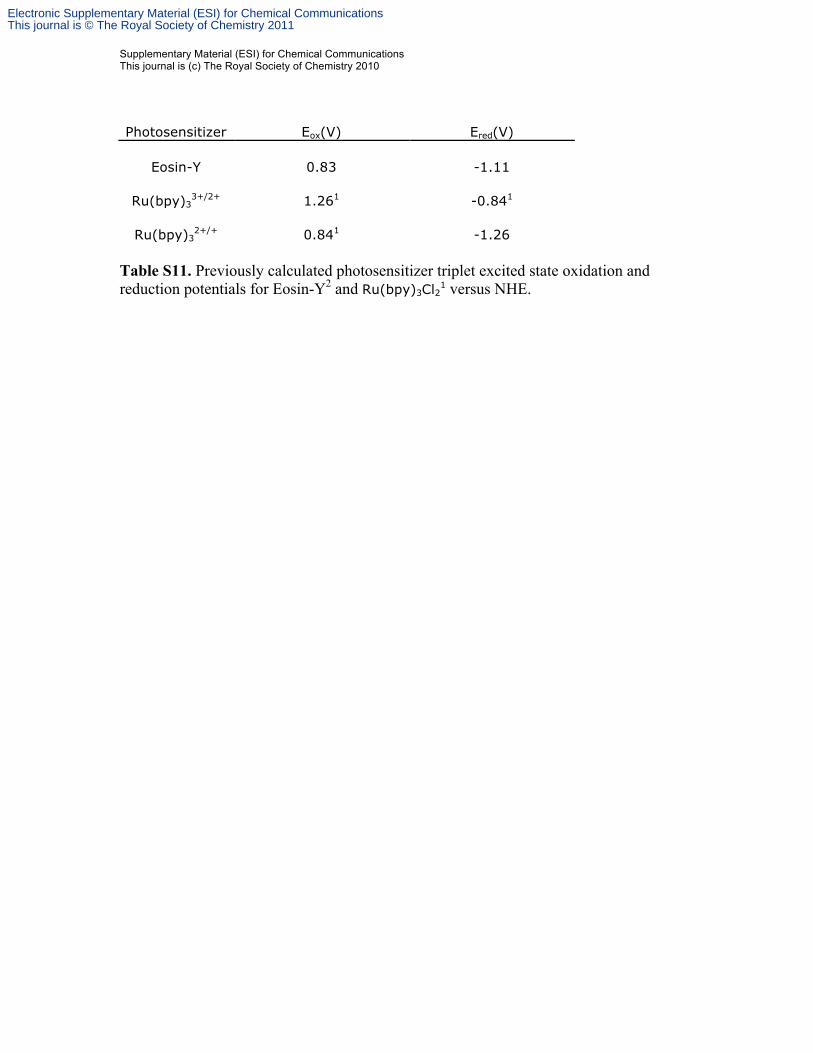
Photosensitizer Eox(V) Ered(V)
Eosin-Y 0.83 -1.11
Ru(bpy)33+/2+ 1.261 -0.841
Ru(bpy)32+/+ 0.841 -1.26
Table S11. Previously calculated photosensitizer triplet excited state oxidation and reduction potentials for Eosin-Y2 and Ru(bpy)3Cl21 versus NHE.
Electronic Supplementary Material (ESI) for Chemical CommunicationsThis journal is © The Royal Society of Chemistry 2011
Supplementary Material (ESI) for Chemical Communications This journal is (c) The Royal Society of Chemistry 2010
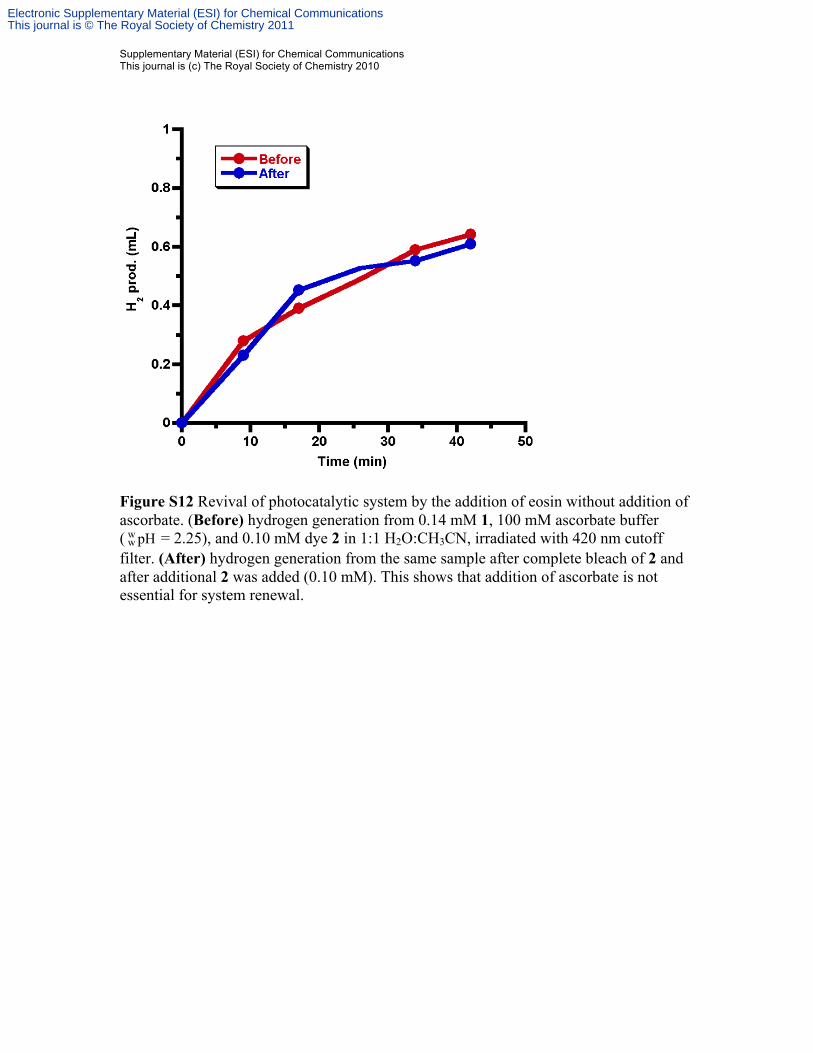
Figure S12 Revival of photocatalytic system by the addition of eosin without addition of ascorbate. (Before) hydrogen generation from 0.14 mM 1, 100 mM ascorbate buffer (
!
ww pH = 2.25), and 0.10 mM dye 2 in 1:1 H2O:CH3CN, irradiated with 420 nm cutoff
filter. (After) hydrogen generation from the same sample after complete bleach of 2 and after additional 2 was added (0.10 mM). This shows that addition of ascorbate is not essential for system renewal.
Electronic Supplementary Material (ESI) for Chemical CommunicationsThis journal is © The Royal Society of Chemistry 2011
Supplementary Material (ESI) for Chemical Communications This journal is (c) The Royal Society of Chemistry 2010
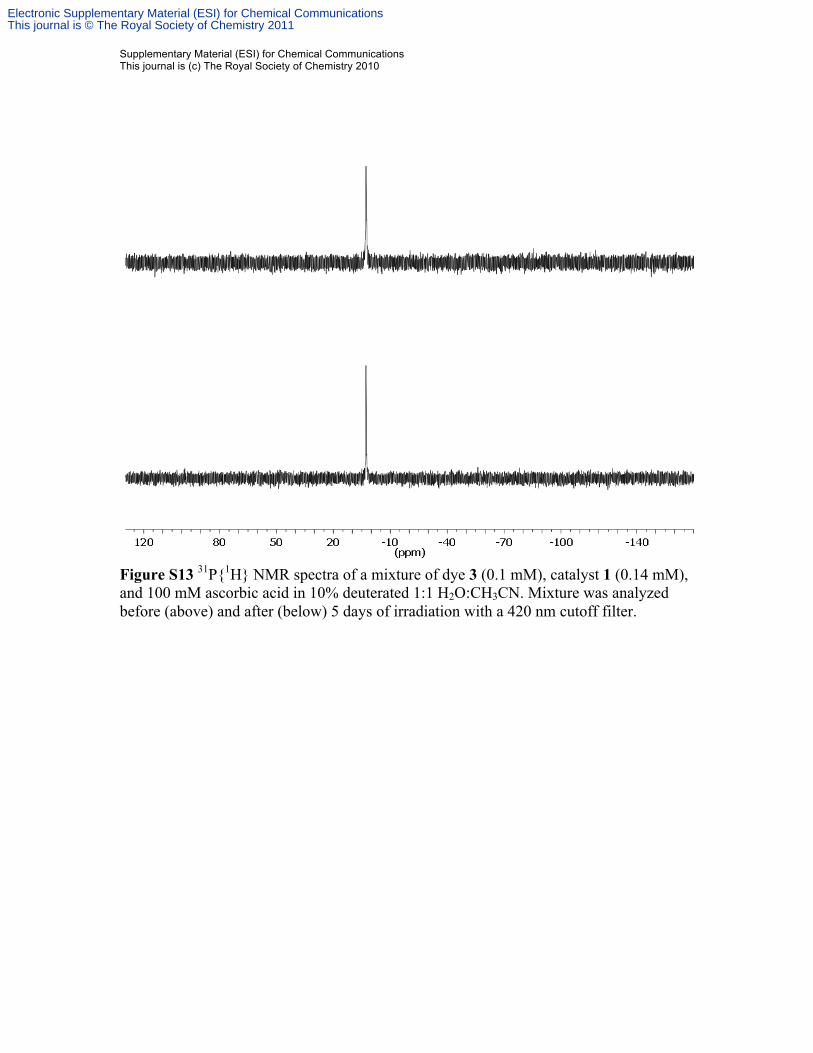
Figure S13 31P{1H} NMR spectra of a mixture of dye 3 (0.1 mM), catalyst 1 (0.14 mM), and 100 mM ascorbic acid in 10% deuterated 1:1 H2O:CH3CN. Mixture was analyzed before (above) and after (below) 5 days of irradiation with a 420 nm cutoff filter.
Electronic Supplementary Material (ESI) for Chemical CommunicationsThis journal is © The Royal Society of Chemistry 2011
Supplementary Material (ESI) for Chemical Communications This journal is (c) The Royal Society of Chemistry 2010
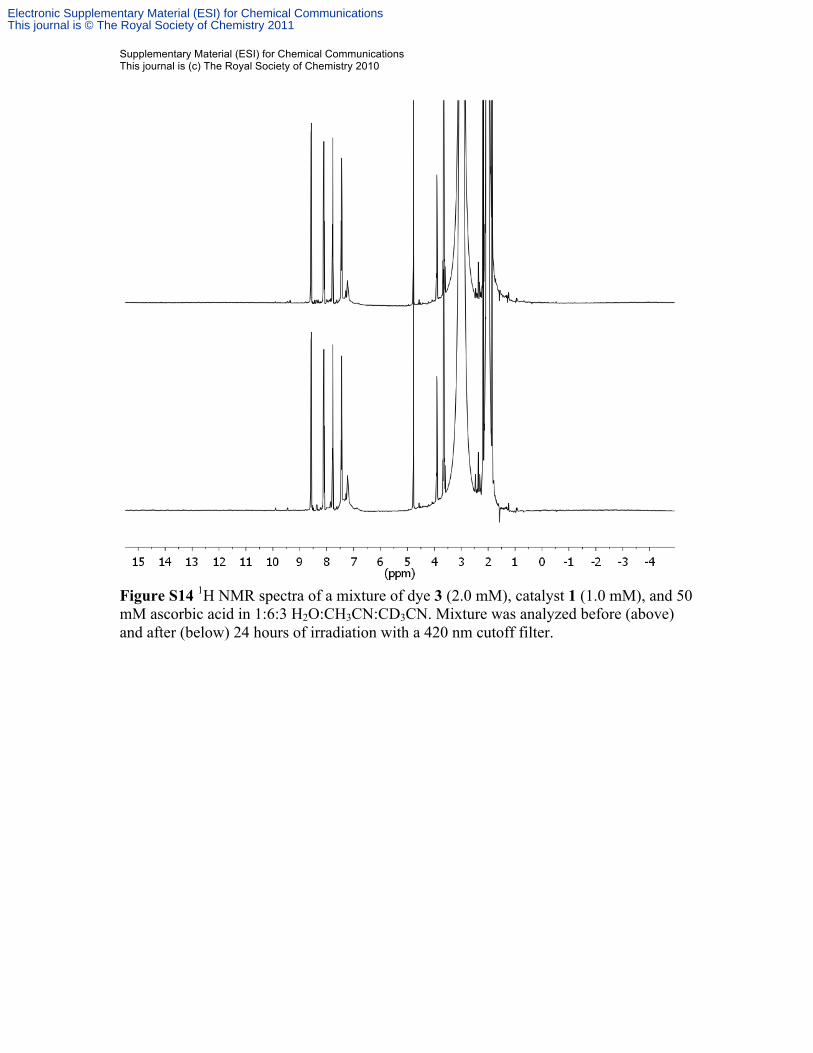
Figure S14 1H NMR spectra of a mixture of dye 3 (2.0 mM), catalyst 1 (1.0 mM), and 50 mM ascorbic acid in 1:6:3 H2O:CH3CN:CD3CN. Mixture was analyzed before (above) and after (below) 24 hours of irradiation with a 420 nm cutoff filter.
Electronic Supplementary Material (ESI) for Chemical CommunicationsThis journal is © The Royal Society of Chemistry 2011
Supplementary Material (ESI) for Chemical Communications This journal is (c) The Royal Society of Chemistry 2010
(a) (b)
(c)
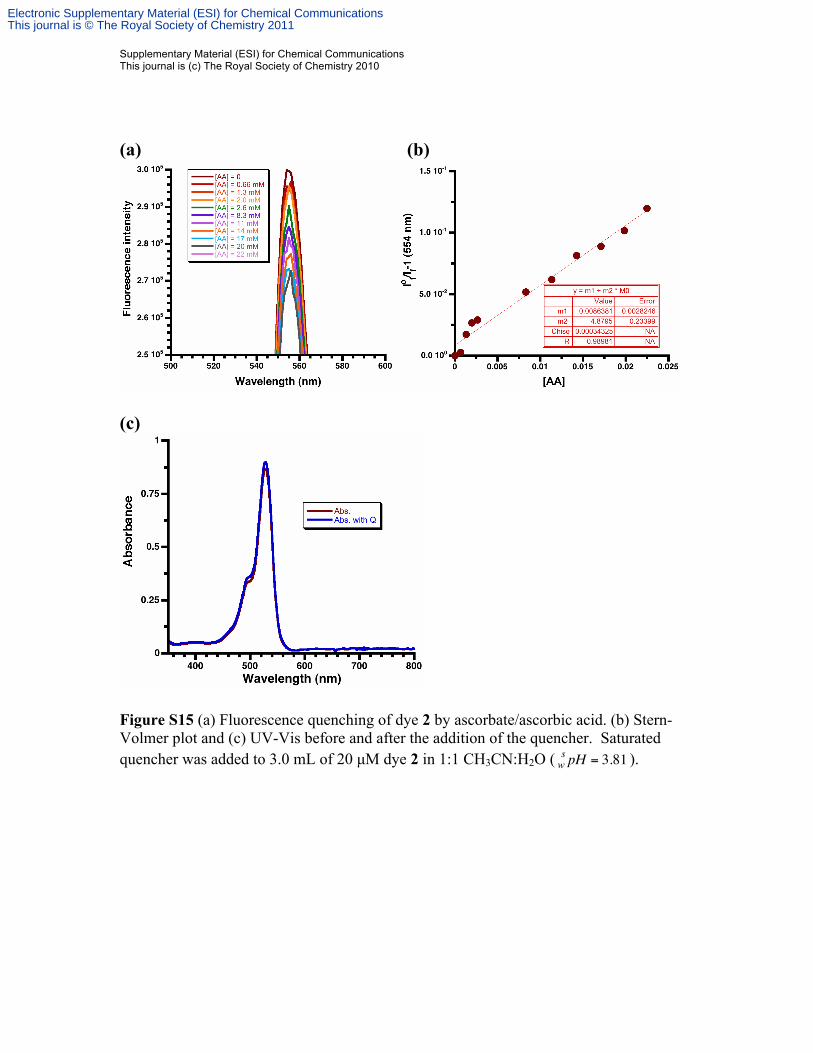
Figure S15 (a) Fluorescence quenching of dye 2 by ascorbate/ascorbic acid. (b) Stern-Volmer plot and (c) UV-Vis before and after the addition of the quencher. Saturated quencher was added to 3.0 mL of 20 µM dye 2 in 1:1 CH3CN:H2O ( w
s pH = 3.81 ).
Electronic Supplementary Material (ESI) for Chemical CommunicationsThis journal is © The Royal Society of Chemistry 2011
Supplementary Material (ESI) for Chemical Communications This journal is (c) The Royal Society of Chemistry 2010
(a) (b)
(c)
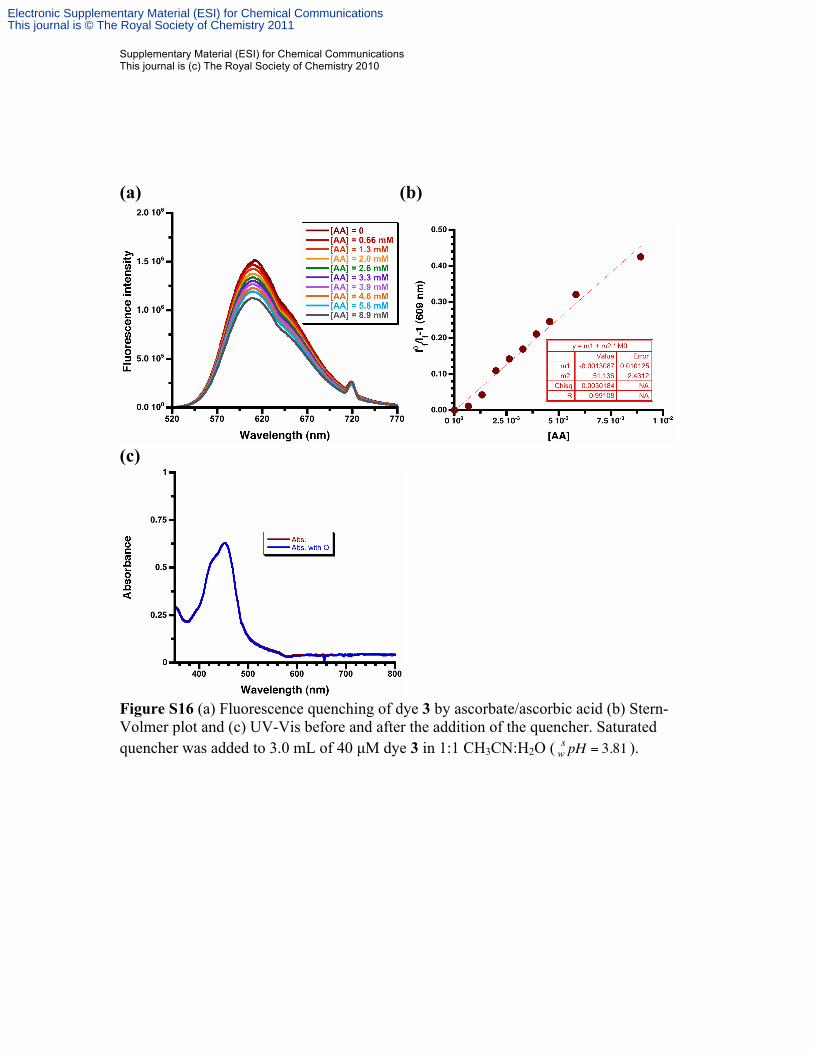
Figure S16 (a) Fluorescence quenching of dye 3 by ascorbate/ascorbic acid (b) Stern-Volmer plot and (c) UV-Vis before and after the addition of the quencher. Saturated quencher was added to 3.0 mL of 40 µM dye 3 in 1:1 CH3CN:H2O ( w
s pH = 3.81 ).
Electronic Supplementary Material (ESI) for Chemical CommunicationsThis journal is © The Royal Society of Chemistry 2011
Supplementary Material (ESI) for Chemical Communications This journal is (c) The Royal Society of Chemistry 2010
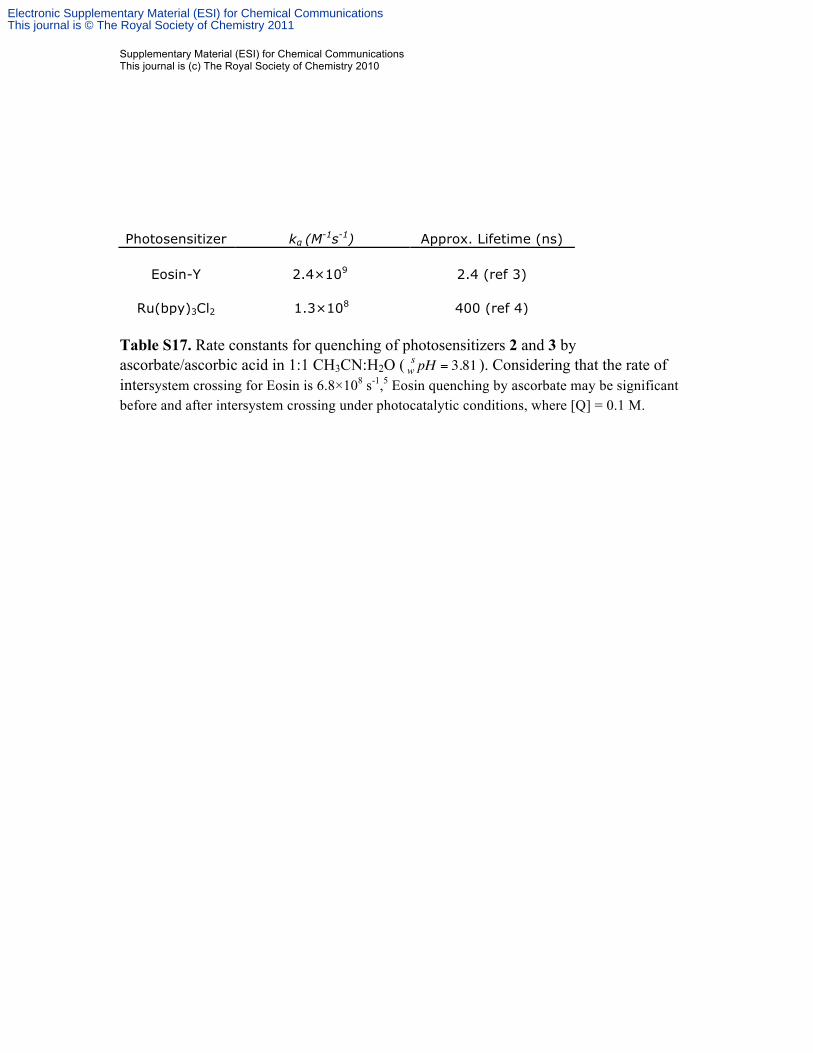
Photosensitizer kq (M-1s-1) Approx. Lifetime (ns)
Eosin-Y 2.4×10⁹ 2.4 (ref 3)
Ru(bpy)3Cl2 1.3×10⁸ 400 (ref 4) Table S17. Rate constants for quenching of photosensitizers 2 and 3 by ascorbate/ascorbic acid in 1:1 CH3CN:H2O ( w
s pH = 3.81 ). Considering that the rate of intersystem crossing for Eosin is 6.8×10⁸ s-1,5 Eosin quenching by ascorbate may be significant before and after intersystem crossing under photocatalytic conditions, where [Q] = 0.1 M.
Electronic Supplementary Material (ESI) for Chemical CommunicationsThis journal is © The Royal Society of Chemistry 2011
Supplementary Material (ESI) for Chemical Communications This journal is (c) The Royal Society of Chemistry 2010
References (1) Bock, C. R.; Connor, J. A.; Gutierrez, A. R.; Meyer, T. J.; Whitten, D. G.; Sullivan, B. P.; Nagle, J. K. Journal of the American Chemical Society 1979, 101, 4815. (2) Lazarides, T.; McCormick, T.; Du, P.; Luo, G.; Lindley, B.; Eisenberg, R. Journal of the American Chemical Society 2009, 131, 9192. (3) Deshpande, A. V.; Iyer, N. B. Journal of Luminescence 1990, 46, 339. (4) Juris, A.; Balzani, V.; Barigelletti, F.; Campagna, S.; Belser, P.; von Zelewsky, A. Coordination Chemistry Reviews 1988, 84, 85. (5) Gerasimova, M. A.; Sizykh, A. G.; Slyusareva, E. A. Journal of Photochemistry and Photobiology B: Biology 2009, 97, 117.
Electronic Supplementary Material (ESI) for Chemical CommunicationsThis journal is © The Royal Society of Chemistry 2011