Embed Size (px)
Citation preview
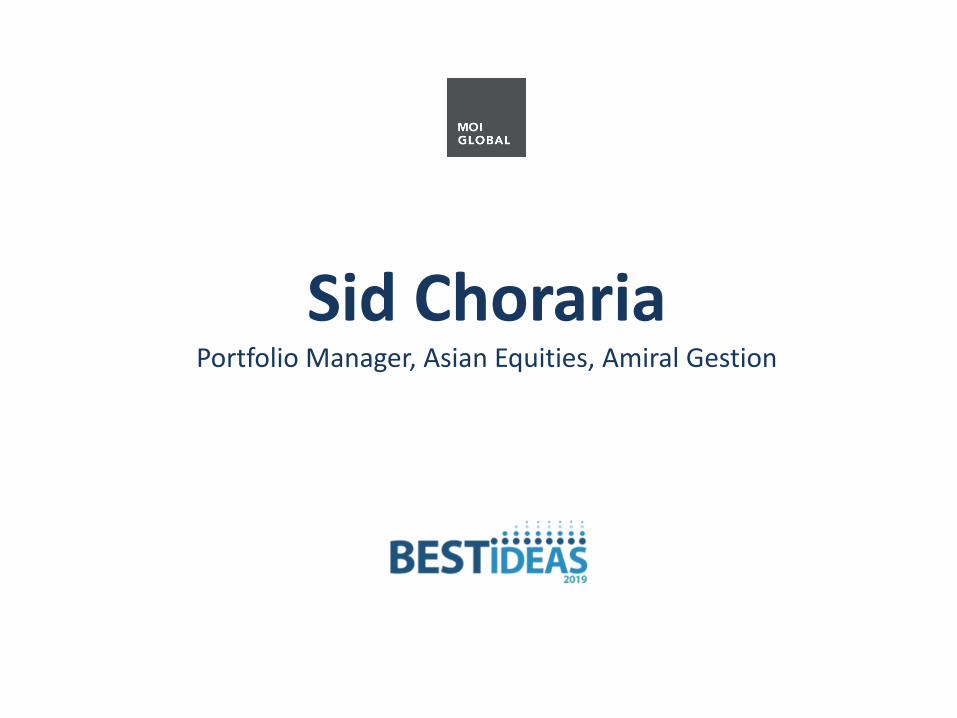
Sid Choraria Portfolio Manager, Asian Equities, Amiral Gestion
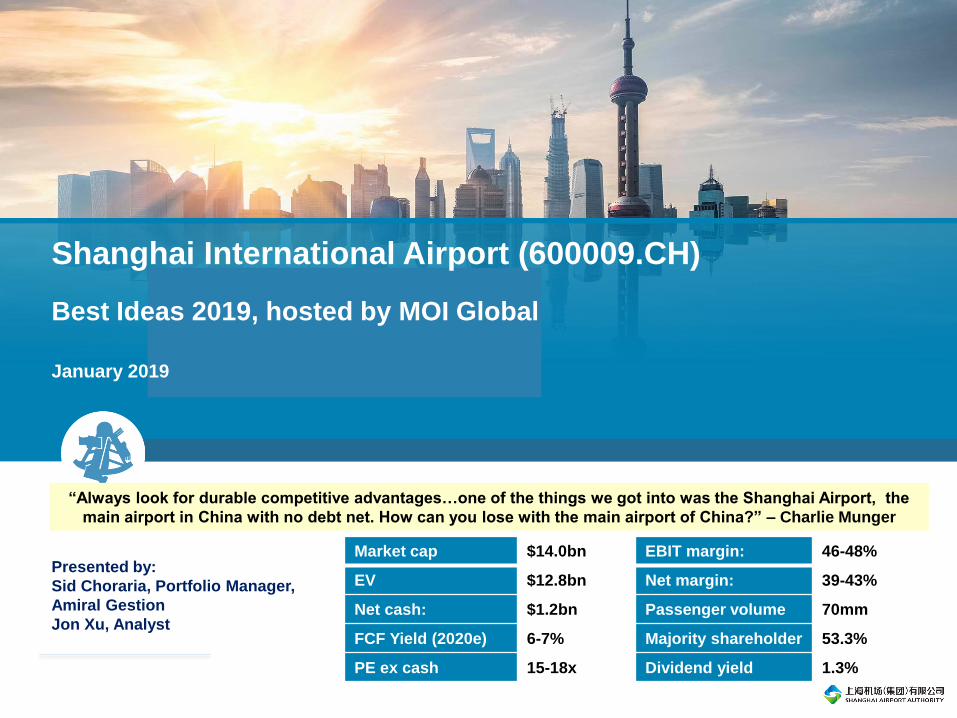
“Always look for durable competitive advantages…one of the things we got into was the Shanghai Airport, the
main airport in China with no debt net. How can you lose with the main airport of China?” – Charlie Munger
Presented by:
Sid Choraria, Portfolio Manager,
Amiral Gestion
Jon Xu, Analyst
Shanghai International Airport (600009.CH)
Best Ideas 2019, hosted by MOI Global
January 2019
Market cap $14.0bn EBIT margin: 46-48%
EV $12.8bn Net margin: 39-43%
Net cash: $1.2bn Passenger volume 70mm
FCF Yield (2020e) 6-7% Majority shareholder 53.3%
PE ex cash 15-18x Dividend yield 1.3%
Section I: Why is Shanghai International Airport Worth Your Attention?
2

3
Charlie Munger on Investing in China and The Example of
Shanghai International Airport
“Always look for durable competitive advantages…one of the things we got into was the Shanghai Airport, the main airport
in China with no debt net. How can you lose with the main airport of China?” – Charlie Munger
4
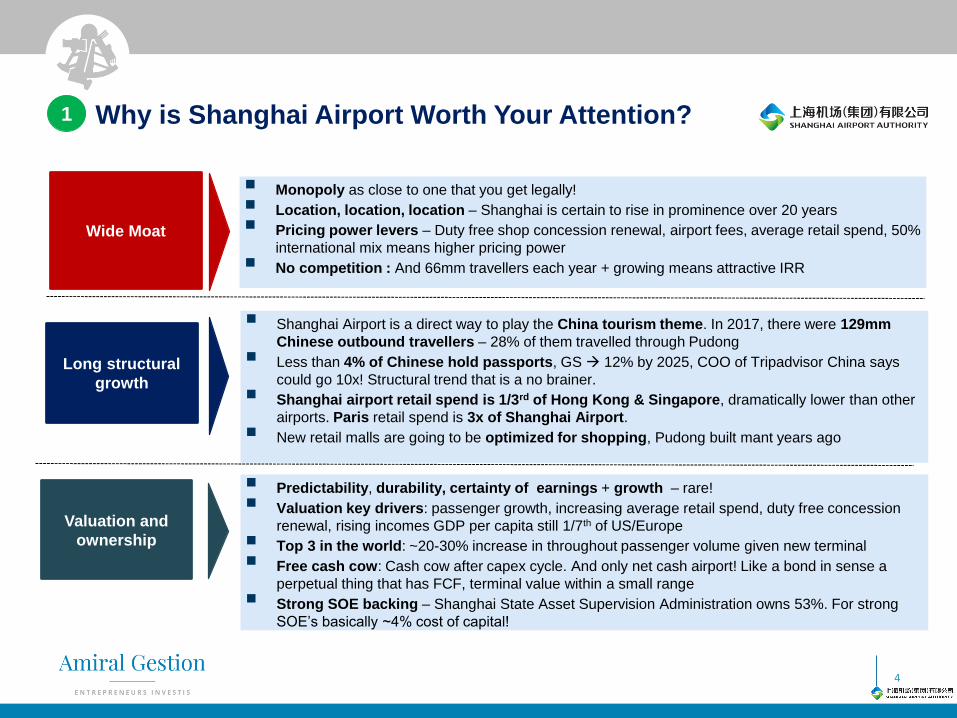
Why is Shanghai Airport Worth Your Attention?1
Wide Moat
Long structural
growth
Valuation and
ownership
▪ Monopoly as close to one that you get legally!
▪ Location, location, location – Shanghai is certain to rise in prominence over 20 years
▪ Pricing power levers – Duty free shop concession renewal, airport fees, average retail spend, 50%
international mix means higher pricing power
▪ No competition : And 66mm travellers each year + growing means attractive IRR
▪ Shanghai Airport is a direct way to play the China tourism theme. In 2017, there were 129mm
Chinese outbound travellers – 28% of them travelled through Pudong
▪ Less than 4% of Chinese hold passports, GS → 12% by 2025, COO of Tripadvisor China says
could go 10x! Structural trend that is a no brainer.
▪ Shanghai airport retail spend is 1/3rd of Hong Kong & Singapore, dramatically lower than other
airports. Paris retail spend is 3x of Shanghai Airport.
▪ New retail malls are going to be optimized for shopping, Pudong built mant years ago
▪ Predictability, durability, certainty of earnings + growth – rare!
▪ Valuation key drivers: passenger growth, increasing average retail spend, duty free concession
renewal, rising incomes GDP per capita still 1/7th of US/Europe
▪ Top 3 in the world: ~20-30% increase in throughout passenger volume given new terminal
▪ Free cash cow: Cash cow after capex cycle. And only net cash airport! Like a bond in sense a
perpetual thing that has FCF, terminal value within a small range
▪ Strong SOE backing – Shanghai State Asset Supervision Administration owns 53%. For strong
SOE’s basically ~4% cost of capital!
5
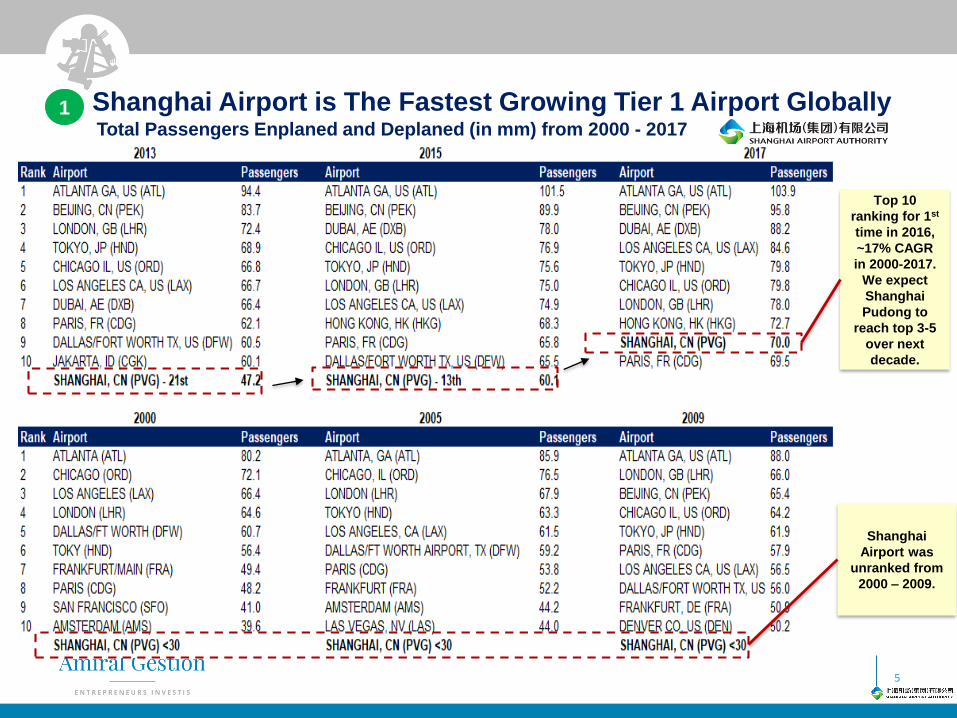
Shanghai Airport is The Fastest Growing Tier 1 Airport Globally1Total Passengers Enplaned and Deplaned (in mm) from 2000 - 2017
Top 10
ranking for 1st
time in 2016,
~17% CAGR
in 2000-2017.
We expect
Shanghai
Pudong to
reach top 3-5
over next
decade.
Shanghai
Airport was
unranked from
2000 – 2009.
6
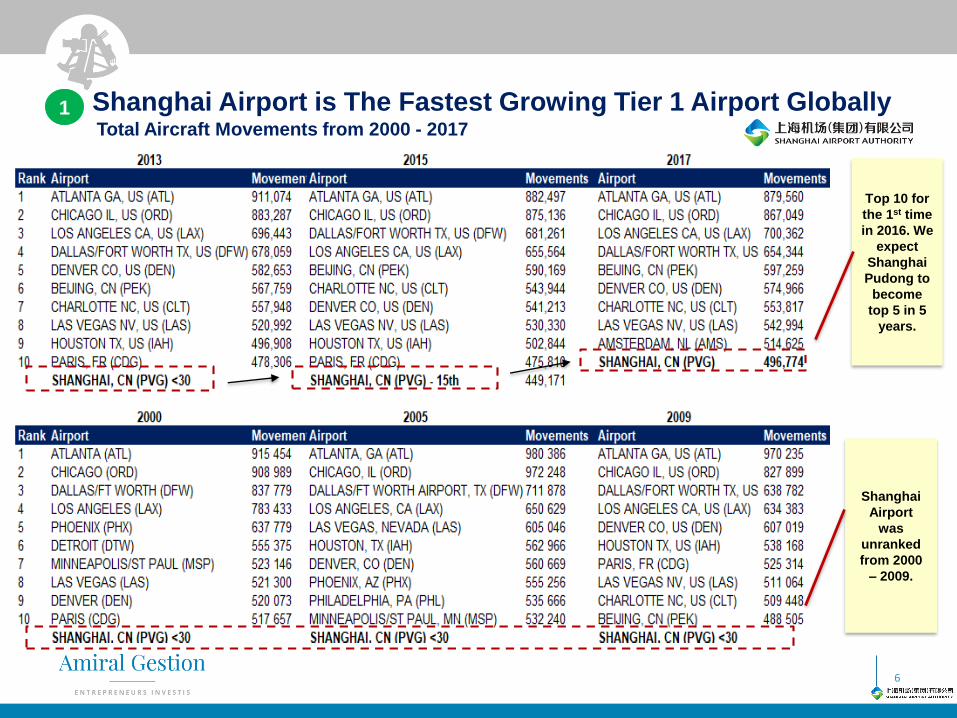
1 Shanghai Airport is The Fastest Growing Tier 1 Airport GloballyTotal Aircraft Movements from 2000 - 2017
Top 10 for
the 1st time
in 2016. We
expect
Shanghai
Pudong to
become
top 5 in 5
years.
Shanghai
Airport
was
unranked
from 2000
– 2009.
7
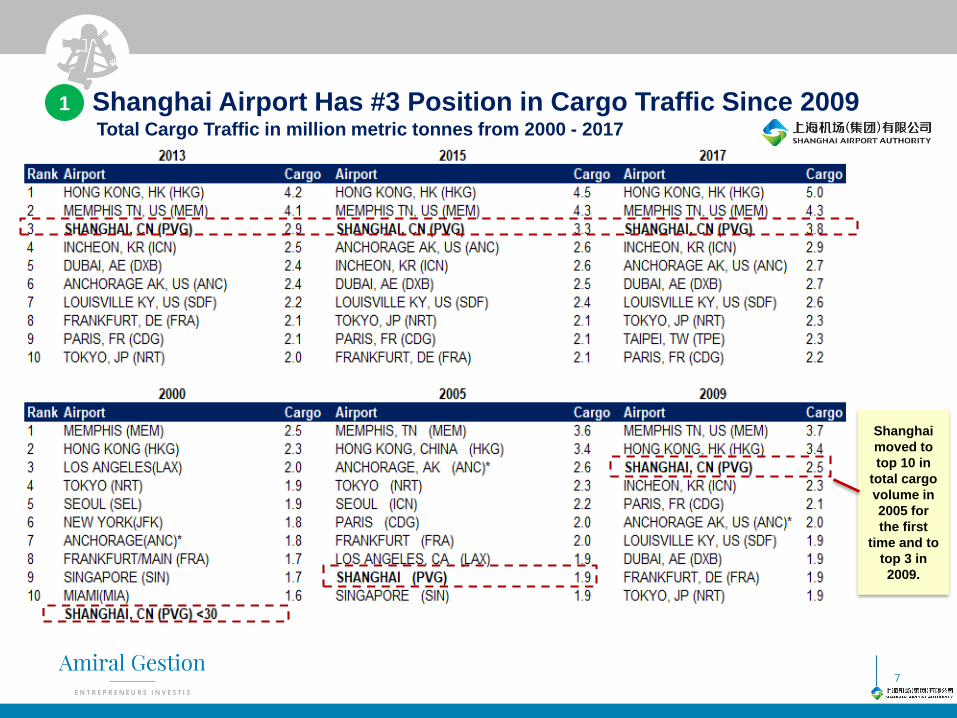
Shanghai Airport Has #3 Position in Cargo Traffic Since 20091
Total Cargo Traffic in million metric tonnes from 2000 - 2017
Shanghai
moved to
top 10 in
total cargo
volume in
2005 for
the first
time and to
top 3 in
2009.

8
Section II: Financials – Predictable and High Earnings Power Through Cycles
Shanghai International Airport
46%
37%
17% Aeronauticalrevenues
Non-aero:commercial rental
Other non-aero
9
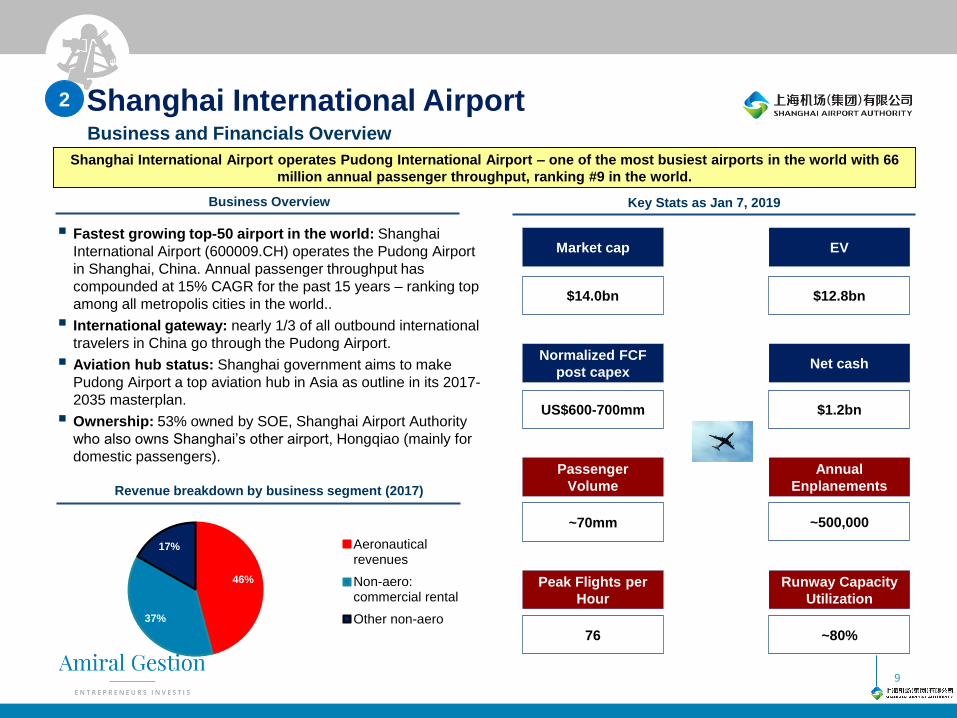
▪ Fastest growing top-50 airport in the world: Shanghai
International Airport (600009.CH) operates the Pudong Airport
in Shanghai, China. Annual passenger throughput has
compounded at 15% CAGR for the past 15 years – ranking top
among all metropolis cities in the world..
▪ International gateway: nearly 1/3 of all outbound international
travelers in China go through the Pudong Airport.
▪ Aviation hub status: Shanghai government aims to make
Pudong Airport a top aviation hub in Asia as outline in its 2017-
2035 masterplan.
▪ Ownership: 53% owned by SOE, Shanghai Airport Authority
who also owns Shanghai’s other airport, Hongqiao (mainly for
domestic passengers).
Revenue breakdown by business segment (2017)
Business Overview Key Stats as Jan 7, 2019
Shanghai International Airport operates Pudong International Airport – one of the most busiest airports in the world with 66
million annual passenger throughput, ranking #9 in the world.
Market cap
$14.0bn
EV
$12.8bn
Normalized FCF
post capex
US$600-700mm
Net cash
$1.2bn
Passenger
Volume
~70mm
Annual
Enplanements
~500,000
Peak Flights per
Hour
76
Runway Capacity
Utilization
~80%
Business and Financials Overview
2

Revenue Growth – Resilient Over Cycles and Expected Increase
Due to 3 Drivers: Passenger Volume, Fee Hikes, Duty Free (1/1) 2
10
Segment revenue breakdown
▪ 2 Revenue segments for Shanghai Airport: i) aeronautical and ii) non-aeronautical
▪ Key drivers include: passenger volume, airport fee hike for aero revenues, concession duty free renewal
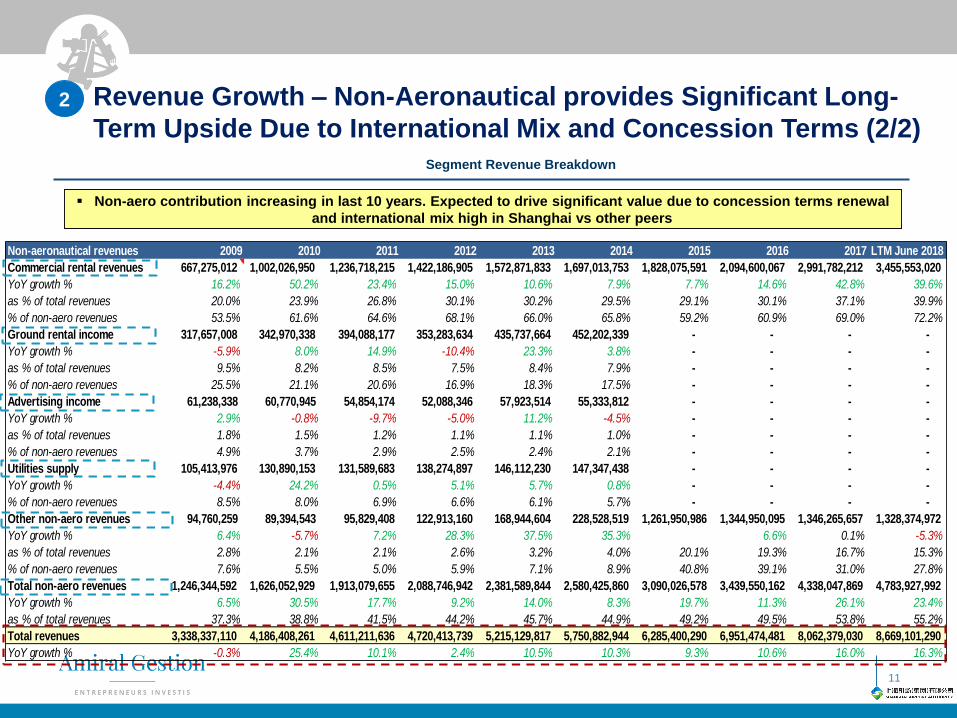
Non-aeronautical revenues 2009 2010 2011 2012 2013 2014 2015 2016 2017 LTM June 2018
Commercial rental revenues 667,275,012 1,002,026,950 1,236,718,215 1,422,186,905 1,572,871,833 1,697,013,753 1,828,075,591 2,094,600,067 2,991,782,212 3,455,553,020
YoY growth % 16.2% 50.2% 23.4% 15.0% 10.6% 7.9% 7.7% 14.6% 42.8% 39.6%
as % of total revenues 20.0% 23.9% 26.8% 30.1% 30.2% 29.5% 29.1% 30.1% 37.1% 39.9%
% of non-aero revenues 53.5% 61.6% 64.6% 68.1% 66.0% 65.8% 59.2% 60.9% 69.0% 72.2%
Ground rental income 317,657,008 342,970,338 394,088,177 353,283,634 435,737,664 452,202,339 - - - -
YoY growth % -5.9% 8.0% 14.9% -10.4% 23.3% 3.8% - - - -
as % of total revenues 9.5% 8.2% 8.5% 7.5% 8.4% 7.9% - - - -
% of non-aero revenues 25.5% 21.1% 20.6% 16.9% 18.3% 17.5% - - - -
Advertising income 61,238,338 60,770,945 54,854,174 52,088,346 57,923,514 55,333,812 - - - -
YoY growth % 2.9% -0.8% -9.7% -5.0% 11.2% -4.5% - - - -
as % of total revenues 1.8% 1.5% 1.2% 1.1% 1.1% 1.0% - - - -
% of non-aero revenues 4.9% 3.7% 2.9% 2.5% 2.4% 2.1% - - - -
Utilities supply 105,413,976 130,890,153 131,589,683 138,274,897 146,112,230 147,347,438 - - - -
YoY growth % -4.4% 24.2% 0.5% 5.1% 5.7% 0.8% - - - -
% of non-aero revenues 8.5% 8.0% 6.9% 6.6% 6.1% 5.7% - - - -
Other non-aero revenues 94,760,259 89,394,543 95,829,408 122,913,160 168,944,604 228,528,519 1,261,950,986 1,344,950,095 1,346,265,657 1,328,374,972
YoY growth % 6.4% -5.7% 7.2% 28.3% 37.5% 35.3% 6.6% 0.1% -5.3%
as % of total revenues 2.8% 2.1% 2.1% 2.6% 3.2% 4.0% 20.1% 19.3% 16.7% 15.3%
% of non-aero revenues 7.6% 5.5% 5.0% 5.9% 7.1% 8.9% 40.8% 39.1% 31.0% 27.8%
Total non-aero revenues 1,246,344,592 1,626,052,929 1,913,079,655 2,088,746,942 2,381,589,844 2,580,425,860 3,090,026,578 3,439,550,162 4,338,047,869 4,783,927,992
YoY growth % 6.5% 30.5% 17.7% 9.2% 14.0% 8.3% 19.7% 11.3% 26.1% 23.4%
as % of total revenues 37.3% 38.8% 41.5% 44.2% 45.7% 44.9% 49.2% 49.5% 53.8% 55.2%
Total revenues 3,338,337,110 4,186,408,261 4,611,211,636 4,720,413,739 5,215,129,817 5,750,882,944 6,285,400,290 6,951,474,481 8,062,379,030 8,669,101,290
YoY growth % -0.3% 25.4% 10.1% 2.4% 10.5% 10.3% 9.3% 10.6% 16.0% 16.3%
Revenue Growth – Non-Aeronautical provides Significant Long-
Term Upside Due to International Mix and Concession Terms (2/2)2
11
▪ Non-aero contribution increasing in last 10 years. Expected to drive significant value due to concession terms renewal
and international mix high in Shanghai vs other peers
Segment Revenue Breakdown

2
12
Revenue Operational Drivers – Passenger Volume, Enplanement
and Average Retail Revenue Per Pax
Passenger volume has grown double digits CAGR for the past 5 years. Average non-aero sales and retail revenue per
passenger are still low compared to global peers
Segment revenue breakdown
13
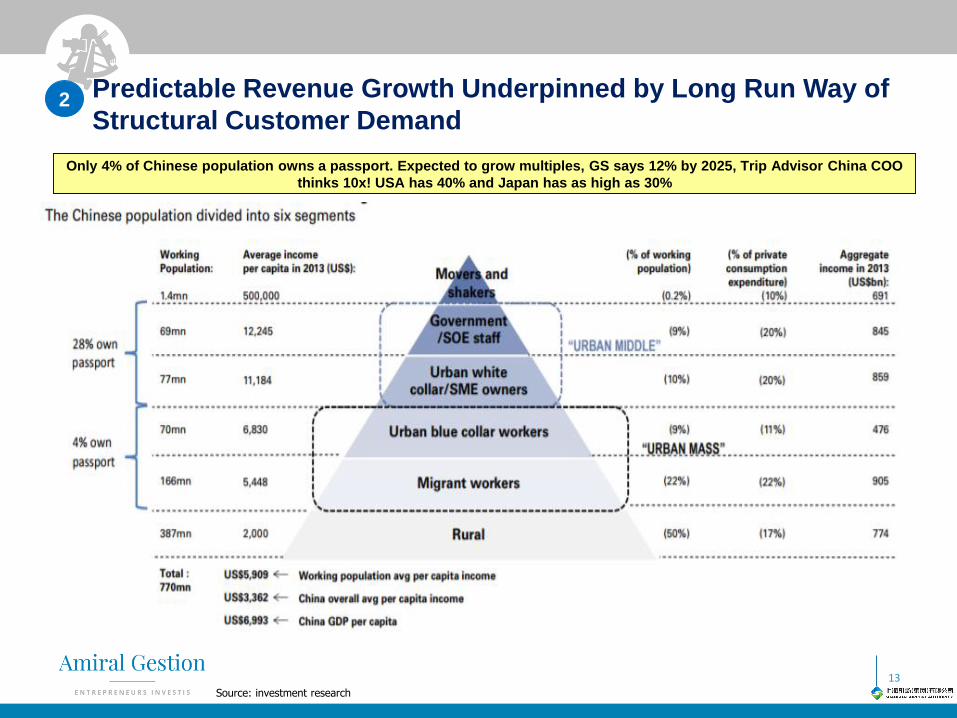
Predictable Revenue Growth Underpinned by Long Run Way of
Structural Customer Demand
Only 4% of Chinese population owns a passport. Expected to grow multiples, GS says 12% by 2025, Trip Advisor China COO
thinks 10x! USA has 40% and Japan has as high as 30%
Source: investment research
2

2
14
Passenger fee comparison across Asia peers
Long Runway for Revenue Growth as Airport Fees and Average Non-
Aero Sales Per Pax Has Room to Grow
Airport fees and average retail sales per passenger are still low in Shanghai International airport and have significant
potential to grow over the next 10 years
Illustrative case study: Paris retail sales per passenger
Source: investment research

Operating Costs Breakdown2
15
The key cost items are labour and depreciation. Operating costs have declined driven by scale and declining labour
costs and D&A relative to revenue growth
Operating cost structure
868 1,157 1,668 1,782
2,352 2,681 2,856 3,144 3,351 3,338 4,186
4,611 4,716 5,215
5,751 6,285
6,951
8,062 8,669
2000 2001 2002 2003 2004 2005 2006 2007 2008 2009 2010 2011 2012 2013 2014 2015 2016 2017 LTMJune2018
0
2,000
4,000
6,000
8,000
10,000
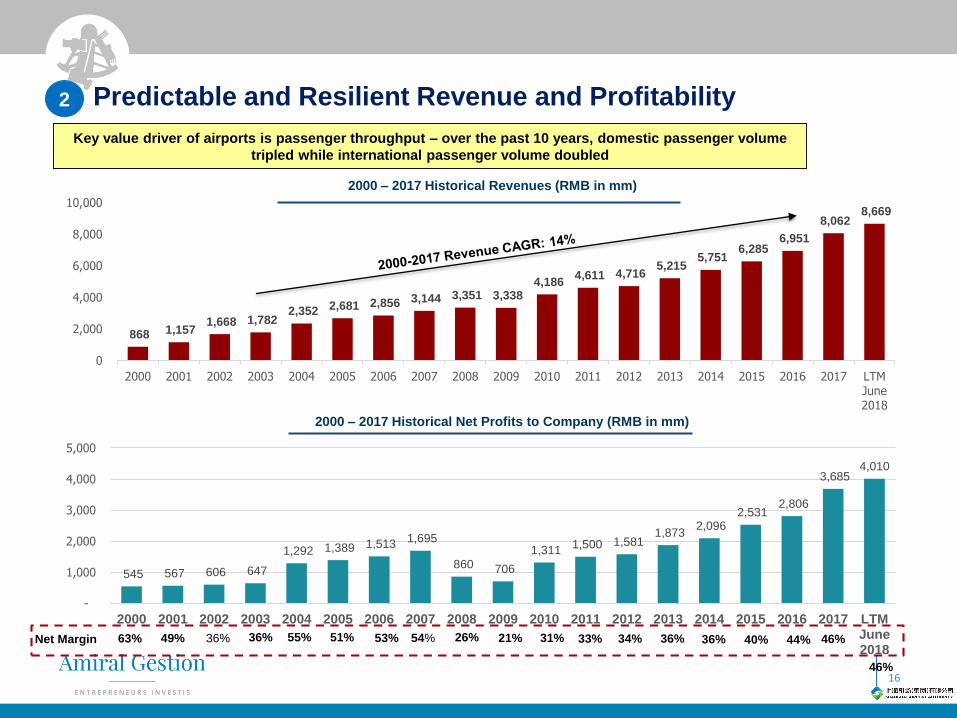
Predictable and Resilient Revenue and Profitability2
Key value driver of airports is passenger throughput – over the past 10 years, domestic passenger volume
tripled while international passenger volume doubled
16
2000 – 2017 Historical Revenues (RMB in mm)
2000 – 2017 Historical Net Profits to Company (RMB in mm)
545 567 606 647
1,292 1,389 1,513 1,695
860 706
1,311 1,500 1,581
1,873 2,096
2,531 2,806
3,685 4,010
-
1,000
2,000
3,000
4,000
5,000
2000 2001 2002 2003 2004 2005 2006 2007 2008 2009 2010 2011 2012 2013 2014 2015 2016 2017 LTMJune2018
Net Margin 63% 49% 36% 36% 55% 51% 53% 54% 26% 21% 31% 33% 34% 36% 36% 40% 44% 46%
46%
Growth Driver: 2018 Duty Free Concession Renewal
17
2
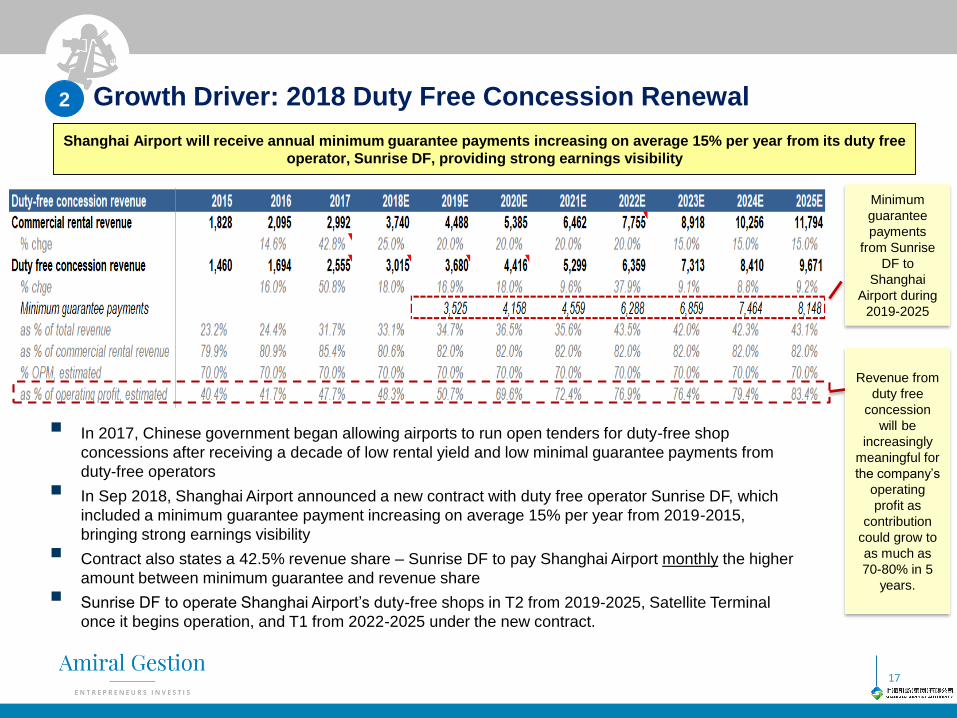
▪ In 2017, Chinese government began allowing airports to run open tenders for duty-free shop
concessions after receiving a decade of low rental yield and low minimal guarantee payments from
duty-free operators
▪ In Sep 2018, Shanghai Airport announced a new contract with duty free operator Sunrise DF, which
included a minimum guarantee payment increasing on average 15% per year from 2019-2015,
bringing strong earnings visibility
▪ Contract also states a 42.5% revenue share – Sunrise DF to pay Shanghai Airport monthly the higher
amount between minimum guarantee and revenue share
▪ Sunrise DF to operate Shanghai Airport’s duty-free shops in T2 from 2019-2025, Satellite Terminal
once it begins operation, and T1 from 2022-2025 under the new contract.
Shanghai Airport will receive annual minimum guarantee payments increasing on average 15% per year from its duty free
operator, Sunrise DF, providing strong earnings visibility
Minimum
guarantee
payments
from Sunrise
DF to
Shanghai
Airport during
2019-2025
Revenue from
duty free
concession
will be
increasingly
meaningful for
the company’s
operating
profit as
contribution
could grow to
as much as
70-80% in 5
years.
Growth Driver: New Satellite Terminal to Begin Operations in 2019
18
2
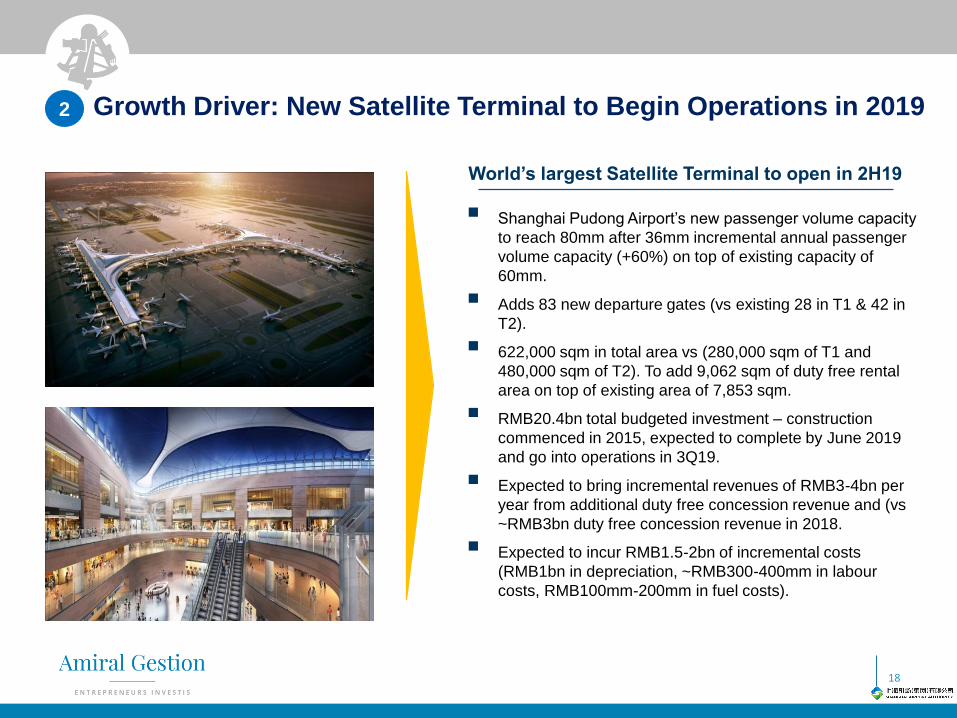
World’s largest Satellite Terminal to open in 2H19
▪ Shanghai Pudong Airport’s new passenger volume capacity
to reach 80mm after 36mm incremental annual passenger
volume capacity (+60%) on top of existing capacity of
60mm.
▪ Adds 83 new departure gates (vs existing 28 in T1 & 42 in
T2).
▪ 622,000 sqm in total area vs (280,000 sqm of T1 and
480,000 sqm of T2). To add 9,062 sqm of duty free rental
area on top of existing area of 7,853 sqm.
▪ RMB20.4bn total budgeted investment – construction
commenced in 2015, expected to complete by June 2019
and go into operations in 3Q19.
▪ Expected to bring incremental revenues of RMB3-4bn per
year from additional duty free concession revenue and (vs
~RMB3bn duty free concession revenue in 2018.
▪ Expected to incur RMB1.5-2bn of incremental costs
(RMB1bn in depreciation, ~RMB300-400mm in labour
costs, RMB100mm-200mm in fuel costs).

Quality Business Checklist
The Business
▪ Long history: Shanghai airport has a long operating history with over 20 years as a listed company. The
company has successfully gone through 2 capex cycles to grow traffic 66mm passengers
▪ Predictable earnings power : The company has predictable earnings power as it is a monopoly with pricing
power with no competition. Moreover, only 4% of Chinese have passports, and this is definitely expected to
increase over the next 10-20 years, offering very predictable customer stickiness to Shanghai Airport
▪ Non-cyclicality: Even in its worst year, Shanghai Airport had net margins of over 20%. Since 1997, the
company has had only one year of revenue decline of -0.4% (in 2009!)
▪ High barriers to entry: No new competitive entrant!
Management &
Corporate
Culture
Quality of
Financials
▪ Strong SOE backing: Strategic monopoly position secured by Shanghai municipal government - who is
ultimate majority shareholder
▪ Capital allocation: Good track record in growing Pudong Airport through two investment cycles into one of
most important aviation hubs in the world
▪ Dividends: Deployment of cash could be better, with higher dividends.
▪ Corporate governance: SOE shareholders are not known for the best corporate governance and
transparence - hard to gain management access and poor communciation with shareholders
▪ Core business has remained profitable for over a decade.
▪ Strong FCF generation which will increase post the capex cycle
▪ ROI during past investment cycle iin around 2007 was 30%+ - high among peers
▪ Upside or downside potential to profitability: Upside contains lots of room for positive surprises including
rise in average retail spend per pax, further airport fee hikes, improved revenue sharing agreements with
duty-free operators. On the downside, aviation demand is quite sensitive to economic health and emergency
incidents that affect peoples' perception of safetiness of air travel
19
Shanghai Airport is a high quality asset that is predictable, durable and offers growth
2
20
Section III: Valuation – High Quality Company with a Wide Moat At a Fair Price
21
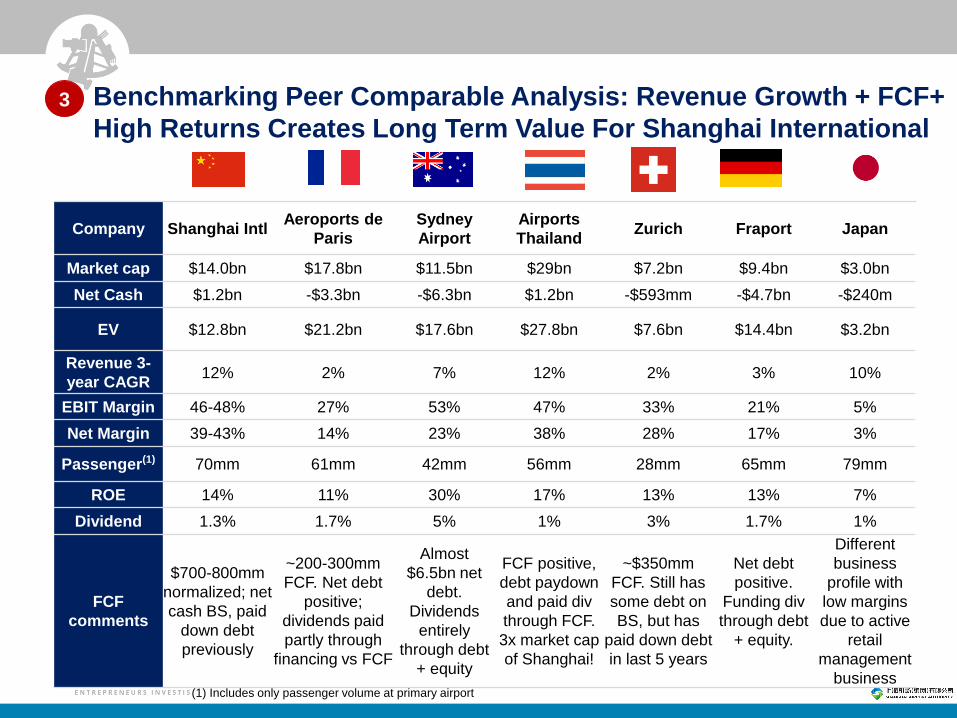
Benchmarking Peer Comparable Analysis: Revenue Growth + FCF+
High Returns Creates Long Term Value For Shanghai International 3
Company Shanghai IntlAeroports de
Paris
Sydney
Airport
Airports
ThailandZurich Fraport Japan
Market cap $14.0bn $17.8bn $11.5bn $29bn $7.2bn $9.4bn $3.0bn
Net Cash $1.2bn -$3.3bn -$6.3bn $1.2bn -$593mm -$4.7bn -$240m
EV $12.8bn $21.2bn $17.6bn $27.8bn $7.6bn $14.4bn $3.2bn
Revenue 3-
year CAGR12% 2% 7% 12% 2% 3% 10%
EBIT Margin 46-48% 27% 53% 47% 33% 21% 5%
Net Margin 39-43% 14% 23% 38% 28% 17% 3%
Passenger(1) 70mm 61mm 42mm 56mm 28mm 65mm 79mm
ROE 14% 11% 30% 17% 13% 13% 7%
Dividend 1.3% 1.7% 5% 1% 3% 1.7% 1%
FCF
comments
$700-800mm
normalized; net
cash BS, paid
down debt
previously
~200-300mm
FCF. Net debt
positive;
dividends paid
partly through
financing vs FCF
Almost
$6.5bn net
debt.
Dividends
entirely
through debt
+ equity
FCF positive,
debt paydown
and paid div
through FCF.
3x market cap
of Shanghai!
~$350mm
FCF. Still has
some debt on
BS, but has
paid down debt
in last 5 years
Net debt
positive.
Funding div
through debt
+ equity.
Different
business
profile with
low margins
due to active
retail
management
business (1) Includes only passenger volume at primary airport
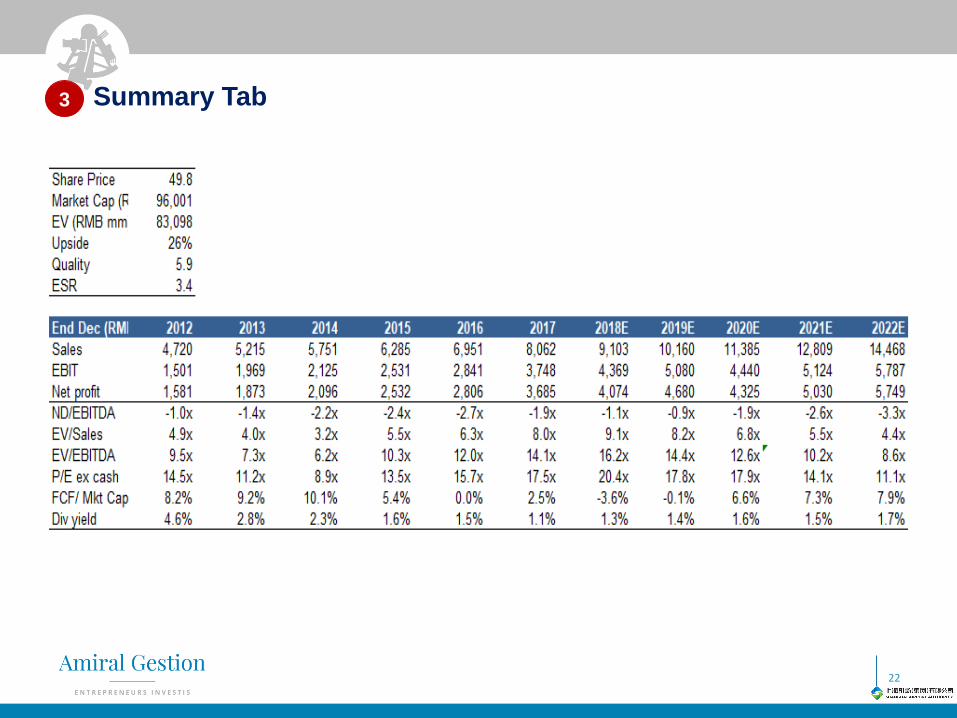
Summary Tab
22
3

23
Disclaimer
This document is confidential and shall not be distributed, disclosed or reproduced, in whole or in part, and the information itcontains shall not be disclosed by its recipients to any third party without the prior written consent of Amiral Gestion.
This document is not contractual and has been prepared as a working paper. It does not constitute an offer to sell or aninvestment recommendation. This document is not soliciting any action based on this document and it does not constitute apersonal recommendation, investment advice or an offer to sell. Reliance on this document for the purpose of engaging in anyinvestment activity may expose an individual to a significant risk of losing all of the property or other assets invested. Please notethat future returns depend upon future economic conditions. Past performance is not an indication of future performance. Thevalue of your investment may go down as well as up. Tax treatments depend on the individual circumstances of each investor andmay be subject to change in the future.