Embed Size (px)
Citation preview
Mike Glen – Flight Performance
SID Climb Gradient Study 2016 A Study of 42 International Airports
Heathrow Community Noise Forum 14/04/16
The Aims
• To benchmark Heathrow operations against other international airports
to understand how our departure procedures compare
• Better inform future projects and procedural updates by understanding
what other airports are doing
• Investigate which airports are using conventional / PBN SIDs
• Gain an insight into what procedures our airlines are following around
the world
• Better answer community enquiries on our operation and how we
compare

Limitations
• Study examines minimum published climb gradients for SID’s at the
airports included in the study.
• It does not consider actual performance of aircraft types and airlines
against stated climb gradients. This is impossible to do without
knowing a wide number of variables.
• Some of the steeper SID climb gradients contain restrictions on aircraft
types so are not available for all aircraft.
• Heathrow has a minimum published climb gradient of 4% for noise
abatement reasons. However some of the SID’s have steeper climb
gradients for airspace and ATC purposes.
• The intention of this work is to make a first step to benchmark
Heathrow against airports worldwide. The Next Steps slide details how
this study will be used going forwards.
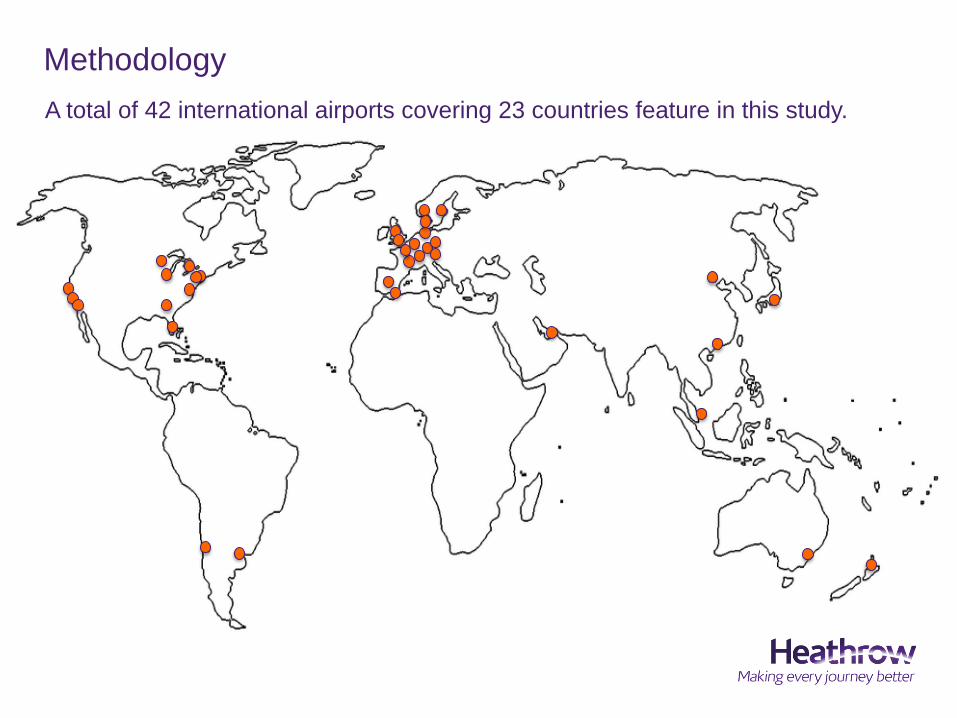
Methodology
A total of 42 international airports covering 23 countries feature in this study.

Methodology
• The airports that feature in this study were chosen as they are within a similar
regulatory environment to HAL and feature in other benchmarking studies e.g
Noise Action Plan Benchmarking Study 2013.
• These airports also represent a good cross section of different aerodrome heights,
surrounding terrain and average local temperatures which are all considerations
when looking at aircraft climb performance.
Information Gathering
• Information from this study has been gathered from recognized aviation sources
which are publicly available; this includes AIS websites, airnav.com and nformation
from Jeppesen databases
• It is important to note that not all SIDs have been listed individually. Some airports
have 100+ procedures so summaries have been provided.
• Information gathered includes climb gradient, end altitude of the procedure, use of
PBN and any other relevant noise mitigation methods
N.B - The information in this presentation and associated spread sheet has been
taken directly from the published procedural plate. No approach has been made to the
associated airport to verify the information.

Climb Gradient Analysis This table shows how many airports have published climb gradients within
the defined %age brackets.
**
< 4% 4% 4.1% - 5% 5.1% - 6% 6.1% - 7% 7.1% - 8% 8.1% - 9% 9.1% - 10% 10.1% - 11% 11.1% - 12% 12.1% - 13% 13.1% - 14% 14.1% - 15%
Eindhoven
Heathrow
Brussels
Amsterdam
Santiago
Buenos Aires
Frankfurt
Paris CDG
NYC JFK
Madrid
Sydney
Salzburg
Toronto Pearson
Hong Kong
Beijing
Prague
Copenhagen
Paris Orly
Dusseldorf
Munich
Tokyo Haneda
Singapore
Auckland
Oslo
Barcelona
Stockholm
Zurich
Geneva
Dubai
Gatwick
Stansted
Manchester
London City
Farnborough
John Wayne
Minneapolis
Chicago O'Hare
Los Angeles
San Francisco
Ronald Regan National
Atlanta
La Guardia
Orlando

Amsterdam Summary
• AMS only specifies set climb gradients from 2 of
it’s 4 runways – Rway 04 and 09
Rway 04 - 4% Rway 09 – 3.8%
ANDIK2F ANDIK1N
ARNEM2F ARNEM2N
LEKKO1F LEKKO1N
LOPIK1F LOPIK1N
LUNIX1F LUNIX1N
• These SIDs originate from the shortest runways
and are closest to the city so it is likely that the
climb gradient is specified for noise abatement
and for integration into other SIDS
• PRNAV Procedures are only available for STARs
09
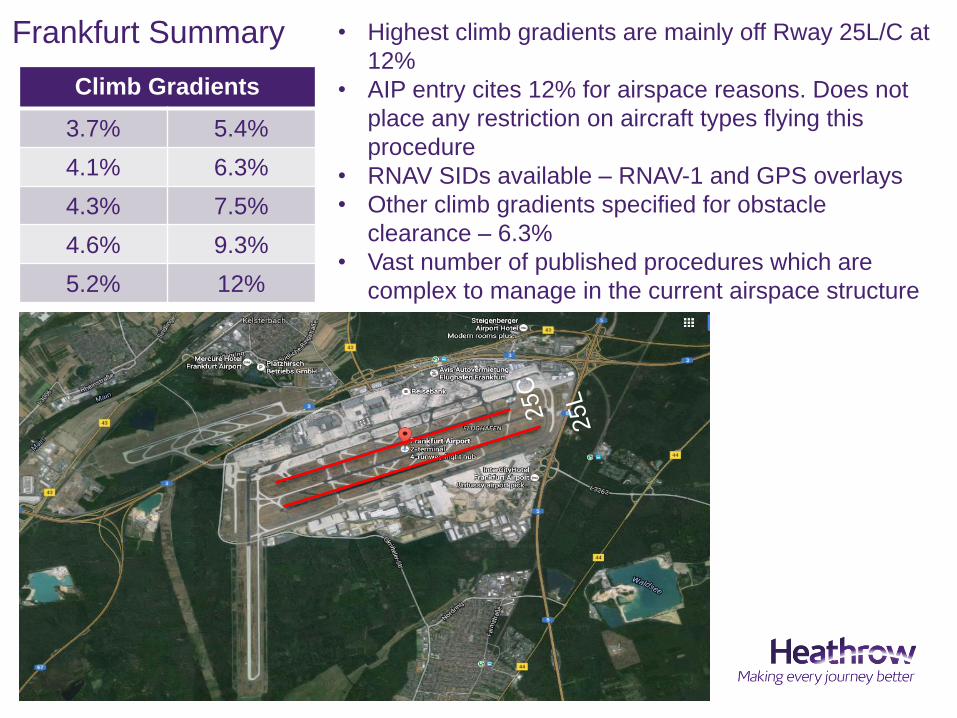
Frankfurt Summary
Climb Gradients
3.7% 5.4%
4.1% 6.3%
4.3% 7.5%
4.6% 9.3%
5.2% 12%
• Highest climb gradients are mainly off Rway 25L/C at
12%
• AIP entry cites 12% for airspace reasons. Does not
place any restriction on aircraft types flying this
procedure
• RNAV SIDs available – RNAV-1 and GPS overlays
• Other climb gradients specified for obstacle
clearance – 6.3%
• Vast number of published procedures which are
complex to manage in the current airspace structure
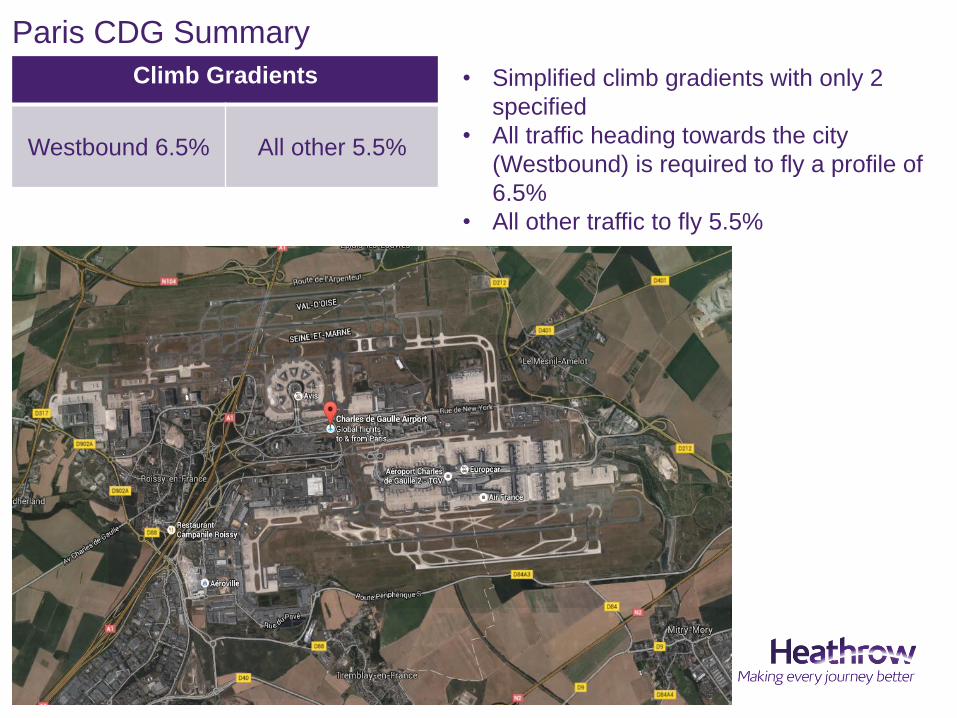
Paris CDG Summary
Climb Gradients
Westbound 6.5% All other 5.5%
• Simplified climb gradients with only 2
specified
• All traffic heading towards the city
(Westbound) is required to fly a profile of
6.5%
• All other traffic to fly 5.5%
The Next Steps
Now the main bulk of information has been gathered, further studies and
analysis can be carried out with ease.
We are now proposing to:
1. Look at airport climb gradients in more detail to identify best practice for
airports with similar traffic eg types and load factors to EGLL i.e those
airports with heavy ultra long haul aircraft departing on climb gradients
greater than 4%
2. Look at the steeper climb gradients in more detail to understand the
restrictions
3. Present the data to the Heathrow Noise Forum and the Community
Noise Forum
4. Approach other airports to discuss actual performance and adherence
to the published gradients
5. Continue engaging with our airline partners in relation to climb gradient
performance
Source List
UK AIS – www.ais.org.uk
Airnav – www.airnav.com
Aus AIS - www.airservicesaustralia.com/aip/pending/dap/aeroprocchartstoc.htm
HK AIS - http://www.hkatc.gov.hk/HK_AIP/ad.htm
Chinese Data - http://opennav.com/airport/ZBAA
NZ AIS - www.aip.net.nz
EU AIS - https://www.ead.eurocontrol.int/eadcms/eadsite/index.php.html


![Climb Slideshow[1]](https://img.pdfslide.net/doc/110x75/555c0aafd8b42ad77e8b48e2/climb-slideshow1.jpg)