Embed Size (px)
Citation preview
© Siemens AG 2010. All rights reserved.
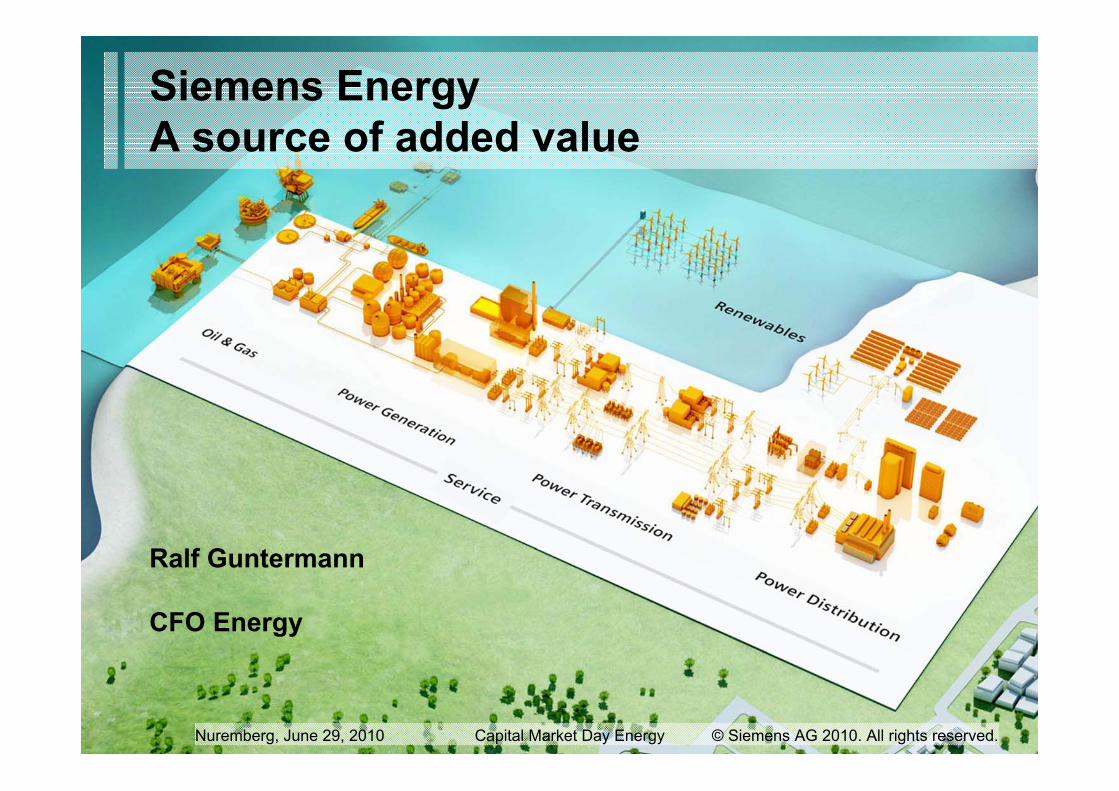
Siemens EnergyA source of added value
Ralf Guntermann
CFO Energy
Nuremberg, June 29, 2010 Capital Market Day Energy © Siemens AG 2010. All rights reserved.
© Siemens AG 2010. All rights reserved.June 29, 2010 Capital Market Day Energy Page 2
Safe Harbour Statement
This document contains forward-looking statements and information – that is, statements related to future, not past, events. These statements may be identified by words such as "expects," "looks forward to", "anticipates", "intends", "plans", "believes", "seeks", "estimates", "will", "project" or words of similar meaning. Such statements are based on the current expectations and certain assumptions of Siemens' management, and are, therefore, subject to certain risks and uncertainties. A variety of factors, many of which are beyond Siemens' control, affect Siemens' operations, performance, business strategy and results and could cause the actual results, performance or achievements of Siemens to be materially different from any future results, performance or achievements that may be expressed or implied by such forward-looking statements. For Siemens, particular uncertainties arise, among others, from changes in general economic and business conditions (including margin developments in major business areas and recessionary trends); the possibility that customers may delay the conversion of booked orders into revenue or that prices will decline as a result of continued adverse market conditions to a greater extent than currently anticipated by Siemens' management; developments in the financial markets, including fluctuations in interest and exchange rates, commodity and equity prices, debt prices (credit spreads) and financial assets generally; continued volatility and a further deterioration of the capital markets; a worsening in the conditions of the credit business and, in particular, additional uncertainties arising out of the subprime, financial market and liquidity crises; future financial performance of major industries that Siemens serves, including, without limitation, the Sectors Industry, Energy and Healthcare; the challenges of integrating major acquisitions and implementing joint ventures and other significant portfolio measures; the introduction of competing products or technologies by other companies; a lack of acceptance of new products or services by customers targeted by Siemens; changes in business strategy; the outcome of pending investigations and legal proceedings and actions resulting from the findings of these investigations; the potential impact of such investigations and proceedings on Siemens' ongoing business including its relationships with governments and other customers; the potential impact of such matters on Siemens' financial statements; as well as various other factors. More detailed information about certain of the risk factors affecting Siemens is contained throughout this report and in Siemens' other filings with the SEC, which are available on the Siemens website, www.siemens.com, and on the SEC’s website, www.sec.gov. Should one or more of these risks or uncertainties materialize, or should underlying assumptions prove incorrect, actual results may vary materially from those described in the relevant forward-looking statement as expected, anticipated, intended, planned, believed, sought, estimated or projected. Siemens does not intend or assume any obligation to update or revise these forward-looking statements in light of developments which differ from those anticipated.
New orders and backlog; adjusted or organic growth rates of Revenue and new orders; book-to-bill ratio; return on equity, or ROE; return on capital employed, or ROCE; Free cash flow; cash conversion rate, or CCR; EBITDA (adjusted); EBIT (adjusted); earnings effect from purchase price allocation (PPA effects) and integration costs; net debt and adjusted industrial net debt are or may be non-GAAP financial measures. These supplemental financial measures should not be viewed in isolation as alternatives to measures of Siemens’ financial condition, results of operations or cash flows as presented in accordance with IFRS in its Consolidated Financial Statements. A definition of these supplemental financial measures, a reconciliation to the most directly comparable IFRS financial measures and information regarding the usefulness and limitations of these supplemental financial measures can be found on Siemens' Investor Relations website at www.siemens.com/nonGAAP. For additional information, see "Supplemental financial measures" and the related discussion in Siemens' annual report on Form 20-F, which can be found on Siemens' Investor Relations website or via the EDGAR system on the website of the United States Securities and ExchangeCommission.
© Siemens AG 2010. All rights reserved.June 29, 2010 Capital Market Day Energy Page 3
Powerful Sector performance backed by strong financial and control infrastructure
Sector on track to deliver all key metrics
Operational excellence continually improving
Focused on delivering consistent and sustainable value
© Siemens AG 2010. All rights reserved.June 29, 2010 Capital Market Day Energy Page 4
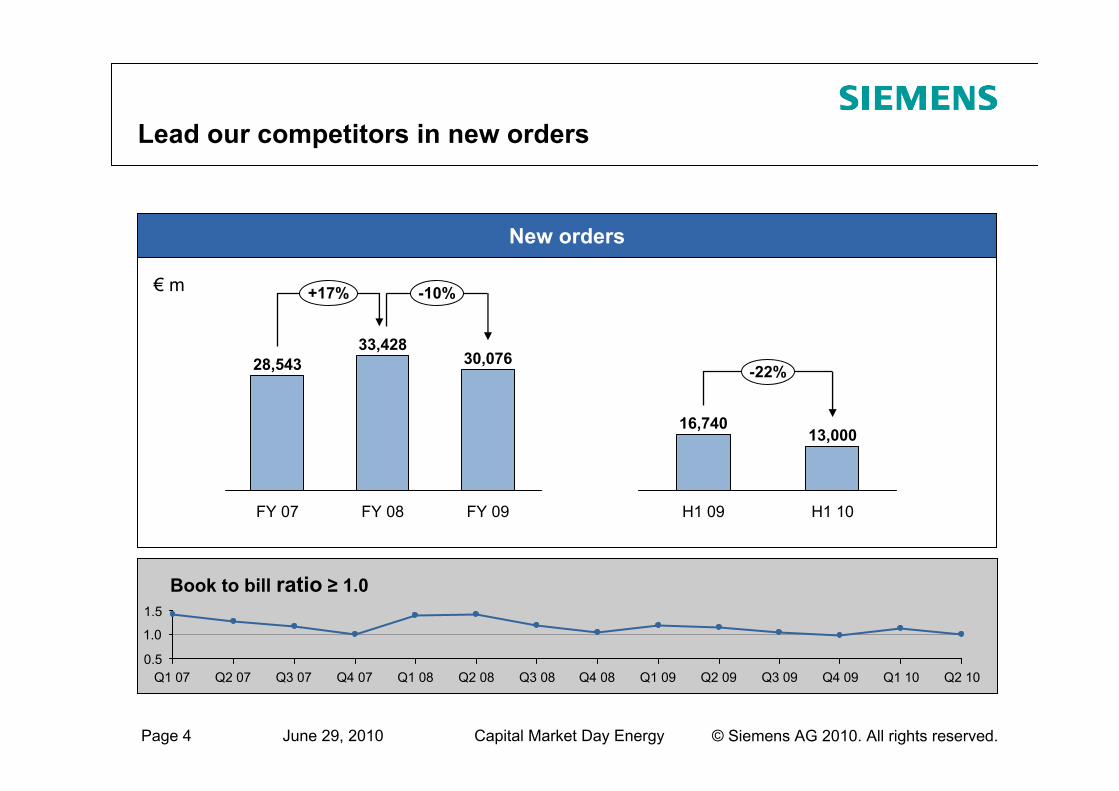
Lead our competitors in new orders
Q2 07Q1 07 Q3 07
1.0
Q2 10Q1 10Q4 09Q3 09Q2 09Q1 09Q4 08Q3 08Q2 08Q1 08Q4 07
Book to bill ratio ≥ 1.0
€ m
30,076
FY 08 FY 09
-10%+17%
FY 07
28,54333,428
New orders
13,00016,740
-22%
H1 10H1 09
1.5
0.5
© Siemens AG 2010. All rights reserved.June 29, 2010 Capital Market Day Energy Page 5
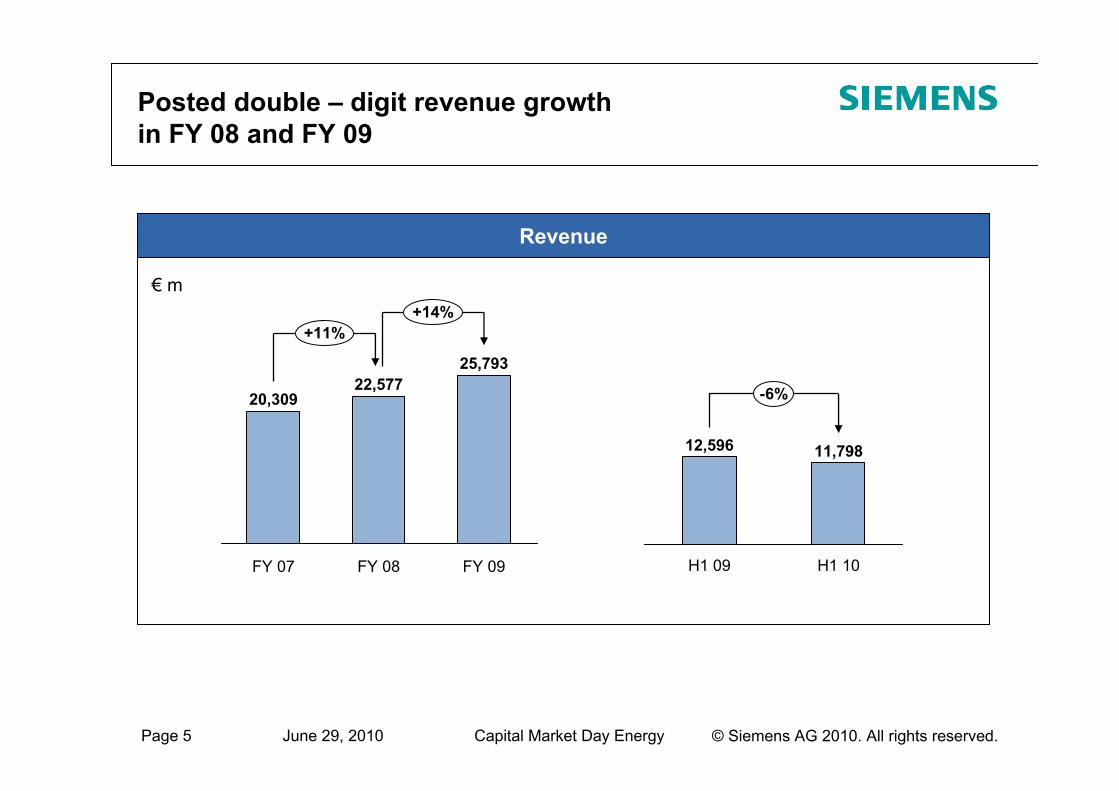
Posted double – digit revenue growth in FY 08 and FY 09
RevenueRevenue
€ m
20,309
FY 08
+11%
22,577
+14%
FY 07 FY 09
25,793
-6%
H1 09
12,596
H1 10
11,798
© Siemens AG 2010. All rights reserved.June 29, 2010 Capital Market Day Energy Page 6
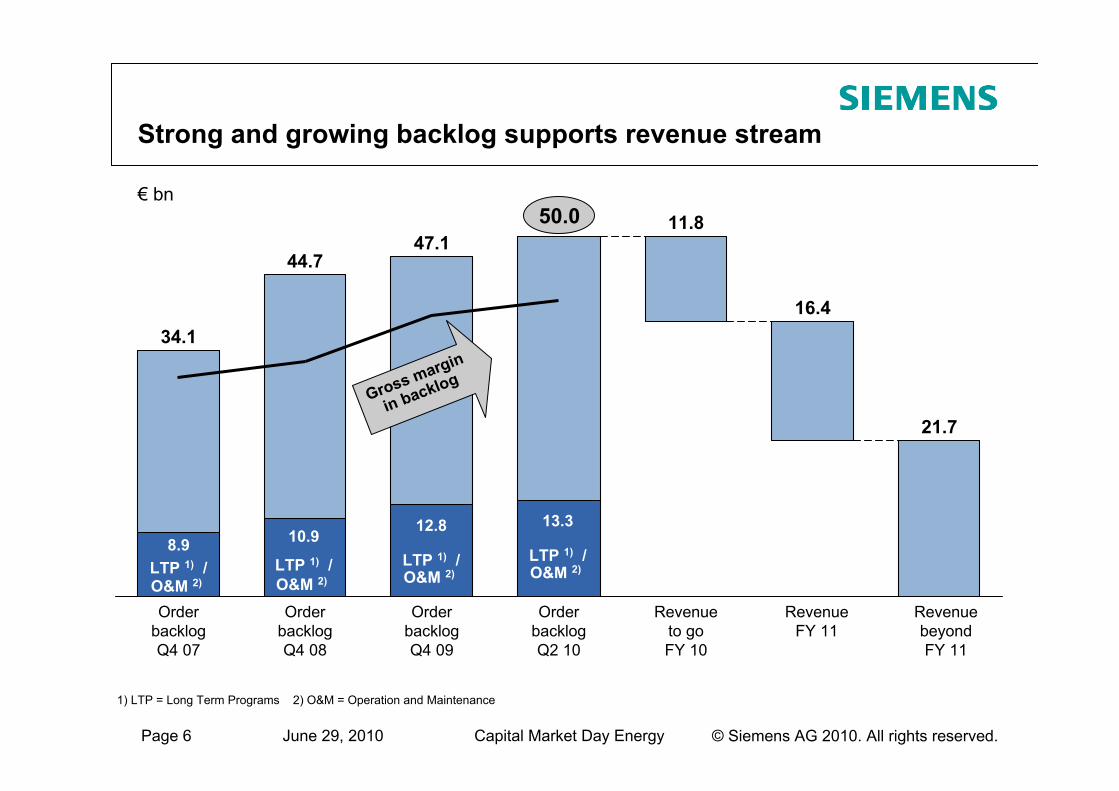
Strong and growing backlog supports revenue stream
1) LTP = Long Term Programs 2) O&M = Operation and Maintenance
Revenue beyond FY 11
21.7
Revenue FY 11
16.4
Revenue to go FY 10
11.8
Order backlog Q2 10
Order backlog Q4 09
47.1
Order backlog Q4 08
44.7
Order backlog Q4 07
34.1
8.9LTP 1) /O&M 2)
50.0
Gross margin
in backlog
10.9
LTP 1) /O&M 2)
12.8
LTP 1) /O&M 2)
13.3
LTP 1) /O&M 2)
€ bn
© Siemens AG 2010. All rights reserved.June 29, 2010 Capital Market Day Energy Page 7
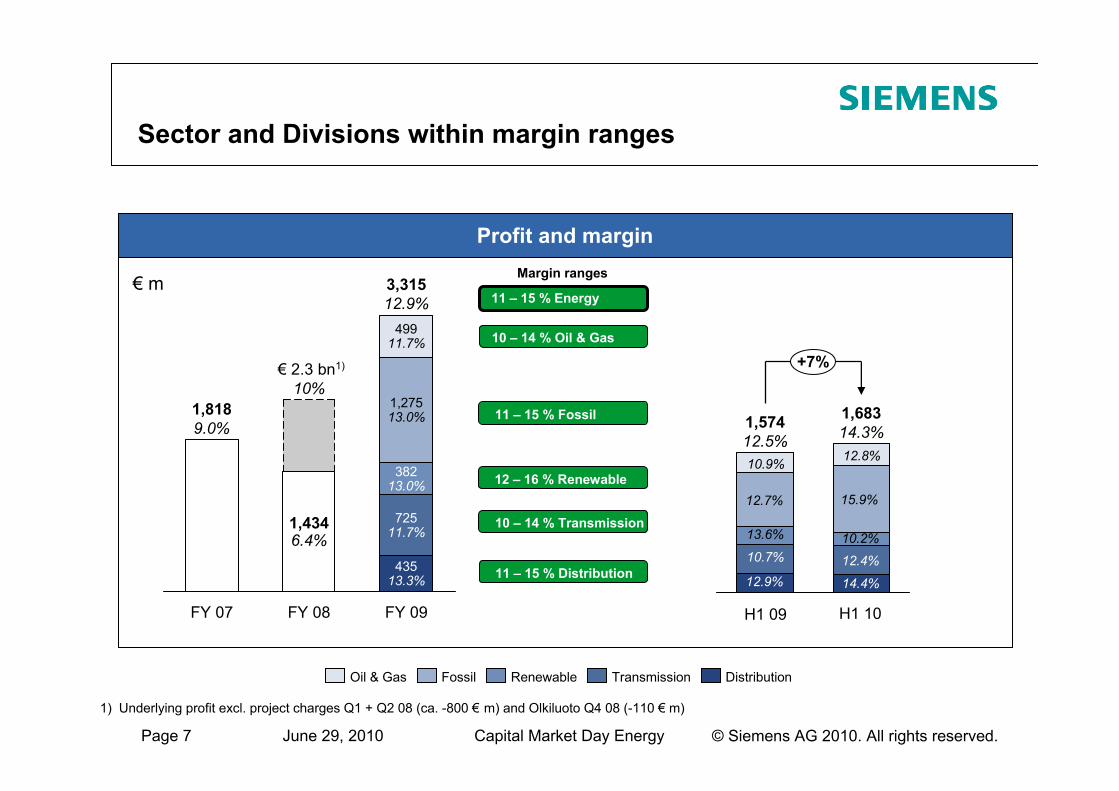
Sector and Divisions within margin ranges
+7%
1,68314.3%1,574
12.5%
10.2%
12.8%
12.4%
14.4%
15.9%
Profit and margin (1 H FY 2009 / 1 H 2010)
FY 09
3,31512.9%
43513.3%
72511.7%
38213.0%
1,27513.0%
49911.7%
FY 08
€ 2.3 bn1)
10%
1,4346.4%
FY 07
1,8189.0%
1) Underlying profit excl. project charges Q1 + Q2 08 (ca. -800 € m) and Olkiluoto Q4 08 (-110 € m)
€ m
13.6%
10.9%
10.7%
12.9%
12.7%
DistributionTransmissionRenewableFossilOil & Gas
Margin ranges
11 – 15 % Distribution
10 – 14 % Oil & Gas
11 – 15 % Fossil
12 – 16 % Renewable
10 – 14 % Transmission
11 – 15 % Energy
H1 09 H1 10
Profit and margin
© Siemens AG 2010. All rights reserved.June 29, 2010 Capital Market Day Energy Page 8
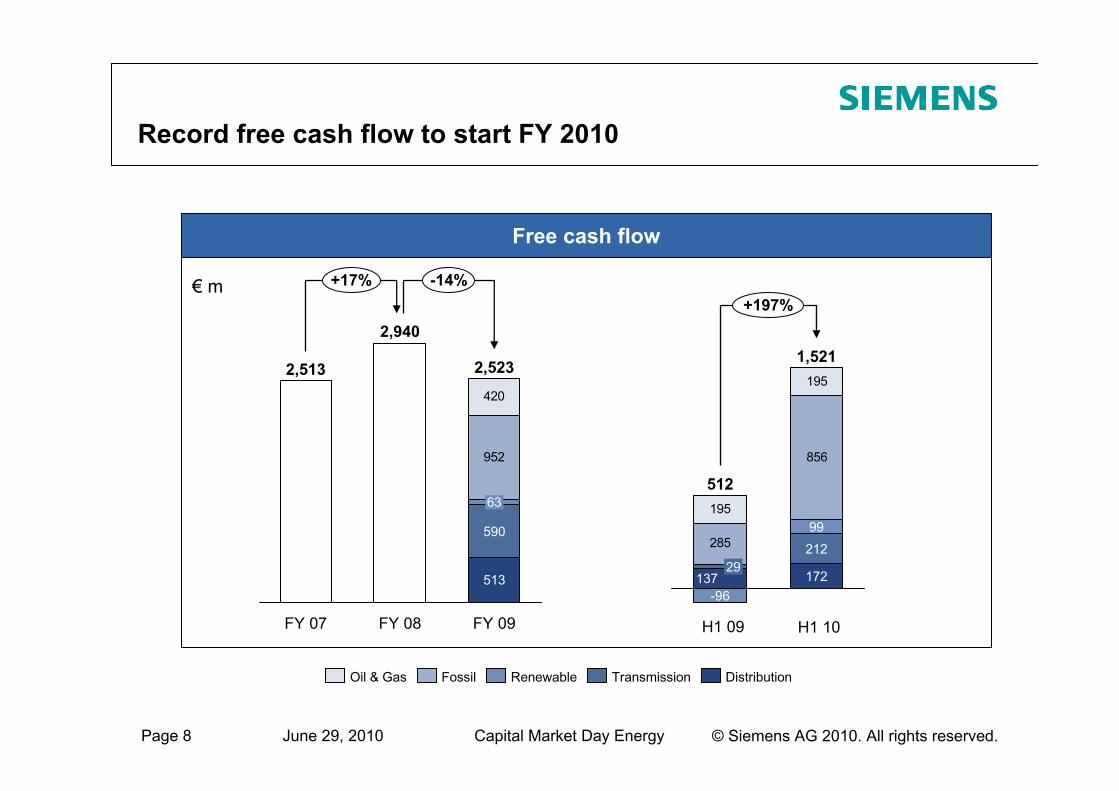
Record free cash flow to start FY 2010
Free cash flow
285
856
195
195
+197%
212
1,521
99
512
137 17229
-96
952
420
FY 07
590
513
+17% -14%
63
FY 08
2,940
FY 09
2,5232,513
€ m
H1 09 H1 10
DistributionTransmissionRenewableFossilOil & Gas
© Siemens AG 2010. All rights reserved.June 29, 2010 Capital Market Day Energy Page 9
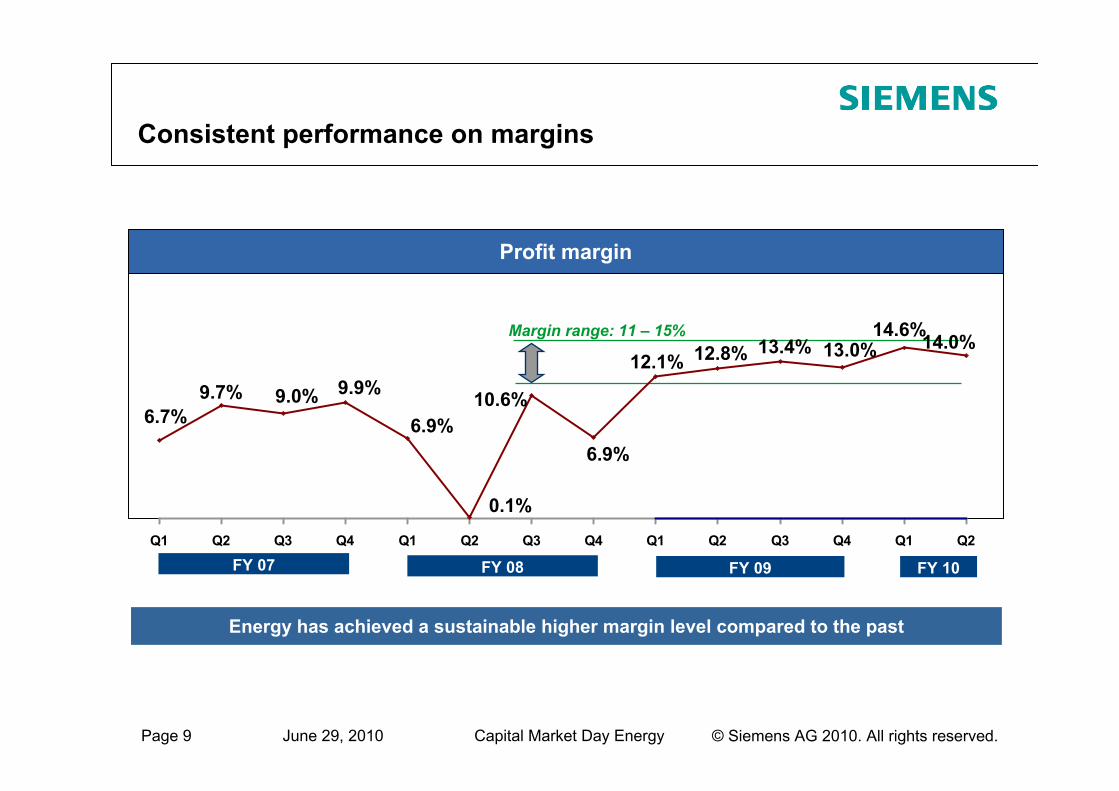
Consistent performance on margins
FY 09FY 07 FY 08 FY 10
Margin range: 11 – 15% 14.0%14.6%13.0%13.4%12.8%12.1%
6.9%
10.6%
0.1%
6.9%
9.9%9.0%9.7%6.7%
Q1 Q2 Q3 Q4 Q1 Q2 Q3 Q4 Q1 Q2 Q3 Q4 Q1 Q2
Profit margin
Energy has achieved a sustainable higher margin level compared to the past
© Siemens AG 2010. All rights reserved.June 29, 2010 Capital Market Day Energy Page 10
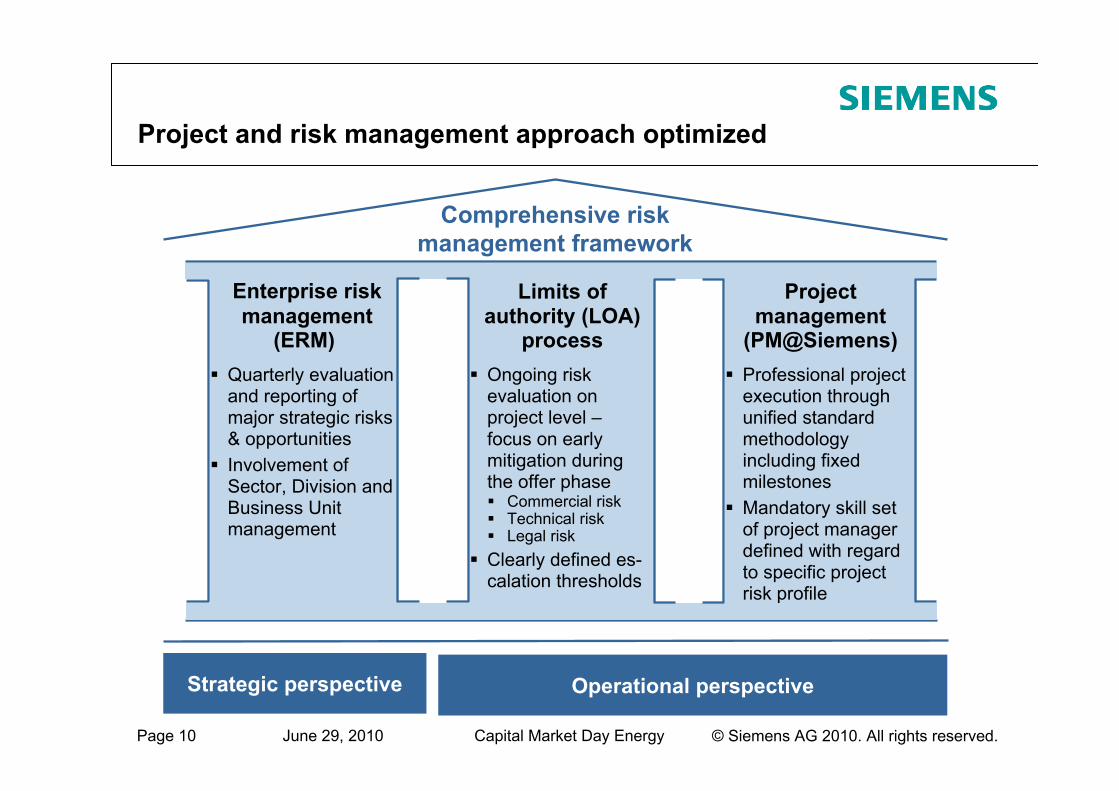
Project and risk management approach optimized
Comprehensive riskmanagement framework
Enterprise riskmanagement
(ERM)Quarterly evaluationand reporting of major strategic risks& opportunitiesInvolvement of Sector, Division and Business Unit management
Limits of authority (LOA)
processOngoing riskevaluation on project level –focus on earlymitigation duringthe offer phase
Commercial riskTechnical riskLegal risk
Clearly defined es-calation thresholds
Project management
(PM@Siemens)Professional projectexecution throughunified standardmethodologyincluding fixedmilestonesMandatory skill setof project managerdefined with regardto specific projectrisk profile
Strategic perspective Operational perspective
© Siemens AG 2010. All rights reserved.June 29, 2010 Capital Market Day Energy Page 11
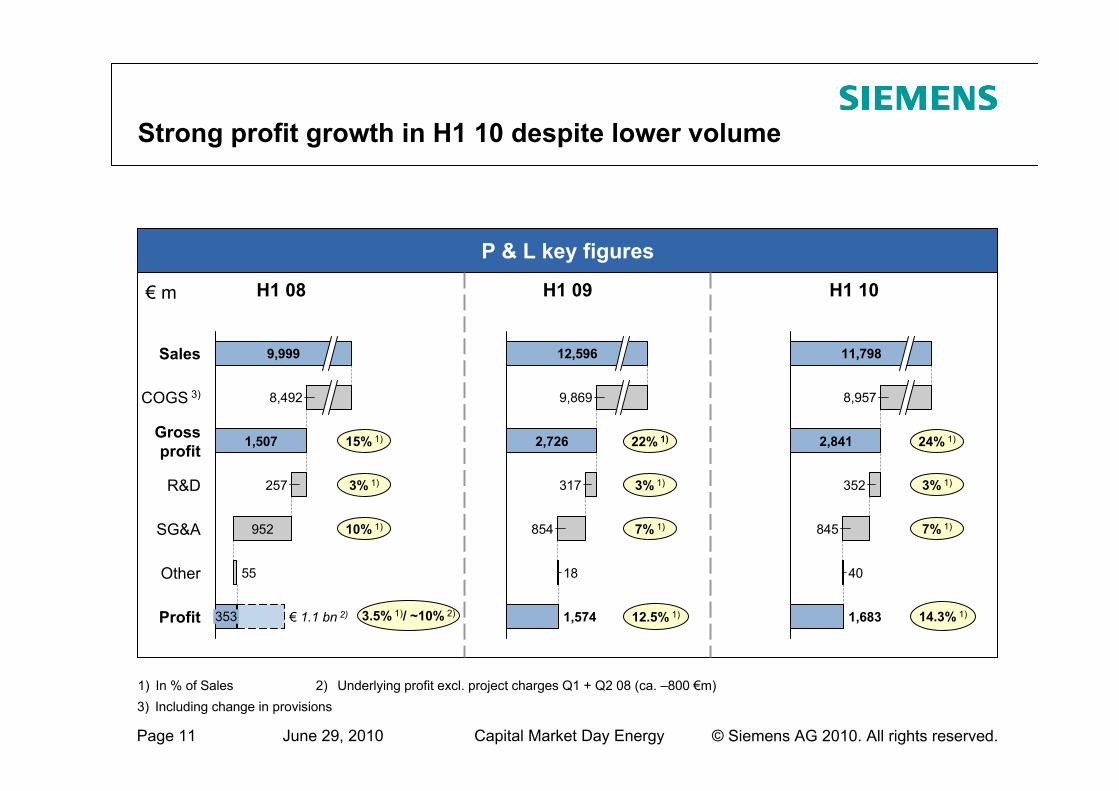
Strong profit growth in H1 10 despite lower volume
P & L key figures
R&D 257
Grossprofit 1,507
COGS 3) 8,492
Sales 9,999
55Other
353
952
€ 1.1 bn 2)Profit
SG&A
1,683
40
845
352
2,841
8,957
11,798
€ m H1 08
15% 1)
10% 1)
H1 10
24% 1)
7% 1)
1) In % of Sales
1,574
18
854
317
2,726
9,869
12,596
H1 09
22% 1)
7% 1)
2) Underlying profit excl. project charges Q1 + Q2 08 (ca. –800 €m)
3.5% 1)/ ~10% 2) 12.5% 1) 14.3% 1)
3) Including change in provisions
3% 1) 3% 1)3% 1)
© Siemens AG 2010. All rights reserved.June 29, 2010 Capital Market Day Energy Page 12
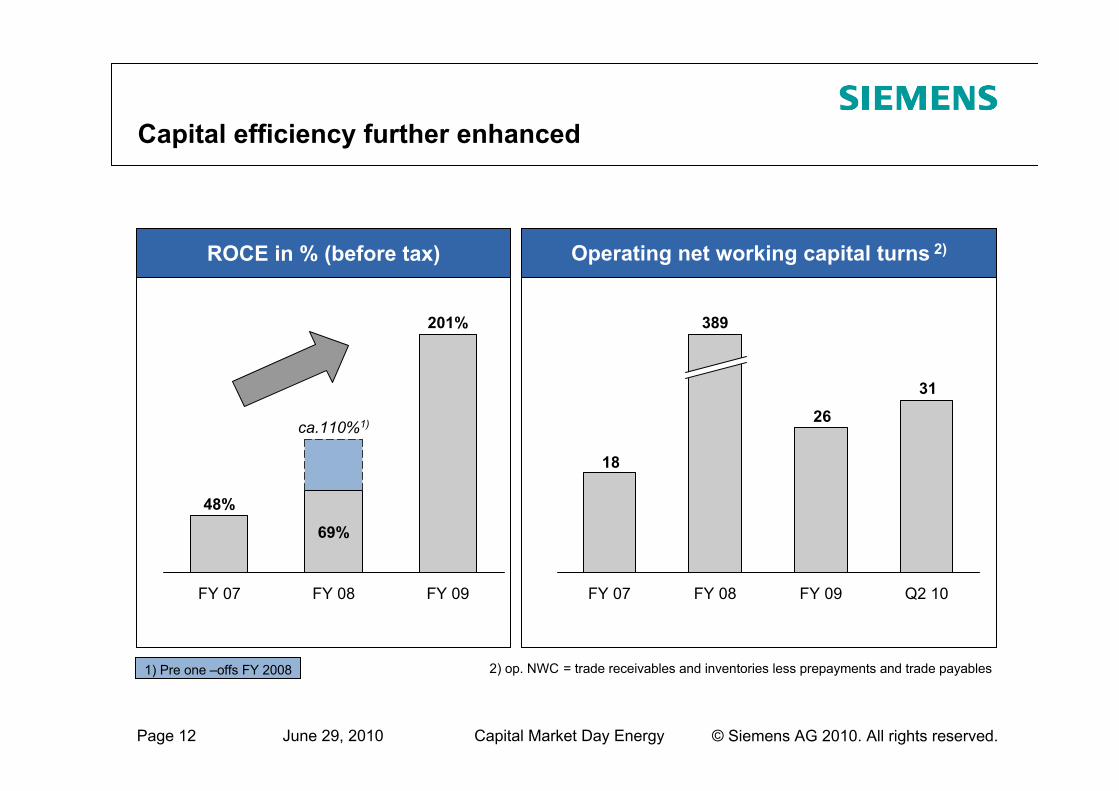
Capital efficiency further enhanced
FY 09
201%
FY 08
ca.110%1)
69%
FY 07
48%
ROCE in % (before tax) Operating net working capital turns 2)
2) op. NWC = trade receivables and inventories less prepayments and trade payables
31
26
18
Q2 10FY 09FY 08
389
FY 07
1) Pre one –offs FY 2008
© Siemens AG 2010. All rights reserved.June 29, 2010 Capital Market Day Energy Page 13
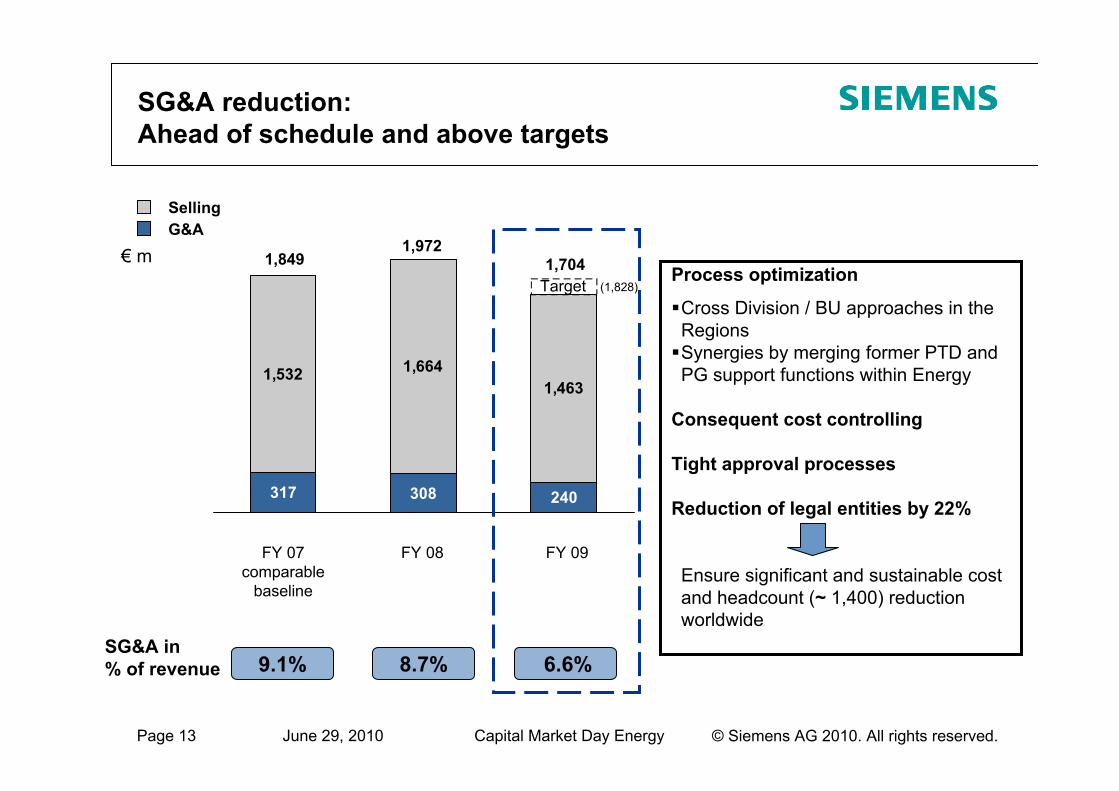
SG&A reduction:Ahead of schedule and above targets
317 308
1,532 1,6641,463
240
1,9721,849 1,704
FY 09
Target
FY 08FY 07comparable
baseline
SG&A in % of revenue 9.1% 8.7% 6.6%
(1,828)
G&ASelling
Process optimization
Cross Division / BU approaches in the RegionsSynergies by merging former PTD and PG support functions within Energy
Consequent cost controlling
Tight approval processes
Reduction of legal entities by 22%
Ensure significant and sustainable cost and headcount (~ 1,400) reduction worldwide
1,8491,972
1,704€ m
© Siemens AG 2010. All rights reserved.June 29, 2010 Capital Market Day Energy Page 14
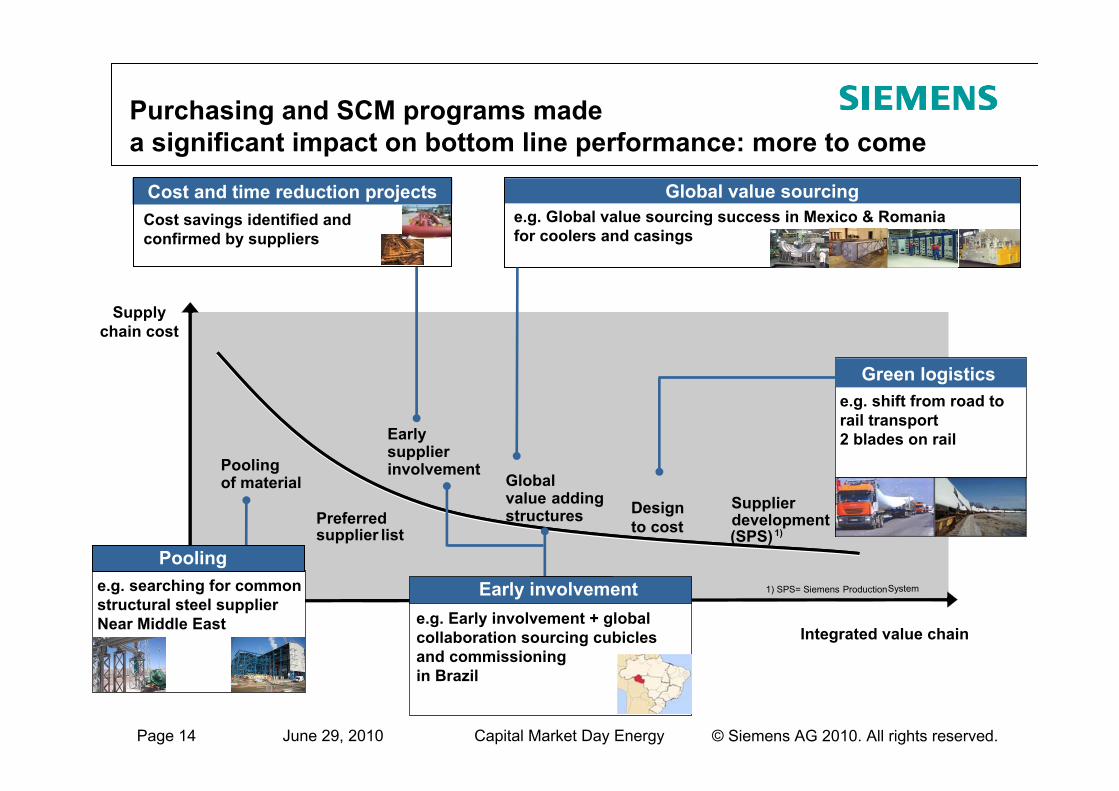
Purchasing and SCM programs madea significant impact on bottom line performance: more to come
value chain
negotiatingpower
preferredSupplier list
globalvalue addingstructures
technicalmaterial costoptimization
earlysupplierinvolvement
supplierdevelopment
(SPS
SCM- Focus now and beyond
optimizingoverall value creation
supplychain cost
pooling of material
1) SPS= Siemens Production
+
value chain
negotiatingpower
preferredSupplier list
globalvalue addingstructures
technicalmaterial costoptimization
EarlySupplierinvolvement
supplierdevelopment(SPS)1
SCM- Focus now and beyond
optimizingoverall value creation
supplychain cost
Poolingof material
1) SPS= Siemens Production System
+negotiatingpower
preferredSupplier list
globalvalue addingstructures
technicalmaterial costoptimization
earlysupplierinvolvement
supplierdevelopment
(SPS
optimizingoverall value creation
pooling of material
1) SPS= Siemens Production
+
Integrated value chain
Preferredsupplier list
Globalvalue addingstructures Design
to cost
Earlysupplierinvolvement
Supplierdevelopment(SPS)1)
Supplychain cost
Poolingof material
1) SPS= Siemens ProductionSystem
Global value sourcinge.g. Global value sourcing success in Mexico & Romania for coolers and casings
Green logisticse.g. shift from road to rail transport2 blades on rail
Offshore &subsea oil & gas
Poolinge.g. searching for commonstructural steel supplier Near Middle East
Offshore &subsea oil & gas
Early involvemente.g. Early involvement + globalcollaboration sourcing cubiclesand commissioningin Brazil
Cost and time reduction projectsCost savings identified andconfirmed by suppliers
© Siemens AG 2010. All rights reserved.June 29, 2010 Capital Market Day Energy Page 15
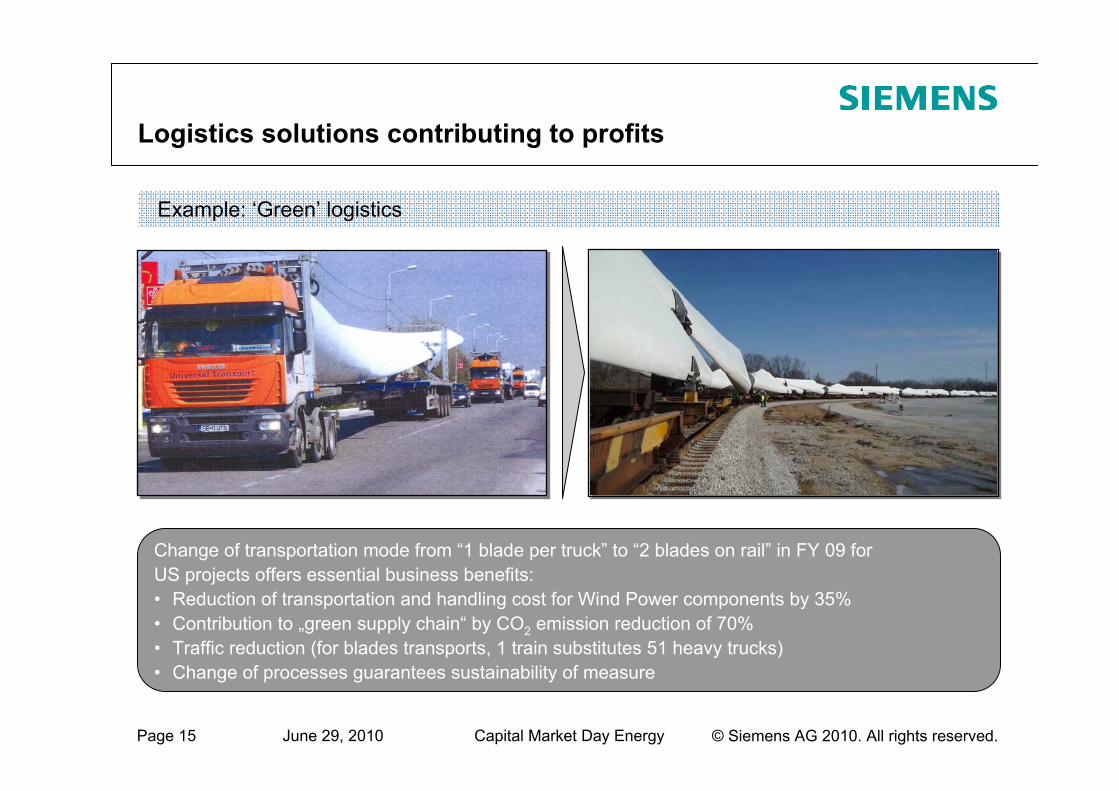
Logistics solutions contributing to profits
Change of transportation mode from “1 blade per truck” to “2 blades on rail” in FY 09 for US projects offers essential business benefits: • Reduction of transportation and handling cost for Wind Power components by 35%• Contribution to „green supply chain“ by CO2 emission reduction of 70%• Traffic reduction (for blades transports, 1 train substitutes 51 heavy trucks)• Change of processes guarantees sustainability of measure
Example: ‘Green’ logistics
© Siemens AG 2010. All rights reserved.June 29, 2010 Capital Market Day Energy Page 16
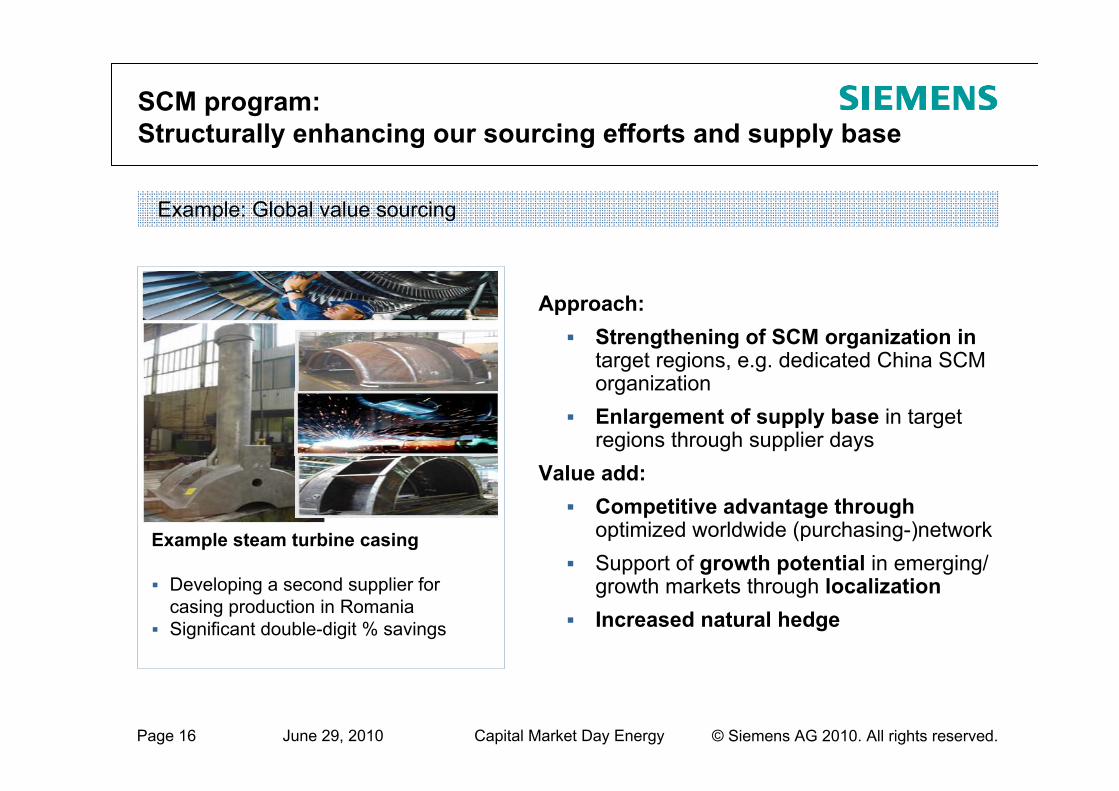
Example: Global value sourcing
Example steam turbine casing
Developing a second supplier for casing production in RomaniaSignificant double-digit % savings
SCM program: Structurally enhancing our sourcing efforts and supply base
Approach:Strengthening of SCM organization in target regions, e.g. dedicated China SCM organizationEnlargement of supply base in targetregions through supplier days
Value add:Competitive advantage throughoptimized worldwide (purchasing-)networkSupport of growth potential in emerging/ growth markets through localizationIncreased natural hedge
© Siemens AG 2010. All rights reserved.June 29, 2010 Capital Market Day Energy Page 17
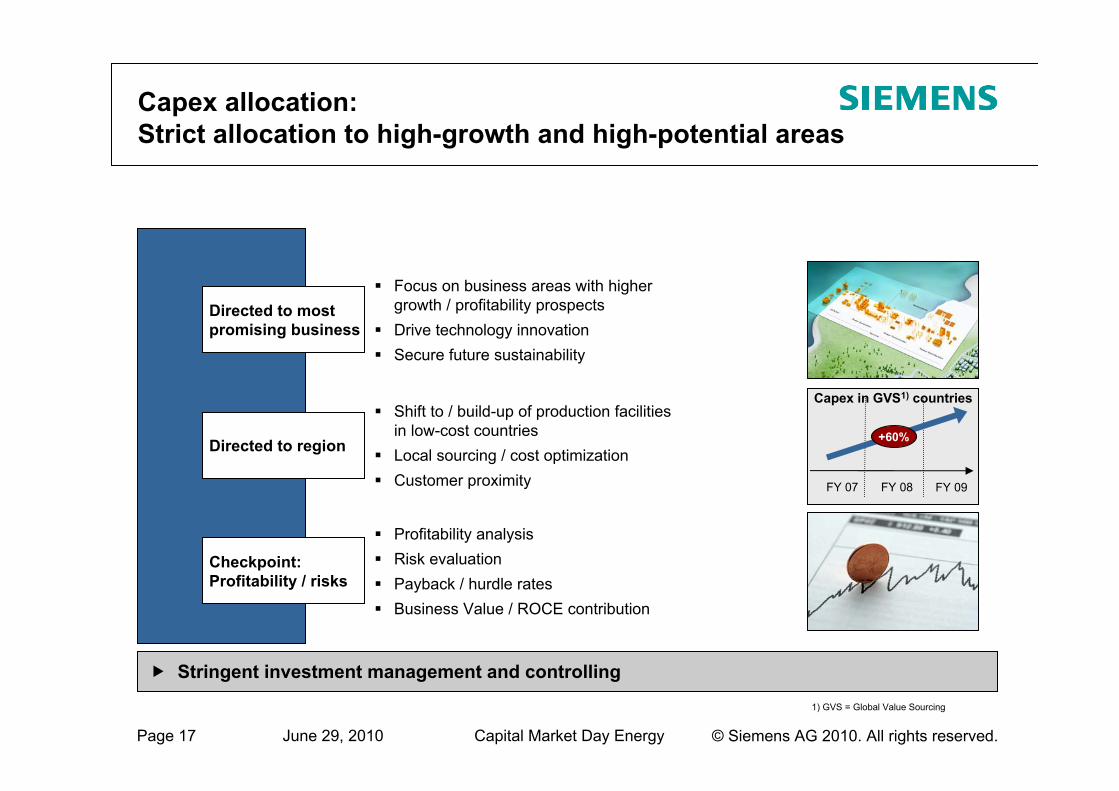
Capex allocation: Strict allocation to high-growth and high-potential areas
Directed to most promising business
Focus on business areas with highergrowth / profitability prospectsDrive technology innovationSecure future sustainability
Checkpoint: Profitability / risks
Profitability analysisRisk evaluationPayback / hurdle ratesBusiness Value / ROCE contribution
Directed to region
Shift to / build-up of production facilitiesin low-cost countriesLocal sourcing / cost optimizationCustomer proximity
Stringent investment management and controlling
FY 07 FY 08 FY 09
+60%
Capex in GVS1) countries
1) GVS = Global Value Sourcing
© Siemens AG 2010. All rights reserved.June 29, 2010 Capital Market Day Energy Page 18
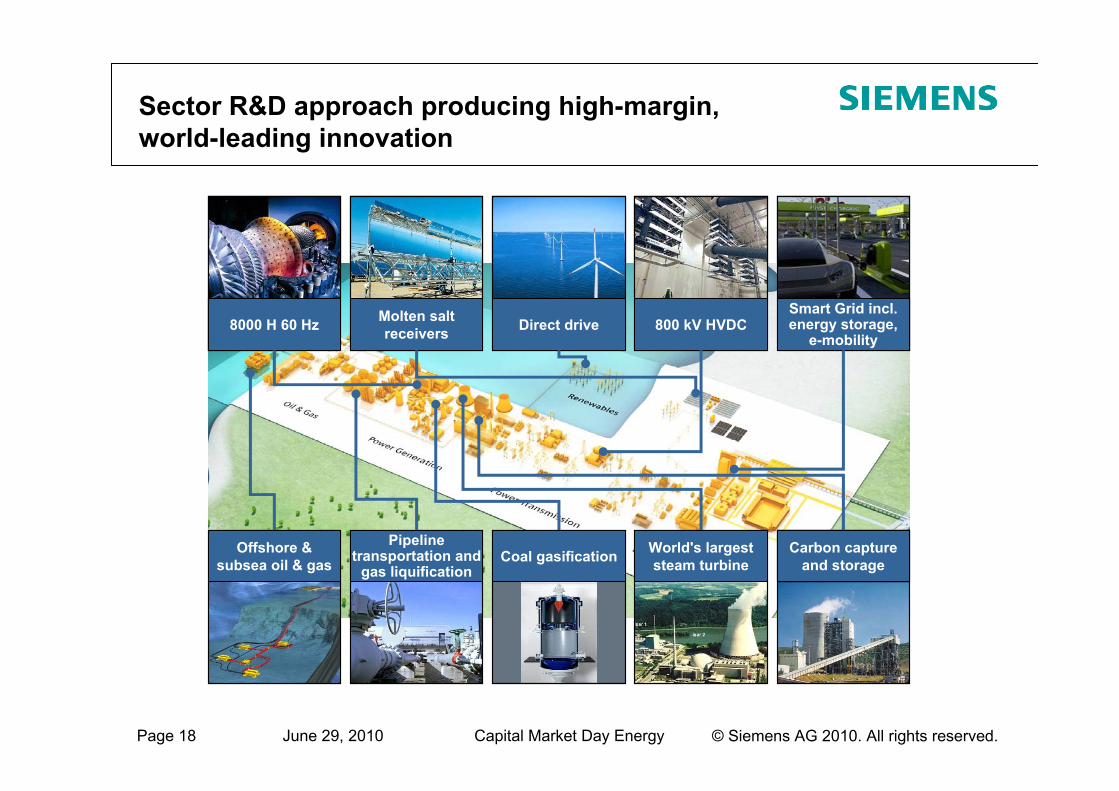
Sector R&D approach producing high-margin, world-leading innovation
Direct Drive Molten saltreceivers 800 kV HVDC
Smart grid incl.energy storage,World’ s largest
steam turbine
- Carbon captureand storage
Smart Grid incl. energy storage,
e-mobility800 kV HVDCDirect driveMolten salt
receivers8000 H 60 Hz
Carbon capture and storage
Pipeline transportation and
gas liquificationOffshore &
subsea oil & gas Coal gasification World's largest steam turbine
© Siemens AG 2010. All rights reserved.June 29, 2010 Capital Market Day Energy Page 19
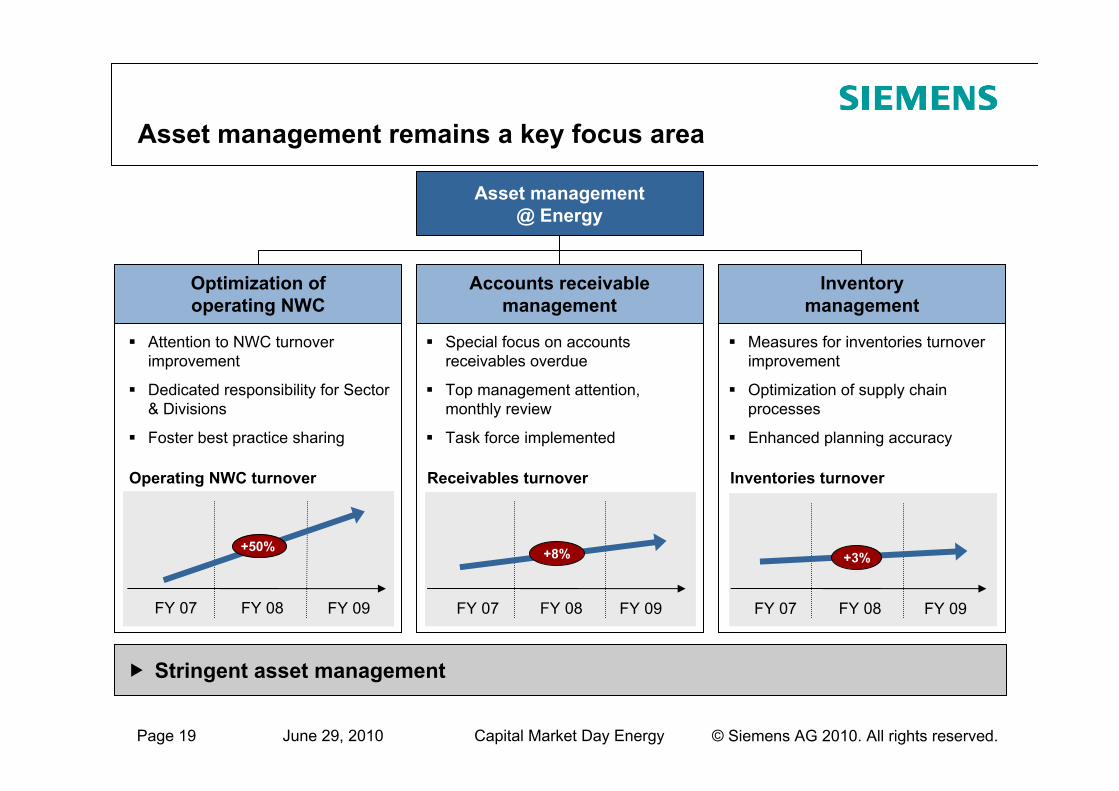
Asset management remains a key focus area
Stringent asset management
Asset management @ Energy
Optimization of operating NWC
Attention to NWC turnover improvement
Dedicated responsibility for Sector & Divisions
Foster best practice sharing
Accounts receivable management
Special focus on accounts receivables overdue
Top management attention, monthly review
Task force implemented
Inventory management
Measures for inventories turnover improvement
Optimization of supply chain processes
Enhanced planning accuracy
Operating NWC turnover
FY 07 FY 08 FY 09
+50%
Receivables turnover
FY 07 FY 08 FY 09
+8%
Inventories turnover
FY 07 FY 08 FY 09
+3%
© Siemens AG 2010. All rights reserved.June 29, 2010 Capital Market Day Energy Page 20
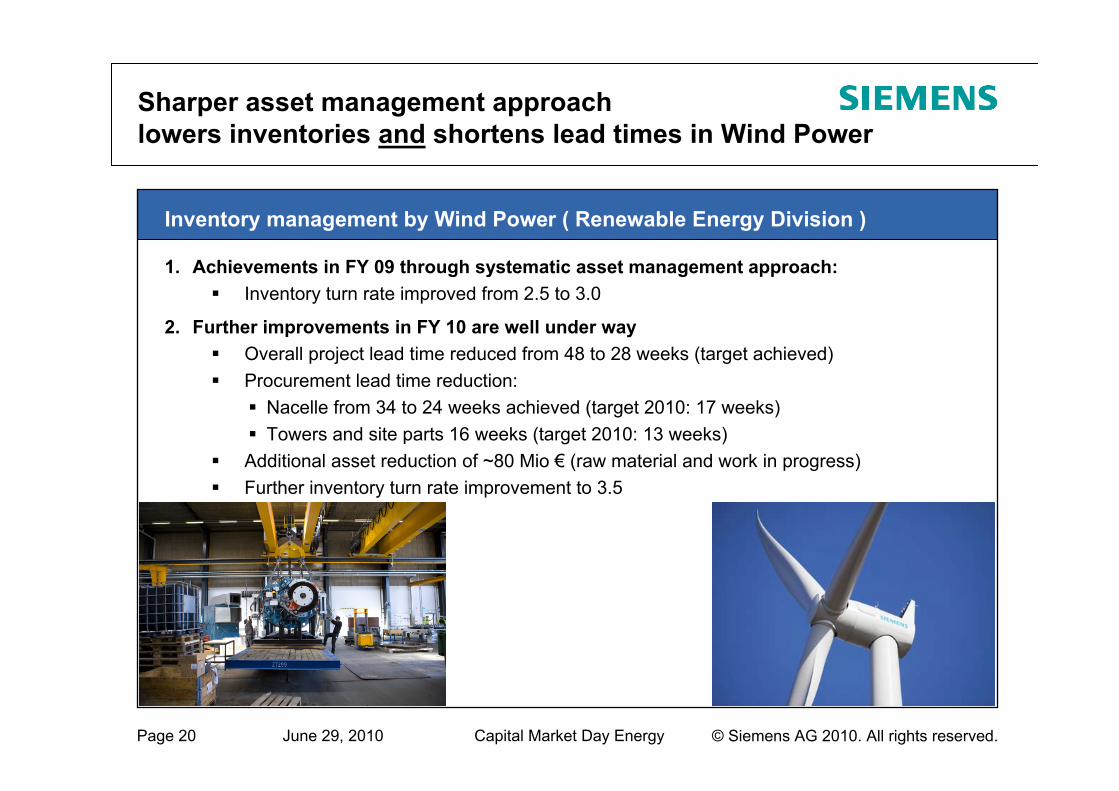
Sharper asset management approachlowers inventories and shortens lead times in Wind Power
Inventory management by Wind Power ( Renewable Energy Division )
1. Achievements in FY 09 through systematic asset management approach:Inventory turn rate improved from 2.5 to 3.0
2. Further improvements in FY 10 are well under way Overall project lead time reduced from 48 to 28 weeks (target achieved)Procurement lead time reduction:
Nacelle from 34 to 24 weeks achieved (target 2010: 17 weeks)Towers and site parts 16 weeks (target 2010: 13 weeks)
Additional asset reduction of ~80 Mio € (raw material and work in progress)Further inventory turn rate improvement to 3.5
© Siemens AG 2010. All rights reserved.June 29, 2010 Capital Market Day Energy Page 21
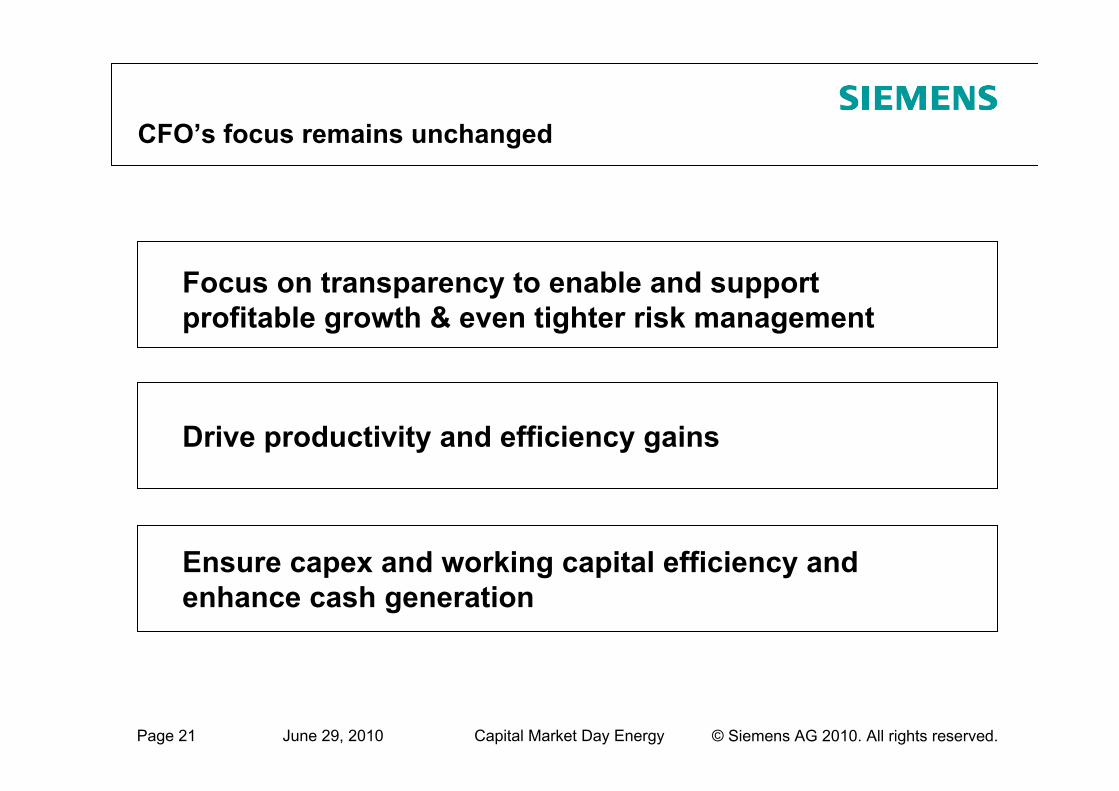
CFO’s focus remains unchanged
Focus on transparency to enable and support profitable growth & even tighter risk management
Drive productivity and efficiency gains
Ensure capex and working capital efficiency and enhance cash generation
© Siemens AG 2010. All rights reserved.June 29, 2010 Capital Market Day Energy Page 22
Reconciliation and Definitions forNon-GAAP Measures (I)
To supplement Siemens’ Consolidated Financial Statements presented in accordance with International Financial Reporting Standards, or IFRS, Siemens presents the following supplemental financial measures:
New orders and order backlogAdjusted or organic growth rates of Revenue and new orders;Book-to-bill ratio;Return on equity, or ROE;Return on capital employed, or ROCE;Free cash flow and cash conversion rate, or CCR;EBITDA (adjusted) and EBIT (adjusted);Earnings effect from purchase price allocation (PPA effects) and integration costsNet debt; andAdjusted industrial net debt.
These supplemental financial measures are or may be “non-GAAP financial measures,” as defined in the rules of the U.S. Securities and Exchange Commission (SEC). They exclude or include amounts that are included or excluded, as applicable, in the calculation of the most directly comparable financial measures calculated in accordance with IFRS, and their usefulness is therefore subject to limitations, which are described below under “Limitations on Usefulness of Non-GAAP Financial Measures.” Accordingly, they should not be viewed in isolation as alternatives to the most directly comparable financial measures calculated in accordance with IFRS, as identified in the following discussion, and they should be considered in conjunction with Siemens’ Consolidated Financial Statements presented in accordance with IFRS and the Notes thereto. Siemens’ most recent Consolidated Financial Statements at any given time (the “Annual Financial Statements”) can be found in the most recent Annual Report of Siemens (the “Annual Report”), which can be accessed at www.siemens.com/annual-report. Siemens’ most recent interim Consolidated Financial Statements (the “Interim Financial Statements”) at any given time can be found at www.siemens.com/investors under the heading “Publications” – “Financial Publications” – “Financial Statements” or in the most recent Quarterly Report of Siemens (the “Quarterly Reports”), which can be accessed at www.siemens.com/quarterly-reports.
In addition, in considering these supplemental financial measures, investors should bear in mind that other companies that report or describe similarly titled financial measures may calculate them differently. Accordingly, investors should exercise appropriate caution in comparing these supplemental financial measures to similarly titled financial measures reported by other companies.
Definitions, most directly comparable IFRS financial measures and usefulness of Siemens’ supplemental financial measuresSiemens’ supplemental financial measures are designed to measure growth, capital efficiency, cash generation and optimization of Siemens’ capital structure and therefore are used to formulate targets for Siemens. The following discussion provides definitions of these supplemental financial measures, the most directly comparable IFRS financial measures and information regarding the usefulness of these supplemental financial measures.
New orders and order backlogUnder its policy for the recognition of new orders, Siemens generally recognizes a new order when we enter into a contract that we consider “legally effective and binding” based on a number of different criteria. In general, if a contract is considered legally effective and binding, Siemens recognizes the total contract value. The contract value is the agreed price or fee for that portion of the contract for which the delivery of goods and/or the provision of services is irrevocably agreed. Future revenues from service, maintenance and outsourcing contracts are recognized as new orders in the amount of the total contract value only if there is adequate assurance that the contract will remain in effect for its entire duration (e.g., due to high exit barriers for the customer).
© Siemens AG 2010. All rights reserved.June 29, 2010 Capital Market Day Energy Page 23
Reconciliation and Definitions forNon-GAAP Measures (II)
New orders and order backlog (continued)New orders are generally recognized immediately when the relevant contract becomes legally effective and binding. The only exception are orders with short overall contract terms. In this case, a separate reporting of new orders would provide no significant additional information regarding our performance. For orders of this type the recognition of new orders thus occurs when the underlying revenue is recognized.Order backlog represents the future revenues of our Company resulting from already recognized new orders. Order backlog is calculated by adding the new orders of the current fiscal year to the balance of the order backlog from the prior fiscal year and subtracting the revenue recognized in the current fiscal year. If an order from the current fiscal year is cancelled or its amount is modified, Siemens adjusts its new order total for the current quarter accordingly, but do not retroactively adjust previously published new order totals. However, if an order from a previous fiscal year is cancelled, new orders of the current quarter and accordingly the current fiscal year are generally not adjusted, instead, if the adjustment exceeds a certain threshold, the existing order backlog is revised. Aside from cancellations, the order backlog is also subject to changes in the consolidation group and to currency translation effects.There is no standard system for compiling and calculating new orders and order backlog information that applies across companies. Accordingly, its new orders and order backlog may not be comparable with new orders and order backlog reported by other companies. Siemens does subject its new orders and its order backlog to internal documentation and review requirements. Siemens may change its policies for recognizing new orders and order backlog in the future without previous notice.
Adjusted or organic growth rates of Revenue and new ordersIn its financial reports, Siemens presents, on a worldwide basis and for each Sector and Cross-Sector Business, the percentage change from period to period in Revenue and new orders as adjusted for currency translation effects and portfolio effects. The adjusted percentage changes are called adjusted or organic rates of growth. The IFRS financial measure most directly comparable to adjusted or organic growth rate of Revenue is the unadjusted growth rate calculated based on the actual Revenue figures presented in the Consolidated Income Statement. There is no comparable IFRS financial measure for the adjusted or organic growth rate of new orders because, as discussed above, new orders is not an IFRS financial measure.Siemens presents its Consolidated Financial Statements in Euros; however, a significant proportion of its operations takes place in a functional currency other than the Euro, particularly the U.S. dollar and the British pound. Converting figures from these currencies into Euros affects the comparability of Siemens’ results and financial position when the exchange rates for these currencies fluctuate. Some Divisions are significantly affected due to the large proportion of international operations, particularly in the U.S.All Sectors and Divisions as well as Cross-Sector Businesses are subject to foreign currency translation effects; however, some Divisions are particularly affected since they generate a significant portion of their operations through subsidiaries whose results are subject to foreign currency translation effects. The effect of acquisitions and dispositions on Siemens’consolidated revenues and expenses affects the comparability of the Consolidated Financial Statements between different periods.The adjusted or organic growth rates of Revenue and new orders are calculated by subtracting currency translation effects and portfolio effects from the relevant actual growth rates. The currency translation effect is calculated as (1) (a) Revenues or new orders, as the case may be, for the current period, based on the currency exchange rate of the current period minus (b) Revenues or new orders for the current period, based on the currency exchange rate of the previous period, divided by (2) Revenues or new orders for the previous period, based on the currency exchange rate of the previous period. The portfolio effect is calculated, in the case of acquisitions, as the percentage change in Revenues or new orders, as the case may be, attributable to the acquired business and, in the case of dispositions, as the percentage change in Revenues or new orders on the assumption that the disposed business had not been part of Siemens in the previous period. Adjusted growth rates of Revenue and new orders are always calculated for a period of twelve months.Siemens is making portfolio adjustments for certain transactions, including the carve-outs of Siemens Home and Office Communication Devices GmbH & Co. KG and the Wireless Modules business, as well as for other minor transactions in the Sectors, Cross-Sector Businesses and Centrally managed portfolio activities. For further information regarding major acquisitions and dispositions, see “Notes to Consolidated Financial Statements.”Siemens believes that the presentation of an adjusted or organic growth rate of Revenue and new orders provides useful information to investors because a meaningful analysis of trends in Revenue and new orders from one period to the next requires an understanding of the developments in the operational business, net of the impact of currency translation and portfolio effects. Siemens’ management considers adjusted or organic rates of growth in its management of Siemens’ business. For this reason, Siemens believes that investors’ability to assess Siemens’ overall performance may be improved by disclosure of this information.
Book-to-bill ratioThe book-to-bill ratio measures the relationship between orders received and the amount of products and services shipped and billed. A book-to-bill ratio of above 1 indicates that more orders were received than billed, indicating stronger demand, whereas a book-to-bill ratio of below 1 points to weaker demand. The book-to-bill ratio is not required or defined by IFRS.
© Siemens AG 2010. All rights reserved.June 29, 2010 Capital Market Day Energy Page 24
Reconciliation and Definitions forNon-GAAP Measures (III)
Return on equity, or ROEIn line with common practice in the financial services industry, Siemens Financial Services (SFS) uses return on equity, or ROE, as one of its key profitability measures. Siemens defines ROE as annualized Income before income taxes of SFS divided by the average allocated equity for SFS. The allocated equity for SFS is determined and influenced by the size and quality of its portfolio of commercial finance assets (primarily leases) and equity investments. This allocation is designed to cover the risks of the underlying business and is in line with common credit risk management standards in banking. The actual risk portfolio of the SFS portfolio is evaluated and controlled monthly and is reflected in the quarterly (commercial finance) and annual (equity investments) adjustments of allocated equity.Return on equity is reported only for the SFS segment. Siemens believes that the presentation of ROE and average allocated equity provides useful information to investors because management uses ROE as a supplement to Siemens’ Consolidated Financial Statements in evaluating the business performance of SFS, and therefore the measure assists investors in assessing Siemens’ overall performance.Return on capital employed, or ROCEReturn on capital employed, or ROCE, is Siemens’ measure of capital efficiency. Siemens uses this financial performance ratio in order to assess its income generation from the point of view of its shareholders and creditors, who provide Siemens with equity and debt. The different methods of calculation are detailed below. Siemens believes that the presentation of ROCE and the various non-GAAP financial measures involved in its calculation provides useful information to investors because ROCE can be used to determine whether capital invested in the Company and the Sectors yields competitive returns. In addition, achievement of predetermined targets relating to ROCE is one of the factors Siemens takes into account in determining the amount of performance-based or variable compensation received by its management.ROCE at the Siemens group levelSiemens defines group ROCE as net income (before interest) divided by average capital employed, or CE.Net income (before interest), the numerator in the ROCE calculation, is defined as Net income excluding Other interest income (expense), net and taxes thereon. Taxes on Other interest (expense), net are calculated in a simplified form by applying the current tax rate, which can be derived from the Consolidated Statements of Income, to Other interest income (expense), net.Capital employed, or CE, the denominator in the ROCE calculation, is defined as Total equity plus Long-term debt plus Short-term debt and current maturities of long-term debt minus Cash and cash equivalents. Each of the components of capital employed appears on the face of the Consolidated Balance Sheet.ROCE at the Siemens group level, on a continuing operations basisSiemens also presents group ROCE on a continuing operations basis. For this purpose, the numerator is Income from continuing operations and the denominator is CE, less Assets classified as held for disposal presented as discontinued operations, net of Liabilities associated with assets held for disposal presented as discontinued operations.ROCE at the Sector levelFor the Sectors, ROCE is defined as Profit divided by average Assets. Profit for each Sector is defined as earnings before financing interest, certain pension costs and income taxes; certain items not considered performance-indicative by management may be excluded. Assets for each Sector are defined as Total assets less intragroup financing receivables and investments, less income tax assets, less non-interest-bearing liabilities/provisions other than tax liabilities.Free cash flow and cash conversion rateSiemens defines Free cash flow as Net cash provided by (used in) operating activities less Additions to intangible assets and property, plant and equipment. The IFRS financial measure most directly comparable to Free cash flow is Net cash provided by (used in) operating activities.Siemens believes that the presentation of Free cash flow provides useful information to investors because it is a measure of cash generated by our operations after deducting cash outflows for Additions to intangible assets and property, plant and equipment. Therefore the measure gives an indication of the long-term cash generating ability of our business. In addition, because Free cash flow is not impacted by portfolio activities, it is less volatile than the total of Net cash provided by (used in) operating activities and Net cash provided by (used in) investing activities. For this reason, Free cash flow is reported on a regular basis to Siemens’ management, who uses it to assess and manage cash generation among the various reportable segments of Siemens and for the worldwide Siemens group. Achievement of predetermined targets relating to Free cash flow generation is one of the factors Siemens takes into account in determining the amount of performance-based or variable compensation received by its management, both at the level of the worldwide Siemens group and at the level of individual reportable segments. Cash conversion rate, or CCR, is defined as Free cash flow divided by Net income. Siemens believes that the presentation of the CCR provides useful information to investors because it is an operational performance measure that shows how much of its income Siemens converts to Free cash flow. CCR is reported on a regular basis to Siemens’management.
© Siemens AG 2010. All rights reserved.June 29, 2010 Capital Market Day Energy Page 25
Reconciliation and Definitions forNon-GAAP Measures (IV)
EBITDA (adjusted) and EBIT (adjusted)Siemens defines EBITDA (adjusted) as EBIT (adjusted) before amortization (which in turn is defined as Amortization and impairments of intangible assets other than goodwill) and Depreciation and impairment of property, plant and equipment and goodwill. Siemens defines EBIT (adjusted) as Income from continuing operations before income taxes less Financial income (expense), net and Income (loss) from investments accounted for using the equity method, net. Each of the components of EBIT (adjusted) appears on the face of the Consolidated Financial Statements, and each of the additional components of EBITDA (adjusted) appears in the Consolidated Financial Statements or the MD&A thereto, which may be found in the relevant annual or quarterly report filed with the SEC. The IFRS financial measure most directly comparable to EBIT (adjusted) and EBITDA (adjusted) is Income from continuing operations before income taxes. For a reconciliation of Income from continuing operations before income taxes to Net income, see the Consolidated Statements of Income in the Annual Reports and Quarterly Reports.Siemens believes that the presentation of EBITDA (adjusted) and EBIT (adjusted) as a cash earnings measure provides useful information to investors. Therefore EBITDA (adjusted) and EBIT (adjusted) are also broadly used by analysts, rating agencies and investors to assess the performance of a company.
Earnings effect from purchase price allocation (PPA effects) and integration costsThe purchase price paid for an acquired business is allocated to the assets, liabilities and contingent liabilities acquired based on their fair values. The fair value step-ups result in an earnings effect over time, e.g. additional amortization of fair value step-ups of intangible assets, which is defined as a PPA effect. Integration costs are internal or external costs that arise after the signing of an acquisition in connection with the integration of the acquired business, e.g. costs in connection with the adoption of Siemens’ guidelines and policies.Siemens believes that the presentation of PPA effects and integration costs effects provides useful information to investors as it allows investors to consider earnings impacts related to business combination accounting and integration in the performance analysis.
Net debtSiemens defines net debt as total debt less total liquidity. Total debt is defined as Short-term debt and current maturities of long-term debt plus Long-term debt. Total liquidity is defined as Cash and cash equivalents plus current Available-for-sale financial assets. Each of these components appears in the Consolidated Balance Sheets. The IFRS financial measure most directly comparable to net debt is total debt as reported in the Notes to Consolidated Financial Statements.Siemens believes that the presentation of net debt provides useful information to investors because its management reviews net debt as part of its management of Siemens’ overall liquidity, financial flexibility, capital structure and leverage. In particular, net debt is an important component of adjusted industrial net debt. Furthermore, certain debt rating agencies, creditors and credit analysts monitor Siemens’ net debt as part of their assessments of Siemens’ business.
Adjusted industrial net debtSiemens defines adjusted industrial net debt as net debt less (1) SFS debt excluding SFS internally purchased receivables; less (2) 50% of the nominal amount of our hybrid bond; plus (3) the funded status of pension plans; plus (4) the funded status of other post-employment benefits; plus (5) credit guarantees; and (6) fair value hedge accounting adjustments. The fair value hedge accounting adjustment has been included in fiscal 2009 in our definition of adjusted industrial net debt. The fair value hedge accounting adjustment generally reflects risks being hedged. We believe that deducting the fair value hedge accounting adjustment from net debt in addition to the adjustments presented above provides investors more meaningful information to our scheduled debt service obligations. Further information concerning adjusted industrial net debt can be found in the Annual Report under the heading “Management’s discussion and analysis – Liquidity and capital resources – Capital structure.”Siemens manages adjusted industrial net debt as one component of its capital. As part of our “Fit42010” program, we decided to optimize our capital structure. A key consideration is to maintain ready access to capital markets through various debt products and to preserve our ability to repay and service our debt obligations over time. Siemens therefore has set a capital structure goal that is measured by adjusted industrial net debt divided by Earnings before interest taxes depreciation and amortization (EBITDA) as adjusted. Adjusted EBITDA is calculated as earnings before income taxes (EBIT) (adjusted) before amortization (defined as amortization and impairments of intangible assets other than goodwill) and depreciation and impairments of property, plant and equipment and goodwill. Adjusted EBIT is Income from continuing operations before income taxes less Financial income (expense), net and Income (loss) from investments accounted for using the equity method, net.Siemens believes that using the ratio of “adjusted industrial net debt” to “EBITDA (adjusted)” as a measure of its capital structure provides useful information to investors because management uses it to manage our debt-equity ratio while ensuring both unrestricted access to debt financing instruments in the capital markets and our ability to meet scheduled debt service obligations.
© Siemens AG 2010. All rights reserved.June 29, 2010 Capital Market Day Energy Page 26
Reconciliation and Definitions forNon-GAAP Measures (V)
Limitations Associated with Siemens’ Supplemental Financial MeasuresThe supplemental financial measures reported by Siemens may be subject to limitations as analytical tools. In particular:
With respect to adjusted or organic growth rates of Revenue and new orders: These measures are not adjusted for other effects, such as increases or decreases in prices or quantity/volume.With respect to book-to-bill ratio: The use of this measure is inherently limited by the fact that it is a ratio and thus does not provide information as to the absolute number of orders received by Siemens or the absolute amount of products and services shipped and billed by it.With respect to return on equity, or ROE: This measure is not adjusted for special items, such as the disposition of equity investments (allocated to SFS) or impairments, and therefore it has been volatile over prior year periods. In addition, the use of this measure is inherently limited by the fact that it is a ratio and thus does not provide information as to the absolute amount of Siemens’ income.With respect to return on capital employed, or ROCE: The use of this measure is inherently limited by the fact that it is a ratio and thus does not provide information as to the absolute amount of Siemens’ income.With respect to Free cash flow and cash conversion rate: Free cash flow is not a measure of cash generated by operations that is available exclusively for discretionary expenditures. This is, because in addition to capital expenditures needed to maintain or grow its business, Siemens requires cash for a wide variety of non-discretionary expenditures, such as interest and principal payments on outstanding debt, dividend payments or other operating expenses. In addition, the use of cash conversion rate is inherently limited by the fact that it is a ratio and thus does not provide information about the amount of Siemens’ Free cash flow.With respect to EBITDA (adjusted) and EBIT (adjusted): EBITDA (adjusted) excludes non-cash items such as depreciation, amortization and impairment, it does not reflect the expense associated with, and accordingly the full economic effect of, the loss in value of Siemens’ assets over time. Similarly, neither EBITDA (adjusted) nor EBIT (adjusted) reflect the impact of financial income and taxes, which are significant cash expenses that may reduce the amount of cash available for distribution to shareholders or reinvestment in the business.With respect to earnings effects from purchase price allocation (PPA effects) and integration costs: The fact that the profit margin is adjusted for these effects does not mean that they do not impact profit of the relevant segment in the Consolidated Financial Statements.With respect to net debt and the ratio adjusted industrial net debt to EBITDA (adjusted): Siemens typically uses a considerable portion of its cash, cash equivalents and available-for-sale financial assets at any given time for purposes other than debt reduction. Therefore, the fact that these items are excluded from net debt does not mean that they are used exclusively for debt repayment. The use of the ratio adjusted industrial net debt to EBITDA (adjusted) is inherently limited by the fact that it is a ratio.
Compensation for Limitations Associated with Siemens’ Supplemental Financial MeasureSiemens provides a quantitative reconciliation of each supplemental financial measure to the most directly comparable IFRS financial measure below, in the Notes to Consolidated Financial Statements or in the Annual Reports and Quarterly Reports under the heading “Management’s discussion and analysis,” and Siemens encourages investors to review those reconciliations carefully.