Embed Size (px)
Citation preview


We are thrilled to present the 2017–18 Annual Report; a year signalling the beginning of a refreshed strategic direction and a period of transition to reimagine Melbourne’s premier public space, Fed Square.
2017–18 saw Fed Square Pty Ltd (FSPL) implement its new Annual Business Plan, which focussed on four Strategic Priorities identified to uplift and guide FSPL through the beginning of this exciting period of transition. These Priorities centred on Visitor Experiences, Asset Management, Positioning and Performance, and Capability.
To this end, FSPL is pleased to report on a number of initiatives within these Strategic Priorities that have been launched at Fed Square during the year. These initiatives have enabled FSPL to respond to various opportunities which will enhance our local and international profile. These align with the vision of the Victorian Government’s Department of Economic Development, Jobs, Transport and Resources (DEDJTR) Strategic Plan 2017-18 and the Victorian Visitor Economy Strategy (July 2016).
A key initiative to enhance the Visitor Experience at Fed Square was to address the ‘big screen’, which due to its age and regular technical issues, posed a significant risk to the success of a number of events at Fed Square. In 2017, FSPL announced a $5.4 million Digital Innovation project which included the installation of a new, state-of-the-art screen. This will create a digital art gallery as a means of displaying conventional programming but also creative artwork developed by artists in collaboration with the National Gallery of Victoria (NGV), the Australian Centre for the Moving Image (ACMI) and tertiary institutions. The impressive five-storey high digital screen will showcase the best of Melbourne’s arts, community and cultural events and activities, and connect Melbourne to other major cities through unique, interactive technology.
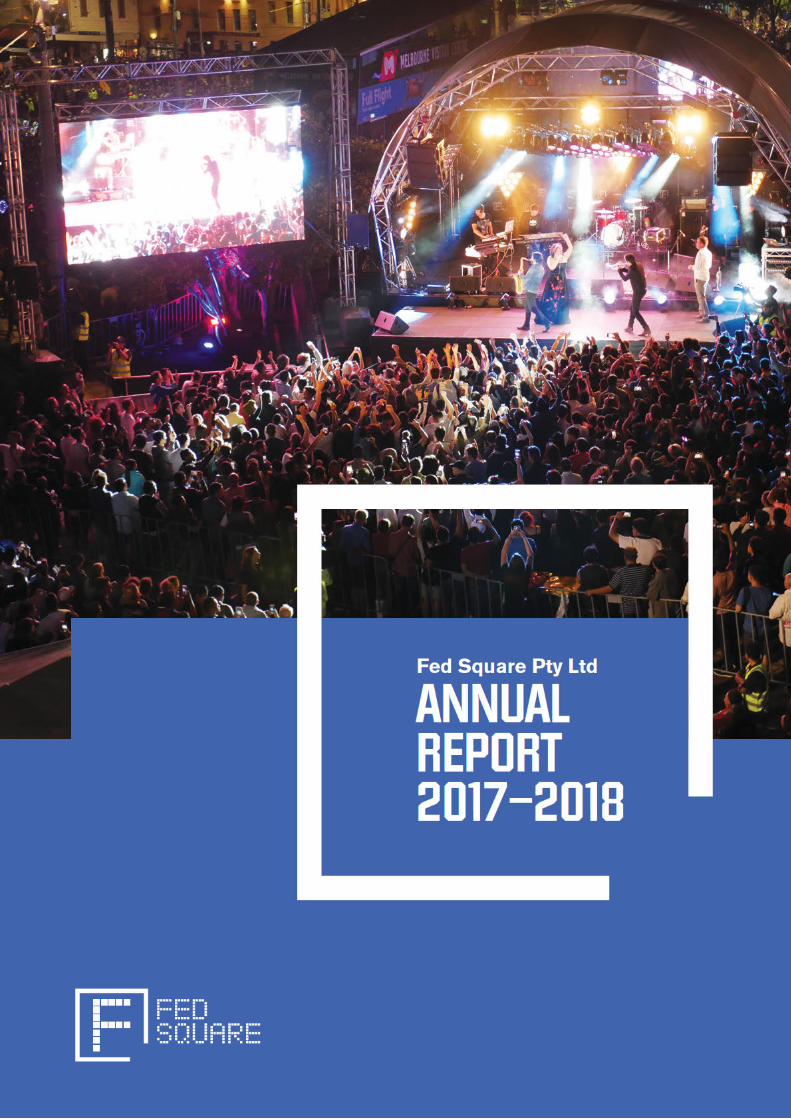
Programming highlights this year included three outstanding events that attracted thousands of people into the precinct – River Rink (an outdoor ice-skating rink), Arboria (a giant inflatable maze) and Marvel’s Avengers S.T.A.T.I.O.N. (an interactive exhibition).
With a focus on improving financial performance and diversifying the tenancy offering at Fed Square, the State Government of Victoria and FSPL announced that world leader for innovation and technology, Apple, will be a new tenant in 2020. The Apple Global Flagship Store at Fed Square will be the first in the Southern Hemisphere. Apple’s presence as a new tenant will attract an additional 2 million visitor to the Square each year, and Apple will create a weekly program of free educational events, focusing on technology, arts and innovation. Importantly, Apple is also committed to working alongside Fed Square’s cultural tenants to explore projects of mutual interest and benefit.
MESSAGE FROM THE CHAIR AND CEO
FED SQUARE ANNUAL REPORT 2017–18
4
ABOUT FED SQUARE Federation Square (known as Fed Square) is Melbourne’s heartbeat, an inspirational precinct which concentrates community, cultural and commercial activities around the city’s major public square.
CORPORATE GOVERNANCEFSPL is wholly owned by State Trustees Limited as custodian trustee on behalf of the State of Victoria. The share is held pursuant to the State Investment Trust Deed and the Treasurer is the Minister responsible for the State Holding in FSPL under the Deed.
The Minister for Tourism and Major Events has State Government portfolio responsibility for FSPL.
FSPL is governed by its Constitution, and also has regard to the Civic and Cultural Charter that was jointly developed and agreed by the Victorian Government and City of Melbourne at the inception of the project.
The Civic and Cultural Charter recognises Melbourne’s pre-eminence as a centre for creativity and innovation, its diverse and successful arts and cultural festivals, its cultural diversity, the popularity and beauty of its gardens and river, and the desire for a new focal point for contemporary cultural and civic activities.
As well as detailing the purpose of Fed Square, the Charter details key outcomes, implementation requirements, and operating principles expected of FSPL.
Because of its diverse role and broad-reaching significance, FSPL interacts with a wide range of government entities particularly the Department of Economic Development, Jobs, Transport and Resources (DEDJTR) on portfolio matters, and the Department of Treasury and Finance (DTF) in relation to the State Government’s shareholding in the company. Within DEDJTR, FSPL liaises with the Creative and Visitor Economies Group with the view to assisting it implement the strategic policies on behalf of Government.
The company has a Board of Directors that is supported by a team of professional staff. Within a framework of “small footprint, big execution”, FSPL has assembled a dedicated team of 43 FTE consisting of 53 staff headcount.
FSPL also contracts services such as cleaning, security, audio visual, car park and property management. These service providers share FSPL’s commitment to service excellence and the delivery of great visitor experiences.
Fed Square is a 5.2 hectare precinct comprising the main plaza, external and internal performance and event spaces, and over 30 tenancies including a diverse range of cafés, bars, restaurants, tourism experiences, the Ian Potter Centre: National Gallery of Victoria Australia (NGVA), the Australian Centre for the Moving Image (ACMI), Special Broadcasting Service (SBS) and the Koorie Heritage Trust (KHT). Fed Square Pty Ltd (FSPL) is responsible for the coordination and management of Fed Square’s self-governing tenancies, programming and marketing of all public space, and all aspects of asset management and development.
FSPL does not receive recurrent funding from the Victorian Government and generates its revenues primarily from tenancy rents, car parking fees, third party venue hire and box office events.
Over 16 years Fed Square has become an integral part of Melbourne and Victoria and is recognised internationally as one of the world’s great public spaces.
FED SQUARE ANNUAL REPORT 2017–18
6

FED SQUARE ANNUAL REPORT 2017–18
8 OUR BOARD
MS DEBORAH BEALE, CHAIR Deb Beale has a Bachelor of Commerce from the University of Melbourne, a Graduate Diploma from the Securities Institute of Australia and a Master of Business Administration from Melbourne Business School. Deb began her working career in the finance industry where she was employed by Merrill Lynch for over a decade. She then moved to Ernst & Young where she specialised in governance and risk management. Deb has also served and continues to serve on a number of government, public, private and not-for-profit boards. Her broad experience includes the areas of finance, corporate governance, public relations and risk management.
MR PATRICK CONLON, BOARD MEMBERPatrick Conlon is a former South Australian politician who represented the electoral district of Elder in the South Australian House of Assembly as a member of the Australian Labor Party from 1997 to 2014. He was Minister for Transport, Minister for Infrastructure, and Minister for Energy, as well as the Leader of Government Business in the Lower House. Until early 2005, Patrick was also Emergency Services Minister.
Patrick served in many portfolios between 2002 and 2013 as a senior cabinet member, including Government Enterprises, Police, Emergency Services, Industrial Relations, State/Local Government Relations, Housing and Urban Development, and Transport and Infrastructure. Since retiring from Parliament, Patrick practised law at Minter Ellison before opening his own consultancy.
MS PAMELA MITCHELL, BOARD MEMBERPam Mitchell is a Chartered Accountant with extensive experience in the establishment, documentation, financial management and reporting of property and investment funds management businesses and superannuation funds in a range of small and medium size enterprises in the corporate, government and not-for-profit sectors.
Pam is currently a non-executive Director of State Trustees Limited and a member of the Audit Committee for the Victorian State Government Department of Economic Development, Jobs, Transport and Resources. She also chairs the Audit Committee for the Australian Radiation and Nuclear Safety Agency.
She was a Director of the Emergency Services and State Super Board and has held many roles as Chief Financial Officer and Company Secretary in the investment and property sectors.
MR LESLIE WILLIAMSON, BOARD MEMBERLes Williamson has been a leader in the information and communications technology (ICT) industry for over 25 years, with various roles based in Sweden, Asia Pacific and Australia. He graduated from Chisholm Monash University with a degree in Electronic Engineering and began his ICT career with Ericsson, one of the largest telecommunications companies in the world.
Les had held various roles over his 13-year career with Ericsson, including three years spent in Europe. He joined Cisco Systems in 1998 and spent 14 years in various leadership roles as a Vice President in Australia and throughout the Asia Pacific region, leading country-wide change agendas to ensure long term market relevance and success, and delivering upon the promise of the Internet Economy.
Les was made a fellow of Engineers Australia in 2010 and has expertise in using technology to support cultural change and delivering operational success. He is currently the Vice President of Service and Sales for Citrix Australia and New Zealand.


FSPL has started on a journey of transformation and in the coming years, some major improvements to Fed Square will see a re-imagined, fit for purpose, enhanced, customer-focused Fed Square.
THE YEAR’S ACTIVITY
17
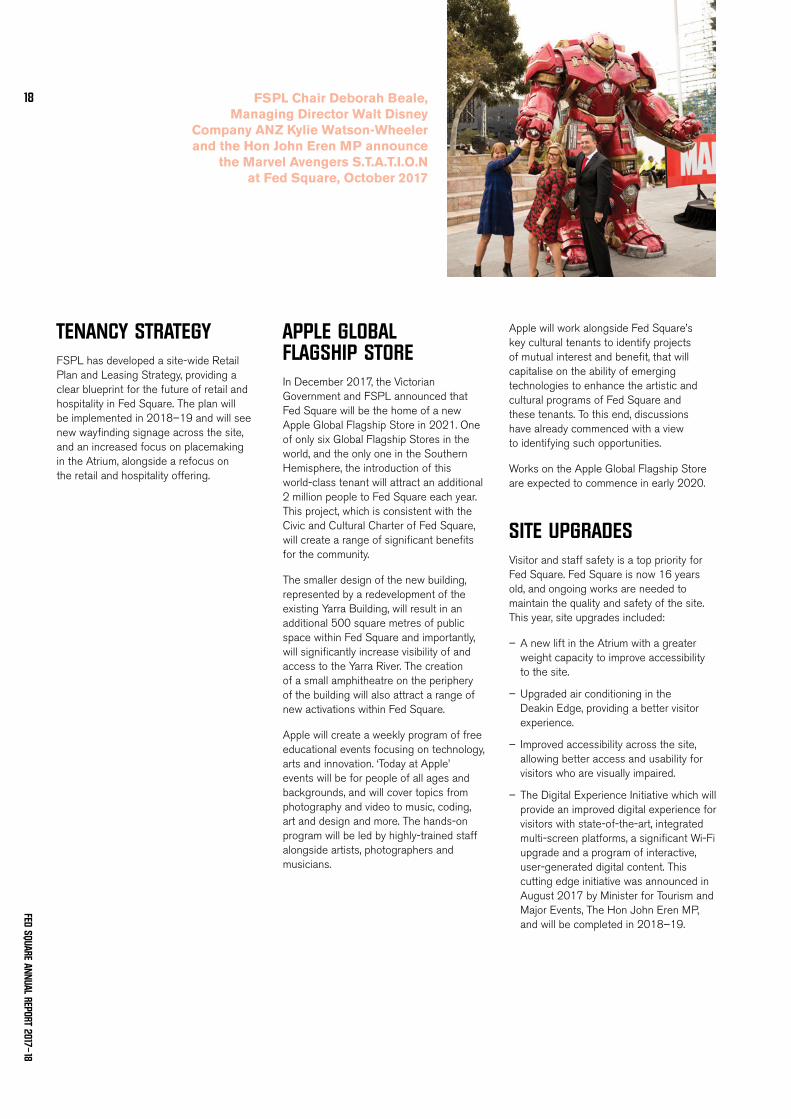
FSPL Chair Deborah Beale, Managing Director Walt Disney
Company ANZ Kylie Watson-Wheeler and the Hon John Eren MP announce
the Marvel Avengers S.T.A.T.I.O.N at Fed Square, October 2017
TENANCY STRATEGY FSPL has developed a site-wide Retail Plan and Leasing Strategy, providing a clear blueprint for the future of retail and hospitality in Fed Square. The plan will be implemented in 2018–19 and will see new wayfinding signage across the site, and an increased focus on placemaking in the Atrium, alongside a refocus on the retail and hospitality offering.
APPLE GLOBAL FLAGSHIP STOREIn December 2017, the Victorian Government and FSPL announced that Fed Square will be the home of a new Apple Global Flagship Store in 2021. One of only six Global Flagship Stores in the world, and the only one in the Southern Hemisphere, the introduction of this world-class tenant will attract an additional 2 million people to Fed Square each year. This project, which is consistent with the Civic and Cultural Charter of Fed Square, will create a range of significant benefits for the community.
The smaller design of the new building, represented by a redevelopment of the existing Yarra Building, will result in an additional 500 square metres of public space within Fed Square and importantly, will significantly increase visibility of and access to the Yarra River. The creation of a small amphitheatre on the periphery of the building will also attract a range of new activations within Fed Square.
Apple will create a weekly program of free educational events focusing on technology, arts and innovation. ‘Today at Apple’ events will be for people of all ages and backgrounds, and will cover topics from photography and video to music, coding, art and design and more. The hands-on program will be led by highly-trained staff alongside artists, photographers and musicians.
Apple will work alongside Fed Square’s key cultural tenants to identify projects of mutual interest and benefit, that will capitalise on the ability of emerging technologies to enhance the artistic and cultural programs of Fed Square and these tenants. To this end, discussions have already commenced with a view to identifying such opportunities.
Works on the Apple Global Flagship Store are expected to commence in early 2020.
SITE UPGRADESVisitor and staff safety is a top priority for Fed Square. Fed Square is now 16 years old, and ongoing works are needed to maintain the quality and safety of the site. This year, site upgrades included:
– A new lift in the Atrium with a greater weight capacity to improve accessibility to the site.
– Upgraded air conditioning in the Deakin Edge, providing a better visitor experience.
– Improved accessibility across the site, allowing better access and usability for visitors who are visually impaired.
– The Digital Experience Initiative which will provide an improved digital experience for visitors with state-of-the-art, integrated multi-screen platforms, a significant Wi-Fi upgrade and a program of interactive, user-generated digital content. This cutting edge initiative was announced in August 2017 by Minister for Tourism and Major Events, The Hon John Eren MP, and will be completed in 2018–19.
18
FED SQUARE ANNUAL REPORT 2017–18

NAIDOC Week, July 2017
THE YEAR’S ACTIVITY
21

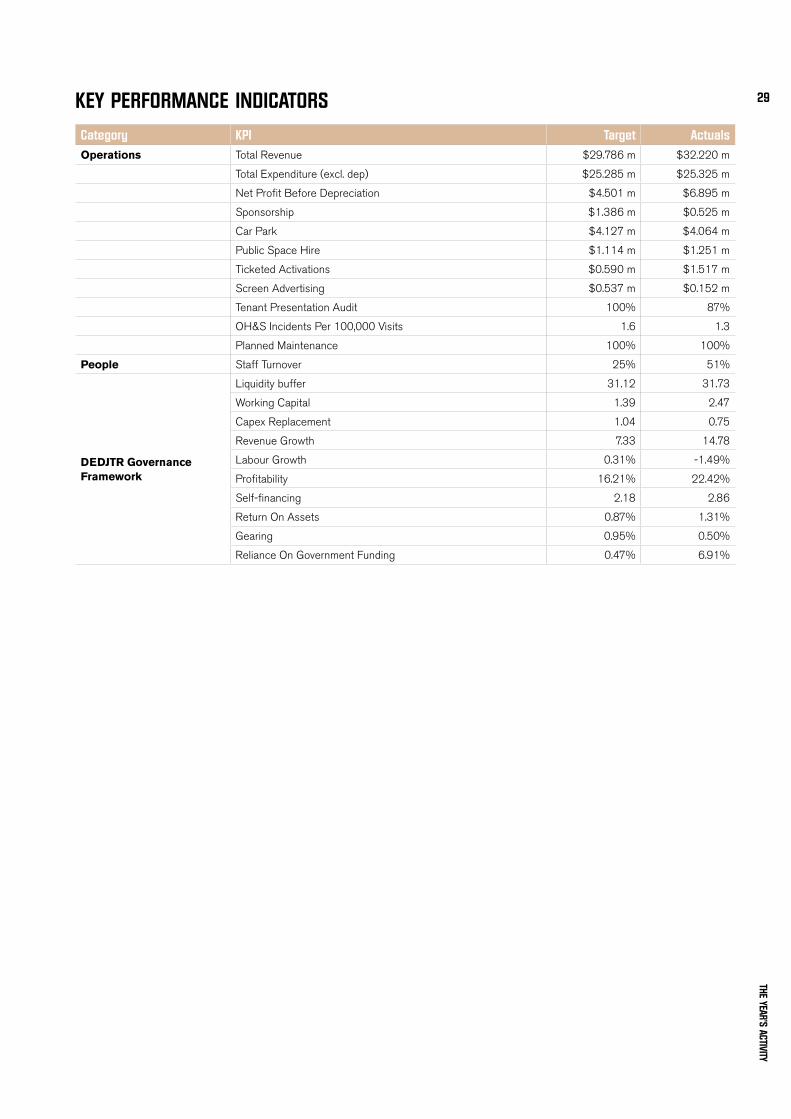
KEY PERFORMANCE INDICATORS
Category KPI Target ActualsOperations Total Revenue $29.786 m $32.220 m
Total Expenditure (excl. dep) $25.285 m $25.325 m
Net Profit Before Depreciation $4.501 m $6.895 m
Sponsorship $1.386 m $0.525 m
Car Park $4.127 m $4.064 m
Public Space Hire $1.114 m $1.251 m
Ticketed Activations $0.590 m $1.517 m
Screen Advertising $0.537 m $0.152 m
Tenant Presentation Audit 100% 87%
OH&S Incidents Per 100,000 Visits 1.6 1.3
Planned Maintenance 100% 100%
People Staff Turnover 25% 51%
DEDJTR Governance Framework
Liquidity buffer 31.12 31.73
Working Capital 1.39 2.47
Capex Replacement 1.04 0.75
Revenue Growth 7.33 14.78
Labour Growth 0.31% -1.49%
Profitability 16.21% 22.42%
Self-financing 2.18 2.86
Return On Assets 0.87% 1.31%
Gearing 0.95% 0.50%
Reliance On Government Funding 0.47% 6.91%
THE YEAR’S ACTIVITY
29

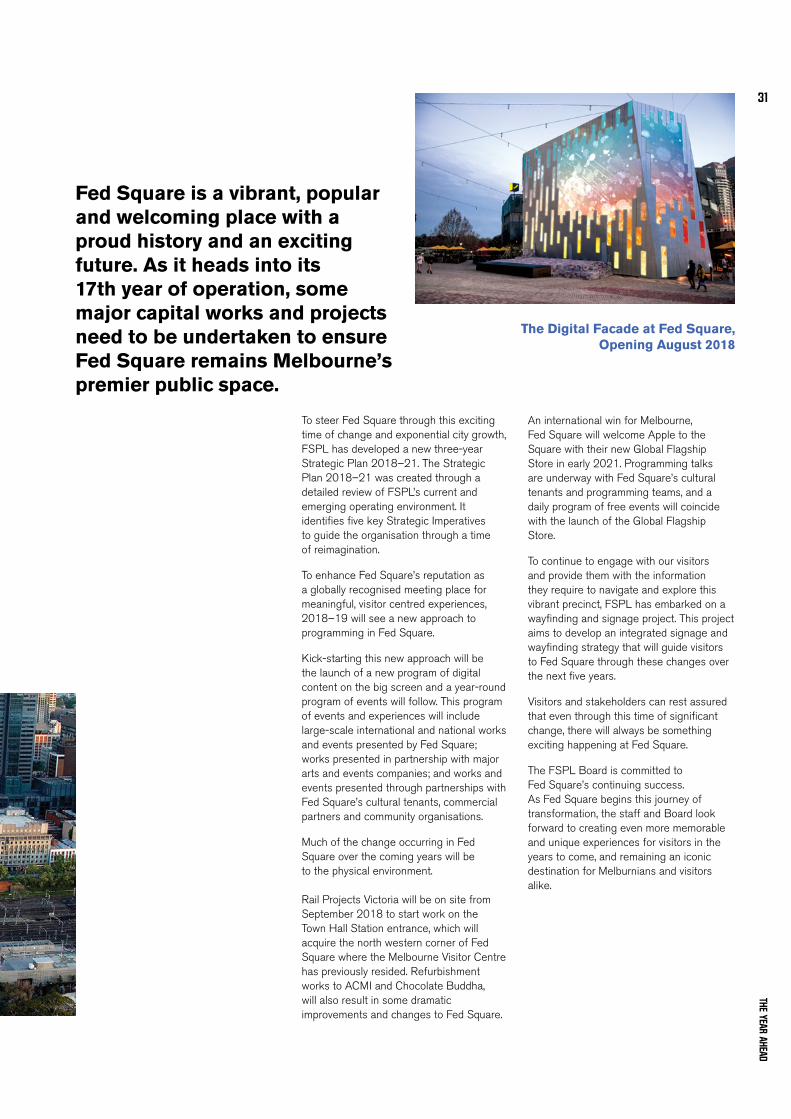
The Digital Facade at Fed Square, Opening August 2018
Fed Square is a vibrant, popular and welcoming place with a proud history and an exciting future. As it heads into its 17th year of operation, some major capital works and projects need to be undertaken to ensure Fed Square remains Melbourne’s premier public space.
To steer Fed Square through this exciting time of change and exponential city growth, FSPL has developed a new three-year Strategic Plan 2018–21. The Strategic Plan 2018–21 was created through a detailed review of FSPL’s current and emerging operating environment. It identifies five key Strategic Imperatives to guide the organisation through a time of reimagination.
To enhance Fed Square’s reputation as a globally recognised meeting place for meaningful, visitor centred experiences, 2018–19 will see a new approach to programming in Fed Square.
Kick-starting this new approach will be the launch of a new program of digital content on the big screen and a year-round program of events will follow. This program of events and experiences will include large-scale international and national works and events presented by Fed Square; works presented in partnership with major arts and events companies; and works and events presented through partnerships with Fed Square’s cultural tenants, commercial partners and community organisations.
Much of the change occurring in Fed Square over the coming years will be to the physical environment. Rail Projects Victoria will be on site from September 2018 to start work on the Town Hall Station entrance, which will acquire the north western corner of Fed Square where the Melbourne Visitor Centre has previously resided. Refurbishment works to ACMI and Chocolate Buddha, will also result in some dramatic improvements and changes to Fed Square.
An international win for Melbourne, Fed Square will welcome Apple to the Square with their new Global Flagship Store in early 2021. Programming talks are underway with Fed Square’s cultural tenants and programming teams, and a daily program of free events will coincide with the launch of the Global Flagship Store.
To continue to engage with our visitors and provide them with the information they require to navigate and explore this vibrant precinct, FSPL has embarked on a wayfinding and signage project. This project aims to develop an integrated signage and wayfinding strategy that will guide visitors to Fed Square through these changes over the next five years.
Visitors and stakeholders can rest assured that even through this time of significant change, there will always be something exciting happening at Fed Square.
The FSPL Board is committed to Fed Square’s continuing success. As Fed Square begins this journey of transformation, the staff and Board look forward to creating even more memorable and unique experiences for visitors in the years to come, and remaining an iconic destination for Melburnians and visitors alike.
THE YEAR AHEAD
31
CORPORATE GOVERNANCE
STATEMENT OF CORPORATE GOVERNANCEThe Directors of FSPL are committed to the highest standard of corporate governance and acknowledge the need for continued maintenance of governance practice and ethical conduct by all Directors and employees.
Accordingly, they have ensured that systems and procedures are in place to provide appropriate assurance that the company undertakes its activities and functions in accordance with:
– All legal requirements;
– The best interests of shareholders;
– An environment that meets relevant standards; and
– A manner that is responsible to all stakeholders and the wider community.
FED SQUARE ANNUAL REPORT 2017–18
32
OBJECTS AND POWERS OF THE COMPANYThe objects of the company are those set out in the FSPL Constitution and Federation Square Civic and Cultural Charter and include without limitation:
a) to occupy the site known as Federation Square;
b) to use, refurbish, maintain, improve, develop, lease, licence, manage, operate and modify all or any part of Federation Square;
c) in relation to any part of Federation Square, to carry on any or all of:
i) the businesses of owners, operators, managers, licensors, lessors or occupiers of: 1) galleries, exhibition centres, libraries, art and craft centres and museums, 2) car parks, 3) theatres, cinemas and cinema based entertainment facilities, radio, television and other multi-media studios, outdoor video screens and video/LED signage, 4) restaurants, cafes, taverns, hotels, food and drink premises (including, without limitation, take-away food and drink premises), liquor vendors, shops, convenience restaurants and convenience shops, and nightclubs, 5) function centres, conference centres and reception centres, 6) retail outlets, shops and stores (including, without limitation those required for service industries and including, without limitation, cash dispensing machines, ticketing machines and tourist and other information services providing machines), 7) offices, 8) amusement parlours and gaming and gambling premises, 9) indoor recreation facilities, 10) visitor and tourist information services and other visitor and tourist services,
ii) live performances, entertainment, carnivals, circuses, community or public events, (both indoor and outdoor), festivals, exhibitions and performances;
iii) places of assembly for religious and cultural activities, entertainment or meetings; and
iv) markets.
DUTIES OF DIRECTORSThe duties of Directors include:
– Duty to act honestly in good faith in the best interests of the corporation and for a proper purpose;
– Duty to act with care and diligence;
– Duty to avoid conflict in the position of a director and/or any interest that a director may have;
– Duties which prohibit the misuse of information obtained by directors; and
– Duties which prohibit a director from taking for oneself the company’s opportunities.
RESPONSIBILITIES OF THE BOARDThe primary responsibilities of the Board include:
– Establishing the company’s vision, mission, values and ethical standards;
– Ensuring the company’s long term viability and enhancing the financial position;
– Formulating and overseeing implementation of corporate strategy;
– Approving the business plan, budget and corporate policies;
– Agreeing key performance indicators (KPIs);
– Monitoring/assessing performance of the company, the Board itself, management and major projects;
– Overseeing the risk management framework and monitoring business risks;
– Appointing and appraising the performance of the Chief Executive Officer;
– Requiring and monitoring legal and regulatory compliance;
– Approving annual accounts, annual report and other public documents;
– Ensuring an effective system of internal controls exists; and
– Delegating an appropriate level of authority to management.
BOARD COMMITTEESThe Board has established two permanent Committees, being the Finance & Audit Committee and the Board Nominations & Executive Remuneration Committee. Committee decisions become recommendations for submission to the Board for resolution.
RISK MANAGEMENTFSPL recognises the need for active risk management procedures and during the year reviewed the Risk Management Policy and Strategy, and procedures to monitor progress with proposed plans. The risk management program is designed to provide a structured approach to business planning, improve operational performance, encourage pro-active management and protect assets, people, finance and property.
Risks are identified, assessed and treated in accordance with the principles contained in Australia/New Zealand Risk Management Standard AS/NZS ISO 31000:2009.
RISK MANAGEMENT ATTESTATIONI, Deborah Beale, certify that Fed Square Pty Ltd has complied with the Ministerial Standing Direction 3.7.1 – Risk Management Framework and Processes. The Fed Square Pty Ltd Finance & Audit Committee verifies this.
DEBORAH BEALE CHAIR
STATEMENT OF CORPORATE GOVERNANCE
33
ASSET MANAGEMENT ACCOUNTABILITY FRAMEWORKThe Asset Management Accountability Framework (AMAF) establishes a flexible and non-prescriptive set of requirements which aim to ensure Victorian public-sector entities manage asset portfolios appropriately. Whilst FSPL is not subject to the provisions of the Financial Management Act 1994 (FMA), the company is implementing the requirements of Ministerial Standing Direction 4.2.3 – Asset Management Accountability on a voluntary basis.
ASSET MANAGEMENT ACCOUNTABILITY FRAMEWORK ATTESTATIONI, Deborah Beale, certify that Fed Square Pty Ltd has complied with the Ministerial Standing Direction 4.2.3 – Asset Management Accountability – Asset Management Accountability. The Fed Square Pty Ltd Finance & Audit Committee verifies this.
DEBORAH BEALE CHAIR
FINANCE & AUDIT COMMITTEE
The main responsibilities of the Finance & Audit Committee are to:
– Review and report independently to the Board on the annual report;
– Assist the Board in reviewing the effectiveness of the internal control environment covering: — effectiveness and efficiency of operations; — reliability of financial reporting; and — compliance with applicable laws and regulations;
– Determine the scope of the internal audit function and ensure its resources are adequate and used effectively, including coordination with the external auditors;
– Maintain effective communication with external auditors;
– Consider recommendations made by internal and external auditors and review the implementation of actions to resolve issues raised;
– Oversee the effective operation of the risk management framework;
– Oversee the effective operation of treasury management; and
– Oversee insurance and legal proceedings.
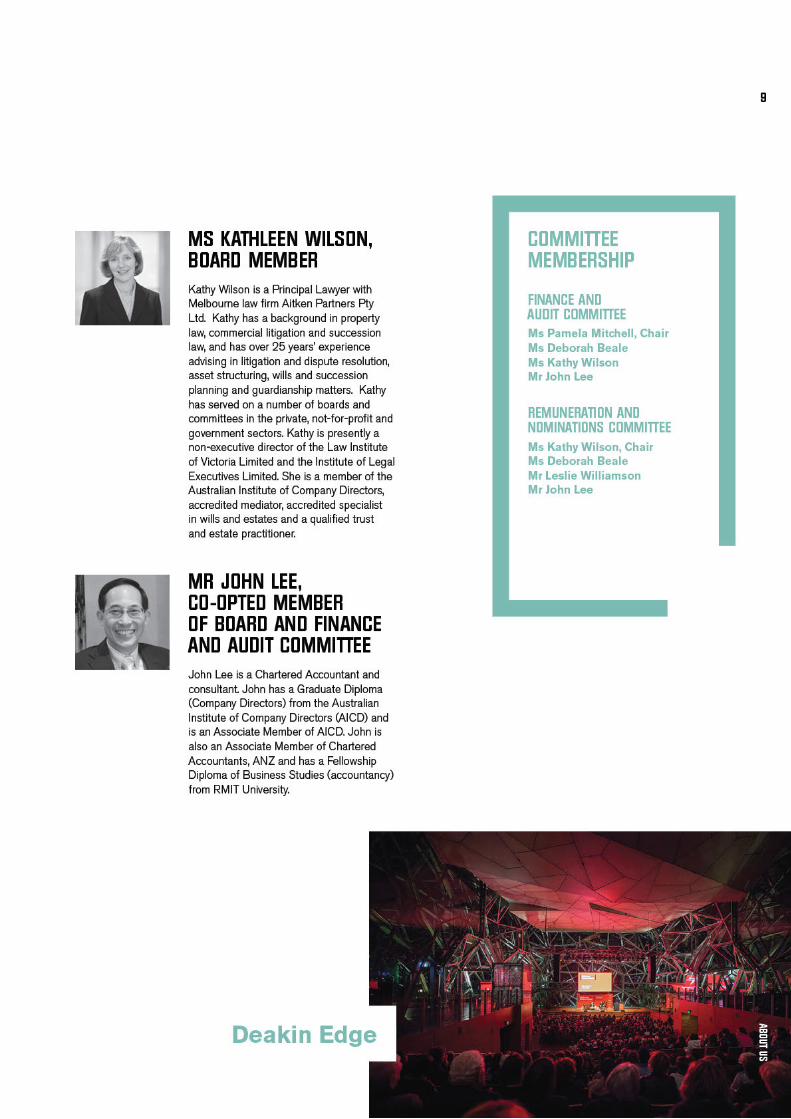
The members of the Committee during the year ended 30 June 2018 were Pamela Mitchell (Chair) Deborah Beale, Kathleen Wilson and John Lee as a co-opted member.
COMPLIANCE ATTESTATION FRAMEWORKThe Standing Directions of the Minister for Finance 2016 (Directions) set the standard for financial management in the Victorian public sector. In April 2016 the Victorian State Government launched the Whole of Government “Compliance Attestation Framework” to assist with monitoring, reporting on and attesting to compliance with the Directions.
The Directions are issued under the provisions of the Financial Management Act 1994 (FMA). The Directions require agencies to annually attest compliance with applicable requirements in the FMA, the Directions and the supporting Instructions. Whilst FSPL is not subject to the provisions of the FMA, the company is implementing the requirements of the Compliance Attestation Framework on a voluntary basis.
INTERNAL AUDITThe company engaged Protiviti Pty Limited as the Internal Auditor to assist in evaluating the company’s internal controls.
Protiviti developed an annual audit plan, having due regard to the company’s risk management program, and implementation of proposed audit activities is now underway.
COMPLIANCE WITH THE PROTECTED DISCLOSURE ACT 2012FSPL does not tolerate improper conduct by employees, nor the taking of reprisals against those who come forward to disclose such conduct. FSPL is committed to ensuring transparency and accountability in its administrative and management practices, and supports the making of disclosures that reveal corrupt conduct, conduct involving a substantial mismanagement of public resources, or conduct involving a substantial risk to public health and safety or the environment.
FSPL is committed to the protection of persons who make disclosures from any detrimental action in reprisal for making a disclosure or for co-operating in the investigation of a disclosure.
The Protected Disclosure Act 2012 seeks to encourage and assist people to make disclosures of improper conduct by public officers and public bodies, provides protections for people who make disclosures and provides for the confidentiality of the content of disclosures and the persons who make them.
MAKING DISCLOSURESFSPL is not a body to which a protected disclosure can be made under the Protected Disclosure Act 2012. Such disclosures must be made to:
Independent Broad-based Anti-corruption Commission (IBAC).
Level 1, North Tower, 459 Collins Street Melbourne, VIC 3000 Phone: 1300 735 135 Mail: IBAC, GPO Box 24234, Melbourne, VIC 3000 Internet: www.ibac.vic.gov.au
The IBAC website contains a secure email disclosure process.
PROTECTING PERSONS WHO MAKE DISCLOSURESFSPL has established procedures to protect persons who make, or who co-operate in the investigation of, protected disclosures, from detrimental action that might be taken against them. Those procedures can be accessed at www.fedsquare.com/information/or a copy obtained from the General Manager - Corporate Services.
FED SQUARE ANNUAL REPORT 2017–18
34
DIRECTORS’ REPORT
The Directors of FSPL present their report on the financial statements of the company for the year ended 30 June 2018.
MINISTERThe Hon. John Eren, MP Minister for Tourism and Major Events
DIRECTORSThe Directors in office during the period and at 30 June 2018 unless otherwise stated were:
– Ms Deborah Beale (Chair) – Ms Kathleen Wilson – Ms Pamela Mitchell – Mr Les Williamson – Mr Patrick Conlon
ACCOUNTABLE OFFICERThe Accountable Officer during the period and at 30 June 2018 unless otherwise stated were:
– Mr Jonathan Tribe, Chief Executive Officer
OWNERSHIP OF FED SQUARE PTY LTDFSPL is a company wholly owned by State Trustees Limited as custodian trustee on behalf of the State of Victoria. The share is held pursuant to the State Investment Trust Deed and the Treasurer is the Minister responsible for the state holding in FSPL under the Deed.
PRINCIPAL ACTIVITIESThe principal activity of FSPL continues to be the management of Federation Square.
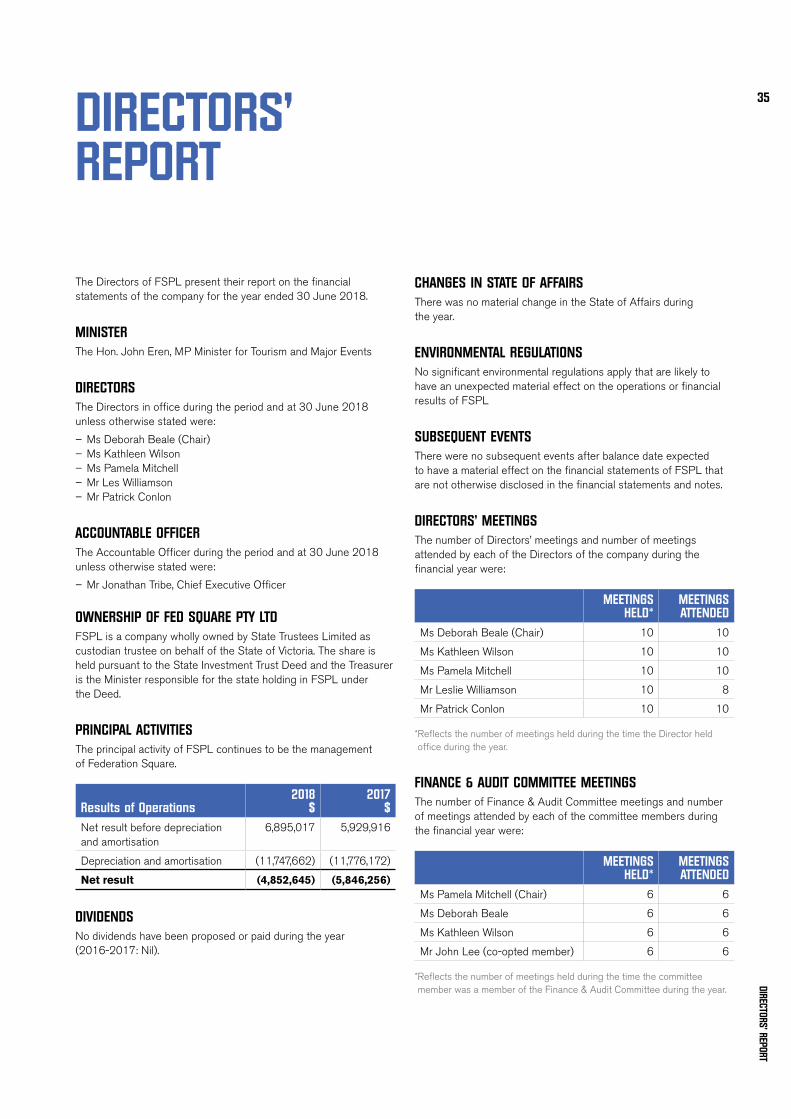
Results of Operations2018
$2017
$Net result before depreciation and amortisation
6,895,017 5,929,916
Depreciation and amortisation (11,747,662) (11,776,172)
Net result (4,852,645) (5,846,256)
DIVIDENDSNo dividends have been proposed or paid during the year (2016-2017: Nil).
CHANGES IN STATE OF AFFAIRSThere was no material change in the State of Affairs during the year.
ENVIRONMENTAL REGULATIONSNo significant environmental regulations apply that are likely to have an unexpected material effect on the operations or financial results of FSPL
SUBSEQUENT EVENTSThere were no subsequent events after balance date expected to have a material effect on the financial statements of FSPL that are not otherwise disclosed in the financial statements and notes.
DIRECTORS’ MEETINGSThe number of Directors’ meetings and number of meetings attended by each of the Directors of the company during the financial year were:
MEETINGS HELD*
MEETINGS ATTENDED
Ms Deborah Beale (Chair) 10 10
Ms Kathleen Wilson 10 10
Ms Pamela Mitchell 10 10
Mr Leslie Williamson 10 8
Mr Patrick Conlon 10 10
* Reflects the number of meetings held during the time the Director held office during the year.
FINANCE & AUDIT COMMITTEE MEETINGSThe number of Finance & Audit Committee meetings and number of meetings attended by each of the committee members during the financial year were:
MEETINGS HELD*
MEETINGS ATTENDED
Ms Pamela Mitchell (Chair) 6 6
Ms Deborah Beale 6 6
Ms Kathleen Wilson 6 6
Mr John Lee (co-opted member) 6 6
* Reflects the number of meetings held during the time the committee member was a member of the Finance & Audit Committee during the year.
DIRECTORS’ REPORT
35
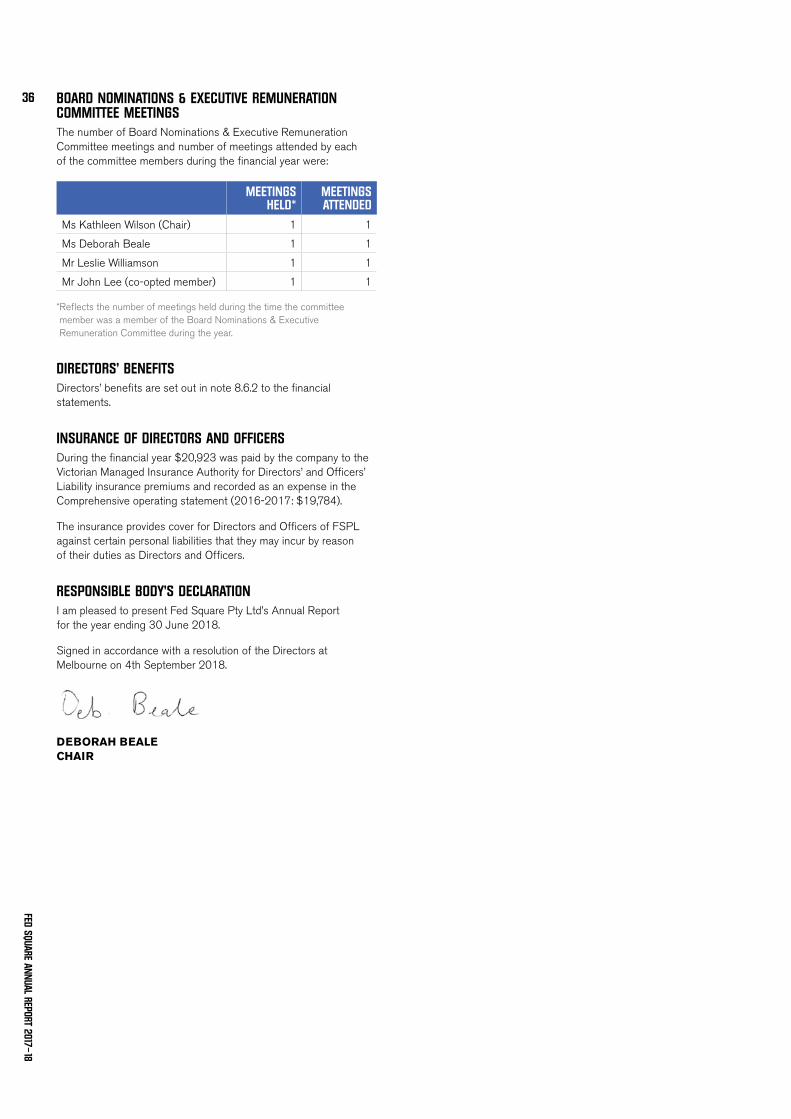
BOARD NOMINATIONS & EXECUTIVE REMUNERATION COMMITTEE MEETINGSThe number of Board Nominations & Executive Remuneration Committee meetings and number of meetings attended by each of the committee members during the financial year were:
MEETINGS HELD*
MEETINGS ATTENDED
Ms Kathleen Wilson (Chair) 1 1
Ms Deborah Beale 1 1
Mr Leslie Williamson 1 1
Mr John Lee (co-opted member) 1 1
* Reflects the number of meetings held during the time the committee member was a member of the Board Nominations & Executive Remuneration Committee during the year.
DIRECTORS’ BENEFITSDirectors’ benefits are set out in note 8.6.2 to the financial statements.
INSURANCE OF DIRECTORS AND OFFICERSDuring the financial year $20,923 was paid by the company to the Victorian Managed Insurance Authority for Directors’ and Officers’ Liability insurance premiums and recorded as an expense in the Comprehensive operating statement (2016-2017: $19,784).
The insurance provides cover for Directors and Officers of FSPL against certain personal liabilities that they may incur by reason of their duties as Directors and Officers.
RESPONSIBLE BODY’S DECLARATIONI am pleased to present Fed Square Pty Ltd’s Annual Report for the year ending 30 June 2018.
Signed in accordance with a resolution of the Directors at Melbourne on 4th September 2018.
DEBORAH BEALE CHAIR
FED SQUARE ANNUAL REPORT 2017–18
36
FED SQUARE ANNUAL REPORT 2017–18
38
FINANCIAL REPORT
39
FED SQUARE ANNUAL REPORT 2017–18
40
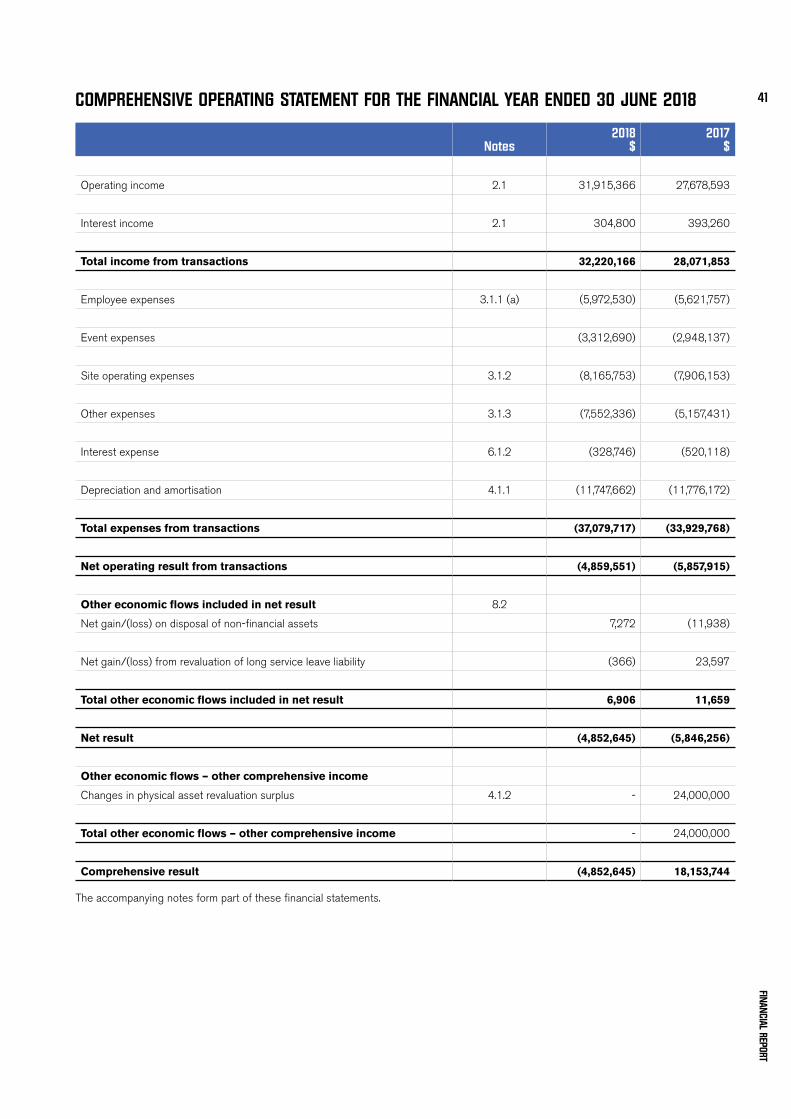
COMPREHENSIVE OPERATING STATEMENT FOR THE FINANCIAL YEAR ENDED 30 JUNE 2018
Notes2018
$2017
$
Operating income 2.1 31,915,366 27,678,593
Interest income 2.1 304,800 393,260
Total income from transactions 32,220,166 28,071,853
Employee expenses 3.1.1 (a) (5,972,530) (5,621,757)
Event expenses (3,312,690) (2,948,137)
Site operating expenses 3.1.2 (8,165,753) (7,906,153)
Other expenses 3.1.3 (7,552,336) (5,157,431)
Interest expense 6.1.2 (328,746) (520,118)
Depreciation and amortisation 4.1.1 (11,747,662) (11,776,172)
Total expenses from transactions (37,079,717) (33,929,768)
Net operating result from transactions (4,859,551) (5,857,915)
Other economic flows included in net result 8.2
Net gain/(loss) on disposal of non-financial assets 7,272 (11,938)
Net gain/(loss) from revaluation of long service leave liability (366) 23,597
Total other economic flows included in net result 6,906 11,659
Net result (4,852,645) (5,846,256)
Other economic flows – other comprehensive income
Changes in physical asset revaluation surplus 4.1.2 - 24,000,000
Total other economic flows – other comprehensive income - 24,000,000
Comprehensive result (4,852,645) 18,153,744
The accompanying notes form part of these financial statements.
FINANCIAL REPORT
41
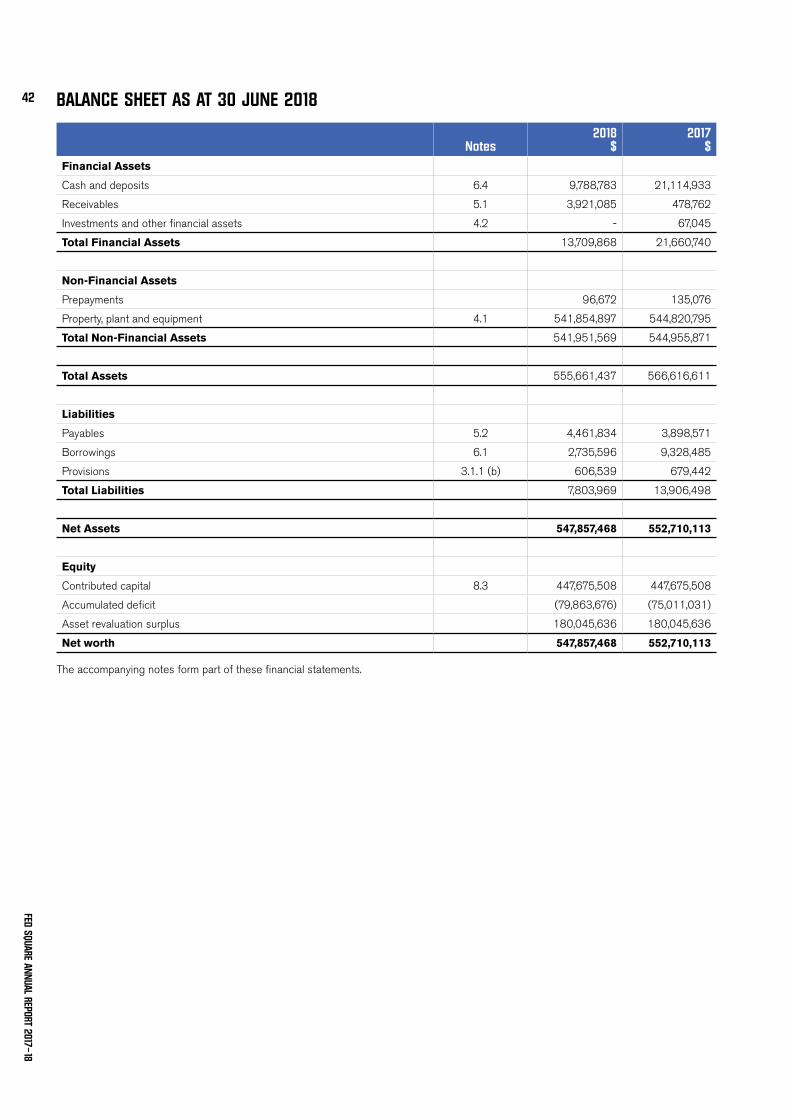
BALANCE SHEET AS AT 30 JUNE 2018
Notes2018
$2017
$Financial Assets
Cash and deposits 6.4 9,788,783 21,114,933
Receivables 5.1 3,921,085 478,762
Investments and other financial assets 4.2 - 67,045
Total Financial Assets 13,709,868 21,660,740
Non-Financial Assets
Prepayments 96,672 135,076
Property, plant and equipment 4.1 541,854,897 544,820,795
Total Non-Financial Assets 541,951,569 544,955,871
Total Assets 555,661,437 566,616,611
Liabilities
Payables 5.2 4,461,834 3,898,571
Borrowings 6.1 2,735,596 9,328,485
Provisions 3.1.1 (b) 606,539 679,442
Total Liabilities 7,803,969 13,906,498
Net Assets 547,857,468 552,710,113
Equity
Contributed capital 8.3 447,675,508 447,675,508
Accumulated deficit (79,863,676) (75,011,031)
Asset revaluation surplus 180,045,636 180,045,636
Net worth 547,857,468 552,710,113
The accompanying notes form part of these financial statements.
FED SQUARE ANNUAL REPORT 2017–18
42
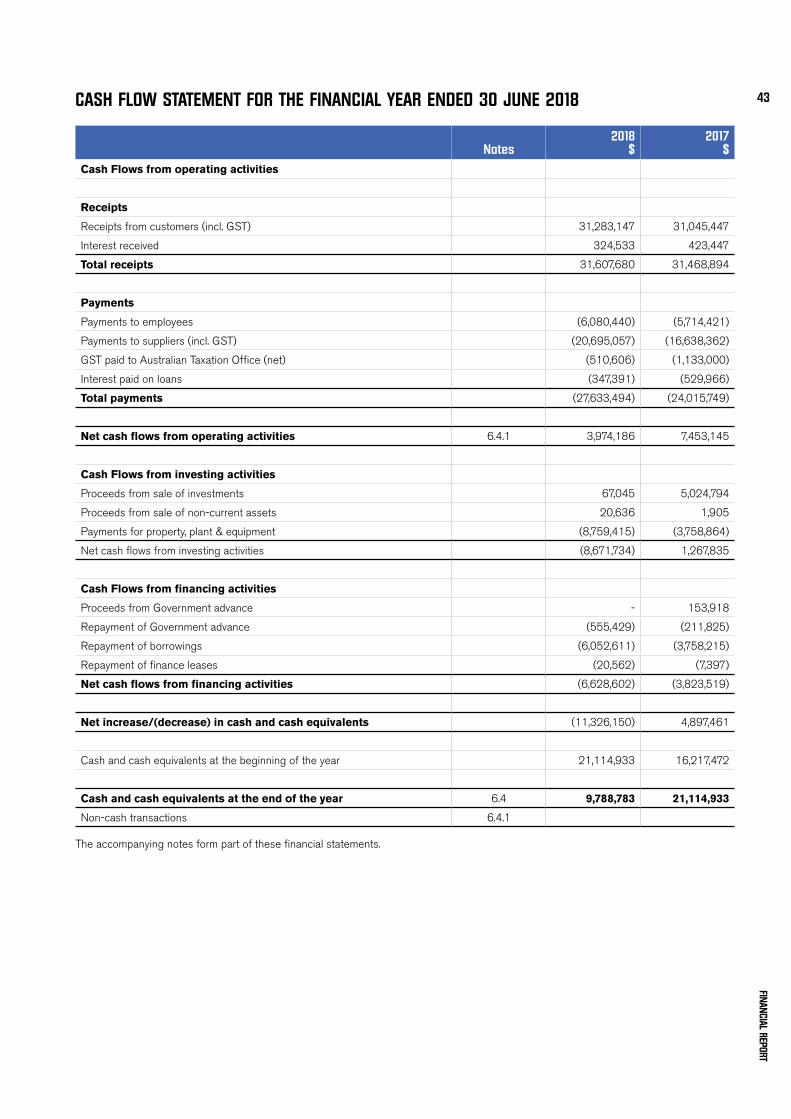
CASH FLOW STATEMENT FOR THE FINANCIAL YEAR ENDED 30 JUNE 2018
Notes2018
$2017
$Cash Flows from operating activities
Receipts
Receipts from customers (incl. GST) 31,283,147 31,045,447
Interest received 324,533 423,447
Total receipts 31,607,680 31,468,894
Payments
Payments to employees (6,080,440) (5,714,421)
Payments to suppliers (incl. GST) (20,695,057) (16,638,362)
GST paid to Australian Taxation Office (net) (510,606) (1,133,000)
Interest paid on loans (347,391) (529,966)
Total payments (27,633,494) (24,015,749)
Net cash flows from operating activities 6.4.1 3,974,186 7,453,145
Cash Flows from investing activities
Proceeds from sale of investments 67,045 5,024,794
Proceeds from sale of non-current assets 20,636 1,905
Payments for property, plant & equipment (8,759,415) (3,758,864)
Net cash flows from investing activities (8,671,734) 1,267,835
Cash Flows from financing activities
Proceeds from Government advance - 153,918
Repayment of Government advance (555,429) (211,825)
Repayment of borrowings (6,052,611) (3,758,215)
Repayment of finance leases (20,562) (7,397)
Net cash flows from financing activities (6,628,602) (3,823,519)
Net increase/(decrease) in cash and cash equivalents (11,326,150) 4,897,461
Cash and cash equivalents at the beginning of the year 21,114,933 16,217,472
Cash and cash equivalents at the end of the year 6.4 9,788,783 21,114,933
Non-cash transactions 6.4.1
The accompanying notes form part of these financial statements.
FINANCIAL REPORT
43
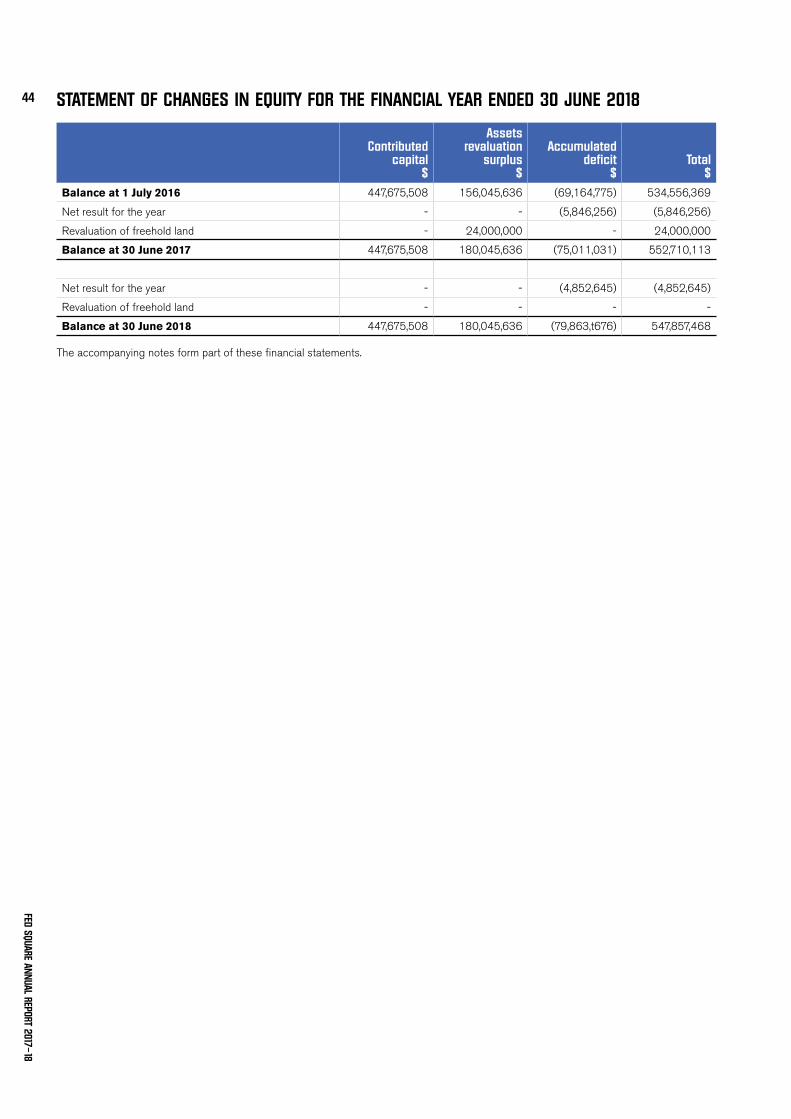
STATEMENT OF CHANGES IN EQUITY FOR THE FINANCIAL YEAR ENDED 30 JUNE 2018
Contributed capital
$
Assets revaluation
surplus $
Accumulated deficit
$Total
$Balance at 1 July 2016 447,675,508 156,045,636 (69,164,775) 534,556,369
Net result for the year - - (5,846,256) (5,846,256)
Revaluation of freehold land - 24,000,000 - 24,000,000
Balance at 30 June 2017 447,675,508 180,045,636 (75,011,031) 552,710,113
Net result for the year - - (4,852,645) (4,852,645)
Revaluation of freehold land - - - -
Balance at 30 June 2018 447,675,508 180,045,636 (79,863,t676) 547,857,468
The accompanying notes form part of these financial statements.
FED SQUARE ANNUAL REPORT 2017–18
44
1. ABOUT THIS REPORT
a. Basis of preparationThese financial statements are in Australian dollars and the historical cost convention is used unless a different measurement basis is specifically disclosed in the note associated with the item measured on a different basis.
The accrual basis of accounting has been applied in preparing these financial statements, whereby assets, liabilities, equity, income and expenses are recognised in the reporting period to which they relate, regardless of when cash is received or paid.
Consistent with the requirements of AASB 1004 Contributions, contributions by owners (that is, contributed capital and its repayment) are treated as equity transactions and, therefore, do not form part of the income and expenses.
Capital appropriations received which have been designated as contributions by owners are recognised as contributed capital.
Judgements, estimates and assumptions are required to be made about financial information being presented. The significant judgements made in the preparation of these financial statements are disclosed in the notes where amounts affected by those judgements are disclosed. Estimates and associated assumptions are based on professional judgements derived from historical experience and various other factors that are believed to be reasonable under the circumstances. Actual results may differ from these estimates.
Revisions to accounting estimates are recognised in the period in which the estimate is revised and also in future periods that are affected by the revision. Judgements and assumptions made by management in applying AAS that have significant effects on the financial statements and estimates are disclosed in the notes under the heading: ‘Significant judgement or estimates’.
All amounts in the financial statements have been rounded to the nearest $1 unless otherwise stated.
b. Compliance informationThese general purpose financial statements have been prepared in accordance with the Corporations Act 2001 and applicable Australian Accounting Standards (AASs) which include Interpretations, issued by the Australian Accounting Standards Board (AASB).
For the purposes of preparing financial statements, FSPL is classed as a not-for-profit entity. Where appropriate, those AASs paragraphs applicable to not-for-profit entities have been applied.
Accounting policies selected and applied in these financial statements ensure that the resulting financial information satisfies the concepts of relevance and reliability, thereby ensuring that the substance of the underlying transactions or other events is reported.
These annual financial statements were authorised for issue by the Directors of FSPL on 4th September 2018.
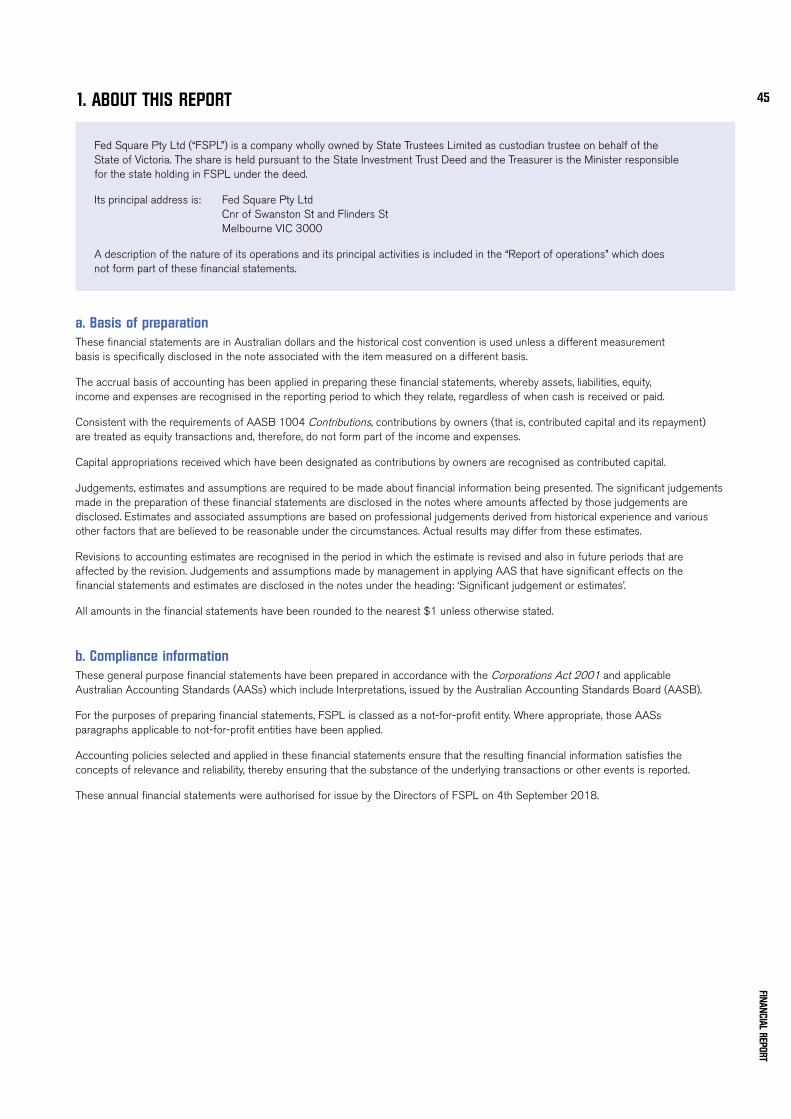
Fed Square Pty Ltd (“FSPL”) is a company wholly owned by State Trustees Limited as custodian trustee on behalf of the State of Victoria. The share is held pursuant to the State Investment Trust Deed and the Treasurer is the Minister responsible for the state holding in FSPL under the deed.
Its principal address is: Fed Square Pty Ltd Cnr of Swanston St and Flinders St Melbourne VIC 3000
A description of the nature of its operations and its principal activities is included in the “Report of operations” which does not form part of these financial statements.
FINANCIAL REPORT
45
2. INCOME TO DELIVER OUR SERVICES
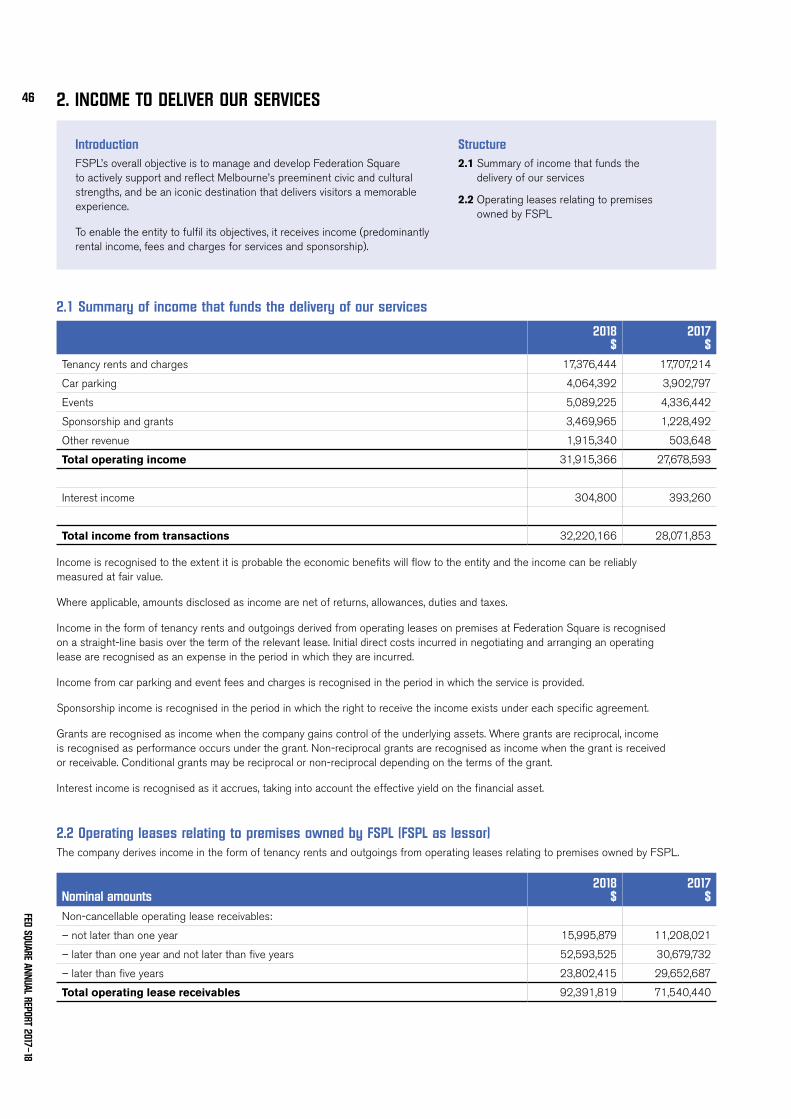
2.1 Summary of income that funds the delivery of our services
2018 $
2017 $
Tenancy rents and charges 17,376,444 17,707,214
Car parking 4,064,392 3,902,797
Events 5,089,225 4,336,442
Sponsorship and grants 3,469,965 1,228,492
Other revenue 1,915,340 503,648
Total operating income 31,915,366 27,678,593
Interest income 304,800 393,260
Total income from transactions 32,220,166 28,071,853
Income is recognised to the extent it is probable the economic benefits will flow to the entity and the income can be reliably measured at fair value.
Where applicable, amounts disclosed as income are net of returns, allowances, duties and taxes.
Income in the form of tenancy rents and outgoings derived from operating leases on premises at Federation Square is recognised on a straight-line basis over the term of the relevant lease. Initial direct costs incurred in negotiating and arranging an operating lease are recognised as an expense in the period in which they are incurred.
Income from car parking and event fees and charges is recognised in the period in which the service is provided.
Sponsorship income is recognised in the period in which the right to receive the income exists under each specific agreement.
Grants are recognised as income when the company gains control of the underlying assets. Where grants are reciprocal, income is recognised as performance occurs under the grant. Non-reciprocal grants are recognised as income when the grant is received or receivable. Conditional grants may be reciprocal or non-reciprocal depending on the terms of the grant.
Interest income is recognised as it accrues, taking into account the effective yield on the financial asset.
2.2 Operating leases relating to premises owned by FSPL (FSPL as lessor)The company derives income in the form of tenancy rents and outgoings from operating leases relating to premises owned by FSPL.
Nominal amounts2018
$2017
$Non-cancellable operating lease receivables:
– not later than one year 15,995,879 11,208,021
– later than one year and not later than five years 52,593,525 30,679,732
– later than five years 23,802,415 29,652,687
Total operating lease receivables 92,391,819 71,540,440
IntroductionFSPL’s overall objective is to manage and develop Federation Square to actively support and reflect Melbourne’s preeminent civic and cultural strengths, and be an iconic destination that delivers visitors a memorable experience.
To enable the entity to fulfil its objectives, it receives income (predominantly rental income, fees and charges for services and sponsorship).
Structure2.1 Summary of income that funds the
delivery of our services
2.2 Operating leases relating to premises owned by FSPL
FED SQUARE ANNUAL REPORT 2017–18
46
3. THE COST OF DELIVERING SERVICES
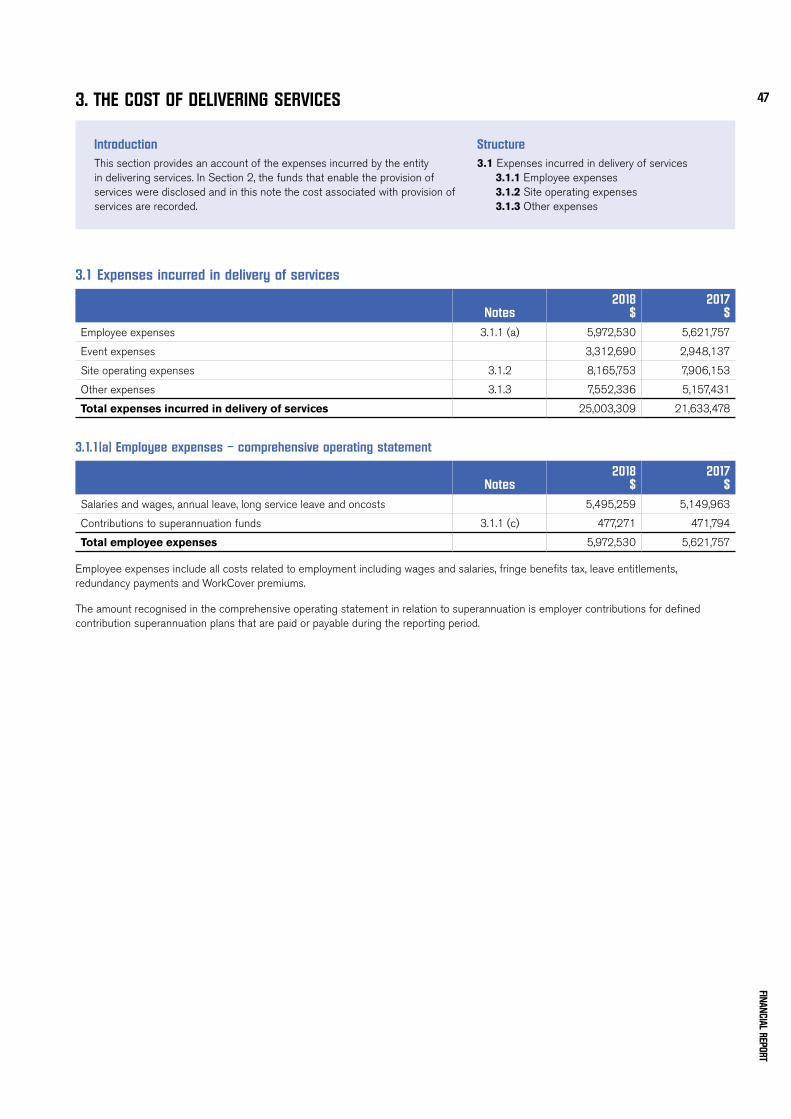
3.1 Expenses incurred in delivery of services
Notes2018
$2017
$Employee expenses 3.1.1 (a) 5,972,530 5,621,757
Event expenses 3,312,690 2,948,137
Site operating expenses 3.1.2 8,165,753 7,906,153
Other expenses 3.1.3 7,552,336 5,157,431
Total expenses incurred in delivery of services 25,003,309 21,633,478
3.1.1(a) Employee expenses – comprehensive operating statement
Notes2018
$2017
$Salaries and wages, annual leave, long service leave and oncosts 5,495,259 5,149,963
Contributions to superannuation funds 3.1.1 (c) 477,271 471,794
Total employee expenses 5,972,530 5,621,757
Employee expenses include all costs related to employment including wages and salaries, fringe benefits tax, leave entitlements, redundancy payments and WorkCover premiums.
The amount recognised in the comprehensive operating statement in relation to superannuation is employer contributions for defined contribution superannuation plans that are paid or payable during the reporting period.
IntroductionThis section provides an account of the expenses incurred by the entity in delivering services. In Section 2, the funds that enable the provision of services were disclosed and in this note the cost associated with provision of services are recorded.
Structure3.1 Expenses incurred in delivery of services 3.1.1 Employee expenses 3.1.2 Site operating expenses 3.1.3 Other expenses
FINANCIAL REPORT
47
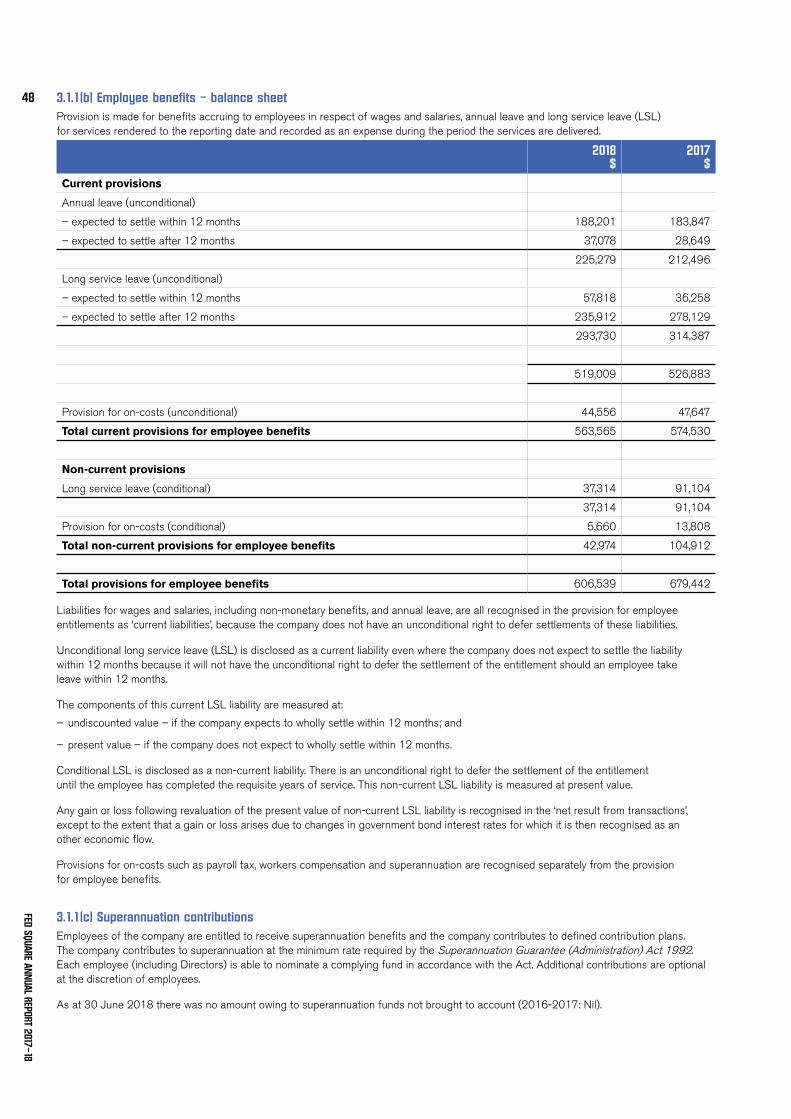
3.1.1(b) Employee benefits – balance sheetProvision is made for benefits accruing to employees in respect of wages and salaries, annual leave and long service leave (LSL) for services rendered to the reporting date and recorded as an expense during the period the services are delivered.
2018 $
2017 $
Current provisions
Annual leave (unconditional)
– expected to settle within 12 months 188,201 183,847
– expected to settle after 12 months 37,078 28,649
225,279 212,496
Long service leave (unconditional)
– expected to settle within 12 months 57,818 36,258
– expected to settle after 12 months 235,912 278,129
293,730 314,387
519,009 526,883
Provision for on-costs (unconditional) 44,556 47,647
Total current provisions for employee benefits 563,565 574,530
Non-current provisions
Long service leave (conditional) 37,314 91,104
37,314 91,104
Provision for on-costs (conditional) 5,660 13,808
Total non-current provisions for employee benefits 42,974 104,912
Total provisions for employee benefits 606,539 679,442
Liabilities for wages and salaries, including non-monetary benefits, and annual leave, are all recognised in the provision for employee entitlements as ‘current liabilities’, because the company does not have an unconditional right to defer settlements of these liabilities.
Unconditional long service leave (LSL) is disclosed as a current liability even where the company does not expect to settle the liability within 12 months because it will not have the unconditional right to defer the settlement of the entitlement should an employee take leave within 12 months.
The components of this current LSL liability are measured at:
– undiscounted value – if the company expects to wholly settle within 12 months; and
– present value – if the company does not expect to wholly settle within 12 months.
Conditional LSL is disclosed as a non-current liability. There is an unconditional right to defer the settlement of the entitlement until the employee has completed the requisite years of service. This non-current LSL liability is measured at present value.
Any gain or loss following revaluation of the present value of non-current LSL liability is recognised in the ‘net result from transactions’, except to the extent that a gain or loss arises due to changes in government bond interest rates for which it is then recognised as an other economic flow.
Provisions for on-costs such as payroll tax, workers compensation and superannuation are recognised separately from the provision for employee benefits.
3.1.1(c) Superannuation contributionsEmployees of the company are entitled to receive superannuation benefits and the company contributes to defined contribution plans. The company contributes to superannuation at the minimum rate required by the Superannuation Guarantee (Administration) Act 1992. Each employee (including Directors) is able to nominate a complying fund in accordance with the Act. Additional contributions are optional at the discretion of employees.
As at 30 June 2018 there was no amount owing to superannuation funds not brought to account (2016-2017: Nil).
FED SQUARE ANNUAL REPORT 2017–18
48
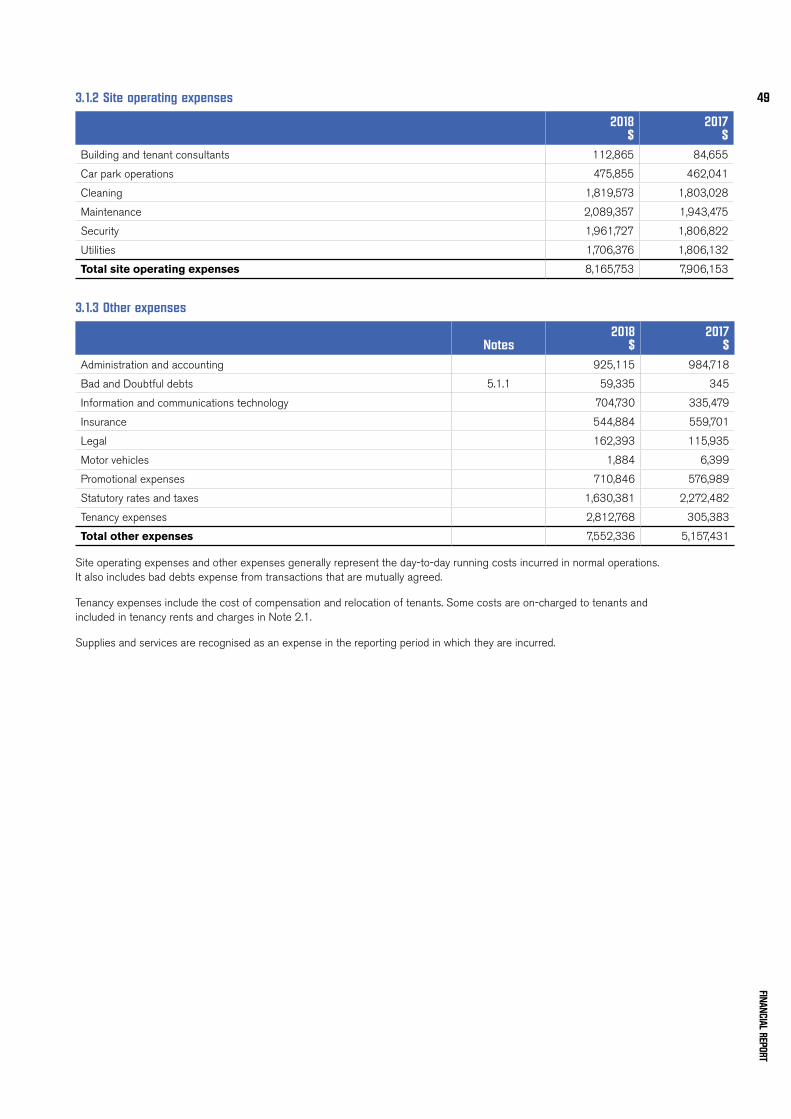
3.1.2 Site operating expenses
2018 $
2017 $
Building and tenant consultants 112,865 84,655
Car park operations 475,855 462,041
Cleaning 1,819,573 1,803,028
Maintenance 2,089,357 1,943,475
Security 1,961,727 1,806,822
Utilities 1,706,376 1,806,132
Total site operating expenses 8,165,753 7,906,153
3.1.3 Other expenses
Notes2018
$2017
$Administration and accounting 925,115 984,718
Bad and Doubtful debts 5.1.1 59,335 345
Information and communications technology 704,730 335,479
Insurance 544,884 559,701
Legal 162,393 115,935
Motor vehicles 1,884 6,399
Promotional expenses 710,846 576,989
Statutory rates and taxes 1,630,381 2,272,482
Tenancy expenses 2,812,768 305,383
Total other expenses 7,552,336 5,157,431
Site operating expenses and other expenses generally represent the day-to-day running costs incurred in normal operations. It also includes bad debts expense from transactions that are mutually agreed.
Tenancy expenses include the cost of compensation and relocation of tenants. Some costs are on-charged to tenants and included in tenancy rents and charges in Note 2.1.
Supplies and services are recognised as an expense in the reporting period in which they are incurred.
FINANCIAL REPORT
49
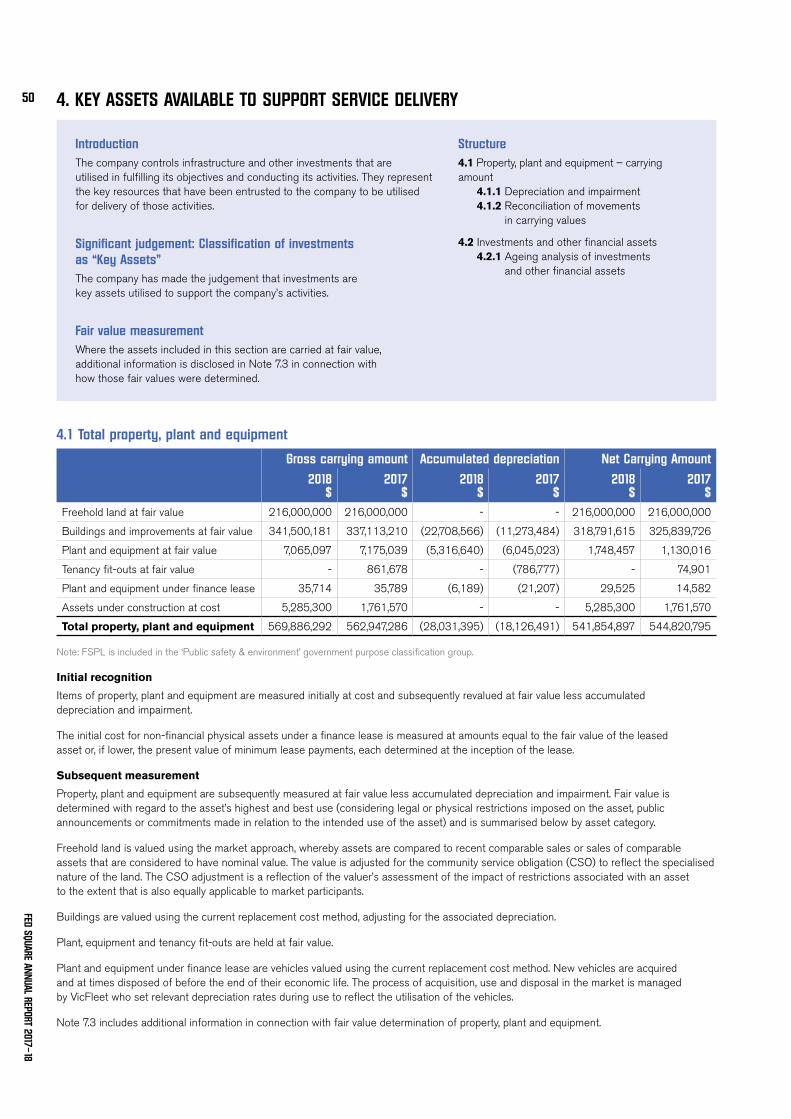
4. KEY ASSETS AVAILABLE TO SUPPORT SERVICE DELIVERY
4.1 Total property, plant and equipment
Gross carrying amount Accumulated depreciation Net Carrying Amount
2018 $
2017 $
2018 $
2017 $
2018 $
2017 $
Freehold land at fair value 216,000,000 216,000,000 - - 216,000,000 216,000,000
Buildings and improvements at fair value 341,500,181 337,113,210 (22,708,566) (11,273,484) 318,791,615 325,839,726
Plant and equipment at fair value 7,065,097 7,175,039 (5,316,640) (6,045,023) 1,748,457 1,130,016
Tenancy fit-outs at fair value - 861,678 - (786,777) - 74,901
Plant and equipment under finance lease 35,714 35,789 (6,189) (21,207) 29,525 14,582
Assets under construction at cost 5,285,300 1,761,570 - - 5,285,300 1,761,570
Total property, plant and equipment 569,886,292 562,947,286 (28,031,395) (18,126,491) 541,854,897 544,820,795
Note: FSPL is included in the ‘Public safety & environment’ government purpose classification group.
Initial recognition
Items of property, plant and equipment are measured initially at cost and subsequently revalued at fair value less accumulated depreciation and impairment.
The initial cost for non-financial physical assets under a finance lease is measured at amounts equal to the fair value of the leased asset or, if lower, the present value of minimum lease payments, each determined at the inception of the lease.
Subsequent measurement
Property, plant and equipment are subsequently measured at fair value less accumulated depreciation and impairment. Fair value is determined with regard to the asset’s highest and best use (considering legal or physical restrictions imposed on the asset, public announcements or commitments made in relation to the intended use of the asset) and is summarised below by asset category.
Freehold land is valued using the market approach, whereby assets are compared to recent comparable sales or sales of comparable assets that are considered to have nominal value. The value is adjusted for the community service obligation (CSO) to reflect the specialised nature of the land. The CSO adjustment is a reflection of the valuer’s assessment of the impact of restrictions associated with an asset to the extent that is also equally applicable to market participants.
Buildings are valued using the current replacement cost method, adjusting for the associated depreciation.
Plant, equipment and tenancy fit-outs are held at fair value.
Plant and equipment under finance lease are vehicles valued using the current replacement cost method. New vehicles are acquired and at times disposed of before the end of their economic life. The process of acquisition, use and disposal in the market is managed by VicFleet who set relevant depreciation rates during use to reflect the utilisation of the vehicles.
Note 7.3 includes additional information in connection with fair value determination of property, plant and equipment.
IntroductionThe company controls infrastructure and other investments that are utilised in fulfilling its objectives and conducting its activities. They represent the key resources that have been entrusted to the company to be utilised for delivery of those activities.
Significant judgement: Classification of investments as “Key Assets”The company has made the judgement that investments are key assets utilised to support the company’s activities.
Fair value measurementWhere the assets included in this section are carried at fair value, additional information is disclosed in Note 7.3 in connection with how those fair values were determined.
Structure4.1 Property, plant and equipment – carrying amount 4.1.1 Depreciation and impairment 4.1.2 Reconciliation of movements
in carrying values
4.2 Investments and other financial assets 4.2.1 Ageing analysis of investments
and other financial assets
FED SQUARE ANNUAL REPORT 2017–18
50
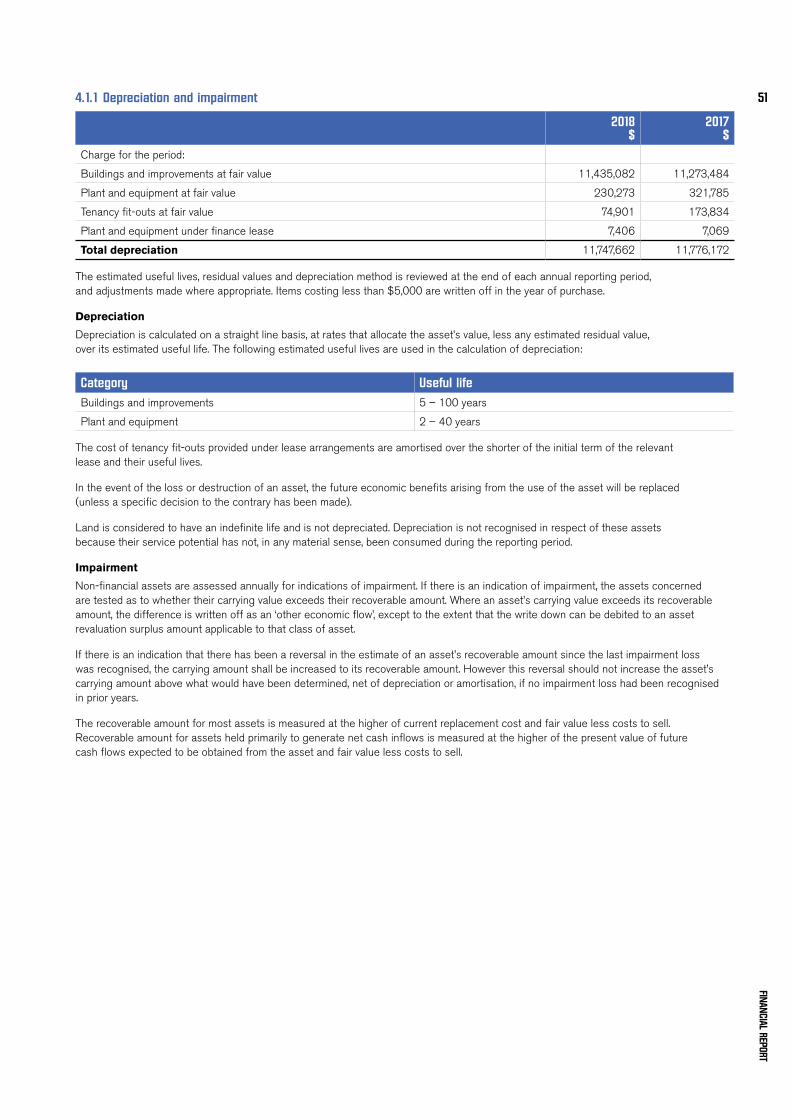
4.1.1 Depreciation and impairment
2018 $
2017 $
Charge for the period:
Buildings and improvements at fair value 11,435,082 11,273,484
Plant and equipment at fair value 230,273 321,785
Tenancy fit-outs at fair value 74,901 173,834
Plant and equipment under finance lease 7,406 7,069
Total depreciation 11,747,662 11,776,172
The estimated useful lives, residual values and depreciation method is reviewed at the end of each annual reporting period, and adjustments made where appropriate. Items costing less than $5,000 are written off in the year of purchase.
Depreciation
Depreciation is calculated on a straight line basis, at rates that allocate the asset’s value, less any estimated residual value, over its estimated useful life. The following estimated useful lives are used in the calculation of depreciation:
Category Useful lifeBuildings and improvements 5 – 100 years
Plant and equipment 2 – 40 years
The cost of tenancy fit-outs provided under lease arrangements are amortised over the shorter of the initial term of the relevant lease and their useful lives.
In the event of the loss or destruction of an asset, the future economic benefits arising from the use of the asset will be replaced (unless a specific decision to the contrary has been made).
Land is considered to have an indefinite life and is not depreciated. Depreciation is not recognised in respect of these assets because their service potential has not, in any material sense, been consumed during the reporting period.
Impairment
Non-financial assets are assessed annually for indications of impairment. If there is an indication of impairment, the assets concerned are tested as to whether their carrying value exceeds their recoverable amount. Where an asset’s carrying value exceeds its recoverable amount, the difference is written off as an ‘other economic flow’, except to the extent that the write down can be debited to an asset revaluation surplus amount applicable to that class of asset.
If there is an indication that there has been a reversal in the estimate of an asset’s recoverable amount since the last impairment loss was recognised, the carrying amount shall be increased to its recoverable amount. However this reversal should not increase the asset’s carrying amount above what would have been determined, net of depreciation or amortisation, if no impairment loss had been recognised in prior years.
The recoverable amount for most assets is measured at the higher of current replacement cost and fair value less costs to sell. Recoverable amount for assets held primarily to generate net cash inflows is measured at the higher of the present value of future cash flows expected to be obtained from the asset and fair value less costs to sell.
FINANCIAL REPORT
51
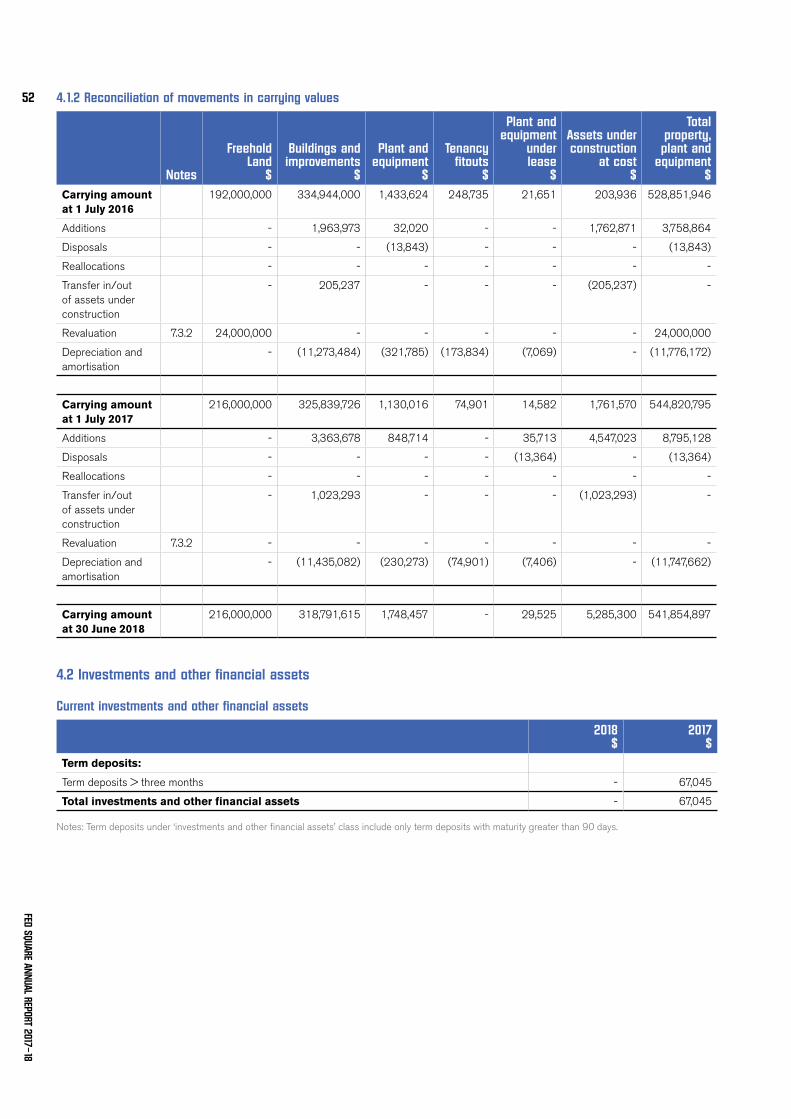
4.1.2 Reconciliation of movements in carrying values
Notes
Freehold Land
$
Buildings and improvements
$
Plant and equipment
$
Tenancy fitouts
$
Plant and equipment
under lease
$
Assets under construction
at cost $
Total property, plant and
equipment $
Carrying amount at 1 July 2016
192,000,000 334,944,000 1,433,624 248,735 21,651 203,936 528,851,946
Additions - 1,963,973 32,020 - - 1,762,871 3,758,864
Disposals - - (13,843) - - - (13,843)
Reallocations - - - - - - -
Transfer in/out of assets under construction
- 205,237 - - - (205,237) -
Revaluation 7.3.2 24,000,000 - - - - - 24,000,000
Depreciation and amortisation
- (11,273,484) (321,785) (173,834) (7,069) - (11,776,172)
Carrying amount at 1 July 2017
216,000,000 325,839,726 1,130,016 74,901 14,582 1,761,570 544,820,795
Additions - 3,363,678 848,714 - 35,713 4,547,023 8,795,128
Disposals - - - - (13,364) - (13,364)
Reallocations - - - - - - -
Transfer in/out of assets under construction
- 1,023,293 - - - (1,023,293) -
Revaluation 7.3.2 - - - - - - -
Depreciation and amortisation
- (11,435,082) (230,273) (74,901) (7,406) - (11,747,662)
Carrying amount at 30 June 2018
216,000,000 318,791,615 1,748,457 - 29,525 5,285,300 541,854,897
4.2 Investments and other financial assets
Current investments and other financial assets
2018 $
2017 $
Term deposits:
Term deposits > three months - 67,045
Total investments and other financial assets - 67,045
Notes: Term deposits under ‘investments and other financial assets’ class include only term deposits with maturity greater than 90 days.
FED SQUARE ANNUAL REPORT 2017–18
52
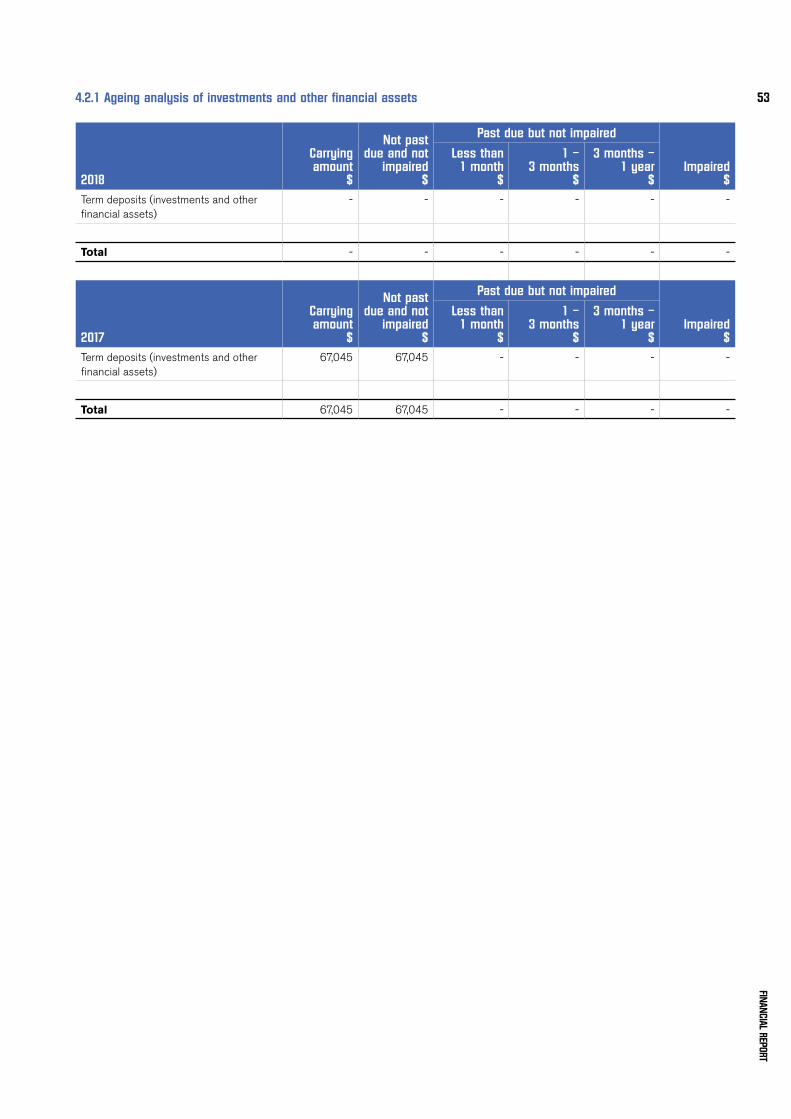
4.2.1 Ageing analysis of investments and other financial assets
2018
Carrying amount
$
Not past due and not
impaired $
Past due but not impaired
Impaired $
Less than 1 month
$
1 – 3 months
$
3 months – 1 year
$Term deposits (investments and other financial assets)
- - - - - -
Total - - - - - -
2017
Carrying amount
$
Not past due and not
impaired $
Past due but not impaired
Impaired $
Less than 1 month
$
1 – 3 months
$
3 months – 1 year
$Term deposits (investments and other financial assets)
67,045 67,045 - - - -
Total 67,045 67,045 - - - -
FINANCIAL REPORT
53
5. OTHER ASSETS AND LIABILITIES
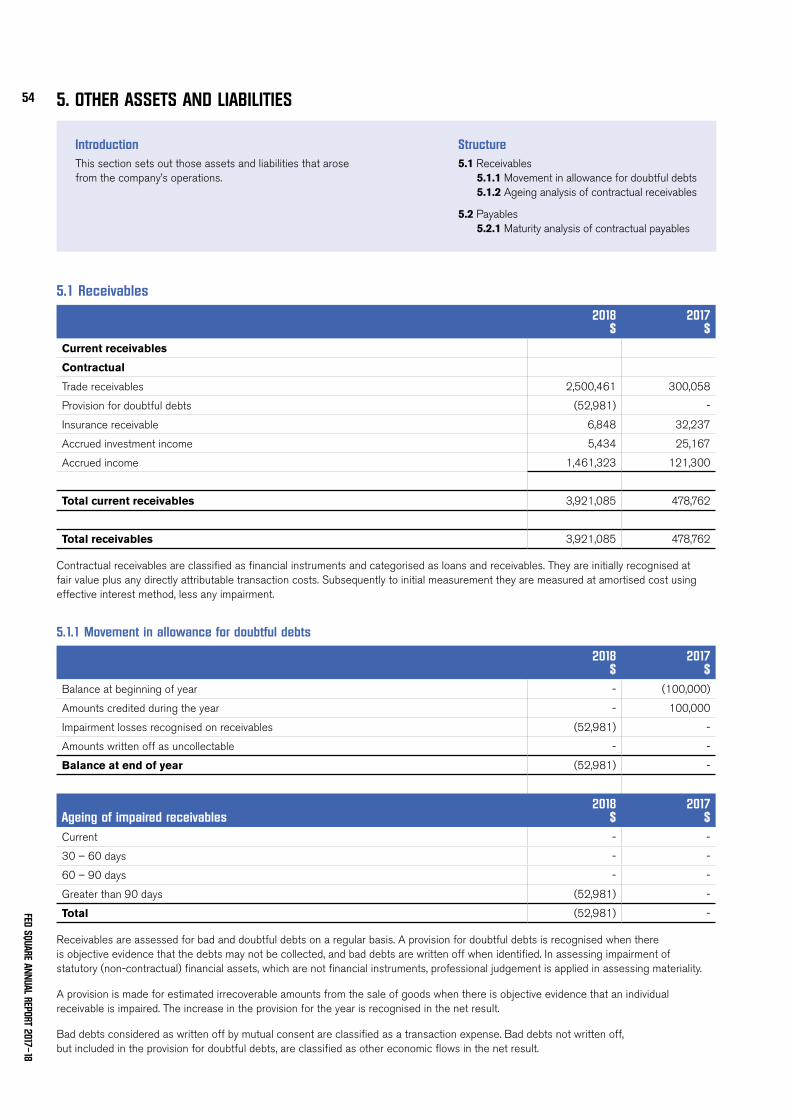
5.1 Receivables
2018 $
2017 $
Current receivables
Contractual
Trade receivables 2,500,461 300,058
Provision for doubtful debts (52,981) -
Insurance receivable 6,848 32,237
Accrued investment income 5,434 25,167
Accrued income 1,461,323 121,300
Total current receivables 3,921,085 478,762
Total receivables 3,921,085 478,762
Contractual receivables are classified as financial instruments and categorised as loans and receivables. They are initially recognised at fair value plus any directly attributable transaction costs. Subsequently to initial measurement they are measured at amortised cost using effective interest method, less any impairment.
5.1.1 Movement in allowance for doubtful debts
2018 $
2017 $
Balance at beginning of year - (100,000)
Amounts credited during the year - 100,000
Impairment losses recognised on receivables (52,981) -
Amounts written off as uncollectable - -
Balance at end of year (52,981) -
Ageing of impaired receivables2018
$2017
$Current - -
30 – 60 days - -
60 – 90 days - -
Greater than 90 days (52,981) -
Total (52,981) -
Receivables are assessed for bad and doubtful debts on a regular basis. A provision for doubtful debts is recognised when there is objective evidence that the debts may not be collected, and bad debts are written off when identified. In assessing impairment of statutory (non-contractual) financial assets, which are not financial instruments, professional judgement is applied in assessing materiality.
A provision is made for estimated irrecoverable amounts from the sale of goods when there is objective evidence that an individual receivable is impaired. The increase in the provision for the year is recognised in the net result.
Bad debts considered as written off by mutual consent are classified as a transaction expense. Bad debts not written off, but included in the provision for doubtful debts, are classified as other economic flows in the net result.
IntroductionThis section sets out those assets and liabilities that arose from the company’s operations.
Structure5.1 Receivables 5.1.1 Movement in allowance for doubtful debts
5.1.2 Ageing analysis of contractual receivables
5.2 Payables 5.2.1 Maturity analysis of contractual payables
FED SQUARE ANNUAL REPORT 2017–18
54
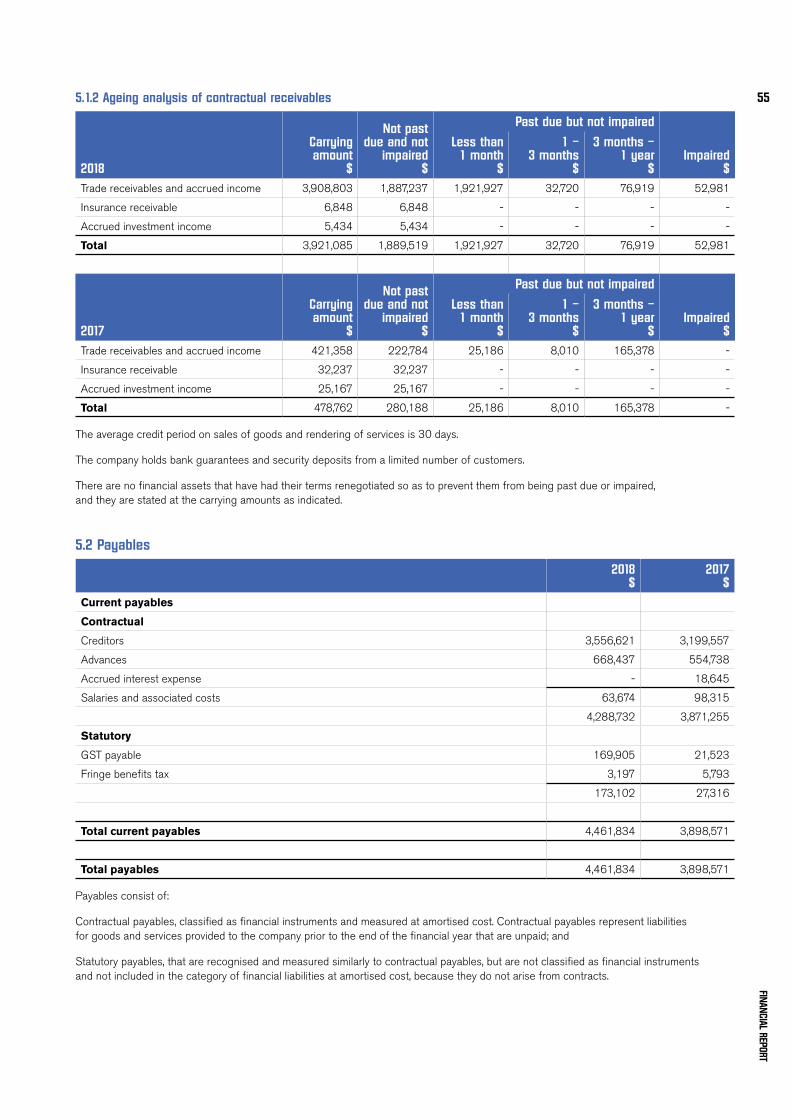
5.1.2 Ageing analysis of contractual receivables
2018
Carrying amount
$
Not past due and not
impaired $
Past due but not impaired
Impaired $
Less than 1 month
$
1 – 3 months
$
3 months – 1 year
$Trade receivables and accrued income 3,908,803 1,887,237 1,921,927 32,720 76,919 52,981
Insurance receivable 6,848 6,848 - - - -
Accrued investment income 5,434 5,434 - - - -
Total 3,921,085 1,889,519 1,921,927 32,720 76,919 52,981
2017
Carrying amount
$
Not past due and not
impaired $
Past due but not impaired
Impaired $
Less than 1 month
$
1 – 3 months
$
3 months – 1 year
$Trade receivables and accrued income 421,358 222,784 25,186 8,010 165,378 -
Insurance receivable 32,237 32,237 - - - -
Accrued investment income 25,167 25,167 - - - -
Total 478,762 280,188 25,186 8,010 165,378 -
The average credit period on sales of goods and rendering of services is 30 days.
The company holds bank guarantees and security deposits from a limited number of customers.
There are no financial assets that have had their terms renegotiated so as to prevent them from being past due or impaired, and they are stated at the carrying amounts as indicated.
5.2 Payables
2018 $
2017 $
Current payables
Contractual
Creditors 3,556,621 3,199,557
Advances 668,437 554,738
Accrued interest expense - 18,645
Salaries and associated costs 63,674 98,315
4,288,732 3,871,255
Statutory
GST payable 169,905 21,523
Fringe benefits tax 3,197 5,793
173,102 27,316
Total current payables 4,461,834 3,898,571
Total payables 4,461,834 3,898,571
Payables consist of:
Contractual payables, classified as financial instruments and measured at amortised cost. Contractual payables represent liabilities for goods and services provided to the company prior to the end of the financial year that are unpaid; and
Statutory payables, that are recognised and measured similarly to contractual payables, but are not classified as financial instruments and not included in the category of financial liabilities at amortised cost, because they do not arise from contracts.
FINANCIAL REPORT
55
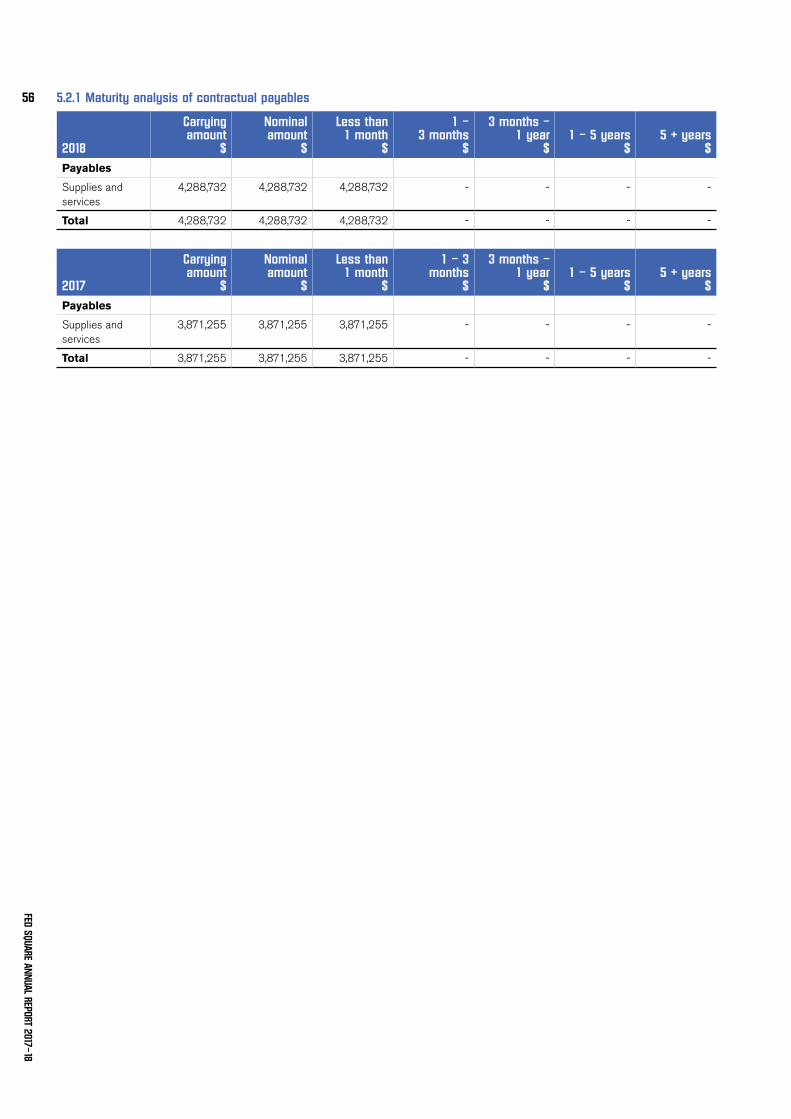
5.2.1 Maturity analysis of contractual payables
2018
Carrying amount
$
Nominal amount
$
Less than 1 month
$
1 – 3 months
$
3 months – 1 year
$1 – 5 years
$5 + years
$Payables
Supplies and services
4,288,732 4,288,732 4,288,732 - - - -
Total 4,288,732 4,288,732 4,288,732 - - - -
2017
Carrying amount
$
Nominal amount
$
Less than 1 month
$
1 – 3 months
$
3 months – 1 year
$1 – 5 years
$5 + years
$Payables
Supplies and services
3,871,255 3,871,255 3,871,255 - - - -
Total 3,871,255 3,871,255 3,871,255 - - - -
FED SQUARE ANNUAL REPORT 2017–18
56
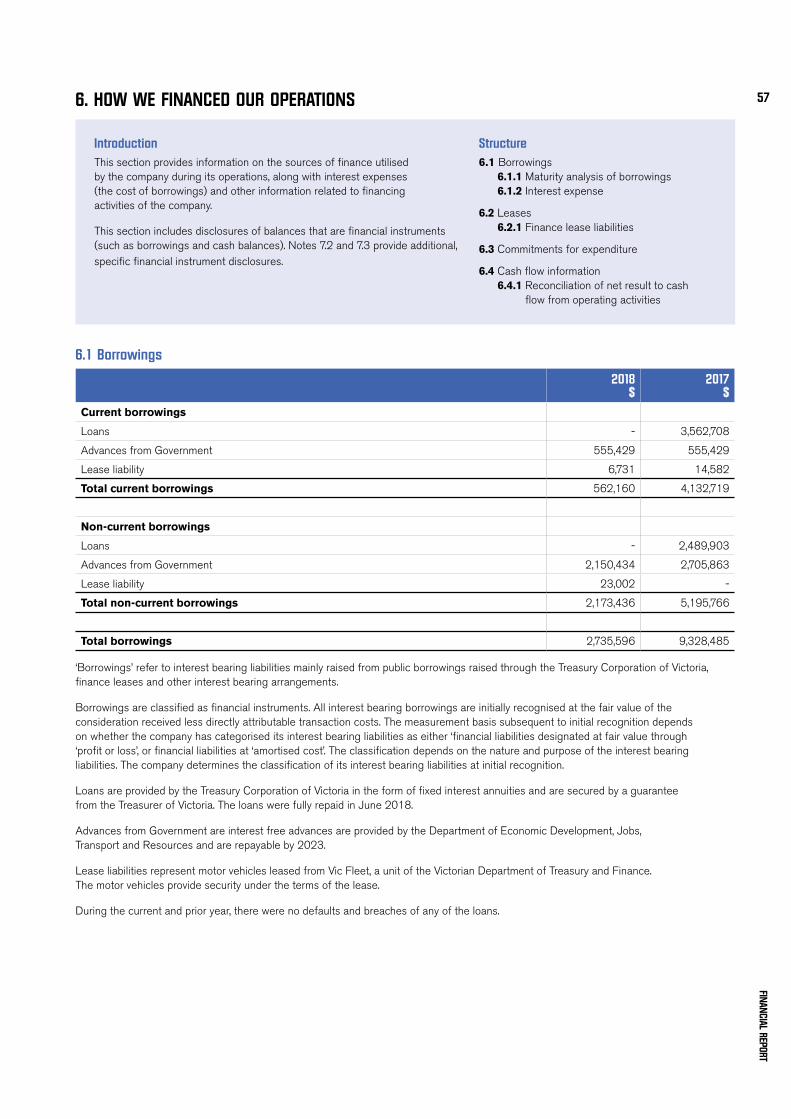
6. HOW WE FINANCED OUR OPERATIONS
6.1 Borrowings
2018 $
2017 $
Current borrowings
Loans - 3,562,708
Advances from Government 555,429 555,429
Lease liability 6,731 14,582
Total current borrowings 562,160 4,132,719
Non-current borrowings
Loans - 2,489,903
Advances from Government 2,150,434 2,705,863
Lease liability 23,002 -
Total non-current borrowings 2,173,436 5,195,766
Total borrowings 2,735,596 9,328,485
‘Borrowings’ refer to interest bearing liabilities mainly raised from public borrowings raised through the Treasury Corporation of Victoria, finance leases and other interest bearing arrangements.
Borrowings are classified as financial instruments. All interest bearing borrowings are initially recognised at the fair value of the consideration received less directly attributable transaction costs. The measurement basis subsequent to initial recognition depends on whether the company has categorised its interest bearing liabilities as either ‘financial liabilities designated at fair value through ‘profit or loss’, or financial liabilities at ‘amortised cost’. The classification depends on the nature and purpose of the interest bearing liabilities. The company determines the classification of its interest bearing liabilities at initial recognition.
Loans are provided by the Treasury Corporation of Victoria in the form of fixed interest annuities and are secured by a guarantee from the Treasurer of Victoria. The loans were fully repaid in June 2018.
Advances from Government are interest free advances are provided by the Department of Economic Development, Jobs, Transport and Resources and are repayable by 2023.
Lease liabilities represent motor vehicles leased from Vic Fleet, a unit of the Victorian Department of Treasury and Finance. The motor vehicles provide security under the terms of the lease.
During the current and prior year, there were no defaults and breaches of any of the loans.
IntroductionThis section provides information on the sources of finance utilised by the company during its operations, along with interest expenses (the cost of borrowings) and other information related to financing activities of the company.
This section includes disclosures of balances that are financial instruments (such as borrowings and cash balances). Notes 7.2 and 7.3 provide additional, specific financial instrument disclosures.
Structure6.1 Borrowings 6.1.1 Maturity analysis of borrowings 6.1.2 Interest expense
6.2 Leases 6.2.1 Finance lease liabilities
6.3 Commitments for expenditure
6.4 Cash flow information 6.4.1 Reconciliation of net result to cash
flow from operating activities
FINANCIAL REPORT
57
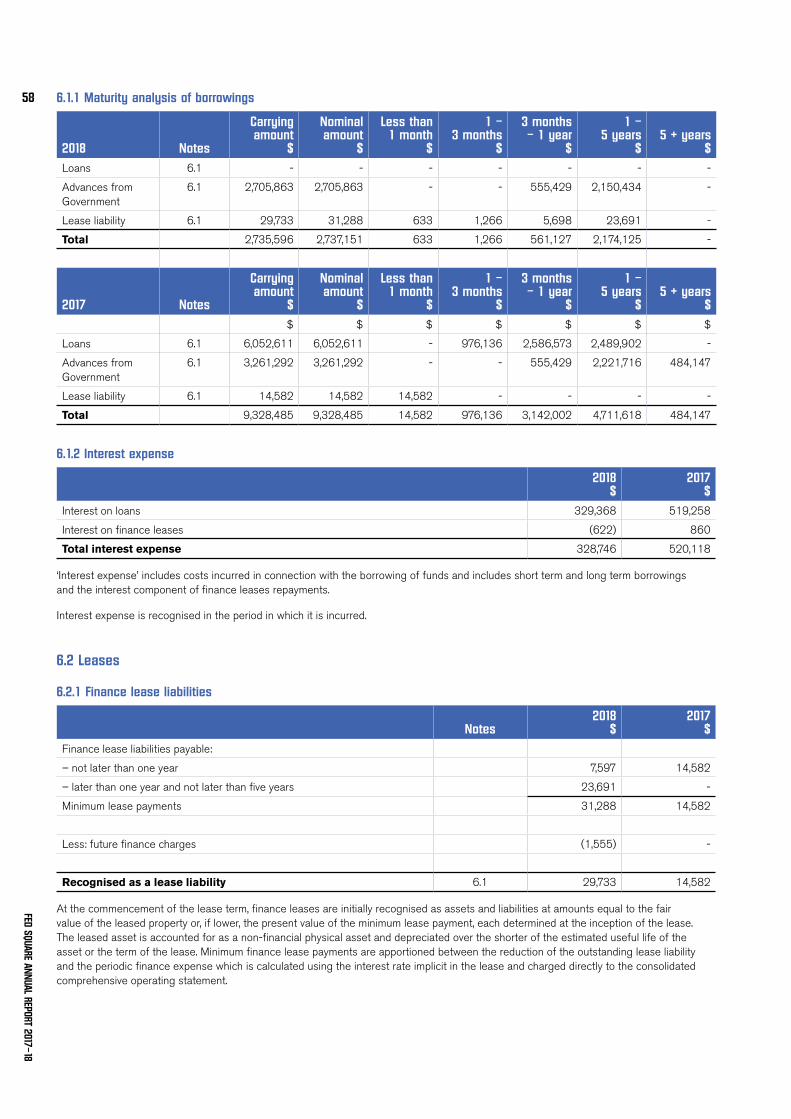
6.1.1 Maturity analysis of borrowings
2018 Notes
Carrying amount
$
Nominal amount
$
Less than 1 month
$
1 – 3 months
$
3 months – 1 year
$
1 – 5 years
$5 + years
$Loans 6.1 - - - - - - -
Advances from Government
6.1 2,705,863 2,705,863 - - 555,429 2,150,434 -
Lease liability 6.1 29,733 31,288 633 1,266 5,698 23,691 -
Total 2,735,596 2,737,151 633 1,266 561,127 2,174,125 -
2017 Notes
Carrying amount
$
Nominal amount
$
Less than 1 month
$
1 – 3 months
$
3 months – 1 year
$
1 – 5 years
$5 + years
$$ $ $ $ $ $ $
Loans 6.1 6,052,611 6,052,611 - 976,136 2,586,573 2,489,902 -
Advances from Government
6.1 3,261,292 3,261,292 - - 555,429 2,221,716 484,147
Lease liability 6.1 14,582 14,582 14,582 - - - -
Total 9,328,485 9,328,485 14,582 976,136 3,142,002 4,711,618 484,147
6.1.2 Interest expense
2018 $
2017 $
Interest on loans 329,368 519,258
Interest on finance leases (622) 860
Total interest expense 328,746 520,118
‘Interest expense’ includes costs incurred in connection with the borrowing of funds and includes short term and long term borrowings and the interest component of finance leases repayments.
Interest expense is recognised in the period in which it is incurred.
6.2 Leases
6.2.1 Finance lease liabilities
Notes2018
$2017
$Finance lease liabilities payable:
– not later than one year 7,597 14,582
– later than one year and not later than five years 23,691 -
Minimum lease payments 31,288 14,582
Less: future finance charges (1,555) -
Recognised as a lease liability 6.1 29,733 14,582
At the commencement of the lease term, finance leases are initially recognised as assets and liabilities at amounts equal to the fair value of the leased property or, if lower, the present value of the minimum lease payment, each determined at the inception of the lease. The leased asset is accounted for as a non-financial physical asset and depreciated over the shorter of the estimated useful life of the asset or the term of the lease. Minimum finance lease payments are apportioned between the reduction of the outstanding lease liability and the periodic finance expense which is calculated using the interest rate implicit in the lease and charged directly to the consolidated comprehensive operating statement.
FED SQUARE ANNUAL REPORT 2017–18
58
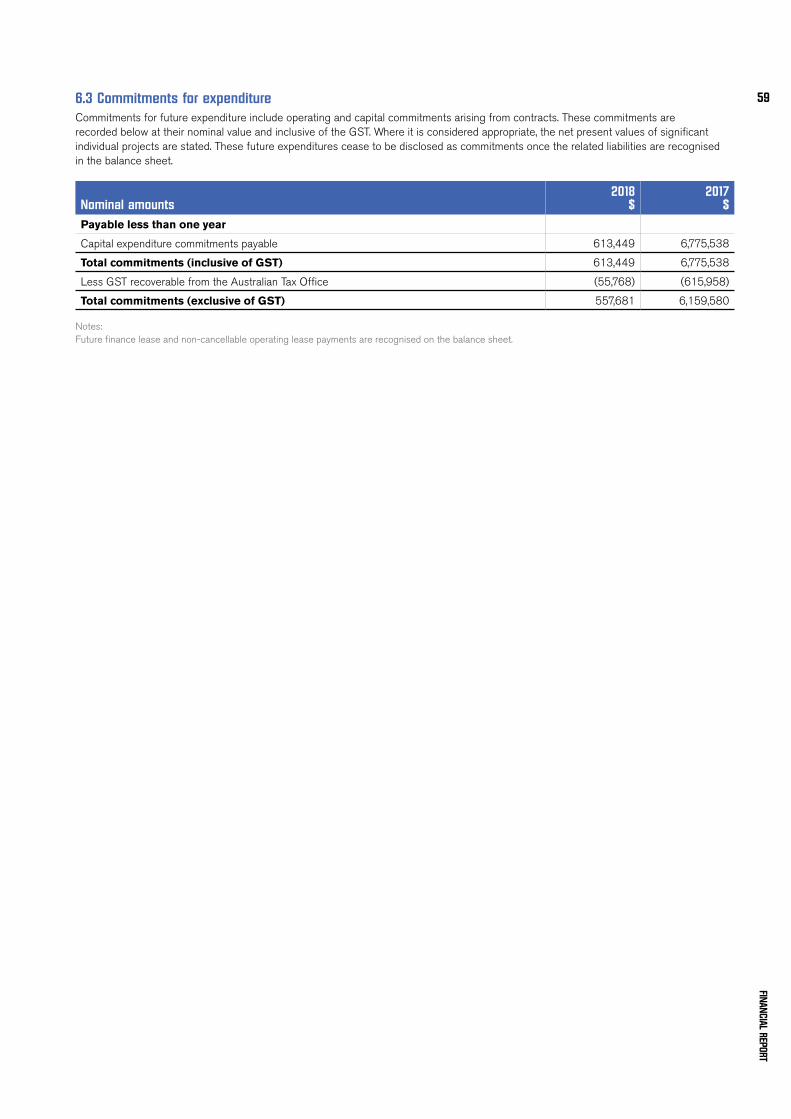
6.3 Commitments for expenditureCommitments for future expenditure include operating and capital commitments arising from contracts. These commitments are recorded below at their nominal value and inclusive of the GST. Where it is considered appropriate, the net present values of significant individual projects are stated. These future expenditures cease to be disclosed as commitments once the related liabilities are recognised in the balance sheet.
Nominal amounts2018
$2017
$Payable less than one year
Capital expenditure commitments payable 613,449 6,775,538
Total commitments (inclusive of GST) 613,449 6,775,538
Less GST recoverable from the Australian Tax Office (55,768) (615,958)
Total commitments (exclusive of GST) 557,681 6,159,580
Notes: Future finance lease and non-cancellable operating lease payments are recognised on the balance sheet.
FINANCIAL REPORT
59
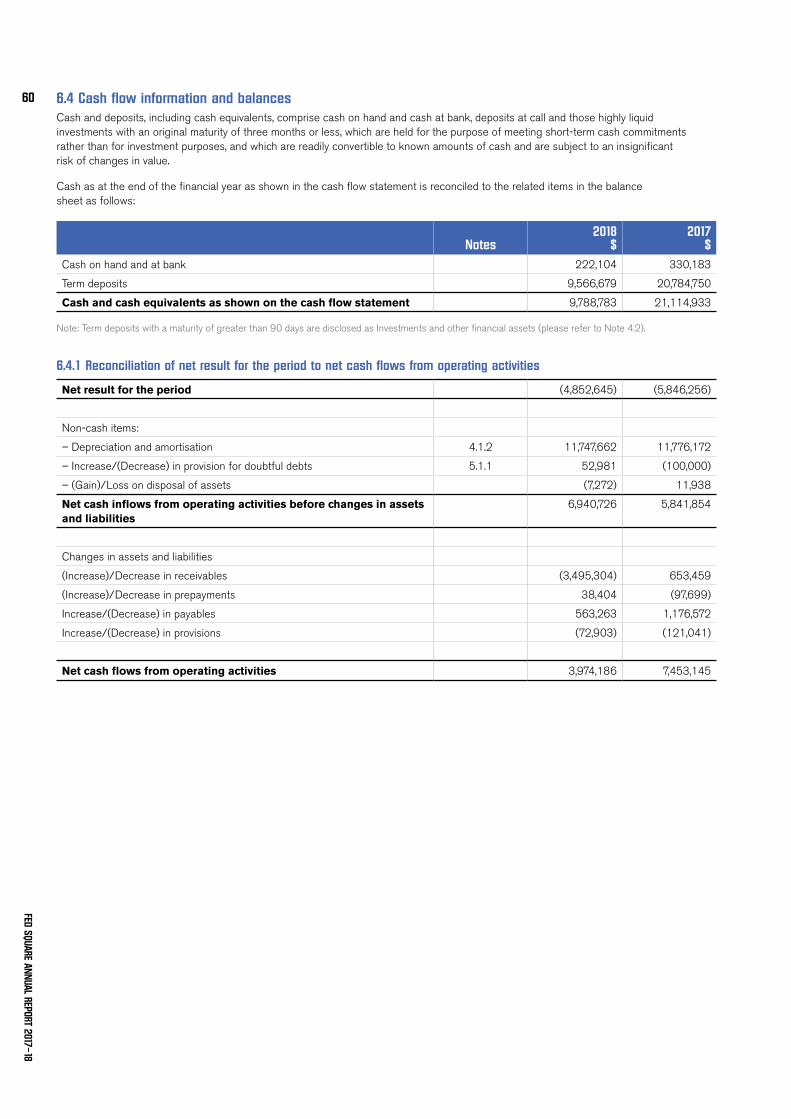
6.4 Cash flow information and balancesCash and deposits, including cash equivalents, comprise cash on hand and cash at bank, deposits at call and those highly liquid investments with an original maturity of three months or less, which are held for the purpose of meeting short-term cash commitments rather than for investment purposes, and which are readily convertible to known amounts of cash and are subject to an insignificant risk of changes in value.
Cash as at the end of the financial year as shown in the cash flow statement is reconciled to the related items in the balance sheet as follows:
Notes2018
$2017
$Cash on hand and at bank 222,104 330,183
Term deposits 9,566,679 20,784,750
Cash and cash equivalents as shown on the cash flow statement 9,788,783 21,114,933
Note: Term deposits with a maturity of greater than 90 days are disclosed as Investments and other financial assets (please refer to Note 4.2).
6.4.1 Reconciliation of net result for the period to net cash flows from operating activities
Net result for the period (4,852,645) (5,846,256)
Non-cash items:
– Depreciation and amortisation 4.1.2 11,747,662 11,776,172
– Increase/(Decrease) in provision for doubtful debts 5.1.1 52,981 (100,000)
– (Gain)/Loss on disposal of assets (7,272) 11,938
Net cash inflows from operating activities before changes in assets and liabilities
6,940,726 5,841,854
Changes in assets and liabilities
(Increase)/Decrease in receivables (3,495,304) 653,459
(Increase)/Decrease in prepayments 38,404 (97,699)
Increase/(Decrease) in payables 563,263 1,176,572
Increase/(Decrease) in provisions (72,903) (121,041)
Net cash flows from operating activities 3,974,186 7,453,145
FED SQUARE ANNUAL REPORT 2017–18
60
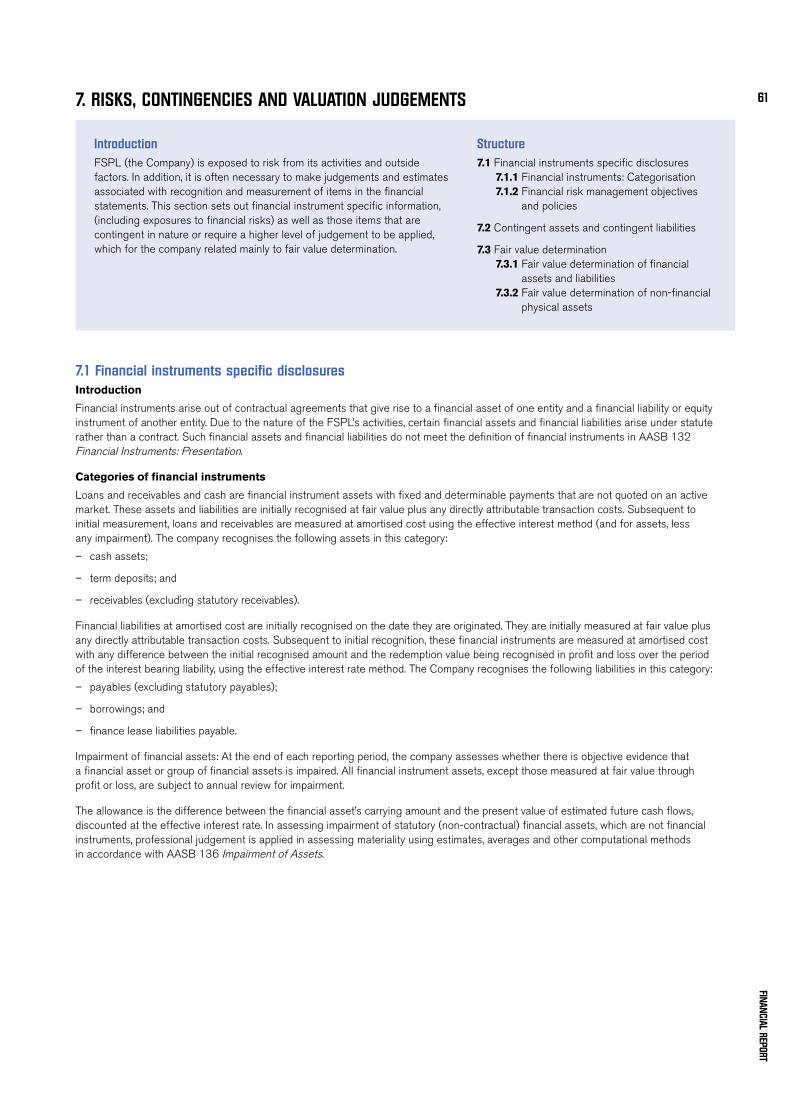
7. RISKS, CONTINGENCIES AND VALUATION JUDGEMENTS
7.1 Financial instruments specific disclosuresIntroduction
Financial instruments arise out of contractual agreements that give rise to a financial asset of one entity and a financial liability or equity instrument of another entity. Due to the nature of the FSPL’s activities, certain financial assets and financial liabilities arise under statute rather than a contract. Such financial assets and financial liabilities do not meet the definition of financial instruments in AASB 132 Financial Instruments: Presentation.
Categories of financial instruments
Loans and receivables and cash are financial instrument assets with fixed and determinable payments that are not quoted on an active market. These assets and liabilities are initially recognised at fair value plus any directly attributable transaction costs. Subsequent to initial measurement, loans and receivables are measured at amortised cost using the effective interest method (and for assets, less any impairment). The company recognises the following assets in this category:
– cash assets;
– term deposits; and
– receivables (excluding statutory receivables).
Financial liabilities at amortised cost are initially recognised on the date they are originated. They are initially measured at fair value plus any directly attributable transaction costs. Subsequent to initial recognition, these financial instruments are measured at amortised cost with any difference between the initial recognised amount and the redemption value being recognised in profit and loss over the period of the interest bearing liability, using the effective interest rate method. The Company recognises the following liabilities in this category:
– payables (excluding statutory payables);
– borrowings; and
– finance lease liabilities payable.
Impairment of financial assets: At the end of each reporting period, the company assesses whether there is objective evidence that a financial asset or group of financial assets is impaired. All financial instrument assets, except those measured at fair value through profit or loss, are subject to annual review for impairment.
The allowance is the difference between the financial asset’s carrying amount and the present value of estimated future cash flows, discounted at the effective interest rate. In assessing impairment of statutory (non-contractual) financial assets, which are not financial instruments, professional judgement is applied in assessing materiality using estimates, averages and other computational methods in accordance with AASB 136 Impairment of Assets.
IntroductionFSPL (the Company) is exposed to risk from its activities and outside factors. In addition, it is often necessary to make judgements and estimates associated with recognition and measurement of items in the financial statements. This section sets out financial instrument specific information, (including exposures to financial risks) as well as those items that are contingent in nature or require a higher level of judgement to be applied, which for the company related mainly to fair value determination.
Structure7.1 Financial instruments specific disclosures 7.1.1 Financial instruments: Categorisation 7.1.2 Financial risk management objectives
and policies
7.2 Contingent assets and contingent liabilities
7.3 Fair value determination 7.3.1 Fair value determination of financial
assets and liabilities 7.3.2 Fair value determination of non-financial
physical assets
FINANCIAL REPORT
61
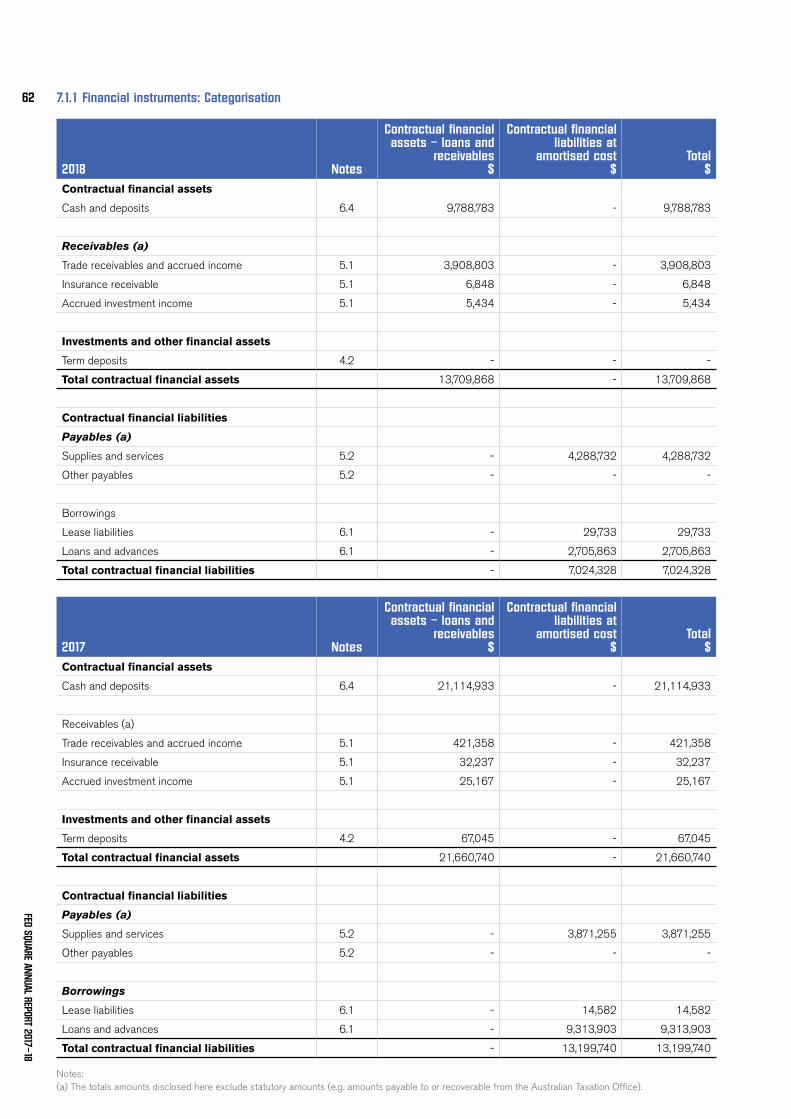
7.1.1 Financial instruments: Categorisation
2018 Notes
Contractual financial assets – loans and
receivables $
Contractual financial liabilities at
amortised cost $
Total $
Contractual financial assets
Cash and deposits 6.4 9,788,783 - 9,788,783
Receivables (a)
Trade receivables and accrued income 5.1 3,908,803 - 3,908,803
Insurance receivable 5.1 6,848 - 6,848
Accrued investment income 5.1 5,434 - 5,434
Investments and other financial assets
Term deposits 4.2 - - -
Total contractual financial assets 13,709,868 - 13,709,868
Contractual financial liabilities
Payables (a)
Supplies and services 5.2 - 4,288,732 4,288,732
Other payables 5.2 - - -
Borrowings
Lease liabilities 6.1 - 29,733 29,733
Loans and advances 6.1 - 2,705,863 2,705,863
Total contractual financial liabilities - 7,024,328 7,024,328
2017 Notes
Contractual financial assets – loans and
receivables $
Contractual financial liabilities at
amortised cost $
Total $
Contractual financial assets
Cash and deposits 6.4 21,114,933 - 21,114,933
Receivables (a)
Trade receivables and accrued income 5.1 421,358 - 421,358
Insurance receivable 5.1 32,237 - 32,237
Accrued investment income 5.1 25,167 - 25,167
Investments and other financial assets
Term deposits 4.2 67,045 - 67,045
Total contractual financial assets 21,660,740 - 21,660,740
Contractual financial liabilities
Payables (a)
Supplies and services 5.2 - 3,871,255 3,871,255
Other payables 5.2 - - -
Borrowings
Lease liabilities 6.1 - 14,582 14,582
Loans and advances 6.1 - 9,313,903 9,313,903
Total contractual financial liabilities - 13,199,740 13,199,740
Notes: (a) The totals amounts disclosed here exclude statutory amounts (e.g. amounts payable to or recoverable from the Australian Taxation Office).
FED SQUARE ANNUAL REPORT 2017–18
62
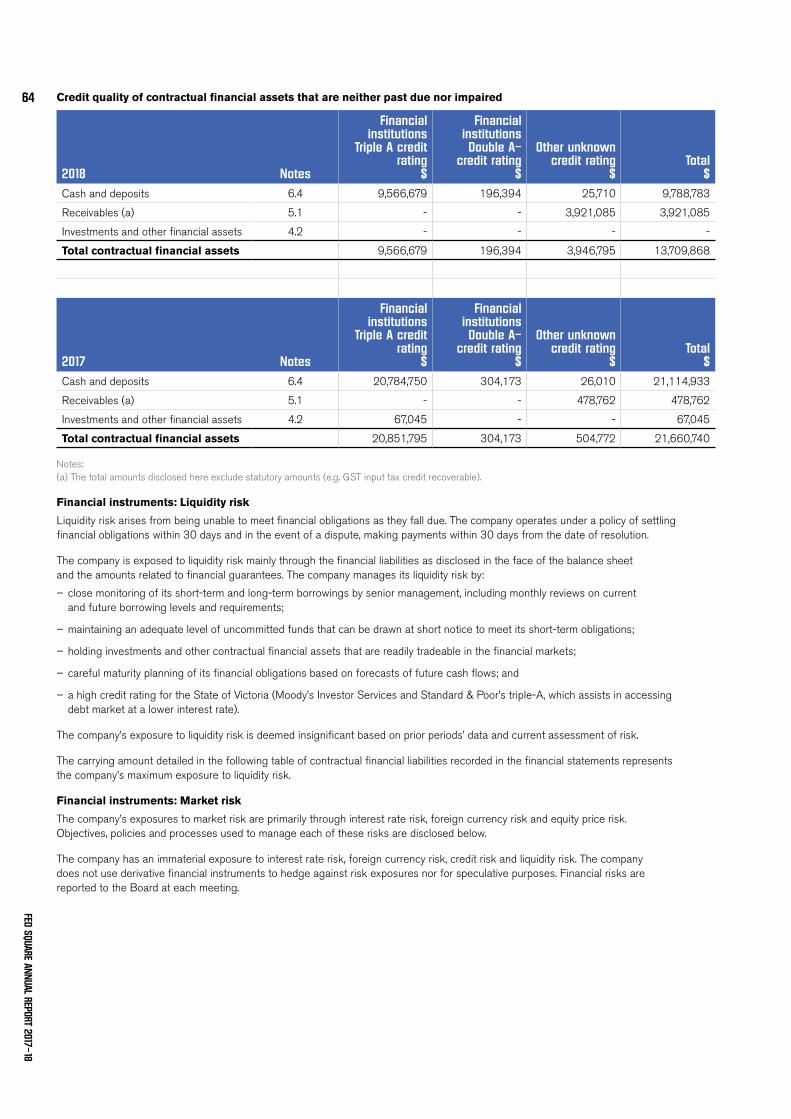
Credit quality of contractual financial assets that are neither past due nor impaired
2018 Notes
Financial institutions
Triple A credit rating
$
Financial institutions Double A–
credit rating $
Other unknown credit rating
$Total
$Cash and deposits 6.4 9,566,679 196,394 25,710 9,788,783
Receivables (a) 5.1 - - 3,921,085 3,921,085
Investments and other financial assets 4.2 - - - -
Total contractual financial assets 9,566,679 196,394 3,946,795 13,709,868
2017 Notes
Financial institutions
Triple A credit rating
$
Financial institutions Double A–
credit rating $
Other unknown credit rating
$Total
$Cash and deposits 6.4 20,784,750 304,173 26,010 21,114,933
Receivables (a) 5.1 - - 478,762 478,762
Investments and other financial assets 4.2 67,045 - - 67,045
Total contractual financial assets 20,851,795 304,173 504,772 21,660,740
Notes: (a) The total amounts disclosed here exclude statutory amounts (e.g. GST input tax credit recoverable).
Financial instruments: Liquidity risk
Liquidity risk arises from being unable to meet financial obligations as they fall due. The company operates under a policy of settling financial obligations within 30 days and in the event of a dispute, making payments within 30 days from the date of resolution.
The company is exposed to liquidity risk mainly through the financial liabilities as disclosed in the face of the balance sheet and the amounts related to financial guarantees. The company manages its liquidity risk by:
– close monitoring of its short-term and long-term borrowings by senior management, including monthly reviews on current and future borrowing levels and requirements;
– maintaining an adequate level of uncommitted funds that can be drawn at short notice to meet its short-term obligations;
– holding investments and other contractual financial assets that are readily tradeable in the financial markets;
– careful maturity planning of its financial obligations based on forecasts of future cash flows; and
– a high credit rating for the State of Victoria (Moody’s Investor Services and Standard & Poor’s triple-A, which assists in accessing debt market at a lower interest rate).
The company’s exposure to liquidity risk is deemed insignificant based on prior periods’ data and current assessment of risk.
The carrying amount detailed in the following table of contractual financial liabilities recorded in the financial statements represents the company’s maximum exposure to liquidity risk.
Financial instruments: Market risk
The company’s exposures to market risk are primarily through interest rate risk, foreign currency risk and equity price risk. Objectives, policies and processes used to manage each of these risks are disclosed below.
The company has an immaterial exposure to interest rate risk, foreign currency risk, credit risk and liquidity risk. The company does not use derivative financial instruments to hedge against risk exposures nor for speculative purposes. Financial risks are reported to the Board at each meeting.
FED SQUARE ANNUAL REPORT 2017–18
64
Sensitivity disclosure analysis and assumptions
The company’s sensitivity to market risk is determined based on the observed range of actual historical data for the preceding five year period, with all variables other than the primary risk variable held constant. The company’s fund managers cannot be expected to predict movements in market rates and prices. Sensitivity analyses shown are for illustrative purposes only. The following movements are ‘reasonably possible’ over the next 12 months:
– a movement of 50 basis points up and down (50 basis points up and down) in market interest rates (AUD);
– proportional exchange rate movement of 15 per cent down and 15 per cent up against the USD; and
– a movement of 15 per cent up and down for the top ASX 200 index.
Where relevant, tables that follow show the impact on the company’s net result and equity for each category of financial instrument held by the company at the end of the reporting period, if the above movements were to occur.
Interest rate risk
Fair value interest rate risk is the risk that the fair value of a financial instrument will fluctuate because of changes in market interest rates. The company does not hold any interest bearing financial instruments that are measured at fair value, and therefore has no exposure to fair value interest rate risk.
There is no interest rate risk associated with loans as all borrowings are made at either fixed rates of interest from Treasury Corporation Victoria or interest free from the Department of Economic Development, Jobs, Transport and Resources.
Cash flow interest rate risk is the risk that the future cash flows of a financial instrument will fluctuate because of changes in market interest rates. The company has minimal exposure to cash flow interest rate risks through cash and deposits, and term deposits that are at floating rate.
The company manages this risk by mainly undertaking fixed rate or non-interest bearing financial instruments with relatively even maturity profiles, with only insignificant amounts of financial instruments at floating rate. Management has concluded for cash at bank, as financial assets that can be left at floating rate without necessarily exposing the company to significant bad risk, management monitors movement in interest rates on a regular basis.
The carrying amounts of financial assets and financial liabilities that are exposed to interest rates and the company’s sensitivity to interest rate risk are set out in the table that follows.
FINANCIAL REPORT
65
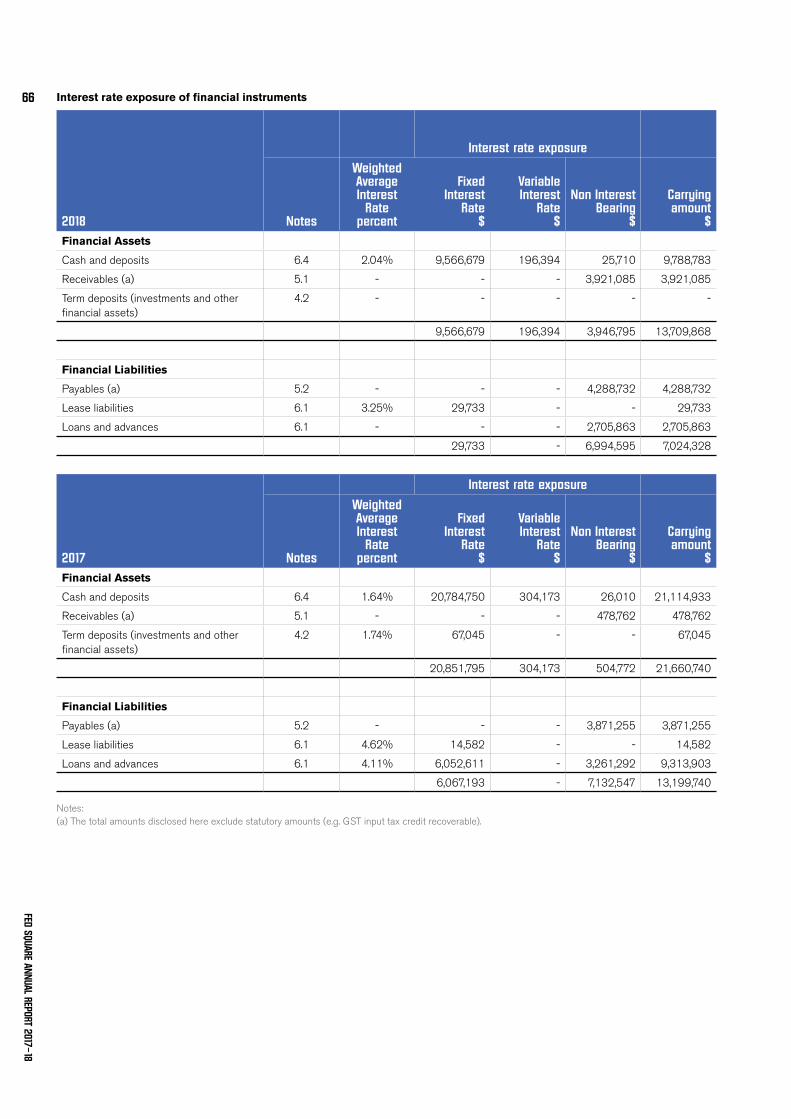
Interest rate exposure of financial instruments
Interest rate exposure
2018 Notes
Weighted Average Interest
Rate percent
Fixed Interest
Rate $
Variable Interest
Rate $
Non Interest Bearing
$
Carrying amount
$Financial Assets
Cash and deposits 6.4 2.04% 9,566,679 196,394 25,710 9,788,783
Receivables (a) 5.1 - - - 3,921,085 3,921,085
Term deposits (investments and other financial assets)
4.2 - - - - -
9,566,679 196,394 3,946,795 13,709,868
Financial Liabilities
Payables (a) 5.2 - - - 4,288,732 4,288,732
Lease liabilities 6.1 3.25% 29,733 - - 29,733
Loans and advances 6.1 - - - 2,705,863 2,705,863
29,733 - 6,994,595 7,024,328
Interest rate exposure
2017 Notes
Weighted Average Interest
Rate percent
Fixed Interest
Rate $
Variable Interest
Rate $
Non Interest Bearing
$
Carrying amount
$Financial Assets
Cash and deposits 6.4 1.64% 20,784,750 304,173 26,010 21,114,933
Receivables (a) 5.1 - - - 478,762 478,762
Term deposits (investments and other financial assets)
4.2 1.74% 67,045 - - 67,045
20,851,795 304,173 504,772 21,660,740
Financial Liabilities
Payables (a) 5.2 - - - 3,871,255 3,871,255
Lease liabilities 6.1 4.62% 14,582 - - 14,582
Loans and advances 6.1 4.11% 6,052,611 - 3,261,292 9,313,903
6,067,193 - 7,132,547 13,199,740
Notes: (a) The total amounts disclosed here exclude statutory amounts (e.g. GST input tax credit recoverable).
FED SQUARE ANNUAL REPORT 2017–18
66
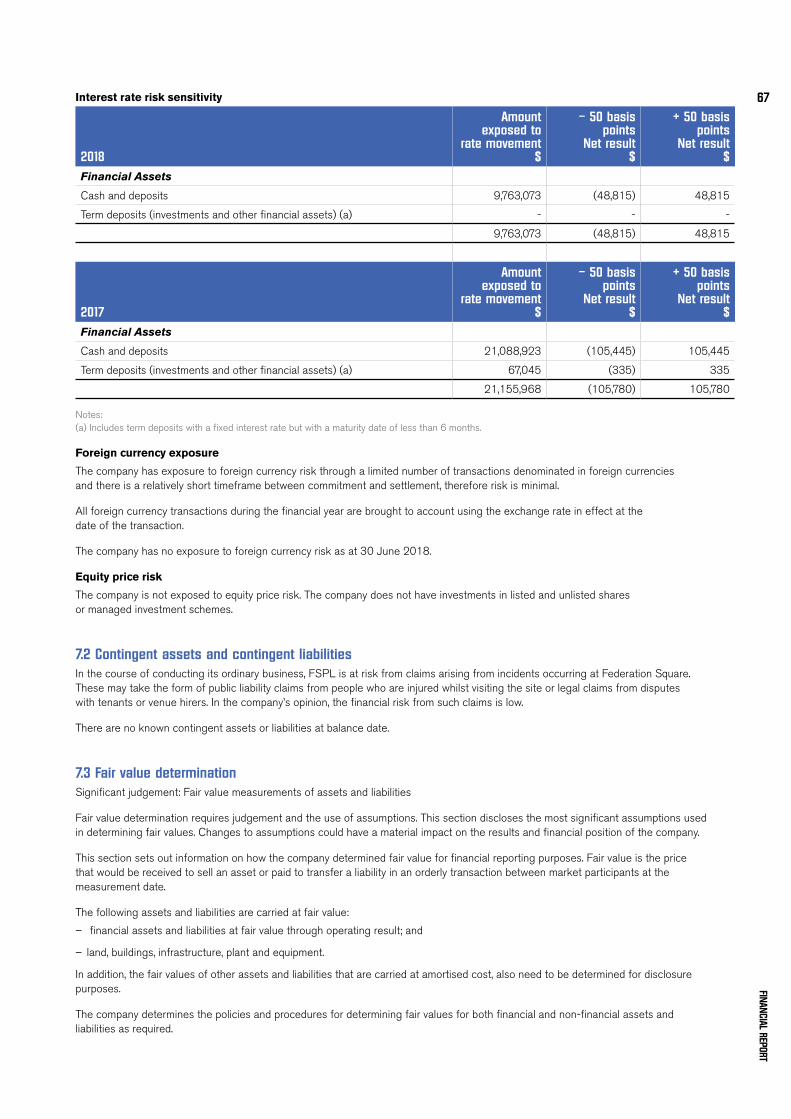
Interest rate risk sensitivity
2018
Amount exposed to
rate movement $
– 50 basis points
Net result $
+ 50 basis points
Net result $
Financial Assets
Cash and deposits 9,763,073 (48,815) 48,815
Term deposits (investments and other financial assets) (a) - - -
9,763,073 (48,815) 48,815
2017
Amount exposed to
rate movement $
– 50 basis points
Net result $
+ 50 basis points
Net result $
Financial Assets
Cash and deposits 21,088,923 (105,445) 105,445
Term deposits (investments and other financial assets) (a) 67,045 (335) 335
21,155,968 (105,780) 105,780
Notes: (a) Includes term deposits with a fixed interest rate but with a maturity date of less than 6 months.
Foreign currency exposure
The company has exposure to foreign currency risk through a limited number of transactions denominated in foreign currencies and there is a relatively short timeframe between commitment and settlement, therefore risk is minimal.
All foreign currency transactions during the financial year are brought to account using the exchange rate in effect at the date of the transaction.
The company has no exposure to foreign currency risk as at 30 June 2018.
Equity price risk
The company is not exposed to equity price risk. The company does not have investments in listed and unlisted shares or managed investment schemes.
7.2 Contingent assets and contingent liabilitiesIn the course of conducting its ordinary business, FSPL is at risk from claims arising from incidents occurring at Federation Square. These may take the form of public liability claims from people who are injured whilst visiting the site or legal claims from disputes with tenants or venue hirers. In the company’s opinion, the financial risk from such claims is low.
There are no known contingent assets or liabilities at balance date.
7.3 Fair value determinationSignificant judgement: Fair value measurements of assets and liabilities
Fair value determination requires judgement and the use of assumptions. This section discloses the most significant assumptions used in determining fair values. Changes to assumptions could have a material impact on the results and financial position of the company.
This section sets out information on how the company determined fair value for financial reporting purposes. Fair value is the price that would be received to sell an asset or paid to transfer a liability in an orderly transaction between market participants at the measurement date.
The following assets and liabilities are carried at fair value:
– financial assets and liabilities at fair value through operating result; and
– land, buildings, infrastructure, plant and equipment.
In addition, the fair values of other assets and liabilities that are carried at amortised cost, also need to be determined for disclosure purposes.
The company determines the policies and procedures for determining fair values for both financial and non-financial assets and liabilities as required.
FINANCIAL REPORT
67
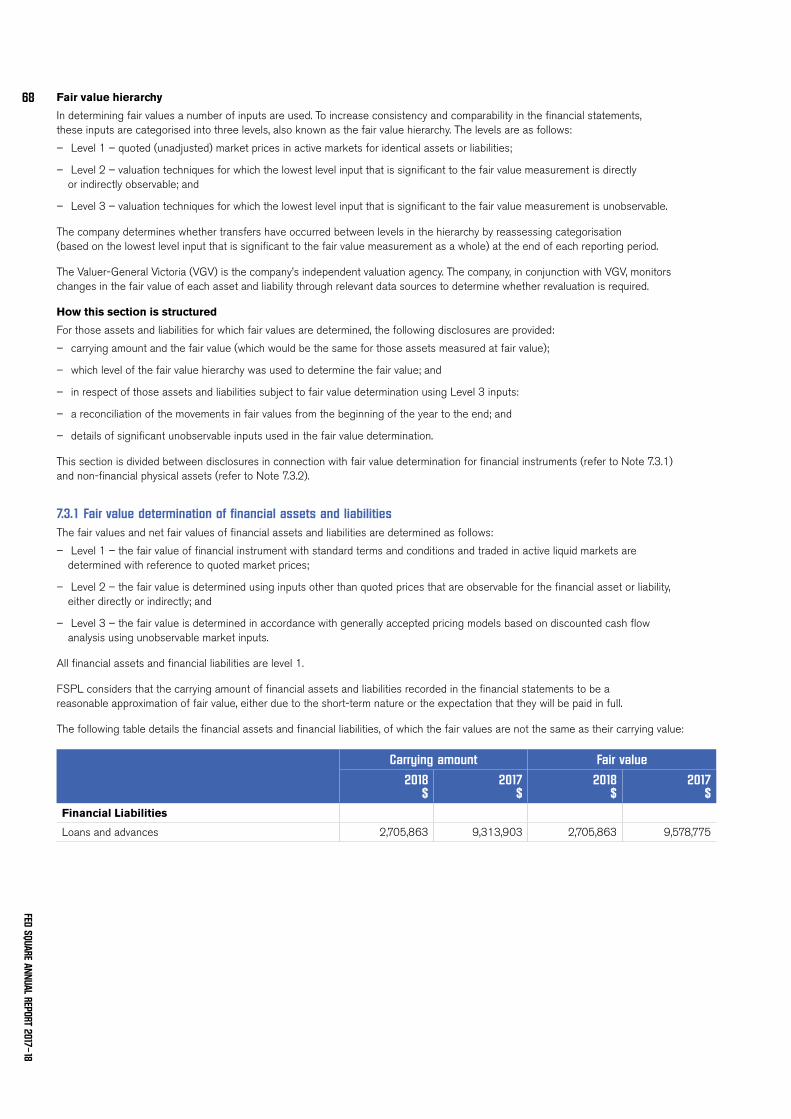
Fair value hierarchy
In determining fair values a number of inputs are used. To increase consistency and comparability in the financial statements, these inputs are categorised into three levels, also known as the fair value hierarchy. The levels are as follows:
– Level 1 – quoted (unadjusted) market prices in active markets for identical assets or liabilities;
– Level 2 – valuation techniques for which the lowest level input that is significant to the fair value measurement is directly or indirectly observable; and
– Level 3 – valuation techniques for which the lowest level input that is significant to the fair value measurement is unobservable.
The company determines whether transfers have occurred between levels in the hierarchy by reassessing categorisation (based on the lowest level input that is significant to the fair value measurement as a whole) at the end of each reporting period.
The Valuer-General Victoria (VGV) is the company’s independent valuation agency. The company, in conjunction with VGV, monitors changes in the fair value of each asset and liability through relevant data sources to determine whether revaluation is required.
How this section is structured
For those assets and liabilities for which fair values are determined, the following disclosures are provided:
– carrying amount and the fair value (which would be the same for those assets measured at fair value);
– which level of the fair value hierarchy was used to determine the fair value; and
– in respect of those assets and liabilities subject to fair value determination using Level 3 inputs:
– a reconciliation of the movements in fair values from the beginning of the year to the end; and
– details of significant unobservable inputs used in the fair value determination.
This section is divided between disclosures in connection with fair value determination for financial instruments (refer to Note 7.3.1) and non-financial physical assets (refer to Note 7.3.2).
7.3.1 Fair value determination of financial assets and liabilitiesThe fair values and net fair values of financial assets and liabilities are determined as follows:
– Level 1 – the fair value of financial instrument with standard terms and conditions and traded in active liquid markets are determined with reference to quoted market prices;
– Level 2 – the fair value is determined using inputs other than quoted prices that are observable for the financial asset or liability, either directly or indirectly; and
– Level 3 – the fair value is determined in accordance with generally accepted pricing models based on discounted cash flow analysis using unobservable market inputs.
All financial assets and financial liabilities are level 1.
FSPL considers that the carrying amount of financial assets and liabilities recorded in the financial statements to be a reasonable approximation of fair value, either due to the short-term nature or the expectation that they will be paid in full.
The following table details the financial assets and financial liabilities, of which the fair values are not the same as their carrying value:
Carrying amount Fair value
2018 $
2017 $
2018 $
2017 $
Financial Liabilities
Loans and advances 2,705,863 9,313,903 2,705,863 9,578,775
FED SQUARE ANNUAL REPORT 2017–18
68
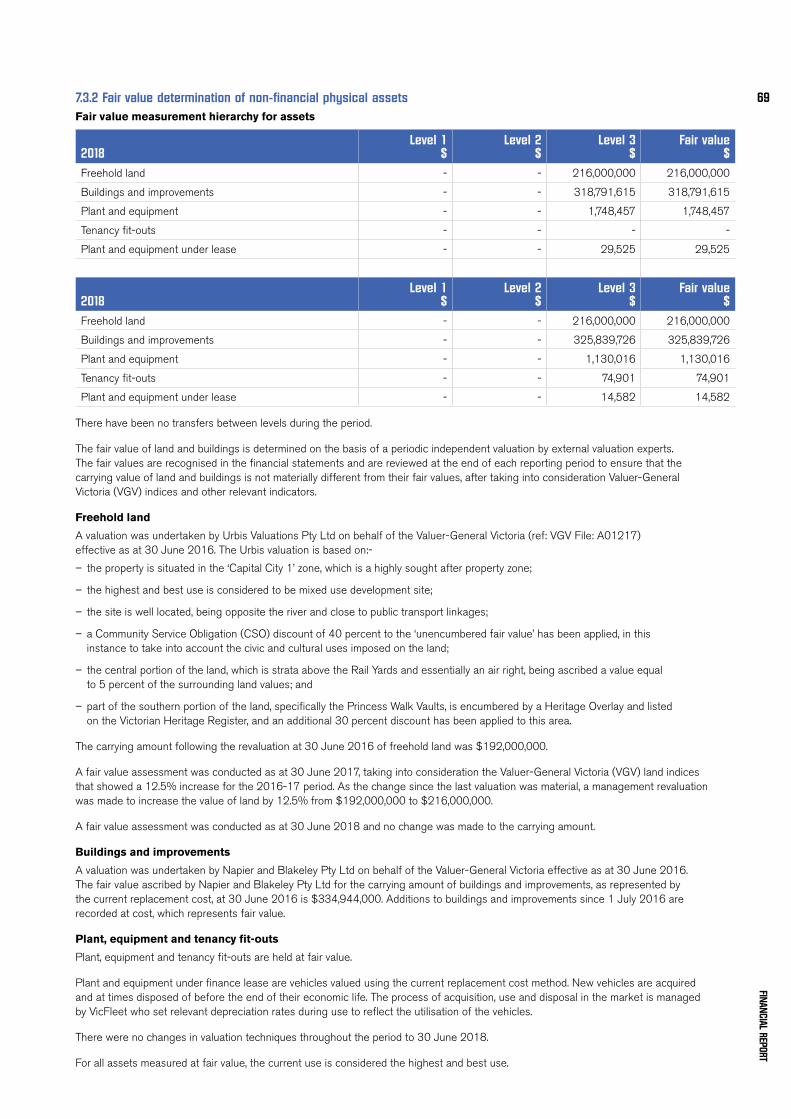
7.3.2 Fair value determination of non-financial physical assetsFair value measurement hierarchy for assets
2018Level 1
$Level 2
$Level 3
$Fair value
$Freehold land - - 216,000,000 216,000,000
Buildings and improvements - - 318,791,615 318,791,615
Plant and equipment - - 1,748,457 1,748,457
Tenancy fit-outs - - - -
Plant and equipment under lease - - 29,525 29,525
2018Level 1
$Level 2
$Level 3
$Fair value
$Freehold land - - 216,000,000 216,000,000
Buildings and improvements - - 325,839,726 325,839,726
Plant and equipment - - 1,130,016 1,130,016
Tenancy fit-outs - - 74,901 74,901
Plant and equipment under lease - - 14,582 14,582
There have been no transfers between levels during the period.
The fair value of land and buildings is determined on the basis of a periodic independent valuation by external valuation experts. The fair values are recognised in the financial statements and are reviewed at the end of each reporting period to ensure that the carrying value of land and buildings is not materially different from their fair values, after taking into consideration Valuer-General Victoria (VGV) indices and other relevant indicators.
Freehold land
A valuation was undertaken by Urbis Valuations Pty Ltd on behalf of the Valuer-General Victoria (ref: VGV File: A01217) effective as at 30 June 2016. The Urbis valuation is based on:-
– the property is situated in the ‘Capital City 1’ zone, which is a highly sought after property zone;
– the highest and best use is considered to be mixed use development site;
– the site is well located, being opposite the river and close to public transport linkages;
– a Community Service Obligation (CSO) discount of 40 percent to the ‘unencumbered fair value’ has been applied, in this instance to take into account the civic and cultural uses imposed on the land;
– the central portion of the land, which is strata above the Rail Yards and essentially an air right, being ascribed a value equal to 5 percent of the surrounding land values; and
– part of the southern portion of the land, specifically the Princess Walk Vaults, is encumbered by a Heritage Overlay and listed on the Victorian Heritage Register, and an additional 30 percent discount has been applied to this area.
The carrying amount following the revaluation at 30 June 2016 of freehold land was $192,000,000.
A fair value assessment was conducted as at 30 June 2017, taking into consideration the Valuer-General Victoria (VGV) land indices that showed a 12.5% increase for the 2016-17 period. As the change since the last valuation was material, a management revaluation was made to increase the value of land by 12.5% from $192,000,000 to $216,000,000.
A fair value assessment was conducted as at 30 June 2018 and no change was made to the carrying amount.
Buildings and improvements
A valuation was undertaken by Napier and Blakeley Pty Ltd on behalf of the Valuer-General Victoria effective as at 30 June 2016. The fair value ascribed by Napier and Blakeley Pty Ltd for the carrying amount of buildings and improvements, as represented by the current replacement cost, at 30 June 2016 is $334,944,000. Additions to buildings and improvements since 1 July 2016 are recorded at cost, which represents fair value.
Plant, equipment and tenancy fit-outs
Plant, equipment and tenancy fit-outs are held at fair value.
Plant and equipment under finance lease are vehicles valued using the current replacement cost method. New vehicles are acquired and at times disposed of before the end of their economic life. The process of acquisition, use and disposal in the market is managed by VicFleet who set relevant depreciation rates during use to reflect the utilisation of the vehicles.
There were no changes in valuation techniques throughout the period to 30 June 2018.
For all assets measured at fair value, the current use is considered the highest and best use.
FINANCIAL REPORT
69
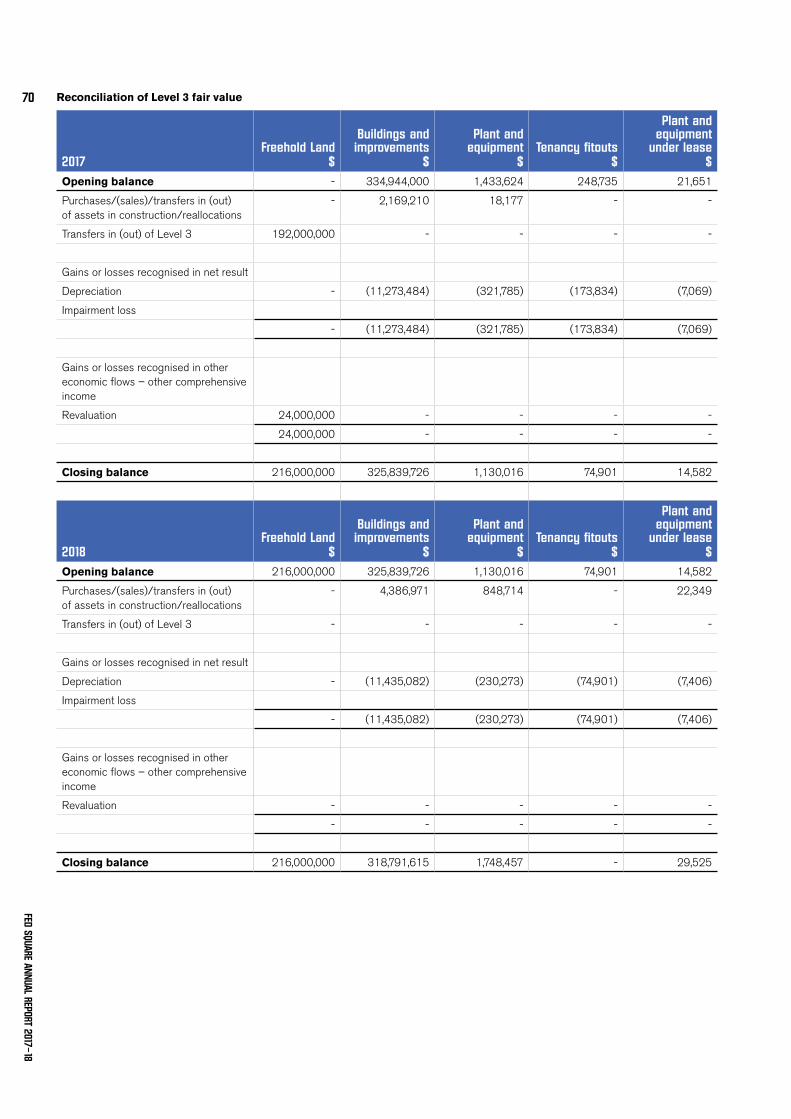
Reconciliation of Level 3 fair value
2017Freehold Land
$
Buildings and improvements
$
Plant and equipment
$Tenancy fitouts
$
Plant and equipment
under lease $
Opening balance - 334,944,000 1,433,624 248,735 21,651
Purchases/(sales)/transfers in (out) of assets in construction/reallocations
- 2,169,210 18,177 - -
Transfers in (out) of Level 3 192,000,000 - - - -
Gains or losses recognised in net result
Depreciation - (11,273,484) (321,785) (173,834) (7,069)
Impairment loss
- (11,273,484) (321,785) (173,834) (7,069)
Gains or losses recognised in other economic flows – other comprehensive income
Revaluation 24,000,000 - - - -
24,000,000 - - - -
Closing balance 216,000,000 325,839,726 1,130,016 74,901 14,582
2018Freehold Land
$
Buildings and improvements
$
Plant and equipment
$Tenancy fitouts
$
Plant and equipment
under lease $
Opening balance 216,000,000 325,839,726 1,130,016 74,901 14,582
Purchases/(sales)/transfers in (out) of assets in construction/reallocations
- 4,386,971 848,714 - 22,349
Transfers in (out) of Level 3 - - - - -
Gains or losses recognised in net result
Depreciation - (11,435,082) (230,273) (74,901) (7,406)
Impairment loss
- (11,435,082) (230,273) (74,901) (7,406)
Gains or losses recognised in other economic flows – other comprehensive income
Revaluation - - - - -
- - - - -
Closing balance 216,000,000 318,791,615 1,748,457 - 29,525
FED SQUARE ANNUAL REPORT 2017–18
70
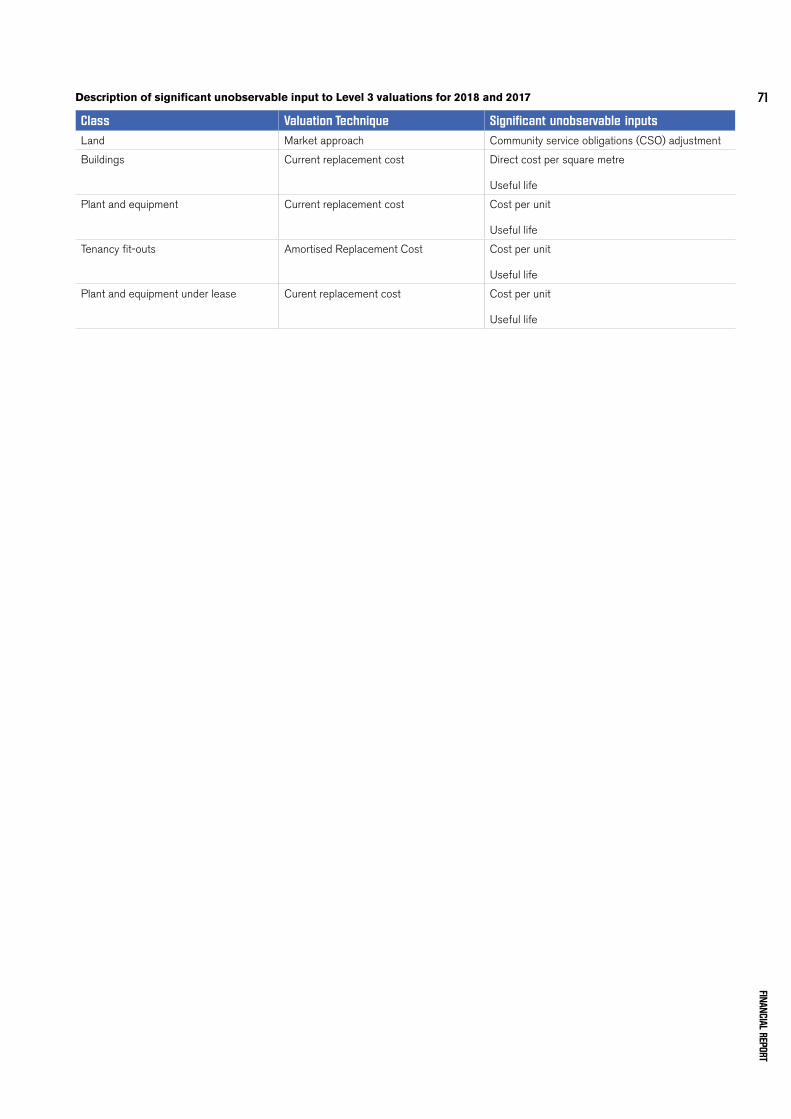
Description of significant unobservable input to Level 3 valuations for 2018 and 2017
Class Valuation Technique Significant unobservable inputsLand Market approach Community service obligations (CSO) adjustment
Buildings Current replacement cost Direct cost per square metre
Useful life
Plant and equipment Current replacement cost Cost per unit
Useful life
Tenancy fit-outs Amortised Replacement Cost Cost per unit
Useful life
Plant and equipment under lease Curent replacement cost Cost per unit
Useful life
FINANCIAL REPORT
71
8. OTHER DISCLOSURES
8.1 Ex-gratia payments There were no ex-gratia expenses greater than or equal to $5,000 during 2017-18 (2016-17: Nil)
8.2 Other economic flows included in net resultOther economic flows are changes in the volume or value of an asset or liability that do not result from transactions.
Other gains/(losses) from other economic flows include the gains or losses from:
– the revaluation of the present value of the long service leave liability due to changes in the bond interest rates; and
– transfer of amounts from the reserves to accumulated surplus or net result due to disposal or derecognition or reclassification.
8.3 Contributed capital FSPL is a company wholly owned by State Trustees Limited as custodian trustee on behalf of the State of Victoria. The share is held pursuant to the State Investment Trust Deed and the Treasurer of Victoria is the Minister responsible for the State Holding in FSPL under the Deed.
The allocation statement dated 27 June 2003 approved by the Minister for Finance required FSPL to record the value of assets transferred to the company in 2002-2003 as a capital injection by the State Government as owners. The total amount of the contributed capital of $435,940,507 comprised $373,440,507 for buildings and improvements, plant and equipment, and $62,500,000 for land. The transfer was effective from 30 June 2003 and is in accordance with the Department of Treasury and Finance ‘Accounting and Financial Reporting Bulletin No.39 – Accounting for Contributed Capital’.
Consistent with the requirements of AASB 1004 Contributions, contributions by owners (that is, contributed capital and its repayment) are treated as equity transactions and, therefore, do not form part of the income and expenses.
Additions to net assets that have been designated as contributions by owners are recognised as contributed capital. Other transfers that are in the nature of contributions to or distributions by owners have also been designated as contributions by owners.
The issued and paid up capital is 1 share @ $1 (2016-17: 1 share @ $1 each).
The contributed capital during the year is nil (2016-17: Nil). The contributed capital since 1 July 2003 is $11,735,000.
8.4 DividendsThere was no provision for dividends or dividends paid for the year (2016-2017: Nil).
IntroductionThis section includes additional material disclosures required by accounting standards or otherwise, for the understanding of this financial report.
Structure8.1 Ex-gratia payments8.2 Other economic flows included in net result8.3 Contributed capital8.4 Dividends8.5 Remuneration of auditors8.6 Responsible persons8.7 Remuneration of executives8.8 Related parties8.9 Subsequent events8.10 Australian Accounting Standards issued
that are not yet effective8.11 Glossary of technical terms
FED SQUARE ANNUAL REPORT 2017–18
72
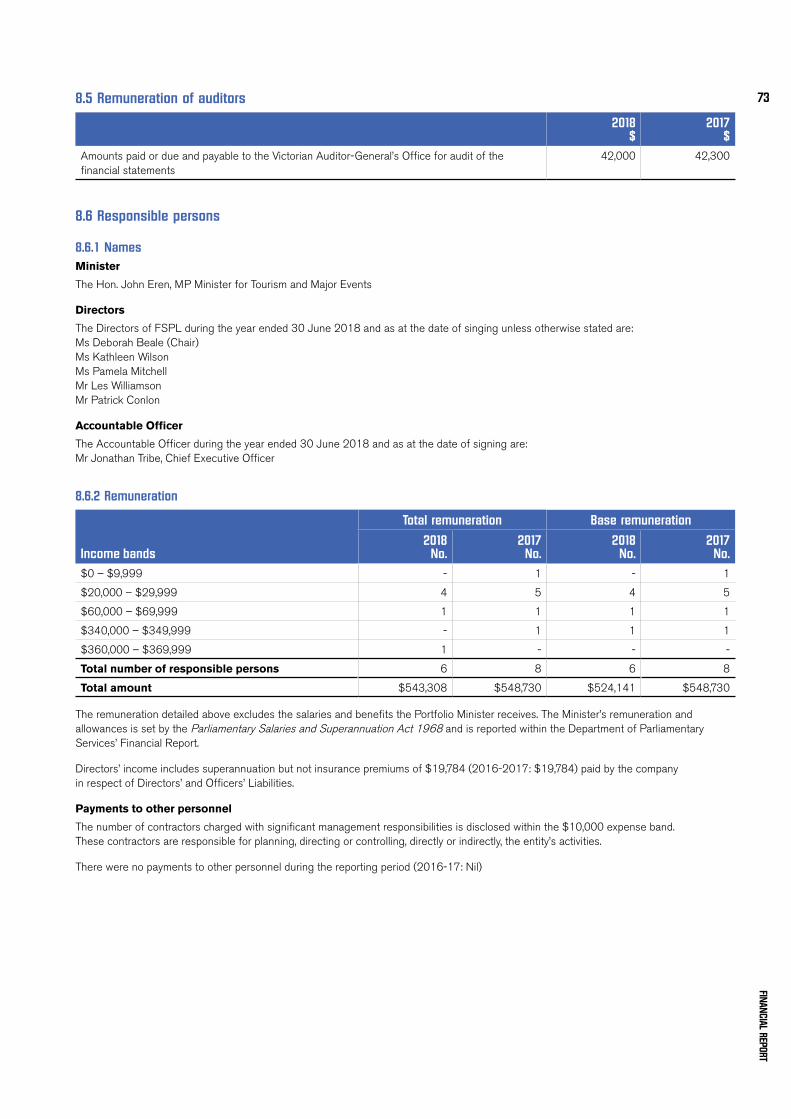
8.5 Remuneration of auditors
2018 $
2017 $
Amounts paid or due and payable to the Victorian Auditor-General’s Office for audit of the financial statements
42,000 42,300
8.6 Responsible persons
8.6.1 NamesMinister
The Hon. John Eren, MP Minister for Tourism and Major Events
Directors
The Directors of FSPL during the year ended 30 June 2018 and as at the date of singing unless otherwise stated are: Ms Deborah Beale (Chair) Ms Kathleen Wilson Ms Pamela Mitchell Mr Les Williamson Mr Patrick Conlon
Accountable Officer
The Accountable Officer during the year ended 30 June 2018 and as at the date of signing are: Mr Jonathan Tribe, Chief Executive Officer
8.6.2 Remuneration
Income bands
Total remuneration Base remuneration
2018 No.
2017 No.
2018 No.
2017 No.
$0 – $9,999 - 1 - 1
$20,000 – $29,999 4 5 4 5
$60,000 – $69,999 1 1 1 1
$340,000 – $349,999 - 1 1 1
$360,000 – $369,999 1 - - -
Total number of responsible persons 6 8 6 8
Total amount $543,308 $548,730 $524,141 $548,730
The remuneration detailed above excludes the salaries and benefits the Portfolio Minister receives. The Minister’s remuneration and allowances is set by the Parliamentary Salaries and Superannuation Act 1968 and is reported within the Department of Parliamentary Services’ Financial Report.
Directors’ income includes superannuation but not insurance premiums of $19,784 (2016-2017: $19,784) paid by the company in respect of Directors’ and Officers’ Liabilities.
Payments to other personnel
The number of contractors charged with significant management responsibilities is disclosed within the $10,000 expense band. These contractors are responsible for planning, directing or controlling, directly or indirectly, the entity’s activities.
There were no payments to other personnel during the reporting period (2016-17: Nil)
FINANCIAL REPORT
73
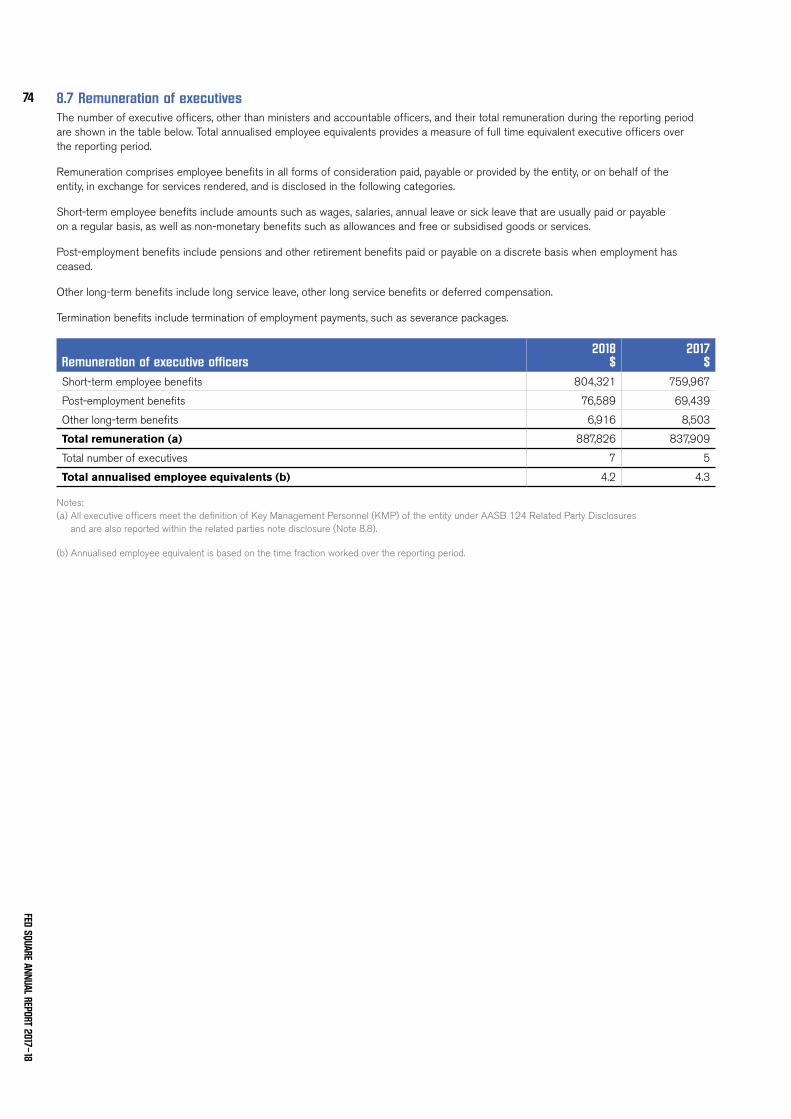
8.7 Remuneration of executivesThe number of executive officers, other than ministers and accountable officers, and their total remuneration during the reporting period are shown in the table below. Total annualised employee equivalents provides a measure of full time equivalent executive officers over the reporting period.
Remuneration comprises employee benefits in all forms of consideration paid, payable or provided by the entity, or on behalf of the entity, in exchange for services rendered, and is disclosed in the following categories.
Short-term employee benefits include amounts such as wages, salaries, annual leave or sick leave that are usually paid or payable on a regular basis, as well as non-monetary benefits such as allowances and free or subsidised goods or services.
Post-employment benefits include pensions and other retirement benefits paid or payable on a discrete basis when employment has ceased.
Other long-term benefits include long service leave, other long service benefits or deferred compensation.
Termination benefits include termination of employment payments, such as severance packages.
Remuneration of executive officers2018
$2017
$Short-term employee benefits 804,321 759,967
Post-employment benefits 76,589 69,439
Other long-term benefits 6,916 8,503
Total remuneration (a) 887,826 837,909
Total number of executives 7 5
Total annualised employee equivalents (b) 4.2 4.3
Notes: (a) All executive officers meet the definition of Key Management Personnel (KMP) of the entity under AASB 124 Related Party Disclosures
and are also reported within the related parties note disclosure (Note 8.8).
(b) Annualised employee equivalent is based on the time fraction worked over the reporting period.
FED SQUARE ANNUAL REPORT 2017–18
74
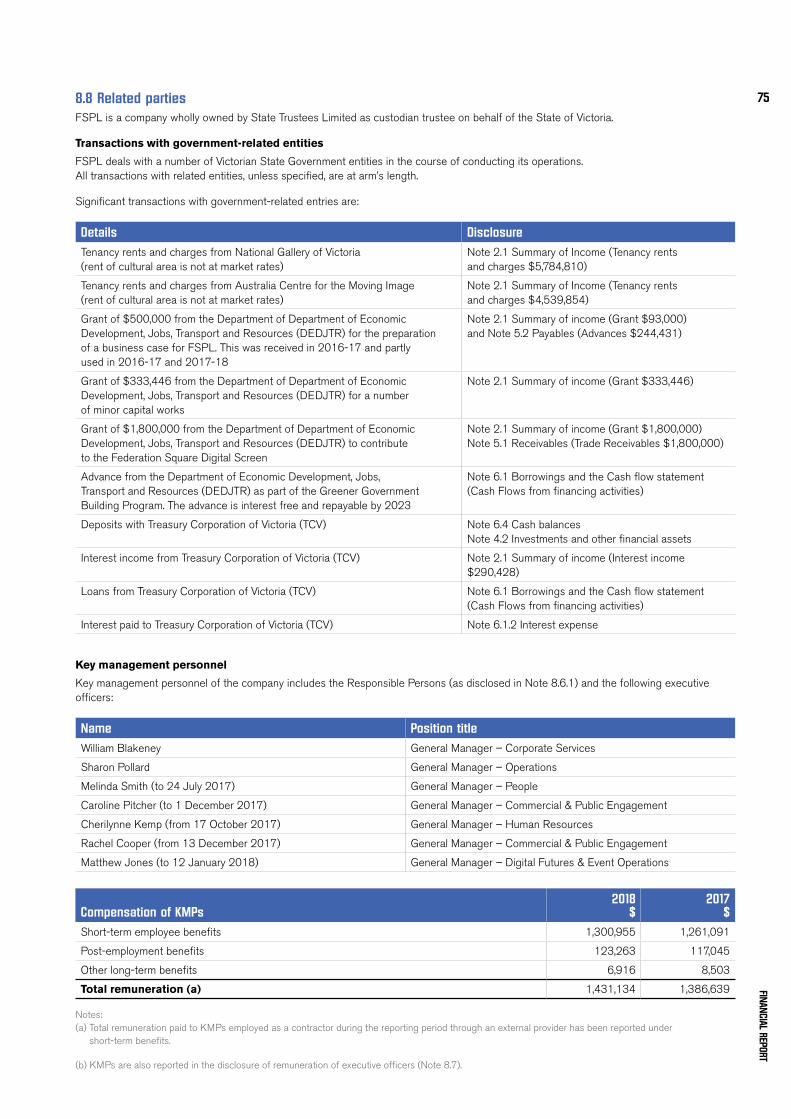
8.8 Related partiesFSPL is a company wholly owned by State Trustees Limited as custodian trustee on behalf of the State of Victoria.
Transactions with government-related entities
FSPL deals with a number of Victorian State Government entities in the course of conducting its operations. All transactions with related entities, unless specified, are at arm’s length.
Significant transactions with government-related entries are:
Details DisclosureTenancy rents and charges from National Gallery of Victoria (rent of cultural area is not at market rates)
Note 2.1 Summary of Income (Tenancy rents and charges $5,784,810)
Tenancy rents and charges from Australia Centre for the Moving Image (rent of cultural area is not at market rates)
Note 2.1 Summary of Income (Tenancy rents and charges $4,539,854)
Grant of $500,000 from the Department of Department of Economic Development, Jobs, Transport and Resources (DEDJTR) for the preparation of a business case for FSPL. This was received in 2016-17 and partly used in 2016-17 and 2017-18
Note 2.1 Summary of income (Grant $93,000) and Note 5.2 Payables (Advances $244,431)
Grant of $333,446 from the Department of Department of Economic Development, Jobs, Transport and Resources (DEDJTR) for a number of minor capital works
Note 2.1 Summary of income (Grant $333,446)
Grant of $1,800,000 from the Department of Department of Economic Development, Jobs, Transport and Resources (DEDJTR) to contribute to the Federation Square Digital Screen
Note 2.1 Summary of income (Grant $1,800,000) Note 5.1 Receivables (Trade Receivables $1,800,000)
Advance from the Department of Economic Development, Jobs, Transport and Resources (DEDJTR) as part of the Greener Government Building Program. The advance is interest free and repayable by 2023
Note 6.1 Borrowings and the Cash flow statement (Cash Flows from financing activities)
Deposits with Treasury Corporation of Victoria (TCV) Note 6.4 Cash balances Note 4.2 Investments and other financial assets
Interest income from Treasury Corporation of Victoria (TCV) Note 2.1 Summary of income (Interest income $290,428)
Loans from Treasury Corporation of Victoria (TCV) Note 6.1 Borrowings and the Cash flow statement (Cash Flows from financing activities)
Interest paid to Treasury Corporation of Victoria (TCV) Note 6.1.2 Interest expense
Key management personnel
Key management personnel of the company includes the Responsible Persons (as disclosed in Note 8.6.1) and the following executive officers:
Name Position titleWilliam Blakeney General Manager – Corporate Services
Sharon Pollard General Manager – Operations
Melinda Smith (to 24 July 2017) General Manager – People
Caroline Pitcher (to 1 December 2017) General Manager – Commercial & Public Engagement
Cherilynne Kemp (from 17 October 2017) General Manager – Human Resources
Rachel Cooper (from 13 December 2017) General Manager – Commercial & Public Engagement
Matthew Jones (to 12 January 2018) General Manager – Digital Futures & Event Operations
Compensation of KMPs2018
$2017
$Short-term employee benefits 1,300,955 1,261,091
Post-employment benefits 123,263 117,045
Other long-term benefits 6,916 8,503
Total remuneration (a) 1,431,134 1,386,639
Notes: (a) Total remuneration paid to KMPs employed as a contractor during the reporting period through an external provider has been reported under
short-term benefits.
(b) KMPs are also reported in the disclosure of remuneration of executive officers (Note 8.7).
FINANCIAL REPORT
75
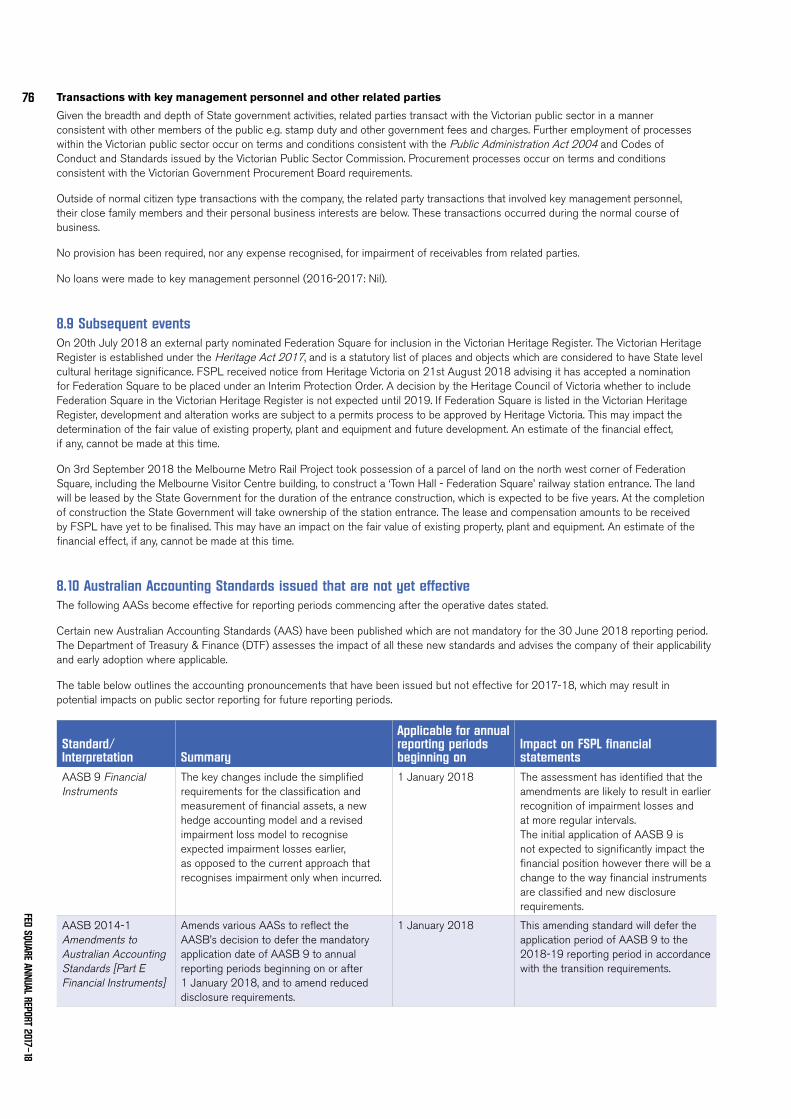
Transactions with key management personnel and other related parties
Given the breadth and depth of State government activities, related parties transact with the Victorian public sector in a manner consistent with other members of the public e.g. stamp duty and other government fees and charges. Further employment of processes within the Victorian public sector occur on terms and conditions consistent with the Public Administration Act 2004 and Codes of Conduct and Standards issued by the Victorian Public Sector Commission. Procurement processes occur on terms and conditions consistent with the Victorian Government Procurement Board requirements.
Outside of normal citizen type transactions with the company, the related party transactions that involved key management personnel, their close family members and their personal business interests are below. These transactions occurred during the normal course of business.
No provision has been required, nor any expense recognised, for impairment of receivables from related parties.
No loans were made to key management personnel (2016-2017: Nil).
8.9 Subsequent eventsOn 20th July 2018 an external party nominated Federation Square for inclusion in the Victorian Heritage Register. The Victorian Heritage Register is established under the Heritage Act 2017, and is a statutory list of places and objects which are considered to have State level cultural heritage significance. FSPL received notice from Heritage Victoria on 21st August 2018 advising it has accepted a nomination for Federation Square to be placed under an Interim Protection Order. A decision by the Heritage Council of Victoria whether to include Federation Square in the Victorian Heritage Register is not expected until 2019. If Federation Square is listed in the Victorian Heritage Register, development and alteration works are subject to a permits process to be approved by Heritage Victoria. This may impact the determination of the fair value of existing property, plant and equipment and future development. An estimate of the financial effect, if any, cannot be made at this time.
On 3rd September 2018 the Melbourne Metro Rail Project took possession of a parcel of land on the north west corner of Federation Square, including the Melbourne Visitor Centre building, to construct a ‘Town Hall - Federation Square’ railway station entrance. The land will be leased by the State Government for the duration of the entrance construction, which is expected to be five years. At the completion of construction the State Government will take ownership of the station entrance. The lease and compensation amounts to be received by FSPL have yet to be finalised. This may have an impact on the fair value of existing property, plant and equipment. An estimate of the financial effect, if any, cannot be made at this time.
8.10 Australian Accounting Standards issued that are not yet effectiveThe following AASs become effective for reporting periods commencing after the operative dates stated.
Certain new Australian Accounting Standards (AAS) have been published which are not mandatory for the 30 June 2018 reporting period. The Department of Treasury & Finance (DTF) assesses the impact of all these new standards and advises the company of their applicability and early adoption where applicable.
The table below outlines the accounting pronouncements that have been issued but not effective for 2017-18, which may result in potential impacts on public sector reporting for future reporting periods.
Standard/Interpretation Summary
Applicable for annual reporting periods beginning on
Impact on FSPL financial statements
AASB 9 Financial Instruments
The key changes include the simplified requirements for the classification and measurement of financial assets, a new hedge accounting model and a revised impairment loss model to recognise expected impairment losses earlier, as opposed to the current approach that recognises impairment only when incurred.
1 January 2018 The assessment has identified that the amendments are likely to result in earlier recognition of impairment losses and at more regular intervals. The initial application of AASB 9 is not expected to significantly impact the financial position however there will be a change to the way financial instruments are classified and new disclosure requirements.
AASB 2014-1 Amendments to Australian Accounting Standards [Part E Financial Instruments]
Amends various AASs to reflect the AASB’s decision to defer the mandatory application date of AASB 9 to annual reporting periods beginning on or after 1 January 2018, and to amend reduced disclosure requirements.
1 January 2018 This amending standard will defer the application period of AASB 9 to the 2018-19 reporting period in accordance with the transition requirements.
FED SQUARE ANNUAL REPORT 2017–18
76
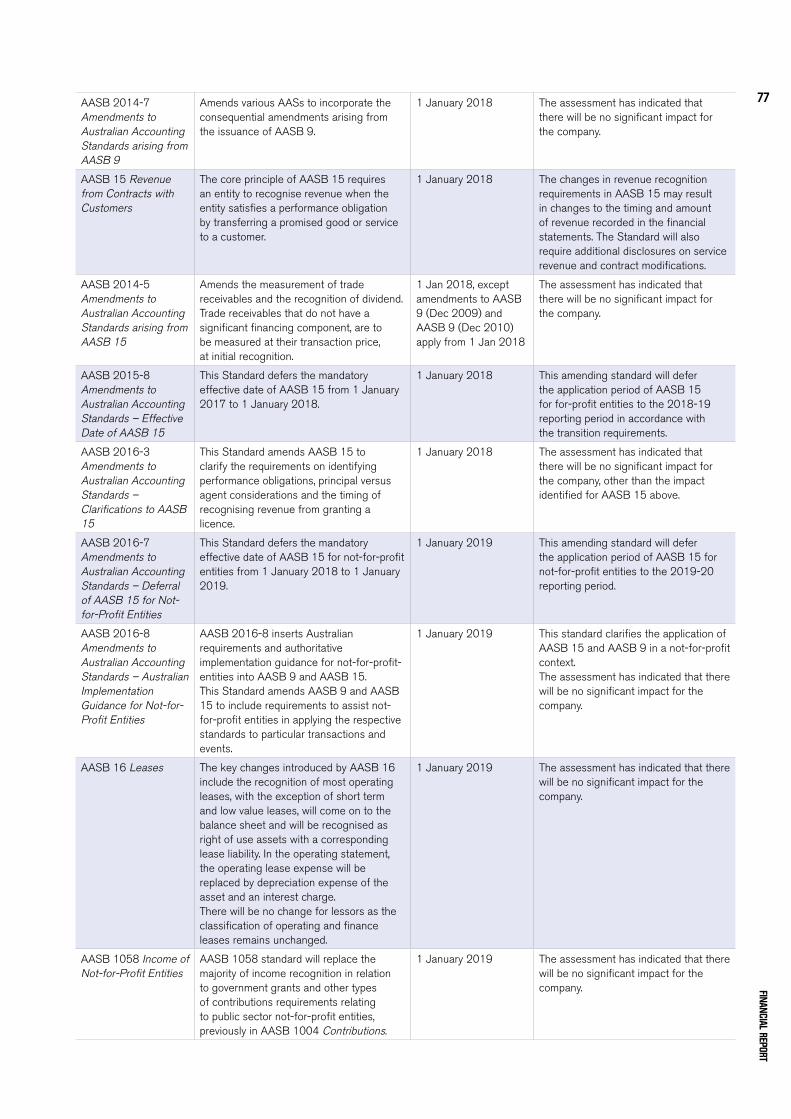
AASB 2014-7 Amendments to Australian Accounting Standards arising from AASB 9
Amends various AASs to incorporate the consequential amendments arising from the issuance of AASB 9.
1 January 2018 The assessment has indicated that there will be no significant impact for the company.
AASB 15 Revenue from Contracts with Customers
The core principle of AASB 15 requires an entity to recognise revenue when the entity satisfies a performance obligation by transferring a promised good or service to a customer.
1 January 2018 The changes in revenue recognition requirements in AASB 15 may result in changes to the timing and amount of revenue recorded in the financial statements. The Standard will also require additional disclosures on service revenue and contract modifications.
AASB 2014-5 Amendments to Australian Accounting Standards arising from AASB 15
Amends the measurement of trade receivables and the recognition of dividend. Trade receivables that do not have a significant financing component, are to be measured at their transaction price, at initial recognition.
1 Jan 2018, except amendments to AASB 9 (Dec 2009) and AASB 9 (Dec 2010) apply from 1 Jan 2018
The assessment has indicated that there will be no significant impact for the company.
AASB 2015-8 Amendments to Australian Accounting Standards – Effective Date of AASB 15
This Standard defers the mandatory effective date of AASB 15 from 1 January 2017 to 1 January 2018.
1 January 2018 This amending standard will defer the application period of AASB 15 for for-profit entities to the 2018-19 reporting period in accordance with the transition requirements.
AASB 2016-3 Amendments to Australian Accounting Standards – Clarifications to AASB 15
This Standard amends AASB 15 to clarify the requirements on identifying performance obligations, principal versus agent considerations and the timing of recognising revenue from granting a licence.
1 January 2018 The assessment has indicated that there will be no significant impact for the company, other than the impact identified for AASB 15 above.
AASB 2016-7 Amendments to Australian Accounting Standards – Deferral of AASB 15 for Not-for-Profit Entities
This Standard defers the mandatory effective date of AASB 15 for not-for-profit entities from 1 January 2018 to 1 January 2019.
1 January 2019 This amending standard will defer the application period of AASB 15 for not-for-profit entities to the 2019-20 reporting period.
AASB 2016-8 Amendments to Australian Accounting Standards – Australian Implementation Guidance for Not-for-Profit Entities
AASB 2016-8 inserts Australian requirements and authoritative implementation guidance for not-for-profit-entities into AASB 9 and AASB 15. This Standard amends AASB 9 and AASB 15 to include requirements to assist not-for-profit entities in applying the respective standards to particular transactions and events.
1 January 2019 This standard clarifies the application of AASB 15 and AASB 9 in a not-for-profit context. The assessment has indicated that there will be no significant impact for the company.
AASB 16 Leases The key changes introduced by AASB 16 include the recognition of most operating leases, with the exception of short term and low value leases, will come on to the balance sheet and will be recognised as right of use assets with a corresponding lease liability. In the operating statement, the operating lease expense will be replaced by depreciation expense of the asset and an interest charge. There will be no change for lessors as the classification of operating and finance leases remains unchanged.
1 January 2019 The assessment has indicated that there will be no significant impact for the company.
AASB 1058 Income of Not-for-Profit Entities
AASB 1058 standard will replace the majority of income recognition in relation to government grants and other types of contributions requirements relating to public sector not-for-profit entities, previously in AASB 1004 Contributions.
1 January 2019 The assessment has indicated that there will be no significant impact for the company. FINANCIAL REPORT
77
The following accounting pronouncements are also issued but not effective for the 2017-18 reporting period. At this stage, the preliminary assessment suggests they may have insignificant impacts on the company’s reporting.
– AASB 2017-6 Amendments to Australian Accounting Standards – Prepayment Features with Negative Compensation
– AASB 2018-1 Amendments to Australian Accounting Standards – Annual Improvements 2015 – 2017 Cycle
– AASB 2018-2 Amendments to Australian Accounting Standards – Plan Amendments, Curtailment or Settlement
Notes: For the current year, given the number of consequential amendments to AASB 9 Financial Instruments, AASB 15 Revenue from Contracts with Customers, and AASB 16 Leases, the standards/interpretations have been grouped together to provide a more relevant view of the upcoming changes.
8.11 Glossary of technical termsThe following is a summary of the major technical terms used in this report.
Amortisation is the expense that results from the consumption, extraction or use over time of a non-produced physical or intangible asset. This expense is classified as an ‘other economic flow’.
Borrowings refers to interest bearing liabilities mainly raised from public borrowings raised through the Treasury Corporation of Victoria, finance leases and other interest bearing arrangements. Borrowings also include non-interest bearing advances from government.
Commitments include those operating, capital and other outsourcing commitments arising from non-cancellable contractual or statutory sources.
Comprehensive result is the amount included in the operating statement representing total change in net worth other than transactions with owners as owners.
Depreciation is an expense that arises from the consumption through wear or time of a produced physical or intangible asset. This expense is classified as a ‘transaction’ and so reduces the ‘net result from transaction’.
Effective interest method is the method used to calculate the amortised cost of a financial asset and of allocating interest income over the relevant period. The effective interest rate is the rate that exactly discounts estimated future cash receipts through the expected life of the financial asset or, where appropriate, a shorter period.
Employee benefits expenses include all costs related to employment including wages and salaries, fringe benefits tax, leave entitlements, redundancy payments and defined contribution superannuation plans.
Ex-gratia expenses mean the voluntary payment of money or other non-monetary benefit (e.g. a write-off) that is not made either to acquire goods, services or other benefits for the entity or to meet a legal liability, or to settle or resolve a possible legal liability or claim against the entity.
Financial asset is any asset that is:
(a) cash; (b) an equity instrument of another entity; (c) a contractual right: – to receive cash or another financial asset from another entity; or – to exchange financial assets or financial liabilities with another entity under conditions that are potentially favourable
to the entity; or (d) a contract that will or may be settled in the entity’s own equity instruments and is: – a non-derivative for which the entity is or may be obliged to receive a variable number of the entity’s own equity instruments;
or – a derivative that will or may be settled other than by the exchange of a fixed amount of cash or another financial asset
for a fixed number of the entity’s own equity instruments.
Financial instrument is any contract that gives rise to a financial asset of one entity and a financial liability or equity instrument of another entity.
Financial liability is any liability that is:
(a) a contractual obligation: – to deliver cash or another financial asset to another entity; or – to exchange financial assets or financial liabilities with another entity under conditions that are potentially unfavourable
to the entity; or (b) a contract that will or may be settled in the entity’s own equity instruments and is: – a non-derivative for which the entity is or may be obliged to deliver a variable number of the entity’s own equity instruments; or – a derivative that will or may be settled other than by the exchange of a fixed amount of cash or another financial asset for
a fixed number of the entity’s own equity instruments. For this purpose, the entity’s own equity instruments do not include instruments that are themselves contracts for the future receipt or delivery of the entity’s own equity instruments.
FED SQUARE ANNUAL REPORT 2017–18
78
Financial statements comprises:
(a) a balance sheet as at the end of the period; (b) a comprehensive operating statement for the period; (c) a statement of changes in equity for the period; (d) a cash flow statement for the period; (e) notes, comprising a summary of significant accounting policies and other explanatory information; (f) comparative information in respect of the preceding period as specified in paragraph 38 of AASB 101 Presentation of Financial Statements; and (g) a statement of financial position as at the beginning of the preceding period when an entity applies an accounting policy
retrospectively or makes a retrospective restatement of items in its financial statements, or when it reclassifies items in its financial statements in accordance with paragraphs 41 of AASB 101.
Interest expense represents costs incurred in connection with borrowings. It includes interest on advances, loans, overdrafts, bonds and bills, deposits, interest components of finance lease repayments, and amortisation of discounts or premiums in relation to borrowings.
Interest income includes unwinding over time of discounts on financial assets and interest received on bank term deposits and other investments.
Leases are rights to use an asset for an agreed period of time in exchange for payment. Leases are classified at their inception as either operating or finance leases based on the economic substance of the agreement so as to reflect the risks and rewards incidental to ownership. Leases of infrastructure, property, plant and equipment are classified as finance leases whenever the terms of the lease transfer substantially all the risks and rewards of ownership from the lessor to the lessee. All other leases are classified as operating leases.
Net operating balance or net result from transactions is a key fiscal aggregate and is revenue from transactions minus expenses from transactions. It is a summary measure of the ongoing sustainability of operations. It excludes gains and losses resulting from changes in price levels and other changes in the volume of assets. It is the component of the change in net worth that is due to transactions and can be attributed directly to government policies.
Net result is a measure of financial performance of the operations for the period. It is the net result of items of revenue, gains and expenses (including losses) recognised for the period, excluding those classified as ‘other non-owner movements in equity’.
Net worth is calculated as assets less liabilities, which is an economic measure of wealth.
Non-financial assets are all assets that are not financial assets. It includes inventories, land, buildings, infrastructure, plant and equipment and intangibles.
Operating result is a measure of financial performance of the operations for the period. It is the net result of items of revenue, gains and expenses (including losses) recognised for the period, excluding those that are classified as ‘other non-owner movements in equity’. Refer also ‘net result’.
Other economic flows included in net result are changes in the volume or value of an asset or liability that do not result from transactions. In simple terms, other economic flows are changes arising from market remeasurements. They include gains and losses from disposals, revaluations and impairments of non-current physical and intangible assets; and fair value changes of financial instruments.
Other economic flows – other comprehensive income comprises items (including reclassification adjustments) that are not recognised in net result as required or permitted by other Australian Accounting Standards. They include changes in physical asset revaluation surplus.
Payables includes short and long-term trade debt and accounts payable, grants, taxes and interest payable.
Receivables include short and long-term trade credit and accounts receivable, accrued investment income, grants and interest receivable.
Sales of goods and services refers to income from the direct provision of goods and services and includes fees and charges for services rendered and sales of goods and services. It also includes rental income under operating leases.
Supplies and services generally represent cost of goods sold and the day to day running costs, including maintenance costs, incurred in the normal operations of the company.
Transactions are those economic flows that are considered to arise as a result of policy decisions, usually an interaction between two entities by mutual agreement. They also include flows into an entity such as depreciation, where the owner is simultaneously acting as the owner of the depreciating asset and as the consumer of the service provided by the asset. Taxation is regarded as mutually agreed interactions between the government and taxpayers. Transactions can be in kind (e.g. assets provided/given free of charge or for nominal consideration) or where the final consideration is cash.
FINANCIAL REPORT
79
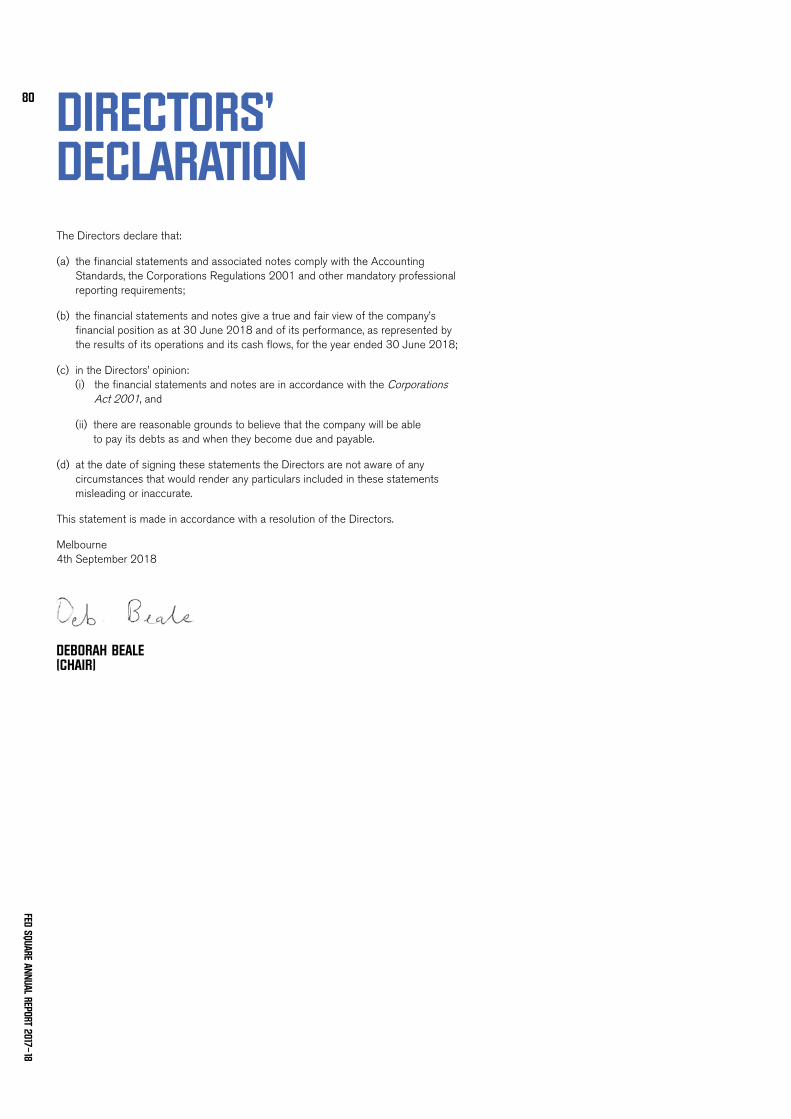
DIRECTORS’ DECLARATIONThe Directors declare that:
(a) the financial statements and associated notes comply with the Accounting Standards, the Corporations Regulations 2001 and other mandatory professional reporting requirements;
(b) the financial statements and notes give a true and fair view of the company’s financial position as at 30 June 2018 and of its performance, as represented by the results of its operations and its cash flows, for the year ended 30 June 2018;
(c) in the Directors’ opinion: (i) the financial statements and notes are in accordance with the Corporations
Act 2001, and
(ii) there are reasonable grounds to believe that the company will be able to pay its debts as and when they become due and payable.
(d) at the date of signing these statements the Directors are not aware of any circumstances that would render any particulars included in these statements misleading or inaccurate.
This statement is made in accordance with a resolution of the Directors.
Melbourne 4th September 2018
DEBORAH BEALE (CHAIR)
FED SQUARE ANNUAL REPORT 2017–18
80

Fed Square Pty LtdABN: 99 085 731 479 ACN: 085 731 479 Published by Fed Square Pty Ltd Melbourne Victoria Australia September 2018
Also published on fedsquare.com © Copyright Fed Square Pty Ltd 2018
This publication is copyright. No part may be reproduced by any process except in accordance with the provisions of the Copyright Act 1968.
DesignAer Design
PrintImpact Digital
This report is printed on Revive Laser, a 100% Recycled paper which is manufactured from FSC® Recycled certified fibre, and manufactured carbon neutral. Produced by an ISO 14001 certified mill. No chlorine bleaching occurs in the recycling process.


![[ES] trendwatching.com’s TRENDS: REFRESHED](https://img.pdfslide.net/doc/110x75/54bf99c64a7959d1158b45cb/es-trendwatchingcoms-trends-refreshed.jpg)
![[CN] trendwatching.com’s TRENDS: REFRESHED](https://img.pdfslide.net/doc/110x75/55391f004a79591c7b8b48e9/cn-trendwatchingcoms-trends-refreshed.jpg)


![[KR] trendwatching.com’s TRENDS: REFRESHED](https://img.pdfslide.net/doc/110x75/54c4593f4a79592c6b8b4579/kr-trendwatchingcoms-trends-refreshed.jpg)
![THE AIESEC WAY [refreshed]](https://img.pdfslide.net/doc/110x75/57906fa91a28ab687499dfac/the-aiesec-way-refreshed.jpg)