Embed Size (px)
Citation preview
1531
SP-230—87
Significance of Stress-Block Parameterson the Moment Capacity of Sections
Under-Reinforced with FRP
by G. Urgessa, S. Horton, M.M. Reda Taha, and A. Maji
SSSSSyyyyynopnopnopnopnopsssssiiiiis:s:s:s:s: For under-reinforced concrete sections reinforced with FRP, failure of amember is initiated by rupture of the FRP bar and the typical ACI compression stress-block might not be applicable. This is because of the fact that the corresponding strainat the extreme fiber of the concrete will not reach the ultimate strain in concrete.Therefore, accurate computation of flexural capacity requires developing equivalentstress-block parameters that represent the stress distribution in the concrete at aparticular strain level. While the ACI 440 permits the use of a simplified approach tocalculate moment capacities that do not require equivalent stress-block calculations,the significance of this simplification needs to be examined. This paper suggests afamily of curves based on the extreme fiber strain in concrete using three existingstress-strain models. The paper highlights the significance of these curves for differentvalues of compressive strengths of concrete.
Keywords: FRP; HPC; stress-block parameters
1532 Urgessa et al.Girum Urgessa is a Ph.D. candidate in the Department of Civil Engineering at the
University of New Mexico. His research interests include the use of FRP to mitigate the
effects of transient loads and structural systems identification. He is a student member of
ACI.
Scott Horton is a M.Sc. candidate in the Department of Civil Engineering at the
University of New Mexico. His research interest is in the area of damage detection
algorithms using neural networks and wavelet multi-resolution analysis.
Mahmoud M. Reda Taha is an assistant Professor in the Department of Civil
Engineering at the University of New Mexico. He is a member of ACI committee 548
and associate member of committees 440 and 209. His research interests include
structural health monitoring and the use of FRP in structures.
Arup Maji is a Professor and Chairman of the Department of Civil Engineering at the
University of New Mexico. He is a member of ACI committees 228 and 446.
INTRODUCTION
The ACI 440 guide (ACI 440 2003) recommends the flexural capacity of an
FRP reinforced concrete section to be computed with the same equations required by ACI
318 code requirements (ACI 318 2002).
un
MM ≥φ (1)
The nominal flexural strength is dependent on the controlling mode of failure. Failure can
be initiated by concrete crushing or FRP rupture. The failure mode can be determined by
comparing the FRP reinforcement ratio (ρf) to the balanced reinforcement ratio (ρ
fb)
which can be calculated from Equations (2a) and (2b).
bd
Af
f=ρ (2a)
fucuf
cuf
fu
c
fb
fE
E
f
f
+
′
=
ε
ε
βρ1
85.0 (2b)
If the reinforcement ratio is below the balanced ratio, FRP rupture failure mode governs.
In this case, the typical compression stress-block might be no longer applicable because
the ultimate strain in concrete, εcu
= 0.003, might not be attained. While a simplified
nominal moment capacity, Mn, can be computed from Equation (3), ACI 440
recommends a conservative calculation of the nominal flexural capacity, Mn-ACI
, based on
balanced section properties and a reduction factor of 0.8 as shown in Equation (4).
β
−=
2
1 b
fufn
c
dfAM (3)
FRPRCS-7 1533
β
−=−
2
80
1 b
fufACIn
c
dfA.M (4)
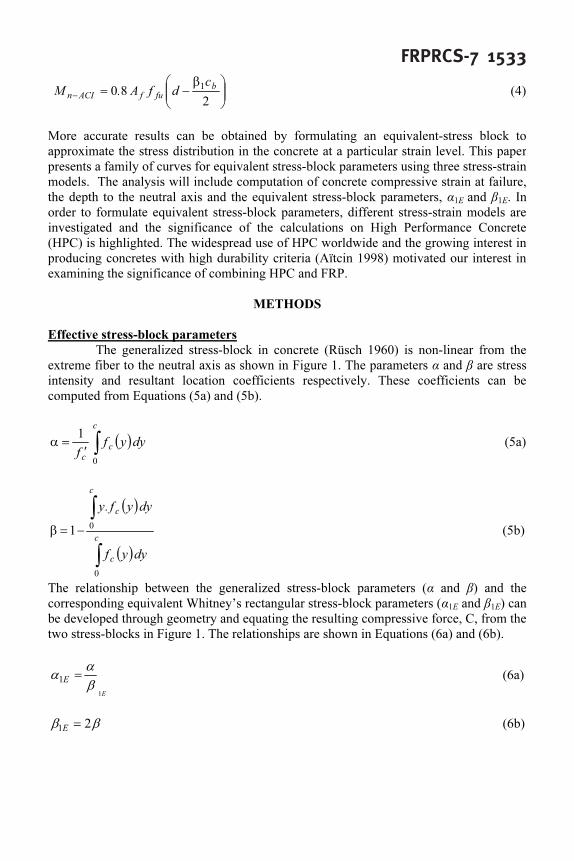
More accurate results can be obtained by formulating an equivalent-stress block to
approximate the stress distribution in the concrete at a particular strain level. This paper
presents a family of curves for equivalent stress-block parameters using three stress-strain
models. The analysis will include computation of concrete compressive strain at failure,
the depth to the neutral axis and the equivalent stress-block parameters, α1E
and β1E
. In
order to formulate equivalent stress-block parameters, different stress-strain models are
investigated and the significance of the calculations on High Performance Concrete
(HPC) is highlighted. The widespread use of HPC worldwide and the growing interest in
producing concretes with high durability criteria (Aïtcin 1998) motivated our interest in
examining the significance of combining HPC and FRP.
METHODS
Effective stress-block parameters
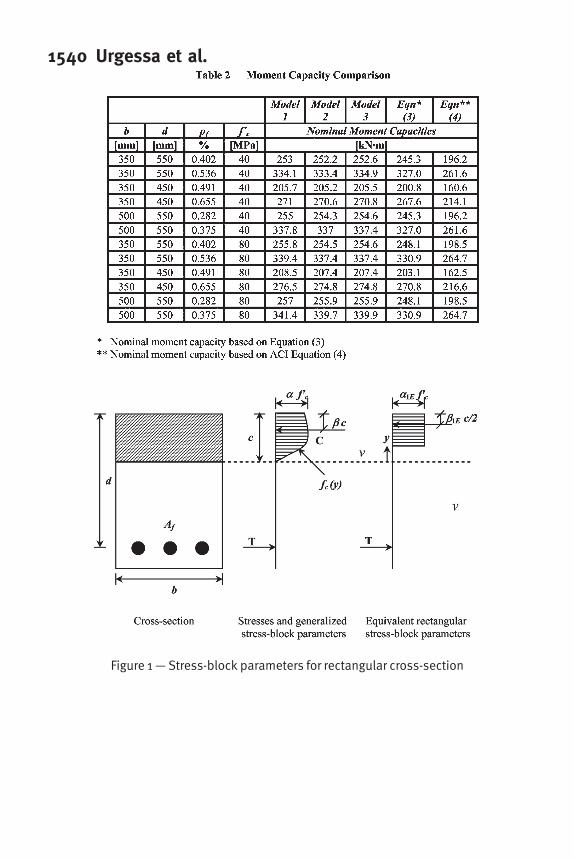
The generalized stress-block in concrete (Rüsch 1960) is non-linear from the
extreme fiber to the neutral axis as shown in Figure 1. The parameters α and β are stress
intensity and resultant location coefficients respectively. These coefficients can be
computed from Equations (5a) and (5b).
( )dyyf
f
c
c
c
∫′
=α
0
1
(5a)
( )
( )dyyf
dyyf.y
c
c
c
c
∫
∫
−=β
0
0
1 (5b)
The relationship between the generalized stress-block parameters (α and β) and the
corresponding equivalent Whitney’s rectangular stress-block parameters (α1E
and β1E
) can
be developed through geometry and equating the resulting compressive force, C, from the
two stress-blocks in Figure 1. The relationships are shown in Equations (6a) and (6b).
E
E
1
1
β
α
α = (6a)
ββ 21
=
E (6b)
1534 Urgessa et al.Stress-strain models
In order to compute the effective stress-block parameters, there is a need to
determine the stress-strain relationship in concrete, fc and ε
c. A number of models
describing the stress-strain curve of Normal Strength Concrete (NSC) were proposed
through the past three decades. Popovics (1970) summarized some of the earlier
empirical models for numerical approximations of stress-strain curves. Yip (1998)
investigated various generic forms of equations for the constitutive stress-strain
relationships of different grades of concrete. Relatively recently, a group of new models
to describe the stress-strain curves of HPC have been developed (e.g. Loov 1991 and
Collins et al. 1993). In this paper, three models are investigated.
Model 1 by Desayi and Krishnan (1964) -- Desayi and Krishnan (1964)
proposed a simple model describing stress-strain of concrete as
( )
( )2
/1
/2
cc
cc
c
c
f
f
ε′ε+
ε′ε
=
′
(7)
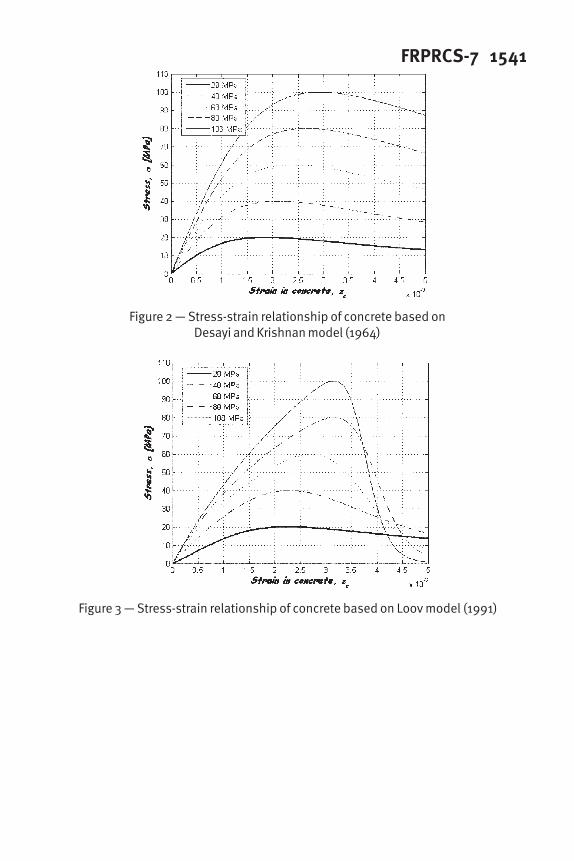
The model is simple in form such that closed-form integrations can be evaluated to
calculate the stress-block parameters. The stress-strain curves resulting from this model
are shown in Figure 2 for different strengths of concrete. The simplicity of the model has
encouraged many researchers to use it as a general stress-strain model for concrete
(MacGregor 1997).
It becomes obvious from Figure 2 that Desayi and Krishnan’s model (1964) was
developed to describe the stress-strain of normal strength concrete. The stress-strain
curves for HPC as proposed by the model do not match those observed experimentally
(Collins and et al. 1993; Macgregor 1997).
Model 2 by Loov (1991) -- Loov (1991) extended the early work by Carriera
and Chu
(1985), who proposed a model that can be adjusted to fit experimental values.
The target was to formulate a generalized model capable of describing stress-strain of
NSC and HPC.
( ) ( )n
ccccc
c
c
c
/C/B
A
f
f
ε′ε+ε′ε+ε′
ε
=
′1
(8a)
where,
1
1
−
=
n
C (8b)
CBA ++=1 (8c)
Loov (1991) had determined the values of n and B experimentally for different concrete
strengths. In order to plot the stress-strain curve for any other specific strength of
FRPRCS-7 1535concrete, polynomial regression can be used to evaluate the corresponding values of A, B,
C and n. The proposed stress-strain curves are shown in Figure 3.
Model 3 by Collins and et al. (1993) -- Collins, Mitchell and MacGregor
(1993) extended the early work by Thorenfeldt and et al. (1987), who described the
relationship between the compressive stress at any strain to the maximum stress. The
descending part of the stress-strain curve is described well in the analysis through a post-
stress decay factor. This model accounts for the fact that the stress-strain curves drop at a
higher rate after the peak stress for HPC sections compared to NSC sections.
( )nk
ccc
c
c
c
n
n
f
f
εεε
ε
′+−′
=
′/1
(9a)
where,
17
8.0
c
f
n
′
+= [MPa units] (9b)
For the ascending part of the curve, 1=k , otherwise
62
67.0
c
f
k
′
+= [MPa units] (9c)
1−
′
=ε′
n
n
E
f
c
c
c
(9d)
69003320 +′=cc
fE [MPa units] (9e)
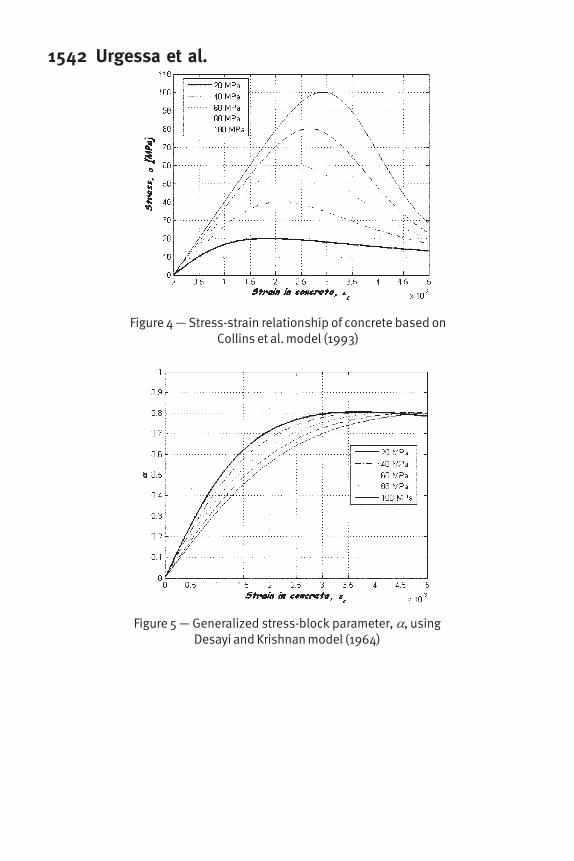
The stress-strain curves representing Collins and et al. model (1993) is shown in Figure 4.
The ratio of resultant location and stress intensity coefficients
An estimate of the ultimate concrete compression strain based solely on the
moment due to the compressive concrete stresses can be obtained by solving the
differential equation
( )
0
/
=
′∂
∂
cc
M
εε
(10a)
By examining the parameter involved in determining the moment capacity from
generalized stress-block diagram (see Figure 1), the moment about the neutral axis due to
tension in the FRP bars can be expressed as
( )cdfAMfuf
β−= (10b)
The depth to the neutral axis can be determined from equilibrium of the tension force in
the FRP bars and the compression force of concrete.
bf
fA
c
c
fuf
′α
= (10c)
1536 Urgessa et al.Combining Equations (10b) and (10c), the general expression for the moment about the
neutral axis for a given FRP reinforced cross-section can be determined as a function of
the ratio of β and α.
( )
α
β−
′
′
=
fuf
c
c
fuf
fA
fdb
bf
fA
M
2
(10d)
The nominal moment capacity, Mn, is thus obtained when the ratio of (β /α) is minimum.
( )
α
β−
′
′
=
minfuf
c
c
fuf
n
fA
fdb
bf
fA
M
2
(10e)
RESULTS
A computer program using MATLAB®
is developed to generate families of
curves describing the generalized and equivalent stress-block parameters curves based on
the three models described above. While closed form solutions can be developed using
Desayi and Krishnan model (1964), numerical integration was implemented to the other
two models. The curves are developed for concrete strengths ranging from 20 MPa to 100
MPa.
Generalized stress-block parameters
A plot of the generalized stress-block parameters, α and β, for each stress-strain
model is generated using Equations (5a) and (5b). The families of curves are shown in
Figures 5 to 10.
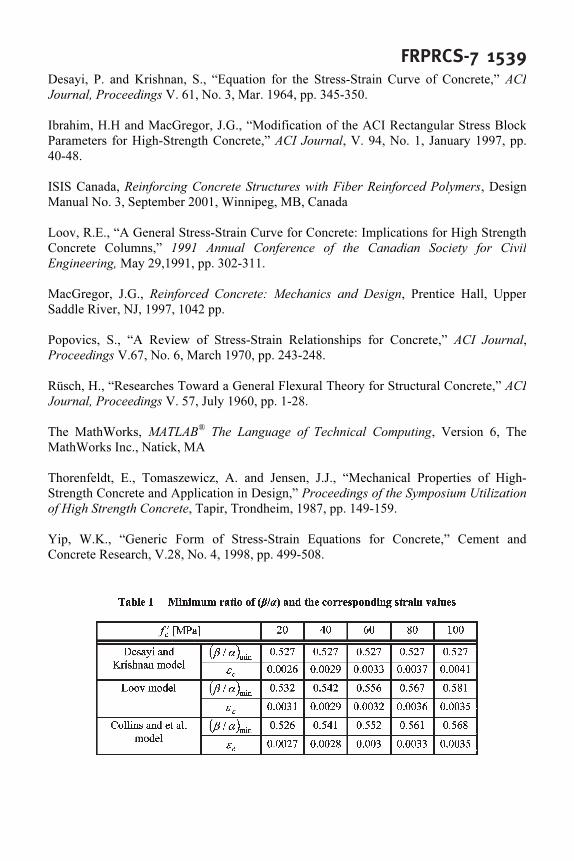
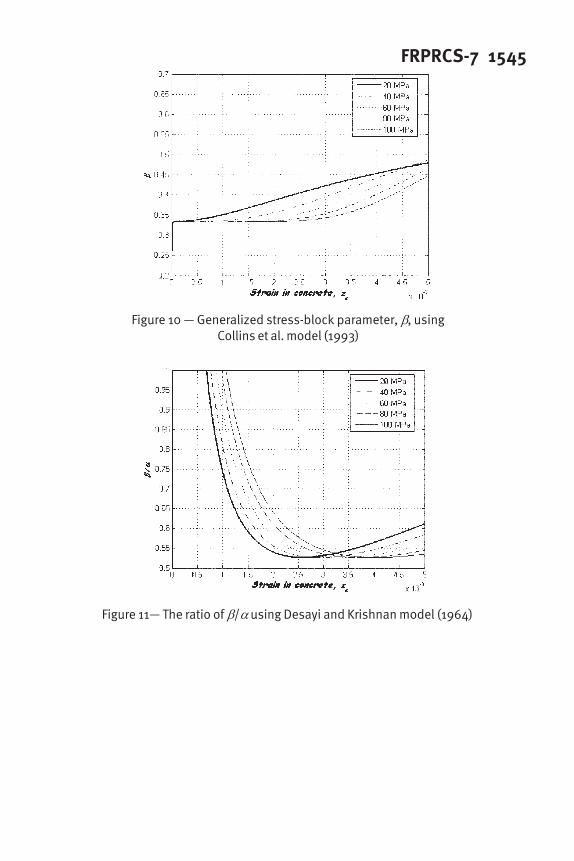
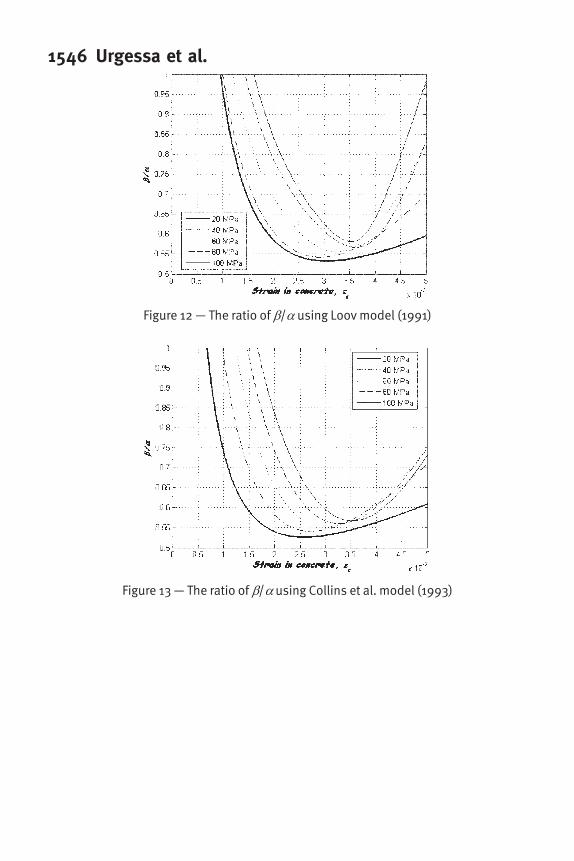
The ratio of resultant location and stress intensity coefficients
Based on equation (10e), the ultimate concrete compression strain in concrete
corresponds to the minimum β/α ratio. Figures 11, 12 and 13 show the plot of the ratio
β/α for the three stress-strain models. Values of concrete strain corresponding to the
minimum (β/α) ratio are presented in Table 1.
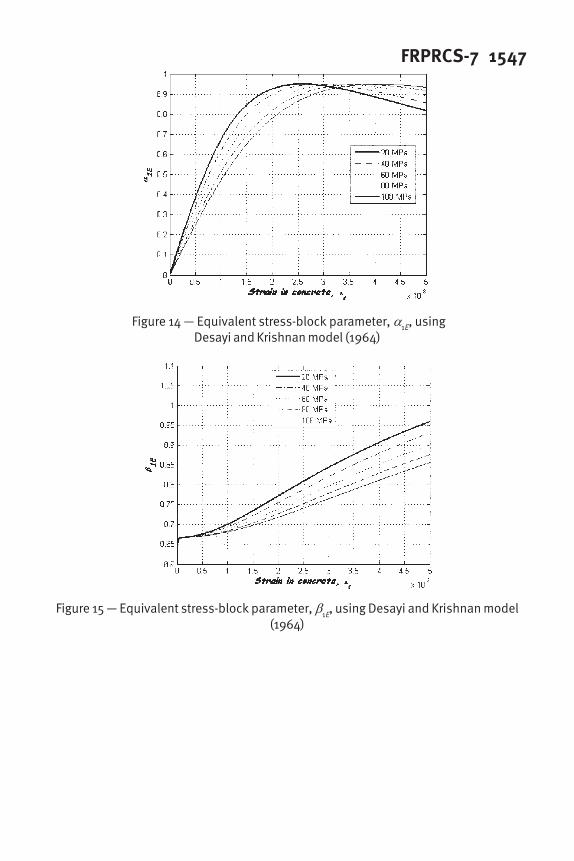
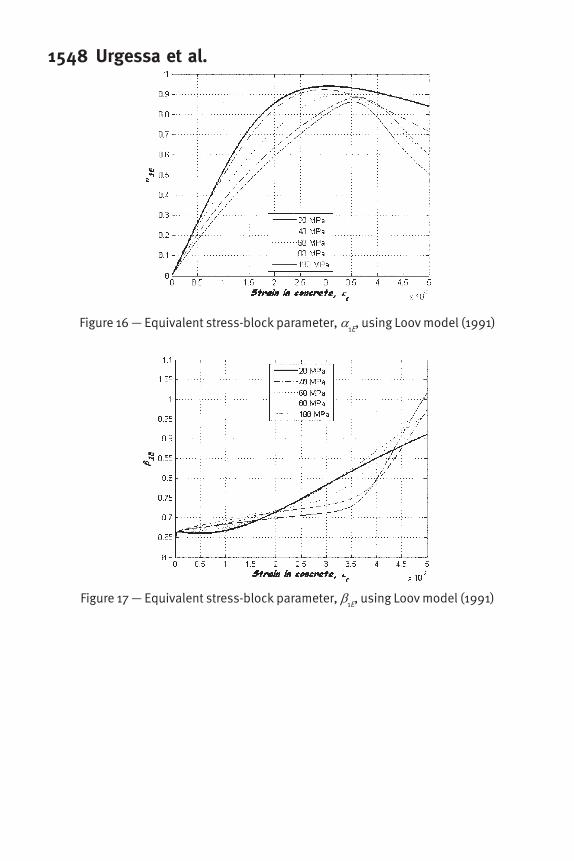
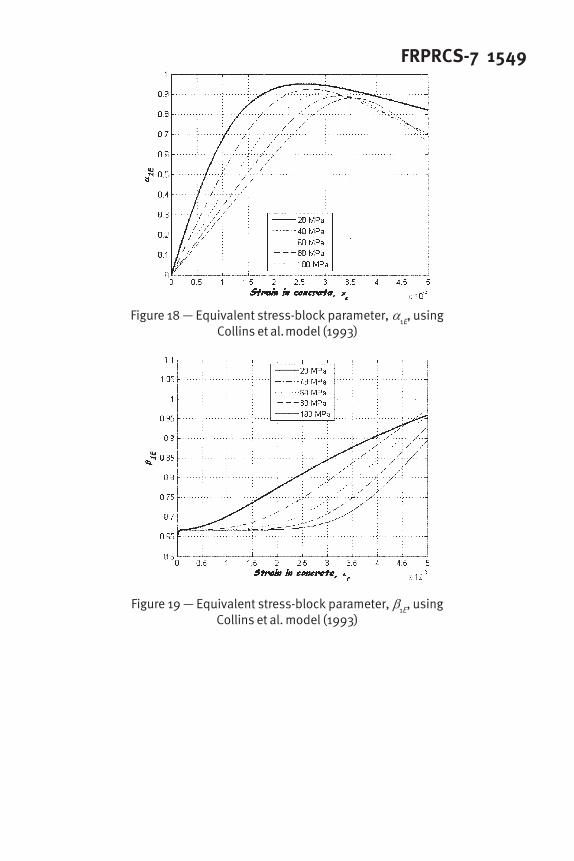
Equivalent stress-block parameters for design of under-reinforced FRP sections
The equivalent stress-block parameters, α1E
and β1E
, are determined from
equations (6a) and (6b) using the generalized stress-block parameters computed above.
The equivalent stress-block parameters proposed for use of under-reinforced FRP
sections are shown in Figures 14 to 19.
Comparison of nominal moment capacities
To compare between these models and to examine their significance given the
ACI 440 recommendations (ACI 440 2003), moment capacity analysis was performed on
a number of concrete sections under-reinforced with GFRP bars and different cross-
section properties. A simplified form of Equation (10e) as shown in Equation 11 is used
while implementing the equivalent stress-block parameters for the three described models
with β1E
representing the value of β when the ratio of β to α is minimum. The predicted
FRPRCS-7 1537flexural capacities using Equations (3) and (4) are also presented based on balanced
section parameters. GFRP material properties offu
f = 617 MPa andf
E = 42 GPa are
used. The results are presented in Table 2.
β−=
2
1c
dfAME
fufn (11)
DISCUSSIONS
Rigorous analysis of the moment capacities using the equivalent stress-block
parameters and Equation (3) and (4) show the value β1E
c (the depth of equivalent stress-
block for FRP rupture) is less than β1
cb (the depth of equivalent stress-block for a
balanced failure). Hence, the ACI 440 model underestimates the moment capacity
compared with the moment capacities computed using the three models. If the reduction
coefficient 0.8, used in the ACI model is eliminated from Equation (4), the ACI estimated
moment capacity will be close but still less than the moment capacities obtained using the
three models. However, such recommendation cannot be made until both the ACI and the
equivalent stress-block moment capacities are compared to experimental results. This
comparison is currently being investigated.
It can be observed that the Desayi and Krishnan model (1964) will result in a
higher moment capacity (small values of β/α) compared to models 2 and 3. The two other
models predicted values of moment capacity closer to each other than model 1.
Observing the (β/α) curves in Figures 11 to 13, it can be argued that a limiting
compressive strain value of 0.0035 for HPC might be more practical than the 0.003 value
currently recommended by ACI. This observation confirms the findings by Loov (1991)
and values of maximum strain obtained from specimens of Ibrahim and MacGregor
(1997), which have been adopted by recent Canadian codes for using FRP in concrete
structures (ISIS Canada 2001).
CONCLUSIONS
Families of curves representing equivalent stress-block parameters were
generated for accurate moment capacity analysis of sections under-reinforced with FRP
using three stress-strain models for HPC. Further investigation is underway to compare
these findings to experimental results for concrete sections under-reinforced with FRP.
NOTATIONS
A , B ,C , n = curve fitting parameters for use in Loov model
fA = area of FRP reinforcement
b = width of concrete cross-section
C = concrete compressive stress
c = distance from extreme compression fiber to the neutral axis
d = distance from extreme fiber to centroid of tension reinforcement
1538 Urgessa et al.c
E = modulus of elasticity of concrete
fE = guaranteed modulus of elasticity of the FRP
c
f = compressive stress in concrete
c
f ′ = characteristic compressive strength of concrete
fuf = design tensile strength of FRP
k = stress decay factor by Collins and et al. model
M = moment due to compressive stresses
nM = nominal moment capacity
uM = factored moment at section
T = tension force in FRP
y = distance from the neutral axis to any location through the depth
α = generalized stress intensity coefficient
E1α = equivalent rectangular stress intensity coefficient
β = resultant location coefficient for a generalized stress-block
1β = ACI resultant location coefficient
E1β = resultant location coefficient for an equivalent stress-block
cε = strain in concrete
cε ′ = strain in concrete at maximum stress
cu
ε = ultimate strain in concrete
φ = strength reduction factor
fρ = FRP reinforcement ratio
fbρ = FRP reinforcement ratio producing balanced strain conditions
REFERENCES
ACI Committee 318, Building Code Requirements for Structural Concrete (ACI 318M-
02) and Commentary (ACI 318M-02), American Concrete Institute, Farmington Hills,
MI, 2002, 443 pp.
ACI Committee 440, Guide for the Design and Construction of Concrete Reinforced with
FRP, American Concrete Institute, Farmington Hills, MI, May 2003, 42 pp.
Aïtcin, P.C., High-Performance Concrete, Routledge, New York, NY, 1998, 591 pp.
Carreira, D.J. and Chu, K-H., “Stress-strain Relationship for Plain-Concrete in
Compression,” ACI Journal, V. 82, No. 6, 1985, pp. 797-804.
Collins, M.P., Mitchell D. and MacGregor, J.G., “Structural Consideration for High-
Strength Concrete,” Concrete International, V. 15, No. 5, May 1993, pp. 27-34.
FRPRCS-7 1539Desayi, P. and Krishnan, S., “Equation for the Stress-Strain Curve of Concrete,” ACI
Journal, Proceedings V. 61, No. 3, Mar. 1964, pp. 345-350.
Ibrahim, H.H and MacGregor, J.G., “Modification of the ACI Rectangular Stress Block
Parameters for High-Strength Concrete,” ACI Journal, V. 94, No. 1, January 1997, pp.
40-48.
ISIS Canada, Reinforcing Concrete Structures with Fiber Reinforced Polymers, Design
Manual No. 3, September 2001, Winnipeg, MB, Canada
Loov, R.E., “A General Stress-Strain Curve for Concrete: Implications for High Strength
Concrete Columns,” 1991 Annual Conference of the Canadian Society for Civil
Engineering, May 29,1991, pp. 302-311.
MacGregor, J.G., Reinforced Concrete: Mechanics and Design, Prentice Hall, Upper
Saddle River, NJ, 1997, 1042 pp.
Popovics, S., “A Review of Stress-Strain Relationships for Concrete,” ACI Journal,
Proceedings V.67, No. 6, March 1970, pp. 243-248.
Rüsch, H., “Researches Toward a General Flexural Theory for Structural Concrete,” ACI
Journal, Proceedings V. 57, July 1960, pp. 1-28.
The MathWorks, MATLAB®
The Language of Technical Computing, Version 6, The
MathWorks Inc., Natick, MA
Thorenfeldt, E., Tomaszewicz, A. and Jensen, J.J., “Mechanical Properties of High-
Strength Concrete and Application in Design,” Proceedings of the Symposium Utilization
of High Strength Concrete, Tapir, Trondheim, 1987, pp. 149-159.
Yip, W.K., “Generic Form of Stress-Strain Equations for Concrete,” Cement and
Concrete Research, V.28, No. 4, 1998, pp. 499-508.
1540 Urgessa et al.
Figure 1 — Stress-block parameters for rectangular cross-section
FRPRCS-7 1541
Figure 2 — Stress-strain relationship of concrete based onDesayi and Krishnan model (1964)
Figure 3 — Stress-strain relationship of concrete based on Loov model (1991)
1542 Urgessa et al.
Figure 4 — Stress-strain relationship of concrete based onCollins et al. model (1993)
Figure 5 — Generalized stress-block parameter, α, usingDesayi and Krishnan model (1964)
FRPRCS-7 1543
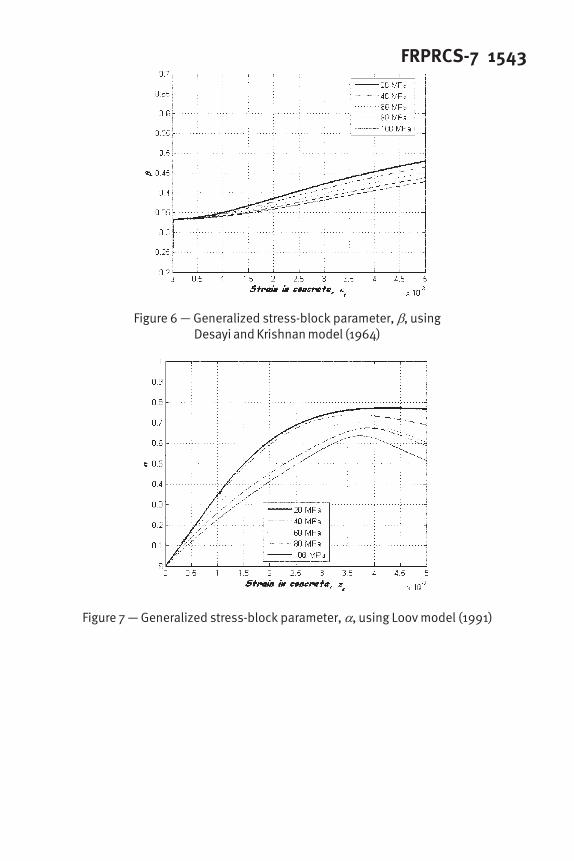
Figure 6 — Generalized stress-block parameter, β, usingDesayi and Krishnan model (1964)
Figure 7 — Generalized stress-block parameter, α, using Loov model (1991)
1544 Urgessa et al.
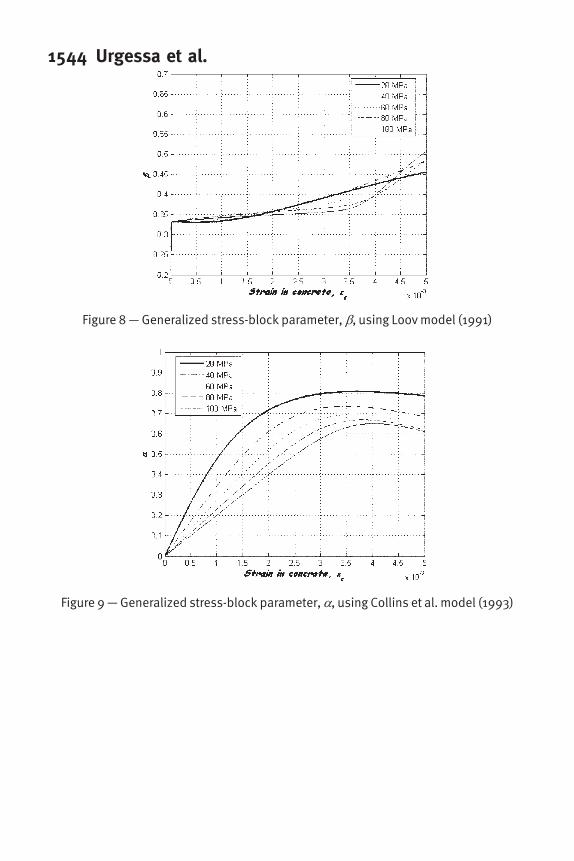
Figure 8 — Generalized stress-block parameter, β, using Loov model (1991)
Figure 9 — Generalized stress-block parameter, α, using Collins et al. model (1993)
FRPRCS-7 1545
Figure 10 — Generalized stress-block parameter, β, usingCollins et al. model (1993)
Figure 11— The ratio of β/α using Desayi and Krishnan model (1964)
1546 Urgessa et al.
Figure 12 — The ratio of β/α using Loov model (1991)
Figure 13 — The ratio of β/α using Collins et al. model (1993)
FRPRCS-7 1547
Figure 14 — Equivalent stress-block parameter, α1E, usingDesayi and Krishnan model (1964)
Figure 15 — Equivalent stress-block parameter, β1E
, using Desayi and Krishnan model(1964)
1548 Urgessa et al.
Figure 16 — Equivalent stress-block parameter, α1E
, using Loov model (1991)
Figure 17 — Equivalent stress-block parameter, β1E
, using Loov model (1991)
FRPRCS-7 1549
Figure 18 — Equivalent stress-block parameter, α1E
, usingCollins et al. model (1993)
Figure 19 — Equivalent stress-block parameter, β1E
, usingCollins et al. model (1993)
1550 Urgessa et al.