Embed Size (px)
Citation preview
Similarity and Conformity Graphs in LightingOptimization and Assessment
Artur Basiura1[0000−0002−1034−6078], Adam Sędziwy1[0000−0002−2489−3726], andKonrad Komnata1[0000−0003−1792−9660]
AGH University of Science and Technology, Department of Applied ComputerScience, Al.Mickiewicza 30, 30-059 Kraków, Poland{abasiura, sedziwy, kkomnata}@agh.edu.pl
Abstract. Lighting affects everyday life in terms of safety, comfort andquality of life. On the other side it consumes significant amounts of en-ergy. Thanks to the effect of scale, even a small unit reduction of a powerefficiency yields the significant energy and cost savings. Unfortunately,planning a highly optimized lighting installation is a task of the highcomplexity, due to a huge number of variants to be checked. In such cir-cumstances it becomes necessary to use a formal model, applicable forautomated bulk processing, which allows finding the best setup or esti-mating resultant installation power in an acceptable time, i.e., in hoursrather than days. This paper introduces such a formal model relyingon the similarity and conformity graph concepts. The examples of theirpractical application in outdoor lighting planning are also presented. Ap-plying those structures allows reducing substantially a processing timerequired for planning large scale installations.
Keywords: graph methods · similarity graph · conformity graph · op-timization · complexity
1 Introduction
The growing civilization needs require making decisions quickly. Additionally,such choices should be based on the real data. In many cases, however, it isnot possible to obtain those data on demand. In such situations the lackinginformation is estimated by human’s intuition or expertise. A time pressure andlack of hard data cause our decisions to be influenced by a social environment,short-term needs or opinions of others. As a result, this choice is not optimalin many cases. These problems are referred to as the cognitive traps and theyare discussed in multiple works [1]. The matter becomes more complicated ifdecisions impact the future and when that influence is broad, for example in thescale of a city, region or country. One of such areas is a public lighting whichinfluences not only a quality of life and safety of people but also the energybalances of municipalities. We can observe a growing power consumption, whichis caused, among others, by the increasing use of light [8, 5, 20]. This also meansthat the percentage of electric energy we use for public lighting has a significantshare in the overall volume of greenhouse gases being produced [16].
ICCS Camera Ready Version 2021To cite this paper please use the final published version:
DOI: 10.1007/978-3-030-77970-2_12
2 A. Basiura et al.
The use of efficient LED (light-emitting diode) light sources gives a powerusage reduction of the order of 40 - 60% [11], compared to the high-intensitydischarge (sodium) lamps. The right choice of optimal installation parameters,however, can result in a much greater, spectacular reduction reaching up to 80%[15, 16]. Those savings can play a key role in terms of the further investments.In the case of medium sized cities, the cost of electricity for lighting often ex-ceeds 1 million euro which gives AC 2,000 of annual savings, at this rate of powerreduction. This budget can be used for financing other related works. For thatreason it seems reasonable to carry out a citywide investment to maximize thesavings which can cover either some further works in other areas or a currentinvestment, when made in the ESCO (energy service company) financing model.It is therefore crucial to assess very quickly the cost of an investment itself andthe potential rate of return. Unfortunately, preparing all required photometricprojects and thus estimating investment costs is often a long-term process bur-dened with additional costs. Analysis of investments that have taken a place inthe city of Cracow, Poland, in recent years, shows that the time of preparationof a single photometric project for 3,741 lighting points takes 3-10 weeks. Byextrapolating it to the total number of city lights in Cracow (approx. 70,000) wecan estimate the time required for financial analysis of a citywide investment atthe level of at least 56 weeks of continuous (24/7) calculations, which is over theyear. In the real life cases such times are utterly unacceptable.
It is neither possible to point precisely which city area should be the sub-ject to a planned investment and in what order, nor to select the scope of amodernization (e.g., only fixtures and arms are replaced, while poles remainedunchanged). Usually an estimation is made on the basis of available fixture pow-ers, which is not the best approach in many cases. It is crucial to develop someindirect methods allowing to estimate as quick as possible, expected outlays andthe return on investment (ROI). This paper introduces concepts of similarityand conformity graphs, which can be used to estimate investment risk and forsuch a quick estimation.
The paper is organized as follows. In the next section the state of the artis presented. In Section 3 the notions of a base graph (3.1), similarity graph(3.2) and conformity graph (3.3) are introduced. The case study demonstratingapplication of proposed models to a real-life case, is presented and discussed inSection 4. The final section contains conclusions and proposed directions of thefurther research.
2 State of the art
Creating optimized, energy-efficient lighting installations was considered in nu-merous scientific works. One can distinguish two approaches: the first is focusedon optimization of an installation parameters (e.g., fixture model, pole height) [4,9, 10, 12–14, 17, 19], while the second one is based on lighting control tuning, i.e.adapting lighting levels to the varying conditions such as traffic flow intensity orweather conditions [2, 3, 21–23]. The main criterion is a final installation power.
ICCS Camera Ready Version 2021To cite this paper please use the final published version:
DOI: 10.1007/978-3-030-77970-2_12
Similarity and Conformity Graphs in Lighting Optimization and Assessment 3
The critical issue of such an optimization, however, is the time required for com-pleting such a project (due to related computational complexity). Also practicalmethods used for its completion are revealed rarely.
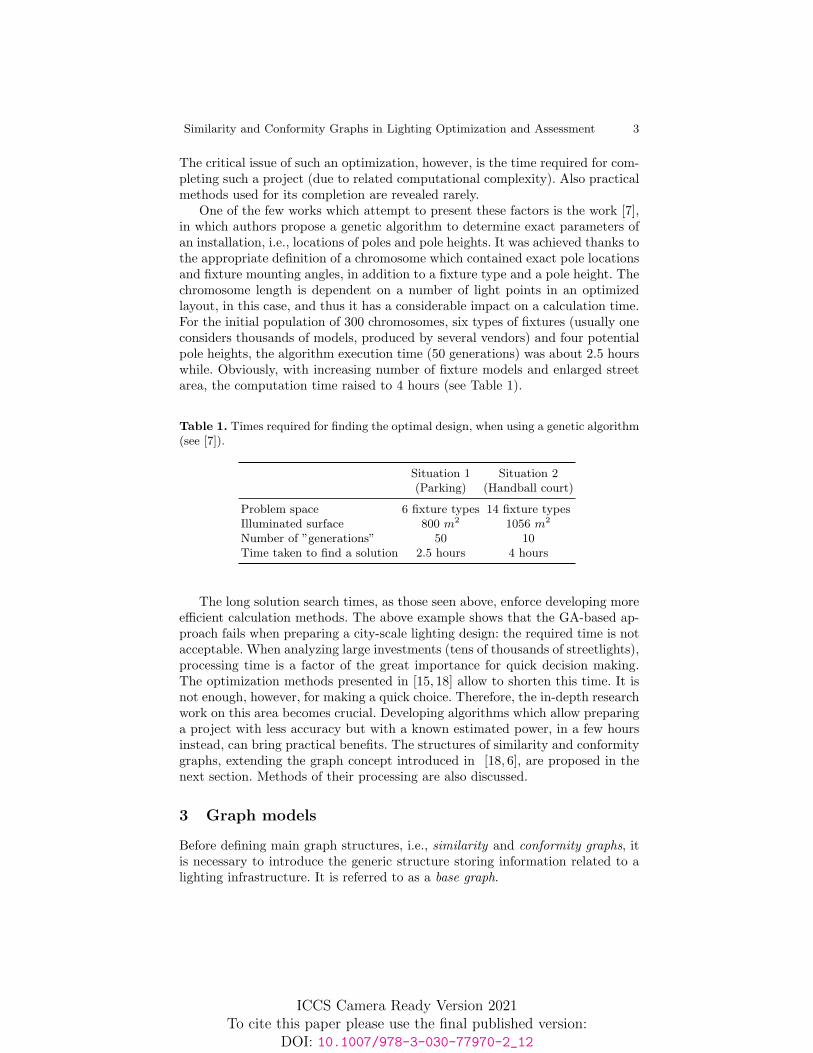
One of the few works which attempt to present these factors is the work [7],in which authors propose a genetic algorithm to determine exact parameters ofan installation, i.e., locations of poles and pole heights. It was achieved thanks tothe appropriate definition of a chromosome which contained exact pole locationsand fixture mounting angles, in addition to a fixture type and a pole height. Thechromosome length is dependent on a number of light points in an optimizedlayout, in this case, and thus it has a considerable impact on a calculation time.For the initial population of 300 chromosomes, six types of fixtures (usually oneconsiders thousands of models, produced by several vendors) and four potentialpole heights, the algorithm execution time (50 generations) was about 2.5 hourswhile. Obviously, with increasing number of fixture models and enlarged streetarea, the computation time raised to 4 hours (see Table 1).
Table 1. Times required for finding the optimal design, when using a genetic algorithm(see [7]).
Situation 1 Situation 2(Parking) (Handball court)
Problem space 6 fixture types 14 fixture typesIlluminated surface 800 m2 1056 m2
Number of ”generations” 50 10Time taken to find a solution 2.5 hours 4 hours
The long solution search times, as those seen above, enforce developing moreefficient calculation methods. The above example shows that the GA-based ap-proach fails when preparing a city-scale lighting design: the required time is notacceptable. When analyzing large investments (tens of thousands of streetlights),processing time is a factor of the great importance for quick decision making.The optimization methods presented in [15, 18] allow to shorten this time. It isnot enough, however, for making a quick choice. Therefore, the in-depth researchwork on this area becomes crucial. Developing algorithms which allow preparinga project with less accuracy but with a known estimated power, in a few hoursinstead, can bring practical benefits. The structures of similarity and conformitygraphs, extending the graph concept introduced in [18, 6], are proposed in thenext section. Methods of their processing are also discussed.
3 Graph models
Before defining main graph structures, i.e., similarity and conformity graphs, itis necessary to introduce the generic structure storing information related to alighting infrastructure. It is referred to as a base graph.
ICCS Camera Ready Version 2021To cite this paper please use the final published version:
DOI: 10.1007/978-3-030-77970-2_12

4 A. Basiura et al.
3.1 Base Graph
Definition 1. Base graph (abbrev. BG) is a graph of the form:
G = (V,E,Σ, Γ, type, attr),
where:
– V is a finite, non-empty set of graph nodes,– E is a finite set of edges,– Σ is a set of node types,– Γ is a set of edge types, where Σ ∩ Γ = ∅,– type : V ∪E → Σ∪Γ is a function that returns the type of a given node/edge:type(V ) = Σ, type(E) = Γ ,
– attr is a function that returns a set of attribute types for a given node/edgetype.
In order to represent a lighting installation the following types, shown inTable 2, are ascribed to vertices of an infrastructure BG. Each node can be
Table 2. Exemplary node types (elements of the Σ set) of an infrastructure graph
Physical entity Node type Description
Street/area U Type representing the illuminated regionSegment S Street subarea (when street geometry varies)
Lighting point L Street luminaireFixture Type F Fixture
Pole P Luminaire’s poleArm R Luminaire’s arm
incident with an edge of a type from Γ which represents a relationship betweentwo nodes. For instance B - ”belongs to”, ”illuminates”, ”depends on” etc.
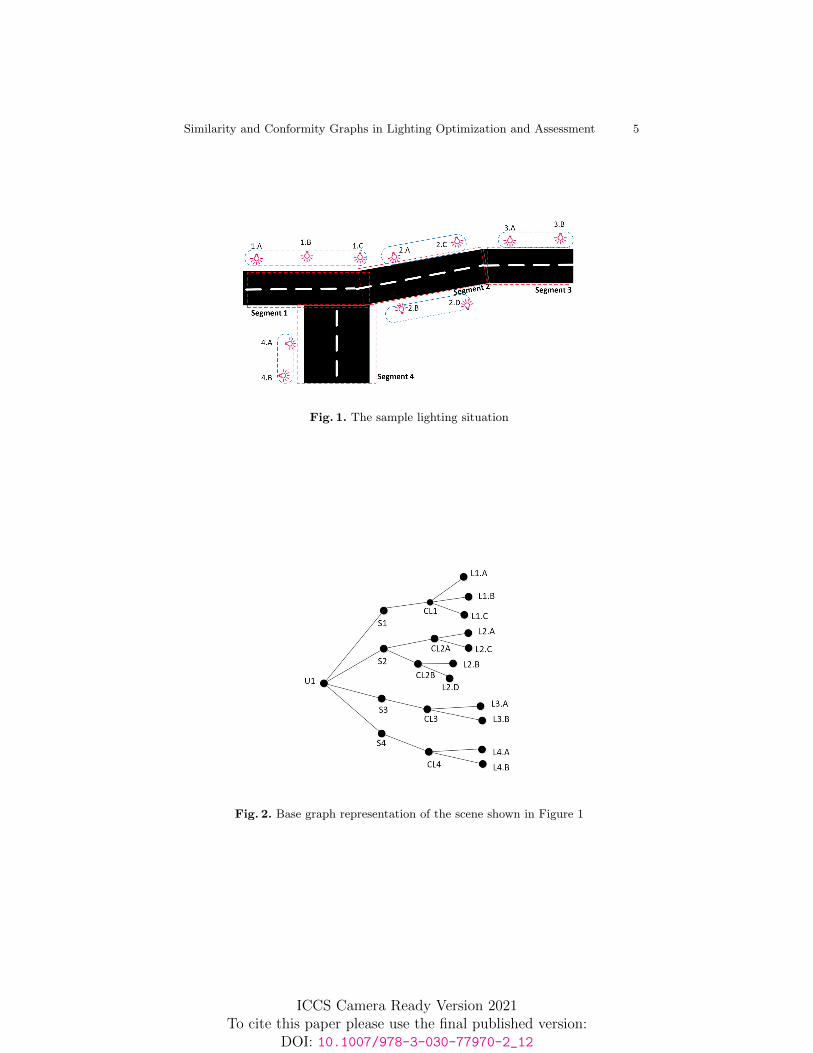
Example. The example of a scene consisting of a street and its lighting infras-tructure, is shown in Figure 1. It is compound of four street segments (S1, S2,S3, S4) having a common layout but different lighting installations, in terms ofgeometry properties. Each segment is assigned with at least one group of lamps(CL1, CL2A, CL2B, CL3, CL4). Those groups are the subject to optimization.The entire scene is represented by the base graph shown in Figure 2. To improvethe readability we neglected edge labels on that.
As shown in Figure 1 segments S1 and S3 are very similar not only in terms ofthe street geometry but also due to the similar lighting installation layouts (e.g.,nearly identical lamp spacings). Thus an optimal setup found for the installation{1.A, 1.B, 1.C} would be applicable to {3.A, 3.B} as well. There arises a questionhow to assess whether two lighting situations are similar to each other and how to
ICCS Camera Ready Version 2021To cite this paper please use the final published version:
DOI: 10.1007/978-3-030-77970-2_12
Similarity and Conformity Graphs in Lighting Optimization and Assessment 5
Fig. 1. The sample lighting situation
Fig. 2. Base graph representation of the scene shown in Figure 1
ICCS Camera Ready Version 2021To cite this paper please use the final published version:
DOI: 10.1007/978-3-030-77970-2_12

6 A. Basiura et al.
quantify this similarity. In other words: does there exist any metrics, in the spaceof base graphs, which would be applicable for lighting situation comparison.
The answer to this question is affirmative. In the next subsections we intro-duce the notion of a similarity graph.
3.2 Similarity graph
A similarity graph is a base graph which contains edges of a specific type, K ∈ Γ ,referred to as similarity edges, connecting nodes of the same type (say, two S-type nodes), with an attributing function attr, such that attr(K) = g ∈ DΣ ,where D = {f |f : V ×V −→ [0, 1]∧f(x, y) = f(y, x)} is a set of functions whichquantify similarity of node attribute values.
Example. Let us consider the following example to clarify this idea. Supposee = {u, v} ∈ E, type(e) = K and type(u) = type(v) = S with a road widthW ∈ attr(S). As said, a type of the edge e is K and its attribute value is afunction f which for two vertices of the same type, being endpoints of e (here: uand v) returns a number between 0 (no similarity between u and v) and 1 (fullsimilarity between u and v). If a considered attribute is a road width, W , forthe segment type (S) then f can be defined as:
f(u, v) = e−|wu−wv|,
where wu, wv denote segment widths for u and v respectively.It should be emphasized that the form of an f function strongly depends
on a context. Even for a single object type, e.g., S, it can have various forms,dependently on an attribute which is actually considered. In particular, one canapply f ∈ D which depends on several attributes of a node, say road width,number of lanes, surface properties and average daily traffic flow.
The formal definition of a similarity graph is given below:
Definition 2. Similarity graph (abbrev. SG) is a base graph such that thereexists K ∈ Γ and
1. e = {u, v} ∈ E ⊆ P2(V ) ∧ type(e) = K =⇒ type(u) = type(v),2. attr(K) = g ∈ DΣ, where D = {f |f : V × V −→ [0, 1] ∧ f(x, y) = f(y, x)}.
An edge e satisfying 1 is referred to as a similarity edge. P2(V ) denotes all twoelement subsets of 2V and V,E,Σ, Γ, type, attr were defined in Definition 1.
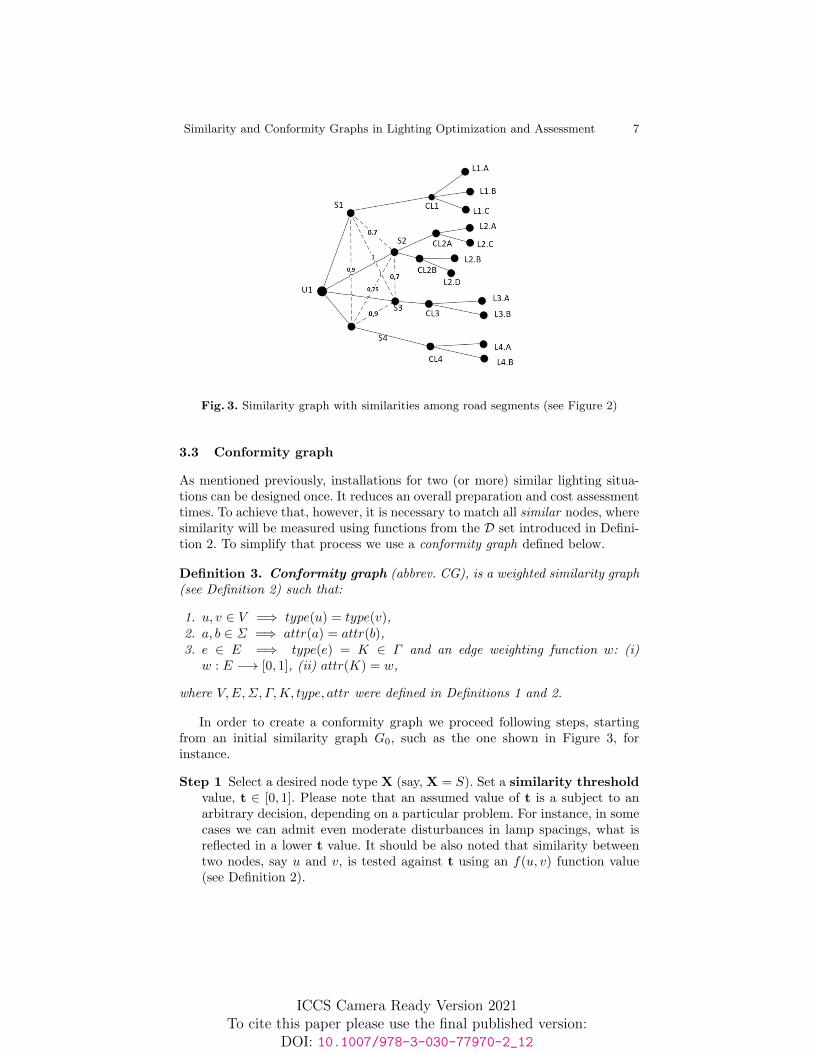
A sample similarity graph for the representation shown in Figure 2 is pre-sented in Figure 3. The values of some exemplary function f are marked along-side similarity edges (dashed lines). Only similarity edges connecting nodes ofthe type S are considered here.
ICCS Camera Ready Version 2021To cite this paper please use the final published version:
DOI: 10.1007/978-3-030-77970-2_12
Similarity and Conformity Graphs in Lighting Optimization and Assessment 7
Fig. 3. Similarity graph with similarities among road segments (see Figure 2)
3.3 Conformity graph
As mentioned previously, installations for two (or more) similar lighting situa-tions can be designed once. It reduces an overall preparation and cost assessmenttimes. To achieve that, however, it is necessary to match all similar nodes, wheresimilarity will be measured using functions from the D set introduced in Defini-tion 2. To simplify that process we use a conformity graph defined below.
Definition 3. Conformity graph (abbrev. CG), is a weighted similarity graph(see Definition 2) such that:
1. u, v ∈ V =⇒ type(u) = type(v),2. a, b ∈ Σ =⇒ attr(a) = attr(b),3. e ∈ E =⇒ type(e) = K ∈ Γ and an edge weighting function w: (i)
w : E −→ [0, 1], (ii) attr(K) = w,
where V,E,Σ, Γ,K, type, attr were defined in Definitions 1 and 2.
In order to create a conformity graph we proceed following steps, startingfrom an initial similarity graph G0, such as the one shown in Figure 3, forinstance.
Step 1 Select a desired node type X (say, X = S). Set a similarity thresholdvalue, t ∈ [0, 1]. Please note that an assumed value of t is a subject to anarbitrary decision, depending on a particular problem. For instance, in somecases we can admit even moderate disturbances in lamp spacings, what isreflected in a lower t value. It should be also noted that similarity betweentwo nodes, say u and v, is tested against t using an f(u, v) function value(see Definition 2).
ICCS Camera Ready Version 2021To cite this paper please use the final published version:
DOI: 10.1007/978-3-030-77970-2_12
8 A. Basiura et al.
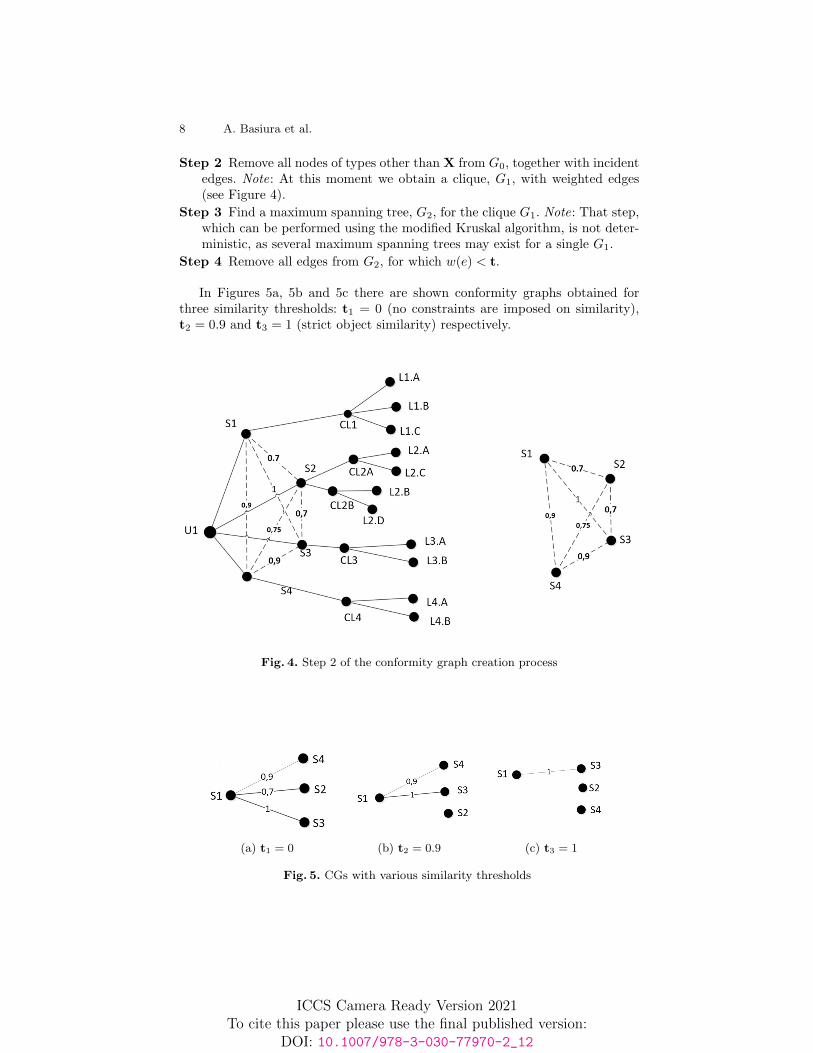
Step 2 Remove all nodes of types other than X from G0, together with incidentedges. Note: At this moment we obtain a clique, G1, with weighted edges(see Figure 4).
Step 3 Find a maximum spanning tree, G2, for the clique G1. Note: That step,which can be performed using the modified Kruskal algorithm, is not deter-ministic, as several maximum spanning trees may exist for a single G1.
Step 4 Remove all edges from G2, for which w(e) < t.
In Figures 5a, 5b and 5c there are shown conformity graphs obtained forthree similarity thresholds: t1 = 0 (no constraints are imposed on similarity),t2 = 0.9 and t3 = 1 (strict object similarity) respectively.
Fig. 4. Step 2 of the conformity graph creation process
(a) t1 = 0 (b) t2 = 0.9 (c) t3 = 1
Fig. 5. CGs with various similarity thresholds
ICCS Camera Ready Version 2021To cite this paper please use the final published version:
DOI: 10.1007/978-3-030-77970-2_12
Similarity and Conformity Graphs in Lighting Optimization and Assessment 9
In the first of the above cases there are no limitations regarding similarityamong segments. This implies that a lighting installation setup found for thesegment S1 will be replicated to installations assigned to all other segments,namely, S2, S3, S4. Obviously, it may cause potential over- or under-lighting.The intermediate scenario, t2 = 0.9, represent the situation of the controlledreplication of solutions among particular segments. The general rule is that re-ducing similarity threshold affects a confidence to the replicated solution qualitybut a benefit is the reduced preparation time. The trade-off between both deter-mines a value of t. In turn, the other extreme case, t3 = 1, reflects the situationwhen we reuse existing solution if and only if there is a full conformity betweentwo lighting situations (identical street geometries, lamp spacings, pole heightsetc.). Although it does not allow to reduce significantly a computation time, un-less there are multiple uniform lighting situations, it is guaranteed that solutionscan be safely replicated among connected nodes.
4 Case study
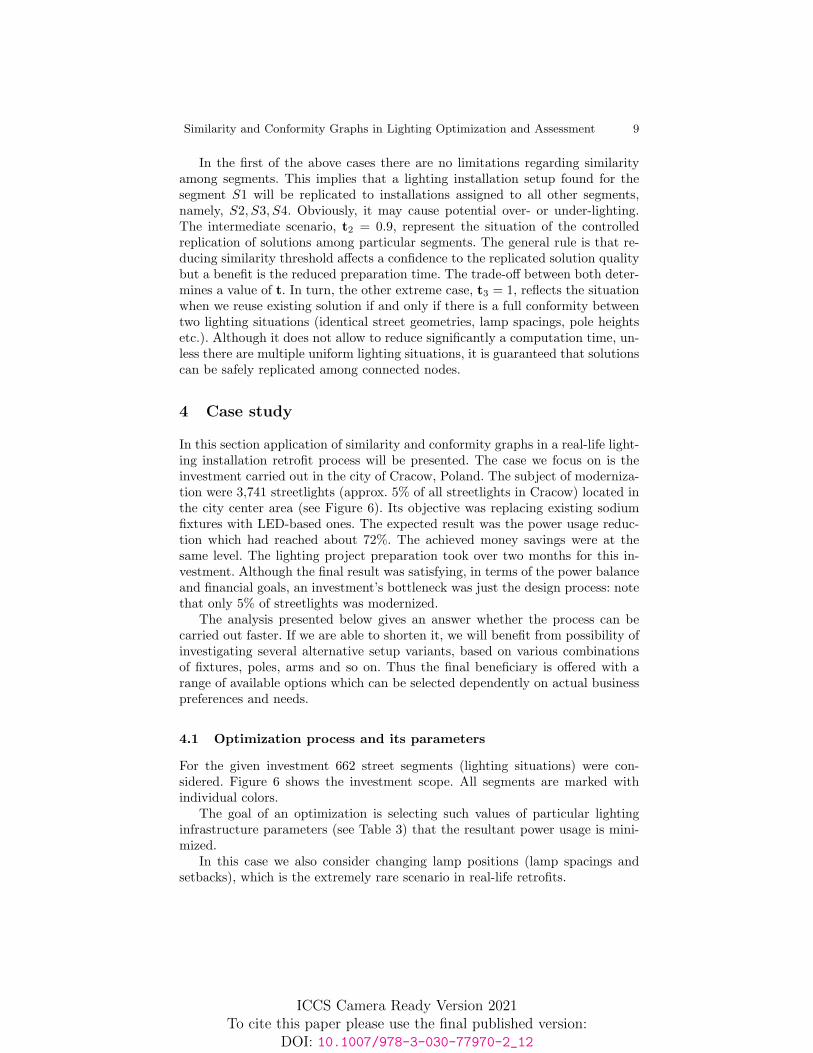
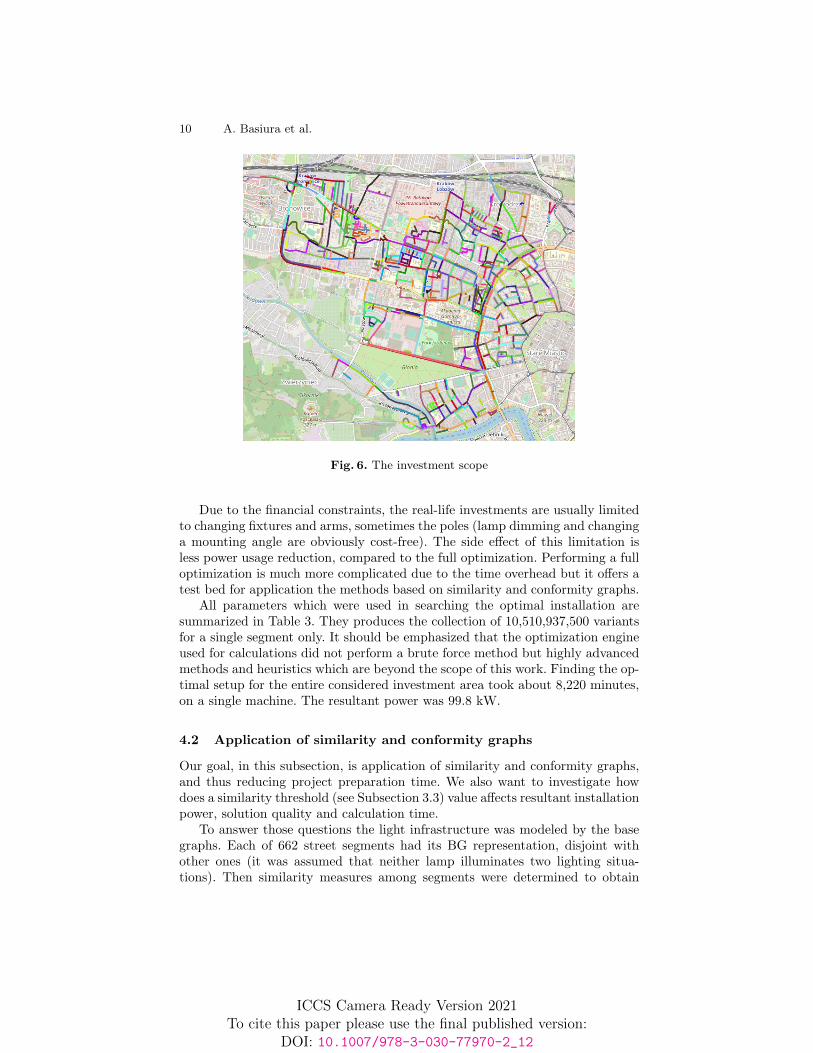
In this section application of similarity and conformity graphs in a real-life light-ing installation retrofit process will be presented. The case we focus on is theinvestment carried out in the city of Cracow, Poland. The subject of moderniza-tion were 3,741 streetlights (approx. 5% of all streetlights in Cracow) located inthe city center area (see Figure 6). Its objective was replacing existing sodiumfixtures with LED-based ones. The expected result was the power usage reduc-tion which had reached about 72%. The achieved money savings were at thesame level. The lighting project preparation took over two months for this in-vestment. Although the final result was satisfying, in terms of the power balanceand financial goals, an investment’s bottleneck was just the design process: notethat only 5% of streetlights was modernized.
The analysis presented below gives an answer whether the process can becarried out faster. If we are able to shorten it, we will benefit from possibility ofinvestigating several alternative setup variants, based on various combinationsof fixtures, poles, arms and so on. Thus the final beneficiary is offered with arange of available options which can be selected dependently on actual businesspreferences and needs.
4.1 Optimization process and its parameters
For the given investment 662 street segments (lighting situations) were con-sidered. Figure 6 shows the investment scope. All segments are marked withindividual colors.
The goal of an optimization is selecting such values of particular lightinginfrastructure parameters (see Table 3) that the resultant power usage is mini-mized.
In this case we also consider changing lamp positions (lamp spacings andsetbacks), which is the extremely rare scenario in real-life retrofits.
ICCS Camera Ready Version 2021To cite this paper please use the final published version:
DOI: 10.1007/978-3-030-77970-2_12
10 A. Basiura et al.
Fig. 6. The investment scope
Due to the financial constraints, the real-life investments are usually limitedto changing fixtures and arms, sometimes the poles (lamp dimming and changinga mounting angle are obviously cost-free). The side effect of this limitation isless power usage reduction, compared to the full optimization. Performing a fulloptimization is much more complicated due to the time overhead but it offers atest bed for application the methods based on similarity and conformity graphs.
All parameters which were used in searching the optimal installation aresummarized in Table 3. They produces the collection of 10,510,937,500 variantsfor a single segment only. It should be emphasized that the optimization engineused for calculations did not perform a brute force method but highly advancedmethods and heuristics which are beyond the scope of this work. Finding the op-timal setup for the entire considered investment area took about 8,220 minutes,on a single machine. The resultant power was 99.8 kW.
4.2 Application of similarity and conformity graphs
Our goal, in this subsection, is application of similarity and conformity graphs,and thus reducing project preparation time. We also want to investigate howdoes a similarity threshold (see Subsection 3.3) value affects resultant installationpower, solution quality and calculation time.
To answer those questions the light infrastructure was modeled by the basegraphs. Each of 662 street segments had its BG representation, disjoint withother ones (it was assumed that neither lamp illuminates two lighting situa-tions). Then similarity measures among segments were determined to obtain
ICCS Camera Ready Version 2021To cite this paper please use the final published version:
DOI: 10.1007/978-3-030-77970-2_12
Similarity and Conformity Graphs in Lighting Optimization and Assessment 11
Table 3. Optimization parameters
From To Step Number
Luminous flux dimming 1% 100% 1% 100Fixture mounting angle 0◦ 30◦ 1◦ 31Arm length 0 m 2 m 0.5 m 5Lamp setback 0 m 2 m 0.5 m 5Mounting height 6 m 12 m 1m 7Lamp spacing 30 m 60 m 1 m 31Fixtures types n/a n/a n/a 625
corresponding similarity graph. Such a SG was ready to generate CGs for sub-sequent threshold values between 0.50 and 1.00 (including).
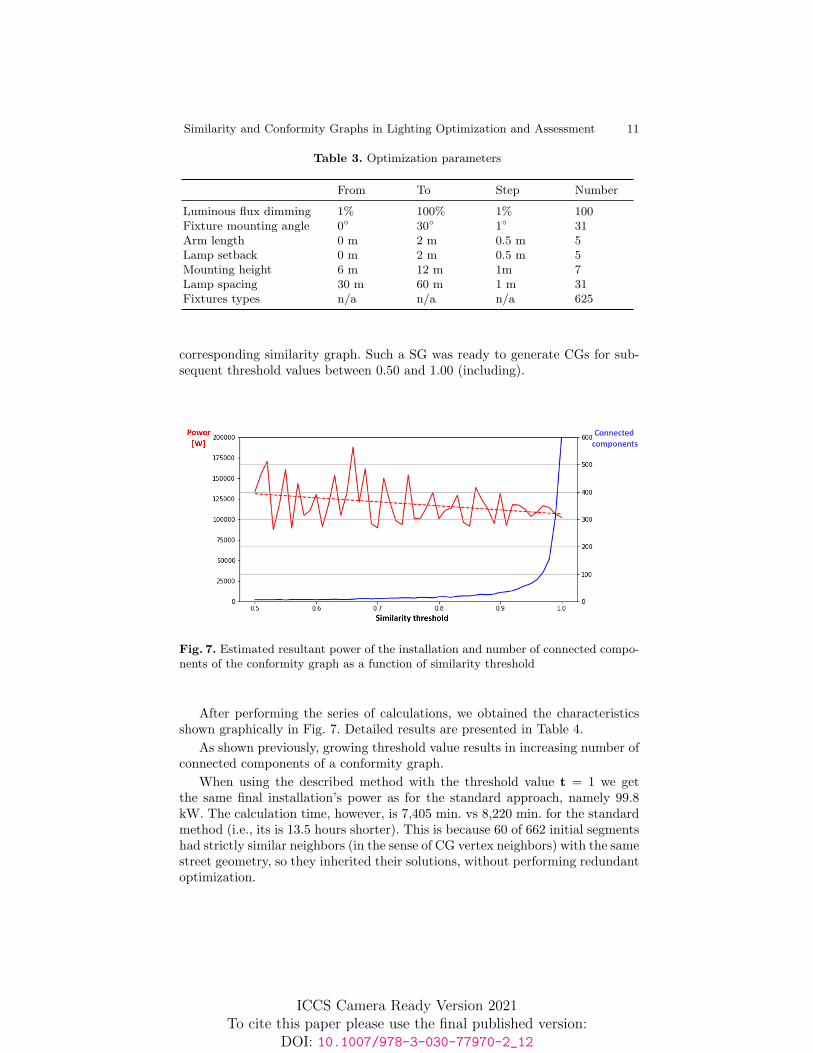
Fig. 7. Estimated resultant power of the installation and number of connected compo-nents of the conformity graph as a function of similarity threshold
After performing the series of calculations, we obtained the characteristicsshown graphically in Fig. 7. Detailed results are presented in Table 4.
As shown previously, growing threshold value results in increasing number ofconnected components of a conformity graph.
When using the described method with the threshold value t = 1 we getthe same final installation’s power as for the standard approach, namely 99.8kW. The calculation time, however, is 7,405 min. vs 8,220 min. for the standardmethod (i.e., its is 13.5 hours shorter). This is because 60 of 662 initial segmentshad strictly similar neighbors (in the sense of CG vertex neighbors) with the samestreet geometry, so they inherited their solutions, without performing redundantoptimization.
ICCS Camera Ready Version 2021To cite this paper please use the final published version:
DOI: 10.1007/978-3-030-77970-2_12
12 A. Basiura et al.
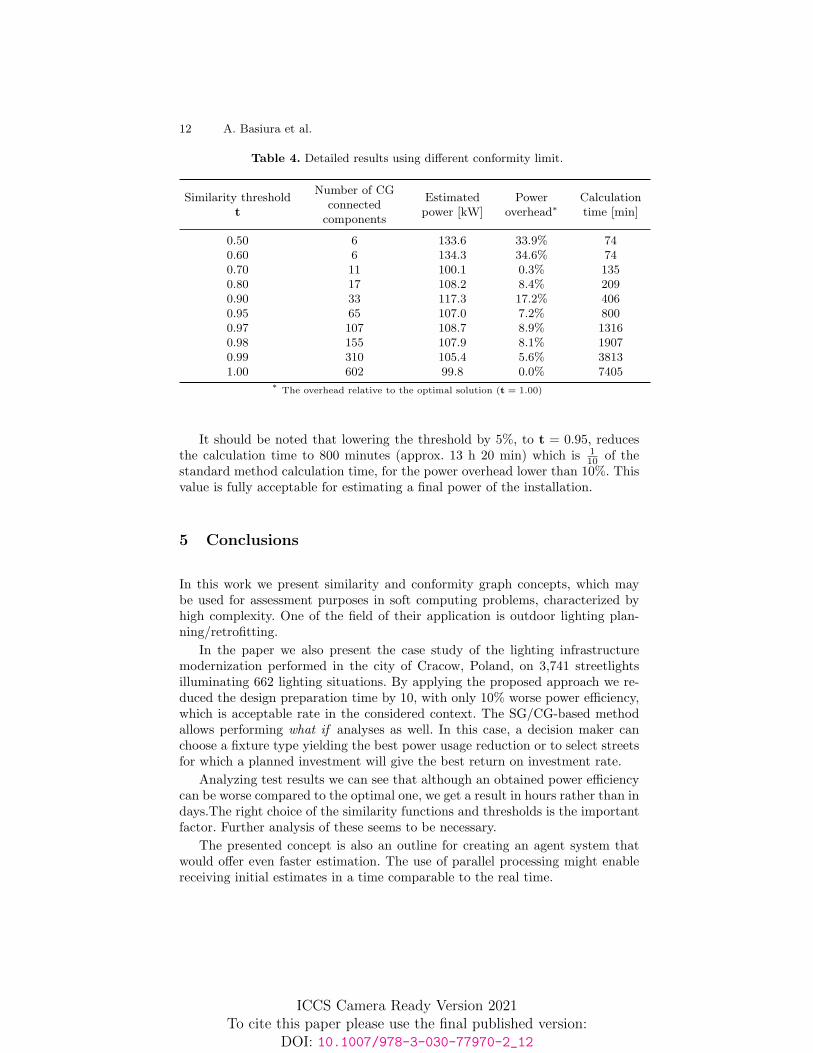
Table 4. Detailed results using different conformity limit.
Similarity thresholdt
Number of CGconnected
components
Estimatedpower [kW]
Poweroverhead∗
Calculationtime [min]
0.50 6 133.6 33.9% 740.60 6 134.3 34.6% 740.70 11 100.1 0.3% 1350.80 17 108.2 8.4% 2090.90 33 117.3 17.2% 4060.95 65 107.0 7.2% 8000.97 107 108.7 8.9% 13160.98 155 107.9 8.1% 19070.99 310 105.4 5.6% 38131.00 602 99.8 0.0% 7405
∗ The overhead relative to the optimal solution (t = 1.00)
It should be noted that lowering the threshold by 5%, to t = 0.95, reducesthe calculation time to 800 minutes (approx. 13 h 20 min) which is 1
10 of thestandard method calculation time, for the power overhead lower than 10%. Thisvalue is fully acceptable for estimating a final power of the installation.
5 Conclusions
In this work we present similarity and conformity graph concepts, which maybe used for assessment purposes in soft computing problems, characterized byhigh complexity. One of the field of their application is outdoor lighting plan-ning/retrofitting.
In the paper we also present the case study of the lighting infrastructuremodernization performed in the city of Cracow, Poland, on 3,741 streetlightsilluminating 662 lighting situations. By applying the proposed approach we re-duced the design preparation time by 10, with only 10% worse power efficiency,which is acceptable rate in the considered context. The SG/CG-based methodallows performing what if analyses as well. In this case, a decision maker canchoose a fixture type yielding the best power usage reduction or to select streetsfor which a planned investment will give the best return on investment rate.
Analyzing test results we can see that although an obtained power efficiencycan be worse compared to the optimal one, we get a result in hours rather than indays.The right choice of the similarity functions and thresholds is the importantfactor. Further analysis of these seems to be necessary.
The presented concept is also an outline for creating an agent system thatwould offer even faster estimation. The use of parallel processing might enablereceiving initial estimates in a time comparable to the real time.
ICCS Camera Ready Version 2021To cite this paper please use the final published version:
DOI: 10.1007/978-3-030-77970-2_12

Similarity and Conformity Graphs in Lighting Optimization and Assessment 13
References
1. Bonini, N., Egidi, M.: Cognitive traps in individual and organizational behav-ior: some empirical evidence, RePEc Revue d economie industrielle (1999) ,https://doi.org/10.3406/rei.1999.1749
2. Escolar, S., Carretero, J., Marinescu, M.C., Chessa, S.: Estimating Energy Savings inSmart Street Lighting by Using an Adaptive Control System”, International Journalof Distributed Sensor Networks (2014) , https://doi.org/10.1155/2014/971587
3. Fujii, Y., Yoshiura, N., Takita, A., Ohta N.: Smart street light system with energysaving function based on the sensor network, International conference on futureenergy systems (e-Energy ’13) (2013)
4. Gómez-Lorente, D., Rabaza, O., Espin Estrella, A., Pena-Garcia, A.:A new method-ology for calculating roadway lighting design based on a multi-objective evolutionaryalgorithm, Expert Systems with Applications, vol. 40, issue 6, pp. 2156 - 2164 (2013)
5. International Energy Agency: Lights Labour’s Lost, Policies for Energy-efficientLighting (2006)
6. Komnata K., Basiura A., Kotulski L.: Graph-Based Street Similarity ComparingMethod, Theory and Applications of Dependable Computer Systems. DepCoS-RELCOMEX (2020), https://doi.org/10.1007/978-3-030-48256-5 36,
7. Lima, GFM., Tavares, J., Peretta, IS., Yamanaka, K., Cardoso, A., Lamounier, E.:Optimization of Lighting Design Usign Genetic Algorithms, IEEEXplore (2010)
8. McKinsey&Company: Lighting the way: perspectives on the global lighting market(2011)
9. Nelson, M.A., Anderson, B.P., Cai, H.: Selection methods and procedure for evalu-ation of LED roadway luminaires, LEUKOS (2017)
10. Pena-Garcıa A. , Gómez-Lorente D., Espın A., Rabaza O., New rules of thumbmaximizing energy efficiency in street lighting with discharge lamps: The generalequations for lighting design, Engineering Optimization, 48, 1080-1089 (2016)
11. PremiumLIGHTPro : LED Basics (2017), http://www.premiumlightpro.eu/ filead-min/user upload/Education/PL-Pro-3-LED Basics-3-Oct-2017.pptx, [Last accessed4 Oct 2020]
12. Rabaza O., Gómez-Lorente D., Perez-Ocón F., Pena-Garcıa A., A simple and ac-curate model for the design of public lighting with energy efficiency functions basedon regression analysis, Energy, 107, 831-842 (2016)
13. Salata, F., Golasi, I., Poliziani, A., Futia, A., Vollaro, E.L., Coppi, M., Vollaro,A.L. Management optimization of the luminous flux regulation of a lighting systemin road tunnels. A first approach to the exertion of predictive control systems,Sustainability, 8 (11), art. no. 1092 DOI: 10.3390/su8111092 (2016)
14. Sędziwy, A.: Sustainable street lighting design supported by hyper-graph basedcomputational model, Sustainability (2016)
15. Sędziwy, A., Basiura, A.: Energy Reduction in Roadway Lighting Achievedwith Novel Design Approach and LEDs, LEUKOS 14(1), 45-51 (2018),https://doi.org/10.1080/15502724.2017.1330155
16. Sędziwy, A., Basiura, A., Wojnicki, I.: Roadway lighting retrofit: environmentaland economic impact of greenhouse gases footprint reduction, Sustainability SpecialIssue: ”Sustainable Lighting and Energy Saving (2018)
17. Sędziwy, A., Kotulski, L.: Graph-based optimization of energy efficiency of streetlighting, ICAISC, LNAI 9120, pp. 515-526, 2015 (2015)
18. Sędziwy, A., Kotulski, L., Basiura, A.: Enhancing Energy Efficiency of AdaptiveLighting Control, Springer, Intelligent Information and Database Systems, 9th AsianConference, ACIIDS (2017)
ICCS Camera Ready Version 2021To cite this paper please use the final published version:
DOI: 10.1007/978-3-030-77970-2_12

14 A. Basiura et al.
19. Sędziwy, A., Kotulski, L., Basiura, A.: Agent Aided Lighting Retrofit Planningfor Large-Scale Lighting Systems, 11th Asian Conference on Intelligent Informationand Database Systems, ACIIDS (2019)
20. Tsao, J.Y., Waide, P.: The World’s Appetite for Light: Empirical Data and TrendsSpanning Three Centuries and Six Continents, LEUKOS 6(4) (2010)
21. Wojnicki, I., Ernst, S., Kotulski, L., Sędziwy, A.: Advanced street lighting control,Expert System (2014)
22. Wojnicki, I., Kotulski, L.: Empirical Study of How Traffic Intensity Detector Pa-rameters Influence Dynamic Street Lighting Energy Consumption: A Case Study inKrakow, Poland, Sustainability (2018)
23. Wojnicki, I., Kotulski, L., Ernst, S., Sedziwy, A., Strug, B.: A Two-Level AgentEnvironment for Intelligent Lighting Control, International Journal of Materials andProduct Technology (2015)
ICCS Camera Ready Version 2021To cite this paper please use the final published version:
DOI: 10.1007/978-3-030-77970-2_12