Embed Size (px)
Citation preview

Simon Miller
Key Environmental
Challenges:
Inconvenient truths & convenient solutions

Earth’s ecosystems
provide goods & services worth $33 trillion per year –
for free!Source: Costanza et al (1997)
About twice the value of global GNP (which is just $18 trillion)

Source: Millennium Ecosystem Assessment 2005 www.millenniumassessment.org
“nearly two thirds of the services provided by nature to human-kind are found to be in decline worldwide”

Year of Peak Fish HarvestHarvest peak
Pre-peak
Post-peak
Source: Millennium Ecosystem Assessment and Sea Around Us project

Year of Peak Fish HarvestHarvest peak
Pre-peak
Post-peak
Source: Millennium Ecosystem Assessment and Sea Around Us project
Year of Peak Fish HarvestHarvest peak
Pre-peak
Post-peak
Source: Millennium Ecosystem Assessment and Sea Around Us project

Source: Global Footprint Network / Best Foot Forward
Humanity’s Ecological Footprint 1961 - 2003
SUSTAINABILITY GAP

How much nature do we have?How much nature do we have?
1.9
1.2
3.8Hectares of bio-productive area per capita(assuming no loss of productivity, incl sea space and allowing for 12% biodiversity)
Source: Sharing Nature’s Interest

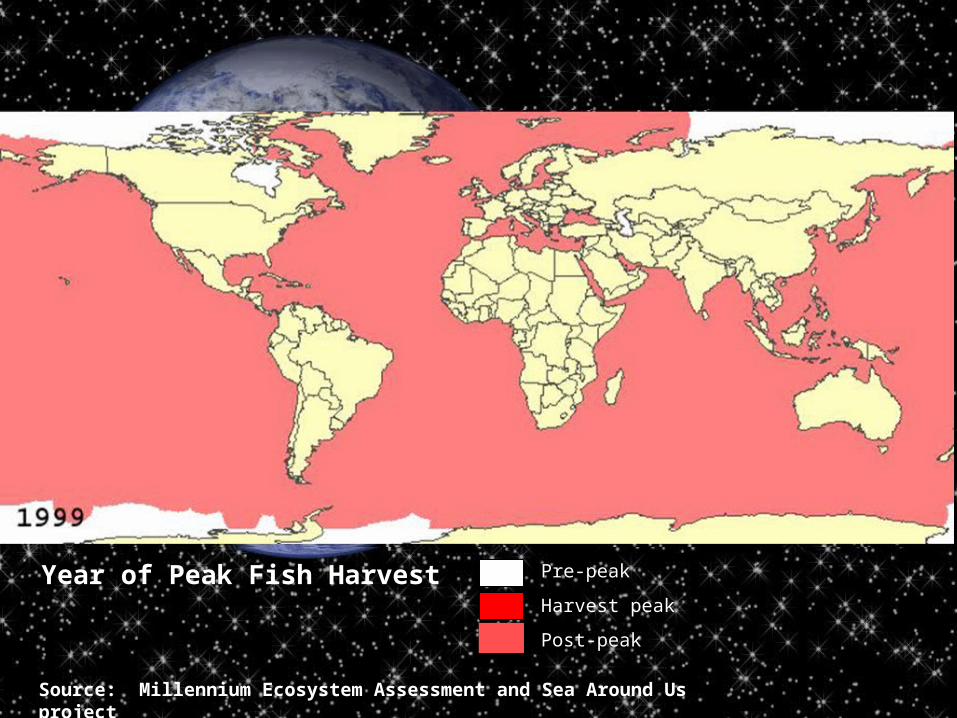
At the moment, we are using 25% more than the Earth can
sustainably provide.Source: Global Footprint Network / Best Foot Forward
Rising to 100% by 2050.
Source: Global Footprint Network / Best Foot Forward

Source: MOSUS project www.mosus.net
Global Use of Resources (1980 - 2002)

Source: Marland, G., T.A. Boden, and R. J. Andres. 2003
Our rising carbon footprint is
of particular concern
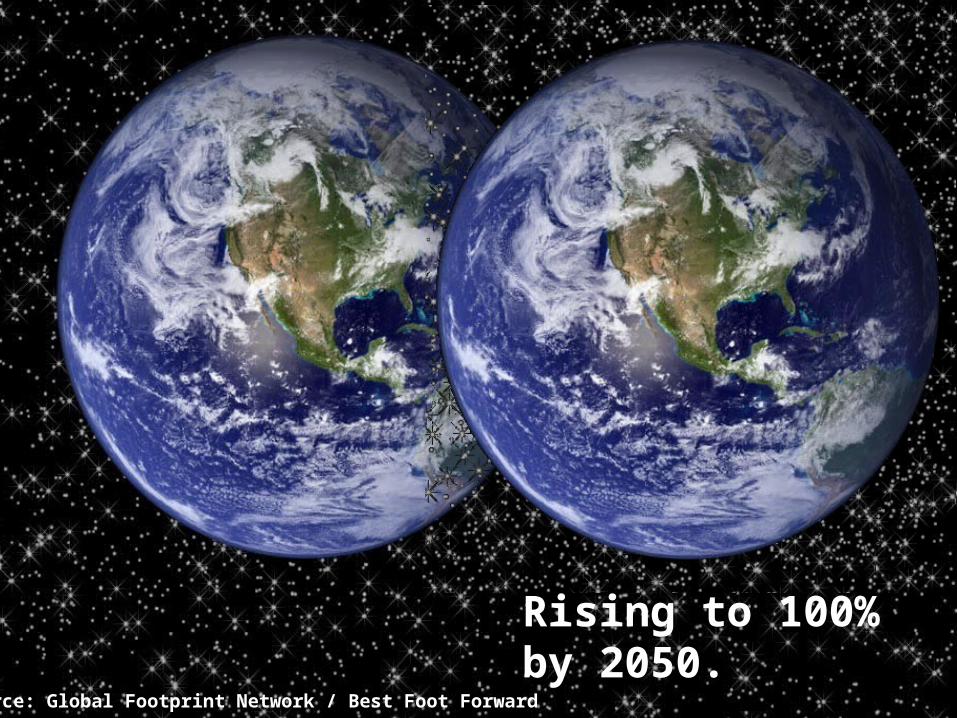
Source: IPCC 4th Assessment report (February 2007)
Change in Temperature, Sea Level &
Northern Hemisphere Snow Cover.
“11 of the last 12 years (1995 -2006) rank among the 12 warmest… since 1850.”

Source: Brooks & Adger (Ambio, In Press)
Global Frequency of Climate-related Disasters
We only have one planetWe only have one planet
• We only have one planet
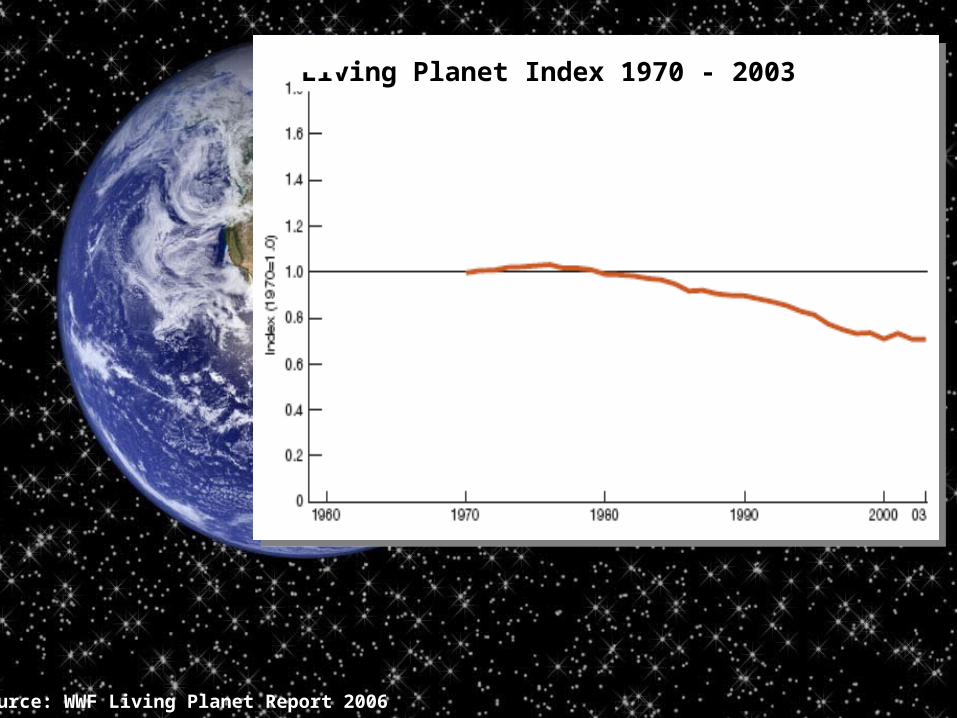
Source: WWF Living Planet Report 2006
Living Planet Index 1970 - 2003

Climate change by degrees
Probably unavoidable(>350 ppm CO2)
Emissions peak 2015 (400ppm CO2)
Emissions peak 2030 (450ppm CO2)
Emissions peak 2050 (550ppm CO2)
Emissions peak > 2050(>650ppm CO2)
Amazon carbon f/b loop
Arctic ice-albedo f/b loop
Siberian methane f/b
Ocean methane hydrate release
Elimination of most life
1°
2°
3°
4°
5°
Source: Lynas (2007) Six Degrees : our future on a hotter planet (figures based on 75% certainty)

Options for stabilisation (450/550ppm CO2e)
Source: Stern Review 2006
“Stabilisation - at whatever level - requires that annual emissions be brought down to the level that balances the Earth’s natural capacity to remove greenhouse gases from the atmosphere. .. This is more than 80% below the absolute level of current annual emissions.”
STOP PRESS:
EU agrees to 20% reductions by 2020
possibly increasing to 30%

Consumption varies considerably by region
Ave
rage
per
cap
ita fo
otpr
int (
gha)
Source: Global Footprint Network / Best Foot Forward

The challenge is to reduce the impact of modern urban living...

…from three or four planets to one. A reduction of 70-80%
in resource use.

Key questions for business:
What is the scale of the change required by each sector?
Where best to intervene in the supply chain?
How to make change happen?

An Example:
The Transport Sector
• Challenges and• Opportunities
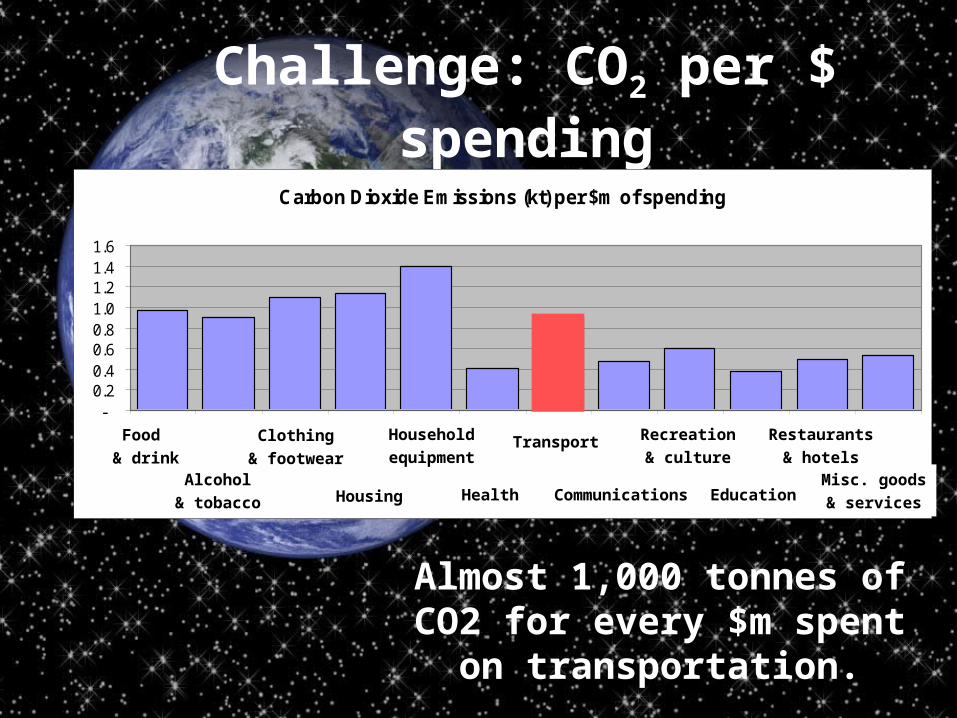
Challenge: CO2 per $ spending
Carbon Dioxide Emissions (kt) per $m of spending
-0.20.40.60.81.01.21.41.6
Almost 1,000 tonnes of CO2 for every $m spent on
transportation.
Food
& drinkAlcohol
& tobacco
Clothing
& footwear
Housing
Household
equipment
Health
Transport
Communications
Recreation
& culture
Education
Restaurants
& hotelsMisc. goods
& services

Challenge: Whole life cycle issues
Source: Best Foot Forward
CO2 emissions from fuel use make
up more than 80% of total.
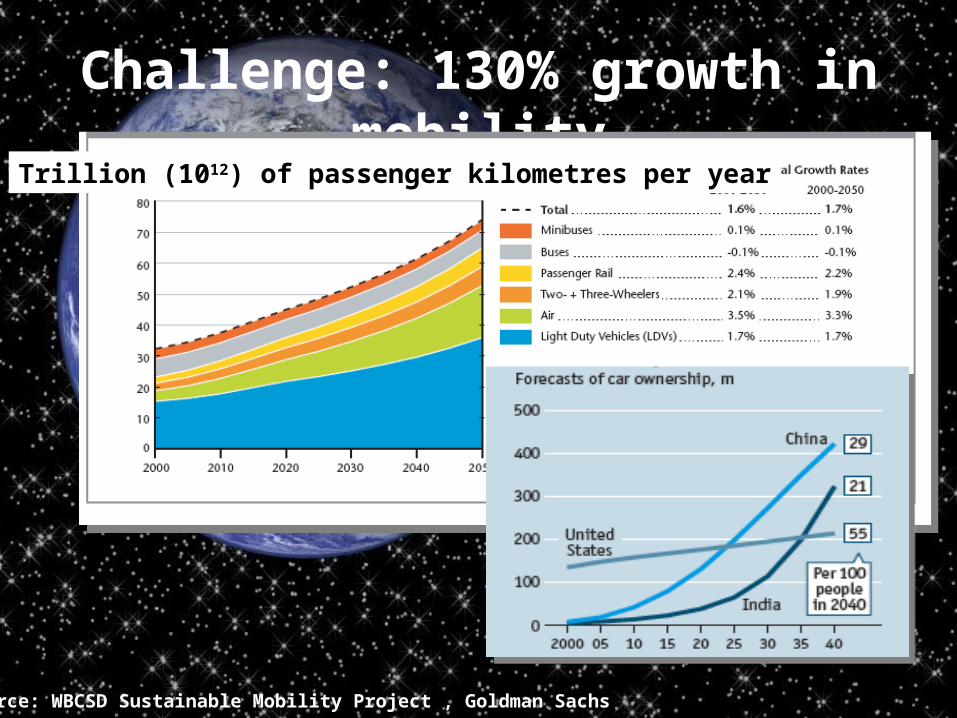
Challenge: 130% growth in mobilityTrillion (1012) of passenger kilometres per year
Source: WBCSD Sustainable Mobility Project , Goldman Sachs

Challenge: 130% CO2 increase
Source: WBCSD Sustainable Mobility Project, Stern Review
Gigatonnes (109) CO2 equivalent emissions per year
“Transport was the fastest growing sector in OECD countries and the second fastest growing sector in non-OECD countries between 1990 and 2002 (emissions increasing by 25% and 36% respectively).”
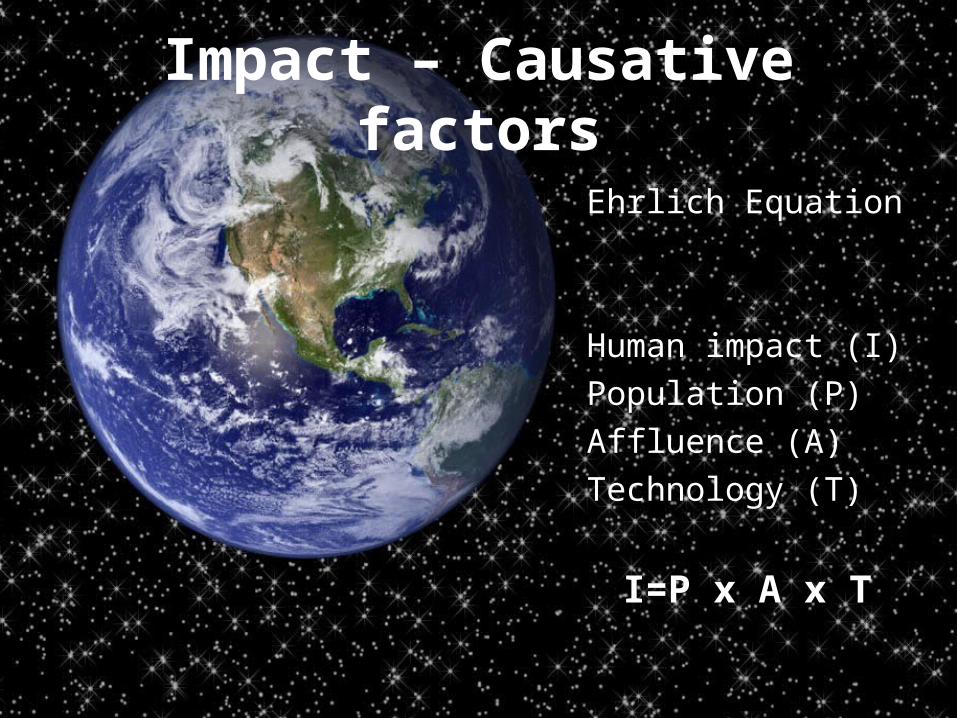
Impact – Causative factors
Ehrlich Equation
Human impact (I)
Population (P)
Affluence (A)
Technology (T)
I=P x A x T

Opportunities…
• Technology
• Modal switch
• Demand management

Technology
0.000
0.250
0.500
0.750
1.000
1.250
0 5 10 15 20 25 30
Different ferry routes
kg
CO
2 p
er
passen
ger
km
Analysis of 25 ferry routes showed 10x difference in efficiency (CO2
per passenger km)Source: Best Foot Forward

Technology
“Emissions rates for midsized cars vary by 50 percent across automobile manufacturers.”
Source: WRI 2003. Note: PSA = Peugeot Citroen, DC = Daimler Chrysler
CO2 intensity of car manufacturer’s profits
(2002)

Modal Switch
Full occupancyCO2 only
0.00
5.00
10.00
15.00
20.00
25.00
30.00
35.00
40.00
45.00
Bristol TempleMeads
Edinburgh Birmingham Leeds Manchester
Leeds Birmingham Manchester Edinburgh Edinburgh
By plane
By car
By train
Full occupancy
CO2 only
0.00
5.00
10.00
15.00
20.00
25.00
30.00
35.00
40.00
45.00
Bristol TempleMeads
Edinburgh Birmingham Leeds Manchester
Leeds Birmingham Manchester Edinburgh Edinburgh
By plane
By car
By train
Comparison of 5 journeys by 3 different modes(kgCO2 per journey - assuming full occupancy)
Modal switches can make more than 3x difference in CO2 emissions
Source: Best Foot Forward. Note: figures do not account for additional climate impact of air travel (x1.9)

Relative energy content of rape crop
Biofuels
Source: Best Foot Forward.
rape seed cakes
rape seed oil
rape straw
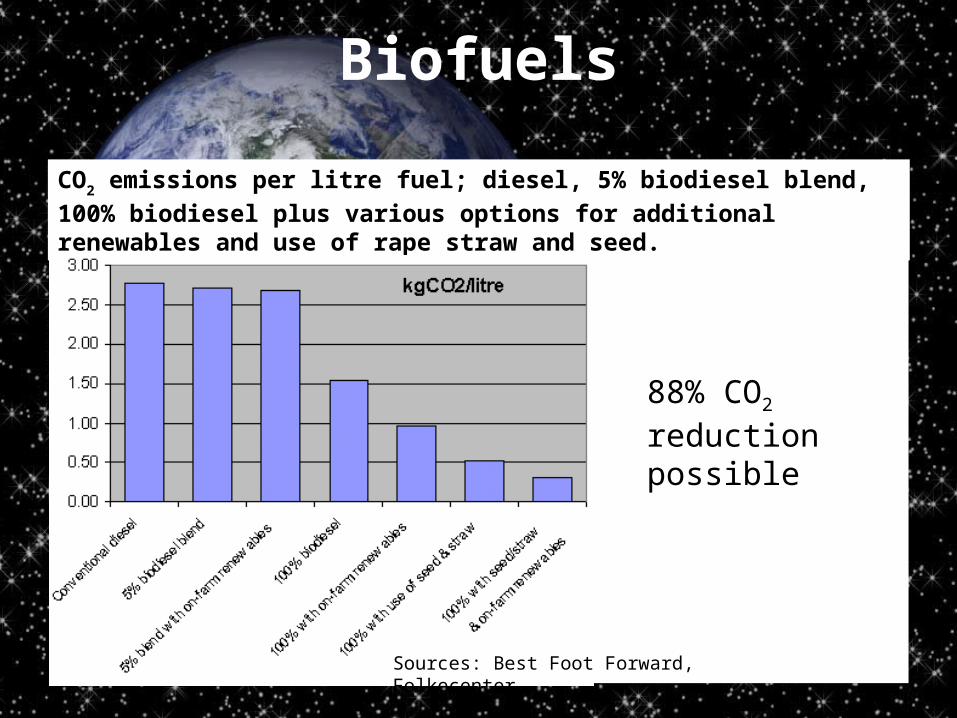
88% CO2 reduction possible
CO2 emissions per litre fuel; diesel, 5% biodiesel blend, 100% biodiesel plus various options for additional renewables and use of rape straw and seed.
Sources: Best Foot Forward, Folkecenter
Biofuels
But is there enough biodiesel?But is there enough biodiesel?
Footprint of biodiesel
production in UK
would far exceed UK
land area

Demand Management
• Companies such as HP and Nortel, that have offered teleworking have seen reductions of up to 10% in emissions from commuting.
• One lift sharing company in the UK estimates that it saves 6 million car-kilometres/year.
• In the UK, 10% of all retail sales are now online (predicted to rise to 40% by 2020)
• NOT making a journey reduces its emissions by 100%!

The Good News: interventions are multiplicative

Questions/challengesWhat CO2 reduction do you think would be
‘fair’ for your business unit?
What are the business implications of operating in a more resource-constrained world?
Could you reduce supply chain CO2 per unit of output by 80% by 2050?
How do you plan to sustainably manage growth?
What combination of demand management, technology & efficiency improvements will work best for you?
Thinking beyond CO2, what plans do you have to reduce your overall ecological footprint?