Embed Size (px)
Citation preview
NBER WORKING PAPER SERIES
SIMPLIFYING CHOICES IN DEFINED CONTRIBUTION RETIREMENT PLANDESIGN
Donald B. KeimOlivia S. Mitchell
Working Paper 21854http://www.nber.org/papers/w21854
NATIONAL BUREAU OF ECONOMIC RESEARCH1050 Massachusetts Avenue
Cambridge, MA 02138January 2016
Research support for the analysis herein was provided by the TIAA-CREF Institute and by the PensionResearch Council/Boettner Center at The Wharton School of the University of Pennsylvania. We aregrateful for expert programming assistance from Louis Yang and Yong Yu, and for suggestions fromTodd Gormley, Alex Michaelides, Jonathan Reuter, and participants at the Insight Summit of the AQRInstitute at the London Business School. Opinions and conclusions expressed herein are solely thoseof the authors and do not represent the opinions or policy of the TIAA-CREF Institute, the NationalBureau of Economic Research, or any institution with which the authors are affiliated. This researchis part of the NBER program on Aging and workshop on Household Finance.
At least one co-author has disclosed a financial relationship of potential relevance for this research.Further information is available online at http://www.nber.org/papers/w21854.ack
NBER working papers are circulated for discussion and comment purposes. They have not been peer-reviewed or been subject to the review by the NBER Board of Directors that accompanies officialNBER publications.
© 2016 by Donald B. Keim and Olivia S. Mitchell. All rights reserved. Short sections of text, not toexceed two paragraphs, may be quoted without explicit permission provided that full credit, including© notice, is given to the source.
Simplifying Choices in Defined Contribution Retirement Plan DesignDonald B. Keim and Olivia S. MitchellNBER Working Paper No. 21854January 2016JEL No. D14,E21,G11,J32
ABSTRACT
In view of the growth and popularity of defined contribution pensions, along with the government’sgrowing attention to retirement plan costs and investment choices provided, it is important to understandhow people select their retirement plan investments. This paper shows how employees in a large firmaltered their fund allocations when the employer streamlined its pension fund menu and deleted nearlyhalf of the offered funds. Using administrative data, we examine the changes in plan participant investmentchoices that resulted from the streamlining and how these changes might affect participants’ eventualretirement wellbeing. We show that streamlined participants’ new allocations exhibited significantlylower within-fund turnover rates and expense ratios, and we estimate this could lead to aggregate savingsfor these participants over a 20-year period of $20.2M, or in excess of $9,400 per participant. Moreover,after the reform, streamlined participants’ portfolios held significantly less equity and exhibited significantlylower risks by way of reduced exposures to most systematic risk factors, compared to their non-streamlinedcounterparts.
Donald B. KeimThe Wharton SchoolFinance DepartmentUniversity of Pennsylvania3620 Locust WalkPhiladelphia, PA [email protected]
Olivia S. MitchellUniversity of PennsylvaniaThe Wharton School3620 Locust Walk, St 3000 SH-DHPhiladelphia, PA 19104-6302and [email protected]
1
Simplifying Choices in Defined Contribution Retirement Plan Design
Working Americans have increasingly relied on employment-based defined contribution
(DC) retirement plans as the more traditional defined benefit (DB) pensions have declined over
the past 50 years.1 A distinguishing feature of DC plans in the U.S. is that participants must decide
how much to contribute and where to invest their retirement assets, instead of holding the employer
responsible for plan investments. Employees make these decisions within the menu of investment
options offered by plan sponsors, and employers often automatically enroll participants into
‘default’ investments if people do not elect an option. Recent research in social psychology has
argued that too many choices may create confusion, resulting in poorly-informed consumer
decisions.
Relatively little is known about how changing the fund lineup can shape employee
investment choices in DC plans.2 We seek to fill this gap using administrative data provided by a
plan sponsor. The information enables us to examine how participants contributed to a menu of
funds and what happened to their fund allocations, along with the costs and risks of the resulting
portfolios, as a result of a firm-wide DC plan streamlining effort. In all, the plan menu in the firm
was reduced considerably, with almost half of the funds deleted from the lineup. This streamlining
process was intended to simplify the fund menu, but it is important to note that the average
characteristics of the menu of offered funds (e.g., expense ratio, within-fund turnover, systematic
1 The US Department of Labor (2014) reports that in 1975, 74% of all participants in private sector plans were covered by DB plans; by 2012, only 6% of participants were in DB pensions. 2 Various researchers have explored other aspects of plan design and participant behavior, including participation, contribution rates, and investment of employer stock; see for instance Choi et al., (2004), Mitchell and Utkus (2006), and Huberman et al. (2007). Additionally, prior analyses describe how participants who are automatically enrolled end up allocating their DC savings (Madrian and Shea, 2001).
2
and idiosyncratic risk) were the same before and after the streamlining. In addition, this
simplification made possible a more coherent categorization or ‘tiering’ of the retained funds.
We examine plan participants’ investment choices prior to and after the streamlining event
and evaluate what happened to participant fund allocations, risk exposure, and costs as a result of
the reform. First, we explore what types of individuals held the deleted funds and how (if at all)
they differed from other participants. Based on participant holdings on June 30, 2012, just before
the changes were announced in July 2012, we define the holders of these deleted funds as the
streamlined participants, and their counterparts as the non-streamlined participants. Second, we
evaluate how streamlined participants responded to the changes, and how they reallocated their
retirement assets after the reform. Third, we show how the streamlining process affected
participants’ portfolio turnover, risk, and expenses.
We find that participants subject to the streamlining proved to be older, more likely to be
male, and higher-income; they also held higher balances in riskier funds and lower balances in
safer balanced/target date funds. Participants holding the deleted funds either (a) reallocated their
money to funds kept in the lineup in advance of the deadline to maintain a similar pre- and post-
streamlining allocation, or (b) were defaulted into Target Date Funds (TDFs) resulting in an
allocation containing, on average, safer assets. Only 9% of the streamlined participants (N=211)
elected the new brokerage window (taking only 0.4% of their assets). Post-streamlining, the
streamlined participants adjusted their portfolio holdings, ending up with fewer funds, significantly
lower within-fund turnover rates, and lower expense ratios. Based on reasonable assumptions,
these portfolio adjustments could lead to potential accumulated savings for these participants over
a 20-year period of $20.2M, or more than $9,400 per participant. Also, after the reform and relative

3
to the non-streamlined participants, streamlined participants’ portfolios generally exhibited lower
diversifiable/idiosyncratic risk and less exposure to systematic/non-diversifiable risk factors.
In what follows, we first offer a brief literature review, followed by a discussion of our data
and descriptive statistics. We then use multivariate regression models to estimate differences in
the changes in portfolio characteristics and risks for participants affected by the streamlining
compared to those who were not, controlling for several participant attributes. We conclude with
thoughts on how a streamlining intervention such as this might shape employees’ eventual
retirement wellbeing.
1. Related Prior Literature
Financial economics suggests that participants in a pension plan should rationally focus on
their own portfolios’ risk-return profiles independent of the number of funds in their pension plan
menu. Yet Benartzi and Thaler (2001) suggested that plan participants actually followed a naïve
diversification approach, investing 1/n of their assets in each of the n funds made available in the
menu. Similarly suboptimal investment decisions were reported by Tang, Mitchell, Mottola, and
Utkus (2010) who showed that even when plan sponsors offered a sufficiently diversified
(efficient) menu of funds, participants regularly selected inadequately-diversified portfolios given
their selected level of risk.
In addition, recent research in social psychology has argued that too many choices can
create confusion and distraction, resulting in poorly-informed consumer decisions (e.g., Iyengar
and Lepper, 2000). In the context of DC fund menus, Iyengar, Huberman, and Jiang (2004) asked
whether such “choice overload” affected participant decisions in the 401(k) environment. They
used a 2001 cross-section of data on 649 DC plans managed by the Vanguard Group to determine
4
whether participation rates were lower in plans when more funds were on the menu. They found
that, for every 10 additional funds on a menu, participation dropped two percent. While most of
the plans examined had 10-30 options, participation rates were actually highest for those with 10
or fewer options.
In a follow-up analysis using the same dataset, Huberman and Jiang (2006) explored fund
investment patterns rather than participation rates. There, conditional on participation, the authors
concluded that (p. 763) “the number of funds used, typically between three and four, is not
sensitive to the number of funds offered by the plans, which ranges from 4 to 59. A participant’s
propensity to allocate contributions to equity funds is not very sensitive to the fraction of equity
funds among offered funds.” They also reported that (p 765) “Once plans offer an abundance of
choices (more than 10 funds), there is no correlation between equity allocation and exposure.”
Ultimately the authors concluded that plan sponsors need not be overly concerned about the length
of the plan menu, as long as a reasonable diversity of options was included.
In a related study, Brown, Liang, and Weisbenner (2007) employed SEC 11-k filings on
891 plans from 1991-2000. The panel nature of their dataset permitted the authors to use fixed-
effect regressions which confirmed that (p. 1995) “the number of equity and bond options in the
401(k) plan is an important predictor of contributions to equity and bond funds, respectively, even
after accounting for firm-level fixed effects.” They also found that, over the time period they
examined, most funds added to 401(k) plans were expensive, actively-managed equity funds,
resulting in higher average portfolio expenses and lower average portfolio performance. They
concluded that (p. 2006) “the choice of investment options to make available in an individual
accounts program is likely to have a first-order effect on the portfolio allocations that individuals
make.”
5
In a more recent study, Morrin, Inman, Broniarczyk, Nenkov, and Reuter (2012) examined
how employees covered by the Oregon University System DC plan altered their behavior when
their plan menu was expanded from 10 to 19 fund choices. Both before and after the expansion,
the default was a money market fund. When the smaller menu was offered, 21% defaulted to the
money fund, while with the larger menu, 34% defaulted. Accordingly, the authors concluded that
offering more funds (p 548) “may be overwhelming for many investors.” Of those who did make
an election, participants selected on average 37% (3.7 funds) of the funds from the 10-fund menu,
and 27% (5.3) from the 19-fund menu. While those results did not support the 1/n heuristic, they
were consistent with perhaps a weaker form of the heuristic whereby increasing the number of
offered funds led participants to hold more funds. Moreover, the authors (p. 547) concluded that it
is sensible for plan sponsors to offer a sufficient variety of choices, but there is a need to “clearly
categorize the options to help the [participants] perceive the set of offerings at a higher, more
abstract level. Partitioning the funds may enhance asset class diversification while not reducing
(and actually increasing) the total number of funds invested in. Subjectively grouping funds by
asset class is more likely to assist novice investors than expert investors in their financial decision
making.”
In sum, research to date has provided mixed conclusions about how the number and mix
of DC fund options influences investment patterns in retirement accounts, and little to no evidence
on how differences in the fund options affect costs and risks of participant portfolios.3 Moreover,
no study has yet examined how participants react to a rather substantial reduction of retirement
plan investment choices. In what follows, we explore these issues with a unique new administrative
3 See also Beshears et al. (2013) who evaluated how a simple saving rate and asset allocation protocol in a DC plan affects the probability of participating and contribution rates conditional on participation; they did not, however, look at asset allocation patterns.
6
dataset that permits us to follow investor behavior before and after a substantial streamlining in
the fund menu and document the effects of the reform on the costs and risks associated with
participants’ portfolios.
2. The Setting
The employer we study is a large US nonprofit institution. Like its peers, it has long offered
a DC structure to cater to participants’ retirement saving needs on a pre-tax basis. Prior to 2013,
the plan included almost 90 mutual funds in the investment menu, ranging from equity to target
date to bond index funds, as well as REIT, commodity, and other sector funds. Cognizant of the
growing literature on choice overload (see references in section 1), the firm’s investment
committee in 2011 determined that a shorter list of offered funds would be easier to administer,
explain, and rationalize, compared to the prior menu.
To this end, the committee streamlined the plan menu and constructed a four-tiered
structure for the remaining funds. Participants who had invested in the funds that would be
eliminated from the menu would be allowed to reallocate their assets and contributions to any other
fund in the menu, and anyone who did not move his assets out of the funds to be deleted would
have his assets automatically transferred to the age-appropriate Target Date Fund (TDF).4
Alternatively, participants who elected to do so could move their assets to a new self-directed
brokerage account within the plan which would give them access to not only the closed funds, but
also thousands of other mutual funds.
4 This was defined as the TDF with the target date closest to the year the participant would attain age 65. Under the Pension Protection Act of 2006, the US Department of Labor permits TDFs as QDIAs (qualified default investment alternatives) that can be used for participants who do not elect their own investment mix.
7
The result was the elimination of 39 funds from the initial lineup, based on the funds’
expense ratios and the number of participants and aggregate amount invested in each fund.5
Remaining funds were allocated across a new four-tier structure, where each successive tier would
afford participants additional choice. Tier 1, selected as the default tier for participants not actively
electing an investment mix, included 13 low-cost Target Date Funds. Additional tiers offered
increasing flexibility of choice for participants seeking to make more customized and sophisticated
allocations. Tier 2 included four indexed funds: Money Market, U.S. Diversified Stocks, U.S.
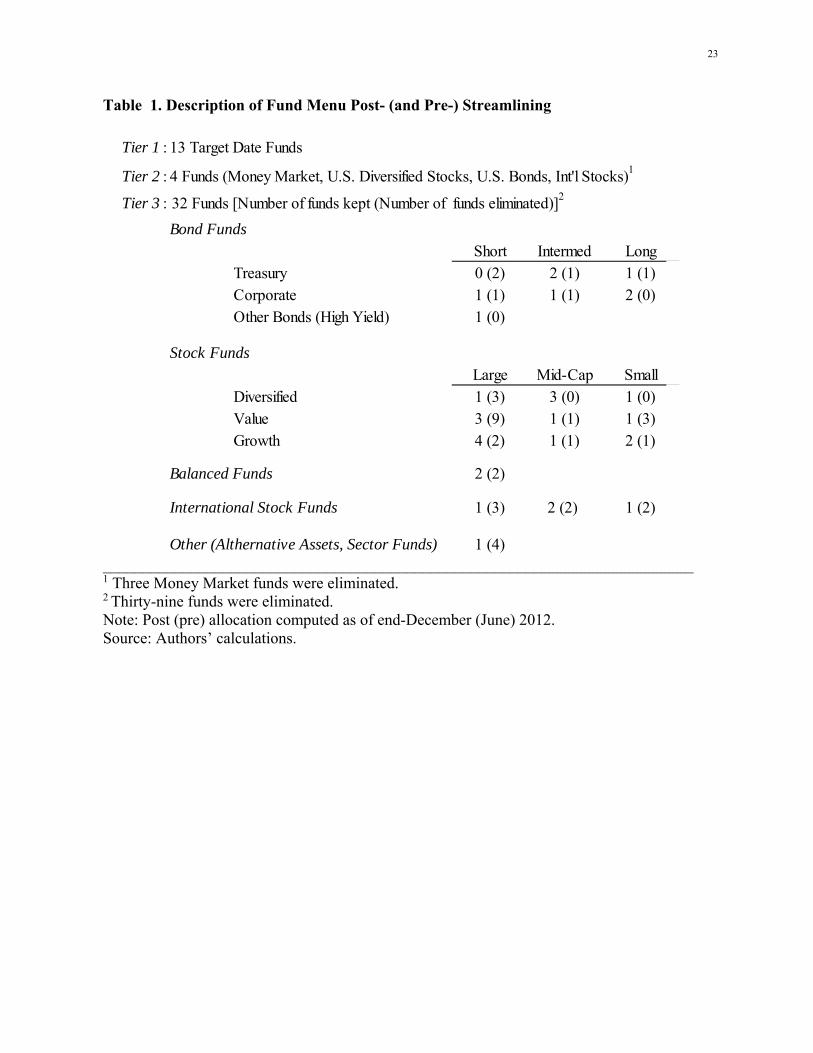
Bonds, and Diversified International Stocks. Tier 3 included 32 funds arranged into separate “risk”
categories illustrated in more detail in Table 1. The range of categories included: small/mid/large-
cap and value/growth stock funds; small/mid/large-cap international stock funds;
short/intermediate/long-maturity and Treasury/corporate bond funds; balanced funds; and a
passive equity REIT fund to provide access to the real estate asset class. Tier 4 constituted the
brokerage account.
[Table 1 here]
The plan sponsor announced its streamlined fund lineup in July 2012, with an
implementation date of mid-October 2012. In addition to a newsletter sent to all participants, the
employer created a custom website, broadcasted online webinars, sent targeted emails, held
participant meetings, and sent hard copy mail to explain the changes.
3. Data and Descriptive Statistics
5 In results not reported here (available on request) we find that the average characteristics of the menu of offered funds (e.g., expense ratios, within-fund turnover rates, and systematic and idiosyncratic risk) were not significantly different before versus after the streamlining.
8
To analyze the change in behavior post- versus pre-streamlining, we obtained access to
information on the retirement plan account balances and periodic contributions of all the (identity-
censored) participants. Our administrative dataset included information on contributions, balances,
and asset allocation prior to the streamlining, defined in our analysis below as end-June 2012, and
after the change, defined as end-December 2012. To this file we appended information from public
sources (via ticker and CUSIP numbers) for each fund’s equity fraction and style (bond, balanced,
stock, etc.), as well as monthly return histories. The fund administrator also provided individual
demographic information on participants’ age, sex, education (highest degree from graduate school
versus less than graduate school), and, from external sources, imputed household income (assigned
according to the participant’s zip codes, where low <$50K, middle $50-100K, and high >$100K).6
Using the participant balance and contribution data, we identify participants whose
holdings were directly affected by the streamlining. Specifically, we separate participants into a
Streamlined group – those participants who held funds at end-April 2012 that were subsequently
deleted due to streamlining – and a Non-Streamlined group. Additionally, we separate the
streamlined participants into two subgroups: “Plan-Defaulted & Streamlined” are the streamlined
participants who took no action after the announced streamlining and were defaulted by the Plan
into an age-appropriate TDF at the October deadline; and “Not-Plan-Defaulted & Streamlined”
are the streamlined participants who exchanged out of the deleted funds prior to the October
deadline.
To illustrate how the reform worked, we begin by reviewing descriptive statistics on the
balances in the retained and deleted funds by risk category, and we also compare key attributes of
6 These were derived from data supplied to the plan administrator from IXI Corporation and derived from zip+4 Census tract information. (See http://www.ixicorp.com/products-and-services/customer-targeting-and-scoring/wealthcomplete/)
9
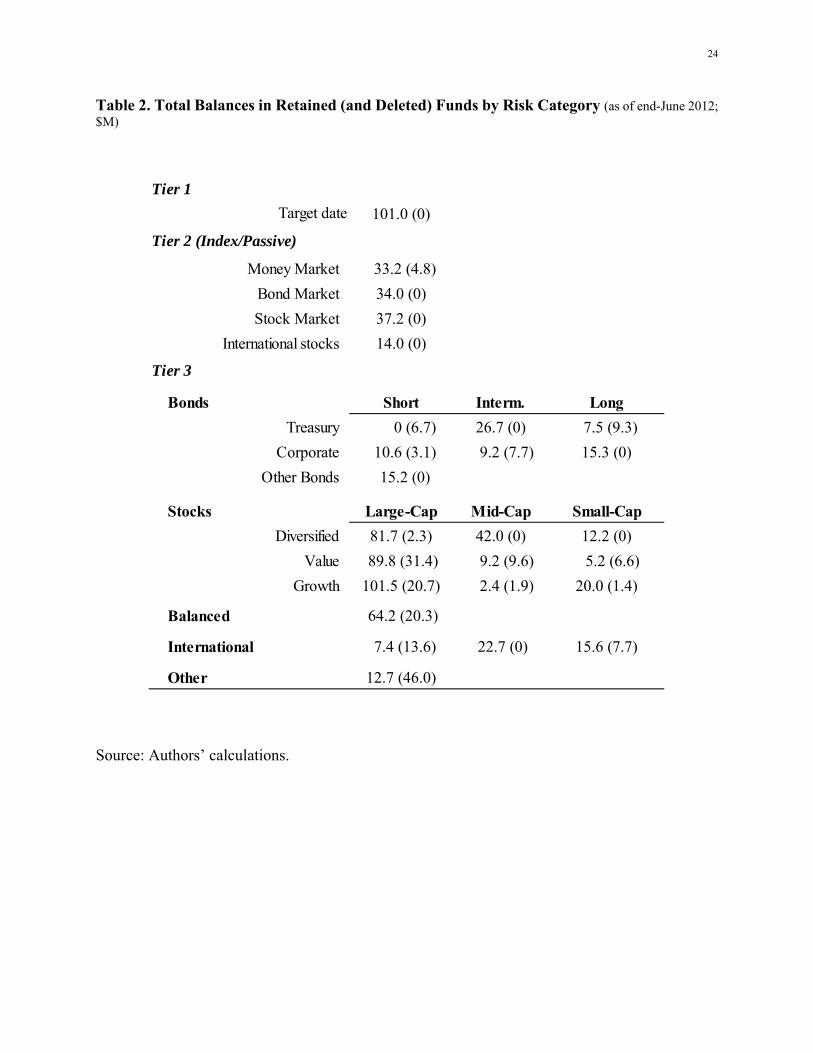
participants and their retirement plan investments as of end-June 2012 (our baseline). Table 2
reports aggregate balances held in retained and deleted funds by risk category, where of the almost
$1 billion invested at end-June 2012, most of the assets (80%) were held in retained funds. Overall,
20% of the total assets were in funds that were subsequently deleted; of those, about 60% had been
in equity (stock, balanced, or international) funds, 24% in alternatives/sector funds, and 14% in
bond funds (with the remainder in money market funds).
[Table 2 here]
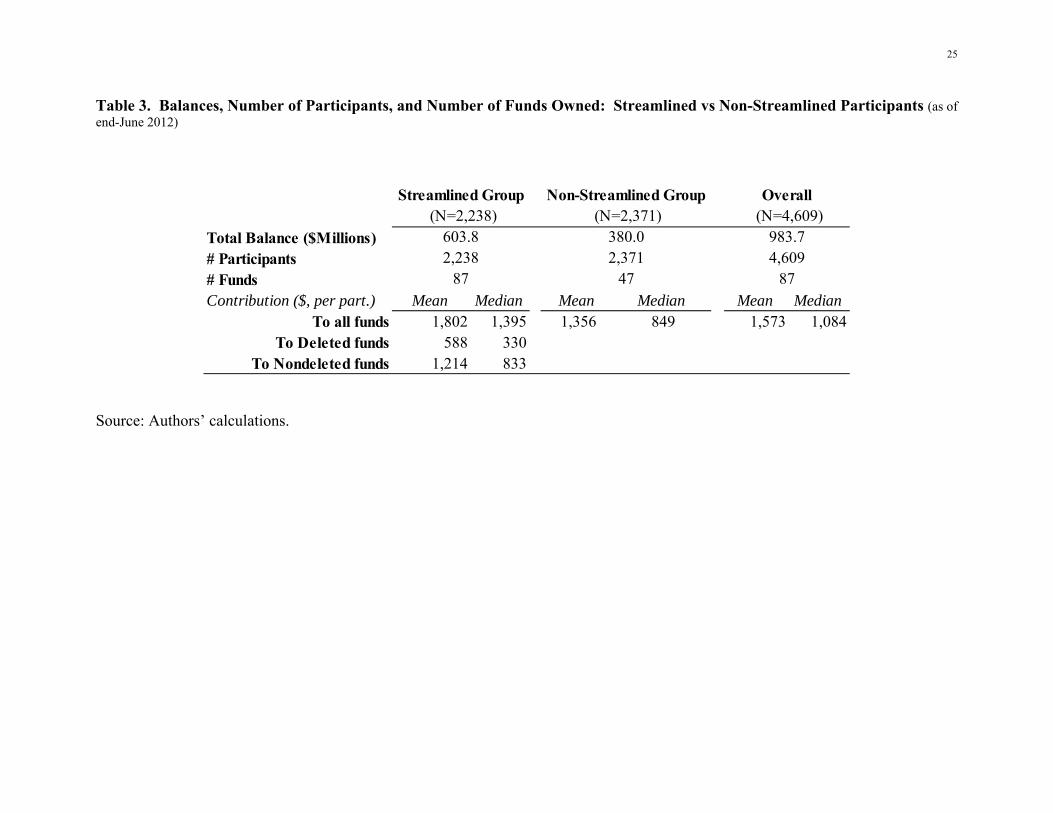
In Table 3 we report aggregate dollar balances, the number of total participants, and the
number of funds held by all plan participants at end-June 2012 (rightmost column), along with the
same information for the streamlined participants (who owned at least one deleted fund) and the
non-streamlined participants (who owned no deleted funds). The number of participants in each
group was roughly similar (2,238 versus 2,371), but the streamlined group had accumulated almost
60% more in assets ($603.8 versus $380.0 million), contributed 30% more on a monthly basis
($1802 versus $1356 per participant), and held more funds overall (87 in total versus 47). On
average, about one-third of the contributions of the streamlined participants were in funds that
were subsequently deleted and two-thirds in retained funds.
[Table 3 here]
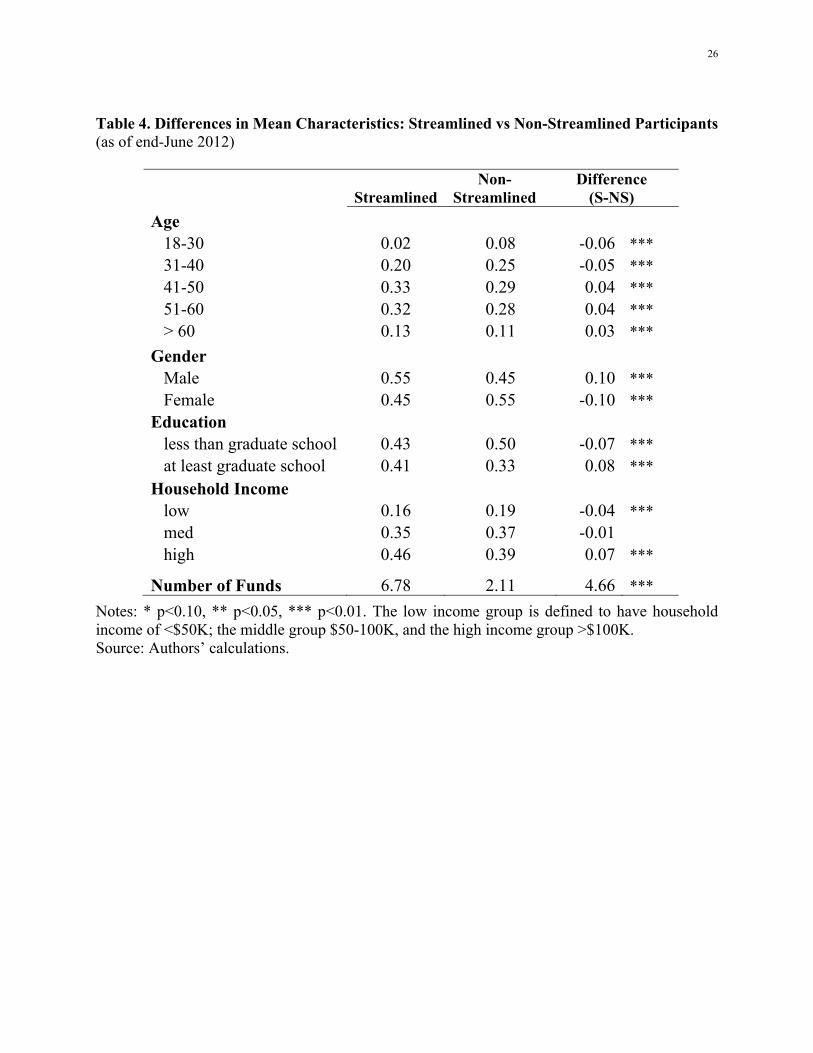
A comparison of characteristics for streamlined versus non-streamlined active participants
appears in Table 4. The streamlined participants were significantly older, more likely to be male,
lived in higher-income households, and were more likely to have earned graduate-level degrees.
They also owned three times as many funds (an average of 6.8 versus 2.1) compared to the non-
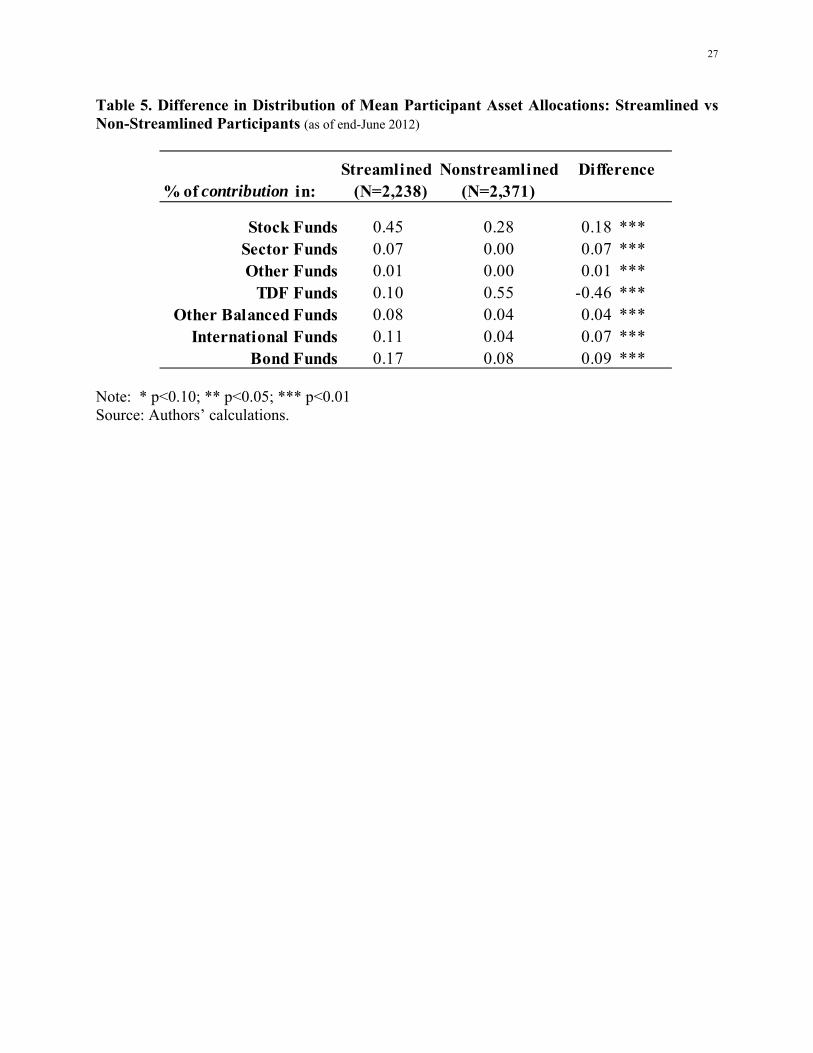
streamlined participants. Regarding asset allocations, Table 5 indicates that the streamlined
participants were more likely to contribute directly to stock funds (sector, domestic and
10
international), while the non-streamlined participants were more likely to obtain equity exposure
(indirectly and in more conservative amounts) via significantly larger allocations to target date
funds.7 As a result, on average, the streamlined participants held portfolios containing more equity
exposure.
[Tables 4 and 5 here]
4. Changes in Portfolio Allocations: A First Look
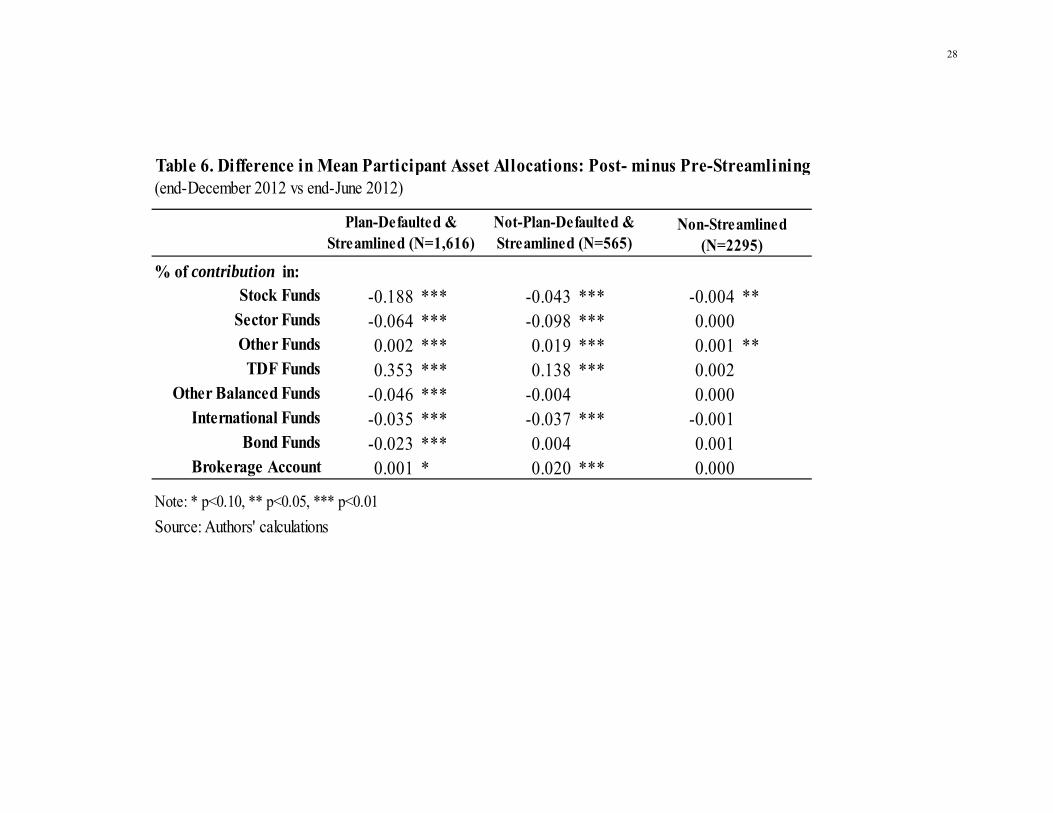
Table 6 reports how participants changed their retirement plan portfolios after the
streamlining went into effect. In particular, we compare the allocation of retirement plan assets at
two time points: prior to (as of end-June 2012), and after streamlining (as of end-December 2012).
Overall, non-streamlined participants kept contributions to their retirement accounts virtually
unchanged (column 3). Because these participants were not directly affected by the elimination
of funds from the lineup, their persistence in the surviving funds refutes the idea that the
reorganization and tiering of the surviving funds might have affected all participants’ behavior.8
[Table 6 here]
By contrast, streamlining produced statistically significant and economically meaningful
changes to allocations made by streamlined participants. To more clearly assess the allocation
adjustment process, we separate this group into two sub-samples: (a) those streamlined participants
who did not take full advantage of the window between the announcement in July and the deadline
7 Given the age profile of the non-streamlined sample, the average equity share of their investment in TDFs was just under 80%. 8 Although contributions by non-streamlined participants did increase for stock funds and decrease for “other” funds, the changes were economically tiny (0.4% and 0.1% respectively). In results not reported here, we also find that fund allocations by non-streamlined participants did not change significantly by the end of either 2012 or 2013, in terms of both contributions and balances.
11
for action on October 19 and hence were defaulted by the Plan into age-appropriate target date
funds (Plan-Defaulted & streamlined); and (b) those streamlined participants who exchanged out
of the deleted funds during the July-October 19 window (Not-Plan-Defaulted & streamlined). The
results for both streamlined groups are reported in the first two columns in Table 6. Both types of
streamlined participants significantly reduced allocations to stock, sector, and international funds
and they shifted contributions mainly to TDFs. The changes were more pronounced, however, for
the Plan-Defaulted members of the streamlined sample: their allocations to stock, sector,
international, balanced and bond funds fell significantly – by a combined 35.6% reduction in
contributions, and their allocations to TDFs rose by 35.3%. By contrast, the Not-Plan-Defaulted
streamlined participants significantly decreased allocations to stock, sector and international funds
(a combined 17.8% reduction) and significantly increased contributions to TDFs by 13.8%. The
Not-Plan-Defaulted group also re-allocated a significant 2% of its contributions to the new
brokerage account.9 Although we cannot see the transactions in these brokerage accounts, we
surmise that this shift in contributions reflects efforts by the Not-Plan-Defaulted group to continue
investing in funds now eliminated from the Plan’s menu.10
9 The amount re-allocated to brokerage accounts, $2.7M, represents a small portion of the plan’s aggregate assets and few participants: only 9% of those holding deleted funds prior to the change subsequently opened a brokerage account following the change. This may be because, at the time the brokerage accounts were announced, restrictions were imposed on the number of exchanges permitted in and out of certain funds each year. Also participants were informed that holdings in the brokerage account would incur special redemption fees of 1% (minimum $50, maximum $250) for no-transaction-fee funds; for transaction-fee funds, the participant would be charged $20 per transaction. These fees were eliminated prior to the actual change. In both cases the minimum investment was $1,000. Additional loads would depend on the share classes elected by each participant. This lack of participation in brokerage accounts reported here is consistent with broader evidence for DC plans reported in Vanguard (2015). 10 This large reallocation by both streamlined groups is expected given they were the participants holding the deleted funds. But it is interesting to note that the streamlined participants were also the more active traders – in terms of number of fund exchanges – during the year prior to the announcement of the streamlining. During the period July 2011 to June 2012, the Not-Plan-

12
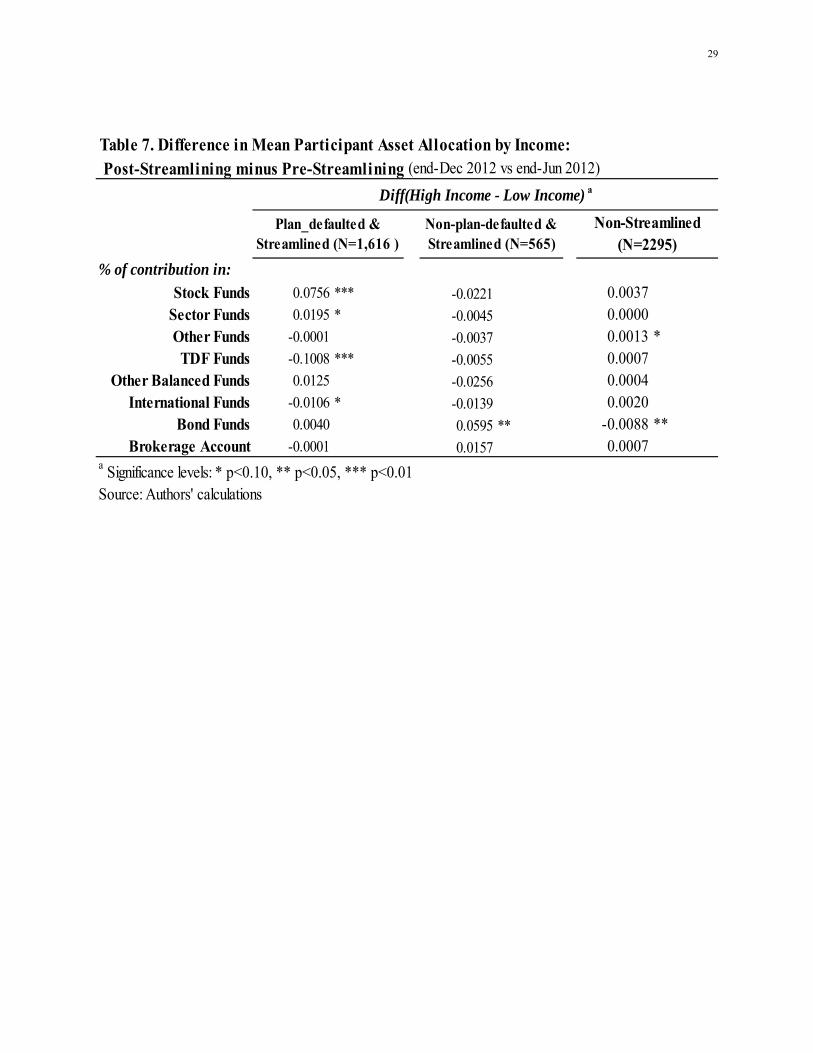
Table 7 helps us examine whether the pre- versus post-streamlining re-allocations were
different for high versus low household income participants.11 In the Non-Streamlined group there
is little evidence of differences by income pre- versus post-streamlining re-allocations; one
exception is that low-income members of the Non-Streamlined group were more likely to shift
allocations out of bond funds into the other available funds, although the magnitudes are very small
(less than 1%). Within the Streamlined group, significant differences in re-allocations between
high and low-income participants are mainly in the Plan-Defaulted sub-group. The most
interesting finding, both statistically and economically, is that the overall re-allocations into TDFs
seen in Table 6 prove to be 10% larger, and the re-allocations out of stock funds 7.6% larger, for
the low-income members of the Plan-Defaulted group. In other words, the streamlining reform had
a larger impact on low-income savers, making their portfolios better balanced and less risky than
before.
[Table 7 here]
5. Changes in Participant Portfolio Characteristics and Risks: Multivariate Analysis
Next we use multivariate regression analyses to analyze in more detail how the reform
shaped changes in the portfolio characteristics and risks of streamlined and non-streamlined
participants. To measure these differences, we again separate the streamlined from the non-
Defaulted & streamlined (Plan-Defaulted & streamlined) participants averaged 2.39 (1.9) fund exchanges per month, compared to 0.9 exchanges on average for the Not-Streamlined participants. 11 Recall, from section 3, that the low income group had household income of <$50K; the middle group $50-100K; and the high income group >$100K.
13
streamlined participants, and we further identify the two sub-groups of streamlined participants
with zero-one indicator variables, the Plan-Defaulted-Streamlined and the Not-Plan-Defaulted-
Streamlined. Our analysis also controls for various participant attributes including age and age-
squared (to test for possible nonlinear effects); male or female; educational level (graduate degree
or not); and high versus low household income. We estimate the change in portfolio characteristics
over two intervals: end-June 2012 to end-December 2012 (the same time period analyzed in Tables
6 and 7); and also end-June 2012 to end-December 2013 (a longer interval that allows more time
for participants to adjust their portfolio allocations post-streamlining).
5.1 Changes in Portfolio Characteristics
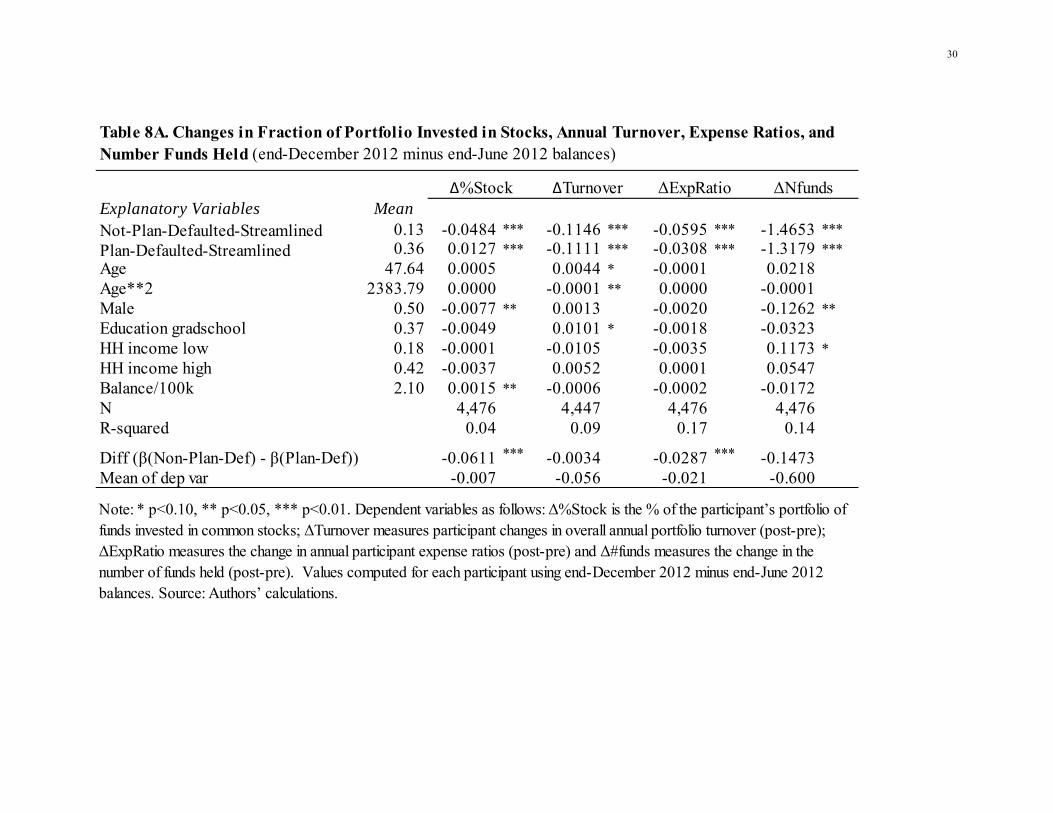
Table 8 compares the effects of the reform on participant portfolio turnover rates, expense
ratios, number of funds held, and percentage allocation to stocks, in portfolios held by streamlined
versus non-streamlined participants. Panel A (B) reports model estimates for the shorter (longer)
post-streamlining period.
[Table 8 here]
Over the shorter interval (Panel 8A), we find that, relative to their unaffected counterparts,
Streamlined participants – both those that were Plan-Defaulted and those that were not –
experienced significantly greater reductions in portfolio turnover, larger reductions in expense
ratios, and a larger decline in the number of funds held. Moreover, these reductions were generally
larger for the subset of streamlined participants that were Not-Plan-Defaulted. For example, the
reduction in the expense ratio was 6.0 (3.1) bps larger for the Not-Plan-Defaulted (Plan-Defaulted)
streamlined participants than for non-streamlined, and the difference of 2.9 bps is significant at the
0.01 level. This last result might be partly due to our inability to observe brokerage window
transactions in which these Not-Plan-Defaulted participants might have replicated their prior fund
14
allocations and associated higher expense ratios. That said, recall that very few Not-Plan-Defaulted
participants opened brokerage accounts; and virtually none of the Plan-Defaulted participants.
In contrast to the findings for the other characteristics in Table 8A, the changes in the
percentage of the portfolio allocated to stocks over the shorter interval were markedly different for
the Not-Plan-Defaulted and the Plan-Defaulted streamlined subsamples relative to their non-
streamlined counterparts. Specifically, the Plan-Defaulted streamlined participants significantly
increased their stock allocations by 1.3% by the end of December 2012, while the Not-Plan-
Defaulted streamlined group experienced a statistically and economically significant 4.8%
reduction in stock allocation as a result of the streamlining. This difference of 6.1% is statistically
significant at the 0.01 level, and it is consistent with Table 6 where we found: (a) a significant
reduction in stock and sector fund allocations by the Not-Plan-Defaulted streamlined participants;
and (b) a significant increased allocation by the Plan-Defaulted streamlined participants to TDFs
which contain a much higher percentage of stocks12 than the more conservative bond and balanced
funds which they dropped, post- streamlining.
We also find that the reductions in stock allocations and number of funds held were greater
for men than for women, consistent with Barber and Odean’s (2001) finding for discount brokerage
accounts that individual male investors trade stocks more aggressively than do female investors.
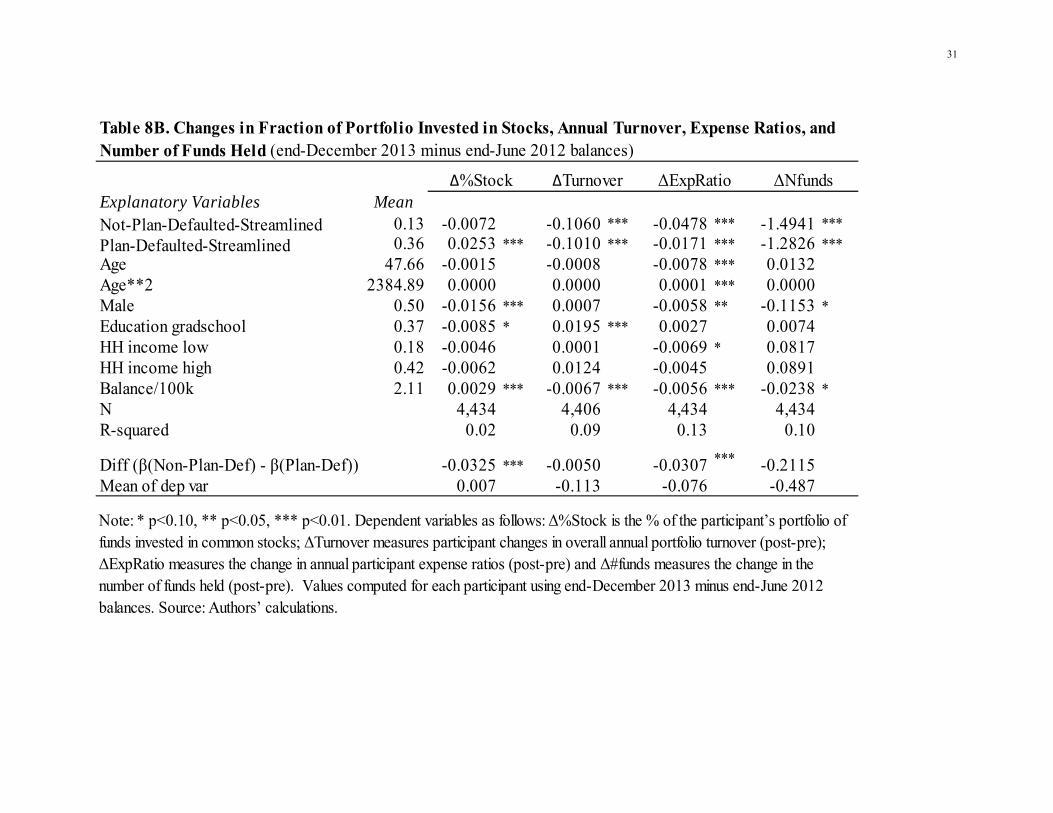
The message of Panel 8B is simple: the changes in portfolio characteristics caused by the
reform that were evident over the shorter interval in Panel A largely persisted over the entire 2013
calendar year. The one exception is that, during 2013, the Not-Plan-Defaulted streamlined
participants reversed the initial reduction in their stock market exposure, so that by the end of
12 Sixty percent of the Plan-Defaulted streamlined group was under the age of 60. The average equity percent in the TDFs for this age range is about 86%.
15
2013, their stock exposure was not significantly different than beforehand. Otherwise, the initial
effects of the reform (e.g., lower turnover and expense ratios) were not undone by participant
transactions over the subsequent twelve months.
Not only are these effects statistically significant: they are also economically important.
That is, the (unconditional) average reduction in the annual expense ratio for the entire streamlined
group was 4.0bp (=27.9bp – 23.9bp), or a $0.242M annual cost savings (based on the pre-
streamlining balance for the streamlined group of $603.8M at end-June 2012). Since the average
age of the streamlined participants was 49 in April 2012, if those savings could be achieved on an
ongoing basis over 20 years and reinvested at 5% annually, the accumulated benefit would amount
to $8.40M or around $4,000 per participant. Additionally, the (unconditional) average decline in
within-fund annual turnover for the streamlined group was 11.3% (=35.2% – 23.9%). Based on
the streamlined group balance of $603.8M at end-June 2012 and assuming round-trip within-fund
transaction costs of 0.50%, this could translate into an annual aggregate cost savings of $0.341M.13
If such savings could be achieved on an ongoing basis over 20 years and reinvested at 5% annually,
the accumulated additional benefit would be $11.8M, or $5,400 per participant. In total, then, the
per-participant savings could be over $9,400 per participant.
5.2 Changes in Portfolio Risks
We also examine how participant portfolio risks changed by comparing pre- versus post-
streamlining positions. To this end, we first estimate the factor-related systematic risks and
diversifiable (idiosyncratic) risks for both retained and deleted funds, using a model similar to
Fama-French (1993) in which the estimated coefficients measure each fund’s exposures to
systematic factor risks:
13 We compute this as $603.8 x (0.113 x 2 x 0.025).
16
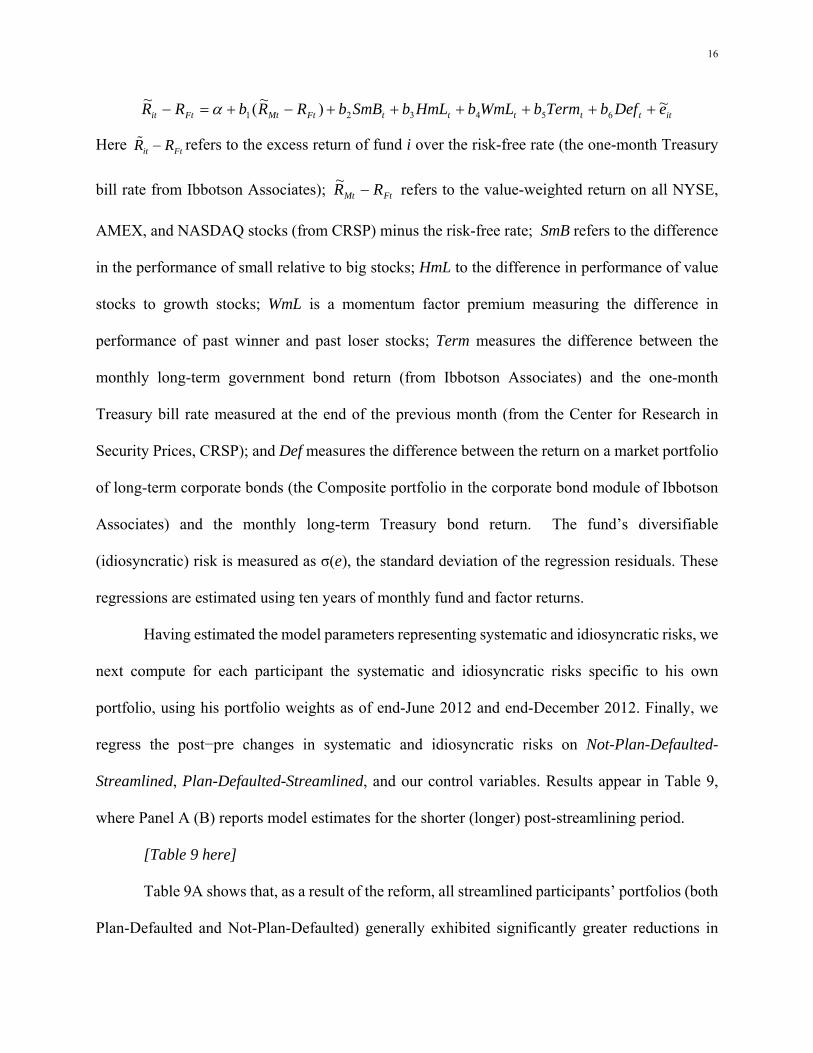
ittttttFtMtFtit eDefbTermbWmLbHmLbSmBbRRbRR ~)~
(~
654321
Here it FtR R refers to the excess return of fund i over the risk-free rate (the one-month Treasury
bill rate from Ibbotson Associates); FtMt RR ~ refers to the value-weighted return on all NYSE,
AMEX, and NASDAQ stocks (from CRSP) minus the risk-free rate; SmB refers to the difference
in the performance of small relative to big stocks; HmL to the difference in performance of value
stocks to growth stocks; WmL is a momentum factor premium measuring the difference in
performance of past winner and past loser stocks; Term measures the difference between the
monthly long-term government bond return (from Ibbotson Associates) and the one-month
Treasury bill rate measured at the end of the previous month (from the Center for Research in
Security Prices, CRSP); and Def measures the difference between the return on a market portfolio
of long-term corporate bonds (the Composite portfolio in the corporate bond module of Ibbotson
Associates) and the monthly long-term Treasury bond return. The fund’s diversifiable
(idiosyncratic) risk is measured as σ(e), the standard deviation of the regression residuals. These
regressions are estimated using ten years of monthly fund and factor returns.
Having estimated the model parameters representing systematic and idiosyncratic risks, we
next compute for each participant the systematic and idiosyncratic risks specific to his own
portfolio, using his portfolio weights as of end-June 2012 and end-December 2012. Finally, we
regress the post−pre changes in systematic and idiosyncratic risks on Not-Plan-Defaulted-
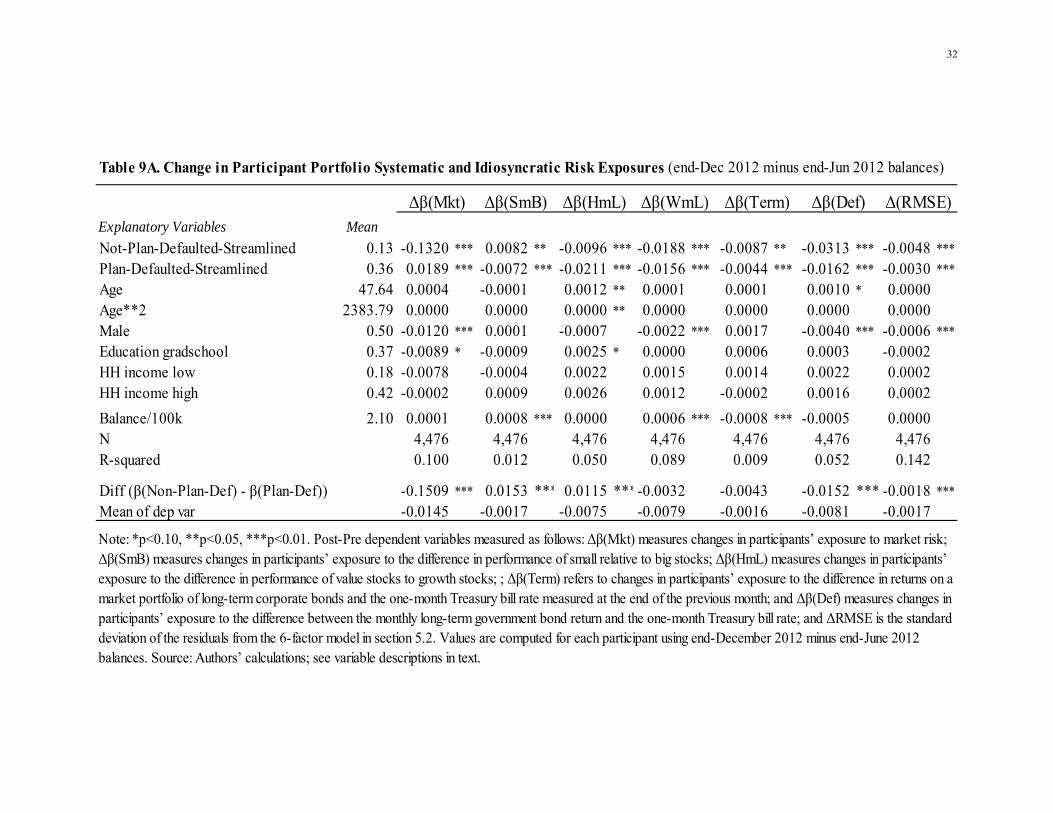
Streamlined, Plan-Defaulted-Streamlined, and our control variables. Results appear in Table 9,
where Panel A (B) reports model estimates for the shorter (longer) post-streamlining period.
[Table 9 here]
Table 9A shows that, as a result of the reform, all streamlined participants’ portfolios (both
Plan-Defaulted and Not-Plan-Defaulted) generally exhibited significantly greater reductions in
17
systematic risk relative to the non-streamlined participants. Stated differently, there was a larger
reduction in portfolio ‘tilt’ toward most systematic sources of variation for the streamlined
participants. There are two exceptions. First, relative to the non-streamlined group, there was a
significant increase in market beta for the Plan-Defaulted streamlined participants, in contrast to
the significant decrease in market beta for the Not-Plan-Defaulted streamlined participants. This
tracks the changes in broad stock market exposure for these two streamlined groups shown in
Table 8. Second, and again relative to the non-streamlined group, we find a greater increase
(reduction) in small-cap risk exposure for the Not-Plan-Defaulted (Plan-Defaulted) streamlined
participants. The reason for this difference is not entirely clear from Tables 6 and 8 where the stock
exposures and allocations are reported with insufficient granularity to differentiate the presence of
small- versus large-cap stocks. One possible explanation, though, is that many of the deleted sector
and international funds, in which the Not-Plan-Defaulted streamlined group had been invested,
had much lower exposures to small-cap risk.
We also find that the reform resulted in a significant reduction in idiosyncratic risk for the
streamlined group relative to their non-streamlined peers, and this reduction was even more
notable for the Not-Plan-Defaulted members of the streamlined group. Moreover, the reduction
in idiosyncratic risk was greater for male versus female participants, as were reductions in
exposures to the market and momentum stock risk factors, and the default risk bond factor. These
last two findings in the retirement plan setting agree with Barber and Odean’s results (2001) for
online brokerage accounts. It is also worth pointing out that many of these changes in risk exposure
were most pronounced for participants with larger, versus smaller, portfolio balances.14
14 This pattern aligns with results by Calvet, Campbell, and Sodini (2009) who studied Swedish investors; they found that wealthier investors rebalanced toward a riskier share when they altered their portfolios. Yet that analysis was not focused on retirement accounts, as here, however.
18
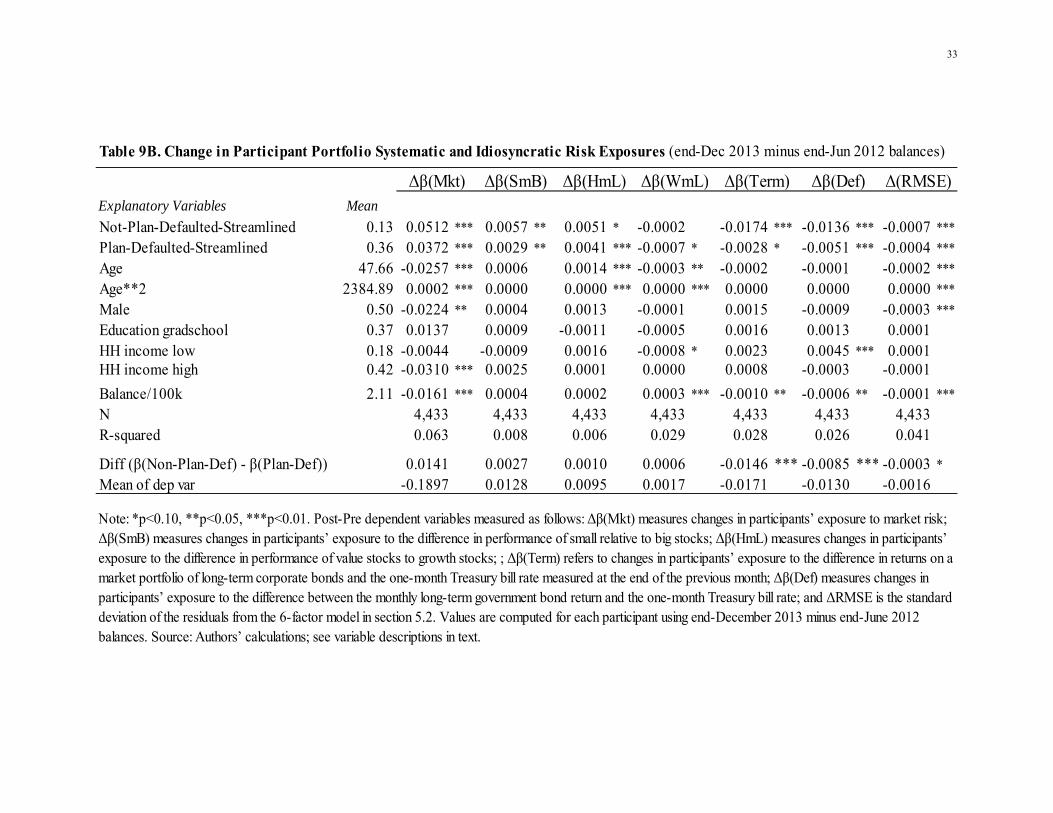
As was true for the observed portfolio characteristics discussed above, Table 9B confirms
that the Panel A shorter-period portfolio risk changes wrought by the reform persisted over the
entire 2013 calendar year. The main exception, consistent with our findings in Table 8B, is that
the Not-Plan-Defaulted streamlined participants reversed their initial reduction in stock market
exposure post-reform, so that by the end of 2013 their market beta was actually significantly larger
than before the streamlining. Also both streamlined groups reversed their initial reduction in tilt
toward value stocks (Δβ(HmL) in Table 9A) and ended 2013 with significantly larger value stock
exposure, relative to the non-streamlined group. It is also worth noting that the reduction in
idiosyncratic risk for both streamlined groups reported for the shorter interval remains significant
over the longer interval, although the change was smaller. Thus the initial effects of the reform
remained largely intact by the end of 2013.
To summarize the results in this section, the streamlining of the DC plan described here
had a statistically significant and economically important impact on the characteristics and risk
attributes of savers’ accounts. Specifically, within-fund turnover in participants’ retirement
portfolios (a significant cause of largely unseen transaction costs) and expense ratios were
significantly reduced; and many dimensions of systematic/non-diversifiable risk, as well as
idiosyncratic/diversifiable risk, were also significantly curtailed. As such, our results complement
and extend previous studies suggesting that plan simplification enhances retirement saving (e.g.,
Beshears et al. 2013), though previous work has focused only on participation and contributions,
but not on asset allocation outcomes as here.
6. Conclusions
19
This study has examined the salutary effects of streamlining the DC fund menu by deleting
some funds and tiering options in an easier-to-understand format. While recent studies have
evaluated how simplification can influence retirement plan participation and contributions, they
have not examined how streamlining changes investment patterns. Our analysis examines how
halving the fund menu while including a new brokerage account changed investment behavior at
a large nonprofit institution. We find that participants who initially held at least one deleted fund
were relatively older, more likely to be male, and earned higher incomes; they also held higher
balances in riskier funds and lower balances in safer/balanced/target date funds. Interestingly, in
response to the changed lineup, only 9% of these participants moved any money at all into the new
brokerage window, taking only 0.4% of assets. Moreover, streamlined participants’ new
allocations included significantly fewer funds and had significantly lower exposure to non-market
systematic risks; they also contained a lower allocation to stocks. Streamlined participants’ new
allocations also led to fund holdings with significantly lower expense ratios and within-fund
turnover rates, which, based on reasonable assumptions, could lead to potential accumulated
savings for these participants over a 20-year period of $20.2M, or over $9,400 per participant.
The changes we have discerned are important, particularly given regulators’ growing
interest in retirement plan fees and costs. As one example, recent US Department of Labor
guidance to plan participants alerted members to the possibility that costs may rise as investment
options become more numerous.15 Such costs, in turn, can reduce the size of the nest egg available
15 For instance, the US Department of Labor (US DOL) states on its website (http://www.dol.gov/ebsa/publications/401k_employee.html): “In recent years, there has been a dramatic increase in the number of investment options typically offered under 401(k) plans as well as the level and types of services provided to participants. These changes give today’s employees who direct their 401(k) investments greater opportunity than ever before to affect their retirement savings. As a participant you may welcome the variety of investment options and the additional
20
for retirement. Additionally, employers in their plan fiduciary capacity are charged under pension
law with managing retirement plans in the best interests of participants.16 Our work implies that
plan sponsors would do well to recognize that the length and complexity of their plan menus
matter. Accordingly, our results should be of substantial interest to those seeking to improve
defined contribution retirement plan design, including employers, fund providers, consultants, and
regulators.
services, but you may not be aware of their cost. As shown above, the cumulative effect of the fees and expenses on your retirement savings can be substantial.” 16 The US DOL points out that plan sponsors must “ensure that fees paid to service providers and other expenses of the plan are reasonable in light of the level and quality of services provided; and select investment options that are prudent and adequately diversified; disclose plan, investment, and fee information to participants to make informed decisions regarding their investment options under the plan; and monitor investment options and service providers once selected to see that they continue to be appropriate choices.” (http://www.dol.gov/ebsa/publications/401k_employee.html)
21
References
Barber, B. and T. Odean. 2001. "Boys will be Boys: Gender, Overconfidence, and Common Stock Investment" Quarterly Journal of Economics 116(1): 261-292 Benartzi, S., and R. Thaler. 2001. “Naıve Diversification Strategies in Defined Contribution Saving Plans. American Economic Review. 91(1): 79–98. Beshears, J., J. Choi, D. Laibson, and B. Madrian. 2013. “Simplification and Saving.” Journal of Economic Behavior & Organization 95 (November): 130– 145 Brown, J., N. Liang, and S. Weisbenner. 2007. "Individual Account Investment Options and Portfolio Choice: Behavioral Lessons from 401(k) Plans." Journal of Public Economics. 91(10): 1992-2013. Calvet, Laurent E. John Y. Campbell, and Paolo Sodini. 2009. Fight or Flight? Portfolio Rebalancing by Individual Investors. Quarterly Journal of Economics. 124 (1): 301-348. Choi, J., D. Laibson, and B. Madrian. 2004. “Plan Design and 401(k) Savings Outcomes.” National Tax Journal 57(2): 275-298. Fama, Eugene and Kenneth R. French. (1993). “Common Risk Factors in the Returns on Stocks and Bonds.” Journal of Financial Economics 33(1): 3-56. Huberman, G., S. Iyengar, and W. Jiang, W. 2007. Defined Contribution Pension Plans: Determinants of Participation and Contribution Rates. Journal of Financial Services Research, 31(1): 1-32. Huberman, G. and W. Jiang. 2006. “Offering vs. Choice in 401(k) Plans: Equity Exposure and Number of Funds.” Journal of Finance. 61(2): 763–801. Iyengar, Sheena S. and Mark Lepper. 2000. “When Choice is Demotivating: Can One Desire Too Much of a Good Thing?” Journal of Personality and Social Psychology 76(9): 995-1006. Iyengar, S., W. Jiang, and G. Huberman. 2004. “How Much Choice is Too Much?: Contributions to 401(k) Retirement Plans.” In Pension Design and Structure: New Lessons from Behavioral Finance. Eds. O. S. Mitchell and S. P. Utkus. Oxford University Press: 83-95. Madrian, B., and D. Shea. 2001. "The Power of Suggestion: Inertia in 401(k) Participation and Saving Behavior." Quarterly Journal of Economics 116(4): 1149-1187. Mitchell, O. S., and S. P. Utkus. 2006. “How Behavioral Finance Can Inform Retirement Plan Design.” Journal of Applied Corporate Finance. 18(1): 82-94 Mitchell, O. S. and S. P. Utkus. 2012. “Target-Date Funds and Portfolio Selection in 401(k) Plans.” NBER WP 17911.
22
Morrin, M., J. Inman, S. Broniarczyk, G. Nenkov, and J. Reuter. 2012. “Investing for Retirement: The Moderating Effect of Fund Assortment Size on the 1/N Heuristic.” Journal of Marketing Research 49(4): 537-550. Tang, N., O.S. Mitchell, G. Mottola, and S. Utkus. (2010). “The Efficiency of Sponsor and Participant Portfolio Choices in 401(k) Plans.” Journal of Public Economics. 94(11-12): 1073-1085 US Department of Labor (US DOL). nd. “A Look At 401(k) Plan Fees.” http://www.dol.gov/ebsa/publications/401k_employee.html US Department of Labor (US DOL). 2014. “Private Pension Plan Bulletin Historical Tables and Graphs.” Employee Benefits Security Administration, September. http://www.dol.gov/ebsa/pdf/historicaltables.pdf Vanguard. (2015). “The Brokerage Option in DC Plans.” Vanguard Research Note, June. https://institutional.vanguard.com/iam/pdf/RNBKDCP.pdf
23
Table 1. Description of Fund Menu Post- (and Pre-) Streamlining
__________________________________________________________________________ 1 Three Money Market funds were eliminated. 2 Thirty-nine funds were eliminated. Note: Post (pre) allocation computed as of end-December (June) 2012. Source: Authors’ calculations.
Tier 1 : 13 Target Date Funds
Tier 2 : 4 Funds (Money Market, U.S. Diversified Stocks, U.S. Bonds, Int'l Stocks)1
Tier 3 : 32 Funds [Number of funds kept (Number of funds eliminated)]2
Bond FundsShort Intermed Long
Treasury 0 (2) 2 (1) 1 (1)Corporate 1 (1) 1 (1) 2 (0)Other Bonds (High Yield) 1 (0)
Stock FundsLarge Mid-Cap Small
Diversified 1 (3) 3 (0) 1 (0)Value 3 (9) 1 (1) 1 (3)Growth 4 (2) 1 (1) 2 (1)
Balanced Funds 2 (2)
International Stock Funds 1 (3) 2 (2) 1 (2)
Other (Althernative Assets, Sector Funds) 1 (4)
24
Table 2. Total Balances in Retained (and Deleted) Funds by Risk Category (as of end-June 2012; $M)
Source: Authors’ calculations.
Tier 1
Target date 101.0 (0)
Tier 2 (Index/Passive)
Money Market 33.2 (4.8)
Bond Market 34.0 (0)
Stock Market 37.2 (0)
International stocks 14.0 (0)
Tier 3
Bonds Short Interm. Long
Treasury 0 (6.7) 26.7 (0) 7.5 (9.3)
Corporate 10.6 (3.1) 9.2 (7.7) 15.3 (0)
Other Bonds 15.2 (0)
Stocks Large-Cap Mid-Cap Small-Cap
Diversified 81.7 (2.3) 42.0 (0) 12.2 (0)
Value 89.8 (31.4) 9.2 (9.6) 5.2 (6.6)
Growth 101.5 (20.7) 2.4 (1.9) 20.0 (1.4)
Balanced 64.2 (20.3)
International 7.4 (13.6) 22.7 (0) 15.6 (7.7)
Other 12.7 (46.0)
25
Table 3. Balances, Number of Participants, and Number of Funds Owned: Streamlined vs Non-Streamlined Participants (as of end-June 2012)
Source: Authors’ calculations.
Total Balance ($Millions)# Participants# FundsContribution ($, per part.) Mean Median Mean Median Mean Median
To all funds 1,802 1,395 1,356 849 1,573 1,084To Deleted funds 588 330
To Nondeleted funds 1,214 833
4,60987 47 87
Streamlined Group Non-Streamlined Group Overall
380.0 983.7 (N=2,238)
603.8 (N=2,371) (N=4,609)
2,238 2,371
26
Table 4. Differences in Mean Characteristics: Streamlined vs Non-Streamlined Participants (as of end-June 2012)
StreamlinedNon-
Streamlined Difference
(S-NS)
Age
18-30 0.02 0.08 -0.06 *** 31-40 0.20 0.25 -0.05 *** 41-50 0.33 0.29 0.04 *** 51-60 0.32 0.28 0.04 *** > 60 0.13 0.11 0.03 ***
Gender
Male 0.55 0.45 0.10 *** Female 0.45 0.55 -0.10 *** Education
less than graduate school 0.43 0.50 -0.07 *** at least graduate school 0.41 0.33 0.08 ***
Household Income
low 0.16 0.19 -0.04 *** med 0.35 0.37 -0.01 high 0.46 0.39 0.07 ***
Number of Funds 6.78 2.11 4.66 ***
Notes: * p<0.10, ** p<0.05, *** p<0.01. The low income group is defined to have household income of <$50K; the middle group $50-100K, and the high income group >$100K. Source: Authors’ calculations.
27
Table 5. Difference in Distribution of Mean Participant Asset Allocations: Streamlined vs Non-Streamlined Participants (as of end-June 2012)
Note: * p<0.10; ** p<0.05; *** p<0.01 Source: Authors’ calculations.
Streamlined Nonstreamlined% of contribution in: (N=2,238) (N=2,371)
Stock Funds 0.45 0.28 0.18 ***Sector Funds 0.07 0.00 0.07 ***Other Funds 0.01 0.00 0.01 ***
TDF Funds 0.10 0.55 -0.46 ***Other Balanced Funds 0.08 0.04 0.04 ***
International Funds 0.11 0.04 0.07 ***Bond Funds 0.17 0.08 0.09 ***
Difference
28
Table 6. Difference in Mean Participant Asset Allocations: Post- minus Pre-Streamlining(end-December 2012 vs end-June 2012)
% of contribution in: Stock Funds -0.188 *** -0.043 *** -0.004 **
Sector Funds -0.064 *** -0.098 *** 0.000Other Funds 0.002 *** 0.019 *** 0.001 **
TDF Funds 0.353 *** 0.138 *** 0.002Other Balanced Funds -0.046 *** -0.004 0.000
International Funds -0.035 *** -0.037 *** -0.001Bond Funds -0.023 *** 0.004 0.001
Brokerage Account 0.001 * 0.020 *** 0.000
Note: * p<0.10, ** p<0.05, *** p<0.01
Source: Authors' calculations
Plan-Defaulted & Streamlined (N=1,616)
Non-Streamlined (N=2295)
Not-Plan-Defaulted & Streamlined (N=565)
29
Post-Streamlining minus Pre-Streamlining (end-Dec 2012 vs end-Jun 2012)
% of contribution in:
Stock Funds 0.0756 *** -0.0221 0.0037Sector Funds 0.0195 * -0.0045 0.0000Other Funds -0.0001 -0.0037 0.0013 *TDF Funds -0.1008 *** -0.0055 0.0007
Other Balanced Funds 0.0125 -0.0256 0.0004International Funds -0.0106 * -0.0139 0.0020
Bond Funds 0.0040 0.0595 ** -0.0088 **Brokerage Account -0.0001 0.0157 0.0007
a Significance levels: * p<0.10, ** p<0.05, *** p<0.01Source: Authors' calculations
Table 7. Difference in Mean Participant Asset Allocation by Income:
Non-Streamlined (N=2295)
Plan_defaulted & Streamlined (N=1,616 )
Non-plan-defaulted & Streamlined (N=565)
Diff(High Income - Low Income) a
30
Explanatory Variables MeanNot-Plan-Defaulted-Streamlined 0.13 -0.0484 *** -0.1146 *** -0.0595 *** -1.4653 ***
Plan-Defaulted-Streamlined 0.36 0.0127 *** -0.1111 *** -0.0308 *** -1.3179 ***Age 47.64 0.0005 0.0044 * -0.0001 0.0218Age**2 2383.79 0.0000 -0.0001 ** 0.0000 -0.0001Male 0.50 -0.0077 ** 0.0013 -0.0020 -0.1262 **Education gradschool 0.37 -0.0049 0.0101 * -0.0018 -0.0323HH income low 0.18 -0.0001 -0.0105 -0.0035 0.1173 *HH income high 0.42 -0.0037 0.0052 0.0001 0.0547Balance/100k 2.10 0.0015 ** -0.0006 -0.0002 -0.0172N 4,476 4,447 4,476 4,476R-squared 0.04 0.09 0.17 0.14
Diff (β(Non-Plan-Def) - β(Plan-Def)) -0.0611 *** -0.0034 -0.0287 *** -0.1473Mean of dep var -0.007 -0.056 -0.021 -0.600
Table 8A. Changes in Fraction of Portfolio Invested in Stocks, Annual Turnover, Expense Ratios, and Number Funds Held (end-December 2012 minus end-June 2012 balances)
Δ%Stock ΔTurnover ΔExpRatio ΔNfunds
Note: * p<0.10, ** p<0.05, *** p<0.01. Dependent variables as follows: Δ%Stock is the % of the participant’s portfolio of funds invested in common stocks; ΔTurnover measures participant changes in overall annual portfolio turnover (post-pre); ΔExpRatio measures the change in annual participant expense ratios (post-pre) and Δ#funds measures the change in the number of funds held (post-pre). Values computed for each participant using end-December 2012 minus end-June 2012 balances. Source: Authors’ calculations.
31
Explanatory Variables MeanNot-Plan-Defaulted-Streamlined 0.13 -0.0072 -0.1060 *** -0.0478 *** -1.4941 ***
Plan-Defaulted-Streamlined 0.36 0.0253 *** -0.1010 *** -0.0171 *** -1.2826 ***Age 47.66 -0.0015 -0.0008 -0.0078 *** 0.0132Age**2 2384.89 0.0000 0.0000 0.0001 *** 0.0000Male 0.50 -0.0156 *** 0.0007 -0.0058 ** -0.1153 *Education gradschool 0.37 -0.0085 * 0.0195 *** 0.0027 0.0074HH income low 0.18 -0.0046 0.0001 -0.0069 * 0.0817HH income high 0.42 -0.0062 0.0124 -0.0045 0.0891Balance/100k 2.11 0.0029 *** -0.0067 *** -0.0056 *** -0.0238 *N 4,434 4,406 4,434 4,434R-squared 0.02 0.09 0.13 0.10
Diff (β(Non-Plan-Def) - β(Plan-Def)) -0.0325 *** -0.0050 -0.0307 *** -0.2115Mean of dep var 0.007 -0.113 -0.076 -0.487
Table 8B. Changes in Fraction of Portfolio Invested in Stocks, Annual Turnover, Expense Ratios, and Number of Funds Held (end-December 2013 minus end-June 2012 balances)
Δ%Stock ΔTurnover ΔExpRatio ΔNfunds
Note: * p<0.10, ** p<0.05, *** p<0.01. Dependent variables as follows: Δ%Stock is the % of the participant’s portfolio of funds invested in common stocks; ΔTurnover measures participant changes in overall annual portfolio turnover (post-pre); ΔExpRatio measures the change in annual participant expense ratios (post-pre) and Δ#funds measures the change in the number of funds held (post-pre). Values computed for each participant using end-December 2013 minus end-June 2012 balances. Source: Authors’ calculations.
32
Explanatory Variables Mean
Not-Plan-Defaulted-Streamlined 0.13 -0.1320 *** 0.0082 ** -0.0096 *** -0.0188 *** -0.0087 ** -0.0313 *** -0.0048 ***
Plan-Defaulted-Streamlined 0.36 0.0189 *** -0.0072 *** -0.0211 *** -0.0156 *** -0.0044 *** -0.0162 *** -0.0030 ***
Age 47.64 0.0004 -0.0001 0.0012 ** 0.0001 0.0001 0.0010 * 0.0000Age**2 2383.79 0.0000 0.0000 0.0000 ** 0.0000 0.0000 0.0000 0.0000Male 0.50 -0.0120 *** 0.0001 -0.0007 -0.0022 *** 0.0017 -0.0040 *** -0.0006 ***
Education gradschool 0.37 -0.0089 * -0.0009 0.0025 * 0.0000 0.0006 0.0003 -0.0002HH income low 0.18 -0.0078 -0.0004 0.0022 0.0015 0.0014 0.0022 0.0002HH income high 0.42 -0.0002 0.0009 0.0026 0.0012 -0.0002 0.0016 0.0002
Balance/100k 2.10 0.0001 0.0008 *** 0.0000 0.0006 *** -0.0008 *** -0.0005 0.0000N 4,476 4,476 4,476 4,476 4,476 4,476 4,476R-squared 0.100 0.012 0.050 0.089 0.009 0.052 0.142
Diff (β(Non-Plan-Def) - β(Plan-Def)) -0.1509 *** 0.0153 *** 0.0115 ***-0.0032 -0.0043 -0.0152 *** -0.0018 ***
Mean of dep var -0.0145 -0.0017 -0.0075 -0.0079 -0.0016 -0.0081 -0.0017
Note: *p<0.10, **p<0.05, ***p<0.01. Post-Pre dependent variables measured as follows: Δβ(Mkt) measures changes in participants’ exposure to market risk; Δβ(SmB) measures changes in participants’ exposure to the difference in performance of small relative to big stocks; Δβ(HmL) measures changes in participants’ exposure to the difference in performance of value stocks to growth stocks; ; Δβ(Term) refers to changes in participants’ exposure to the difference in returns on a market portfolio of long-term corporate bonds and the one-month Treasury bill rate measured at the end of the previous month; and Δβ(Def) measures changes in participants’ exposure to the difference between the monthly long-term government bond return and the one-month Treasury bill rate; and ΔRMSE is the standard deviation of the residuals from the 6-factor model in section 5.2. Values are computed for each participant using end-December 2012 minus end-June 2012 balances. Source: Authors’ calculations; see variable descriptions in text.
Table 9A. Change in Participant Portfolio Systematic and Idiosyncratic Risk Exposures (end-Dec 2012 minus end-Jun 2012 balances)
Δβ(Mkt) Δβ(SmB) Δβ(HmL) Δβ(WmL) Δβ(Term) Δβ(Def) Δ(RMSE)
33
Explanatory Variables Mean
Not-Plan-Defaulted-Streamlined 0.13 0.0512 *** 0.0057 ** 0.0051 * -0.0002 -0.0174 *** -0.0136 *** -0.0007 ***
Plan-Defaulted-Streamlined 0.36 0.0372 *** 0.0029 ** 0.0041 *** -0.0007 * -0.0028 * -0.0051 *** -0.0004 ***
Age 47.66 -0.0257 *** 0.0006 0.0014 *** -0.0003 ** -0.0002 -0.0001 -0.0002 ***
Age**2 2384.89 0.0002 *** 0.0000 0.0000 *** 0.0000 *** 0.0000 0.0000 0.0000 ***
Male 0.50 -0.0224 ** 0.0004 0.0013 -0.0001 0.0015 -0.0009 -0.0003 ***
Education gradschool 0.37 0.0137 0.0009 -0.0011 -0.0005 0.0016 0.0013 0.0001HH income low 0.18 -0.0044 -0.0009 0.0016 -0.0008 * 0.0023 0.0045 *** 0.0001HH income high 0.42 -0.0310 *** 0.0025 0.0001 0.0000 0.0008 -0.0003 -0.0001
Balance/100k 2.11 -0.0161 *** 0.0004 0.0002 0.0003 *** -0.0010 ** -0.0006 ** -0.0001 ***
N 4,433 4,433 4,433 4,433 4,433 4,433 4,433R-squared 0.063 0.008 0.006 0.029 0.028 0.026 0.041
Diff (β(Non-Plan-Def) - β(Plan-Def)) 0.0141 0.0027 0.0010 0.0006 -0.0146 *** -0.0085 *** -0.0003 *
Mean of dep var -0.1897 0.0128 0.0095 0.0017 -0.0171 -0.0130 -0.0016
Note: *p<0.10, **p<0.05, ***p<0.01. Post-Pre dependent variables measured as follows: Δβ(Mkt) measures changes in participants’ exposure to market risk; Δβ(SmB) measures changes in participants’ exposure to the difference in performance of small relative to big stocks; Δβ(HmL) measures changes in participants’ exposure to the difference in performance of value stocks to growth stocks; ; Δβ(Term) refers to changes in participants’ exposure to the difference in returns on a market portfolio of long-term corporate bonds and the one-month Treasury bill rate measured at the end of the previous month; Δβ(Def) measures changes in participants’ exposure to the difference between the monthly long-term government bond return and the one-month Treasury bill rate; and ΔRMSE is the standard deviation of the residuals from the 6-factor model in section 5.2. Values are computed for each participant using end-December 2013 minus end-June 2012 balances. Source: Authors’ calculations; see variable descriptions in text.
Table 9B. Change in Participant Portfolio Systematic and Idiosyncratic Risk Exposures (end-Dec 2013 minus end-Jun 2012 balances)
Δβ(Mkt) Δβ(SmB) Δβ(HmL) Δβ(WmL) Δβ(Term) Δβ(Def) Δ(RMSE)