Embed Size (px)
Citation preview

SIMULATED MONTHLY HYDROLOGIC DATA AND ESTIMATED FLOOD CHARACTERISTICS FOR CHERRY CREEK AT A PROPOSED RESERVOIR SITE NEAR TERRY, MONTANA
By Charles Parrett and Dave R. Johnson
U.S. GEOLOGICAL SURVEY Water-Resources Investigations Report 94-4230
Prepared in cooperation with theBUREAU OF LAND MANAGEMENT
and theMONTANA BUREAU OF MINES AND GEOLOGY
Helena, Montana February 1995

U.S. DEPARTMENT OF THE INTERIOR
BRUCE BABBITT, Secretary
U.S. GEOLOGICAL SURVEY
Gordon P. Eaton, Director
For additional information write to: Copies of this report may be purchased from:
District Chief U.S. Geological SurveyU.S. Geological Survey Earth Science Information Center428 Federal Building Open-File Reports Section301 South Park Avenue Box 25286, Mail Stop 517Drawer 10076 Denver Federal CenterHelena, MT 59626-0076 Denver, CO 80225-0286

CONTENTS
Page
Abstract................................................................................................................................................................................. 1Introduction........................................................................................................................................................................... 1
Purpose and scope..................................................................................................................................................... 2Site description.......................................................................................................................................................... 2
Description of available data..................................................................................................................................... 4Estimation of monthly data................................................................................................................................................... 4
Hydrologic budget..................................................................................................................................................... 4Suspended sediment and dissolved solids................................................................................................................. 6
Simulation algorithms......................................................._ 9Hydrologic budget..................................................................................................................................................... 9Suspended-sediment load and dissolved-solids concentration.................................................................................. 10
Simulation results.................................................................................................................................................................. 11Estimates of flood hydrographs and volumes....................................................................................................................... 16
Summary............................................................................................................................................................................... 19
References cited.................................................................................................................................................................... 19Data............................................._ 21
ILLUSTRATIONS
Figure 1. Map showing location of Cherry Creek Basin and selected streamflow-gaging, evaporation, andprecipitation stations.................................................................................................................................... 3
2-3. Graphs showing regression relations for suspended-sediment and dissolved-solids concentrations for:2. Cherry Creek near Terry, Mont. ................................................................................................................ 73. Yellowstone River near Sidney, Mont. ..................................................................................................... 8
4. Graph showing simulated inflows to proposed Cherry Creek Reservoir near Terry, Mont., from theYellowstone River for a reservoir seepage loss of 3 cubic feet per second................................................. 12
5-6. Graphs showing simulated outflows from proposed Cherry Creek Reservoir near Terry, Mont.5. For condition of no seepage loss................................................................................................................ 126. For a reservoir seepage loss of 3 cubic feet per second............................................................................. 13
7-10. Graphs for proposed Cherry Creek Reservoir near Terry, Mont., for two rates of reservoir seepage loss showing simulated:
7. Water-surface elevation.............................................................................................................................. 138. Wume...............................................................^ 149. Cumulative volume of sediment deposition.............................................................................................. 14
10. Concentration of dissolved solids.............................................................................................................. 1511. Graph showing synthetic 100-year storm hyetograph for Cherry Creek Basin near Terry, Mont................... 1712. Graph showing hydrograph for Cherry Creek near Terry, Mont., for the flood of June 25, 1991................... 1813. Graph showing synthetic hydrographs for 25-, 50-, and 100-year floods for 24-hour duration storms for
Cherry Creek near Terry, Mont.................................................................................................................... 18
CONTENTS iii
TABLES
Page
Table 1. Streamflow-gaging stations used as potential base stations for record extension for Cherry Creek nearTerry, Mont. .................................................................................................................................................. 5
2. Precipitation stations used as potential base stations for record extension for Terry and Terry 21 NNW,Mont...............................................................................................................^ 6
3. Flood discharges and recurrence intervals for Cherry Creek near Terry, Mont. .............................................. 164. Peak discharges and flood volumes for Cherry Creek near Terry, Mont., for specified recurrence
intervals.......................................................................................................................................................... 175. Recorded and estimated monthly mean flow for Cherry Creek near Terry, Mont., for water years
1937-92 ............................................._ 226. Estimated monthly precipitation at proposed Cherry Creek Reservoir near Terry, Mont.,
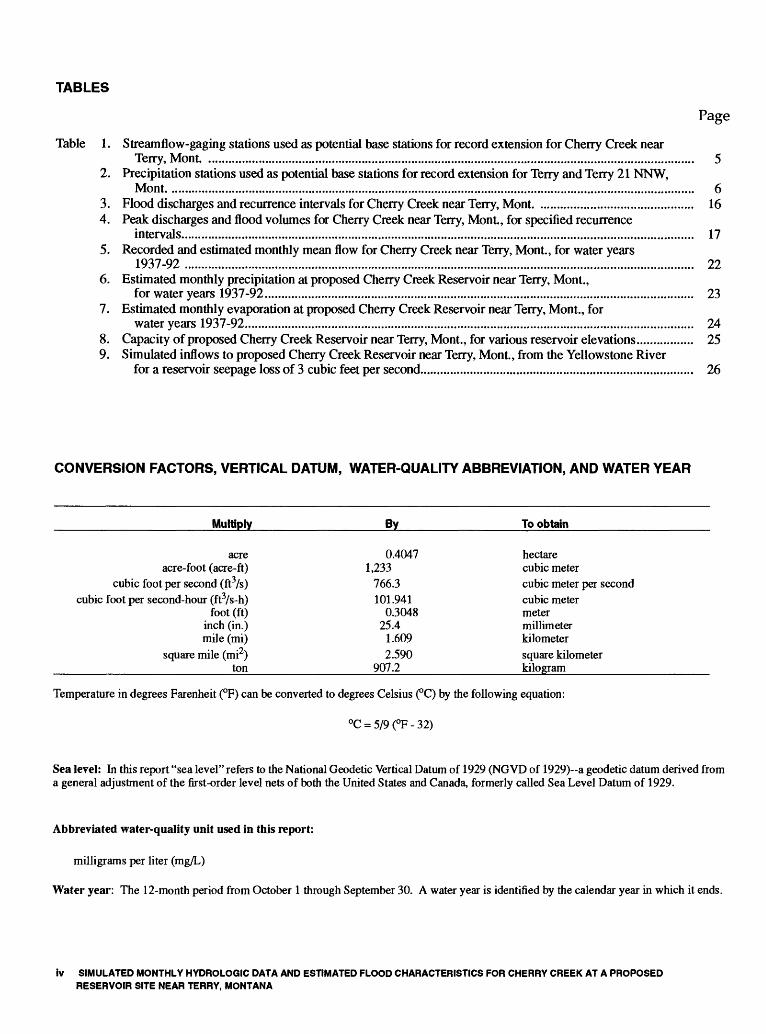
for water years 1937-92................................................................................................................................. 237. Estimated monthly evaporation at proposed Cherry Creek Reservoir near Terry, Mont., for
water years 1937-92....................................................................................................................................... 248. Capacity of proposed Cherry Creek Reservoir near Terry, Mont., for various reservoir elevations................. 259. Simulated inflows to proposed Cherry Creek Reservoir near Terry, Mont., from the Yellowstone River
for a reservoir seepage loss of 3 cubic feet per second.................................................................................. 26
CONVERSION FACTORS, VERTICAL DATUM, WATER-QUALITY ABBREVIATION, AND WATER YEAR
Multiply
acreacre-foot (acre-ft)
cubic foot per second (ft3/s)cubic foot per second-hour (ft3/s-h)
foot (ft)inch (in.)mile (mi)
square mile (mi2)ton
By
0.40471,233
766.3101.941
0.304825.4
1.6092.590
907.2
To obtain
hectarecubic metercubic meter per secondcubic metermetermillimeterkilometersquare kilometerkilogram
Temperature in degrees Farenheit (°F) can be converted to degrees Celsius (°C) by the following equation:
°C = 5/9 (°F - 32)
Sea level: In this report "sea level" refers to the National Geodetic Vertical Datum of 1929 (NGVD of 1929) a geodetic datum derived from a general adjustment of the first-order level nets of both the United States and Canada, formerly called Sea Level Datum of 1929.
Abbreviated water-quality unit used in this report:
milligrams per liter (mg/L)
Water year: The 12-month period from October 1 through September 30. A water year is identified by the calendar year in which it ends.
ivRESERVOIR SITE NEAR TERRY, MONTANA

SIMULATED MONTHLY HYDROLOGIC DATA AND ESTIMATED FLOOD CHARACTERISTICS FOR CHERRY CREEK AT A PROPOSED RESERVOIR SITE NEAR TERRY, MONTANA
By Charles Parrett and Dave R. Johnson
Abstract
Methods used to simulate a monthly hydro- logic budget for water years 1937-92 for the pro posed Cherry Creek Reservoir (maximum volume about 14,100 acre-feet) are described and monthly results of the simulation are presented. The budget is based on recorded and estimated streamflow, precipitation, evaporation, and estimated reservoir seepage. The budget also includes water diver sions from the Yellowstone River whenever the reservoir depth was less than 20 feet (minimum operating level of 2,260 feet) and outflows when ever the reservoir elevation exceeded a maximum operating level of 2,290 feet. Monthly suspended- sediment and dissolved-solids concentrations in the reservoir were estimated from regression rela tions between logarithms of concentration and streamflow for Cherry Creek and for the Yellow- stone River near Sidney, Montana.
The results of the reservoir simulation indi cate that flows from Cherry Creek, an intermittent stream having a drainage area of about 360 square miles, generally were adequate to maintain the res ervoir elevation above the minimum operating level if no seepage loss occured. With a seepage loss of 3 cubic feet per second, flow diversions from the Yellowstone River were required for 34 percent of the months to maintain the reservoir ele vation at minimum operating level. The reservoir elevation generally was maintained near maxi mum operating level for a seepage loss of 0 cubic feet per second, but generally was close to mini mum operating level for a seepage loss of 3 cubic feet per second. Cumulative sediment deposition for the 56-year period was estimated to be about 138 acre-feet from Cherry Creek alone and only slightly more (149 acre-feet) when additional water was imported from the Yellowstone River.
The simulated concentration of dissolved solids in the reservoir showed a slightly increasing trend over time, interrupted by several large decreases, for no reservoir seepage loss. The max imum concentration for no seepage loss reached a maximum value of about 2,500 milligrams per liter in 1982. For a seepage loss of 3 cubic feet per second, water was imported from the Yellowstone River, and the concentration generally ranged from about 500 to about 1,200 milligrams per liter throughout the period.
Flood hydrographs and volumes for flood discharges having 25-, 50-, and 100-year recur rence intervals were estimated from synthetic 24- hour duration storms having total storm depths with recurrence intervals of 25, 50, and 100 years. These synthetic storms were used in a rainfall-runoff model (HEC-1) based on the Clark unit-hydrograph method to develop flood hydrographs from which volumes were computed. The peak discharges of the 25-, 50-, and 100-year flood hydrographs determined from the rainfall- runoff model compared closely to the 25-, 50-, and 100-year peak discharges determined from regional equations developed by the U. S. Geolog ical Survey. The volume of the 100-year hydrograph developed from the HEC-1 model was about 11,250 acre-feet.
INTRODUCTION
The Bureau of Land Management proposes to construct a reservoir for recreation and fish-and- wildlife habitat enhancement on Cherry Creek in Prai rie County, Mont. (Bureau of Land Management, 1991, p. 1-3). Hydrologic information is required for the design and management of the reservoir. Because Cherry Creek is an intermittent stream with highly vari able flows, inflows to the proposed reservoir may need to be augmented at times by flow diversions from the
Abstract

Yellowstone River to ensure that the reservoir depth at the dam is maintained at a specified minimum of 20 ft (minimum operating level of 2,260.0 ft) (D.G. Pisto- rius, Bureau of Land Management, written commun., 1992). For planning purposes, a monthly hydrologic budget is needed to determine the quantity and timing of diversions that would be needed from the Yellow- stone River to maintain the minimum operating level.
The reservoir is expected to contain all inflow with the exception of occasional flood events that would cause the water in the reservoir to exceed a spec ified maximum operating level of 2,290.0 ft (D.G. Pis- torius, Bureau of Land Management, written commun., 1992). Because water lost from the reservoir generally will be due to seepage and evaporation, the effects of accumulated sediment and dissolved solids in the res ervoir need to be considered.
In addition to the monthly hydrologic budget and effects of accumulated sediment and dissolved solids, hydrographs and volumes for the 25-, 50-, and 100- year frequency floods also need to be determined for spillway design purposes. The U.S. Geological Sur vey, in cooperation with the Bureau of Land Manage ment and the Montana Bureau of Mines and Geology, conducted a study to simulate a long-term monthly hydrologic budget for the proposed Cherry Creek Res ervoir, estimate suspended-sediment loads and dis solved-solids concentrations in the reservoir, and estimate hydrographs and runoff volumes for the 25-, 50-, and 100-year floods on Cherry Creek. For pur poses of the hydrologic analysis, it was assumed that a spillway or some other kind of reservoir outlet would allow outflows when the reservoir elevation exceeds a specified maximum operating level.
Purpose and Scope
This report presents results of simulations of the hydrologic budget, suspended-sediment loads and dissolved-solids concentrations, and estimates of the 25-, 50-, and 100-year flood hydrographs and volumes for Cherry Creek at the proposed reservoir site. The hydrologic budget is based on recorded and estimated streamflow, precipitation, evaporation, and reservoir seepage for water years 1937-92. The budget includes water diversions from the Yellowstone River whenever the reservoir elevation is less than 2,260.0 ft and reser voir outflows whenever the reservoir elevation exceeds 2,290.0 ft. Monthly streamflow and precipitation were estimated using a multi-station record-extension proce dure. Pan-evaporation data were adjusted to simulate Cherry Creek reservoir evaporation. Monthly concen trations of suspended sediment and dissolved solids
were estimated from regression relations between these constituents and streamflow for Cherry Creek and the Yellowstone River. The suspended-sediment concen trations were used to compute loads and the cumulative sediment deposition in the reservoir. The dissolved- solids concentrations were used to compute loads and resultant increases in concentration over time. A rainfall-runoff simulation model was used to estimate flood hydrographs and volumes. Flood peaks were estimated by the simulation model and regional regres sion equations.
Site Description
The proposed dam site on Cherry Creek is located in northern Prairie County about 3 miles north east of Terry, Mont. (fig. 1). Upstream from the pro posed dam site, Cherry Creek drains about 360 mi2 of sparsely populated, rolling uplands. The drainage sys tem is well developed and the area is vegetated with medium-height grasses and scattered shrubs. The basin has moderate relief, with land surface elevations rang ing from about 2,240 to 3,625 ft.
The climate of the Cherry Creek basin typically is continental with cold, dry winters and hot summers. Based on the 1951-80 period, mean monthly tempera tures at Terry range from 72.0 °F in July to 11.5 °F in January. Based on the 1951-80 period, the average annual precipitation at Terry is 11.3 in., with 8.3 in. occurring from April through August. June is the wet test month with an average of 2.6 in. of precipitation, and March is the driest with an average of 0.2 in. (National Climate Data Center, 1990 and 1991).
At the proposed dam site (fig. 1), the bottom of the reservoir is at an elevation of approximately 2,240.0 ft. At the specified minimum operating level of 2,260.0 ft, the reservoir has a surface area of about 177 acres and a volume of about 2,100 acre-ft. At the spec ified maximum operating level of 2,290.0 ft, the reser voir has a surface area of about 569 acres and a volume of about 14,100 acre-ft.
Because of the sparse annual precipitation and lack of a mountain snowpack or large ground-water inflow to sustain base flows, Cherry Creek is an inter mittent stream that commonly flows only when the prairie snow cover melts or in response to spring and summer rainstorms. The largest known flows have been the result of intense summer rainstorms.
RESERVOIR SITE NEAR TERRY, MONTANA

I050 I7'30"
Approximate boundary proposed reservoir
V ft x .- j'x*=i'<-l^~j M- vj-icwmgwell ,K- v- V ^<£^v ;-^!). ->*. ^-'-x\ V^-, ^T^^T^- ^^^'^^1
AI3IOOO 177500 329200
r
294940 Z2tf9t50°30840̂ ,_ A\ 326600
EXPLANATION
329200A STREAMFLOW-GAGING STATION AND ABBRE VIATED STATION NUMBER
EVAPORATION STATION AND NAME
PRECIPITATION STATION AND NAME
50 100 KILOMETERS
Figure 1. Location of Cherry Creek Basin and selected streamflow-gaging, evaporation, and precipitation stations.
INTRODUCTION 3

Description of Available Data
Daily streamflow and annual peak-discharge data are available for Cherry Creek for water years 1980-81 and 1990-92 at the Cherry Creek near Terry gaging station (06326555) located near the upstream end of the proposed reservoir. Water-quality data are available for water years 1978-81 and 1990-92 for determination of suspended-sediment concentra tions and water years 1978-81 for determination of dissolved-solids concentrations. For the Yellowstone River, the proposed source of supplemental water sup ply to the proposed reservoir, daily streamflow data for the Yellowstone River near Sidney gaging station (06329500) are available for water years 1934-92. At this site, water-quality data are available for water years 1972-81 and 1983-92 for determination of suspended-sediment concentrations and for water years 1964-81 for determination of dissolved-solids concen trations.
Monthly precipitation data are available for National Weather Service stations at Terry for most of the period 1950-92 and Terry 21NNW for most of the period 1951 and 1962-92. Average monthly precipita tion for Cherry Creek Basin is presumed to be equal to the average of the monthly precipitation at the two National Weather Service stations.
Although some evaporation data are available for the Terry station, the period of record is short and data are sparse. Monthly evaporation data for most of the growing season (April through October) are avail able for the National Weather Service station at Hunt- ley for the period 1911-92.
ESTIMATION OF MONTHLY DATA
To assess long-term characteristics of reservoir fluctuation and supplemental flow needs, a long period of record for components of the hydrologic budget is required. However, the periods of record for stream- flow, precipitation, and evaporation in the Cherry Creek Basin are not concurrently long or complete. In addition, suspended-sediment and dissolved-solids data are discrete rather than continuous data and are from a relatively small number of samples. Therefore, data for each component need to be estimated to pro vide a long, concurrent period of record. Water years 1937-92 were selected as the period of record for the simulation of reservoir operation because they are con sidered to be representative of a wide range of hydro- logic conditions, including the drought years in the late 1930's, the 1950's, and the 1980's and several wet years in the 1960's and 1970's. In addition, the 1937- 86 base period was used in previous streamflow estima
tion studies done for the Montana Departments of Fish, Wildlife and Parks (Parrett and others, 1989) and Nat ural Resources and Conservation (Parrett and Johnson, 1989,1994), and using the 1937-92 base period for this study ensures that estimates from this study represent hydrologic conditions occurring during previous stud ies.
Hydrologic Budget
A monthly record-extension program developed by Alley and Burns (1983) was used to estimate monthly flows for Cherry Creek for the 1937-92 base period. This program uses a mixed-station procedure that selects the best base station from all those available in a region to estimate each month of missing data for a site. Thus, several base stations may be used for making estimates for a single site. The criterion for selection is to use the base station that results in the smallest standard error of prediction for that month. Once a base station is selected for estimating a missing monthly flow, several different curve-fitting techniques are available in the record-extension program for developing a relation between concurrent flows at the base station and the site requiring an estimate. The curve-fitting technique used in this study is the MOVE.l (Maintenance of Variance Extension, Type 1) technique described by Hirsch and Gilroy (1984). This technique is preferred over ordinary least squares (OLS) regression techniques because MOVE. 1 pre serves the variance of the unextended record whereas OLS regression results in an extended record with a smaller variance than the unextended record.
Streamflow-gaging stations and their periods of record since 1937 that were used as potential base sta tions for the extension of flow records for Cherry Creek are listed in table 1. Also shown in table 1 is the num ber of times each station was used to estimate a missing monthly flow for Cherry Creek. The base station used most frequently, Big Dry Creek near Van Norman (06131000), was used to estimate 355 values of monthly flow. The average standard error of predic tion, an error measurement used in the record- extension program that is always slightly greater than the standard error of estimate, for the 617 estimates made for Cherry Creek was 522 percent. Although this standard error of prediction may seem unacceptably large, the magnitude of the error needs to be consid ered. More than half of the 55 recorded monthly flows for Cherry Creek are 0 and the mean of the 55 values is 0.3 ft3/s, resulting in a large number of zero and near- zero estimated flows. Thus, a large standard error in percent does not necessarily imply large absolute errors
RESERVOIR SITE NEAR TERRY, MONTANA

Table 1. Streamflow-gaging stations used as potential base stations for record extension for Cherry Creek near Terry, Mont.
Station number
061310000613120006169500061765000617750006294940062949950629600306307600063077400630840006309000063090750632450006326300063265000632660006326952063292000632950006336500
Station name
Big Dry Creek near Van Norman, Mont.Nelson Creek near Van Norman, Mont.Rock Creek below Horse Creek, near International BoundaryWolf Creek near Wolf Point, Mont.Redwater River at Circle, Mont.Sarpy Creek near Hysham, Mont.Armells Creek near Forsyth, Mont.Rosebud Creek at mouth, near Rosebud, Mont.Hanging Woman Creek near Birney, MontOtter Creek at Ashland, Mont.Pumpkin Creek near Miles City, Mont.Yellowstone River at Miles City, Mont.Sunday Creek near Miles City, Mont.Powder River at Moorhead, Mont.Mizpah Creek near Mizpah, Mont.Powder River near Locate, Mont.O'Fallon Creek near Ismay, Mont.Clear Creek near Lindsay, Mont.Burns Creek near Savage, Mont.Yellowstone River near Sidney, Mont.Beaver Creek at Wibaux, Mont.
Period of record since 1937
1940-69;1971-921982-85:19881957-921951-53;1982-921937-71;1975-921973-84!975-84;l988-921975-921974-84; 1986-921973-85-.1988-921972-85;19871937-921975-841937-72;1975-921975-861939-921978-911982-85;19881958-67;l975-841937-921938-69;1979-83
No. of times station used to
estimate missing flows
for Cherry Creek
35529
0133
100000179000
1000
720
in individual estimates. Estimated and recorded monthly flows for the base period are shown in table 5 at the back of the report. The mean annual flow of Cherry Creek for the 1937-92 period is 3.9 ft3/s (2,800 acre-ft).
The same record-extension program used to extend flow records for Cherry Creek was used to extend the precipitation records for the 1937-92 base period for the National Weather Service stations Terry and Terry 21 NNW. In this instance, 12 other precipi tation stations in eastern Montana were used as poten tial base stations. The potential base stations, their periods of record, and the number of times each was used to estimate missing values of monthly precipita tion at either Terry or Terry 21 NNW are shown in table 2. The average standard error of prediction for the 181 estimates made for Terry was 96 percent, and the aver age standard error of prediction for the 291 estimates made for Terry 21 NNW was 71 percent. Estimated monthly precipitation depths, expressed in ft, for the Cherry Creek Basin for the base period are shown in table 6 at the back of the report. The estimated mean annual precipitation depth for the base period is 0.96 ft (11.5 in.).
Reservoir evaporation for the base period was estimated from pan-evaporation data collected at Hunt- ley, Mont. Pan-evaporation data for Huntley are avail able for May through September for most years and for April through October for some years. Pan evaporation for months of missing data during the 1937-92 period was estimated using an OLS regression equation relat ing monthly pan evaporation to monthly mean maxi mum temperature at Huntley. The coefficient of determination (r2) for the regression equation was 55 percent and the standard error of estimate was 18 per cent. The measured and estimated values of monthly pan evaporation for the 1937-92 base period at Huntley were converted to estimated monthly pan evaporation at Terry by multiplying by the ratio of monthly mean maximum temperature at Terry to the monthly mean maximum temperature at Huntley. For example, for a month when the monthly mean maximum temperature at Terry was 80 °F and the monthly mean maximum temperature at Huntley was 75 °F, the estimated pan evaporation at Terry would be (80/75), or 1.067 times the measured or estimated pan evaporation at Huntley. The estimated monthly pan evaporation at Terry was converted to reservoir evaporation by multiplying by a
ESTIMATION OF MONTHLY DATA

Table 2. Precipitation stations used as potential base stations for record extension for Terry and Terry 21 NNW, Mont. [Symbol: --, not applicable]
Station name Period of record since 1937No. of times station used to estimate missing values of
precipitation for Terry or Terry 21 NNW
EkalakaMizpah4NNWWibaux 2 EPlevnaMildred 5 NBrockway 3 WSWCohagenRock SpringsMiles City FAAAPGlendiveTerryTerry 21 NNW
1937-911950-911949-921937-911980-911960-911967-911952-911937-911937-92
1 1950-9221 950-51; 1962-92
Terry100
130100
7591 0
Terry 21 NNW40101913
1520
26174
1--
1Twenty-five months of missing data during period. 2Fifteen months of missing data during period.
monthly pan coefficient. The coefficients were empir ically derived by Knapp and others (1982, p. 81) and Kohler (1954, p. 140). Estimated monthly evaporation depths, expressed in ft, for the proposed Cherry Creek reservoir for the base period are shown in table 7 at the back of the report. The estimated mean annual evapo ration depth for the period is 2.73 ft.
Suspended Sediment and Dissolved Solids
Monthly values of suspended-sediment concen tration for Cherry Creek were estimated from an OLS linear regression equation relating the logarithm of sus pended-sediment concentration, in milligrams per liter, to the logarithm of streamflow, in cubic feet per second (fig. 2). The log-linear regression equation was derived from 75 samples obtained under varying conditions of flow during the sampling period of record. The rz was 0.56, and the standard error of estimate was 278 per cent.
Monthly values of dissolved-solids concentra tion for Cherry Creek were estimated from a similar equation relating the logarithm of dissolved-solids con centration, in milligrams per liter, to the logarithm of streamflow, in cubic feet per second (fig. 2). The regression equation for estimation of dissolved-solids concentration was based on 33 samples obtained under varying conditions of flow during the sampling period of record and had an r2 of 0.65 and a standard error of estimate of 38 percent.
Log-linear OLS regression equations also were used to estimate the suspended-sediment and dis solved-solids concentrations of inflows from the Yel- lowstone River (fig. 3). The regression equation for estimation of suspended-sediment concentrations was based on 211 samples obtained from the Yellowstone River near Sidney during the sampling period of record and had an r2 of 0.50 and a standard error of estimate of 148 percent. The equation for the estimation of dissolved-solids concentrations was based on 154 sam ples from the Yellowstone River near Sidney and had an r2 of 0.31 and a standard error of estimate of 27 per cent.
The regression relations shown in figures 2 and 3 are poor, as indicated by the large amount of scatter about the regression lines. Nevertheless, the authors considered them adequate to provide reasonable esti mates of the average concentrations of suspended sed iment and dissolved solids for monthly mean flows for Cherry Creek and the Yellowstone River near Sidney. For the 1937-92 base period, the concentration of sus pended sediment for the average flow in Cherry Creek was 240 mg/L and for the average flow in the Yellow- stone River was 450 mg/L. Similarly, the concentra tion of dissolved solids for the average flow in Cherry Creek was 1,040 mg/L and for the average flow in the Yellowstone River was 420 mg/L.
RESERVOIR SITE NEAR TERRY, MONTANA

100,000
£ 10,000
o zee
EZO-
Og
1,000
100 i r
0.01
LCX3 CHERRYSED = 2.08 + 0.502(LCX3 Q)
^-0.56
0.1 1 10 100
STREAMFLOW (Q), IN CUBIC FEET PER SECOND
1,000 10.000
10.000
LOG CHERRYDS = 3.12-0.172(LOGQ)
0.1 1 10
STREAMFLOW (Q). IN CUBIC FEET PER SECOND
100 1,000
Figure 2. Regression relations for suspended-sediment and dissolved-solids concentrations for Cherry Creek near Terry, Mont.
ESTIMATION OF MONTHLY DATA 7

10,000
[il 1.000
8
ozui CO6 ui o01a.CO
CO
100 -
10100
' ' '»
s*x .IS?.
LOG YELLOWSED = -1.46 + 1.00(LOG Q) .
1,000 10,000 100,000
STREAMFLOW (Q), IN CUBIC FEET PER SECOND
1,000,000
1,000
700
01Jtr 500 5 uj
400
300
200
100
LOG YELLOWDS = 3.62 - 0.243(LOG Q)
r2 = 0.31
100 1,000 10,000
STREAMFLOW (Q), IN CUBIC FEET PER SECOND
100,000
Figure 3. Regression relations for suspended-sediment and dissolved-solids concentrations for Yellowstone River near Sidney, Mont.
8 SIMULATED MONTHLY HYDROLOGIC DATA AND ESTIMATED FLOOD CHARACTERISTICS FOR CHERRY CREEK AT A PROPOSED RESERVOIR SITE NEAR TERRY, MONTANA

SIMULATION ALGORITHMS
Simulation of monthly conditions in the pro posed reservoir requires that components of the hydro- logic budget and suspended-sediment and dissolved- solids concentrations and loads be computed on a monthly basis. The equations and procedures for sim ulating the hydrologic budget and suspended-sediment and dissolved-solids concentrations and loads are described in the following two sections. The algo rithms are based on the assumption that Yellowstone River inflows are added to the reservoir as needed at the end of the month after all other computations for Cherry Creek inflows, precipitation, seepage, and evaporation are completed. Actual reservoir operation would require some forecasting of flows from Cherry Creek and perhaps day-to-day inflows from the Yel lowstone River to ensure that minimum reservoir ele vations were always met.
Hydrologic Budget
The monthly hydrologic budget for the proposed Cherry Creek reservoir can be described by the follow ing mass-balance equation:
where Ij and Oj are the reservoir inflow and outflow,respectively, for month i;
Vj and Vj.j are the reservoir volumes at theend of months i and i-1, respectively; and all terms are expressed in units of volume as acre-ft.
The components of each term in the mass-balance equation and the algorithm for making computations are described below.
Sources of inflow to the proposed Cherry Creek reservoir include Cherry Creek, the Yellowstone River whenever reservoir elevation falls below 2,260.0 ft, and precipitation over the reservoir surface. Although a flowing well is known to exist near the proposed res ervoir, ground-water inflow to the reservoir was con sidered to be negligible because Cherry Creek is known to be an ephemeral or intermittent stream throughout its length. Outflows include reservoir seepage losses, evaporation, and flows through the principal reservoir outlet or the spillway whenever the maximum operat ing level of 2,290.0 ft is exceeded.
Reservoir volume at the beginning of the 1937- 92 simulation period was presumed to be that for the minimum operating level of 2,260.0 ft. For all subse quent months, the relation between reservoir elevation
and volume was determined from a reservoir elevation- capacity table. The elevation-capacity table was based on data furnished by the Bureau of Land Management (1991). An abbreviated elevation-capacity table is shown in table 8 at the back of the report.
Reservoir seepage loss is the hydrologic-budget component that probably is least accurately known. Because of the lack of reliable information, two differ ent values of reservoir seepage were used in the hydro- logic-budget computations to determine the relative effects of possible error in the seepage term. The low est possible value of seepage loss (0 ft3/s) was used for one set of computations and a value (3 ft3/s) used in a previous study for Cherry Creek by the Bureau of Rec lamation (Calcagno and Parish, 1990) and presumed to be conservatively large was used in the second set of computations.
Equation 1 is not explicitly solvable for reservoir volume because several components of monthly inflow volume (precipitation and inflows from the Yellow- stone River) and outflow volume (evaporation and out let flows) are dependent upon reservoir elevation or volume. Accordingly, the following multi-step solu tion procedure was used. First, Cherry Creek was ini tially considered to be the only source of reservoir inflow, and seepage loss was initially considered to be the only source of outflow. Equation 1 was modified, rearranged, and solved for a trial value of reservoir vol-
A
ume, V; as follows:
j = Q x (CHERRYi - SEEP) + (2)
where Q is a conversion factor used to convert the units for monthly flow, in cubic ft per second, to volume, in acre-feet, and is equal to 1.9835 times the number of days in month i;
CHERRYi is the inflow, in cubic feet per second, from Cherry Creek for month i;
SEEP is the seepage loss, in cubic feet per second, from the reservoir (either 0 or 3); and the other terms are as previously defined.
After Vj was computed using equation 2, the eleva
tion-capacity table for the reservoir was used to deter-A A
mine the reservoir elevation, Ej, corresponding to Vj ,
and precipitation and evaporation depths were algebra ically added to the reservoir elevation to obtain a revised, more correct reservoir elevation, Ej:
EJ= (3)
SIMULATION ALGORITHMS 9

where PJ and EVAP^ are, respectively, the monthly precipitation and evaporation depths in ft.
Before the reservoir volume for the end of month i was calculated, the reservoir elevation was checked to ensure that it was not below the minimum operating level of 2,260.0 ft or above the maximum operating level of 2,290.0 feet. If the reservoir elevation was below 2,260.0 ft, the Yellowstone River inflow in cubic feet per second, YELLOWj, was calculated as the difference between the reservoir volumes corre sponding to 2,260.0 ft and Ej divided by the conver sion factor, Q:
YELLOWi = (Vnin - VEi)/Ci, (4)
where V^ and VEI are the reservoir volumes,obtained from the reservoir elevation- capacity table, corresponding to elevations 2,260.0 and Ej, respectively; and
Q is as defined for equation 2.
Similarly, if Ej exceeded the maximum operating level, the rate of reservoir outlet flow, OUTFLOW^ in cubic feet per second was calculated as follows:
OUTFLOWi =(VEi -Vmax)/Ci, (5)
where Vmax is the reservoir volume corresponding to the maximum operating level of 2,290.0 ft and the other terms are as previously defined.
Finally, the reservoir volume for the end ofmonth i,Vi ,was calculated as follows:
Vi = VEi + (YELLOWi - OUTFLOW^ x Q (6)
where all terms are as previously defined. For reser voir elevations between 2,260.0 ft and 2,290.0 ft, YELLOWi and OUTFLOWi are both equal to 0.0.
Suspended-Sediment Load and Dissolved- Solids Concentration
After the hydrologic-budget algorithm was used to simulate reservoir inflow and outflow components, volumes, and elevations, the monthly suspended-sedi ment loads to the reservoir and concentration of dis solved solids in the reservoir were simulated based on the assumptions that chemical reactions or stratification within the reservoir were insignificant. The equation for calculating suspended-sediment load to the reser voir is as follows:
i = Ki x (CHERRYSEDi x CHERRYi + YELLOWSEDi x YELLOW;), (7)
where LOAD; is the suspended-sediment load to the reservoir for month i, in tons;
Kj is a conversion factor used to convert concentration units, in milligrams per liter, times discharge units, in cubic feet per second, to load units, in tons, and is equal to 0.0027 times the number of days in month i;
CHERRYSEDj is the concentration ofsuspended sediment in Cherry Creek formonth i, in milligrams per liter,
CHERRYi is the monthly average inflow tothe reservoir from Cherry Creek, in cubicfeet per second;
YELLOWSEDi is the concentration ofsuspended sediment in the Yellowstone River for month i, in milligrams per liter; and
YELLOWi is me monthly average inflow to the reservoir from the Yellowstone River, in cubic feet per second.
Although reservoir outflows were significant for some months, outflows were negligible or absent during most months. Therefore, it was assumed that all sus pended sediment would be deposited in the reservoir. This assumption is considered to be conservative in that computations assuming no sediment loss in out flows would tend to overestimate sediment deposition in the reservoir. Because the cumulative sediment loading to the reservoir results in a reduced reservoir capacity, sediment volume also was computed as:
LOADVOLi = LOADi x (0.000656), (8)
where LOADVOLj is the volume of suspendedsediment delivered to the reservoir during month i, in acre-ft;
LOADj is as defined for equation 7; and0.000656 is a conversion factor for
converting tons of sediment to acre-ft based on an assumed unit weight of sediment of 70 Ib/ft3 .
The cumulative total volume of sediment in the reser voir for any month i is:
VOLi = VOL i_! + LOADVOLi, (9)
where VOLj and VOLj.i are the cumulative totalvolumes of sediment at the end of months i and i-1, respectively, in acre-ft; and
LOADVOLi is as defined for equation 8. Mass balance calculations were used to compute
the concentration of dissolved solids in the reservoir at the end of each month. The change in total mass of dis solved solids in the reservoir from the end of a previous month, i-1, to the current month, i, is expressed as:
RESERVOIR SITE NEAR TERRY, MONTANA

CHANGEi = [(RESCONQ x Vj) - (RESCONQ.! x, (10)
where CHANGE^ is the change in mass ofdissolved solids in the reservoir during month i, in tons;
RESCONQ and RESCONQ.! are the concentrations of dissolved solids, in milligrams per liter, in the reservoir at the ends of months i and i-1, respectively;
Vj and Vi_i are the reservoir volumes in acre-feet, at the ends of months i and i-1, respectively; and the other terms are as previously defined.
The change in mass of dissolved solids in the reservoir results from a mass gain from inflows from Cherry Creek and the Yellowstone River and a mass loss from reservoir outlet flows and seepage. The mass gain in dissolved solids during month i can be expressed as:
GAINi = Ki x (CHERRYDSi x CHERRYj +YELLOWDSi xYELLOWi), (11)
where GAINi is the mass gain in dissolved solidsin the reservoir during month i, in tons;
CHERRYDSi is the concentration ofdissolved solids in Cherry Creek for month i, expressed in milligrams per liter,
YELLOWDSi is the concentration ofdissolved solids in the Yellowstone River for month i in milligrams per liter, and
CHERRYi and YELLOWi are as previously defined for equation 7.
The mass loss of dissolved solids during month i can be expressed as:
= iq x (OUTFLOWi + SEEP) x ( RESCONQ + RESCONCM)/2, (12)
LOSSi *s the mass loss in dissolved solids from the reservoir during month i in tons;
(RESCONCi + RESCONCi-i)/2 represents an average value of concentration of dissolved solids in the reservoir during month i based on the concentrations at the end of months i and i-1; and all other terms are as previously defined.
To satisfy the condition of mass balance of dis solved solids in the reservoir, the change in dissolved solids during month i has to equal the mass gain in dis solved solids minus the mass loss in dissolved solids:
where
CHANGEi = GAINi - (13)
Substituting the expressions in equations 10 and 12 for the change and loss terms in equation 13 and
solving for the concentration of dissolved solids at the end of month i, RESCONCi, yields the following:
RESCONCi = [(RESCONQ.O x VM x (Q/K^) + GAINi - (Ki/2) x (SEEP + OUTFLOWi) x RESCONQ.!]/ [Vi x (Q /Kj) + (Ki/2) x
(SEEP+OUTFLOW^], (14)
where all terms are as previously defined.
SIMULATION RESULTS
The hydrologic-budget, suspended-sediment, and dissolved-solids algorithms were used to compute monthly inflows from the Yellowstone River and reser voir elevations, volumes, sediment volumes, and dissolved-solids concentrations for the 1937-92 base period for the two different values of reservoir seepage. Because the simulations showed that Yellowstone River inflows were required for only 4 months during the first year when reservoir seepage was 0 ft3/s, no table or figure is shown for that value of seepage. The results of the simulations for Yellowstone River inflows for a reservoir seepage of 3 ft3/s are shown in table 9 at the back of the report and are displayed graphically in figure 4. Simulation results for reser voir outflows, elevations, volumes, sediment volumes, and dissolved-solids concentrations are shown graphi cally in figures 5-10.
For a reservoir seepage loss of 0 ft3/s, simula tions indicate that inflows from the Yellowstone River were required for only 4 months in 1937 to maintain minimum operating water levels in the reservoir. The maximum monthly inflow from the Yellowstone River was 1.3 ft3/s, and the average annual required inflow was less than 0.01 ft3/s. In general, reservoir inflows from Cherry Creek were adequate to keep the reservoir elevation above the minimum operating level when seepage from the reservoir was 0 ft3/s.
For a reservoir seepage of 3 ft3/s, table 9 and fig ure 4 show that Yellowstone River inflows were required for 226 months out of 672, or 34 percent of the months, to keep reservoir elevations above the mini mum operating level. The maximum monthly Yellow- stone River inflow was 5.1 ft3/s, and the average annual inflow was 1.0 ft3/s.
Figure 5 shows simulated monthly reservoir out flows for a seepage loss of 0 ft3/s, and figure 6 shows simulated monthly reservoir outflows for a seepage loss of 3 ft3/s. In general, outflows occurred about twice as often and were greater for conditions of no seepage loss. Supplemental inflows from the Yellow- stone River primarily serve to balance the water lost as seepage and do not necessarily increase
SIMULATION RESULTS 11

in cr coLLJ DC > 111 DC°-
jo gmS3
^OOOCVI't(£)OOO<N't(£)00
YEAR
Figure 4. Simulated inflows to proposed Cherry Creek Reservoir near Terry, Mont., from the Yellowstone River for a reservoir seepage loss of 3 cubic feet per second.
niu
350
Q_ z
1§U- W 250br DC
RESERVOIR Ol N CUBIC FEET PE
i i 1
50
n
i i i i i i i i i i i i
-
-
- i i i i i i i Ji i i i ,1
1
i li. i* i i i i i i i i i i i i ill 1 li i i i i i i i i lAu i i
i i i i i i
-
-
iL,i
YEAR
Figure 5. Simulated outflows from proposed Cherry Creek Reservoir near Terry, Mont., for condition of no seepage loss.
RESERVOIR SITE NEAR TERRY, MONTANA

Q
LL *' 't: GC2 LU O 0.
pLU 9 00 CD LU Z) CCQ
400
350
300
250
200
150
100
50
1, I J
YEAR
Figure 6. Simulated outflows from proposed Cherry Creek Reservoir near Terry, Mont., for a reservoir seepage loss of 3 cubic feet per second.
LU
LLcc
LU
Sm SH> LU > LU CC LLoz ccz"
cc
2,310
2,300
2,290
2,280
2,270
2,260
2,250
i i i i i i i i i i i i i i i i i i i i i i i i i i i i i i i
SEEPAGE = 0 CUBIC FEET PER SECOND
2)23o i i i i i i i i i i i i i i i i i i i i i i i i i i i i i i i i i i i i i i i i i i i i I i i I I I I I I I I I
YEAR
Figure 7. Simulated water-surface elevation of proposed Cherry Creek Reservoir near Terry, Mont., for two rates of reservoir seepage loss.
SIMULATION RESULTS 13

LU LU U_LLJ CT
zLU
O
CC
§DC LLI CO LLI DC
18,000
16,000
14,000
12,000
10,000
8,000
6,000
4.000
2,000
0
SEEPAGE = 0 CUBIC FEET PER SECOND SEEPAGE - 3 CUBIC FEET PER SECOND
I I I I I I I I I I I I I I I I I I I I I I I I I I I I I I I I I I I I I I I I I I I I I I I I I I I I I I I I
YEAR
Figure 8. Simulated volume of proposed Cherry Creek Reservoir near Terry, Mont., for two rates of reservoir seepage loss.
LU
sDC
00.LU Q
160
150
140
130
120
110
100
90
80
70
60
50
40
30
20
10
0
SEEPAGE = 0 CUBIC FEET PER SECOND
SEEPAGE = 3 CUBIC FEET PER SECOND
YEAR
Figure 9. Simulated cumulative volume of sediment depositbn in proposed Cherry Creek Reservoir near Terry, Mont., for two rates of reservoir seepage loss.
RESERVOIR SITE NEAR TERRY, MONTANA

DCoDC LJJ 00 LJJ DC
pffzoo 111 2o < z oc oo
op 6LJJ
00 00 Q
3.000
2,000
1.000
i i i i i
SEEPAGE = 0 CUBIC FEET PER SECOND
SEEPAGE = 3 CUBIC FEET PER SECOND
MONTANA CROP IRRIGATIONCRITERIA (Montana Department of Health
and Environmental Sciences, 1986)
' SECONDARY MAXIMUM CONTAMINANT LEVEL FOR DRINKING WATER (U.S. Environmental
Protection Agency, 1991) i i i i i i i i i i i i i i i ' ' ' i i i i i i i ' ' ' i ' i
U)tnu)tnu)cococo S CO CO 00 CO 00 00
YEAR
Figure 10. Simulated concentration of dissolved solids in proposed Cherry Creek Reservoir near Terry, Mont., for two rates of reservoir seepage loss.
outflow from the reservoir.
Figure 7 shows simulated reservoir elevations throughout the base period for the two rates of reservoir seepage loss. For a reservoir seepage of 0 ft3/s, reser voir elevations generally were maintained near the maximum operating level throughout most of the base period. For a reservoir seepage of 3 ft3/s, reservoir ele vations varied between the minimum and maximum operating levels, but generally were closer to the mini mum operating level.
Figure 8 shows simulated reservoir volumes for the two rates of reservoir seepage loss and corresponds to figure 7. For a reservoir seepage of 0 ft3/s, reservoir volume was fairly constant after the initial filling period and generally was near 14,000 acre-ft except for a dry period in the early 1960's. For a reservoir seep age of 3 ft3/s, reservoir volume varied from 2,100 acre-ft to 14,000 acre-ft, but generally was closer to 2,100 acre-ft.
Figure 9 shows the simulated cumulative sedi ment deposition in the reservoir for the two rates of res- ervoir seepage loss. Because of the additional sediment inflow in supplemental water diverted from the Yellowstone River, the cumulative volume of sedi ment deposition is slightly greater for a reservoir seep
age of 3 ft3/s than it is for a seepage of 0 ft3/s. The minimum reservoir volume of 2,000 acre-ft is not sub stantially decreased by 56 years of sediment deposition for either rate of sediment loading (138 to 149 acre-ft).
Figure 10 shows the effects of the two rates of reservoir inflows and seepage loss on the simulated concentration of dissolved solids in the reservoir. For a seepage loss of 3 ft3/s, Yellowstone River water is imported and the concentration of dissolved solids ranges from about 500 to about 1,200 mg/L. For a seepage loss of 0 ft3/s, Cherry Creek is the sole source of inflow and the concentration of dissolved solids shows a slightly increasing trend throughout the base period, interrupted by several large decreases when inflows were large. The concentration reaches a maxi mum value of about 2,500 mg/L in 1982. Thus, although a reservoir seepage loss of 3 ft3/s requires substantially more supplemental inflow from the Yel lowstone River and results in reservoir elevations and volumes substantially less than those for a full reser voir, the water quality, as measured by concentration of dissolved solids, is better for the condition of greater seepage and the importation of water from the Yellow- stone River.
SIMULATION RESULTS 15

ESTIMATES OF FLOOD HYDROGRAPHS AND VOLUMES
Because only 3 years of annual peak-discharge data are available for Cherry Creek, regional equations developed by the Geological Survey for estimating flood peaks at ungaged sites were used to estimate flood discharges having recurrence intervals of 25, 50, and 100 years (Omang, 1992, p. 64). The estimated peak discharges and associated recurrence intervals are shown in table 3.
Table 3. Flood discharges and recurrence intervals for Cherry Creek near Terry, Mont.
Discharge, In cubic feet per second
Recurrence Interval, In years
4,520
6,240
8,640
25
50
100
To estimate hydrographs and runoff volumes associated with the 25-, 50-, and 100-year peak dis charges, a rainfall-runoff simulation model developed by the U.S. Army Corps of Engineers (HEC-1) that is based on the Clark unit-hydrograph method was used to simulate runoff from basin-averaged precipitation excess on the Cherry Creek Basin. Precipitation excess is the total precipitation input to the basin minus infil tration and detention losses. Total precipitation input for each peak discharge was a synthetic storm having a 24-hour duration. Hourly values of precipitation for the 25-, 50-, and 100-year recurrence intervals were obtained from depth-duration data compiled by the National Weather Service (Miller and others, 1973) and corrected for the Cherry Creek drainage area by using a depth-area adjustment developed by the U.S. Soil Conservation Service and modified by Parrett (1986). The 24-hour-duration synthetic storm for each recur rence interval was developed by assigning the largest hourly value of rainfall depth to the 16th hour of the storm, the second and third largest values to the 15th and 14th hour, respectively, the fourth largest to the 17th hour, and so on in an alternating fashion until val ues were assigned to all 24 hours of the storm (Cud- worth, 1989, p. 58-61). The resultant synthetic storm hyetograph for the 100-year recurrence interval is shown in figure 11.
Infiltration and detention losses were estimated using the Curve Number method developed by the U.S. Soil Conservation Service (1972). This method requires that a Curve Number characterizing the ability
of the land surface to absorb precipitation be assigned to a basin. The Curve Number ranges from 0 to 100 where 0 represents a totally porous land surface that absorbs all precipitation and 100 represents a land sur face that has no absorption or detention. Based on a previous study in northeastern Montana (Parrett, 1986), the basin-average Curve Number for Cherry Creek was assumed to be 80.0.
For the Clark unit-hydrograph method, two vari ables are required to define a unit hydrograph for a basin. One variable, time of concentration (Tc), is a measure of the time required for a particle of water to travel from the farthest point in the basin to the basin outlet. The second variable, basin-storage coefficient (R), is a measure of the effect of temporary basin stor age on the shape of the hydrograph. Tc and R can be determined for a specific basin by analyzing one or more recorded storms and flood hydrographs or by using regional equations developed from recorded hydrograph data at numerous sites. A regional equa tion developed by Holnbeck and Parrett (1993) having a coefficient of determination (r2) of 0.91 and a stan dard error of estimate of 0.16 log units was used to cal culate Tc as 13.6 hours. Although Holnbeck and Paired: also developed a regional equation for R, this equation was not used because of its small coefficient of determination (0.47) and large standard error of esti mate (0.39 log units). Instead, a recorded flood hydrograph for June 25, 1991 was used to estimate an R value for Cherry Creek. The recorded flood hydrograph had a peak discharge of 4,720 ft3/s and an estimated flood volume of 2,300 acre-ft (fig. 12). As discussed by Sabol (1988), R was estimated from the recorded flood hydrograph by dividing the flood vol ume remaining at the inflection point of the recession limb of the hydrograph by the discharge at the inflec tion point (fig. 12). The value of R estimated from the recorded flood hydrograph for June 25, 1991 was 7 hours.
Flood hydrographs based on a runoff Curve Number of 80.0, a Tc of 13.6 hours, an R of 7 hours, and 24-hour duration synthetic storms having recur rence intervals of 25, 50, and 100 years are shown in figure 13. The peak discharges and flood volumes determined from the Clark unit-hydrograph method are shown together with the peak discharges determined from Geological Survey regional equations in table 4.
As shown in table 4, the peak discharges for the 25-, 50-, and 100-year synthetic storms as determined from the dark unit-hydrograph analysis are close to the corresponding peak discharges determined from Geological Survey regional equations. Thus, the flood volumes determined from the Clark unit-hydrograph method are also presumed to be reasonable.
RESERVOIR SITE NEAR TERRY, MONTANA

TOTAL PRECIPITATION = 2.05 INCHES
8 10 12 14 16
TIME , IN HOURS
18 20 24
Figure 11. Synthetic 100-year storm hyetograph for Cherry Creek Basin near Terry, Mont.
Table 4. Peak discharges and flood volumes for Cherry Creek near Terry, Mont., for specified recurrence intervals
Peak discharge, in cubic feet per second, for specified
method
Regional Clark unit- equation hydrograph
4,520 4,610 6,240 6,490 8,640 8,670
Flood volume, in acre-
feet
6,090 8,450
11,250
Recur rence
interval, in years
25 50
100
The flood volume for the 100-year storm is about 11,250 acre-ft. Monthly runoff for Cherry Creek can exceed the 100-year flood volume for months having more than one large storm or for months having pro longed snowmelt runoff in addition to one or more storms. For example, the estimated monthly mean flow for Cherry Creek for April 1952 (table 5) was 390 ftVs or about 23,200 acre-ft. In many basins in northeastern Montana, large floods in April 1952 caused record peak and monthly mean discharges as a result of April storms coupled with exceptionally large amounts of snowmelt runoff.
ESTIMATES OF FLOOD HYDROGRAPHS AND VOLUMES 17

Q
O
COocLL1 CL
LLl LLO CD
5,000
4,000
3,000
O 2,000
LLl O
O COQ
1,000
DISCHARGE AT INFLECTION POINT = 1,740 CUBIC FEET PER SECOND
VOLUME REMAINING AFTER INFLECTION POINT = 12,200 CUBIC FEET PER SECOND HOUR
0000 0200 0400 0600 0800 1000 1200 1400 1600 1800 2000 2200 2400
JUNE 25,1991
Figure 12. Hydrograph for Cherry Creek near Terry, Mont., for the flood of June 25,1991.
10,000
100-YEAR FLOOD
50-YEAR FLOOD
25-YEAR FLOOD
0 4 8 12 16 20 24 28 32 36 40 44 48 52 56 60 64 68 72
TIME, IN HOURS
Figure 13. Synthetic hydrographs for 25-, 50-, and 100-year floods for 24-hour duration storms for Cherry Creek near Terry, Mont.
18RESERVOIR SITE NEAR TERRY, MONTANA

SUMMARY
A reservoir for recreation and fish-and-wildlife habitat enhancement is proposed for Cherry Creek, an intermittent stream near Terry, Mont. A hydrologic budget for the proposed Cherry Creek Reservoir was simulated for the 1937-92 base period. Streamflow and precipitation were estimated for months of missing data using a multi-station record-extension procedure. Evaporation was estimated from nearby pan-evapora tion rates that were extrapolated by using monthly mean maximum-temperature ratios. Water diversions from the Yellowstone River were included in the bud get whenever reservoir elevations dropped below a specified minimum operating level of 2,260.0 ft. Out flows from the reservoir were considered on a monthly basis only when the reservoir elevation exceeded a maximum operating level of 2,290.0 ft. Monthly sus pended-sediment and dissolved-solids concentrations in the reservoir were estimated for the simulation period from regression relations between concentration and streamflow for Cherry Creek near Terry, Mont., and for the Yellowstone River near Sidney, Mont.
Because of the uncertainty about reservoir seep age loss, reservoir simulations were based on two val ues of seepage. One value was the lowest possible seepage loss, 0 ft3/s, and the other value was a constant loss rate of 3 ft3/s that was used in a previous investi gation of Cherry Creek Reservoir by the Bureau of Reclamation. The results of the reservoir simulations showed that inflows from Cherry Creek generally were adequate to keep the reservoir elevation above the min imum operating level if no seepage occurred. For a simulated reservoir seepage of 3 ft3/s, inflows from the Yellowstone River were required 34 percent of the months. The average monthly inflow from the Yellow- stone River required to maintain the minimum reser voir operating level was about 1.0 ft3/s for a reservoir seepage of 3 ft3/s. With minimal Yellowstone River inflows, the reservoir elevation generally was main tained near the maximum operating level under condi tions of no seepage, but generally was close to the minimum operating level for a seepage of 3 ft3/s.
Cumulative sediment deposition in the reservoir was 149 acre-ft for a reservoir seepage of 3 ft3/s and 138 acre-ft for a reservoir seepage of 0 ft3/s. The addi tional sediment deposition for a seepage of 3 ft3/s came from supplemental water diverted from the Yellow- stone River. The concentration of dissolved solids in the reservoir showed a slightly increasing trend inter rupted by several large decreases when seepage was 0 ft3/s and reached a maximum value of about 2,500 mg/L in 1982. The concentration of dissolved solids ranged from about 500 to 1,200 mg/L throughout the
base period for a reservoir seepage of 3 ft3/s. Water quality in the reservoir, as measured by the concentra tion of dissolved solids, thus is better for a reservoir seepage of 3 ft3/s because of the importation of water from the Yellowstone River.
Flood volumes for flood discharges having 25-, 50-, and 100-year recurrence intervals were computed from 24-hour duration synthetic storms having 25-, 50-, and 100-year recurrence intervals. The synthetic storms were used in the HEC-1 rainfall-runoff model to estimate flood hydrographs based on the Clark unit- hydrograph method. The resultant flood hydrographs were used to compute flood volumes. One variable used in the Clark unit-hydrograph method, time of con centration (Tc), was computed from a regional equation previously developed by the U.S. Geological Survey. The other variable used in the Clark unit-hydrograph method, basin-storage coefficient (R), was estimated by analyzing a recorded flood hydrograph for the flood of June 25, 1991. Rainfall infiltration and detention losses were estimated using the Curve Number approach. Based on a previous study in northeastern Montana, the basin-average Curve Number used for the Cherry Creek basin was 80.0. The peak discharges of the 25-, 50-, and 100-year flood hydrographs deter mined from the Clark unit-hydrograph method com pared closely to 25-, 50-, and 100-year peak discharges determined from regional equations developed by the U.S. Geological Survey. The volume of the 100-year flood hydrograph determined from the Clark unit- hydrograph method was about 11,250 acre-ft.
REFERENCES CITED
Alley, W.M., and Bums, A.W., 1983, Mixed-station exten sion of monthly streamflow records: Journal of Hydraulic Engineering, v. 109, no. 10, p. 1,272-1,284.
Bureau of Land Management, 1991, Draft Cherry Creek Project report: Miles City District Office, 31 p.
Calcagno, Frank, Jr., and Parish, L.M., 1990, Geologic and construction materials report for the Cherry Creek dam and reservoir sites northeast of Terry, Montana: Bureau of Reclamation, Great Plains Region, 43 p.
Cudworth, A.G., Jr., 1989, Flood hydrology manual: Den ver, Cob., Bureau of Reclamation, 243 p.
Hirsch, R.M., and Gilroy, E.J., 1984, Methods of fitting a straight line to data examples in water resources: Water Resources Bulletin, v. 20, no. 5, p. 705-711.
Holnbeck, S.R., and Parrett, Charles, 1993, Estimation of unit hydrographs for large floods at ungaged sites in Montana: U.S. Geological Survey Open-File Report 93-168,69 p.
Knapp, H.V., Yu, Y.S., and Pogge, B.C., 1982, Evaporation time series analysis for Milford Lake in Kansas: Amer-
SUMMARY 19

lean Water Resources Association, International Sym posium on Hydrometeorology, Denver, Co., June 13- 17, p. 79-83.
Kohler, M.A., 1954, Lake and pan evaporation, in Water- loss investigations Lake Heffner studies, technical report: U. S. Geological Survey Professional Paper 269, p. 127-148.
Miller, J. R, Frederick, R. H., and Tracey, R. J., 1973, Precip itation-frequency atlas of the western United States, volume 1, Montana: Silver Spring, Md., National Weather Service, 41 p.
Montana Department of Health and Environmental Sci ences, 1986, Montana water quality, 1986: Helena, 1986 Montana 305(b) Report, 198 p.
National Climate Data Center, 1990, Climatological data annual summary, Montana: National Oceanic and Atmospheric Administration, v. 93, no. 13,44 p.
___1991, Climatological data annual summary, Mon tana: National Oceanic and Atmospheric Administra tion, v. 94, no. 13,44 p.
Omang, R J., 1992, Analysis of the magnitude and frequency of floods and the peak-flow gaging network in Mon tana: U.S. Geological Survey Water-Resources Investi gations Report 92-4048,70 p.
Parrett, Charles, 1986, Simulation of rain floods on Willow Creek, Valley County, Montana: U.S. Geological Sur vey Water-Resources Investigations Report 86-4341, 89 p.
Parrett, Charles, and Johnson, D.R., 1989, Estimates of mean monthly streamflow for selected sites in the Mus-
selshell River Basin, Montana, base period water years 1937-86: U.S. Geological Survey Water-Resources Investigations Report 89-4165,31 p.
___1994, Estimates of monthly streamflow characteris tics and dominant-discharge hydrographs for selected sites in the lower Missouri and Little Missouri River basins in Montana: U.S. Geological Survey Water- Resources Investigations Report 94-4098,29 p.
Parrett, Charles, Johnson, D.R., and Hull, J.A., 1989, Esti mates of monthly streamflow characteristics at selected sites in the upper Missouri River Basin, Montana, base period water years 1937-86: U.S. Geological Survey Water-Resources Investigations Report 89-4082,103 p.
Sabol, G.V., 1988, Clark unit hydrograph and R-parameter estimation: American Society of Civil Engineers, Jour nal of Hydraulic Engineering, v. 114, no. 1, p. 103-111.
U.S. Army Corps of Engineers, 1987, HEC-1 flood hydrograph package, users manual: Davis, Calif., Hydrologic Engineering Center, 190 p.
U.S. Environmental Protection Agency, 1991, Secondary Maximum Contaminant Levels (section 143.3 of part 143, National Secondary Drinking Water Regulations): U.S. Code of Federal Regulations, Title 40, Parts 100 to 149, revised as of July 1,1991, p. 759.
U.S. Soil Conservation Service, 1972, National engineering handbook, section 4, Hydrology: 547 p.
RESERVOIR SITE NEAR TERRY, MONTANA

DATA
DATA 21

Table 5. Recorded and estimated monthly mean flow for Cherry Creek near Terry, Mont., for water years 1937-92
Mean streamflow for indicated month, in cubic feet per second
Water year
1937193819391940
19411942194319441945
19461947194819491950
19511952195319541955
19561957195819591960
19611962196319641965
19661967196819691970
1971197219731974
.1975
19761977197819791980
19811982198319841985
19861987198819891990
19911992
Oct.
0000
0.4.4
0.1
0.6.1
00
3131
.1
000
.1
.100
.200
.10
.10
.1
.12
.2
.1
.1
.400
.20
.10000
02100
00
Nov.
0000
0.1.4.4.1
.3
.1
.100
422
.1
.1
0000
.1
00000
.1
.1000
.1
.1
.1
.1
.2
.100
.30
.10000
02300
00
Dec.
0000
000
.40
.30000
313
.1
.1
0000
.100000
.1
.10
.10
000
.1
.1
.300
.20
00
.100
02200
0.1
Jan.
0000
00000
2.1
000
20200
00000
0.1
000
00000
.10
.3
.20
10000
00
.4
.20
02
.900
00
Feb.
0000
00
290
.2
1515000
.9
.523
.4
0.6.1
0.7
.1
.2160
.1
0.5
80
.1
340
.1
.10
6.1
000
03520
9413200
00
Mar.
0.1.2
1
.2104627
.9
2.1.3.2
2
19.2
14.4
6
165
.1
.2
.4
.142
.14
566
13.1
5169
.4
.4
.2
2.2
34
.2
.1
.5922
9,2201363.2
0.1
Apr.
0002
.2
.212
.2
.13
.2
.983
9523,200
1123
.2
.2
.12
.8
0.2.5.3
45
.31
.320
311
.13
.6
.3
.72
.2
.156
7.7
7
14224
11.2
.2
.9
May
0.3.6.9.4
.1
.8
.2
.4
.1
.2
.31.2
22
248
33.1.8
.2
.20
.3
.3
0.7.6.6
4
.24013
.52
.3
.319
0.2
16.3
0
029
9.3
5
13237
.1
.3
.2
June
1347
52
59
1639
.5
.6
.5880
32
63
841.8
.1
.1
.1
.40
023
182
.441.8
1
.4112
.51
7.1
2.8
21
010
.314
2201
.1
620
July
i8.2.3
.4
.1
.620
2.1
304
023
803
.50
.6
.10
012
.223
6.3
224
.8
0.5.1.3.8
.3
.41.8.1
.4
.5200
076
000
12.4
Aug.
000
.8
.6
.1
.2
.40
0.3
00
.3
04
.324
.1
.2
.2000
.1
.30
.1
.7
.90
.20
.1
07
.412
.401.5.4
711
.1
.9
.32
.1
.1
.1
.1
.2
Sept.
0000
5.1
000
.4
.100
.3
30
.2
.40
000
.10
300
.1
.2
.1100
.2
.1
.2
.4
.1
.1
0.5
200
.10000
.4
.6000
70
RESERVOIR SITE NEAR TERRY, MONTANA

Table 6. Estimated monthly precipitation at proposed Cherry Creek Reservoir near Terry, Mont., for water years 1937-92
Water year
1937193819391940
19411942194319441945
19461947194819491950
19511952195319541955
19561957195819591960
19611962196319641965
19661967196819691970
19711972197319741975
19761977197819791980
19811982198319841985
19861987198819891990
19911992
Precipitation for indicated month, in feet
Oct.
0.01.05.08.01
.17
.08
.05
.100
.03
.20
.020
.15
.05
.030
.13
.03
.07
.01
.02
.08
.03
.02
.03
.110
.01
0.01.07.03.03
.04
.38
.02
.01
.06
.13
.04
.18
.01
.01
.18
.09
.16
.01
.01
.03
.030
.03
.06
.04
.03
Nov.
0.02.01.03
0
.02
.02
.01
.01
.05
.04
.02
.02
.020
.01
.03
.070
.01
.02
.03
.07
.05
.02
00
.040
.03
.02
.03
.01
.010
.04
.03
.010
.06
.060
.04
.050
.06
.0400
.02
.03
.010
.01
.05
.04
.03
Dec.
0.04.02.02.02
.01
.01
.0100
.02
.030
.01
.03
.02
.04
.01
.02
.01
.0400
.02
.01
.01
.01
.010
.02
.01
.01
.01
.05
.03
.02
.01
.03
.07
.01
.01
.01
.06
.020
0.01.06.01.01
.0100
.020
00
Jan.
0.02.01.03.01
00
.08
.03
.02
.01
.01
.01
.03
.02
.01
.03
.03
.04
.02
.01
.020
.03
.01
0.02.02.02.04
.02
.01
.03
.04
.02
.11
.02
.0100
0.04.05.01
0
0.05
0.01.01
.03
.01
.05
.03
.05
.01
.01
Feb.
0.01.04.02.03
.01
.040
.010
.01
.010
.02
.03
.03
.05
.04
.01
.04
.01
.01
.01
.02
.01
.02
.01
.03
.01
.01
.01
.02
.01
.010
.02
.04
.05
.010
0.01.06.04.02
0.01
000
.03
.01
.02
.010
00
Mar.
0.01.05.01.03
.01
.01
.01
.05
.04
.02
.06
.03
.02
.12
.01
.03
.04
.03
.01
.01
.03
.010
.02
.01
.05
.03
.02
.02
.02
.03
.03
.03
.01
.03
.02
.03
.02
.10
.02
.030
.01
.01
.01
.01
.06
.05
.02
0.08.03.04
0
.01
.03
Apr.
0.02.01.04.12
.09
.05
.01
.09
.02
.03
.11
.06
.01
.12
.020
.17
.08
.08
.01
.12
.07
.05
.06
.14
.01
.22
.11
.07
.06
.12
.02
.12
.16
.07
.03
.30
.04
.17
.080
.03
.04
.04
.0200
.07
.06
.03
.02
.02
.32
.09
.19
.36
May
0.05.15.12.11
.18
.24
.10
.10
.22
.25
.04
.13
.13
.09
.12
.09
.33
.05
.30
.18
.14
.02
.07
.07
.12
.39
.10
.18
.11
.08
.09
.18
.15
.23
.08
.21
.07
.20
.26
.09
.11
.33
.07
.01
.14
.33
.21
.06
.07
.25
.39
.07
.21
.07
.29
.09
June
0.14.18.31.21
.17
.40
.49
.82
.14
.16
.30
.38
.11
.26
.18
.14
.23
.24
.13
.05
.28
.27
.15
.05
.08
.22
.45
.29
.32
.21
.38
.40
.19
.13
.18
.24
.39
.08
.42
.19
.18
.22
.07
.23
.16
.20
.12
.21
.02
.16
.13
.06
.08
.17
.26
.14
July
0.23.16.04.16
.05
.09
.21
.02
.02
.56
.21
.47
.13
.08
.16
.20
.18
.05
.15
.12
.09
.27
.02
.12
.16
.36
.09
.07
.23
.13
.09
.05
.20
.12
.01
.11
.01
.20
.12
.23
.07
.09
.14
.08
.07
.09
.090
.13
.09
.10
.02
.27
.07
.04
.04
Aug.
0.01.05.07.04
.17
.06
.16
.17
.08
.09
.22
.10
.04
.10
.29
.02
.31
.260
.29
.11
.03
.02
.08
.04
.03
.06
.26
.07
.180
.35
.010
.06
.09
.07
.12
.06
.08
.15
.07
.01
.23
.21
.07
.03
.07
.17
.03
.21
.08
.10
.12
.01
.13
Sept.
0.07.03.04.03
.47
.09
.02
.06
.16
.46
.02
.03
.01
.17
.06
.07
.03
.09
.01
.01
.06
.01
.140
.23
.05
.21
.01
.07
.03
.16
.080
.13
.10
.09
.36
.01
.02
.04
.31
.130
.08
.05
.21
.07
.08
.10
.39
.09
.130
.02
.36
.05
TABLE 6 23
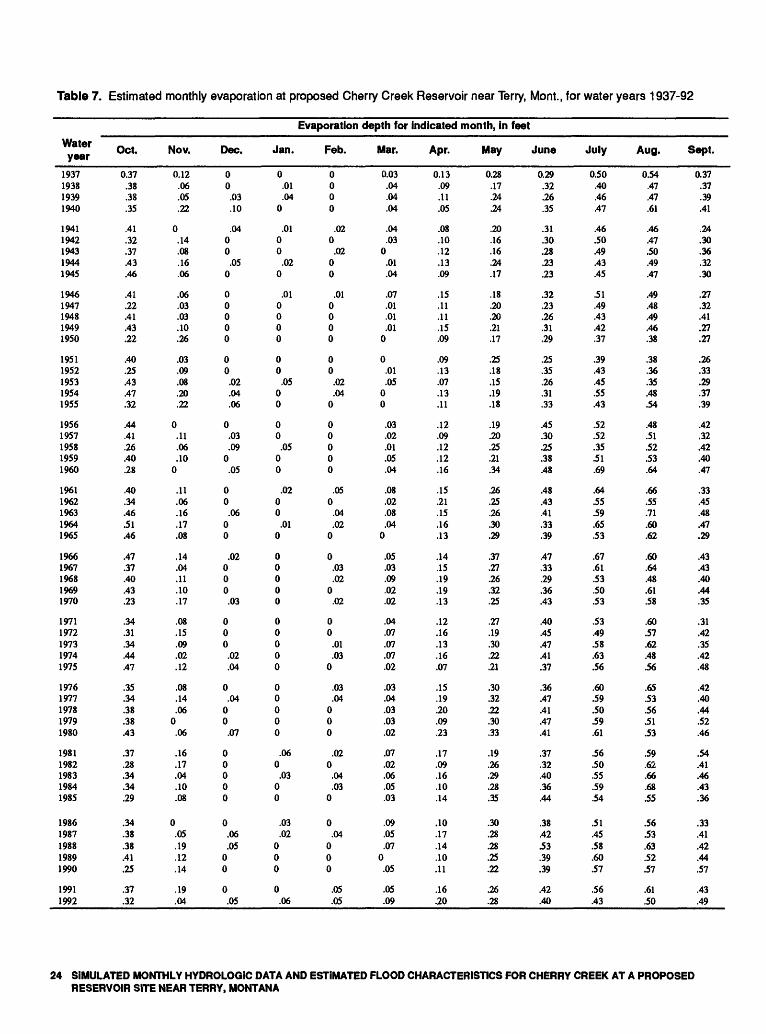
Table 7. Estimated monthly evaporation at proposed Cherry Creek Reservoir near Terry, Mont., for water years 1937-92
Evaporation depth for indicated month, in feetWater year
1937193819391940
19411942194319441945
19461947194819491950
19511952195319541955
19561957195819591960
19611962196319641965
19661967196819691970
19711972197319741975
19761977197819791980
19811982198319841985
19861987198819891990
19911992
Oct.
0.37.38.38.35
.41
.32
.37
.43
.46
.41
.22
.41
.43
.22
.40
.25
.43
.47
.32
.44
.41
.26
.40
.28
.40
.34
.46
.51
.46
.47
.37
.40
.43
.23
.34
.31
.34
.44
.47
.35
.34
.38
.38
.43
.37
.28
.34
.34
.29
.34
.38
.38
.41
.25
.37
.32
Nov.
0.12.06.05.22
0.14.08.16.06
.06
.03
.03
.10
.26
.03
.09
.08
.20
.22
0.11.06.100
.11
.06
.16
.17
.08
.14
.04
.11
.10
.17
.08
.15
.09
.02
.12
.08
.14
.060.06
.16
.17
.04
.10
.08
0.05.19.12.14
.19
.04
Dec.
00.03.10
.0400.05
0
00000
00.02.04.06
0.03.09
0.05
00.0600
.02000.03
000.02.04
0.0400.07
00000
0.06.0500
0.05
Jan.
0.01.04
0
.0100.02
0
.010000
00.05
00
00.05
00
.0200.01
0
00000
00000
00000
.060.03
00
.03
.02000
0.06
Feb.
0000
.020.02
00
.010000
00.02.04
0
00000
.050.04.02
0
0.03.02
0.02
00.01.03
0
.03
.04000
.020.04.03
0
0.04
000
.05
.05
Mar.
0.03.04.04.04
.04
.030.01.04
.07
.01
.01
.010
0.01.05
00
.03
.02
.01
.05
.04
.08
.02
.08
.040
.05
.03
.09
.02
.02
.04
.07
.07
.07
.02
.03
.04
.03
.03
.02
.07
.02
.06
.05
.03
.09
.05
.070.05
.05
.09
Apr.
0.13.09.11.05
.08
.10
.12
.13
.09
.15
.11
.11
.15
.09
.09
.13
.07
.13
.11
.12
.09
.12
.12
.16
.15
.21
.15
.16
.13
.14
.15
.19
.19
.13
.12
.16
.13
.16
.07
.15
.19
.20
.09
.23
.17
.09
.16
.10
.14
.10
.17
.14
.10
.11
.16
.20
May
0.28.17.24.24
.20
.16
.16
.24
.17
.18
.20
.20
.21
.17
.25
.18
.15
.19
.18
.19
.20
.25
.21
.34
.26
.25
.26
.30
.29
.37
.27
.26
.32
.25
.27
.19
.30
.22
.21
.30
.32
.22
.30
.33
.19
.26
.29
.28
.35
.30
.28
.28
.25
.22
.26
.28
June
0.29.32.26.35
.31
.30
.28
.23
.23
.32
.23
.26
.31
.29
.25
.35
.26
.31
.33
.45
.30
.25
.38
.48
.48
.43
.41
.33
.39
.47
.33
.29
.36
.43
.40
.45
.47
.41
.37
.36
.47
.41
.47
.41
.37
.32
.40
.36
.44
.38
.42
.53
.39
.39
.42
.40
July
0.50.40.46.47
.46
.50
.49
.43
.45
.51
.49
.43
.42
.37
.39
.43
.45
.55
.43
.52
.52
.35
.51
.69
.64
.55
.59
.65
.53
.67
.61
.53
.50
.53
.53
.49
.58
.63
.56
.60
.59
.50
.59
.61
.56
.50
.55
.59
.54
.51
.45
.58
.60
.57
.56
.43
Aug.
0.54.47.47.61
.46
.47
.50
.49
.47
.49
.48
.49
.46
.38
.38
.36
.35
.48
.54
.48
.51
.52
.53
.64
.66
.55
.71
.60
.62
.60
.64
.48
.61
.58
.60
.57
.62
.48
.56
.65
.53
.56
.51
.53
.59
.62
.66
.68
.55
.56
.53
.63
.52
.57
.61
.50
Sept.
0.37.37.39.41
.24
.30
.36
.32
.30
.27
.32
.41
.27
.27
.26
.33
.29
.37
.39
.42
.32
.42
.40
.47
.33
.45
.48
.47
.29
.43
.43
.40
.44
.35
.31
.42
.35
.42
.48
.42
.40
.44
.52
.46
.54
.41
.46
.43
.36
.33
.41
.42
.44
.57
.43
.49
RESERVOIR SITE NEAR TERRY, MONTANA

Table 8. Capacity of proposed Cherry Creek Reservoir near Terry, Mont., for various reservoir elevations
[Symbol: , not applicable]
Reservoir capacity, in acre-feet, for indicated elevationIncremental reservoir elevation, in tenths of a foot
Reservoirelevation,
in feetabove sea
level
2,240
2,2412,2422,2432,2442,245
2,2462,2472,2482,2492,250
2,2512,2522,2532,2542,255
2,2562,2572,2582,2592,260
2,2612,2622,2632,2642,265
2,2662,2672,2682,2692,270
2,2712,2722,2732,2742,275
2,2762,2772,2782,2792,280
2,2812,2822,2832,2842,285
2,2862,2872,2882,2892,290
0.0
0
007
3371
120180260340440
550670810950
1,100
1,3001,5001,7001,9002,100
2,3002,6002,8003,1003,300
3,6003,9004,3004,6004,900
5,3005,6006,0006,4006,800
7,2007,6008,0008,5008,900
9,4009,900
10,40010,90011,400
11,90012,50013,00013,60014,100
0.1
0
007
3372
120180260340440
550680810960
1,100
1,3001,5001,7001,9002,100
2,3002,6002,8003,1003,300
3,6003,9004,3004,6004,900
5,3005,6006,0006,4006,800
7,2007,6008,0008,5008,900
9,4009,900
10,40010,90011,400
11,90012,50013,00013,600
-
0.2
0
007
3472
120190260350440
550680810960
1,100
1,3001,5001,7001,9002,100
2,3002,6002,8003,1003,400
3,6003,9004,3004,6004,900
5,3005,6006,0006,4006,800
7,2007,6008,0008,5008,900
9,4009,900
10,40010,90011,400
11,90012,50013,00013,600
~
0.3
0
008
3473
120190260350450
560680810960
1,100
1,3001,5001,7001,9002,100
2,3002,6002,8003,1003,400
3,6003,9004,3004,6004,900
5,3005,6006,0006,4006,800
7,2007,6008,0008,5008,900
9,4009,900
10,40010,90011,400
11,90012,50013,00013,600
--
0.4
0
008
3473
120190260350450
560680810960
1,100
1,3001,5001,7001,9002,100
2,3002,6002,8003,1003,400
3,6003,9004,3004,6004,900
5,3005,6006,0006,4006,800
7,2007,6008,1008,5009,000
9,4009,900
10,40010,90011,400
11,90012,50013,00013,600
--
0.5
0
008
3574
120190260350450
560680810960
1,100
1,3001,5001,7001,9002,100
2,3002,6002,8003,1003,400
3,7004,0004,3004,6004,900
5,3005,6006,0006,4006,800
7,2007,6008,1008,5009,000
9,4009,900
10,40010,90011,400
11,90012,50013,00013,600
-
0.6
0
008
3574
120190260350450
560680820960
1,100
1,3001,5001,7001,9002,100
2,3002,6002,8003,1003,400
3,7004,0004,3004,6004,900
5,3005,6006,0006,4006,800
7,2007,6008,1008,5009,000
9,4009,900
10,40010,90011,400
12,00012,50013,00013,600
-
0.7
0
008
3574
130190260350450
560680820960
1,100
1,3001,5001,7001,9002,100
2,3002,6002,8003,1003,400
3,7004,0004,3004,6004,900
5,3005,6006,0006,4006,800
7,2007,6008,1008,5009,000
9,4009,900
10,40010,90011,400
12,00012,50013,10013,600
-
0.8
0
009
3675
130190260350450
560680820970
1,100
1,3001,5001,7001,9002,100
2,3002,6002,8003,1003,400
3,7004,0004,3004,6004,900
5,3005,7006,0006,4006,800
7,2007,6008,1008,5009,000
9,4009,900
10,40010,90011,400
12,00012,50013,10013,600
-
0.9
0
009
3675
130190270350450
560690820970
1,100
1,3001,5001,7001,9002,100
2,3002,6002,8003,1003,400
3,7004,0004,3004,6004,900
5,3005,7006,0006,4006,800
7,2007,6008,1008,5009,000
9,4009,900
10,40010,90011,400
12,00012,50013,10013,600
TABLE 8 25
U.S. GOVERNMENT PRINTING OFFICE: 1995 - 673-211 / 00026 REGION NO. 8