Embed Size (px)
Citation preview

SIMULATING CHEMICAL REACTIONS OF GLASS POWDER IN CEMENT USING SILICA,
CALCIUM HYDROXIDE AND SODIUM HYDROXIDE


SIMULATING CHEMICAL REACTIONS OF GLASS POWDER IN CEMENT USING SILICA,
CALCIUM HYDROXIDE AND SODIUM HYDROXIDE
By SARAH YOUNG, B.ENG.
A Thesis Submitted to the School of Graduate Studies in Partial Fulfillment of the
Requirements for the Degree Master of Applied Science
McMaster University
©Copyright by Sarah Young, October 2013

ii
MASTER OF APPLIED SCIENCE (2013) McMaster University
(Civil Engineering) Hamilton, Ontario
TITLE: Simulating chemical reactions of glass powder in cement using
silica, calcium hydroxide and sodium hydroxide
AUTHOR: Sarah Young, B.Eng. (McMaster University)
SUPERVISOR: Dr. Samir E. Chidiac, Ph.D., P.Eng
NUMBER OF PAGES: x, 100

iii
Abstract
The use of supplementary cementitious materials (SCM) decreases the
environmental impact of the cement industry. SCMs are commercial by-products that
possess pozzolanic properties. Recycled glass powder, classified as a SCM, when added
as a cement replacement reacts with the available lime in the cement to form calcium
silicate hydrate (C-S-H) products. In contrast with other SCMs, glass is siliceous and thus
the reaction can also cause alkali silica reaction (ASR) which causes expansion and
cracking. This study was completed in order to characterize the chemical reactions and
their rate using a simplified system that mimics glass particles in hardened cement
paste.
Silica powder was added to solutions containing calcium hydroxide and/or sodium
hydroxide. The rate of dissolution of the silica was monitored as well as the composition
of the reaction products. Dissolution rates of silica with varying concentrations of silica,
calcium hydroxide and sodium hydroxide, were fitted to the Hixson-Crowell cubic root
law. The precipitate composition of the reaction product was represented by means of
triaxial plots. It was found that silicate ions enter the solutions containing sodium
hydroxide and containing both sodium hydroxide and calcium hydroxide. The rate is
proportional to the quantity of sodium ions in the solution and to the pH. Also, higher
concentrations of silica generally cause higher dissolution rates. The solutions with a pH
of 13.48 and with lower silica concentrations created reaction products that were similar
to C-S-H while the solutions with higher pH levels formed ASR after thirty days. The C-S-
H prevented further dissolution of the silica. The formation of the ASR reaction products
did not prevent further dissolution of the silica and they continued to dissolve until most
of the silica had entered the solution.

iv
Acknowledgements
First, I would like to thank my supervisor Dr. Samir Chidiac. His support
encouraged me to continuously strive for excellence in my graduate student career.
Thank you to Lisa Federico who started me off on the right path and who
provided a wealth of knowledge concerning glass in concrete. I also wish to thank the
technicians with the Department of Civil Engineering, Kent Wheeler, Anna Robertson,
Paul Heerema, and Peter Koudys. Their help and guidance helped make my
experimental program possible. Thank you to the technicians with the Department of
Materials Science and Engineering who helped me with my ICP-AES testing, Xiaogang Li
and Doug Culley. Thank you to my fellow graduate students for their encouragement
during my testing and writing. I would also like to thank the faculty and staff of the Civil
Engineering Department at McMaster University.
I would like to thank the National Sciences and Engineering Research Council of
Canada, the Ontario Graduate Scholarship Program and the Department of Civil
Engineering at McMaster University for their funding.
Finally I would like to thank my friends and family for their continual
encouragement. A very special thank you is extended to my parents, Anne and Doug
Young, for their loving support and editing expertise.

v
Table of Contents
Abstract ..................................................................................................................... iii
Acknowledgements ................................................................................................... iv
Table of Contents ....................................................................................................... v
List of Figures ............................................................................................................ vii
1 Introduction ....................................................................................................... 1
1.1 Objective .................................................................................................... 1
1.2 Outline ........................................................................................................ 1
2 Literature Review ............................................................................................... 3
2.1 Introduction ................................................................................................ 3
2.2 Cement Chemical Reactions ....................................................................... 3
2.2.1 Portland Cement Hydration .................................................................... 3
2.2.2 Pozzolanic Reaction ................................................................................ 4
2.2.3 Alkali Silica Reaction ............................................................................... 4
2.3 Supplementary Cementing Material .......................................................... 6
2.4 Recycled Glass ............................................................................................ 6
2.5 Dissolution of silica ..................................................................................... 7
2.6 Reaction Models ......................................................................................... 9
2.7 Silica and sodium hydroxide solutions ..................................................... 11
2.8 Silica and Lime Solutions .......................................................................... 13
2.9 Calcium, Sodium and Silica Solutions ....................................................... 14
2.10 Alkali Glass Systems.................................................................................. 21
2.11 Thermo Gravimetric Analysis ................................................................... 22
2.12 Summary .................................................................................................. 23
3 Experimental Program ..................................................................................... 26
3.1 Materials ................................................................................................... 26
3.2 Experimental Procedure ........................................................................... 26

vi
3.2.1 Mixture Composition ............................................................................ 26
3.2.2 Mixing Procedure.................................................................................. 27
3.3 Testing ...................................................................................................... 31
3.3.1 pH Values .............................................................................................. 31
3.3.2 ICP-AES Testing ..................................................................................... 33
3.3.3 TGA Testing ........................................................................................... 35
4 Experimental Results ....................................................................................... 39
4.1 Introduction .............................................................................................. 39
4.2 Calcium and Silicon Concentrations over Time ........................................ 39
4.3 Sodium and Silicon Solution Concentrations over Time .......................... 48
4.4 Sodium, Calcium and Silicon Concentrations over Time .......................... 53
4.5 Precipitate Composition ........................................................................... 63
5 Discussions and Analyses ................................................................................. 67
5.1 Introduction .............................................................................................. 67
5.2 Silica Dissolution ....................................................................................... 67
5.2.1 Sodium Hydroxide and Silica ................................................................ 68
5.2.2 Calcium Hydroxide, Sodium Hydroxide and Silica ................................ 77
5.2.3 Discussion ............................................................................................. 85
5.3 Reaction Progression ................................................................................ 87
5.3.1 Calcium and Silica ................................................................................. 87
5.3.2 Sodium and Silica .................................................................................. 88
5.3.3 Calcium, Sodium and Silica ................................................................... 88
6 Conclusions and Recommendations ................................................................ 92
6.1 Conclusions ............................................................................................... 92
6.1.1 Dissolution of Silica ............................................................................... 92
6.1.2 Reaction of Silica with Calcium Hydroxide and Sodium Hydroxide ..... 92
6.2 Future Research ....................................................................................... 93
7 References ....................................................................................................... 95

vii
List of Figures
Figure 2.1: Composition of ASR in Field Samples (Thaulow, Hjorth Jakobsen, & Clark,
1996) ........................................................................................................................... 5
Figure 2.2: Solubility of Silica at Various pH Levels (Alexander, Heston, & Iler, 1954) ....... 8
Figure 2.3: Dissolution of amorphous silica in sodium hydroxide (Niibori, Kunita,
Tochiyama, & Chida, 2000) ....................................................................................... 12
Figure 2.4: Dissolution of Opal in a Sodium Hydroxide Solution (Dron & Brivot, 1993) ... 13
Figure 2.5: Calcium hydroxide concentration given sodium hydroxide concentration,
25°C ........................................................................................................................... 17
Figure 2.6: Concentration of Chemicals at Various Na2O Concentrations. ∘ = SiO2, • = CaO
(Kalousek, 1944) ....................................................................................................... 19
Figure 2.7: Composition of Precipitate at Various Initial Na2O Concentrations with
Oversaturated Calcium Oxide and Silica. (Kalousek, 1944) ...................................... 19
Figure 2.8: Ion Concentrations in Solutions at 2 Weeks(Macphee, Luke, Glasser, &
Lachowski, 1989) ...................................................................................................... 20
Figure 2.9: Ion Concentrations in Solutions at 6 Months(Macphee, Luke, Glasser, &
Lachowski, 1989) ...................................................................................................... 20
Figure 2.10: Precipitate Composition, initial [NaOH]=0.25M(Macphee, Luke, Glasser, &
Lachowski, 1989) ...................................................................................................... 21
Figure 2.11: Precipitate Composition, initial [NaOH]=0.8M(Macphee, Luke, Glasser, &
Lachowski, 1989) ...................................................................................................... 21
Figure 2.12: The dissolution of a glass in various concentrations of alkali solution
(Kouassi, Andji, Bonnet, & Rossignol, 2010) ............................................................. 22
Figure 3.1: Electronic scale with ±0.0001g accuracy used to weigh the powder .............. 28
Figure 3.2: Glove bag with N2 to mitigate contamination ................................................. 29
Figure 3.3: Additions of liquids, R.O. water and NaOH to reaction bottle inside the glove
bag ............................................................................................................................ 29
Figure 3.4: Rollers used for continuous mixing of samples ............................................... 30
Figure 3.5: Sample being filtered ....................................................................................... 31
Figure 3.6: pH electrode inside the glove bag ................................................................... 32
Figure 3.7: Calibrating pH electrode .................................................................................. 33
Figure 3.8: ICP AES machine located in BSB at McMaster University ............................... 34
Figure 3.9: Sample cups on TGA beams ............................................................................. 36
Figure 3.10: TGA Weight Loss Calculations for Ca(OH)2 .................................................... 37
Figure 4.1: Concentration and pH vs. Time; [Ca(OH)2]0=0.013, [SiO2]0=0.0016 ................ 39

viii
Figure 4.2: Concentration and pH vs. Time; [Ca(OH)2]0=0.013, [SiO2]0=0.020 .................. 40
Figure 4.3: Concentration and pH vs. Time; [Ca(OH)2]0=0.015, [SiO2]0=0.100 .................. 40
Figure 4.4: Precipitate Composition; [Ca(OH)2]0=0.015, [SiO2]0=0.100 ............................. 41
Figure 4.5: Concentration and pH vs. Time; [Ca(OH)2]0=0.023, [SiO2]0=0.0016 ................ 41
Figure 4.6: Concentration and pH vs. Time; [Ca(OH)2]0=0.023, [SiO2]0=0.020 .................. 42
Figure 4.7: Precipitate Composition; [Ca(OH)2]0=0.023, [SiO2]0=0.020 ............................. 42
Figure 4.8: Concentration and pH vs. Time; [Ca(OH)2]0=0.023, [SiO2]0=0.100 .................. 43
Figure 4.9: Precipitate Composition; [Ca(OH)2]0=0.023, [SiO2]0=0.100 ............................. 43
Figure 4.10: Concentration and pH vs. Time; [Ca(OH)2]0=0.021, [SiO2]0=0.134 ................ 44
Figure 4.11: Precipitate Composition; [Ca(OH)2]0=0.021, [SiO2]0=0.134 ........................... 44
Figure 4.12: Concentration and pH vs. Time; [Ca(OH)2]0=0.023, [SiO2]0=0.153 ................ 45
Figure 4.13: Precipitate Composition; [Ca(OH)2]0=0.023, [SiO2]0=0.153 ........................... 45
Figure 4.14: Concentration and pH vs. Time; [Ca(OH)2]0=0.045, [SiO2]0=0.0016 .............. 46
Figure 4.15: Precipitate Composition; [Ca(OH)2]0=0.045, [SiO2]0=0.0016 ......................... 46
Figure 4.16: Concentration and pH vs. Time; [Ca(OH)2]0=0.045, [SiO2]0=0.020 ................ 47
Figure 4.17: Concentration and pH vs. Time; [Ca(OH)2]0=0.045, [SiO2]0=0.100 ................ 47
Figure 4.18: Precipitate Composition; [Ca(OH)2]0=0.045, [SiO2]0=0.100 ........................... 48
Figure 4.19: Concentration and pH vs. Time; [NaOH]0=0.30, [SiO2]0=0.115 ..................... 49
Figure 4.20: Concentration and pH vs. Time; [NaOH]0=0.30, [SiO2]0=0.134 ..................... 49
Figure 4.21: Concentration and pH vs. Time; [NaOH]0=0.30, [SiO2]0=0.153 ..................... 50
Figure 4.22: Concentration and pH vs. Time; [NaOH]0=0.42, [SiO2]0=0.134 ..................... 50
Figure 4.23: Concentration and pH vs. Time; [NaOH]0=0.42, [SiO2]0=0.153 ..................... 51
Figure 4.24: Concentration and pH vs. Time; [NaOH]0=0.42, [SiO2]0=0.165 ..................... 51
Figure 4.25: Concentration and pH vs. Time; [NaOH]0=0.53, [SiO2]0=0.153 ..................... 52
Figure 4.26: Concentration and pH vs. Time; [NaOH]0=0.53, [SiO2]0=0.165 ..................... 52
Figure 4.27: Concentration and pH vs. Time; [NaOH]0=0.53, [SiO2]0=0.180 ..................... 53
Figure 4.28: Concentration and pH vs. Time; [Ca(OH)2]0=0.023, [NaOH]0=0.30,
[SiO2]0=0.115 ............................................................................................................ 54
Figure 4.29: Precipitate Composition; [Ca(OH)2]0=0.023, [NaOH]0=0.30, [SiO2]0=0.115 .. 54
Figure 4.30: Concentration and pH vs. Time; [Ca(OH)2]0=0.023, [NaOH]0=0.30,
[SiO2]0=0.134 ............................................................................................................ 55
Figure 4.31: Precipitate Composition; [Ca(OH)2]0=0.023, [NaOH]0=0.30, [SiO2]0=0.134 .. 55
Figure 4.32: Concentration and pH vs. Time; [Ca(OH)2]0=0.023, [NaOH]0=0.30,
[SiO2]0=0.153 ............................................................................................................ 56
Figure 4.33: Precipitate Composition; [Ca(OH)2]0=0.023, [NaOH]0=0.30,
[SiO2]0=0.153 ........................................................................................................ 56

ix
Figure 4.34: Concentration and pH vs. Time; [Ca(OH)2]0=0.023, [NaOH]0=0.42,
[SiO2]0=0.134 ............................................................................................................ 57
Figure 4.35: Precipitate Composition; [Ca(OH)2]0=0.023, [NaOH]0=0.42, [SiO2]0=0.134 .. 57
Figure 4.36: Concentration and pH vs. Time; [Ca(OH)2]0=0.023, [NaOH]0=0.42,
[SiO2]0=0.153 ............................................................................................................ 58
Figure 4.37: Precipitate Composition; [Ca(OH)2]0=0.023, [NaOH]0=0.42, [SiO2]0=0.153 .. 58
Figure 4.38: Concentration and pH vs. Time; [Ca(OH)2]0=0.023, [NaOH]0=0.42,
[SiO2]0=0.165 ............................................................................................................ 59
Figure 4.39: Precipitate Composition; [Ca(OH)2]0=0.023, [NaOH]0=0.42, [SiO2]0=0.165 .. 59
Figure 4.40: Concentration and pH vs. Time; [Ca(OH)2]0=0.023, [NaOH]0=0.53,
[SiO2]0=0.153 ............................................................................................................ 60
Figure 4.41: Precipitate Composition; [Ca(OH)2]0=0.023, [NaOH]0=0.53, [SiO2]0=0.153 .. 60
Figure 4.42: Concentration and pH vs. Time; [Ca(OH)2]0=0.023, [NaOH]0=0.53,
[SiO2]0=0.165 ............................................................................................................ 61
Figure 4.43: Precipitate Composition; [Ca(OH)2]0=0.023, [NaOH]0=0.53, [SiO2]0=0.165 .. 61
Figure 4.44: Concentration and pH vs. Time; [Ca(OH)2]0=0.023, [NaOH]0=0.53,
[SiO2]0=0.180 ............................................................................................................ 62
Figure 4.45: Precipitate Composition; [Ca(OH)2]0=0.023, [NaOH]0=0.53, [SiO2]0=0.180 .. 62
Figure 4.46: Precipitate Composition at 12 Hours ............................................................. 63
Figure 4.47: Precipitate Composition at 1 Day .................................................................. 64
Figure 4.48: Precipitate Composition at 4 Days ................................................................. 64
Figure 4.49: Precipitate Composition at 7 Days ................................................................. 65
Figure 4.50: Precipitate Composition at 14 Days ............................................................... 65
Figure 4.51: Precipitate Composition at 30 Days ............................................................... 66
Figure 4.52: Precipitate Composition at 92 Days ............................................................... 66
Figure 5.1: Silica Dissolution; [NaOH]0=0.30, [SiO2]0=0.115 .............................................. 68
Figure 5.2: Silica Dissolution; [NaOH]0=0.30, [SiO2]0=0.134 .............................................. 69
Figure 5.3: Silica Dissolution; [NaOH]0=0.30, [SiO2]0=0.153 .............................................. 70
Figure 5.4: Silica Dissolution; [NaOH]0=0.42, [SiO2]0=0.134 .............................................. 71
Figure 5.5: Silica Dissolution; [NaOH]0=0.42, [SiO2]0=0.153 .............................................. 72
Figure 5.6: Silica Dissolution; [NaOH]0=0.42, [SiO2]0=0.165 .............................................. 73
Figure 5.7: Silica Dissolution; [NaOH]0=0.53, [SiO2]0=0.153 .............................................. 74
Figure 5.8: Silica Dissolution; [NaOH]0=0.53, [SiO2]0=0.165 .............................................. 75
Figure 5.9: Silica Dissolution; [NaOH]0=0.53, [SiO2]0=0.180 .............................................. 76
Figure 5.10: Silica Dissolution; [Ca(OH)2]0=0.023, [NaOH]0=0.30, [SiO2]0=0.115 .............. 77
Figure 5.11: Silica Dissolution; [Ca(OH)2]0=0.023, [NaOH]0=0.30, [SiO2]0=0.134 .............. 78
x
Figure 5.12: Silica Dissolution; [Ca(OH)2]0=0.023, [NaOH]0=0.30, [SiO2]0=0.153 .............. 79
Figure 5.13: Silica Dissolution; [Ca(OH)2]0=0.023, [NaOH]0=0.42, [SiO2]0=0.134 .............. 80
Figure 5.14: Silica Dissolution; [Ca(OH)2]0=0.023, [NaOH]0=0.42, [SiO2]0=0.153 .............. 81
Figure 5.15: Silica Dissolution; [Ca(OH)2]0=0.023, [NaOH]0=0.42, [SiO2]0=0.165 .............. 82
Figure 5.16: Silica Dissolution; [Ca(OH)2]0=0.023, [NaOH]0=0.53, [SiO2]0=0.153 .............. 83
Figure 5.17: Silica Dissolution; [Ca(OH)2]0=0.023, [NaOH]0=0.53, [SiO2]0=0.165 .............. 84
Figure 5.18: Silica Dissolution; [Ca(OH)2]0=0.023, [NaOH]0=0.53, [SiO2]0=0.180 .............. 85

M.A.Sc. Thesis - Sarah Young - McMaster University - Civil Engineering
1
1 Introduction
1.1 Objective
The use of supplementary cementitious materials in concrete can add their
beneficial properties to Portland cement. It is possible to use glass as an additive to
cement, however adverse chemical reactions can occur. There have been numerous
studies that have added ground recycled glass to concrete to monitor its expansion and
to study its strength gain. These studies have provided recommendations for the
particle size required to prevent deleterious expansion and to maximize strength.
Noticeably, these recommendations vary greatly, partly due to different chemical
compositions of the glasses used. These studies have not identified what is occurring on
a chemical level.
The objective of this work is to study the chemical reactions that occur when glass
reacts with concrete pore solution. The dissolution rate of silica particles will be
quantified for varying pH and ion levels that mimic those found in concrete.
Additionally, the reaction products from these different scenarios will be identified. This
work will provide insight into the possible reactions that could occur when adding
recycled glass particles into a concrete mix.
1.2 Outline
This work consists of six chapters, the first being this introduction.
The second chapter presents relevant literature. In this section, previous work is
examined. The included earlier work encapsulates the following topics: the use of glass
in concrete, the chemical reactions that occur in cement and finally the reactions that
occur between glass and cement pore solution. This experimental work is placed in
context of the previous research.
Chapter three covers the experimental method that was used in this study. The
materials for the samples are detailed and the concentrations for each sample are listed.
The procedure used for each portion of the experimental work conducted is outlined.
Chapter four presents the results obtained from testing the samples. The results
are plotted against time and as a comparison between the samples for each testing
time.

M.A.Sc. Thesis - Sarah Young - McMaster University - Civil Engineering
2
Chapter five is the discussion and analysis of these results. First, the dissolution of
silica is modeled and discussed. Second, the compositions of the reaction products are
presented.
Chapter six consists of the conclusions, where the results are summarized and
recommendations are made for future work.

M.A.Sc. Thesis - Sarah Young - McMaster University - Civil Engineering
3
2 Literature Review
2.1 Introduction
Worldwide, the cement industry is known to have a massive environmental
impact. The energy usage from cement production has been approximated to be from
8x10¹⁸
to 10x1018
J per year (International Energy Agency, 2006). Additionally, the
cement industry produces approximately 3% of all the world wide greenhouse gas
emissions (World Business Council for Sustainable Development, 2002). The sources of
the CO2 are from the energy used to create cement and from the calcination of
limestone (Romeo, Catalina, Lisbona, Lara, & Martínez, 2011). In 2010, it was found that
for the production of clinker, the equivalent of 0.75kg of CO2 was created for every kg of
cement produced (Chen, Habert, Bouzidi, & Jullien). Large quantities of natural
resources are also consumed in production. It takes approximately 1.53 kg of limestone
and clay to make 1 kg of cement (Chen, Habert, Bouzidi, & Jullien, 2010). The
substitution of a portion of the cement with an industrial by-product decreases the
amount of new natural resources required as well as the quantity of greenhouse gasses
released.
2.2 Cement Chemical Reactions
2.2.1 Portland Cement Hydration
Portland cement is formed from predominately limestone and clay as a source of
silica and calcium. The raw materials are ground and heated in a kiln to produce cement
clinker. Gypsum is added to the mix after heat treatment. The resulting Portland
cement mix contains tricalcium silicate, beta-dicalcium silicate, calcium aluminate and
ferroaluminate (Mehta & Monteiro, 2006). Portland cement is a hydraulic cement,
meaning that only water needs to be added to the mix to form a hardened cement
paste.
Once the cement has been mixed with water, the hydration reaction starts and
multiple products are formed. The components in hardened Portland cement paste
include calcium-silicate-hydrate, calcium hydroxide, ettringite and monosulfate.
Calcium-silicate-hydrate (C-S-H) makes up approximately half of the material in the
hardened cement paste. Its structure is irregular and the composition is approximately
C3S2H3, however it varies significantly (Mehta & Monteiro, 2006). The calcium hydroxide
makes up around one fifth to one quarter of the material. It consists of Ca(OH)2 in a
crystal structure and is considerably weaker than the C-S-H. Finally, the aluminate
M.A.Sc. Thesis - Sarah Young - McMaster University - Civil Engineering
4
products form up to one fifth of the final material. They are the first to form and create
the initial structure in the cement paste.
2.2.2 Pozzolanic Reaction
A pozzolanic reaction occurs when a siliceous material reacts with calcium
hydroxide and water to form solid cement paste. In cement, the calcium hydroxide is
available from the hydration of Portland cement. This reaction occurs at a slower rate
than Portland cement hydration, thus strength gain will be more gradual when there are
pozzolans present. The benefits of using pozzolanic materials include a finer pore
structure and conversion of the calcium hydroxide in the paste to a C-S-H product
(Mehta & Monteiro, 2006).
2.2.3 Alkali Silica Reaction
Alkali-silicate reaction (ASR) involves a reactive aggregate and the pore solution of
concrete. It was first discussed by Thomas Stanton in the 1930’s after a substantial
quantity of structures had experienced deleterious expansion in southern California
(Stanton, 1940). This expansion causes the concrete to crack. It has been found that the
high pH of cement promotes the dissolution of silica contained in aggregates. The alkalis
contained in the pore solution will then bond with the silica ions in the reactive particle,
creating an ASR gel around the particle (Idir, Cyr, & Tagnit-Hamou, 2011). If the reacted
layer cracks, more ions are able to easily reach aggregate that has not yet reacted and
the ASR is able to continue (Mehta & Monteiro, 2006). If it does not crack, the layer of
reaction product will decrease the diffusion rate of the ions, causing the reaction to
slow. Expansive pressure can be created when the ions diffuse into the reacted product
as well as when water is adsorbed (Chatterji, 2005). Enough pressure can develop to
crack the aggregate and the surrounding paste. This reaction can readily occur in
concrete containing glass particles as they mostly consist of silica.
ASR contains the same basic elements as C-S-H, however the ratios differ. The ASR
gel has higher amounts of silica and alkalis. The composition of gel found in field
samples was studied by Thaulow, Hjorth Jakobsen and Clark, their results are presented
in Figure 2.1 (1996). In their specimens, the sodium content was between 10 and 25%.
The ratio of calcium to silica was highly variable, with the silica content being mostly
above 50% of the sample. Kawamura and Fuwa created concrete samples in a lab
setting with reactive aggregate to study the composition of the resulting gel (2003). The
ratio of CaO to SiO2 for samples without any treatment ranged from 0.05 to 0.3. The
alkali to silica ratio was then approximately 0.1 to 0.4. The amount of alkalis in these

M.A.Sc. Thesis - Sarah Young - McMaster University - Civil Engineering
5
samples is more variable than those found by Thaulow et al. Both of these studies found
that the gel is composed of high amounts of silica.
Figure 2.1: Composition of ASR in Field Samples (Thaulow, Hjorth Jakobsen, &
Clark, 1996)
Mitigation of ASR can be achieved through several methods. Firstly, the use of
reactive aggregate can be limited. Second, the alkali content of the cement to be used
can be reduced. It has been recommended that the total amount of alkalis in the
cement be limited to 3 kg/m3
(Mehta & Monteiro, 2006). Adding pozzolanic material to
the cement mix can reduce the quantity of alkalis and it also reacts with the silica to
form non-expansive products. Finally, for alkali silica reaction to occur, water needs to
be available to transport the ions in the solution. Keeping the concrete in a dry
environment will prevent ASR from occurring.

M.A.Sc. Thesis - Sarah Young - McMaster University - Civil Engineering
6
2.3 Supplementary Cementing Material
Supplementary cementing materials (SCMs) are added to concrete as a
replacement to cement. They can either be cementitious or pozzolanic. Commonly
used materials include silica fume, ground granulated blast furnace slag and fly ash.
SCMs add to the durability of cement as their additions lead to a finer pore structure.
They also decrease the environmental impact by reducing the quantity of new natural
resources required to produce Portland cement and adding waste by-products from
other industries. Recycled glass has been studied for its use as a supplementary
cementitious material (Federico & Chidiac, 2009). Unlike other SCMs, it requires
significant energy to be imputed before it is suitable as it requires grinding to a specified
fineness.
2.4 Recycled Glass
Glass is an amorphous solid that consists of inorganic elements (Paul, 1982). It is
made by cooling a liquid faster than it is able to crystallize, forming an amorphous solid.
Commonly, glass is made of silica and various impurities. The addition of chemical
impurities into amorphous silica will decrease its resistance to chemical attack (De Jong,
Beerkens, van Nijnatten, & Le Bourhis, 2011). The most common type of glass used is
soda-lime glass; it contains soda, usually in the form of sodium carbonate, as a network
modifier in the amorphous silica structure (Bray, 2001). Other important modifiers
include aluminum oxide, boron trioxide, and lead oxide (De Jong, Beerkens, van
Nijnatten, & Le Bourhis, 2011).
Waste glass has been studied as a cement and as a fine aggregate replacement by
various researchers. Partially due to its fluctuating composition, mixed results have
been reported concerning its reactivity. Researchers who have added glass as a
replacement for fine aggregate have commonly experienced the deleterious effects of
ASR. The specimens that have experienced ASR have expanded past ASTM test limits
(Park & Lee, 2004), (Park, Lee, & Kim, 2004),(Dhir, Dyer, & Tang, 2009),(Idir, Cyr, &
Tagnit-Hamou, 2010). These mixes would be unsuitable to use in an exposed
environment. It was found that as the size of the glass particle increases, there is more
expansion up until a pessimum point, and then the amount of expansion decreases
(Rajabipour, Maraghechi, & Fisher, 2010). It has been successfully shown that when
mixes contain reactive aggregate, such as glass, the addition of a pozzolan will decrease
the amount of expansion (Dhir, Dyer, & Tang, 2009),(Idir, Cyr, & Tagnit-Hamou, 2010).
Therefore, the use of this reactive glass is still possible if measures are taken to reduce
the harmful reactions.

M.A.Sc. Thesis - Sarah Young - McMaster University - Civil Engineering
7
Researchers have also found glass to undergo a pozzolanic reaction when it has
been ground to a fine enough powder (Shi, Wu, Riefler, & Wang, 2005); (Federico,
Chidiac, & Raki, 2011); (Chidiac & Mihaljevic, 2011). Specimens that have undergone
pozzolanic reaction have either experienced no additional expansion in comparison to
control bars or a reduced amount of expansion (Ismail & Al-Hashmi, 2009). These mixes
will have a higher strength than control mixes with an equivalent amount of inert filler
material, indicating that a pozzolanic reaction has occurred (Idir, Cyr, & Tagnit-Hamou,
2011). Over time, the strength of the material increases at a rate similar or greater than
that of fly ash (Shao, Lefort, Moras, & Rodriguez, 2000), (Schwarz & Neithalath, 2008).
There has been some contradicting research regarding the conditions necessary for a
pozzolanic reaction rather than ASR. From SEM images, some researchers have found
that a pozzolanic reaction will occur on the surface of glass aggregate and then inside
the cracks of the glass aggregate will have ASR (Maraghechi, Shafaatian, Fischer, &
Rajabipour, 2012). Since there is uncertainty into the conditions required for ASR and
pozzolanic reactions, the chemistry of these reactions will be examined.
2.5 Dissolution of silica
Alexander, Heston and Iler studied the dissolution of silica in water to determine
its solubility at various pH levels (1954). They studied different types of amorphous
silica and found the solubilities, presented in Figure 2.2, to be equal regardless of its
initial form. For all solutions below pH=10.6, the silica in the solution is present in the
form of monosilic acid.
Sjöberg explained the increasing quantity of soluble silica by examining the
different species formed at various pH levels (1996). Below a pH of 8, the silica in
solution is monosilicic acid. Above this level, the ions formed are increasingly more
complex. The notation used to describe the bonding of silicon is Qn; where n is the
number of Si-Si bonds. For example, Q0 indicates a monomer and Q
1 indicates a silicon
atom at the end of a chain. From a pH of approximately 9.8 to 11, the silicon is mostly in
the form of Q4 ions. From pH 11 to 13.5, Q
3 is the predominant species. Cement will
typically have a pH in this range, so this is the form of silicon that is expected to be
present in the pore solution. Since the silicon has been converted from monosilicic acid
to a more complex form, the monosilicic acid in the solution remains unsaturated,
allowing the continued dissolution of the solid silica.

M.A.Sc. Thesis - Sarah Young - McMaster University - Civil Engineering
8
Figure 2.2: Solubility of Silica at Various pH Levels (Alexander, Heston, & Iler,
1954)
At pH values above 10.7, all amorphous silica is soluble (Iler, 1979, p. 47). The
ionic Equation 2-1 is valid at all pH levels at 25°C; however, the silicate ion changes to
other ionic species. The equilibrium equations for other silica species are in Equation
2-2 to Equation 2-5 (Iler, 1979, p. 136). Since the silica is converted into multiple
species, there is continued dissolution of the amorphous silica. This condition is
expected in concrete where the pH is typically 12.5 to 13.5 (Mehta & Monteiro, 2006).
�H�SiO� = 1.85 × 10�Si�OH���OH� Equation 2-1
Si�OH� + OH� Si�OH��
+ H�O Equation 2-2
Si�OH� + 2OH� SiO��OH��
� + 2H�O Equation 2-3
4Si�OH� + 2OH�SiO�OH��� + 6H�O Equation 2-4
M.A.Sc. Thesis - Sarah Young - McMaster University - Civil Engineering
9
4Si�OH� + 4OH�SiO�OH� + 8H�O Equation 2-5
The mechanism of dissolution proposed by Iler involves an anion catalyst to start
the reaction (1979, pp. 62-63). In alkaline solutions, the catalyst is a hydroxide ion that
is adsorbed onto the silica surface. The adsorbed hydroxyl ion increases the
coordination number of the silicon ion; this weakens the strength of the bonds to the
oxygen atoms. The silicon atom is then able to enter the solution as soluble silica.
When the pH rises above 11, hydroxyl ions in the solution will also react with the silica,
forming silicate ions. This keeps the solution unsaturated with respect to soluble silica.
Alkali ions can also act as catalysts for the dissolution (Dove & Rimstidt, 1994).
The effects of sodium and potassium ions are very similar while lithium and magnesium
are less effective catalysts. Additionally, the presence of salts in solutions will increase
the dissolution rate of silica (Iler, 1979),(Wirth & Gieskes, 1978). Wirth and Gieskes
found that both sodium chloride and magnesium chloride increased the dissolution rate
of silica (1978). They concluded that it was the chlorine ion that had the catalytic effect
on the reaction.
2.6 Reaction Models
The dissolution rate of silica in solution has been fit by many researchers to
Equation 2-6 (O'Connor & Greenberg, 1958). In this equation, C is the concentration of
monosilicic acid, S is the surface area and k2 and Ce are rate constants.
���� = ����� − �� Equation 2-6
At a high pH, the rate of dissolution is much greater than the rate of
polymerization of silica. Therefore, Equation 2-6 is simplified to the Hixson-Crowell
cubic root law given by Equation 2-7. This equation was initially developed by Hixson
and Crowell to model the dissolution of particles in an agitated solution (1931). In this
equation, the rate, k, is a function of the surface area. Assumptions include mostly
spherical particles, dissolution in the direction normal to the surface and constant
agitation.

M.A.Sc. Thesis - Sarah Young - McMaster University - Civil Engineering
10
�Si��"�#� = ��$�%&%'%()#� − �� Equation 2-7
This model only accounts for the dissolution and polymerization of silica and does
not model any reactions occurring on the surface of the silica with other ions in the
solution. This is accounted for in the model by Ichikawa and Miura (2007).
Ichikawa and Miura conducted an experimental study to determine what
conditions will create expansive pressure which will crack glass aggregates (2007). Five
millimetre diameter glass beads were dropped in aqueous solutions containing various
concentrations of sodium hydroxide and calcium hydroxide. The method that resulted
in cracked beads was a two day immersion in a sodium hydroxide solution, followed by
three days in calcium hydroxide, then finally one day in sodium hydroxide. The
researcher postulated that the sodium hydroxide solution first created a soft alkali
silicate on the surface of the glass. When submerged in the calcium hydroxide, the
outside layer is converted to a harder calcium alkali silicate. The sodium hydroxide then
is able to penetrate through this layer while the silica diffusion out of the particle has
been slowed. Expansive pressure is created which cracks the particle.
Ichikawa then developed a model to predict the expansive pressure using his
experimental results (Ichikawa, 2009). The first portion of the model is the probability,
pr, that the particle will develop a reaction rim with a certain thickness, hr, can withstand
the accumulation of enough pressure that would be able to crack the particle. The
thicknesses are assumed to follow a normal distribution.
*+ = 1 − 1,2-.+�/ exp 3−124�ℎ − ℎ(�.+ 6�7 �ℎ89:
*+ ≈ < 00.5 + ℎ+ − ℎ(3.+1 >?@ℎ+ ≤ ℎ( − 1.5.+>?@ℎ( − 1.5.+ ≤ ℎ+ ≤ ℎ( + 1.5.+>?@ℎ+ ≥ ℎ( + 1.5.+ C Equation 2-8
In Equation 2-8, ha is the average thickness of the reaction rim and σr is the standard
deviation of the rim thickness.

M.A.Sc. Thesis - Sarah Young - McMaster University - Civil Engineering
11
The model then estimates whether there is enough pressure to crack the particle.
The probability, pc, that the particle will crack is estimated with the following normal
distribution.
*D = 1 − 1,2-.D�/ exp 3−124�E − E(�.D 6�7 �E8FGHFI
≈ JKL 0 >?@MN ≤ �E( − 1.5.D�OMP0.5 + MN − OMPE(3.DOMP >?@�E( − 1.5.(�.MP ≤ MN ≤ �E( + 1.5.D�OMP1 >?@MN ≥ �E( + 1.5.D�OMP
C Equation 2-9
Where US is the volume of the reacting aggregate, UA is the volume that is converted to
alkali-silicate, this volume is compressed to the volume, U. P is the expansive pressure,
Pa, the average expansive pressure and σc is the standard deviation of the pressure. The
term α is found using Equation 2-10, where κS is the compressibility of the aggregate,
and ε is the reaction expansion ratio.
O = κRϵ − 1 Equation 2-10
Ichikawa’s model then predicts the reaction rim thickness according to the
concentrations of ions in the pore solutions.
2.7 Silica and sodium hydroxide solutions
Niibori, Kunita, Tochiyama and Chida studied the dissolution kinetics of silica in
alkaline solutions with an initial pH of 13 (2000). Researchers mixed 100 milligrams of
amorphous silica or 200 milligrams of silica scale in 500 millilitres of 0.1M sodium
hydroxide. Figure 2.3 shows the dissolution rates at various temperatures. The
researchers then fit a shrinking spherical model to the experimental results. The rate of
dissolution at a certain time, or alternatively, the rate of change of concentration in the
solution, is proportional to the surface area of the spherical particles. It was found that
this model fit well with the dissolution rates at high temperatures, whereas it deviated
at low temperatures.

M.A.Sc. Thesis - Sarah Young - McMaster University - Civil Engineering
12
Figure 2.3: Dissolution of amorphous silica in sodium hydroxide (Niibori, Kunita,
Tochiyama, & Chida, 2000)
Dron and Brivot studied solutions containing silica in the form of opal and sodium
hydroxide (Dron & Brivot, 1993). The initial portion of their study concerned the
dissolution rate of the opal in a sodium hydroxide solution, shown in Figure 2.4. Dron
and Brivot mixed 25ml of solution with 10g of opal. The equilibrium concentration
reached was equal to the initial concentration of sodium hydroxide, indicating that the
limiting reagent in this study was the sodium hydroxide. The authors were not certain if
the initial portion of the curve before one hour was a result of the solution heating to
the desired temperature or another phenomenon.

M.A.Sc. Thesis - Sarah Young - McMaster University - Civil Engineering
13
Figure 2.4: Dissolution of Opal in a Sodium Hydroxide Solution (Dron & Brivot,
1993)
Greenberg studied the factors impacting the dissolution of silica in sodium
hydroxide solutions (1957). Holding all variables constant, adding more silica to a
solution of sodium hydroxide will increase the rate of reaction. This agrees with other
findings that an increase in surface area results in a faster reaction. Greenberg also
found an increase in pH will cause the silica to react faster. Finally, they investigated the
impacts of stirring and temperature. As expected, a temperature increase and stirring
will cause a faster reaction.
2.8 Silica and Lime Solutions
The reaction between silica and calcium hydroxide involves the dissolution of silica
and then a reaction between the silicon ions and calcium hydroxide to form calcium
silicate hydrate products (Greenberg, 1961). One of the earliest studies on this system
was conducted by Shaw and MacIntire (1930). They found the speed of the reaction
increased with smaller particles, due to increasing the surface area. Additionally, when
calcium chloride was added to the solutions, more calcium reacted with the silica in the
solution. This is evidence of chlorine ions having a catalytic effect on the dissolution of
silica as stated by Wirth and Gieskes (1978). Greenberg also investigated the rates of
reaction between silica and calcium hydroxide solutions (1961). It was determined that
the rate determining step in the reaction was the dissolution of silica. As a result of this
conclusion, it was found that the rate of reaction was proportional to the quantity of

M.A.Sc. Thesis - Sarah Young - McMaster University - Civil Engineering
14
silica added to the solution. In the range that was studied, the quantity of calcium
hydroxide did not impact the reaction rate.
Barret, Ménétrier and Cottin studied solutions containing silica and lime (1977).
One gram of silica was combined with one litre of calcium hydroxide solutions of varying
concentrations. The solutions were measured at various points to understand the
progression of the reaction. The solutions were filtered and the solids were measured
by atomic adsorption spectrophotometry. Barret et al. also used varying initial
concentrations of lime. The lime in the solutions reached their equilibrium points at
approximately 5 days. The solutions with less initial lime reached equilibrium faster.
The silica in the solution reached its equilibrium point slightly after the lime. Barret et al.
observed that in this specific scenario, the silica enters the solution faster than the lime
precipitates, indicating the dissolution of silica is occurring at a faster rate than the
precipitation of silica-lime products.
El-Shimy, Abo-El-Enein, El-Didamony and Osman investigated systems containing
lime and silica fume at C/S ratios of 0.8 to 2.0 (2000). Due to the large surface area of
silica fume, the silica reacted rapidly with the calcium in the solution. After a short
period, a reacted rim formed around the grains of silica fume. These reaction rims are
similar to those that have been modeled by Ichikawa (2009).
2.9 Calcium, Sodium and Silica Solutions
Systems with calcium hydroxide, sodium hydroxide and silica have been studied
with the purpose of creating synthetic C-S-H and studying alkali silica reaction. The
solutions had varying calcium to silica ratios depending whether the goal was to study
the formation of C-S-H or ASR.
Solutions containing both calcium hydroxide and sodium hydroxide reacting with
silica will have both the effects of the two component systems competing and forming
new products. The silica will be dissolving readily due to the high pH of system and the
catalytic effects of the sodium and the silica ions will be available to react with the
calcium and sodium ions in the solution. Due to the interaction of the sodium hydroxide
and the calcium hydroxide in the solution, the solubility of calcium hydroxide is
repressed. The solubility of calcium hydroxide is determined from the solubility product
in Equation 2-11, where T± is the mean activity coefficient. Including the activity
coefficient increases the accuracy of solutions with high ionic strengths.

M.A.Sc. Thesis - Sarah Young - McMaster University - Civil Engineering
15
V"W = ��X�Y��Z[��T± (Wright, 2007) Equation 2-11
The mean activity coefficient may be found by using Equation 2-12. The equation
is derived from Debye-Hückel theory. In this equation, A and B are constants which
depend on the solvent and the temperature, I is the ionic strength of the solution, z is
charge on the ions in the solution and bI is a linear term to account for an increase of
solubility when the solution has a higher ionic strength.
log T± = −_|aYa| √c1 + då√c + fc (Wright, 2007) Equation 2-12
The concentration of hydroxide in Equation 2-11 is equal to the total
concentration in the solution rather than the hydroxide originating from the calcium
hydroxide. Since there is hydroxide originating from both sodium hydroxide and calcium
hydroxide, Equation 2-11 can be transformed to Equation 2-13.
V"W = ��X�Y���Z[�g( + �Z[�h(��T± Equation 2-13
In this equation, the subscripts indicate whether the hydroxide ion originated from
the sodium hydroxide or the calcium hydroxide. Since the presence of sodium hydroxide
suppresses the solubility of the calcium hydroxide, it can be assumed that the calcium
hydroxide is saturated. The ions in the solution are in equilibrium with the solid calcium
hydroxide according to Equation 2-14.
�X�Z[���"� � �X�(i��Y + 2Z[�(i� Equation 2-14
From Equation 2-14, it can be seen that the amount of calcium ions in the solution
is half that of the hydroxyl ions from the calcium hydroxide, shown in Equation 2-15.
2��X�Y� = �Z[�h( Equation 2-15
Substituting Equation 2-15 into Equation 2-13 gives the following:

M.A.Sc. Thesis - Sarah Young - McMaster University - Civil Engineering
16
V"W = 12 �Z[�h(j�Z[�g( + �Z[�h(k�T± Equation 2-16
Expanding the formula gives the following cubic function.
V"W = l12 �Z[�h(� + �Z[�g(�Z[�h(� + 12 �Z[�g(� �Z[�h(m T± Equation 2-17
There is one real root of Equation 2-17 and it is given by Equation 2-18.
�OH�no
=pqr�OH�so– 3 × uKwxγ± + �OH�so�27 +4Kwxγ± � + 2 × Kwx × �OH�so�27γ± 6#�{
#�
|}~�
9 × uKwxγ± + �OH�so�27 +4Kwxγ± � + 2 × Kwx × �OH�so�27γ± 6#�{#�
Equation 2-18
Therefore, the concentration of calcium ions in the solution in terms of the
concentration of sodium ions and the solubility product of calcium hydroxide is given in
Equation 2-19.
�Ca�Y�
= pqr�NaY�– 3 × uKwxγ± + �NaY��27 +4Kwxγ± � + 2 × Kwx × �NaY��27γ± 6#�{
#�
|}~�
18 × uKwxγ± + �NaY��27 +4Kwxγ± � + 2 × Kwx × �NaY��27γ± 6#�{#�
Equation 2-19
Given Ksp=9.04x10⁻⁶
and γ±=0.647, the expected concentration of calcium
hydroxide in the solution is shown in Figure 2.5 (Greenberg & Copeland, 1960).

M.A.Sc. Thesis
Figure 2.5: Calcium hydroxide concentration given sodium hydroxide
Diamond studied
concentrations with those calculated with Debye
determined during the first two to three months
cement was extremely similar to the theoretical calculations
these equations are valid for estimating concrete ion concentrations.
this time span, the calcium disappeared from t
should have still been present
over the calcium hydroxide in the cement, preventing further dissolution.
Way and Shayan investigated alkali calcium silicates to
structure of the products from alkali silica
sodium hydroxide and silica with lime. The initial ratios of calcium to silica ranged from
0.116 to 1.81. Once mixed, the solutions were agitated for 2 hours and then shaken
once each day. After four weeks, the solutions were analyzed by the gravimetric
method and by x-ray diffraction.
instead of lime and there were no significant changes to the results.
initially contained a C/S ratio up to 1.17 produced precipitate with higher ratios,
indicating that more of the calcium was dissolved into the solution. Above this ratio, the
precipitate had approximately the same C/S ratio as the initial ratio.
include any time dependent findings.
M.A.Sc. Thesis - Sarah Young - McMaster University - Civil Engineering
17
Calcium hydroxide concentration given sodium hydroxide
concentration, 25°C
pore solutions of cements and compared the actual ion
concentrations with those calculated with Debye-Hückel theory equations
determined during the first two to three months that the calcium concentration in the
cement was extremely similar to the theoretical calculations. This demonstrates
these equations are valid for estimating concrete ion concentrations.
, the calcium disappeared from the pore solution when theoretically
should have still been present. Diamond hypothesized that a reacted layer had formed
over the calcium hydroxide in the cement, preventing further dissolution.
Way and Shayan investigated alkali calcium silicates to further understand the
structure of the products from alkali silica reaction (1992). They mixed solutions
sodium hydroxide and silica with lime. The initial ratios of calcium to silica ranged from
Once mixed, the solutions were agitated for 2 hours and then shaken
once each day. After four weeks, the solutions were analyzed by the gravimetric
ray diffraction. Solutions were also created with calcium hydroxide
ere were no significant changes to the results.
initially contained a C/S ratio up to 1.17 produced precipitate with higher ratios,
indicating that more of the calcium was dissolved into the solution. Above this ratio, the
approximately the same C/S ratio as the initial ratio. This study did not
include any time dependent findings.
Civil Engineering
Calcium hydroxide concentration given sodium hydroxide
pore solutions of cements and compared the actual ion
equations (1975). He
that the calcium concentration in the
This demonstrates that
these equations are valid for estimating concrete ion concentrations. However, after
when theoretically it
. Diamond hypothesized that a reacted layer had formed
over the calcium hydroxide in the cement, preventing further dissolution.
further understand the
. They mixed solutions of
sodium hydroxide and silica with lime. The initial ratios of calcium to silica ranged from
Once mixed, the solutions were agitated for 2 hours and then shaken
once each day. After four weeks, the solutions were analyzed by the gravimetric
Solutions were also created with calcium hydroxide
ere were no significant changes to the results. Solutions that
initially contained a C/S ratio up to 1.17 produced precipitate with higher ratios,
indicating that more of the calcium was dissolved into the solution. Above this ratio, the
This study did not

M.A.Sc. Thesis - Sarah Young - McMaster University - Civil Engineering
18
Kalousek studied the products formed when a sodium silicate solution was mixed
with sodium hydroxide, calcium hydroxide and distilled water (1944). The samples were
shaken for the first few hours after they were mixed and then once per day afterwards.
They were tested at random intervals from two weeks up to eighteen weeks. Kalousek
observed that there were no visible changes in the solutions up to the time they were
tested. Several methods of testing the solutions were utilized to find the concentrations
of the various components. The concentration of calcium hydroxide was found using a
gravimetric method. The sodium oxide concentration was found by titrating the
solution with hydrochloric acid and calculations were conducted to account for the
calcium hydroxide that was neutralized as well. Finally, the solutions were dehydrated
by using hydrochloric acid and then the resulting solids were burned and reacted with
hydrofluoric acid. The weight loss from the process was considered silica. The
concentrations found in the solutions are presented in Figure 2.6. The variation from
the fitted line is due to testing the solutions at various ages. The line has been fitted
best to solutions that were four weeks old. The composition of the precipitates is shown
in Figure 2.7. It can be observed that for solutions that contained above approximately
25g/L of sodium oxide, the ratio of sodium to silica is constant. The same conclusion
was drawn concerning the ratio of calcium to silica; however, there does not appear to
be sufficient data points to draw a definite conclusion regarding the trend. Kalousek
varied the quantity of silica in the solution while holding the concentration of sodium
oxide constant. The observed changes in the solutions were not greater than the errors
produced by preparation of the samples, thus no conclusions can be drawn from the
data.

M.A.Sc. Thesis
Figure 2.6: Concentration of Chemicals at Various Na
Figure 2.7: Composition of Precipitate at Various Initial Na
with Oversaturated Calcium Oxide and Silica.
Macphee, Luke, Glasser and Lachowski studied solutions containing calcium oxide,
soda gels, sodium hydroxide and silicic acid
M.A.Sc. Thesis - Sarah Young - McMaster University - Civil Engineering
19
: Concentration of Chemicals at Various Na2O Concentrations
• = CaO (Kalousek, 1944)
: Composition of Precipitate at Various Initial Na2O Concentrations
with Oversaturated Calcium Oxide and Silica. (Kalousek, 1944)
Macphee, Luke, Glasser and Lachowski studied solutions containing calcium oxide,
soda gels, sodium hydroxide and silicic acid (1989). The initial compositions contained
Civil Engineering
O Concentrations. ∘∘∘∘ = SiO2,
O Concentrations
(Kalousek, 1944)
Macphee, Luke, Glasser and Lachowski studied solutions containing calcium oxide,
. The initial compositions contained

M.A.Sc. Thesis
C/S ratios from 1 to 1.9 and sodium hydroxide concentrations from 0.25M to 0.8M. The
solutions were mixed in an atmosphe
one week following mixing
by using flame emission spectroscopy,
measurements. Some of the results from solutions are presented in
Figure 2.9. The solid lines indicate
acid, calcium oxide and sodium hydroxide while the dashed best fit line is for systems
created with C3S. Over time, both the quantity of calcium ions and silicon ions in the
solution decreased, indicating solids forming. The molar ratios in the synthetic C
formed are presented in
initial ratio of C/S. The fitted lines range from initial C/S ratio of 1 to 1.9. The solutions
with lower C/S ratios have precipitate compositions very similar to the initial ones. As
the initial C/S ratio increases, the precipitate composi
than the initial ratio. By comparing
the precipitate composition over time is highly dependent on the initial concentration of
sodium hydroxide. The precipitates formed in [NaOH]=0.25M change significan
the course of the testing period while those in [NaOH]=0.8M experience very little
changes.
Figure 2.8: Ion Concentrations in
Solutions at 2 Weeks(Macphee, Luke,
Glasser, & Lachowski, 1989)
M.A.Sc. Thesis - Sarah Young - McMaster University - Civil Engineering
20
C/S ratios from 1 to 1.9 and sodium hydroxide concentrations from 0.25M to 0.8M. The
solutions were mixed in an atmosphere without carbon dioxide. They
one week following mixing and then at intervals thereafter. The solutions were analyzed
flame emission spectroscopy, the automated colorimetric method, and pH
Some of the results from solutions are presented in
es indicate the best fit lines when analyzing a system with silicic
, calcium oxide and sodium hydroxide while the dashed best fit line is for systems
Over time, both the quantity of calcium ions and silicon ions in the
solution decreased, indicating solids forming. The molar ratios in the synthetic C
formed are presented in Figure 2.10 and Figure 2.11. The best fit lines
The fitted lines range from initial C/S ratio of 1 to 1.9. The solutions
with lower C/S ratios have precipitate compositions very similar to the initial ones. As
the initial C/S ratio increases, the precipitate composition increasingly becomes lower
By comparing Figure 2.10 and Figure 2.11, it can be observed that
the precipitate composition over time is highly dependent on the initial concentration of
sodium hydroxide. The precipitates formed in [NaOH]=0.25M change significan
the course of the testing period while those in [NaOH]=0.8M experience very little
: Ion Concentrations in
(Macphee, Luke,
Glasser, & Lachowski, 1989)
Figure 2.9: Ion Concentrations in
Solutions at 6 Months(Macp
Glasser, & Lachowski, 1989)
Civil Engineering
C/S ratios from 1 to 1.9 and sodium hydroxide concentrations from 0.25M to 0.8M. The
were shaken for
The solutions were analyzed
automated colorimetric method, and pH
Some of the results from solutions are presented in Figure 2.8 and
the best fit lines when analyzing a system with silicic
, calcium oxide and sodium hydroxide while the dashed best fit line is for systems
Over time, both the quantity of calcium ions and silicon ions in the
solution decreased, indicating solids forming. The molar ratios in the synthetic C-S-H
. The best fit lines are for each
The fitted lines range from initial C/S ratio of 1 to 1.9. The solutions
with lower C/S ratios have precipitate compositions very similar to the initial ones. As
tion increasingly becomes lower
, it can be observed that
the precipitate composition over time is highly dependent on the initial concentration of
sodium hydroxide. The precipitates formed in [NaOH]=0.25M change significantly over
the course of the testing period while those in [NaOH]=0.8M experience very little
: Ion Concentrations in
(Macphee, Luke,
Glasser, & Lachowski, 1989)

M.A.Sc. Thesis - Sarah Young - McMaster University - Civil Engineering
21
Figure 2.10: Precipitate Composition,
initial [NaOH]=0.25M(Macphee, Luke,
Glasser, & Lachowski, 1989)
Figure 2.11: Precipitate Composition,
initial [NaOH]=0.8M(Macphee, Luke,
Glasser, & Lachowski, 1989)
Leemann, Saout, Winnefeld, Rentsch and Lothenbach studied the conditions
required to develop an alkali silica reaction by creating a synthetic pore solution, silica
fume and portlandite (2011). 1M sodium hydroxide or potassium hydroxide was mixed
with the microsilica and the portlandite at a solid to liquid ratio at 1:2. The ratio of
calcium hydroxide to silica ranged from 0:1 to 0.58:1. The samples were mixed for 6
days and then were placed in a desiccator at a high relative humidity to promote the
formation of ASR products. It was found that the addition of portlandite slowed the
dissolution of silica, but allowed more to dissolve over time. The concentration of silica
and calcium remained low in the solution while C-S-H was being formed. Once all of the
calcium was consumed, the solution’s silica concentration increased. This was
accompanied by a gradual loss of alkali from the solution.
2.10 Alkali Glass Systems
Kouassi, Andji, Bonnet and Rossignol studied the dissolution of glass in highly
alkaline solutions with the goal of understanding the behaviour of glass in concrete
(2010). Two grams of crushed recycled glass was added to thirty millilitres of 0.5M to
5M alkaline solutions and placed into an oven to accelerate the reaction. Samples were
removed at various times and an ICP-AES analysis was conducted to determine the
contents of the solutions. TGA analysis was carried out as well as SEM. Finally, IR
analysis was performed. The recycled glass mostly consisted of silica, sodium oxide and
calcium oxide.
As expected, it was found that the smaller particles dissolved the fastest.
Additionally, when the concentration of the alkali solution was increased, the dissolution
rate of the glass increased slightly. This effect can be seen in Figure 2.12. Kouassi et al.

M.A.Sc. Thesis - Sarah Young - McMaster University - Civil Engineering
22
identified the three distinct stages of the dissolution of glass, the first is while the
solution remains unsaturated, next, there is dissolution and precipitation because the
solution has become saturated and finally the last stage is when a reaction layer has
developed on the surface of the glass.
Figure 2.12: The dissolution of a glass in various concentrations of alkali solution
(Kouassi, Andji, Bonnet, & Rossignol, 2010)
2.11 Thermo Gravimetric Analysis
Kim, Foley and Reda Taha created synthetic calcium silicate hydrate samples from
solutions of sodium metasilicate, commonly known as waterglass, and calcium oxide
(2013). The samples were dried to eleven percent relative humidity and then tested
with thermo gravimetric analysis (TGA) to determine the percentage of calcium
hydroxide, calcium carbonate and calcium silicate hydrate in the specimens. The
samples were heated to 1000 degrees Celsius by 10 degrees per minute. The initial
weight was taken at 145 degrees to exclude any absorbed water. The weight loss
between 145 and 350 degrees Celsius was assumed to be loss of water from C-S-H.
Between 350 and 500 degrees Celsius, the weight loss was due to the dehydration of the
calcium hydroxide. Finally, the weight loss between 600 and 825 degrees Celsius was
assumed to be due to the loss of carbon dioxide from calcium carbonate.
Zhang and Ye studied the dehydration of cement paste up to 1000 degrees Celsius
(Zhang & Ye, 2012). They varied the heating rates from 1 to 30 degrees Celsius per
minute. It was found that the dehydration of calcium hydroxide occurred between 400

M.A.Sc. Thesis - Sarah Young - McMaster University - Civil Engineering
23
and 550 degrees Celsius. Above 600 degrees, the rate of weight loss increases which
corresponds to Kim et al.’s loss of carbon dioxide in the calcium carbonate (Kim, Foley, &
Reda Taha, 2013). However, Zhang and Ye neglected analysis of this phase even though
the loss of carbon dioxide from calcium carbonate consisted of approximately two
percent of their sample. From their study of varying the heating rates, it is shown that a
higher heating rate causes compounds to decompose at higher temperatures than if the
heating rate was slow. The rate of mass loss per degree Celsius was lower when the
samples were heated faster.
Jain and Neithalath studied the changes to porosity due to calcium leaching in
cement and used TGA analysis to identify the quantities of calcium hydroxide and C-S-H
in their system (2009). They identified the weight drop associated with calcium
hydroxide dehydration to be between 400 and 450 degrees Celsius. The amount of
calcium hydroxide in the mix was then calculated using Equation 2-20.
�[% = ��h��%� × ��h���� (Jain & Neithalath, 2009) Equation 2-20
Where WLCH is the weight loss of dehydrating calcium hydroxide, MWCH is the
molecular weight of calcium hydroxide and MWH is the molecular weight of water. This
equation was derived from the dehydration equilibrium of calcium hydroxide.
�X�Z[���P� � ('���� �XZ�P� + [�Z��� Equation 2-21
2.12 Summary
A review of C-S-H and ASR formation has been presented in this chapter. C-S-H is
a main component of hardened cement paste and is a strong and durable solid. ASR is a
product of silica, alkalis and some calcium hydroxide. It is a gel that forms in the
hardened cement paste that is able to expand when exposed to liquid and crack the
concrete. This leads to safety and durability issues and should be prevented when
concrete will be exposed to wet environments.
When using ground glass in concrete, the particles will undergo either a pozzolanic
reaction or an alkali-silica reaction. Previous work has focused on how the size of
particle will impact the expansiveness of the resulting product. It has been found that a
pessimum size will create the largest expansion, sizes above and below will create a less

M.A.Sc. Thesis - Sarah Young - McMaster University - Civil Engineering
24
expansive product. Since there is a large amount of variability in the chemistry in these
tests, there has not been a definite agreement as to what size of glass is required to
produce a concrete product that will not expand. Thus the chemistry of the reactions
between silica, sodium hydroxide and calcium hydroxide were examined.
Systems containing sodium hydroxide and silica will result in the silica dissolving at
a rate proportional to the surface area of the silica particles. The sodium in the solution
acts as a catalyst to the reaction and will result in faster dissolution compared to
solutions without alkalis. The dissolution fits with the Hixson-Crowell cubic root law at
elevated temperatures and deviates slightly at room temperature. At an elevated pH,
like that found in concrete, the solubility of silica is greatly increased and it will continue
to dissolve until all the solids have been converted to aqueous silicate ions.
Calcium hydroxide and silica will create calcium silicate products. The silica will
dissolve into solution and react with the aqueous calcium. The rate of this reaction is
determined by the dissolution of the silica. Eventually, reaction rims of calcium silicate
can form on the surface of the silica. This will slow the reaction until equilibrium has
been reached.
The system with calcium hydroxide, sodium hydroxide and silica is able to form
products similar to C-S-H and to ASR. Due to the common hydroxide ion, the calcium
hydroxide is kept saturated in these solutions. Silica will dissolve and can react with the
sodium and calcium ions in the solution. Once it has reacted with some of the calcium,
further dissolution of calcium occurs. Depending on the initial concentrations, and ASR
product or a C-S-H product can be formed. The rates of reaction depend on the energy
imputed into the system. These have been varied by changing the temperature of the
solutions and the amount of agitation reaction vessels experience.
The method of Thermo Gravimetric Analysis was examined when researchers
have used products with calcium hydroxide and calcium carbonate. The heating rate
impacts the temperature at which compounds will decompose. In general, calcium
hydroxide will decompose between 350 and 550 degrees Celsius and calcium carbonate
will decompose above 650 degrees Celsius. From this, researchers are able to calculate
the quantity of these substances that is present in their specimens.
Further research into the chemical reactions involved between glass and cement is
needed to characterize the rate of silica dissolution and precipitation of solids and

M.A.Sc. Thesis - Sarah Young - McMaster University - Civil Engineering
25
product formed. This will aid in determining which mixes will create an expansive
product due to ASR and which ones will have a pozzolanic reaction.

M.A.Sc. Thesis - Sarah Young - McMaster University - Civil Engineering
26
3 Experimental Program
The experimental program developed for this study includes the selection and
characterization of the materials, the mixing and handling procedure adapted, and
testing methods. Chemical reactions were monitored with time through changes in the
pH values, and by testing the composition of the liquid and solid products using ICP-AES
(inductively coupled plasma atomic emission spectroscopy) and Thermal Gravimetric
Analysis (TGA), respectively. All of the experiments were conducted at room
temperature.
3.1 Materials
The samples were created from stock solutions and powders. The sodium
hydroxide stock solution was a 1N solution from EDM Millipore Corporation (EDM
Millipore, 2013). Amorphous fumed silicon (IV) oxide from Alfa Aesar was used for the
silica; its purity was 99.5% and passed a 400 mesh (Alfa Aesar, 2013). Finally, two
different bottles of calcium hydroxide were used. The first was used for some of the
calcium and silica reactions and was calcium hydroxide powder from EDM. Since this
container was older, it had experienced partial carbonation and it contained 85%
calcium hydroxide by mass. Initial concentrations presented in this work reflect the real
quantity of calcium hydroxide contained in the samples. The second container of
calcium hydroxide was also from EDM and had not experienced carbonation (EDM
Millipore, 2013). The water used to mix the samples had undergone reverse osmosis
(R.O.) filtration. The water used to create the calibration standards for the ICP-AES
testing was filtered by a Milli-Q Integral filter. The reaction bottles were 30mL Thermo
Scientific Nalgene Wide-Mouth Economy Bottles made with high-density polyethylene
(HDPE).
3.2 Experimental Procedure
3.2.1 Mixture Composition
The concentrations of the samples were designed to represent the pore solution
of cement. The corresponding pH range of the sodium hydroxide was 13.4 to 13.7 in
order to represent the alkali concentration found in concrete.
The initial concentrations for the samples were divided into three groups, Ca(OH)2
+SiO2, NaOH + SiO2 and NaOH + Ca(OH)2 + SiO2 as shown in Table 3.1. Abbreviation used
in labeling is "CLSL" when "C" corresponds to Ca, "S" to Si, and "L" low concentrations.
Terms "M" and "H" are used to represent medium and high concentrations respectively.

M.A.Sc. Thesis - Sarah Young - McMaster University - Civil Engineering
27
Table 3.1: Concentrations of NaOH, Ca(OH)2, and SiO2 used for the experimental
program (M)
Group # Sample # [Ca(OH)2] [NaOH] [SiO2] pH
1 CLSL 0.013 0 0.0016 12.41
CLSM 0.013 0 0.02 12.41
CLSH 0.015 0 0.10 12.48
CMSL 0.023 0 0.0016 12.66
CMSM 0.023 0 0.02 12.66
CMSH1 0.023 0 0.10 12.66
CMSH2 0.021 0 0.134 12.62
CMSH3 0.023 0 0.153 12.66
CHSL 0.045 0 0.0016 12.66
CHSM 0.045 0 0.02 12.66
CHSH 0.045 0 0.10 12.66
2 NLSL 0 0.30 0.115 13.48
NLSM 0 0.30 0.134 13.48
NLSH 0 0.30 0.153 13.48
NMSL 0 0.42 0.134 13.62
NMSM 0 0.42 0.153 13.62
NMSH 0 0.42 0.165 13.62
NHSL 0 0.53 0.153 13.72
NHSM 0 0.53 0.165 13.72
NHSH 0 0.53 0.180 13.72
3 CNLSL 0.023 0.30 0.115 13.48
CNLSM 0.023 0.30 0.134 13.48
CNLSH 0.023 0.30 0.153 13.48
CNMSL 0.023 0.42 0.134 13.62
CNMSM 0.023 0.42 0.153 13.62
CNMSH 0.023 0.42 0.165 13.62
CNHSL 0.023 0.53 0.153 13.72
CNHSM 0.023 0.53 0.165 13.72
CNHSH 0.023 0.53 0.180 13.72
3.2.2 Mixing Procedure
Eight samples of each composition were created for testing at 12 hours, 1 day, 4
days, 7 days, 14 days, 30 days, 92 days and one for pH measurements. The samples
were prepared by first weighing the required quantity of silica and then, if needed the
calcium hydroxide into the 30mL reaction bottles, shown in Figure 3.1. In a glove bag
that contained a nitrogen atmosphere as seen in Figure 3.2, the R.O. water was added
via an automatic pipette. Subsequently, the appropriate quantity of sodium hydroxide
was added to the solution with the automatic pipette, Figure 3.3. The reaction bottles

M.A.Sc. Thesis - Sarah Young - McMaster University - Civil Engineering
28
were tightly closed then removed from the glove bag and vigorously shaken by hand to
dissolve the calcium hydroxide. The bottles containing the mixed solutions were placed
onto rollers, Figure 3.4, which kept the solutions rotating at a rate of approximately 0.92
rpm until they were tested. The purpose of the rollers was to prevent the solids from
settling and to ensure all of the solids were reacting. The samples were kept at constant
room temperature.
Figure 3.1: Electronic scale with ±0.0001g accuracy used to weigh the powder

M.A.Sc. Thesis - Sarah Young - McMaster University - Civil Engineering
29
Figure 3.2: Glove bag with N2 to mitigate contamination
Figure 3.3: Additions of liquids, R.O. water and NaOH to reaction bottle inside the
glove bag

M.A.Sc. Thesis - Sarah Young - McMaster University - Civil Engineering
30
Figure 3.4: Rollers used for continuous mixing of samples
At the specified time, the solutions were filtered by gravimetric filtration under a
nitrogen atmosphere, Figure 3.5. The separated solids were left to dry in the glove bag
under a nitrogen atmosphere. While the solutions were filtering, a different container
containing the same solution was used to test for the solution’s pH. The filtered
solutions and solids were then stored in sealed reaction bottles until they were tested.

M.A.Sc. Thesis - Sarah Young - McMaster University - Civil Engineering
31
Figure 3.5: Sample being filtered
3.3 Testing
3.3.1 pH Values
The progression of the pH in the various solutions was measured using, one of the
eight samples for each mixture. When using normal pH electrodes, sodium in the
solution can be confused with the hydrogen ions; leading to large errors in the pH
readings. Therefore, an electrode tailor made for measuring pH in high sodium
environments was selected. The Oakton pH electrode is shown in Figure 3.6 (Cole-
Parmer Canada Inc., 2012). Amber glass was used to minimize the sodium error. The
voltage was measured by the Thermo Scientific Orion Star A211 pH Benchtop Meter. Its
accuracy is to ±0.002 pH or to ±0.2 mV (Cole-Parmer Canada Inc., 2012).

M.A.Sc. Thesis - Sarah Young - McMaster University - Civil Engineering
32
Figure 3.6: pH electrode inside the glove bag
The pH meter was calibrated before every measurement as seen in Figure 3.7. The
meter contained a calibration method in which the electrode is placed into different
buffer solutions. The meter then identifies the solution and correlates the pH of the
buffer to the voltage it reads. Between each reading, the probe was rinsed with tap
water. The buffer solutions used were pH 4, 7 and 10. The meter then displays both the
pH of its readings and the potential difference between the solution and the reference
cell.

M.A.Sc. Thesis - Sarah Young - McMaster University - Civil Engineering
33
Figure 3.7: Calibrating pH electrode
Once calibrated, the pH probe was rinsed with tap water again and then placed
into the reacting solution. When the reading of the pH probe was stabilized, the meter
displayed the solution’s pH. Following a measurement, the probe was placed in a pH 4
buffer solution for fifteen minutes. This was found to reduce the errors encountered
following successive alkaline pH measurements.
3.3.2 ICP-AES Testing
ICP-AES (inductively coupled plasma atomic emission spectroscopy) testing was
carried out to quantify the concentration of silicon, calcium and sodium ions in the
solutions. The ICP-AES machine, seen in Figure 3.8, first turns a portion of the sample
into a mist with the nebulizer and injects it into a chamber where there is a plasma
torch. The plasma excites the ions in the solution. When the ions return to their normal
state, they emit radiation which is measured. Technical details on the test equipment
can be found in the Varian Vista ICP brochure (Varian, 2013).

M.A.Sc. Thesis - Sarah Young - McMaster University - Civil Engineering
34
Figure 3.8: ICP AES machine located in BSB at McMaster University
Three calibration solutions were created for each of the elements to be tested.
Each set of solutions contained a low, medium and high concentration of the element to
be analyzed. To aid the dissolution of the silica calibration solutions, hydrochloric acid
was added to the mix. The solutions to be tested were diluted in order for the
concentrations to be within the limits of the calibrations solutions. The dilution was
performed under a nitrogen atmosphere in a glove bag to ensure that the solutions did
not experience carbonation. The solutions were diluted to 5x their original
concentrations. A second dilution was necessary for the samples containing sodium as it
is a strong catalyst for silicon dissolution and they were out of range of the silicon
calibration solutions. These samples were diluted to 10x or 25x when necessary.
Once the ICP-AES machine was setup and ready to operate, the method was
entered into the ICP expert II software. First, the element to be analyzed was entered
into the program. Three wavelengths were then selected to be read during the testing.
The wavelengths selected were the top three recommended by the software. For each
of the wavelengths, the interactions with other elements were checked to ensure the
interacting elements were not present in the solutions. The software calculated the
calibration curve from the calibration solutions.

M.A.Sc. Thesis - Sarah Young - McMaster University - Civil Engineering
35
The test method consisted of running a blank sample, three calibration solutions
and then the test solutions. The machine was recalibrated after every ten samples. At
the end of the procedure, the software calculated the average concentration from the
three wavelengths measured. This average was taken as the concentration of ions
present in the solution.
While the ICP-AES machine was capable of identifying the concentration of all
three elements simultaneously, this could not be done since the calibration solutions
would require all three elements in one solution. This would have caused reactions and
precipitation similar to the sample solutions. Therefore, the solutions were tested for
each element individually.
3.3.3 TGA Testing
Thermal Gravimetric Analysis (TGA) was completed on the dried precipitate
samples. The testing was completed using a TGA/SDT Q600 machine made by TA
Instruments (TA Instruments, 2013). The equipment heats an alumina cup filled with a
sample shown in Figure 3.9 at a constant rate. The weight and the heat flow into the
sample are measured. Both the sample cup and the reference cup are placed onto the
balance arms and the machine is tared. The sample cup is then removed and
approximately 20mg of solids was added to the cup. Less was added if the reactions did
not produce enough precipitate. The cup was then placed back on the balance and the
furnace was left for 20 minutes so that the air would be purged and replaced with
nitrogen. All of the samples were then heated at a rate of 20 degrees per minute up to
at least 1000°C. Both the weight and heat flow were recorded for the duration of the
experiment.

M.A.Sc. Thesis - Sarah Young - McMaster University - Civil Engineering
36
Figure 3.9: Sample cups on TGA beams
The weight change was analyzed using the software "Advantage" developed by TA
instruments (TA Instruments, 2013). The weight loss was taken as the loss from the
onset of the curve to the end, as shown by the arrows in Figure 3.10. There was some
moisture in all the samples since they were not initially heated to remove the free
water. The initial water content was calculated from the mass loss that occurred around
100°C. The percent losses from compounds were then changed to the percent loss from
a dried sample using Equation 3-1.
Dried%lost = initial%lost × 100%100%−%freewater Equation 3-1
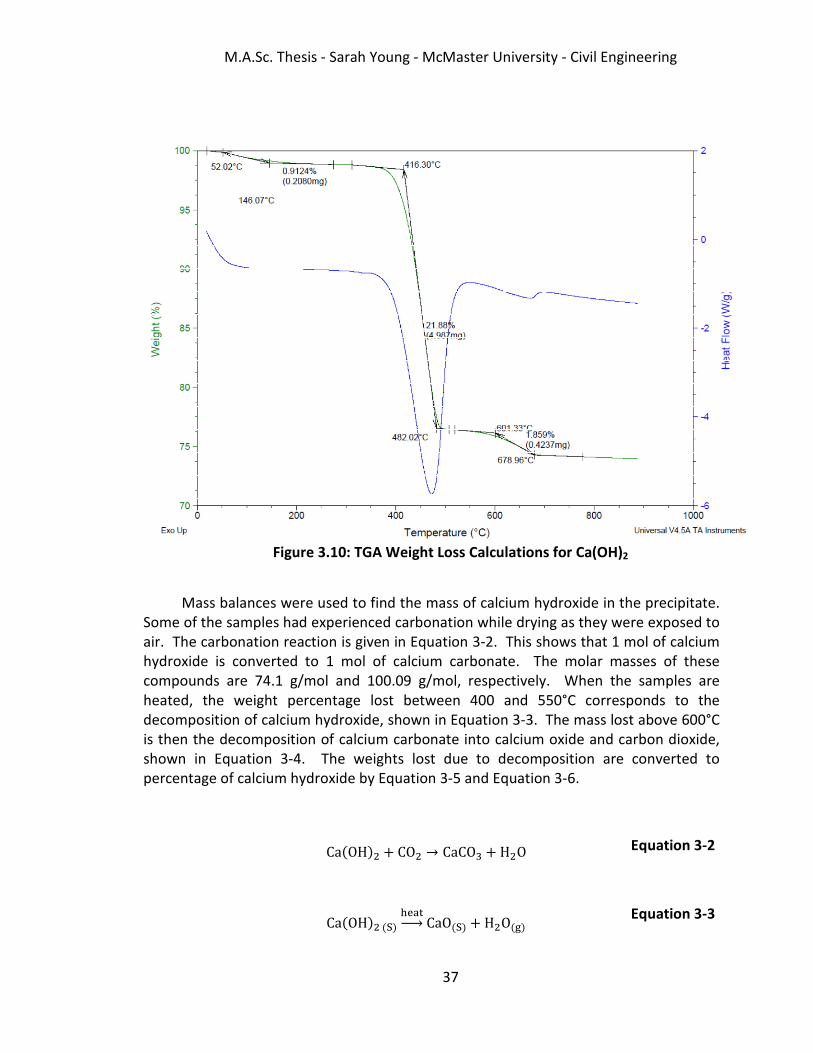
M.A.Sc. Thesis - Sarah Young - McMaster University - Civil Engineering
37
Figure 3.10: TGA Weight Loss Calculations for Ca(OH)2
Mass balances were used to find the mass of calcium hydroxide in the precipitate.
Some of the samples had experienced carbonation while drying as they were exposed to
air. The carbonation reaction is given in Equation 3-2. This shows that 1 mol of calcium
hydroxide is converted to 1 mol of calcium carbonate. The molar masses of these
compounds are 74.1 g/mol and 100.09 g/mol, respectively. When the samples are
heated, the weight percentage lost between 400 and 550°C corresponds to the
decomposition of calcium hydroxide, shown in Equation 3-3. The mass lost above 600°C
is then the decomposition of calcium carbonate into calcium oxide and carbon dioxide,
shown in Equation 3-4. The weights lost due to decomposition are converted to
percentage of calcium hydroxide by Equation 3-5 and Equation 3-6.
Ca�OH�� + CO� → CaCO� + H�O Equation 3-2
Ca�OH���R� ��o���� CaO�R� + H�O��� Equation 3-3

M.A.Sc. Thesis - Sarah Young - McMaster University - Civil Engineering
38
CaCO��R� ��o����CaO�R� + CO���� Equation 3-4
1%H�Olost400 − 550℃ × 74.1 g mol⁄ Ca�OH��18.01 g mol⁄ H�O= 4.11%Ca�OH��
Equation 3-5
1%CO�lostabove600℃ × 100.09 g mol⁄ CaCO�44.01 g mol⁄ CO�× 74.1 g mol⁄ Ca�OH��100.09 g mol⁄ CaCO� = 1.68%Ca�OH��
Equation 3-6

M.A.Sc. Thesis - Sarah Young - McMaster University - Civil Engineering
39
4 Experimental Results
4.1 Introduction
Results of the experimental program are presented in this chapter. This includes
the concentrations of ions in the solutions as found by the ICP-AES testing, the pH levels
with time, and the composition of the precipitate with time. The results are presented
in graphical form as a function of time.
4.2 Calcium and Silicon Concentrations over Time
The results for the samples containing solely calcium hydroxide and silica are
presented in the following section. For low concentrations of calcium hydroxide with
low, medium and high contents of silica, the results are presented in Figure 4.1, Figure
4.2, and Figure 4.3. The composition of the precipitate plotted as a ratio of calcium to
silica is shown in Figure 4.4. For the combination of medium concentrations of calcium
hydroxide with all the different contents of silica, the results are plotted in Figure 4.5,
Figure 4.6, Figure 4.8, Figure 4.10, and Figure 4.12. The composition of the precipitate
for the medium concentration of calcium hydroxide with silica is shown in Figure 4.7,
Figure 4.9, Figure 4.11, and Figure 4.13 and is shown as the ratio of calcium to silica. For
the high concentrations of calcium hydroxide with the low, medium and high contents of
silica, the results are shown in Figure 4.14, Figure 4.16 and Figure 4.17. The ratio of
calcium to silica in the precipitate is plotted in Figure 4.15 and Figure 4.18.
Figure 4.1: Concentration and pH vs. Time; [Ca(OH)2]0=0.013, [SiO2]0=0.0016
10
10.5
11
11.5
12
12.5
13
13.5
14
0.000
0.002
0.004
0.006
0.008
0.010
0.012
0 20 40 60 80 100
Ca
Si
pH

M.A.Sc. Thesis - Sarah Young - McMaster University - Civil Engineering
40
Figure 4.2: Concentration and pH vs. Time; [Ca(OH)2]0=0.013, [SiO2]0=0.020
Figure 4.3: Concentration and pH vs. Time; [Ca(OH)2]0=0.015, [SiO2]0=0.100
10.0
10.5
11.0
11.5
12.0
12.5
13.0
13.5
14.0
0.000
0.002
0.004
0.006
0.008
0.010
0.012
0.014
0 20 40 60 80 100
pH
Co
nce
ntr
ati
on
(m
ol/
L)
Time (Days)
Ca
Si
pH
10.0
10.5
11.0
11.5
12.0
12.5
13.0
13.5
14.0
0.000
0.002
0.004
0.006
0.008
0.010
0.012
0 20 40 60 80 100
pH
Co
nce
ntr
ati
on
(m
ol/
L)
Time (Days)
Ca
Si
pH

M.A.Sc. Thesis - Sarah Young - McMaster University - Civil Engineering
41
Figure 4.4: Precipitate Composition; [Ca(OH)2]0=0.015, [SiO2]0=0.100
Figure 4.5: Concentration and pH vs. Time; [Ca(OH)2]0=0.023, [SiO2]0=0.0016
0.00
0.01
0.02
0.03
0.04
0.05
0.06
0.07
0.08
0.09
0.10
0 20 40 60 80 100
C/S
Time (Days)
10.0
10.5
11.0
11.5
12.0
12.5
13.0
13.5
14.0
0.000
0.005
0.010
0.015
0.020
0.025
0 20 40 60 80 100
pH
Co
nce
ntr
ati
on
(m
ol/
L)
Time (Days)
Ca
Si
pH

M.A.Sc. Thesis - Sarah Young - McMaster University - Civil Engineering
42
Figure 4.6: Concentration and pH vs. Time; [Ca(OH)2]0=0.023, [SiO2]0=0.020
Figure 4.7: Precipitate Composition; [Ca(OH)2]0=0.023, [SiO2]0=0.020
10.0
10.5
11.0
11.5
12.0
12.5
13.0
13.5
14.0
0.000
0.002
0.004
0.006
0.008
0.010
0.012
0.014
0.016
0.018
0 20 40 60 80 100
pH
Co
nce
ntr
ati
on
(m
ol/
L)
Time (Days)
Ca
Si
pH
0.00
0.05
0.10
0.15
0.20
0.25
0.30
0.35
0.40
0 20 40 60 80 100
C/S
Time (Days)

M.A.Sc. Thesis - Sarah Young - McMaster University - Civil Engineering
43
Figure 4.8: Concentration and pH vs. Time; [Ca(OH)2]0=0.023, [SiO2]0=0.100
Figure 4.9: Precipitate Composition; [Ca(OH)2]0=0.023, [SiO2]0=0.100
10.0
10.5
11.0
11.5
12.0
12.5
13.0
13.5
14.0
0.000
0.002
0.004
0.006
0.008
0.010
0.012
0.014
0.016
0.018
0.020
0 20 40 60 80 100
pH
Co
nce
ntr
ati
on
(m
ol/
L)
Time (Days)
Ca
Si
pH
0.00
0.02
0.04
0.06
0.08
0.10
0.12
0.14
0.16
0 20 40 60 80 100
C/S
Time (Days)

M.A.Sc. Thesis - Sarah Young - McMaster University - Civil Engineering
44
Figure 4.10: Concentration and pH vs. Time; [Ca(OH)2]0=0.021, [SiO2]0=0.134
Figure 4.11: Precipitate Composition; [Ca(OH)2]0=0.021, [SiO2]0=0.134
10.0
10.5
11.0
11.5
12.0
12.5
13.0
13.5
14.0
0.000
0.002
0.004
0.006
0.008
0.010
0.012
0.014
0.016
0.018
0 20 40 60 80 100
pH
Co
nce
ntr
ati
on
(m
ol/
L)
Time (Days)
Ca
Si
pH
-0.02
0.00
0.02
0.04
0.06
0.08
0.10
0.12
0 20 40 60 80 100
C/S
Time (Days)

M.A.Sc. Thesis - Sarah Young - McMaster University - Civil Engineering
45
Figure 4.12: Concentration and pH vs. Time; [Ca(OH)2]0=0.023, [SiO2]0=0.153
Figure 4.13: Precipitate Composition; [Ca(OH)2]0=0.023, [SiO2]0=0.153
10.0
10.5
11.0
11.5
12.0
12.5
13.0
13.5
14.0
0.000
0.002
0.004
0.006
0.008
0.010
0.012
0.014
0.016
0.018
0 20 40 60 80 100
pH
Co
nce
ntr
ati
on
(m
ol/
L)
Time (Days)
Ca
Si
pH
0.00
0.02
0.04
0.06
0.08
0.10
0.12
0 20 40 60 80 100
C/S
Time (Days)

M.A.Sc. Thesis - Sarah Young - McMaster University - Civil Engineering
46
Figure 4.14: Concentration and pH vs. Time; [Ca(OH)2]0=0.045, [SiO2]0=0.0016
Figure 4.15: Precipitate Composition; [Ca(OH)2]0=0.045, [SiO2]0=0.0016
10.0
10.5
11.0
11.5
12.0
12.5
13.0
13.5
14.0
0.000
0.005
0.010
0.015
0.020
0.025
0 20 40 60 80 100
pH
Co
nce
ntr
ati
on
(m
ol/
L)
Time (Days)
Ca
Si
pH
0
1
2
3
4
5
6
7
8
0 20 40 60 80 100
C/S
Time (Days)

M.A.Sc. Thesis - Sarah Young - McMaster University - Civil Engineering
47
Figure 4.16: Concentration and pH vs. Time; [Ca(OH)2]0=0.045, [SiO2]0=0.020
Figure 4.17: Concentration and pH vs. Time; [Ca(OH)2]0=0.045, [SiO2]0=0.100
10.0
10.5
11.0
11.5
12.0
12.5
13.0
13.5
14.0
0.000
0.005
0.010
0.015
0.020
0.025
0 20 40 60 80 100
pH
Co
nce
ntr
ati
on
(m
ol/
L)
Time (Days)
Ca
Si
pH
10.0
10.5
11.0
11.5
12.0
12.5
13.0
13.5
14.0
0.000
0.005
0.010
0.015
0.020
0.025
0 20 40 60 80 100
pH
Co
nce
ntr
ati
on
(m
ol/
L)
Time (Days)
Ca
Si
pH

M.A.Sc. Thesis - Sarah Young - McMaster University - Civil Engineering
48
Figure 4.18: Precipitate Composition; [Ca(OH)2]0=0.045, [SiO2]0=0.100
4.3 Sodium and Silicon Solution Concentrations over Time
The results for the samples containing sodium hydroxide and silica are shown in
this section. The results for the low content of sodium hydroxide and the low, medium
and high concentrations of silica are presented in Figure 4.19, Figure 4.20 and Figure
4.21. The results for the medium concentration of sodium hydroxide with low, medium
and high concentrations of silica are shown in Figure 4.22, Figure 4.23 and Figure 4.24.
The results for the high concentration of sodium hydroxide with all of the silica contents
are presented in Figure 4.25, Figure 4.26 and Figure 4.27.
0.00
0.05
0.10
0.15
0.20
0.25
0.30
0.35
0.40
0 20 40 60 80 100
C/S
Time (Days)

M.A.Sc. Thesis - Sarah Young - McMaster University - Civil Engineering
49
Figure 4.19: Concentration and pH vs. Time; [NaOH]0=0.30, [SiO2]0=0.115
Figure 4.20: Concentration and pH vs. Time; [NaOH]0=0.30, [SiO2]0=0.134
10.0
10.5
11.0
11.5
12.0
12.5
13.0
13.5
14.0
0.00
0.05
0.10
0.15
0.20
0.25
0.30
0.35
0 20 40 60 80 100
pH
Co
nce
ntr
ati
on
(m
ol/
L)
Time (Days)
Na
Si
pH
10.0
10.5
11.0
11.5
12.0
12.5
13.0
13.5
14.0
0.00
0.05
0.10
0.15
0.20
0.25
0.30
0.35
0 20 40 60 80 100
pH
Co
nce
ntr
ati
on
(m
ol/
L)
Time (Days)
Na
Si
pH

M.A.Sc. Thesis - Sarah Young - McMaster University - Civil Engineering
50
Figure 4.21: Concentration and pH vs. Time; [NaOH]0=0.30, [SiO2]0=0.153
Figure 4.22: Concentration and pH vs. Time; [NaOH]0=0.42, [SiO2]0=0.134
10.0
10.5
11.0
11.5
12.0
12.5
13.0
13.5
14.0
0.00
0.05
0.10
0.15
0.20
0.25
0.30
0.35
0 20 40 60 80 100
pH
Co
nce
ntr
ati
on
(m
ol/
L)
Time (Days)
Na
Si
pH
10.0
10.5
11.0
11.5
12.0
12.5
13.0
13.5
14.0
0.00
0.05
0.10
0.15
0.20
0.25
0.30
0.35
0.40
0.45
0 20 40 60 80 100
pH
Co
nce
ntr
ati
on
(m
ol/
L)
Time (Days)
Na
Si
pH

M.A.Sc. Thesis - Sarah Young - McMaster University - Civil Engineering
51
Figure 4.23: Concentration and pH vs. Time; [NaOH]0=0.42, [SiO2]0=0.153
Figure 4.24: Concentration and pH vs. Time; [NaOH]0=0.42, [SiO2]0=0.165
10.0
10.5
11.0
11.5
12.0
12.5
13.0
13.5
14.0
0.00
0.05
0.10
0.15
0.20
0.25
0.30
0.35
0.40
0.45
0.50
0 20 40 60 80 100
pH
Co
nce
ntr
ati
on
(m
ol/
L)
Time (Days)
Na
Si
pH
10.0
10.5
11.0
11.5
12.0
12.5
13.0
13.5
14.0
0.00
0.05
0.10
0.15
0.20
0.25
0.30
0.35
0.40
0.45
0 20 40 60 80 100
pH
Co
nce
ntr
ati
on
(m
ol/
L)
Time (Days)
Na
Si
pH

M.A.Sc. Thesis - Sarah Young - McMaster University - Civil Engineering
52
Figure 4.25: Concentration and pH vs. Time; [NaOH]0=0.53, [SiO2]0=0.153
Figure 4.26: Concentration and pH vs. Time; [NaOH]0=0.53, [SiO2]0=0.165
10.0
10.5
11.0
11.5
12.0
12.5
13.0
13.5
14.0
0.00
0.10
0.20
0.30
0.40
0.50
0.60
0 20 40 60 80 100
pH
Co
nce
ntr
ati
on
(m
ol/
L)
Time (Days)
Na
Si
pH
10.0
10.5
11.0
11.5
12.0
12.5
13.0
13.5
14.0
0.00
0.10
0.20
0.30
0.40
0.50
0.60
0 20 40 60 80 100
pH
Co
nce
ntr
ati
on
(m
ol/
L)
Time (Days)
Na
Si
pH

M.A.Sc. Thesis - Sarah Young - McMaster University - Civil Engineering
53
Figure 4.27: Concentration and pH vs. Time; [NaOH]0=0.53, [SiO2]0=0.180
4.4 Sodium, Calcium and Silicon Concentrations over Time
This section contains the results for the samples containing sodium hydroxide,
calcium hydroxide and silica. The results for the low concentration of sodium hydroxide
with calcium hydroxide and low, medium and high concentrations of silica are shown in
Figure 4.28, Figure 4.30 and Figure 4.32. The precipitate composition is plotted as the
ratio of calcium to silica and sodium to silica and is shown in Figure 4.29, Figure 4.31 and
Figure 4.33. The results for the medium concentration of sodium hydroxide with
calcium hydroxide and low, medium and high contents of silica are plotted in Figure
4.34, Figure 4.36 and Figure 4.38. The precipitate composition is shown in Figure 4.35,
Figure 4.37 and Figure 4.39. The results for the high concentration of sodium hydroxide
with calcium hydroxide the low, medium and high contents of silica are shown in Figure
4.40, Figure 4.42 and Figure 4.44. The precipitate composition is displayed in Figure
4.41, Figure 4.43 and Figure 4.45.
10.0
10.5
11.0
11.5
12.0
12.5
13.0
13.5
14.0
0.00
0.10
0.20
0.30
0.40
0.50
0.60
0 20 40 60 80 100
pH
Co
nce
ntr
ati
on
(m
ol/
L)
Time (Days)
Na
Si
pH

M.A.Sc. Thesis - Sarah Young - McMaster University - Civil Engineering
54
Figure 4.28: Concentration and pH vs. Time; [Ca(OH)2]0=0.023, [NaOH]0=0.30,
[SiO2]0=0.115
Figure 4.29: Precipitate Composition; [Ca(OH)2]0=0.023, [NaOH]0=0.30,
[SiO2]0=0.115
10.00
10.50
11.00
11.50
12.00
12.50
13.00
13.50
14.00
0.00
0.05
0.10
0.15
0.20
0.25
0.30
0.35
0 20 40 60 80 100
pH
Co
nce
ntr
ati
on
(m
ol/
L)
Time (Days)
Ca
Na
Si
pH
0.00
0.20
0.40
0.60
0.80
1.00
1.20
0 20 40 60 80 100
Time (Days)
C/S
N/S

M.A.Sc. Thesis - Sarah Young - McMaster University - Civil Engineering
55
Figure 4.30: Concentration and pH vs. Time; [Ca(OH)2]0=0.023, [NaOH]0=0.30,
[SiO2]0=0.134
Figure 4.31: Precipitate Composition; [Ca(OH)2]0=0.023, [NaOH]0=0.30,
[SiO2]0=0.134
10.0
10.5
11.0
11.5
12.0
12.5
13.0
13.5
14.0
0.00
0.05
0.10
0.15
0.20
0.25
0.30
0.35
0 20 40 60 80 100
pH
Co
nce
ntr
ati
on
(m
ol/
L)
Time (Days)
Ca
Na
Si
pH
0.00
0.10
0.20
0.30
0.40
0.50
0.60
0.70
0.80
0.90
1.00
0 20 40 60 80 100
Time (Days)
C/S
N/S

M.A.Sc. Thesis - Sarah Young - McMaster University - Civil Engineering
56
Figure 4.32: Concentration and pH vs. Time; [Ca(OH)2]0=0.023, [NaOH]0=0.30,
[SiO2]0=0.153
Figure 4.33: Precipitate Composition; [Ca(OH)2]0=0.023, [NaOH]0=0.30,
[SiO2]0=0.153
10.0
10.5
11.0
11.5
12.0
12.5
13.0
13.5
14.0
0.00
0.05
0.10
0.15
0.20
0.25
0.30
0.35
0 20 40 60 80 100
pH
Co
nce
ntr
ati
on
(m
ol/
L)
Time (Days)
Ca
Na
Si
pH
0.00
0.50
1.00
1.50
2.00
2.50
3.00
0 20 40 60 80 100
Time (Days)
C/S
N/S
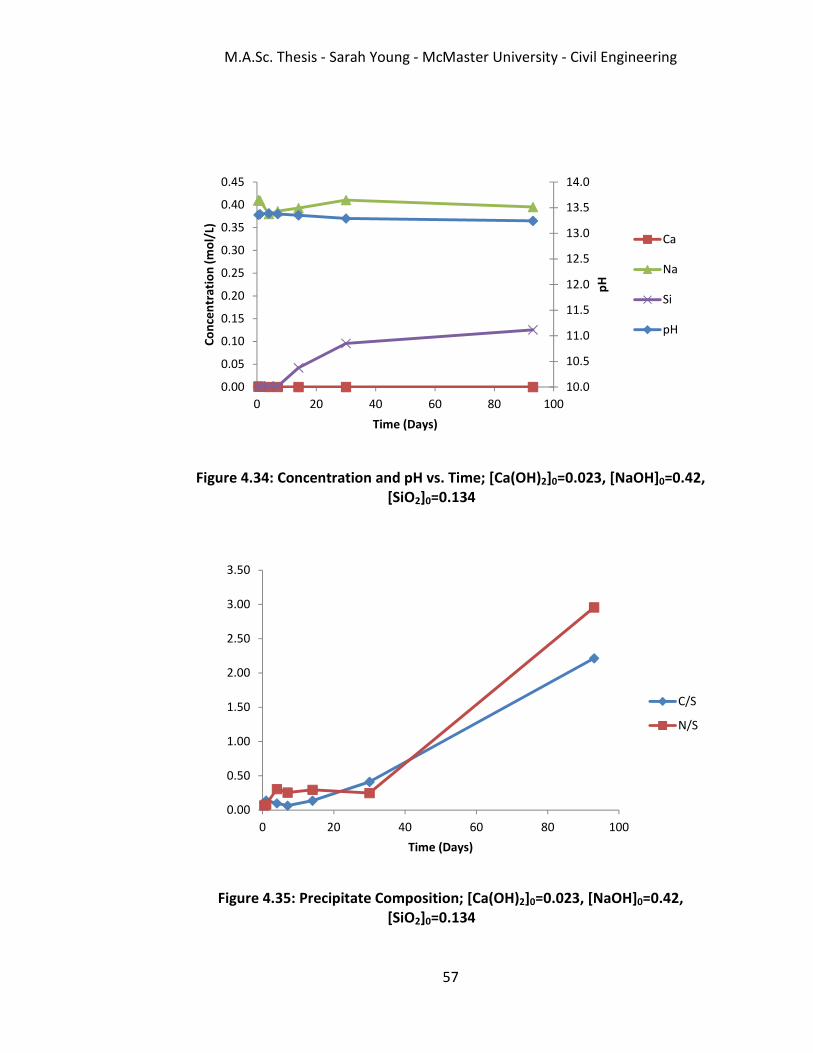
M.A.Sc. Thesis - Sarah Young - McMaster University - Civil Engineering
57
Figure 4.34: Concentration and pH vs. Time; [Ca(OH)2]0=0.023, [NaOH]0=0.42,
[SiO2]0=0.134
Figure 4.35: Precipitate Composition; [Ca(OH)2]0=0.023, [NaOH]0=0.42,
[SiO2]0=0.134
10.0
10.5
11.0
11.5
12.0
12.5
13.0
13.5
14.0
0.00
0.05
0.10
0.15
0.20
0.25
0.30
0.35
0.40
0.45
0 20 40 60 80 100
pH
Co
nce
ntr
ati
on
(m
ol/
L)
Time (Days)
Ca
Na
Si
pH
0.00
0.50
1.00
1.50
2.00
2.50
3.00
3.50
0 20 40 60 80 100
Time (Days)
C/S
N/S

M.A.Sc. Thesis - Sarah Young - McMaster University - Civil Engineering
58
Figure 4.36: Concentration and pH vs. Time; [Ca(OH)2]0=0.023, [NaOH]0=0.42,
[SiO2]0=0.153
Figure 4.37: Precipitate Composition; [Ca(OH)2]0=0.023, [NaOH]0=0.42,
[SiO2]0=0.153
10.0
10.5
11.0
11.5
12.0
12.5
13.0
13.5
14.0
0.00
0.05
0.10
0.15
0.20
0.25
0.30
0.35
0.40
0.45
0 20 40 60 80 100
pH
Co
nce
ntr
ati
on
(m
ol/
L)
Time (Days)
Ca
Na
Si
pH
0
2
4
6
8
10
12
14
16
18
0 20 40 60 80 100
Time (Days)
C/S
N/S

M.A.Sc. Thesis - Sarah Young - McMaster University - Civil Engineering
59
Figure 4.38: Concentration and pH vs. Time; [Ca(OH)2]0=0.023, [NaOH]0=0.42,
[SiO2]0=0.165
Figure 4.39: Precipitate Composition; [Ca(OH)2]0=0.023, [NaOH]0=0.42,
[SiO2]0=0.165
10.0
10.5
11.0
11.5
12.0
12.5
13.0
13.5
14.0
0.00
0.05
0.10
0.15
0.20
0.25
0.30
0.35
0.40
0.45
0 20 40 60 80 100
pH
Co
nce
ntr
ati
on
(m
ol/
L)
Time (Days)
Ca
Na
Si
pH
0.00
0.50
1.00
1.50
2.00
2.50
0 20 40 60 80 100
Time (Days)
C/S
N/S

M.A.Sc. Thesis - Sarah Young - McMaster University - Civil Engineering
60
Figure 4.40: Concentration and pH vs. Time; [Ca(OH)2]0=0.023, [NaOH]0=0.53,
[SiO2]0=0.153
Figure 4.41: Precipitate Composition; [Ca(OH)2]0=0.023, [NaOH]0=0.53,
[SiO2]0=0.153
10.0
10.5
11.0
11.5
12.0
12.5
13.0
13.5
14.0
0.00
0.10
0.20
0.30
0.40
0.50
0.60
0 20 40 60 80 100
pH
Co
nce
ntr
ati
on
(m
ol/
L)
Time (Days)
Ca
Na
Si
pH
0.00
0.20
0.40
0.60
0.80
1.00
1.20
1.40
1.60
1.80
0 20 40 60 80 100
Time (Days)
C/S
N/S

M.A.Sc. Thesis - Sarah Young - McMaster University - Civil Engineering
61
Figure 4.42: Concentration and pH vs. Time; [Ca(OH)2]0=0.023, [NaOH]0=0.53,
[SiO2]0=0.165
Figure 4.43: Precipitate Composition; [Ca(OH)2]0=0.023, [NaOH]0=0.53,
[SiO2]0=0.165
10.0
10.5
11.0
11.5
12.0
12.5
13.0
13.5
14.0
0.00
0.10
0.20
0.30
0.40
0.50
0.60
0 20 40 60 80 100
pH
Co
nce
ntr
ati
on
(m
ol/
L)
Time (Days)
Ca
Na
Si
pH
0
5
10
15
20
25
0 20 40 60 80 100
Time (Days)
C/S
N/S

M.A.Sc. Thesis - Sarah Young - McMaster University - Civil Engineering
62
Figure 4.44: Concentration and pH vs. Time; [Ca(OH)2]0=0.023, [NaOH]0=0.53,
[SiO2]0=0.180
Figure 4.45: Precipitate Composition; [Ca(OH)2]0=0.023, [NaOH]0=0.53,
[SiO2]0=0.180
10.0
10.5
11.0
11.5
12.0
12.5
13.0
13.5
14.0
0.00
0.10
0.20
0.30
0.40
0.50
0.60
0 20 40 60 80 100
pH
Co
nce
ntr
ati
on
(m
ol/
L)
Time (Days)
Ca
Na
Si
pH
0
1
2
3
4
5
6
7
8
0 20 40 60 80 100
Time (Days)
C/S
N/S

M.A.Sc. Thesis - Sarah Young - McMaster University - Civil Engineering
63
4.5 Precipitate Composition
Triaxial plots showing the composition of the reaction products are presented in
this section. The figures are showing the values in atomic percent. The precipitate after
12 hours, 1 day, 4 days, 7 days, 7 days, 30 days and 92 days are shown in Figure 4.46 to
Figure 4.52 respectively.
Figure 4.46: Precipitate Composition at 12 Hours

M.A.Sc. Thesis - Sarah Young - McMaster University - Civil Engineering
64
Figure 4.47: Precipitate Composition at 1 Day
Figure 4.48: Precipitate Composition at 4 Days

M.A.Sc. Thesis - Sarah Young - McMaster University - Civil Engineering
65
Figure 4.49: Precipitate Composition at 7 Days
Figure 4.50: Precipitate Composition at 14 Days

M.A.Sc. Thesis - Sarah Young - McMaster University - Civil Engineering
66
Figure 4.51: Precipitate Composition at 30 Days
Figure 4.52: Precipitate Composition at 92 Days

M.A.Sc. Thesis - Sarah Young - McMaster University - Civil Engineering
67
5 Discussions and Analyses
5.1 Introduction
This chapter presents the analysis of the results presented in chapter 4. Section
5.2 presents the modeling of the silica dissolution and section 5.3 provides an analysis of
the progression of the reaction products.
5.2 Silica Dissolution
The silica dissolution was modeled with the Hixson-Crowell cubic root law given in
Equation 2-7. Linear regression was used to fit the data to the dissolution law. The
intercept was forced to the initial concentration of silica. Additionally, the exponent in
the expression was changed to better fit the data.
The Hixson-Crowell cubic root law was linearized in order to use linear regression
to model the data. The linearized equation is shown as Equation 5-1, where the cubic
root of the silicon concentration became y and intercept is the cubic root of the initial
silicon concentration. The slope of the model is found by minimizing the sum of the
squares of the difference between the real and fitted points, shown as Equation 5-2(Box,
Hunter, & Hunter, 2005).
� = ��$�%&%'%()& − �� Equation 5-1
S = ��� − ��$�%&%'%()& − ���� Equation 5-2
No significant dissolution was observed in most of the solutions solely containing
silica and calcium hydroxide. Only CMSH2 and CMSH3 had noticeable silica dissolution,
as seen in Figure 4.10 and Figure 4.12. These solutions contained the lowest initial
calcium to silica ratios and therefore, less calcium was available to react with the
dissolved silicate ions that were able to remain in solution. Since the silica dissolution
was observed mainly in the solutions containing sodium hydroxide, this section will
focus on those samples.

M.A.Sc. Thesis - Sarah Young - McMaster University - Civil Engineering
68
5.2.1 Sodium Hydroxide and Silica
The dissolution rate of silica in the low medium and high concentrations of sodium
hydroxide were fitted with Equation 5-1. The results are shown in Figure 5.1 to Figure
5.9.
Table 5.1: Coefficients for Dissolution Curves with Sodium Hydroxide and Silica
Sample [Si]initial k n
NLSL 0.115 -0.0044831 1/3
NLSM 0.134 1.09190 -1
NLSH 0.153 3.15810 -1
NMSL 0.134 0.216651 -1/2
NMSM 0.153 0.053165 -1/4
NMSH 0.165 10.8666 -2
NHSL 0.153 0.20466 -1
NHSM 0.165 0.11743 -1/2
NHSH 0.180 0.1678 -1/2
Figure 5.1: Silica Dissolution; [NaOH]0=0.30, [SiO2]0=0.115

M.A.Sc. Thesis - Sarah Young - McMaster University - Civil Engineering
69
Figure 5.2: Silica Dissolution; [NaOH]0=0.30, [SiO2]0=0.134

M.A.Sc. Thesis - Sarah Young - McMaster University - Civil Engineering
70
Figure 5.3: Silica Dissolution; [NaOH]0=0.30, [SiO2]0=0.153

M.A.Sc. Thesis - Sarah Young - McMaster University - Civil Engineering
71
Figure 5.4: Silica Dissolution; [NaOH]0=0.42, [SiO2]0=0.134

M.A.Sc. Thesis - Sarah Young - McMaster University - Civil Engineering
72
Figure 5.5: Silica Dissolution; [NaOH]0=0.42, [SiO2]0=0.153

M.A.Sc. Thesis - Sarah Young - McMaster University - Civil Engineering
73
Figure 5.6: Silica Dissolution; [NaOH]0=0.42, [SiO2]0=0.165

M.A.Sc. Thesis - Sarah Young - McMaster University - Civil Engineering
74
Figure 5.7: Silica Dissolution; [NaOH]0=0.53, [SiO2]0=0.153

M.A.Sc. Thesis - Sarah Young - McMaster University - Civil Engineering
75
Figure 5.8: Silica Dissolution; [NaOH]0=0.53, [SiO2]0=0.165

M.A.Sc. Thesis - Sarah Young - McMaster University - Civil Engineering
76
Figure 5.9: Silica Dissolution; [NaOH]0=0.53, [SiO2]0=0.180

M.A.Sc. Thesis - Sarah Young - McMaster University - Civil Engineering
77
5.2.2 Calcium Hydroxide, Sodium Hydroxide and Silica
The dissolution rate of silica in the sodium hydroxide and calcium hydroxide
solution was fitted to Equation 5-1. The results are shown in Figure 5.10 to Figure 5.18.
Table 5.2: Coefficients for Dissolution Curves with Calcium Hydroxide, Sodium
Hydroxide and Silica
Sample [Si]initial k n
CNLSL 0.115 -0.0023743 1/3
CNLSM 0.134 0.49934 -1
CNLSH 0.153 -0.0037712 1/3
CNMSL 0.134 -0.0035547 1/3
CNMSM 0.153 -0.0040633 1/3
CNMSH 0.165 0.91641 -1
CNHSL 0.153 0.45262 -1
CNHSM 0.165 -0.0048228 1/3
CNHSH 0.180 0.0428363 -1/3
Figure 5.10: Silica Dissolution; [Ca(OH)2]0=0.023, [NaOH]0=0.30, [SiO2]0=0.115

M.A.Sc. Thesis - Sarah Young - McMaster University - Civil Engineering
78
Figure 5.11: Silica Dissolution; [Ca(OH)2]0=0.023, [NaOH]0=0.30, [SiO2]0=0.134

M.A.Sc. Thesis - Sarah Young - McMaster University - Civil Engineering
79
Figure 5.12: Silica Dissolution; [Ca(OH)2]0=0.023, [NaOH]0=0.30, [SiO2]0=0.153

M.A.Sc. Thesis - Sarah Young - McMaster University - Civil Engineering
80
Figure 5.13: Silica Dissolution; [Ca(OH)2]0=0.023, [NaOH]0=0.42, [SiO2]0=0.134

M.A.Sc. Thesis - Sarah Young - McMaster University - Civil Engineering
81
Figure 5.14: Silica Dissolution; [Ca(OH)2]0=0.023, [NaOH]0=0.42, [SiO2]0=0.153
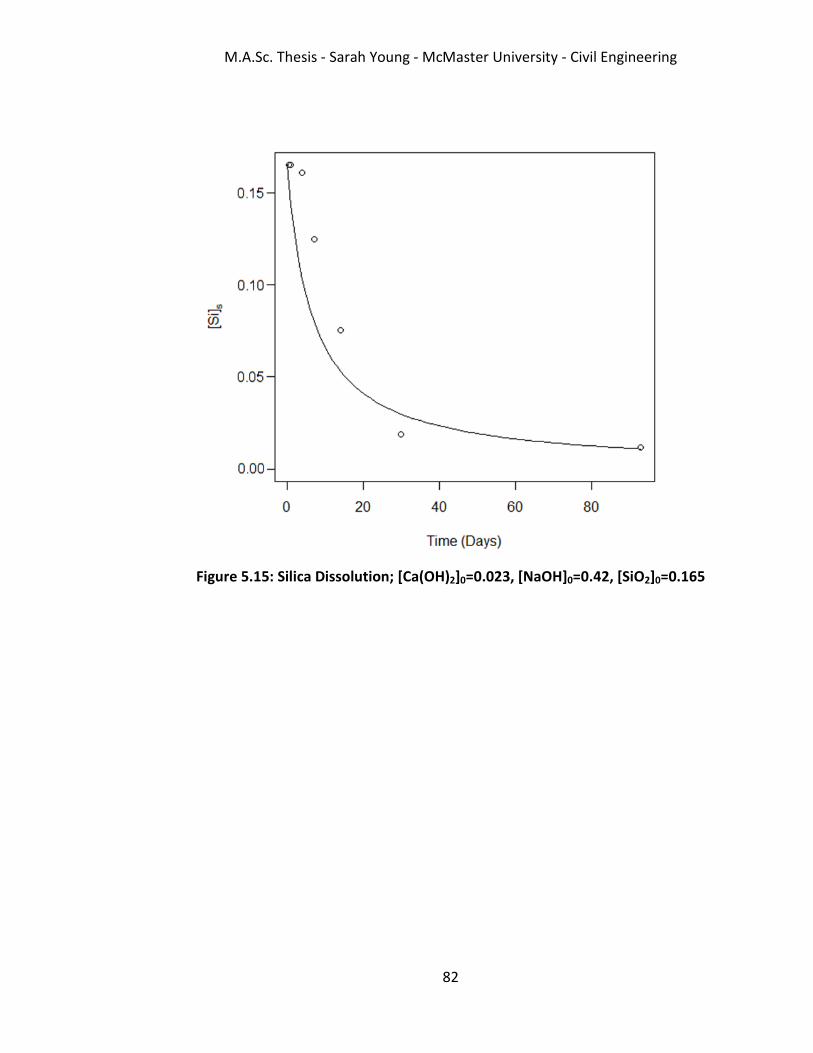
M.A.Sc. Thesis - Sarah Young - McMaster University - Civil Engineering
82
Figure 5.15: Silica Dissolution; [Ca(OH)2]0=0.023, [NaOH]0=0.42, [SiO2]0=0.165

M.A.Sc. Thesis - Sarah Young - McMaster University - Civil Engineering
83
Figure 5.16: Silica Dissolution; [Ca(OH)2]0=0.023, [NaOH]0=0.53, [SiO2]0=0.153

M.A.Sc. Thesis - Sarah Young - McMaster University - Civil Engineering
84
Figure 5.17: Silica Dissolution; [Ca(OH)2]0=0.023, [NaOH]0=0.53, [SiO2]0=0.165

M.A.Sc. Thesis - Sarah Young - McMaster University - Civil Engineering
85
Figure 5.18: Silica Dissolution; [Ca(OH)2]0=0.023, [NaOH]0=0.53, [SiO2]0=0.180
5.2.3 Discussion
The dissolution of silica has been fit to the Hixson-Crowell dissolution law. The
solutions containing only silica and sodium hydroxide show dissolution curves that are
steeper than those that would be expected from the Hixson-Crowell dissolution law.
This indicates that the silica has a higher initial rate of dissolution than expected.
The fitted dissolution curves for the sodium hydroxide and silica solutions
demonstrate how the dissolution is affected by the concentrations of the two
components. The dissolution of the silica in the solution NLSL, as shown in Table 5.1, is
the only dissolution curve that has an exponential curve of 1/3, fitting the Hixson-
Crowell dissolution law. The rest of the solutions dissolve faster, necessitating the use of
different exponents. In general, when the initial concentration of sodium hydroxide is
held constant, the dissolution rate increases as the quantity of silica increases. This is
the same conclusion as found by Greenberg (1957). The only sample that did not follow
this trend was NMSH, see Table 5.1. This sample contained the highest amount of silica

M.A.Sc. Thesis - Sarah Young - McMaster University - Civil Engineering
86
among the solutions with an initial sodium hydroxide concentration of 0.42M, yet it
experienced the slowest dissolution rate.
The dissolution rate of silica in the solution when the quantity of silica is held
constant led to contradicting results. The samples that initially contained 0.134M of
silica demonstrated that as the sodium hydroxide concentration increased, the
dissolution rate also increased. The same trend was displayed in the samples that
initially contained 0.165M of silica. The samples that contained 0.153M of silica
behaved in the opposite manner; when the solution's sodium hydroxide concentration
increased, the dissolution rate decreased.
The solutions containing silica, calcium hydroxide and sodium hydroxide dissolved
closer to the Hixson-Crowell cubic root law than the ones without the calcium
hydroxide. The addition of calcium hydroxide has slowed the dissolution rate of the
silica, indicating a reacted layer has formed; similar to those modeled by Ichikawa
(2009). In order to use Ichikawa's model, the experiment would need to be repeated
with larger spherical silica particles. The thickness of the reaction layer would be
measured and particles would require observation for cracking.
The fitted dissolution equations demonstrate the quantity of silica that is present
in the solution. When the concentration of sodium hydroxide is held constant, the
solutions with the smallest initial concentration of silica dissolve at the slowest rate. The
solutions with initial sodium hydroxide concentrations of 0.42M and 0.53M dissolved at
rates proportional to their concentration of silica. This trend also appeared in the
solutions without the calcium hydroxide. The solutions with an initial sodium hydroxide
concentration of 0.30M behave differently than the other solutions; the solution with
the medium level of silica dissolved the fastest. When the initial concentration of silica
is held constant, the solutions with the higher levels of sodium dissolve most rapidly.
While the rate of dissolution predominantly followed the cubic root law, the initial
dissolution rate was slow; similar to the experiment by Dron and Brivot (1993). The
modeled dissolution does not include this initial portion of the curve. Since this is not
observed in the solutions without calcium hydroxide, the calcium is causing this initial
retardation. This phenomenon is more evident in the solutions containing lower initial
sodium concentrations.
The dissolution of silica in this experimental program is similar to what is expected
when using glass particles instead of pure silica. Kouassi et al. found that when the pH

M.A.Sc. Thesis - Sarah Young - McMaster University - Civil Engineering
87
of the solution is increased, the dissolution rate increased. The three stages of
dissolution would not have occured as identified by Kouassi since the silicon remained
unsaturated in the solution. Had the pH of the solution been below 10.7, the silica
would have reached saturation and these stages could have occured. Since concrete has
a higher pH, this is not expected to occur in a concrete-glass system.
5.3 Reaction Progression
5.3.1 Calcium and Silica
The solutions composed of calcium and silica showed the level of calcium in the
solution slowly lowering and the quantity of silica in the solution remaining negligible or
increasing slightly. The samples that contained low initial silica and calcium
concentrations often did not produce enough precipitate to test with the TGA so the
calcium to silica ratio in the reacted product is unknown. These solutions would need to
be repeated with a larger volume in order to produce more precipitate to find this data.
There are some large jumps in the concentration measurements of the calcium in
the solutions. It is possible that these were caused by differences in handling the
solutions before they were filtered. If some of the solutions were jostled more than
others, some of the calcium hydroxide in precipitate form could have entered the
solution. This would cause a measurement that is unnaturally high.
The calcium to silica ratio in the precipitate remained low at approximately 0.1 for
most of the solutions. The calcium bonded to the silica very slowly over the course of
the testing. The only abnormal sample was the one with high initial concentrations of
calcium hydroxide and very low concentrations of silica. As seen in Figure 4.15, C/S
ratios started around 5.5 and increased to approximately 7. The other two solutions
with the low initial concentration of silica did not produce enough precipitate to
measure, so it is unknown whether they displayed the same trend.
Barret et al. found that the silica in their samples dissolved faster than it could
react with the lime in the solution (1977). The opposite occurred in this experiment; the
calcium is exiting the solution more rapidly than the silica is entering. This indicates that
the rate determining step is the dissolution of the silica; whereas it was the precipitation
in Barret et al.'s observations.
As observed by Greenberg, the rate of reaction is proportional to the quantity of
silica in the solution (1961). This can also be seen in Figure 4.8, Figure 4.10 and Figure

M.A.Sc. Thesis - Sarah Young - McMaster University - Civil Engineering
88
4.12. In these plots, the initial level of calcium hydroxide is held constant and the
concentration of silica was varied. The solution containing the lower level of silica is the
slowest to reach equilibrium and the solution with the highest concentration reaches
equilibrium much more rapidly.
5.3.2 Sodium and Silica
The samples containing silica and sodium hydroxide have the silica dissolving and a
small amount of the sodium reacting with the silica. In comparison with the solutions
without the sodium, the silica has dissolved much more rapidly. This is due to the higher
pH in the solutions and because alkalis act as a catalyst in the dissolution process.
The sodium levels remained high throughout the testing; indicating that not much
had reacted with the silica. Additionally, the pH values dropped only slightly. The silica
dissolved and reacted with the hydroxide ions forming various reaction products, some
being Si(OH)4, Si(OH)3-, SiO2(OH)2
2, Si4O4(OH)6
2- and Si4O4(OH)4
4-. These products are in
equilibrium according to Equation 2-1 to Equation 2-5. While these products could not
be identified through the testing methods performed, they are known to exist in the
solutions due to the high pH.
5.3.3 Calcium, Sodium and Silica
The samples containing calcium hydroxide, sodium hydroxide and silica showed
behaviours evident in the solutions with just two components. The dissolution of the
silica in the sodium hydroxide competed with the reaction of the calcium on the surface
of the silica. As can be observed, the silica dissolves rapidly into the solution while the
calcium concentration remains very low and the sodium slowly exits the solution. The
pH level also decreases slightly, similar to the solutions with the sodium hydroxide and
silica.
The level of calcium ions in the solution remained low throughout the entire
testing period due to the common ion effect. The high concentration of sodium
hydroxide in the solution caused the solubility of the calcium hydroxide to be
suppressed according to Figure 2.5. When some hydroxide from the solution reacted
with the silica, more calcium hydroxide was able to enter the solution and react with the
silicate ions. From the TGA testing, it was observed that the solutions remained
saturated in calcium hydroxide throughout the entire testing period.
The reacted precipitate started as mostly silica and progressed to a combination of
silica, sodium and calcium. The composition of the precipitate over the course of the

M.A.Sc. Thesis - Sarah Young - McMaster University - Civil Engineering
89
experiment can be seen in Figure 4.46 to Figure 4.52. At twelve hours, the precipitate
was extremely similar for all of the samples. Since the reaction had just commenced,
the product is mostly silica. The solutions containing the highest initial concentration of
sodium have the highest levels of sodium in the precipitate. At one day, the
composition of the reaction product is extremely similar as at twelve hours. It can be
seen in the concentration and pH versus time plots for the three component systems in
section 4.4 that the silica has not dissolved much into the solution while the sodium and
calcium concentrations have not altered much. Therefore not much change in the
precipitate was expected.
At four days, the samples were still essentially silica. As seen in the concentration
and pH versus time plots, the silica dissolution is in its initial stagnant phase. The level of
calcium in the precipitate had risen to approximately 10 percent for all the samples. The
sample CNMSL contained the most sodium at approximately 22 percent. At the seven
day mark, many of the results were unable to be measured due to the quantity of
precipitate gathered being too low to analyze with the TGA. The samples that were
measured did not differ greatly from the composition at four days.
At fourteen days, the level of sodium in the reaction product had increased. A
distinction can be seen between the products with different initial levels of sodium. The
concentration in the products was proportional to the initial concentration. At this
point, the level of calcium has increased very slightly up to approximately 10 percent of
the sample.
At thirty days, a drastic change has occurred in the composition of the reaction
product. A significant increase in the quantity of calcium can be observed. The mixes
with the highest initial concentration of sodium now have from 20 to 25% calcium in the
reaction product. The mixes with the medium level of initial sodium are extremely
varied in terms of the quantity of calcium and silica. The mix CNMSM contains
approximately 5% calcium, 12% sodium and 83% silica, and the mix CNMSH contains
approximately 35% calcium, 30% sodium and 35% silica. The composition of these
reaction products do not correlate with the initial concentration of silica. The products
at this point contain concentrations of silica and calcium that would be found in ASR.
The composition of ASR from field samples is seen in Figure 2.1, the reaction products
from the samples CNMSM, CNMSL, CNLSM, CNLSH and CNLSL would fit well with those
found by Thaulow, Hjorth Jakobsen and Clark. The other samples have a similar C/S
ratio but contain more sodium.

M.A.Sc. Thesis - Sarah Young - McMaster University - Civil Engineering
90
The samples at ninety two days have evolved to contain more sodium and less
silica. The products that could have been considered ASR at 30 days now contain very
little silica. It can be seen in the concentration and pH versus time plots that the silica
has mostly dissolved and reaction rims have not prevented dissolution. The reaction
product at this point has progressed past what would be considered ASR and C-S-H and
now has extremely large concentration of sodium. However, two of the samples, CNLSL
and CNLSM, contain low amounts of sodium. Those samples contained low initial
concentrations of sodium and silica. The final composition of these samples were similar
to C-S-H. It is possible that these solutions developed reaction rims that were unable to
be dissolved because the pH was lower.
Similarly to Kalousek, the samples did not undergo any visual changes throughout
the experiment. Over time, more of the precipitate would get stuck to the sides of the
bottle, however when it was filtered, the consistency was still the same. The equilibrium
of the solutions differed between these experiments. Kalousek's ratio of sodium to silica
was approximately 0.5 and was significantly lower than what was measured in this
experiment. The ratio of calcium to silica was between 1.0 and 1.5, which was also
lower than what was measured at the end of the experiment. The precipitate was
closest to Kaolusek's values at thirty days. After this time, the silica continued to
dissolve causing the ratios to increase. Kalousek did not have his samples being mixed
continuously as in this experiment. They were mixed initially and then once per day.
Therefore, the dissolution rate would have been slower and more silica would still be in
the precipitate. The two samples that formed reaction product similar to C-S-H, CNLSL
and CNLSM, displayed equilibrium compositions similar to those in Kalousek's
experiment. These solutions did not dissolve to the extent of the others and thus had
higher silica contents.
Macphee et al. studied systems similar to those in this experiment. Their range of
concentrations was larger and their time frame was longer. The calcium to silica ratios
at equilibrium for the samples in this experiment were between 0.6 and 9.0 with the
median value of 2.2, which were higher than those by Macphee et al. with an 0.8M
initial sodium hydroxide concentration. As seen in Figure 2.11, their samples reached
their equilibrium concentrations much faster than the ones in this experiment. It is
possible that those samples were mixed more rapidly, causing them to react faster.
Macphee et al. reported their calcium to silica ratios having a maximum at
approximately fifty days for their samples with 0.2M initial sodium hydroxide. The

M.A.Sc. Thesis - Sarah Young - McMaster University - Civil Engineering
91
samples with low sodium hydroxide in this experiment did not have this maximum. The
ratio of calcium to silica rose and reached a maximum at the end of the testing period.
The trends in Macphee et al.'s solutions matched the ones in this work. Figure 2.8
and Figure 2.9 demonstrate that as the sodium concentration increased, the calcium
concentration decreased and the silica concentration increased. This can be seen in the
plot of CNLSH, Figure 4.32, and CNMSM, Figure 4.36. The initial concentrations of silica
and calcium hydroxide are then same for these two mixes, but the initial sodium
hydroxide concentration was changed from 0.30M to 0.42M. The silicon ion
concentration in the solution was higher when there was a higher sodium concentration.
At six months, Macphee et al. experienced the calcium and silicon ion concentrations
lowering. This experimental program had a shorter testing period and thus it is
unknown if the solutions would eventually experience lowering concentrations in the
solution.
In this study, the silica dissolved faster than it reacted with the calcium and
sodium. Leeman et al. encountered the opposite effect. They found that the silica
concentration increased considerably once all of the calcium was consumed; indicating
that the rate determining step was the dissolution. It is possible that this difference was
caused by the ratio of solids to liquids in the experiments. Leeman et al. had a mass
ratio of 1:2 between the solids and the solution, this experiment was close 1:200.

M.A.Sc. Thesis - Sarah Young - McMaster University - Civil Engineering
92
6 Conclusions and Recommendations
6.1 Conclusions
6.1.1 Dissolution of Silica
There are several conclusions that can be drawn from studying the dissolution of
silica in the alkaline solutions.
1. The rate of dissolution is proportional to the pH level and the quantity of
sodium in the solution. These conclusions cannot be separated because
the two are coupled.
2. Adding calcium hydroxide to a solution causes the rate that silicon is
entering the solution to decrease. This was caused by the calcium ions
reacting with the silicate ions in the solution, which decreased the
concentration.
3. The dissolution of silica first has a stagnant period that lasted
approximately one week when there were calcium ions in the solution.
This period was shorter for solutions containing higher sodium ion
concentrations.
4. Silica powder dissolves at a faster rate in a sodium hydroxide solution than
the Hixson-Crowell cubic root law predicts. The alkali ions act as additional
catalysts for the dissolution process.
5. For most of the solutions studied, the dissolution rate is proportional to the
quantity of silica that was added to the solution. This is due to a higher
surface area of silica being attacked by the hydroxide and alkali ions.
6.1.2 Reaction of Silica with Calcium Hydroxide and Sodium Hydroxide
The following conclusions can be made concerning the reaction products that are
formed in the reaction between silica and calcium hydroxide and sodium hydroxide.
1. The rate of the reaction between calcium and silica is determined by the
rate of silica dissolution. This is observed in the concentration vs. time
plots when the calcium ions are exiting the solution faster than the silica is
entering the solution.
2. When the pH is sufficiently low and the concentration of silica is low,
reaction rims are able to form causing C-S-H products. The solutions that
produced C-S-H had a pH of 13.48, and initial silica concentrations of
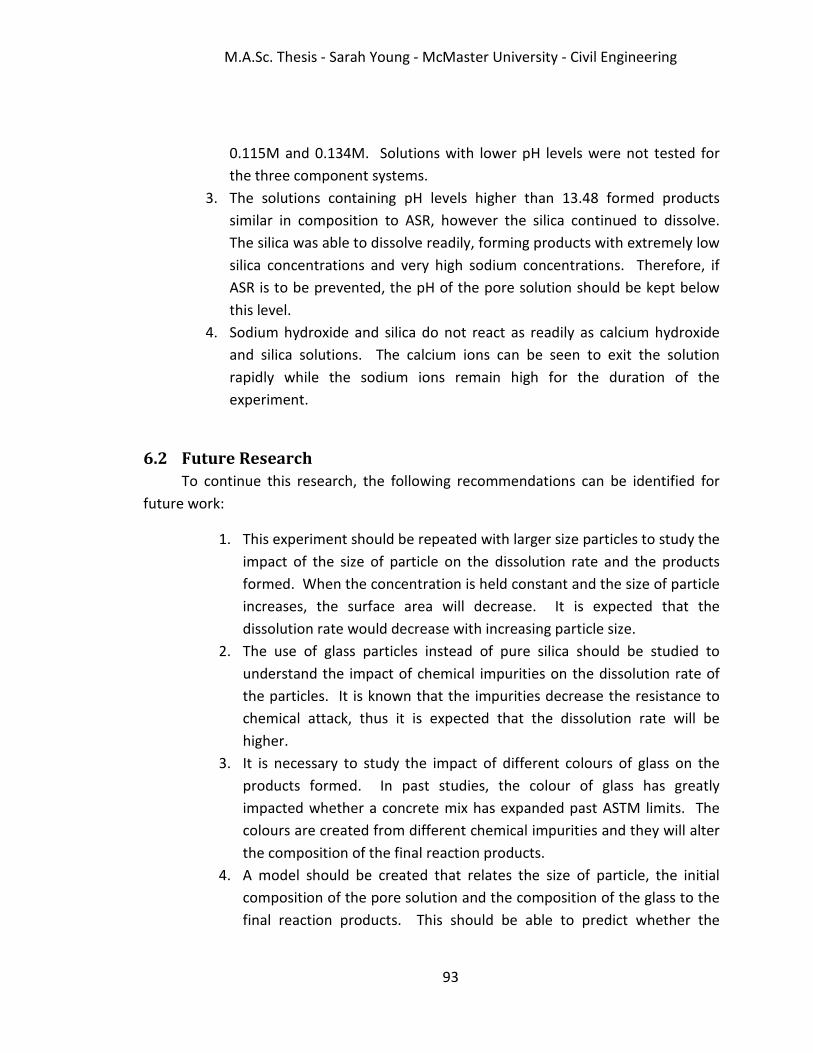
M.A.Sc. Thesis - Sarah Young - McMaster University - Civil Engineering
93
0.115M and 0.134M. Solutions with lower pH levels were not tested for
the three component systems.
3. The solutions containing pH levels higher than 13.48 formed products
similar in composition to ASR, however the silica continued to dissolve.
The silica was able to dissolve readily, forming products with extremely low
silica concentrations and very high sodium concentrations. Therefore, if
ASR is to be prevented, the pH of the pore solution should be kept below
this level.
4. Sodium hydroxide and silica do not react as readily as calcium hydroxide
and silica solutions. The calcium ions can be seen to exit the solution
rapidly while the sodium ions remain high for the duration of the
experiment.
6.2 Future Research
To continue this research, the following recommendations can be identified for
future work:
1. This experiment should be repeated with larger size particles to study the
impact of the size of particle on the dissolution rate and the products
formed. When the concentration is held constant and the size of particle
increases, the surface area will decrease. It is expected that the
dissolution rate would decrease with increasing particle size.
2. The use of glass particles instead of pure silica should be studied to
understand the impact of chemical impurities on the dissolution rate of
the particles. It is known that the impurities decrease the resistance to
chemical attack, thus it is expected that the dissolution rate will be
higher.
3. It is necessary to study the impact of different colours of glass on the
products formed. In past studies, the colour of glass has greatly
impacted whether a concrete mix has expanded past ASTM limits. The
colours are created from different chemical impurities and they will alter
the composition of the final reaction products.
4. A model should be created that relates the size of particle, the initial
composition of the pore solution and the composition of the glass to the
final reaction products. This should be able to predict whether the

M.A.Sc. Thesis - Sarah Young - McMaster University - Civil Engineering
94
ground recycled glass particles will form an ASR or C-S-H type product in
a specific concrete mix.
M.A.Sc. Thesis - Sarah Young - McMaster University - Civil Engineering
95
7 References
Alexander, G., Heston, W., & Iler, R. (1954). The Solubility of Amorphous Silica in Water.
The Journal of Physical Chemistry , 58 (6), 453-455.
Alfa Aesar. (2013). Silicon (IV) Oxide, 99.5%. Retrieved September 2013, from Alfa Aesar:
http://www.alfa.com/en/gp100w.pgm?dsstk=013024
Barret, P., Ménétrier, D., & Cottin, B. (1977). Study of silica-lime solution reactions.
Cement and Concrete Research , 7, 61-68.
Box, G. E., Hunter, J. S., & Hunter, W. G. (2005). Statistics for Experimenters; Design,
Innovation and Discovery (2nd ed.). John Wiley & Sons Inc.
Bray, C. (2001). Dictionary of Glass: Materials and Techniques (2nd ed.). London: A & C
Black.
Chatterji, S. (2005). Chemistry of alkali-silica reaction and testing of aggregates. Cement
& Concrete Composites , 27 (7-8), 788-795.
Chen, C., Habert, G., Bouzidi, Y., & Jullien, A. (2010). Environmental impact of cement
production: detail of the different processes and cement plant variability
evaluation. Journal of Cleaner Production , 18 (5), 478-485.
Chidiac, S. E., & Mihaljevic, S. N. (2011). Performance of dry cast concrete blocks
containing waste glass powder or polyethylene aggregates. Cement and Concrete
Composites , 33 (8), 855-863.
Cole-Parmer Canada Inc. (2012). pH Electrode Selection Guide. Retrieved June 2012,
from Cole Parmer: http://www.coleparmer.ca/TechLibraryArticle/684
Cole-Parmer Canada Inc. (2012). Thermo Scientific Orion Star A211 pH Benchtop Meter
Only. Retrieved June 2012, from Cole-Parmer:
http://www.coleparmer.com/Product/Thermo_Scientific_Orion_Star_A211_pH_B
enchtop_Meter_Only/EW-58825-22
De Jong, B. H., Beerkens, R. G., van Nijnatten, P. A., & Le Bourhis, E. (2011). Glass, 1.
Fundamentals. In Ullmann's Encyclopedia of Industrial Chemistry.
Dhir, R. K., Dyer, T. D., & Tang, M. C. (2009). Alkali-silica reaction in concrete containing
glass. Materials and Structures , 2009, 1451-1462.

M.A.Sc. Thesis - Sarah Young - McMaster University - Civil Engineering
96
Diamond, S. (1975). Long-Term Status of Calcium Hydroxide Saturation of Pore Solutions
in Hardened Cements. Cement and Concrete Research , 5, 607-616.
Dove, P. M., & Rimstidt, J. D. (1994). Silica-Water Interactions. In P. J. Heaney, C. T.
Prewitt, & G. V. Gibbs (Eds.), Silica: Physical Behaviour, Geochemistry and
Materials Applications (Vol. 29, pp. 259-308). Washington, D.C.: Mineralogical
Society of America.
Dron, R., & Brivot, F. (1993). Thermodynamic and Kinetic Approach to the Alkali-Silica
Reaction. Part 2: Experiment. Cement and Concrete Research , 23, 93-103.
EDM Millipore. (2013). Calcium hydroxide. Retrieved September 2013, from EDM
Millipore: http://www.emdmillipore.com/is-bin/INTERSHOP.enfinity/WFS/Merck-
CA-Site/en_CA/-/USD/ViewPDF-
Print.pdf?RenderPageType=ProductDetail&CatalogCategoryID=&ProductUUID=J0C
sHfETFiMAAAE2JilwtCIm&PortalCatalogUUID=KvSb.s1Ob48AAAEgr9B6cjOt
EDM Millipore. (2013). Sodium hydroxide solution. Retrieved September 2013, from
EDM Millipore: http://www.emdmillipore.com/is-
bin/INTERSHOP.enfinity/WFS/Merck-CA-Site/en_CA/-/USD/ViewPDF-
Print.pdf;sid=qDiZk-eYl3-
ek7Xf6Dn0xE9YL7uLY40_kBaHxVQ1ikwn8GkWhNj6OeGmv2MULszhKEuJj-
RBVQCwlG5RCrwseEjSicyA1ytIm6Ihsl-B4wYVmY0_kBYhsl-
B?RenderPageType=ProductDetail
El-Shimy, E., Abo-El-Enein, S. A., El-Didamony, H., & Osman, T. A. (2000). Physico-
Chemical and Thermal Characteristics of Lime-Silica Fume Pastes. Journal of
Thermal Analysis and Calorimetry , 60, 549-556.
Federico, L. M., & Chidiac, S. E. (2009). Waste glass as a supplementary cementitious
material in concrete – Critical review of treatment methods. Cement and Concrete
Composites , 31 (8), 606-610.
Federico, L. M., Chidiac, S. E., & Raki, L. (2011). Reactivity of cement mixtures containing
waste glass using thermal analysis. Journal of Thermal Analysis and Calorimetry ,
104 (3), 849-858.
Fertani-Gmati, M., & Jemal, M. (2011). Thermochemistry and kinetics of silica dissolution
in NaOH aqueous solution. Thermochemica Acta , 513, 43-48.

M.A.Sc. Thesis - Sarah Young - McMaster University - Civil Engineering
97
Greenberg, S. (1961). Reaction Between Silica and Calcium Hydroxide Solutions: I.
Kinetics in the Temperature Range 30 to 85°. The Journal of Physical Chemistry , 65
(1), 12-16.
Greenberg, S. (1957). The Depolymerization of Silica in Sodium Hydroxide Solutions. The
Journal of Physical Chemistry , 61 (7), 960-965.
Greenberg, S., & Copeland, L. (1960). The Thermodynamic Functions for the Soltuion of
Calcium Hydroxide in Water. The Journal of Physical Chemistry , 64 (8), 1057-1059.
Hixson, A. W., & Crowell, J. H. (1931). Dependence of Reaction Velocity upon Surface
and Agitation. Industrial & Engineering Chemistry , 23 (8), 923-931.
Ichikawa, T. (2009). Alkali-silica reaction, pessimum effects and pozzolanic effect.
Cement and Concrete Research , 39, 716-726.
Ichikawa, T., & Miura, M. (2007). Modified model of alkali-silica reaction. Cement and
Concrete Research , 37, 1291-1297.
Idir, R., Cyr, M., & Tagnit-Hamou, A. (2011). Pozzolanic properties of fine and coarse
color-mixed glass cullet. Cement & Concrete Composites , 33 (1), 19-29.
Idir, R., Cyr, M., & Tagnit-Hamou, A. (2010). Use of fine glass as ASR inhibitor in glass
aggregate mortars. Construction and Building Materials , 24, 1309-1312.
Iler, R. K. (1979). The Chemistry of Silica. Toronto: John Wiley & Sons.
International Energy Agency. (2006). Energy Technology Perspectives 2006.
Ismail, Z. Z., & Al-Hashmi, E. A. (2009). Recycling of waste glass as a partial replacement
for fine aggregate in concrete. Waste Management , 29, 655-659.
Jain, J., & Neithalath, N. (2009). Physico-chemical changes in nano-silica and silica fume
modified cement pastes in response to leaching. International Journal of Materials
and Structural Integrity , 114-133.
Kalousek, G. L. (1944). Studies of Portions of the Quaternary System Soda-Lime-Silica-
Water at 25°C. Journal of Research of the National Bureau of Standards , 32, 285-
302.

M.A.Sc. Thesis - Sarah Young - McMaster University - Civil Engineering
98
Kawamura, M., & Fuwa, H. (2003). Effects of lithium salts on ASR gel composition and
expansion of mortars. Cement and Concrete Research , 33 (6), 913-919.
Kim, J. J., Foley, E. M., & Reda Taha, M. M. (2013). Nano-mechanical characterization of
synthetic calcium-silicate-hydrate (C-S-H). Cement & Concrete Composites , 36, 65-
70.
Kouassi, S. S., Andji, J., Bonnet, J.-P., & Rossignol, S. (2010). Dissolution of waste glass in
highly alkaline solutions. Ceramics-Silikáty , 54 (3), 235-240.
Leemann, A., Le Saout, G., Winnefeld, F., Rentsch, D., & Lothenbach, B. (2011). Alkali-
Silica Reaction: the Influence of Calcium on Silica Dissolution and the Formation of
Reaction Products. Journal of the American Ceramic Society , 94 (4), 1243-1249.
Macphee, D. E., Luke, K., Glasser, F. P., & Lachowski, E. E. (1989). Solubility and Aging of
Calcium Silicate Hydrates in Alkaline Solutions at 25°C. Journal of the American
Ceramic Society , 72 (4), 646-654.
Maraghechi, H., Shafaatian, S.-M.-H., Fischer, G., & Rajabipour, F. (2012). The role of
residual cracks on alkali-silica reactivity of recycled glass aggregates. Cement &
Concrete Composites , 34 (1), 41-47.
Mehta, P. K., & Monteiro, P. J. (2006). Concrete: Microstructure, Properties, and
Materials (3rd ed.). New York: McGraw-Hill.
Niibori, Y., Kunita, M., Tochiyama, O., & Chida, T. (2000). Dissolution rates of amorphous
silica in highly alkaline solution. Journal of Nuclear Science and Technology , 37 (4),
349-357.
O'Connor, T. L., & Greenberg, S. A. (1958). The Kinetics for the Solution of Silica in
Aqueous Solutions. The Journal of Physical Chemistry , 62 (10), 1195-1198.
Park, S. B., Lee, B. C., & Kim, J. H. (2004). Studies on mechanical properties of concrete
containing waste glass aggregate. Cement and Concrete Research , 34, 2181-2189.
Park, S.-B., & Lee, B.-C. (2004). Studies on expansion properties in mortar containing
waste glass and fibres. Cement and Concrete Research , 34, 1145-1152.
Paul, A. (1982). Chemistry of Glasses. New York: Chapman and Hall.

M.A.Sc. Thesis - Sarah Young - McMaster University - Civil Engineering
99
Rajabipour, F., Maraghechi, H., & Fisher, G. (2010). Investigating the Alkali-Silica
Reaction of Recycled Glass Aggregates in Concrete Materials. Journal of Materials
in Civil Engineering , 22 (12), 1201-1208.
Romeo, L. M., Catalina, D., Lisbona, P., Lara, Y., & Martínez, A. (2011). Reduction of
greenhouse gas emissions by integration of cement plants, power plants, and CO2
capture systems. Greenhouse gases: science and technology , 1 (1), 72-82.
Schwarz, N., & Neithalath, N. (2008). Influence of a fine glass powder on cement
hydration: Comparison to fly ash and modeling the degree of hydration. Cement
and Concrete Research , 38, 429-436.
Shao, Y., Lefort, T., Moras, S., & Rodriguez, D. (2000). Studies on concrete containing
ground waste glass. Cement and Concrete Research , 30, 91-100.
Shaw, W. M., & MacIntire, W. H. (1930). The Nature of Calcium Hydroxide Absorption by
Hydrated Silica. Soil Science , 29 (6), 429-456.
Shi, C., Wu, Y., Riefler, C., & Wang, H. (2005). Characteristics and pozzolanic reactivity of
glass powders. Cement and Concrete Research , 35, 987-993.
Sjöberg, S. (1996). Silica in aqueous environments. Journal of Non-Crystalline Solids ,
196, 51-57.
Stanton, T. E. (1940). Expansion of Concrete Through Reaction Between Cement and
Aggregate. Proceedings of the ASCE , 66 (10), 1781-1811.
TA Instruments. (2013). Advantage Software. Retrieved August 27, 2013, from TA
Instruments: http://www.tainstruments.com/main.aspx?id=292&n=2&siteid=11
TA Instruments. (2013). Q600. Retrieved August 27, 2013, from TA Instruments:
http://www.tainstruments.com/product.aspx?id=22&n=1&siteid=11
Thaulow, N., Hjorth Jakobsen, U., & Clark, B. (1996). Composition of Alkali Silica Gel and
Ettringite in Concrete Railroad Ties: SEM-EDX and X-Ray Diffraction Analysis.
Cement and Concrete Research , 26 (2), 309-318.
Thornton, S. D., & Radke, C. J. (1988). Dissolution and Condensation Kinetics of Silica in
Alkaline Solution. SPE Reservoir Engineering , 3 (2), 743-752.
M.A.Sc. Thesis - Sarah Young - McMaster University - Civil Engineering
100
Varian. (2013). ICP-OES. Retrieved August 27, 2013, from Varian Vista-MPX CCD
Simultaneous ICP-OES: http://www.colloidalsciencelab.com/fact_pages/Varian-
MPX.pdf
Way, S., & Shayan, A. (1992). Study of Some Synthetically Prepared Hydrous Alkali
Calcium Silicates. Cement and Concrete Research , 22, 915-926.
Wirth, G. S., & Gieskes, J. M. (1978). The Initial Kinetics of the Dissolution of Vitreous
Silica in Aqueous Media. Journal of Colloid and Interface Science , 68 (3), 492-500.
World Business Council for Sustainable Development. (2002). Toward a Sustainable
Cement Industry.
Wright, M. R. (2007). An Introduction to Aqueous Electrolyte Solutions. Chichester,
England: John Wiley & Sons Ltd.
Zhang, Q., & Ye, G. (2012). Dehydration kinetics of Portland cement paste at high
temperature. Journal of Thermal Analysis and Calorimetry , 110, 153-158.