Embed Size (px)
Citation preview
WIND ENERGY
Wind Energ. (2011)
Published online in Wiley Online Library (wileyonlinelibrary.com). DOI: 10.1002/we.489
RESEARCH ARTICLE
Simulating climate change and its effects on the windenergy resource of IrelandPaul Nolan1, Peter Lynch1, Ray McGrath2, Tido Semmler2 and Shiyu Wang2
1University College Dublin2Met Éireann, Dublin
ABSTRACT
We consider the impact of climate change on the wind energy resource of Ireland using an ensemble of Regional ClimateModel (RCM) simulations. The RCM dynamically downscales the coarse information provided by the Global ClimateModels (GCMs) and provides high resolution information, on a subdomain covering Ireland. The RCM used in this workis the Rossby Center’s RCM (RCA3).
The RCA3 model is evaluated by performing simulations of the past Irish climate, driven by European Center forMedium-Range Weather Forecasts ERA-40 data, and by comparing the output to observations. Results confirm that theoutput of the RCA3 model exhibits reasonable and realistic features as documented in the historical wind data record. Forthe investigation of the influence of the future climate under different climate scenarios, the Max Plank Institute’s GCM,European Center Hamburg Model, is used to drive the RCA3 model. Simulations are run for a control period 1961-2000and future period 2021-2060. The future climate was simulated using the four Intergovernmental Panel on Climate Changeemission scenarios A1B, A2, B1 and B2. The results for the downscaled simulations show a substantial overall increasein the energy content of the wind for the future winter months and a decrease during the summer months. The projectedchanges for summer and winter were found to be statistically significant over most of Ireland. However, the projectedchanges should be viewed with caution since the climate change signal is of similar magnitude to the variability of theevaluation and control simulations. Copyright © 2011 John Wiley & Sons, Ltd.
KEYWORDS
climate change; wind energy; Ireland; regional climate model
Correspondence
Paul Nolan, University College Dublin.E-mail: [email protected]
Received 7 October 2009; Revised 28 April 2011; Accepted 6 May 2011
1. INTRODUCTION
Greenhouse gas emissions are having a significant effect on the Earth’s climate. Globally, an increasing rate of warminghas taken place over the last 25 years, and 11 of the 12 warmest years on record occurred in the 1990s and 2000s.1 Temper-atures in Ireland have mirrored this global trend.2,3 Climate models predict that global temperatures could rise by a further1–5ıC over the next 100 years, depending on the amounts of greenhouse gases (GHGs) emitted and the sensitivity of theclimate system. The analysis presented in this paper was undertaken to investigate whether there is evidence that increasingtemperatures will lead to changes in the wind climatology of Ireland.
There is considerable interest in renewable energy resources as a means of reducing carbon dioxide emissions to min-imize climate change. From a climate perspective, Ireland is ideally located to exploit the natural energy associated withthe wind; mean annual speeds are typically in the range of 6–8 m s�1 at 50 m level over land, values that are sufficient tosustain commercial enterprises with current wind turbine technology.
The wind energy potential of the Irish climate has been well documented.4–6 However, climate change may alter thewind patterns in the future; a reduction in speeds may reduce the commercial returns or pose problems for the continuityof supply; an increase in the frequency of severe winds (e.g., gale/storm gusts) may similarly impact on supply continuity.Conversely, an increase in the mean wind speed may have a positive effect on the available power supply.
Copyright © 2011 John Wiley & Sons, Ltd.
Climate change and its effects on wind energy in Ireland P. Nolan et al.
The impact of GHGs on climate change can be simulated using Global Climate Models (GCMs). However, longclimate simulations using coupled atmosphere-ocean general circulation models are currently feasible only with horizontalresolutions of 50 km or greater. Since the wind energy resource of Ireland exhibits a high degree of spatial heterogeneity,this is inadequate for the simulation of the detail and the pattern of climate change and its effects on the wind resourceof Ireland. The Regional Climate Model (RCM) method dynamically downscales the coarse information provided by theglobal models and provides high resolution information on a subdomain covering Ireland. The computational cost of run-ning the RCM, for a given resolution, is considerably less than a global model. The method of using an RCM to assess theimpact of climate change on the wind energy resource has been used before in such studies as Pryor et al.7 Although thepresent study primarily focuses on the Irish climate, the simulation domain includes the UK. Moreover, the methodologyemployed in the study is general and may be applied to other geographical regions.
To date, the amount of research on climate change on the wind energy resource of Ireland has been small. Notableinternational research includes Harrison et al.8 for the UK, Pryor et al.7 and Pryor and Barthelmie9 for the Nordic andBaltic regions as well as Breslow and Sailor10 and Sailor et al.11 for the USA. The results for the UK indicate seasonalchanges in potential wind production with winter production generally increasing whereas summer production decreasing.For Northern Europe, there is evidence for increased wind energy density7 in the projected climate change simulationsparticularly during the wintertime, whereas Pryor and Barthelmie9 suggests no detectable change in the wind resource orother external conditions that could jeopardize the continued exploitation of wind energy. The results for the USA show anexpected overall slight decrease in wind speeds over the next 100 years.
2. OBJECTIVES
The main objective of the research is to evaluate future wind energy resources by simulating the wind climatology ofIreland at high resolution using the method of Regional Climate Modeling.
� To achieve this, we first evaluate the ability of the RCM to accurately simulate the wind climatology. The RCM isevaluated by performing simulations of the past Irish climate and comparing the output with observational data.
� We then simulate the future wind climate for different GHG emission scenarios and determine if (i) future climateprojections of the RCM show substantial changes when compared with the past and (ii) whether the changes aresignificant.
In the concluding section of this paper, we will discuss our results with reference to these objectives.
3. MODELS
3.1. The Rossby Center regional atmospheric model
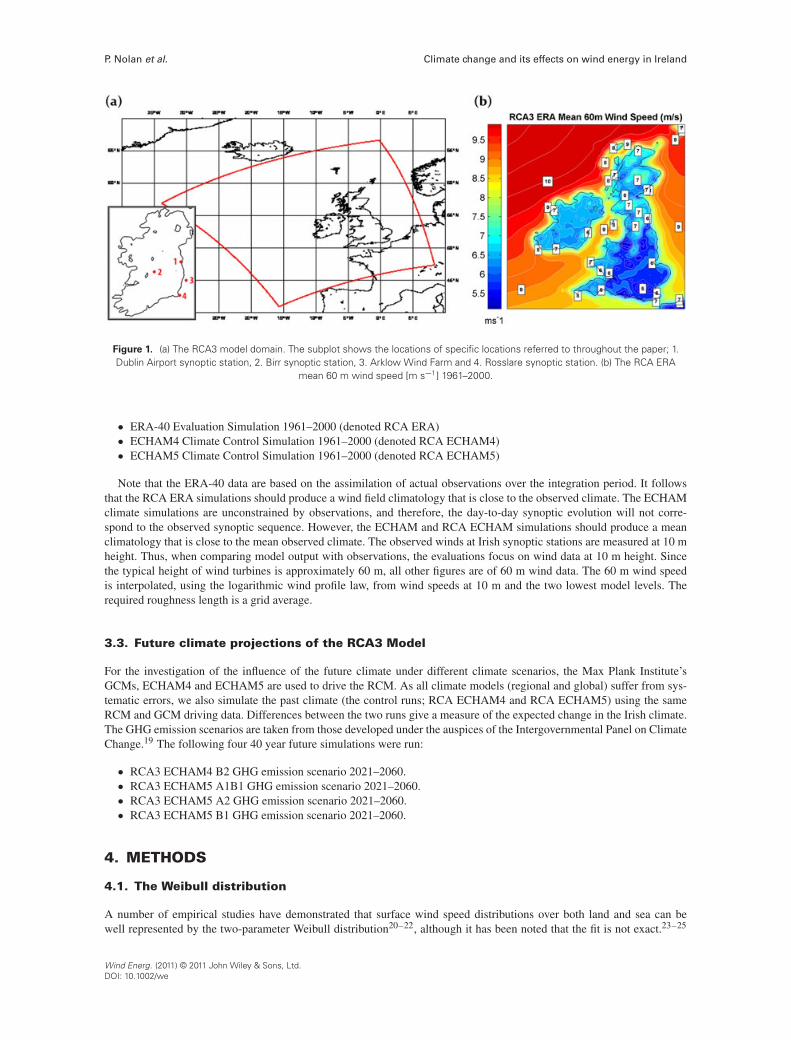
The Rossby Center regional atmospheric climate model version 3 (RCA3)12,13 has been developed from the High Res-olution Limited Area Model (HIRLAM; see www.hirlam.org). Compared with the numerical weather prediction modelHIRLAM, several changes have been made to the radiation scheme, the turbulence scheme and the cloud parameterization.A new land surface scheme has been developed and implemented in RCA3, which is described in detail in Samuelssonet al.14 Within a model grid cell, several tiles with different surface properties such as type of vegetation, roughness lengthand albedo are considered. For all tiles, water and energy balances are calculated separately, and a weighted average overthe grid cell is computed. The land surface scheme also includes soil moisture and runoff parameterizations. Diagnosticvariables of temperature and humidity at 2 m and wind at 10 m are calculated using Monin–Obukhov similarity theory asdescribed in Samuelsson et al.14 The RCM model domain used in this study has been set up with a 0:12ı (13 km) spherical,rotated latitude/longitude grid. The model domain has 156 � 166 grid points, and in the vertical, there are 40 unequallyspaced levels. The wind fields are output at 3 h intervals. For considering the effect of the North Atlantic Ocean, the modeldomain includes large parts of the ocean north, west and south of Ireland. There is a large scale jump between the GCMand RCM spatial resolution. However, this model setup has been evaluated extensively, and the results suggest that themodel configuration is well able to capture the characteristics of present day climate.2,3,15 The model domain is presentedin Figure 1(a).
3.2. Evaluation of the RCA3 RCM
The RCA3 model was evaluated by performing 40 year simulations of the past Irish climate (1961–2000) and compar-ing the output with observations. The European Center for Medium-Range Weather Forecasts’ ERA-40 global re-analysisdata16 and the Max Planck Institute’s European Center Hamburg Model 4 (ECHAM4)17 and ECHAM518 data were usedto drive the RCA3 model. The following three simulations were run:
Wind Energ. (2011) © 2011 John Wiley & Sons, Ltd.DOI: 10.1002/we
P. Nolan et al. Climate change and its effects on wind energy in Ireland
Figure 1. (a) The RCA3 model domain. The subplot shows the locations of specific locations referred to throughout the paper; 1.Dublin Airport synoptic station, 2. Birr synoptic station, 3. Arklow Wind Farm and 4. Rosslare synoptic station. (b) The RCA ERA
mean 60 m wind speed [m s�1] 1961–2000.
� ERA-40 Evaluation Simulation 1961–2000 (denoted RCA ERA)� ECHAM4 Climate Control Simulation 1961–2000 (denoted RCA ECHAM4)� ECHAM5 Climate Control Simulation 1961–2000 (denoted RCA ECHAM5)
Note that the ERA-40 data are based on the assimilation of actual observations over the integration period. It followsthat the RCA ERA simulations should produce a wind field climatology that is close to the observed climate. The ECHAMclimate simulations are unconstrained by observations, and therefore, the day-to-day synoptic evolution will not corre-spond to the observed synoptic sequence. However, the ECHAM and RCA ECHAM simulations should produce a meanclimatology that is close to the mean observed climate. The observed winds at Irish synoptic stations are measured at 10 mheight. Thus, when comparing model output with observations, the evaluations focus on wind data at 10 m height. Sincethe typical height of wind turbines is approximately 60 m, all other figures are of 60 m wind data. The 60 m wind speedis interpolated, using the logarithmic wind profile law, from wind speeds at 10 m and the two lowest model levels. Therequired roughness length is a grid average.
3.3. Future climate projections of the RCA3 Model
For the investigation of the influence of the future climate under different climate scenarios, the Max Plank Institute’sGCMs, ECHAM4 and ECHAM5 are used to drive the RCM. As all climate models (regional and global) suffer from sys-tematic errors, we also simulate the past climate (the control runs; RCA ECHAM4 and RCA ECHAM5) using the sameRCM and GCM driving data. Differences between the two runs give a measure of the expected change in the Irish climate.The GHG emission scenarios are taken from those developed under the auspices of the Intergovernmental Panel on ClimateChange.19 The following four 40 year future simulations were run:
� RCA3 ECHAM4 B2 GHG emission scenario 2021–2060.� RCA3 ECHAM5 A1B1 GHG emission scenario 2021–2060.� RCA3 ECHAM5 A2 GHG emission scenario 2021–2060.� RCA3 ECHAM5 B1 GHG emission scenario 2021–2060.
4. METHODS
4.1. The Weibull distribution
A number of empirical studies have demonstrated that surface wind speed distributions over both land and sea can bewell represented by the two-parameter Weibull distribution20–22, although it has been noted that the fit is not exact.23–25
Wind Energ. (2011) © 2011 John Wiley & Sons, Ltd.DOI: 10.1002/we
Climate change and its effects on wind energy in Ireland P. Nolan et al.
For each RCM simulation, a Weibull distribution was fitted to the wind speed time series at each grid point on the modeldomain. The method of Maximum Likelihood Estimates, as recommended for wind speed time series,20,26 was employedto calculate the Weibull parameters.
The Weibull probability density function (pdf) is given by
W .x/ D ˛ˇ�˛x˛�1e��xˇ
�˛for x 2 Œ0;1/; ˛; ˇ > 0 (1)
where ˛ is the shape parameter, ˇ is the scale parameter and x is the wind speed.The mean value is
�DE.X/D ˇ��1C ˛�1
�(2)
where � is the gamma function, �.˛/DR10 z˛�1e�zdz.
Other statistical quantities are given in terms of the parameters.22
4.2. The mean winds
The mean wind speed and the mean cubed wind speed were calculated at each grid point per month, per season and perhour (the diurnal cycle). The mean absolute difference metric (MAD) and the root mean square difference metric (RMSD)were used to compare the RCA ECHAM simulations with the RCA ERA simulation. The ‘projected percentage change’metric is used to give a measure of expected climate change by comparing the future climate projections with the controlsimulation. It is defined as follows:
Di D 100�
NFi � NPiNPi
!(3)
where i is the grid point, NPi and NFi are the wind data for the past and future model runs, respectively.
4.3. Statistical analysis
A key purpose for this study is to establish the significance level of any changes of the wind speed in the future projections.Considering that wind speeds are generally not normally distributed, the Wilcoxon rank sum test and the Kolmogorov–Smirnov test27,28 were applied to the future and past wind speed time series. The null hypothesis states that the past andfuture winds are from the same continuous distribution. The alternative hypothesis is that they are from different contin-uous distributions. Small values of the confidence level p cast doubt on the validity of the null hypothesis. If p < ', forsmall ', this indicates that the null hypothesis is rejected, the alternative hypothesis is accepted and the difference betweenthe future and past wind speeds is statistically significant at the .100 � '/% confidence level. The significance tests wereapplied at each grid point per annum and per season. Since the Wilcoxon rank sum test and the Kolmogorov–Smirnov testgave similar results at the 5% level of significance, only the latter will be presented. It should be noted that whereas theWilcoxon rank sum test is sensitive to changes in the location of distributions, the Kolmogorov–Smirnov test is sensitive toboth changes in location and shape of distributions. Since wind turbines usually work within a certain range of wind speeds(cut-in and cut-out speeds), it is important to investigate the significance of changes in the shape, as well as location (meanand median) of the past and future wind speed distributions.
Three different alternative hypotheses are chosen, depending on the future wind speed projections presented in Figures 6,7 and 8. The alternative hypotheses are as follows:
� Ha0: Fc ¤ Pc. The future and past wind speed cumulative distribution functions (cdfs) are not equal.� Ha1: Fc > Pc. The future cdf is greater than the past cdf, implying a decrease in the future wind speed.� Ha2: Fc < Pc. The future cdf is less than the past cdf, implying an increase in the future wind speed.
Wind Energ. (2011) © 2011 John Wiley & Sons, Ltd.DOI: 10.1002/we
P. Nolan et al. Climate change and its effects on wind energy in Ireland
4.4. Comparison of RCA3 output with observations
When comparing the model output with observed station data, the model data were bilinearly interpolated onto the latitude–longitude station location. Figure 1(a) shows the locations of the synoptic stations referred to throughout this paper. DublinAirport is located 8.5 km north of Dublin City center. The Irish Sea is approximately 10 km away, between 40 and 150ı.The Wicklow mountains lie between 155 and 225ı, starting about 18 km south of the airport and extending a further 60 kmto the south. The anemometer is well exposed except in the south–southwest direction. Birr station is located in the low-lying plains of the midlands, approximately 1.5 km east–southeast of Birr Town. The anemometer is well exposed in alldirections. Rosslare Station is situated on the southeast coast of Ireland within 500 m of the coastline. The observed winddata for Rosslare station was limited to the 36 year period 1961–1996. The anemometer is well exposed in all directions.
5. RESULTS
5.1. Evaluation of the RCA3 models
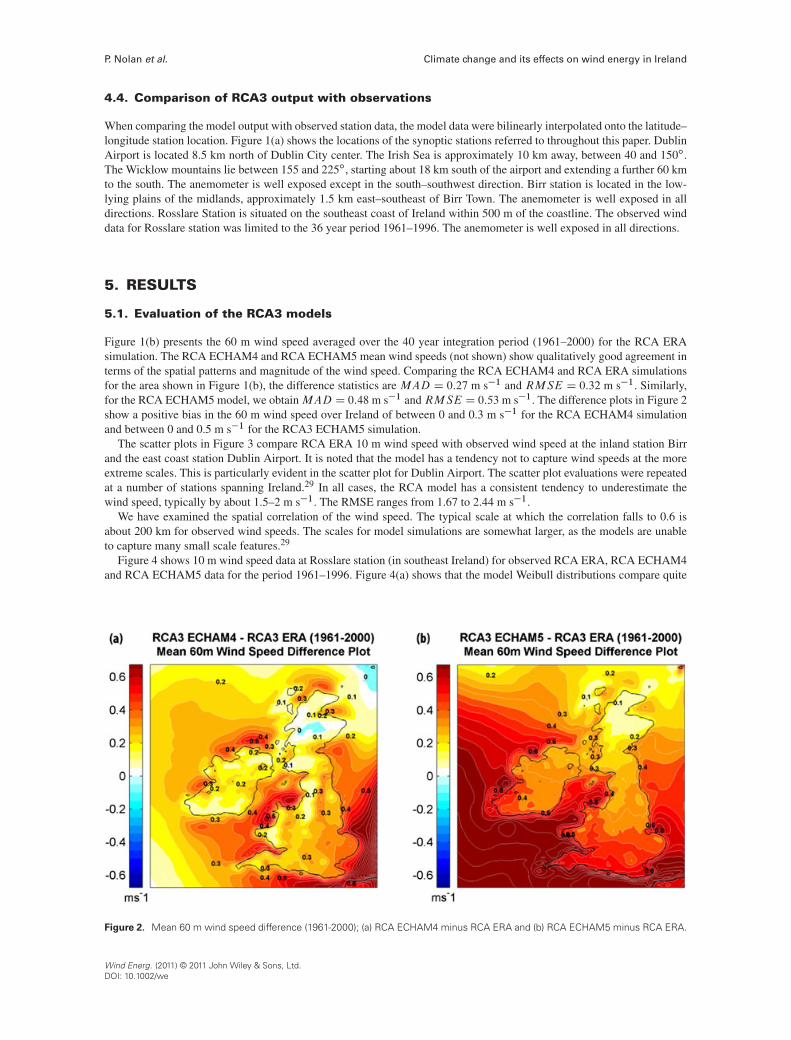
Figure 1(b) presents the 60 m wind speed averaged over the 40 year integration period (1961–2000) for the RCA ERAsimulation. The RCA ECHAM4 and RCA ECHAM5 mean wind speeds (not shown) show qualitatively good agreement interms of the spatial patterns and magnitude of the wind speed. Comparing the RCA ECHAM4 and RCA ERA simulationsfor the area shown in Figure 1(b), the difference statistics are MAD D 0:27 m s�1 and RMSE D 0:32 m s�1. Similarly,for the RCA ECHAM5 model, we obtainMAD D 0:48m s�1 andRMSE D 0:53m s�1. The difference plots in Figure 2show a positive bias in the 60 m wind speed over Ireland of between 0 and 0.3 m s�1 for the RCA ECHAM4 simulationand between 0 and 0.5 m s�1 for the RCA3 ECHAM5 simulation.
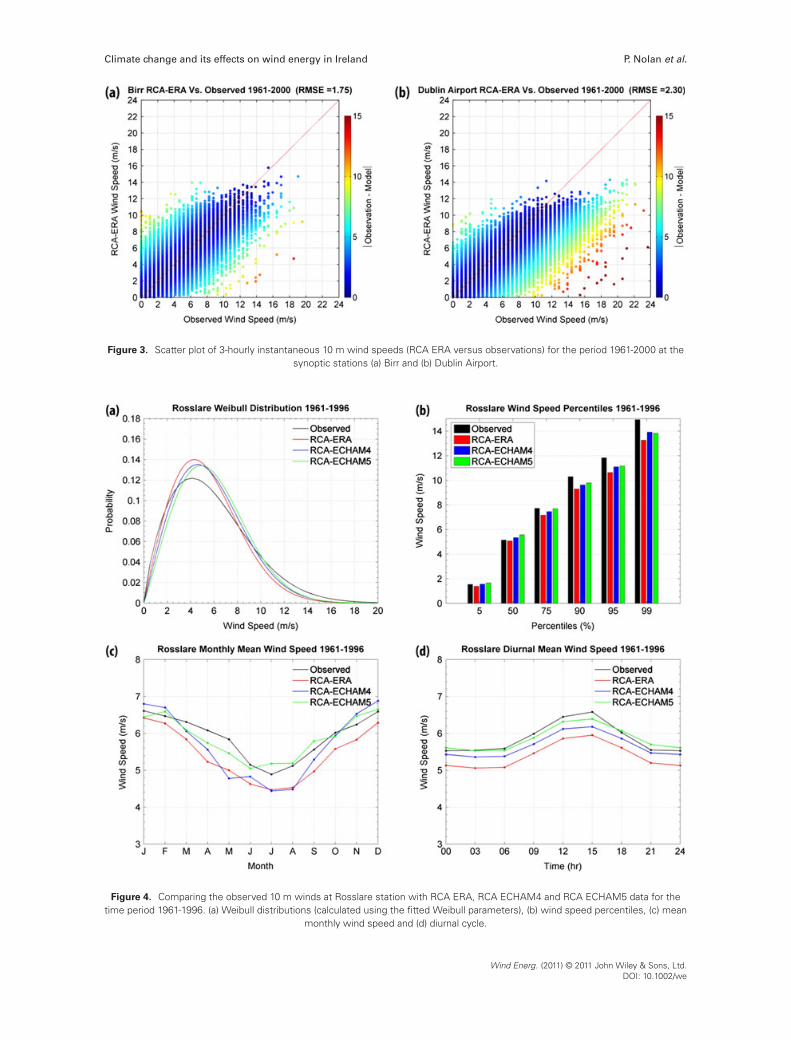
The scatter plots in Figure 3 compare RCA ERA 10 m wind speed with observed wind speed at the inland station Birrand the east coast station Dublin Airport. It is noted that the model has a tendency not to capture wind speeds at the moreextreme scales. This is particularly evident in the scatter plot for Dublin Airport. The scatter plot evaluations were repeatedat a number of stations spanning Ireland.29 In all cases, the RCA model has a consistent tendency to underestimate thewind speed, typically by about 1.5–2 m s�1. The RMSE ranges from 1.67 to 2.44 m s�1.
We have examined the spatial correlation of the wind speed. The typical scale at which the correlation falls to 0.6 isabout 200 km for observed wind speeds. The scales for model simulations are somewhat larger, as the models are unableto capture many small scale features.29
Figure 4 shows 10 m wind speed data at Rosslare station (in southeast Ireland) for observed RCA ERA, RCA ECHAM4and RCA ECHAM5 data for the period 1961–1996. Figure 4(a) shows that the model Weibull distributions compare quite
Figure 2. Mean 60 m wind speed difference (1961-2000); (a) RCA ECHAM4 minus RCA ERA and (b) RCA ECHAM5 minus RCA ERA.
Wind Energ. (2011) © 2011 John Wiley & Sons, Ltd.DOI: 10.1002/we
Climate change and its effects on wind energy in Ireland P. Nolan et al.
Figure 3. Scatter plot of 3-hourly instantaneous 10 m wind speeds (RCA ERA versus observations) for the period 1961-2000 at thesynoptic stations (a) Birr and (b) Dublin Airport.
Figure 4. Comparing the observed 10 m winds at Rosslare station with RCA ERA, RCA ECHAM4 and RCA ECHAM5 data for thetime period 1961-1996. (a) Weibull distributions (calculated using the fitted Weibull parameters), (b) wind speed percentiles, (c) mean
monthly wind speed and (d) diurnal cycle.
Wind Energ. (2011) © 2011 John Wiley & Sons, Ltd.DOI: 10.1002/we
P. Nolan et al. Climate change and its effects on wind energy in Ireland
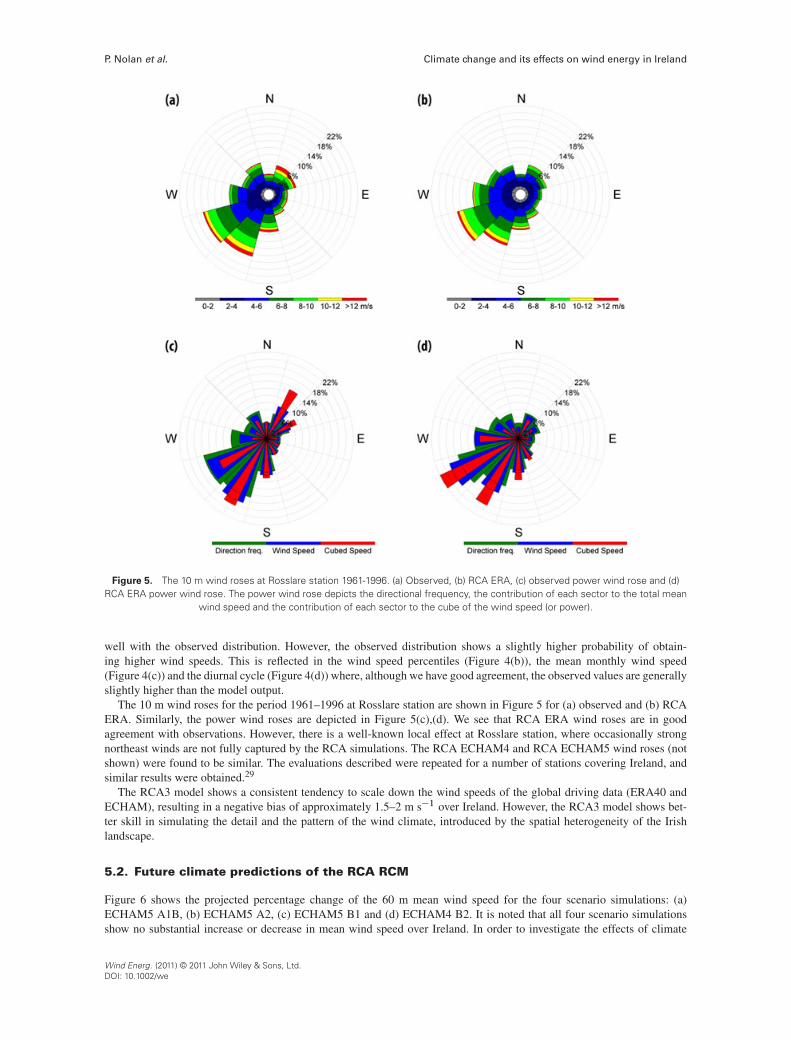
Figure 5. The 10 m wind roses at Rosslare station 1961-1996. (a) Observed, (b) RCA ERA, (c) observed power wind rose and (d)RCA ERA power wind rose. The power wind rose depicts the directional frequency, the contribution of each sector to the total mean
wind speed and the contribution of each sector to the cube of the wind speed (or power).
well with the observed distribution. However, the observed distribution shows a slightly higher probability of obtain-ing higher wind speeds. This is reflected in the wind speed percentiles (Figure 4(b)), the mean monthly wind speed(Figure 4(c)) and the diurnal cycle (Figure 4(d)) where, although we have good agreement, the observed values are generallyslightly higher than the model output.
The 10 m wind roses for the period 1961–1996 at Rosslare station are shown in Figure 5 for (a) observed and (b) RCAERA. Similarly, the power wind roses are depicted in Figure 5(c),(d). We see that RCA ERA wind roses are in goodagreement with observations. However, there is a well-known local effect at Rosslare station, where occasionally strongnortheast winds are not fully captured by the RCA simulations. The RCA ECHAM4 and RCA ECHAM5 wind roses (notshown) were found to be similar. The evaluations described were repeated for a number of stations covering Ireland, andsimilar results were obtained.29
The RCA3 model shows a consistent tendency to scale down the wind speeds of the global driving data (ERA40 andECHAM), resulting in a negative bias of approximately 1.5–2 m s�1 over Ireland. However, the RCA3 model shows bet-ter skill in simulating the detail and the pattern of the wind climate, introduced by the spatial heterogeneity of the Irishlandscape.
5.2. Future climate predictions of the RCA RCM
Figure 6 shows the projected percentage change of the 60 m mean wind speed for the four scenario simulations: (a)ECHAM5 A1B, (b) ECHAM5 A2, (c) ECHAM5 B1 and (d) ECHAM4 B2. It is noted that all four scenario simulationsshow no substantial increase or decrease in mean wind speed over Ireland. In order to investigate the effects of climate
Wind Energ. (2011) © 2011 John Wiley & Sons, Ltd.DOI: 10.1002/we

Climate change and its effects on wind energy in Ireland P. Nolan et al.
Figure 6. The predicted percentage change of the annual 60 m mean wind speed for the four climate scenario simulations: (a) RCAECHAM5 A1B, (b) RCA ECHAM5 A2, (c) RCA ECHAM5 B1 and (d) RCA ECHAM4 B2. In each case, the future period 2021-2060 is
compared with the control period 1961-2000.
change on the energy content of the wind, the projected change in the 60 m mean cubed wind speed were calculated.Again, small changes (�2 to 2%) were observed in the energy content of the wind for the four GHG scenario simulations(figure not presented).
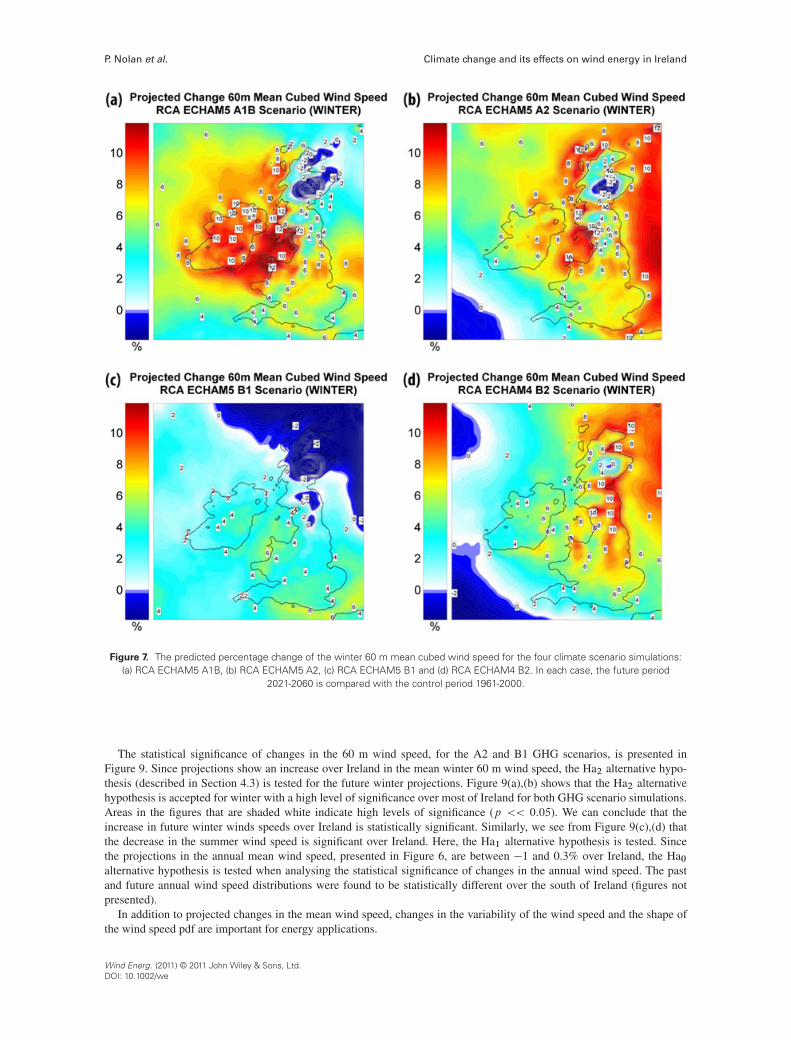
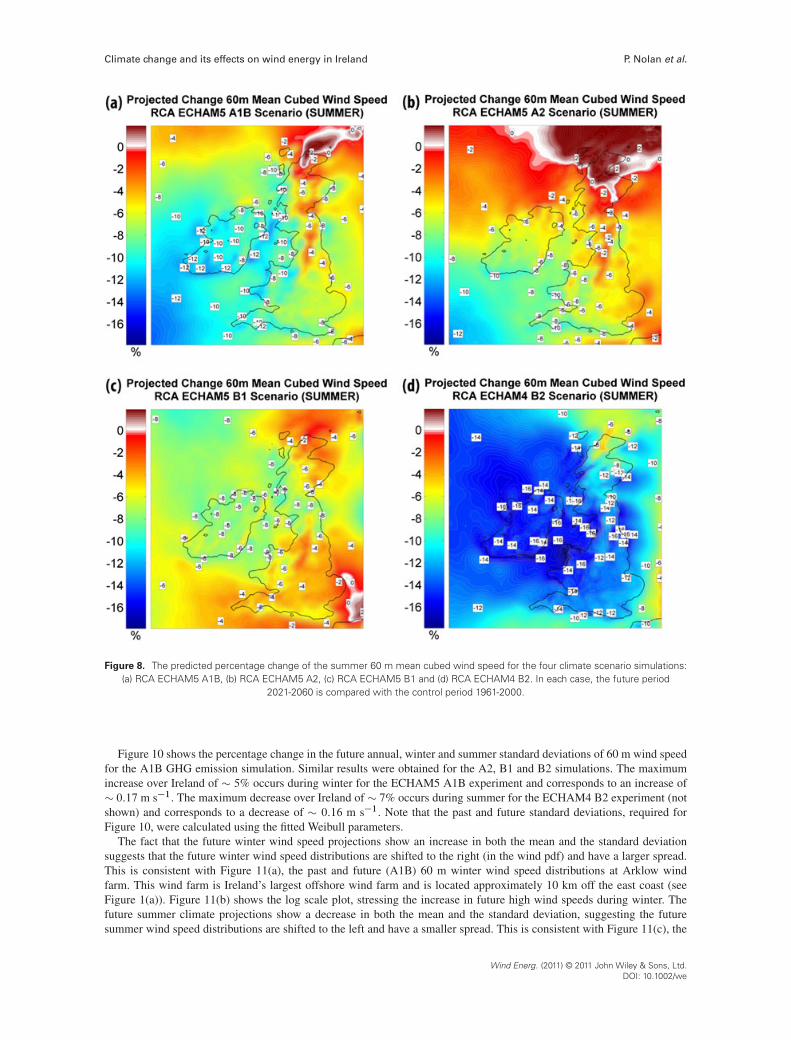
However, when stratified per season, we do see substantial changes in the mean wind speed, particularly for the winterand summer months. The projections show an expected increase in the winter mean wind speed over Ireland ranging from1% for the ECHAM5 B1 simulation to 3.5% for the ECHAM5 A1B simulation (not presented). The projected change inthe energy content of the wind for the winter months ranges from an increase of 2–4% for the ECHAM5 B1 simulationto an increase of 8–11% for the ECHAM5 A1B simulation (Figure 7). The projections show an expected decrease in thesummer mean wind speed over Ireland ranging from 2–3% for the ECHAM5 A2 simulation to 4–5% for the ECHAM4B2 simulation (not presented). The projected change in the energy content of the wind for the summer months ranges froma decrease of 4–10% for the ECHAM5 A2 simulation to a decrease of 14–16% for the ECHAM4 B2 simulation (Figure 8).
Note that the past and future 60 m mean cubed wind speeds, required for Figures 7 and 8, were calculated using thefitted Weibull parameters.
Wind Energ. (2011) © 2011 John Wiley & Sons, Ltd.DOI: 10.1002/we
P. Nolan et al. Climate change and its effects on wind energy in Ireland
Figure 7. The predicted percentage change of the winter 60 m mean cubed wind speed for the four climate scenario simulations:(a) RCA ECHAM5 A1B, (b) RCA ECHAM5 A2, (c) RCA ECHAM5 B1 and (d) RCA ECHAM4 B2. In each case, the future period
2021-2060 is compared with the control period 1961-2000.
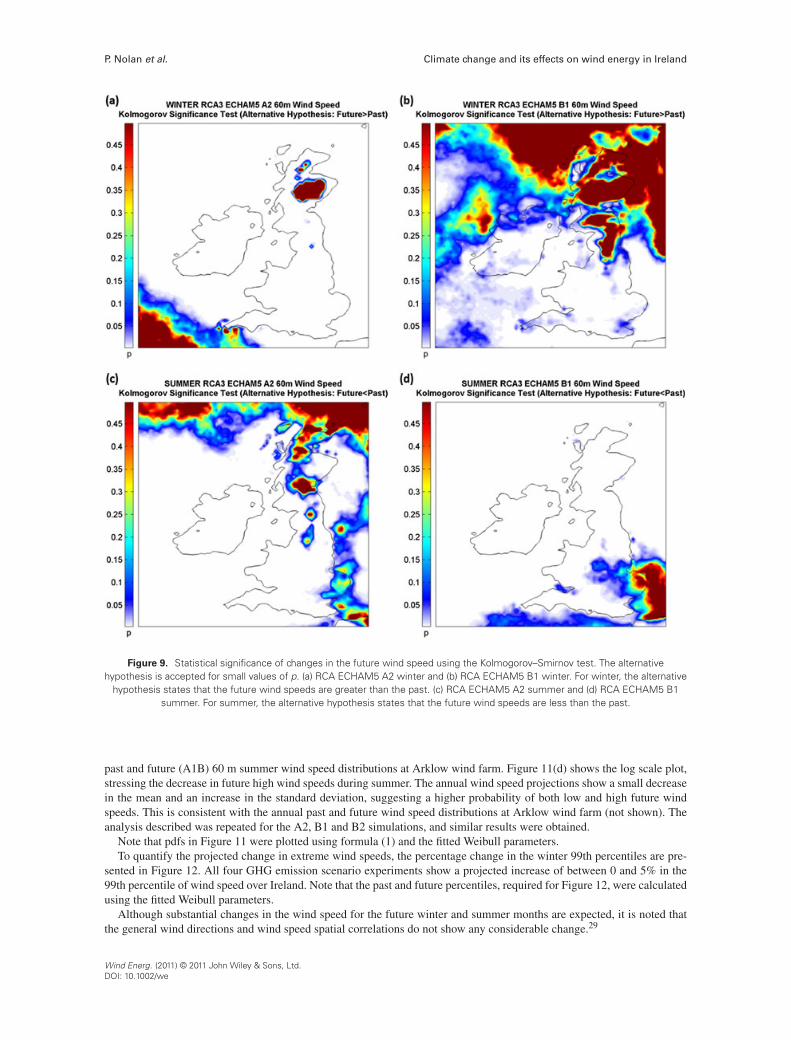
The statistical significance of changes in the 60 m wind speed, for the A2 and B1 GHG scenarios, is presented inFigure 9. Since projections show an increase over Ireland in the mean winter 60 m wind speed, the Ha2 alternative hypo-thesis (described in Section 4.3) is tested for the future winter projections. Figure 9(a),(b) shows that the Ha2 alternativehypothesis is accepted for winter with a high level of significance over most of Ireland for both GHG scenario simulations.Areas in the figures that are shaded white indicate high levels of significance (p << 0:05). We can conclude that theincrease in future winter winds speeds over Ireland is statistically significant. Similarly, we see from Figure 9(c),(d) thatthe decrease in the summer wind speed is significant over Ireland. Here, the Ha1 alternative hypothesis is tested. Sincethe projections in the annual mean wind speed, presented in Figure 6, are between �1 and 0.3% over Ireland, the Ha0alternative hypothesis is tested when analysing the statistical significance of changes in the annual wind speed. The pastand future annual wind speed distributions were found to be statistically different over the south of Ireland (figures notpresented).
In addition to projected changes in the mean wind speed, changes in the variability of the wind speed and the shape ofthe wind speed pdf are important for energy applications.
Wind Energ. (2011) © 2011 John Wiley & Sons, Ltd.DOI: 10.1002/we
Climate change and its effects on wind energy in Ireland P. Nolan et al.
Figure 8. The predicted percentage change of the summer 60 m mean cubed wind speed for the four climate scenario simulations:(a) RCA ECHAM5 A1B, (b) RCA ECHAM5 A2, (c) RCA ECHAM5 B1 and (d) RCA ECHAM4 B2. In each case, the future period
2021-2060 is compared with the control period 1961-2000.
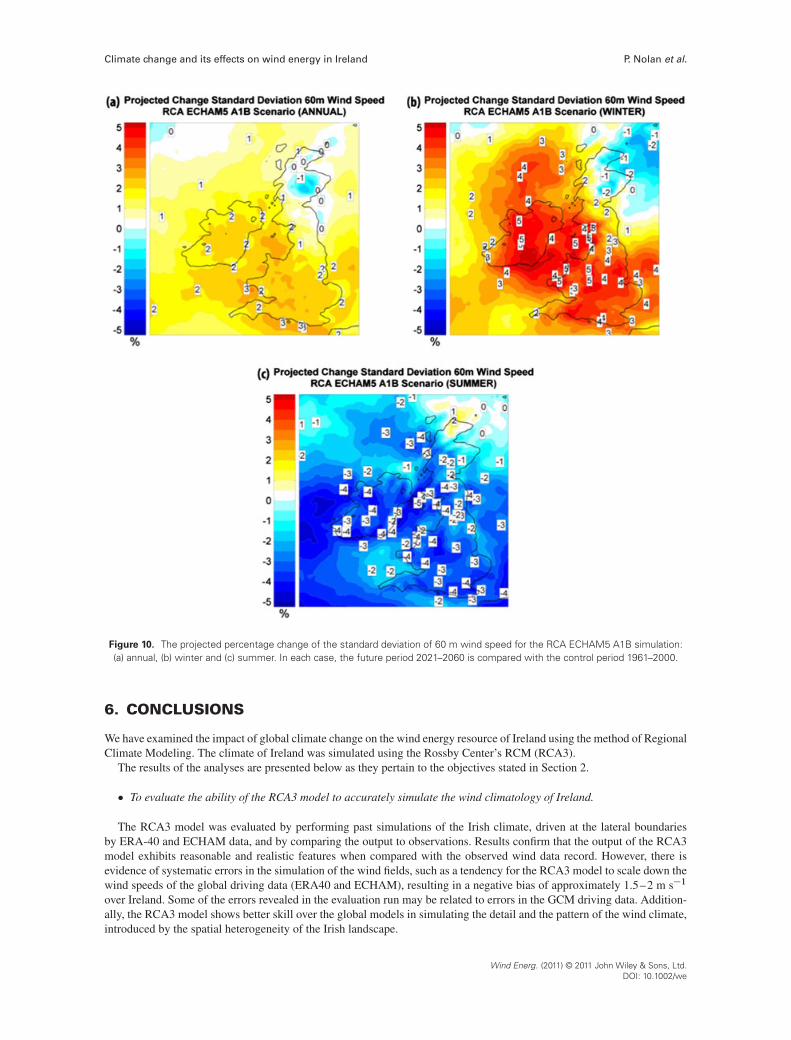
Figure 10 shows the percentage change in the future annual, winter and summer standard deviations of 60 m wind speedfor the A1B GHG emission simulation. Similar results were obtained for the A2, B1 and B2 simulations. The maximumincrease over Ireland of � 5% occurs during winter for the ECHAM5 A1B experiment and corresponds to an increase of� 0:17 m s�1. The maximum decrease over Ireland of � 7% occurs during summer for the ECHAM4 B2 experiment (notshown) and corresponds to a decrease of � 0:16 m s�1. Note that the past and future standard deviations, required forFigure 10, were calculated using the fitted Weibull parameters.
The fact that the future winter wind speed projections show an increase in both the mean and the standard deviationsuggests that the future winter wind speed distributions are shifted to the right (in the wind pdf) and have a larger spread.This is consistent with Figure 11(a), the past and future (A1B) 60 m winter wind speed distributions at Arklow windfarm. This wind farm is Ireland’s largest offshore wind farm and is located approximately 10 km off the east coast (seeFigure 1(a)). Figure 11(b) shows the log scale plot, stressing the increase in future high wind speeds during winter. Thefuture summer climate projections show a decrease in both the mean and the standard deviation, suggesting the futuresummer wind speed distributions are shifted to the left and have a smaller spread. This is consistent with Figure 11(c), the
Wind Energ. (2011) © 2011 John Wiley & Sons, Ltd.DOI: 10.1002/we
P. Nolan et al. Climate change and its effects on wind energy in Ireland
Figure 9. Statistical significance of changes in the future wind speed using the Kolmogorov–Smirnov test. The alternativehypothesis is accepted for small values of p. (a) RCA ECHAM5 A2 winter and (b) RCA ECHAM5 B1 winter. For winter, the alternative
hypothesis states that the future wind speeds are greater than the past. (c) RCA ECHAM5 A2 summer and (d) RCA ECHAM5 B1summer. For summer, the alternative hypothesis states that the future wind speeds are less than the past.
past and future (A1B) 60 m summer wind speed distributions at Arklow wind farm. Figure 11(d) shows the log scale plot,stressing the decrease in future high wind speeds during summer. The annual wind speed projections show a small decreasein the mean and an increase in the standard deviation, suggesting a higher probability of both low and high future windspeeds. This is consistent with the annual past and future wind speed distributions at Arklow wind farm (not shown). Theanalysis described was repeated for the A2, B1 and B2 simulations, and similar results were obtained.
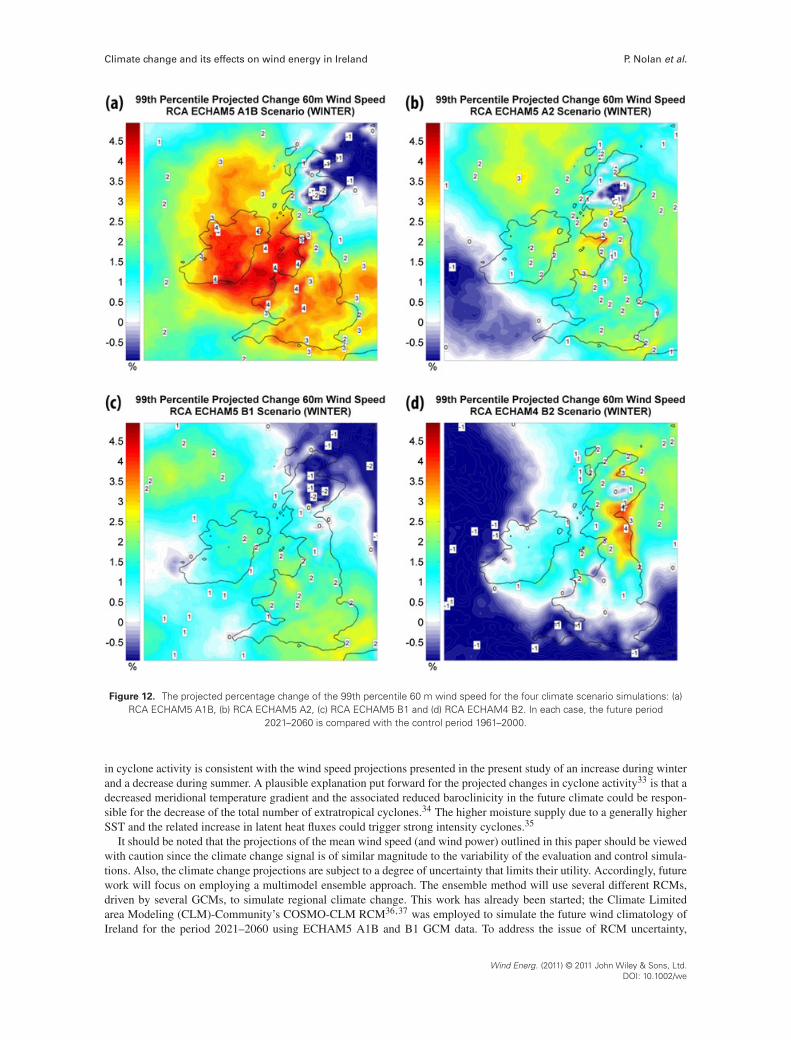
Note that pdfs in Figure 11 were plotted using formula (1) and the fitted Weibull parameters.To quantify the projected change in extreme wind speeds, the percentage change in the winter 99th percentiles are pre-
sented in Figure 12. All four GHG emission scenario experiments show a projected increase of between 0 and 5% in the99th percentile of wind speed over Ireland. Note that the past and future percentiles, required for Figure 12, were calculatedusing the fitted Weibull parameters.
Although substantial changes in the wind speed for the future winter and summer months are expected, it is noted thatthe general wind directions and wind speed spatial correlations do not show any considerable change.29
Wind Energ. (2011) © 2011 John Wiley & Sons, Ltd.DOI: 10.1002/we
Climate change and its effects on wind energy in Ireland P. Nolan et al.
Figure 10. The projected percentage change of the standard deviation of 60 m wind speed for the RCA ECHAM5 A1B simulation:(a) annual, (b) winter and (c) summer. In each case, the future period 2021–2060 is compared with the control period 1961–2000.
6. CONCLUSIONS
We have examined the impact of global climate change on the wind energy resource of Ireland using the method of RegionalClimate Modeling. The climate of Ireland was simulated using the Rossby Center’s RCM (RCA3).
The results of the analyses are presented below as they pertain to the objectives stated in Section 2.
� To evaluate the ability of the RCA3 model to accurately simulate the wind climatology of Ireland.
The RCA3 model was evaluated by performing past simulations of the Irish climate, driven at the lateral boundariesby ERA-40 and ECHAM data, and by comparing the output to observations. Results confirm that the output of the RCA3model exhibits reasonable and realistic features when compared with the observed wind data record. However, there isevidence of systematic errors in the simulation of the wind fields, such as a tendency for the RCA3 model to scale down thewind speeds of the global driving data (ERA40 and ECHAM), resulting in a negative bias of approximately 1.5–2 m s�1
over Ireland. Some of the errors revealed in the evaluation run may be related to errors in the GCM driving data. Addition-ally, the RCA3 model shows better skill over the global models in simulating the detail and the pattern of the wind climate,introduced by the spatial heterogeneity of the Irish landscape.
Wind Energ. (2011) © 2011 John Wiley & Sons, Ltd.DOI: 10.1002/we

P. Nolan et al. Climate change and its effects on wind energy in Ireland
Figure 11. Comparing the RCA ECHAM5 past and future (A1B) 60 m wind speed distributions at Arklow wind farm. (a) Winterdistribution, (b) log scale winter distribution, (c) summer distribution and (d) log scale summer distribution.
The evaluation results are consistent with previous studies investigating the ability of the RCA model to accurately sim-ulate wind fields.2,7 Separate studies, using different RCMs, have also noted an inability of RCMs to accurately simulatehigh to extreme wind speeds for Northern Europe.1 For example, most PRUDENCE30,31 RCMs, although quite realisticover sea, severely underestimate the occurrence of very high wind speeds over land and coastal areas.32
� To simulate the future wind climate for different GHG emission scenarios and to determine if (a) future climateprojections of the RCMs show substantial changes when compared with the past and (b) whether the changes aresignificant.
Projections for the future Irish climate were generated by downscaling the Max Planck Institute’s ECHAM GCM datausing the RCA3 model. Simulations were run for the 40 year future period (2021–2060) and a control period (1961–2000).The simulations were run at 13 km resolution using the four GHG emission scenarios A1B, A2, B1 and B2.
Future projections show a marked increase in the amplitude of the annual cycle in wind strength with 4 to 10% moreenergy available during winter and 5 to 14% less during summer. The projected changes for summer and winter were foundto be statistically significant, according to the Kolmogorov–Smirnov test, over most of Ireland. An increase in extreme windspeeds is expected during winter, which may impact on the continuity of supply of wind power. Nevertheless, the simula-tion results show an expected increase in the frequency of wind speeds in the energetically useful range occurring duringthe winter months. The future projections of wind direction and spatial correlations did not show any substantial change.
A possible explanation for the inter-annual variability increase in wind speed may be due to a future change in cycloneactivity. Most GCMs summarized in IPCC AR41 (chapter 10) produce fewer weak but more intense midlatitude cyclones.The increase in intense cyclones over the North Atlantic is found to occur particularly during winter. This projected change
Wind Energ. (2011) © 2011 John Wiley & Sons, Ltd.DOI: 10.1002/we
Climate change and its effects on wind energy in Ireland P. Nolan et al.
Figure 12. The projected percentage change of the 99th percentile 60 m wind speed for the four climate scenario simulations: (a)RCA ECHAM5 A1B, (b) RCA ECHAM5 A2, (c) RCA ECHAM5 B1 and (d) RCA ECHAM4 B2. In each case, the future period
2021–2060 is compared with the control period 1961–2000.
in cyclone activity is consistent with the wind speed projections presented in the present study of an increase during winterand a decrease during summer. A plausible explanation put forward for the projected changes in cyclone activity33 is that adecreased meridional temperature gradient and the associated reduced baroclinicity in the future climate could be respon-sible for the decrease of the total number of extratropical cyclones.34 The higher moisture supply due to a generally higherSST and the related increase in latent heat fluxes could trigger strong intensity cyclones.35
It should be noted that the projections of the mean wind speed (and wind power) outlined in this paper should be viewedwith caution since the climate change signal is of similar magnitude to the variability of the evaluation and control simula-tions. Also, the climate change projections are subject to a degree of uncertainty that limits their utility. Accordingly, futurework will focus on employing a multimodel ensemble approach. The ensemble method will use several different RCMs,driven by several GCMs, to simulate regional climate change. This work has already been started; the Climate Limitedarea Modeling (CLM)-Community’s COSMO-CLM RCM36,37 was employed to simulate the future wind climatology ofIreland for the period 2021–2060 using ECHAM5 A1B and B1 GCM data. To address the issue of RCM uncertainty,
Wind Energ. (2011) © 2011 John Wiley & Sons, Ltd.DOI: 10.1002/we

P. Nolan et al. Climate change and its effects on wind energy in Ireland
simulations were run using both COSMO-CLM version 3 and version 4 with respective dynamical cores, leapfrog andRunge–Kutta. To address the issue of inherent climate variability, the control and future simulations were repeated usingdifferent realizations of the ECHAM5 data to drive the RCMs. Climate variability can then be assessed by comparing theclimate change signals with the variability of the control simulations. Preliminary results show that the CLM projectionsagree with the RCA3 projections in the sense that they show substantial increases in 60 m wind speed over Ireland duringwinter of 4–5% and decreases during summer of 3–4%. The agreement of the RCA3 and COSMO-CLM simulation resultsincreases our confidence that the future projections are robust.
ACKNOWLEDGEMENTS
This research was supported and co-funded by Environmental Protection Agency and the Higher Education Authority. Thework was also supported by Met Éireann and by the CosmoGrid project, the latter funded under the Program for Researchin Third Level Institutions (PRTLI) administered by the Higher Education Authority under the National Development Planand with partial support from the European Regional Development Fund.
We would like to thank the model and data group at Max Planck Institute for Meteorology in Hamburg, Germany for theECHAM5-OM1 data and the Rossby Center at the Swedish Meteorological and Hydrological Institute in Norrköping,Sweden for the RCA3 model. The support received from Met Éireann, particularly from the IT and Climate andObservations Divisions, is also gratefully acknowledged.
We would also like to acknowledge the reviewers’ assistance in greatly improving the paper.
REFERENCES
1. IPCC. In Climate Change 2007: The Physical Science Basis. Contribution of Working Group I to the Fourth Assess-ment Report of the Intergovernmental Panel on Climate Change, Solomon S, Qin D, Manning M, Chen Z, Marquis M,Averyt KB, Tignor M, Miller H (eds). Cambridge University Press: Cambridge and New York, NY, 2007.
2. McGrath R, Lynch P, Dunne S, Hanafin J, Nishimura E, Nolan P, Ratnam J, Semmler T, Sweeney S, Wang S. Irelandin a warmer world: scientific predictions of the Irish climate in the twenty-first century. Final Report of C4I, Dublin,2008.
3. McGrath R, Nishimura E, Nolan P, Semmler T, Sweeney C, Wang S. Climate Change: Regional Climate ModelPredictions for Ireland. ERTDI Report Series No. 36, Environmental Protection Agency, 2005.
4. Troen I, Petersen EL. European Wind Atlas. Risø National Laboratory: Roskilde, 1989.5. Frank HP, Landberg L. Modelling the wind climate of Ireland. Boundary-Layer Meteorology 1997; 85: 359–378.6. SEI: Wind Atlas 2003. Report No. 4Y103A-1-R1. [Online]. Available: http://www.sei.ie/uploadedfiles/Renewable
Energy/IrelandWindAtlas2003.pdf (Accessed 01 July 2011).7. Pryor SC, Barthelmie RJ, Kjellstrom E. Analyses of the potential climate change impact on wind energy resources in
northern Europe using output from a regional climate model. Climate Dynamics 2005; 25: 815–835.8. Harrison GP, Cradden LC, Chick JP. Preliminary assessment of climate change impacts on the UK onshore wind
energy resource. Energy Sources 2008; 30: 1286–1299.9. Pryor SC, Barthelmie RJ. Climate change impacts on wind energy: a review. Renewable and Sustainable Energy
Reviews 2010; 14: 430–437.10. Breslow PB, Sailor DJ. Vulnerability of wind power resources to climate change in the continental United States.
Renewable Energy 2002; 27: 585–98.11. Sailor DJ, Smith M, Hart M. Climate change implications for wind power resources in the Northwest United States.
Renewable Energy 2008; 33: 2393–2406.12. Jones CG, Willén U, Ullerstig A, Hansson U. The Rossby Centre regional atmospheric climate model part I: model
climatology and performance for the present climate over Europe. Ambio 2004; 33: 199–210.13. Kjellström E, Bärring L, Gollvik S, Hansson U, Jones C, Samuelsson P, Rummukainen M, Ullerstig A, Willén U,
Wyser K. A 140-year simulation of European climate with the new version of the Rossby Centre regional atmosphericclimate model (RCA3). Reports Meteorology and Climatology, 108, SMHI, SE 60176 Norrköping, Sweden, 2005.
14. Samuelsson P, Gollvik S, Ullerstig A. The land-surface scheme of the Rossby Centre regional atmospheric climatemodel (RCA3). Report in Meteorology, 122, SMHI, SE-60176 Norrköping, Sweden, 2006.
15. Wang S, McGrath R, Semmler T, Sweeney, C. Validation of simulated precipitation patterns over Ireland for the period1961-2000. International Journal of Climatology 2006; 26: 251–266.
Wind Energ. (2011) © 2011 John Wiley & Sons, Ltd.DOI: 10.1002/we
Climate change and its effects on wind energy in Ireland P. Nolan et al.
16. Uppala SM, Allberg K, Simmons PW, Andrae AJ, Da Costa U, Bechtold V, Fiorino M, Gibson JK, Haseler J,Hernandez A, Kelly GA, Li X, Onogi K, Saarinen S, Sokka N, Allan RP, Andersson E, Arpe K, Balmaseda MA,Beljaars ACM, Van De Berg L, Bidlot J, Bormann N, Caires S, Chevallier F, Dethof A, Dragosavac M, Fisher M,Fuentes M, Hagemann S, Holm E, Hoskins BJ, Isaksen L, Janssen PAEM, Jenne R, Mcnally AP, Mahfouf J-F,Morcrette J-J, Rayner NA, Saunders RW, Simon P, Sterl A, Trenberth KE, Untch A, Vasiljevic D, Viterbo P, Woollen J.The ERA-40 re-analysis. Quarterly Journal of the Royal Meteorological Society 2005; 131: 2961–3012.
17. Roeckner E, Arpe K, Bengsson L, Christoph M, Claussen M, Duemenil L, Esch M, Giorgetta M, Schlese U,Schulzweida U, Giorgetta M, Schlese U. The atmospheric general circulation model ECHAM-4: model descriptionand simulation of present-day-climate. Report No. 218, Max Planck Institute for Meteorology, Hamburg, Germany,1996.
18. Roeckner E, Bauml G, Bonaventura L, Brokopf R, Esch M, Giorgetta M, Hagemannn S, Kirchner I, Kornblueh L,Manzini E, Rhodin A, Schlese U, Schulzweida U, Tompkins A. The atmospheric general circulation model ECHAM5part I: model description. Report No. 349, Max Planck Institute for Meteorology, Hamburg, Germany, 2003.
19. IPCC. In Special Report on Emission Scenarios. A Special Report of Working Group III of the Intergovernmental Panelon Climate Change, Nakicenovic N, Swart S (eds). Cambridge University Press: Cambridge, 2000.
20. Conradsen K, Nielsen L, Prahm L. Review of Weibull statistics for estimation of wind speed distributions. Journal ofClimate and Applied Meteorology 1984; 23: 1173–1183.
21. Deaves D, Lines I. On the fitting of low mean windspeed data to the Weibull distribution. Journal of Wind Engineeringand Industrial Aerodynamics 1997; 66: 169–178.
22. Monahan AH. The probability distribution of sea surface wind speeds. Part I: theory and SeaWinds observations.Journal of Climate 2006; 19: 497–520.
23. Tuller SE, Brett AC. The characteristics of wind velocity that favor the fitting of a Weibull distribution in wind speedanalysis. Journal of Climate and Applied Meteorology 1984; 23: 124–134.
24. Erickson DJ, Taylor JA. Non-Weibull behavior observed in a model-generated global surface wind field frequencydistribution. Journal of Geophysical Research 1989; 94: 698.
25. Bauer E. Characteristic frequency distributions of remotely sensed in situ and modelled wind speeds. InternationalJournal of Climatology 1996; 16: 1087–1102.
26. Seguro JV, Lambert TW. Modern estimation of the parameters of the Weibull wind speed distribution for windenergy analysis. Journal of Wind Engineering and Industrial Aerodynamics 2000; 85: 75–84. DOI: 10.1016/S0167-6105(99)00122-1. ISSN 0167-6105.
27. Hollander M, Wolfe DA. Nonparametric Statistical Methods. Wiley: Hoboken, NJ, 1973.28. Gibbons JD. Nonparametric Statistical Inference (2nd edn). Marcel Dekker: New York, NY, 1985.29. Nolan P. Simulating climate change and its effects on the wind energy resource of Ireland. PhD Thesis, 2009. [Online].
Available: http://mathsci.ucd.ie/met/staff/PaulNolan/PhD_Thesis_Paul_Nolan.pdf (Accessed 01 July 2011).30. Christensen JH, Carter TR, Rummukainen M, Amanatidis G. Evaluating the performance and utility of regional climate
models: the PRUDENCE project. Climatic Change 2007; 81: 1–6. DOI: 10.1007/s10584-006-9211-6.31. Déqué M, Jones RG, Wild M, Giorgi F, Christensen JH, Hassell DC, Vidale PL, Rockel B, Jacob D, Kjellström E,
de Castro M, Kucharski F, van den Hurk B. Global high resolution versus Limited Area Model scenarios over Europe:results from the PRUDENCE project. Climate Dynamics 2005; 25: 653–670. DOI: 10.1007/s00382-005-0052-1.
32. Rockel B, Woth K. Future changes in near surface wind speed extremes over Europe from an ensemble of RCMsimulations. Climate Change 2007. DOI: 10.1007/s10584-006-9227-y, (to appear in print).
33. Semmler T, Varghese S, McGrath R, Nolan P, Wang S, Lynch P, O’Dowd C. Regional model simulation of NorthAtlantic cyclones: present climate and idealized response to increased sea surface temperature. Journal of GeophysicalResearch 2008; 113: D02107.
34. Geng Q, Sugi M. Possible change of extratropical cyclone activity due to enhanced greenhouse gases and sulfateaerosols—study with a high-resolution AGCM. Journal of Climate 2003; 16: 2262–2274.
35. Hall NMJ, Hoskins BJ, Valdes PJ, Senior CA. Storm tracks in a high resolution GCM with doubled carbon dioxide.Quarterly Jorunal Royal Meteorological Society 1994; 120: 1209–1230. DOI: 10.1256/smsqj.51904.
36. Steppeler J, Doms G, Schättler U, Bitzer HW, Gassmann A, Damrath U, Gregoric G. Meso-gamma scale forecastsusing the nonhydrostatic model LM. Meteorology and Atmospheric Physics 2003; 82: 75–96.
37. Rockel B, Will A, Hense A. The regional climate model COSMO-CLM (CCLM). Meteorologische Zeitschrift 2008;17: 347–348.
Wind Energ. (2011) © 2011 John Wiley & Sons, Ltd.DOI: 10.1002/we


![From Richardson to early numerical weather predictionmathsci.ucd.ie/~plynch/Publications/CMMAP-Pp3-17.pdf · C:/ITOOLS/WMS/CUP/2120402/WORKINGFOLDER/DDO/9780521190060C02.3D 3 [3–17]](https://img.pdfslide.net/doc/110x75/5c62001a09d3f2de6a8b45af/from-richardson-to-early-numerical-weather-plynchpublicationscmmap-pp3-17pdf.jpg)