Embed Size (px)
Citation preview

Portolés Jl, Romero ML*, Filippou FC and Bonet JL, Simulation and design recommendations of eccentrically loaded slender concrete-filled tubular columns, Engineering Structures 2011: 33 (5) , pp. 1576-1593.
1
Simulation and design recommendations of eccentrically loaded slender
concrete-filled tubular columns.
J.M. Portolésa, M.L. Romerob*, F.C. Filippouc and J.L. Bonetb
a Department of Mechanical Engineering and Construction, Universitat Jaume I,
Castellón, Spain
b Instituto de Ciencia y Tecnología del Hormigón (ICITECH), Universidad
Politécnica de Valencia, Spain
c Civil and Environmental Engineering Department. University of California at
Berkeley, USA
ABSTRACT
This paper proposes an efficient numerical model for the simulation of the behavior
of slender circular concrete-filled tubular columns subjected to eccentric axial load with
single curvature, for the cases of both normal and high strength concrete. The paper
focuses on the study of the influence that the variables affecting beam-column behavior
(length and relative slenderness) and the variables affecting section behavior
(diameter/thickness ratio, mechanical capacity of steel) have on the overall buckling of
this type of column. An extended parametric study is carried out to propose design
recommendations, primarily to establish the importance of the use of high strength
concrete compared with that of normal strength concrete. The results show that for
slender elements the optimum design is reached when the mechanical capacity of the
steel is slightly lower than that of the concrete contribution.
Keywords: numerical model, composite column, concrete-filled tubular columns,
high strength concrete, buckling.
*Corresponding author: Tel: +34-963877007(ext: 76742) Fax: +34-963879679,
e-mail address: [email protected]
Portolés Jl, Romero ML*, Filippou FC and Bonet JL, Simulation and design recommendations of eccentrically loaded slender concrete-filled tubular columns, Engineering Structures 2011: 33 (5) , pp. 1576-1593.
2
NOTATION
e = eccentricity
L = length
D = diameter
t = thickness
fc = strength of concrete
fy = yielding stress of steel
CXXX-T-L-FF-EE-1 (i.e. C125-5-3-90-50-1), where C stands for circular, XXX is
the diameter in mm, T the thickness in mm, L the nominal length in meters, FF the
nominal concrete strength in MPa, and EE is the eccentricity applied.
CFT =concrete-filled tubular columns
NSC= normal strength concrete
HSC= high strength concrete.
CCR = concrete contribution ratio
SI = strength index
Ac = area of concrete
As = area of steel
E·I = effective flexural stiffness of the composite section.
relative slenderness
2
2
L
EI
fAfA
N
N yscc
cr
pl
Portolés Jl, Romero ML*, Filippou FC and Bonet JL, Simulation and design recommendations of eccentrically loaded slender concrete-filled tubular columns, Engineering Structures 2011: 33 (5) , pp. 1576-1593.
3
1 INTRODUCTION
Recent years have seen an increase in the use of concrete-filled tubular columns due to
their high stiffness, ductility and fire resistance. In addition, high strength concrete is
widely used in building columns to reduce the size of the cross section. Since most
experimental studies on eccentrically loaded slender columns are limited to normal
strength concrete, there is a need for information regarding the response of this type of
structural member towards high strength concrete.
In order to address this lack of information the authors established an integrated
experimental and analytical study consisting of the following tasks: an extensive set of
experiments on eccentrically loaded slender columns [1], the development of a
computationally-efficient analytical model, parametric studies on the influence of key
parameters, and the development of design recommendations.
This paper provides a brief presentation of the development of the numerical model but
focuses on the two remaining tasks. The aim is to obtain as accurate and reliable a
method as possible for performing an extended parametric study with reduced time
consumption. The purpose of this is to provide some design recommendations to
establish the importance of the use of high strength concrete compared with that of
normal strength concrete.
In fact, the design codes for each country provide simplified methods for composite
columns, but these are generally limited to the use of concrete with a cylinder strength
no higher than 50-60 MPa, as in the case of Eurocode 4 (EC4) [2], and ought to be
revised accordingly. This is crucial given that in the practical design of a column within
a building the axial load, eccentricity and height of the storey are fixed. In this situation
Portolés Jl, Romero ML*, Filippou FC and Bonet JL, Simulation and design recommendations of eccentrically loaded slender concrete-filled tubular columns, Engineering Structures 2011: 33 (5) , pp. 1576-1593.
4
if HSC is used, rather than normal strength concrete (NSC), the section is reduced and
the slenderness increased, so the element experiences higher geometric nonlinearity.
Johansson and Gylltoft [3],[4], and Zeghiche and Chaoui [5], have demonstrated that
it is possible to use high strength concrete and still achieve structural ductile behavior.
However, if the aim is to obtain the same ductility as with NSC, a greater wall thickness
is required to complement the HSC core of the column.
If the column is slender and is subjected to an eccentric load it seems clear that the
increasing curvature in the cross section and the increase in flexure are to the detriment
of any improvement in the concrete strength due to the confinement effect [3]. O’Shea
and Bridge [6], however, stated that when eccentricity is increased in short columns,
ductility also improves. This statement needs to be amplified for slender columns, as
there are not many studies on high performance materials for CFTs, focusing on overall
buckling. Han [7] studied tubular columns with a high slenderness ratio and normal
strength concrete, concluding that the strength of the concrete has very little influence
on the ultimate capacity as the failure load is governed by the flexural rigidity.
Sakino et al. [8] and Fujimoto et al. [9] concluded, in the case of short columns, that
the use of HSC reduces the ductility of circular CFT. However, this can be improved in
two ways, by using low values of D/t or increasing the strength of the steel (fy).
Grauers [10] obtained more ductile behavior introducing a small eccentricity and
Bergman [11] observed non-ductile behavior once the maximum load was reached. He
studied the confinement mainly for normal strength concrete and partially for high
strength concrete, but applying only axial load and not eccentricity.
Portolés Jl, Romero ML*, Filippou FC and Bonet JL, Simulation and design recommendations of eccentrically loaded slender concrete-filled tubular columns, Engineering Structures 2011: 33 (5) , pp. 1576-1593.
5
Varma et al. [12] asserted that the curvature ductility of high strength square CFT
beam-columns (with a length of 1.5 meters) decreased significantly with an increase in
either the axial load level or the b/t ratio of the steel tube.
Zeghiche and Chaoui [5] stated that the increase of concrete core strength is only
effective for shorter columns and decreases with increasing L/D. The D/t ratio, which is
one of the parameters that can improve ductile behavior, was not varied in their tests.
Portolés et al. [1] concluded it was clear that the use of HSC in concrete-filled tubular
columns does not offer the same improvement as that of NSC in composite behavior.
However, it is possible to achieve ductile behavior by employing a proper set of
parameters for the section (D/t, fy and fc), together with a proper set of parameters for
the whole member (L/D and e/D), all of which are decisive for the behavior of the
member. Different performance indexes were used to study the effects of the main
variables on the load-carrying capacity and ductility. These led to the conclusion that it
was necessary to provide more data to achieve reliable results. To do so a numerical
model for the accurate prediction of high strength concrete composite columns was
needed.
The aim of this paper is to establish design recommendations for the use of high
strength concrete as opposed to that of normal strength concrete through the comparison
of two performance indexes: concrete contribution ratio and strength index. Although
ductility is also an interesting issue in concrete-filled columns, the authors chose not to
include it in this paper so as to avoid excessive complication.
The final objective is to provide guidance when specifying the design for the best
performing slender CFST columns, both for normal and high strength concrete.
Portolés Jl, Romero ML*, Filippou FC and Bonet JL, Simulation and design recommendations of eccentrically loaded slender concrete-filled tubular columns, Engineering Structures 2011: 33 (5) , pp. 1576-1593.
6
2. NUMERICAL MODEL
2.1. Introduction.
In general, there are three different types of numerical models for the simulation of CFT
columns [13]: a) three-dimensional finite element model; b) fiber beam-column
elements; and c) concentrated plasticity column elements.
As the main interest of this paper focuses on a computationally efficient element for
conducting extensive parametric studies, the three-dimensional finite element models
will not be pursued. While concentrated plasticity models are very efficient they suffer
from some limitations as regards aspects important for this project: the need to calibrate
a yield surface under biaxial bending and axial force and the development of evolution
rules for hardening and softening response for non-associative plasticity. For this reason
this type of model is not pursued further in this study, although Hajjar et al. [14]
presented a thorough study showing the potential of this model.
A beam finite element was selected, given that the final objective of this project is both
the development of design recommendations for slender high strength concrete-filled
tubular (CFT) columns, and the development of analytical models for nonlinear
simulation of large structures.
For fiber column elements, the review study by Spacone and El-Tawil [13] contains
information on available frame elements, section models, with lumped and distributed
inelasticity, as well as models with perfect and partial connections.
However, recent interest has focused on the introduction of high strength concrete in
this type of structure. In fact, it can be stated that extensive work has been done on
nonlinear finite element analysis for normal strength concrete, although the number of
Portolés Jl, Romero ML*, Filippou FC and Bonet JL, Simulation and design recommendations of eccentrically loaded slender concrete-filled tubular columns, Engineering Structures 2011: 33 (5) , pp. 1576-1593.
7
studies on high strength concrete is considerably lower. Romero et al. [15] presented a
review of the latest formulations.
The fiber models are simpler as their material constitutive models are one-dimensional
despite the fact that the element itself is three-dimensional, with nonlinearity distributed
along the element. These elements can be classified into three general families in terms
of the method of interpolation: displacement-, force-, and mixed-based. Displacement-
based frame elements are quite simple and easy to implement, but suffer from
limitations when yielding concentrates at a specific location, as the assumption of cubic
displacements (and thus linear curvatures) is exact for an Euler-Bernoulli beam only in
the linear elastic range and for constant cross sections. Nonetheless, they are popular
due to their ease of implementation, and De Sousa and Caldas [16] used a cubic
interpolation of transverse displacements and quadratic interpolation for axial
displacements obtaining suitable results with no more than four elements per column.
Initially, a perfect bond between the concrete core and steel tube was assumed in most
of the displacement-based models, but Hajjar et al. [17] proposed a numerical model for
rectangular columns that accounted for slip between concrete and steel components.
According to this study slip has an important effect on the transmission of loads in the
composite joints but has little effect on the global behavior of CFT columns.
In the two-node Euler-Bernoulli force-based frame element, the beam section forces are
expressed as functions of the nodal forces through force interpolation functions. The
force-based element is rather appealing as it is exact within the small-deformation
Euler-Bernoulli beam theory, Spacone et al. [18].
With this model it is possible to represent geometric nonlinearity within a structural
member by subdividing it into 2 or 4 elements and using the co-rotational formulation

Portolés Jl, Romero ML*, Filippou FC and Bonet JL, Simulation and design recommendations of eccentrically loaded slender concrete-filled tubular columns, Engineering Structures 2011: 33 (5) , pp. 1576-1593.
8
to transform the nodal variables on account of large displacements. A more complex
alternative approach is the development of a force-based element that includes the effect
of geometric nonlinearity due to moderate deformations, as pursued by Neuenhofer and
Filippou [19] for elastic, and De-Souza[20] for inelastic response. Valipour and Foster
[21] recently pursued a similar approach. Ayoub and Filippou [22] and Limkatanyu and
Spacone [23] proposed a beam element which includes the effect of relative slip
between steel and concrete.
Spacone et al. [24] were the first to propose a mixed formulation for the beam finite
element. Taylor et al. [25] finally demonstrated the consistent derivation of such an
element with the Hu-Washizu variational principle and its consistent numerical
implementation. Pi et al. [26] used a mixed formulation and proposed a total Lagrangian
finite element for both composite beams and columns, introducing an independent
displacement to reproduce the slip between the steel and concrete. Tort and Hajjar [27]
also presented a mixed finite-element model for rectangular concrete-filled steel tube
members.
Previous studies have shown that the behavior of CFT columns depends on several
parameters which can be grouped into geometric or material categories. It is relatively
easy to include the geometric parameters in a computational model but it is more
difficult to find the rational description of the material effects in a beam element. The
decision was made to start the investigation with a readily available beam column
element with simple assumptions and later refine it if the correlation studies proved this
necessary.
The numerical model must be valid for simulating the behavior of slender circular
concrete-filled tubular columns subjected to eccentric axial load with single curvature,

Portolés Jl, Romero ML*, Filippou FC and Bonet JL, Simulation and design recommendations of eccentrically loaded slender concrete-filled tubular columns, Engineering Structures 2011: 33 (5) , pp. 1576-1593.
9
both for normal and high strength concrete. The material constitutive model is uniaxial
and the finite element uses a co-rotational formulation with a force interpolation
iterative scheme and a fiber integration of the cross section. The results from the
literature reviewed show that, for slender columns subjected to axial load with
eccentricity, the second order effects and overall buckling have a great influence on the
numerical model, and the concrete is not confined until the post-peak behavior stage.
This type of element is available in the OpenSees platform [28] and in FedeasLab
[29], a Matlab-based toolbox for the nonlinear analysis of structures. The assumptions
of the beam column element available are:
The element is based on the Euler-Bernoulli beam theory under small
deformations.
Perfect bond in the longitudinal direction between the concrete core and the steel
tube is assumed. Consequently, the interlayer slip displacement is not accounted
for. This assumption was made to avoid a complication which is not clear that is
necessary for slender columns, Hajjar et al. [17].
Perfect compatibility is also assumed in the radial direction. This is a rough
approximation as the Poisson ratio of the concrete core is lower than that of the
steel tube for small strain values [30]. However, the oval deformation of the cross
section due to the eccentricity of the load introduces significant complexity with
unclear significance for slender columns.
Local buckling of the steel tube is neglected, because all the cases analyzed have a
thickness greater than the minimum set in Eurocode 4 [2]. The maximum D/t ratio
equals 90(235/fy).
Portolés Jl, Romero ML*, Filippou FC and Bonet JL, Simulation and design recommendations of eccentrically loaded slender concrete-filled tubular columns, Engineering Structures 2011: 33 (5) , pp. 1576-1593.
10
The section is discretized into fibers with uniaxial material relationships for steel
and concrete that will be discussed in detail in a later section.
The limitations of the model are the following: columns with an L/D ratio higher
than 8, ratios of e/D from 0.05 to 0.5, strength of concrete up to 100 MPa and
strength of steel up to 435 MPa.
2.2. Experimental tests for validation.
The model was validated with comparisons of results from experiments by the authors
[1] and different cases from the literature, summarized in Romero et al. [33].
From many tests in the literature only the data regarding maximum load can be obtained
while the entire force-displacement curve is available from the tests by the authors. The
former will be used to check the reliability of the numerical model, while the latter are
used for the complete validation of the model.
2.2.1.- Tests from experiments by the authors.
These tests are described briefly in the following. The full details can be found in
Portolés et al. [1]. Thirty-seven tests were carried out on normal and high strength CFT
columns, with three of these being repeated to check consistency, so that thirty-four
different cases are listed in Table 1. These tests were designed to investigate the effect
of four main parameters on the column behavior: slenderness (L/D), diameter to
thickness ratio (D/t), strength of concrete (fc) and eccentricity (e0). The ranges of these
parameters were selected with respect to current construction practices, including high
strength concrete and high eccentricities, which are less common. Table 1 summarizes
the experimental data. The column lengths were 2135 mm and 3135 mm, for tube
lengths of 2000 mm and 3000 mm, respectively, allowing for the length of the end
plates used in the special assembly. The nominal cross section of the circular tubes

Portolés Jl, Romero ML*, Filippou FC and Bonet JL, Simulation and design recommendations of eccentrically loaded slender concrete-filled tubular columns, Engineering Structures 2011: 33 (5) , pp. 1576-1593.
11
(diameter D × thickness t) measured 100 × 3 mm, 100 × 5 mm, 125 × 5 mm, and 160 ×
6 mm. The thickness of the tubes was such that local buckling was avoided following
Eurocode 4. The nominal strength of concrete varied from 30, 70 to 90 MPa and in
some cases empty columns were tested as reference. The axial load was applied with the
same eccentricity at both ends with a value of 20 or 50 mm, which meant that the
columns were subjected to single curvature bending. The tests are identified according
to:
CXXX-T-L-FF-EE-1 (i.e. C125-5-3-90-50-1), where C stands for circular, XXX is
the nominal diameter in mm, T the thickness in mm, L the nominal length in meters, FF
the nominal concrete strength in MPa, and EE is the eccentricity applied.
The steel grade was S275JR and the actual strength (fy) of the empty tubes was
obtained by coupon test. The yielding stress was between 320 and 325 MPa for all
cases. The modulus of elasticity Es of the steel was set following European standards
with a value of 210 GPa.
The concrete compressive strength fc was determined from both the 150 × 300 mm
cylinders and the 100 mm cubes using standard tests. The strength of the cubic samples
was interpreted for the cylindrical equivalent using Eurocode 2.
Five LVDTs were used to symmetrically measure the deflection of the column at mid
length (0.5L) and also at four additional levels (0.25L, 0.37L, 0.625L, 0.75L). Once the
specimen was put in place, it was tested with displacement control in order to measure
post-peak behavior.
2.2.2.- Tests by other authors.

Portolés Jl, Romero ML*, Filippou FC and Bonet JL, Simulation and design recommendations of eccentrically loaded slender concrete-filled tubular columns, Engineering Structures 2011: 33 (5) , pp. 1576-1593.
12
A comparison with 52 experimental tests from the literature was performed in this
paper. The tests were from Zeghiche and Chaoui [34] , Rangan and Joyce [35], Neogi et
al. [36], and Kilpatrick and Rangan [37] .
2.3. Sensitivity analysis.
In this section a sensitivity analysis of the numerical model is carried out in order to
establish which parameters primarily influence the numerical model.
2.3.1. Constitutive Models.
The concrete confined in a short concrete-filled tubular column is in a triaxial stress
state, while the steel is in a biaxial state. Under these multiaxial stress conditions the
concrete strength and ductility increase while steel strength decreases. If uniaxial stress-
strain relations are selected for both materials for the sake of simplicity, then this
behavior must be accounted for. Complicating matters further, the column slenderness
or the large eccentricity of loading produces a non-uniform confinement of the concrete
that may need to be included.
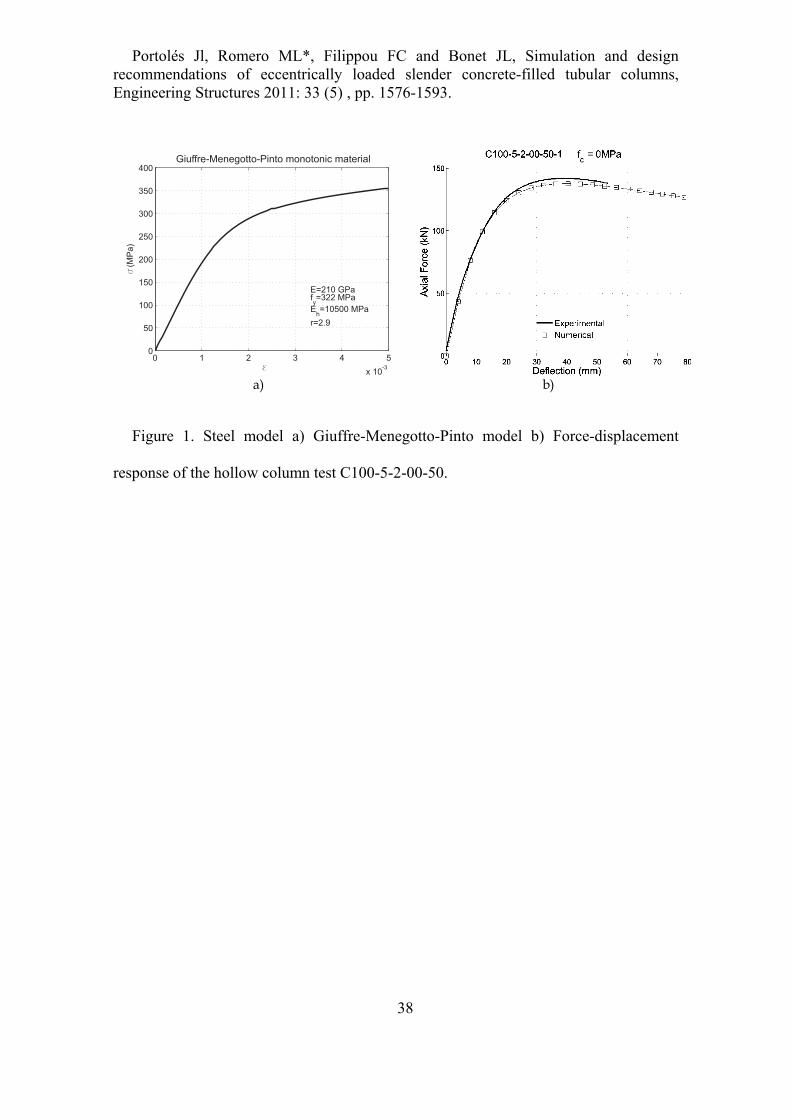
a) Steel model
The stress-strain relationship of cold-formed hollow tubes is well represented by the
Giuffre-Menegotto-Pinto model [38] with its gradual transition from a linear elastic
to a post-yield hardening branch.
The equation of this model is defined by four parameters, elastic modulus E, the
yielding stress fy, the hardening modulus of yielded steel Eh, and the index r. This index
has effects on the curvature of the diagram:
r
1rX1
X)b1(bXY
, (1)
where E
fyy ,
E
Eb h ,
y
X
, Yf y
Portolés Jl, Romero ML*, Filippou FC and Bonet JL, Simulation and design recommendations of eccentrically loaded slender concrete-filled tubular columns, Engineering Structures 2011: 33 (5) , pp. 1576-1593.
13
The elastic modulus of steel was assumed to be equal to E = 210 GPa, while the
remaining parameters were determined from the hollow tube experiments. Figure 1.a
shows a graph of the steel stress-strain relation that was used in the correlation of the
response of a hollow column test in Figure 1.b. The horizontal axis presents the lateral
deflection of the mid-span section.
b) Concrete model
For short columns one of the first numerical models for CFT columns was developed
and formulated for normal strength concrete and for rectangular CFT columns by Tomii
and Sakino [39]. They stated that in square or rectangular CFT columns the
confinement was not important due to the non-constant lateral pressure on the concrete
core, and the model did not increase the strength of concrete but improved the post-peak
descending behavior in terms of the diameter-to-thickness ratio.
Several authors, such as Shams and Saadeghvaziri [40], Susantha et al. [41],
Hatzigeorgiou [42], Xiao et al. [43], and Hu et al. [44], proposed new models for
circular columns which account for the strength and the ductility enhancement of the
concrete. These models are based on the well-known studies by Richart et al [45] where
the confined concrete strength depends on the mean confining stress and a confinement
factor k, which ranges from 4 to 6.
Nakahara et al. [46] updated fiber σ-ε curves for high strength materials and Uy [47]
developed fiber models for conventional strength CFTs made from thin-walled steel
tubes.
However, these models are limited to short columns subjected to loading with small
eccentricity. Recently Hatzigeorgiou [48], Liang [49], Hu et al. [50] and Liang and
Portolés Jl, Romero ML*, Filippou FC and Bonet JL, Simulation and design recommendations of eccentrically loaded slender concrete-filled tubular columns, Engineering Structures 2011: 33 (5) , pp. 1576-1593.
14
Frangomeni [51] proposed models for short columns under axial load and bending
moment.
But if the structural member is slender and the second order effects are significant,
the eccentricity of the axial force at the critical section is so large that the confinement
effect on the concrete is insignificant, as also concluded by Hajjar and Gourley [52], and
Liang [53]. In contrast, the descending branch of the concrete stress-strain relation is
critical for the representation of the softening behavior of the post-peak of the slender
CFT columns. Clearly, the softening response is very sensitive to the numerical solution
scheme. When the concrete core starts to crush, its dilatation reaches the steel value, and
the resulting contact of the two materials produces a confinement effect. This was
observed by Tomii and Sakino [39] for square columns but is also applicable in the case
of slender circular columns with high eccentricity or slenderness.
In order to validate a general beam column fiber model, but for square columns,
Varma et al. [54] used a three-dimensional finite element model for the failure segment
of a high strength square CFT subjected to concentric axial compressive loading. They
used their own stress-strain relationship for the confined concrete.
However, most of the previous studies concentrated on short columns and the study of
the influence of high strength concrete for slender columns subjected to eccentric
loading was not completely established.
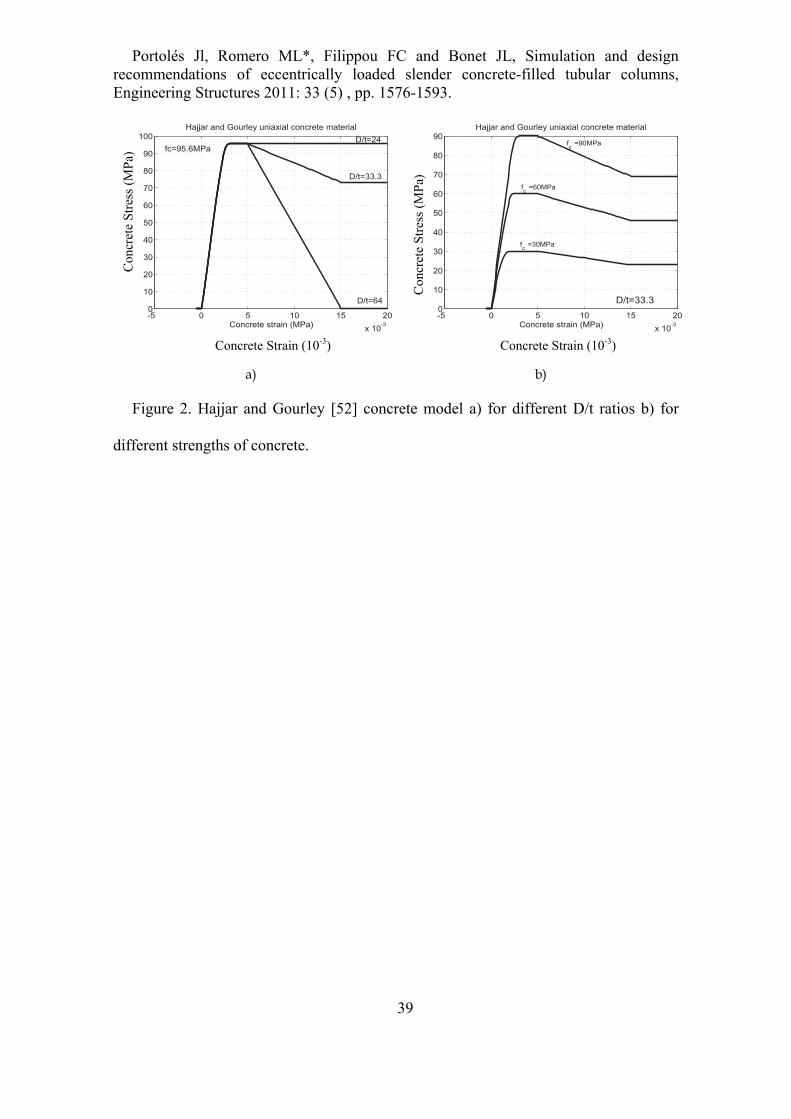
Therefore, the authors decided to use a combination of two models for this
paper. The ascending branch is based on the model of Collins et al. [55] for concrete
valid for NSC and HSC without confinement. The post-peak behavior is represented by
the model from Tomii and Sakino [39] which accounts for the effect of the D/t ratio on
the softening slope. The tensile strength is ignored. This model was first proposed by

Portolés Jl, Romero ML*, Filippou FC and Bonet JL, Simulation and design recommendations of eccentrically loaded slender concrete-filled tubular columns, Engineering Structures 2011: 33 (5) , pp. 1576-1593.
15
Hajjar and Gourley [52] for NSC. Figure 2 shows the concrete model for different D/t
ratios and different strengths of concrete.
Once the maximum concrete strength is reached, it remains constant up to a strain of
005.01c . For larger compressive strains, concrete stress remains constant if the D/t
ratios are equal or lower than 24. For larger D/t ratios the concrete stress decreases with
increasing compressive strain to a residual value (res) at a strain 015.01c .
According to the following equation, this residual stress depends on the D/t ratio up to a
maximum value of D/t = 64, where it becomes zero. The residual stress is given by the
following equations:
t
D640
64t
D24
t
D025.06.1f
24t
Df
c
c
res (2)
The equations are:
c2cres
2cc1c1c2c
1cccresc
1cc0cc
0cck·nc
c
)f(f
f
0X1n
n·Xf
00
(3)
where 6900
f3320E c
c ; 17
f8.0n c ; with fc in MPa
c ; )1n(
n
E
f
c
c1c ; 005.01c ; 015.02c ;
1c
cX
;
Portolés Jl, Romero ML*, Filippou FC and Bonet JL, Simulation and design recommendations of eccentrically loaded slender concrete-filled tubular columns, Engineering Structures 2011: 33 (5) , pp. 1576-1593.
16
Figure 3 shows the comparison between two concrete models, the Collins model with a
sudden loss of strength which did not converge in the post-peak range, and the Hajjar-
Gourley model which captured the post-peak response.
2.3.2. Finite element model.
At the beginning of the study the force, displacement and mixed formulation were
considered because they were available in the computer program. After an initial
evaluation we concluded that the force formulation was the most suitable for the
purpose of this study.
a) Number of elements per column.
In the interest of reducing computational time it is important to use the smallest
number of finite elements for each column member without affecting the accuracy. It is
important to use an even number of elements for each member so as to have a node at
mid height of the slender column where the maximum eccentricity occurs. From the
numerical tests it was decided that only four elements were needed to obtain results
accurate enough (within 3 % deviation from the results of detailed analyses).
b) Discretization of the section.
The integration of the internal forces in the Gauss integration points is performed
repeatedly during the iterative process and needs to be optimized, as it consumes at least
one third of the total computational time, Romero et al. [56].
Although the same authors, in Bonet et al. [57], have proposed a fast integration
algorithm to obtain the stiffness and internal forces of reinforced concrete sections, this
is not appropriate if a comparison between strains and local behavior is desired for use
in experiments. For this case the integration of the section using fibers was selected.
Portolés Jl, Romero ML*, Filippou FC and Bonet JL, Simulation and design recommendations of eccentrically loaded slender concrete-filled tubular columns, Engineering Structures 2011: 33 (5) , pp. 1576-1593.
17
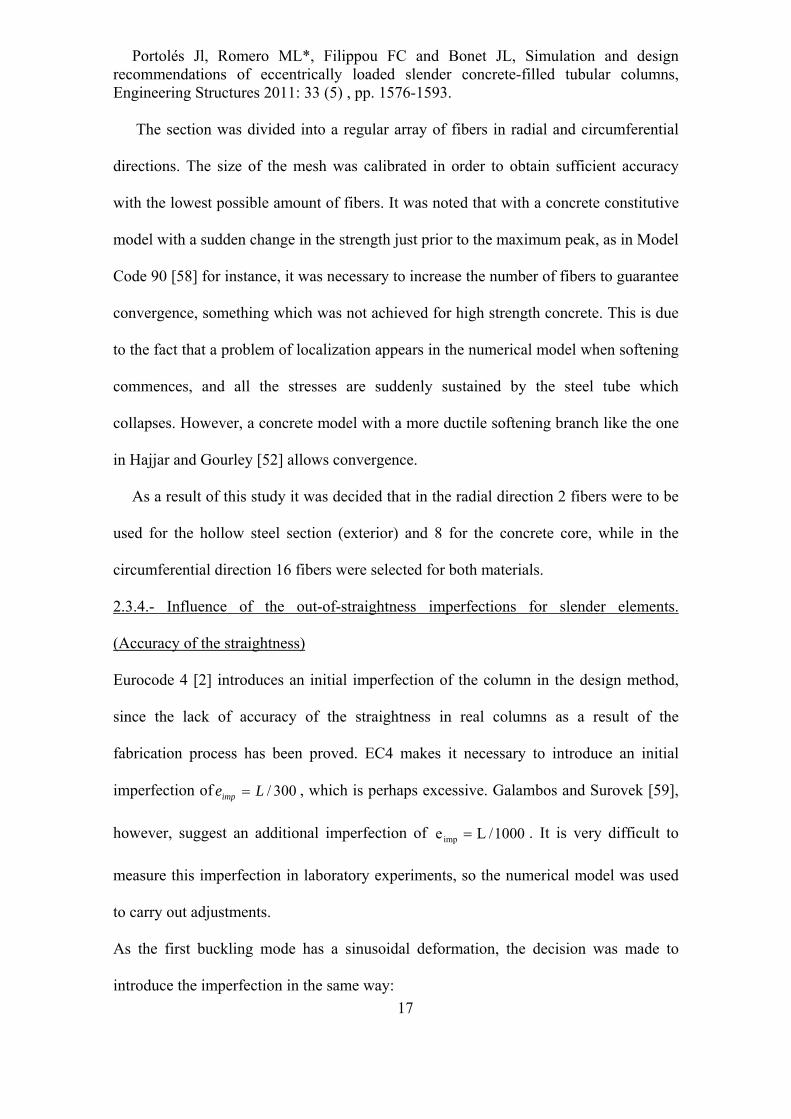
The section was divided into a regular array of fibers in radial and circumferential
directions. The size of the mesh was calibrated in order to obtain sufficient accuracy
with the lowest possible amount of fibers. It was noted that with a concrete constitutive
model with a sudden change in the strength just prior to the maximum peak, as in Model
Code 90 [58] for instance, it was necessary to increase the number of fibers to guarantee
convergence, something which was not achieved for high strength concrete. This is due
to the fact that a problem of localization appears in the numerical model when softening
commences, and all the stresses are suddenly sustained by the steel tube which
collapses. However, a concrete model with a more ductile softening branch like the one
in Hajjar and Gourley [52] allows convergence.
As a result of this study it was decided that in the radial direction 2 fibers were to be
used for the hollow steel section (exterior) and 8 for the concrete core, while in the
circumferential direction 16 fibers were selected for both materials.
2.3.4.- Influence of the out-of-straightness imperfections for slender elements.
(Accuracy of the straightness)
Eurocode 4 [2] introduces an initial imperfection of the column in the design method,
since the lack of accuracy of the straightness in real columns as a result of the
fabrication process has been proved. EC4 makes it necessary to introduce an initial
imperfection of 300/Leimp , which is perhaps excessive. Galambos and Surovek [59],
however, suggest an additional imperfection of 1000/Leimp . It is very difficult to
measure this imperfection in laboratory experiments, so the numerical model was used
to carry out adjustments.
As the first buckling mode has a sinusoidal deformation, the decision was made to
introduce the imperfection in the same way:

Portolés Jl, Romero ML*, Filippou FC and Bonet JL, Simulation and design recommendations of eccentrically loaded slender concrete-filled tubular columns, Engineering Structures 2011: 33 (5) , pp. 1576-1593.
18
L
xsine)x(y imp
(4)
The effect that the variation of initial imperfection has in the force-displacement
response for a given column is obvious: when this imperfection increases the maximum
load decreases.
The best adjustment between the maximum axial force of the tests and the numerical
model is obtained for an initial imperfection of 600/Leimp .
2.4. Validation of the numerical model.
This section demonstrates the precision of the numerical model once all the
parameters are fixed using a prior sensitivity analysis.
2.4.1. Force displacement
Figure 4 shows the comparison of six cases representative of the experimental results
and the numerical model with and without introducing the initial imperfections (L/600).
As can be observed, the model not only represents the behavior of the column in the
ascending branch with sufficient accuracy but also follows the post-peak behavior. It
can be inferred that there is a greater difference between both cases in the numerical
model (with and without additional imperfection) when the first order eccentricity is
lower (e = 20 mm) or the length is higher (L = 3 m). This is because it is very important
to capture the total eccentricity (first order + second order + additional imperfection)
properly, and in such cases the eimp is relatively larger than the others.
Figure 5 also shows the comparison of the force-displacement behavior of the
experimental cases from Kilpatrick and Rangan [37], with eccentricities varying from
10 to 50 mm, showing excellent accuracy.
Portolés Jl, Romero ML*, Filippou FC and Bonet JL, Simulation and design recommendations of eccentrically loaded slender concrete-filled tubular columns, Engineering Structures 2011: 33 (5) , pp. 1576-1593.
19
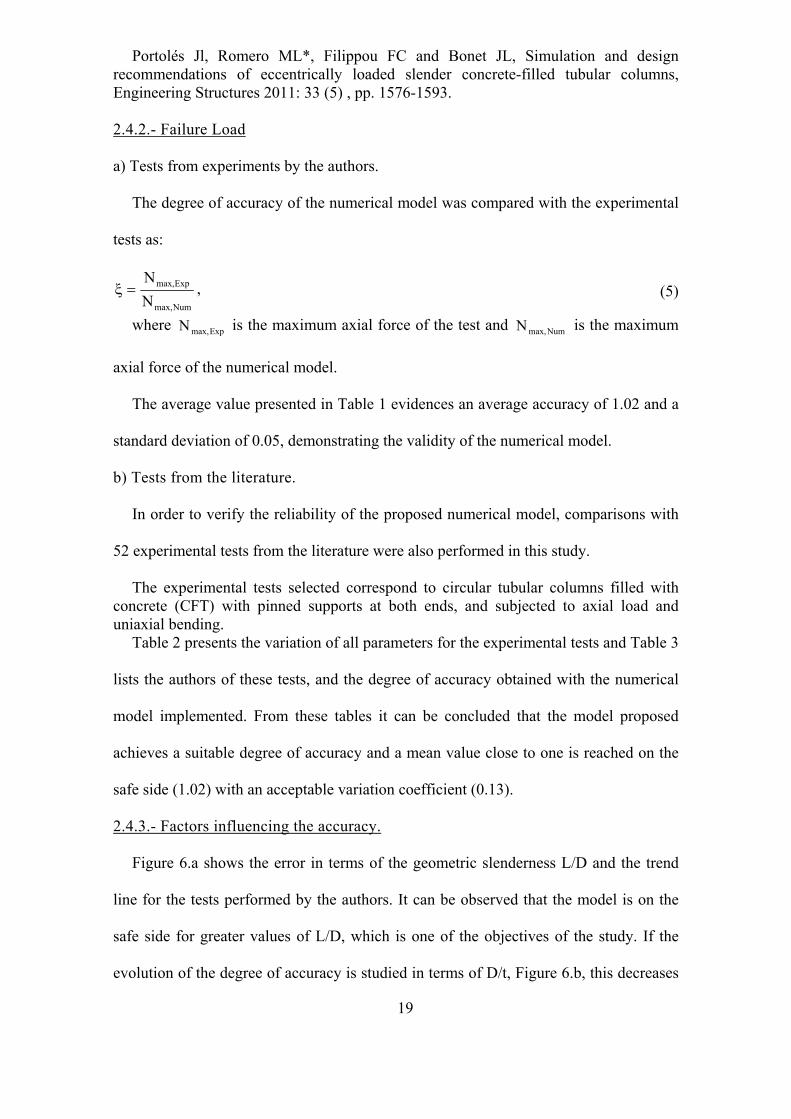
2.4.2.- Failure Load
a) Tests from experiments by the authors.
The degree of accuracy of the numerical model was compared with the experimental
tests as:
Nummax,
Expmax,
N
N , (5)
where Expmax,N is the maximum axial force of the test and Nummax,N is the maximum
axial force of the numerical model.
The average value presented in Table 1 evidences an average accuracy of 1.02 and a
standard deviation of 0.05, demonstrating the validity of the numerical model.
b) Tests from the literature.
In order to verify the reliability of the proposed numerical model, comparisons with
52 experimental tests from the literature were also performed in this study.
The experimental tests selected correspond to circular tubular columns filled with concrete (CFT) with pinned supports at both ends, and subjected to axial load and uniaxial bending.
Table 2 presents the variation of all parameters for the experimental tests and Table 3
lists the authors of these tests, and the degree of accuracy obtained with the numerical
model implemented. From these tables it can be concluded that the model proposed
achieves a suitable degree of accuracy and a mean value close to one is reached on the
safe side (1.02) with an acceptable variation coefficient (0.13).
2.4.3.- Factors influencing the accuracy.
Figure 6.a shows the error in terms of the geometric slenderness L/D and the trend
line for the tests performed by the authors. It can be observed that the model is on the
safe side for greater values of L/D, which is one of the objectives of the study. If the
evolution of the degree of accuracy is studied in terms of D/t, Figure 6.b, this decreases
Portolés Jl, Romero ML*, Filippou FC and Bonet JL, Simulation and design recommendations of eccentrically loaded slender concrete-filled tubular columns, Engineering Structures 2011: 33 (5) , pp. 1576-1593.
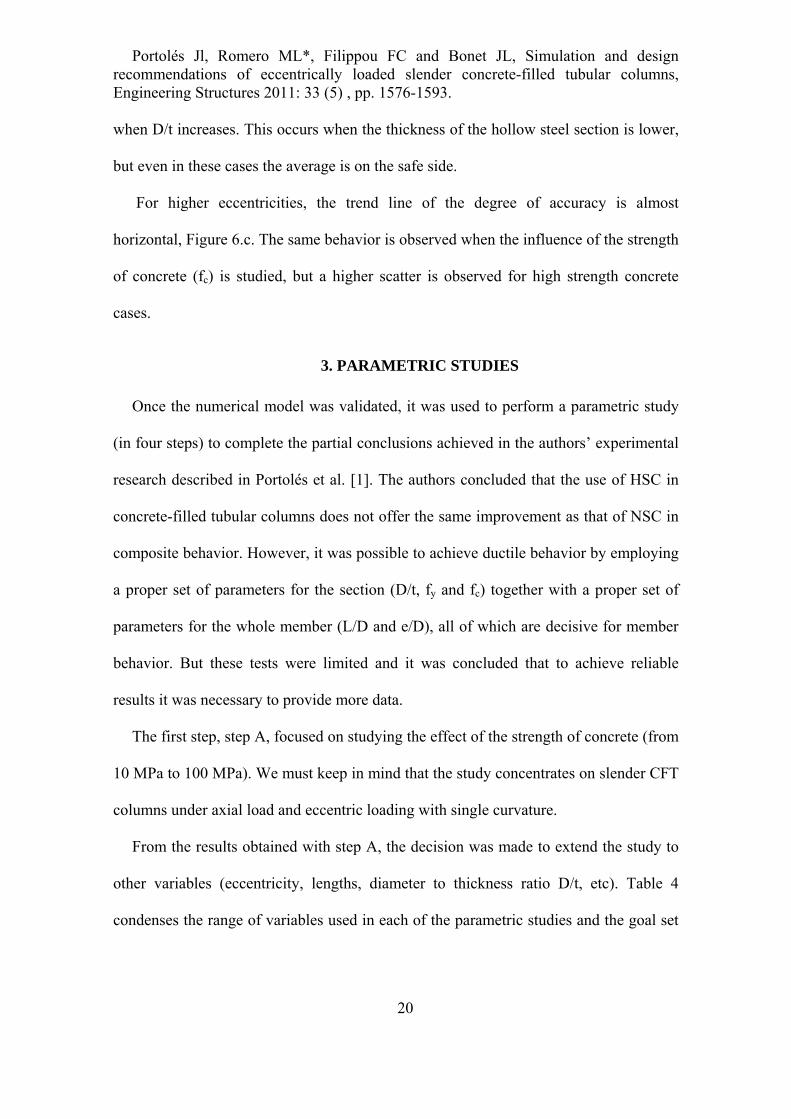
20
when D/t increases. This occurs when the thickness of the hollow steel section is lower,
but even in these cases the average is on the safe side.
For higher eccentricities, the trend line of the degree of accuracy is almost
horizontal, Figure 6.c. The same behavior is observed when the influence of the strength
of concrete (fc) is studied, but a higher scatter is observed for high strength concrete
cases.
3. PARAMETRIC STUDIES
Once the numerical model was validated, it was used to perform a parametric study
(in four steps) to complete the partial conclusions achieved in the authors’ experimental
research described in Portolés et al. [1]. The authors concluded that the use of HSC in
concrete-filled tubular columns does not offer the same improvement as that of NSC in
composite behavior. However, it was possible to achieve ductile behavior by employing
a proper set of parameters for the section (D/t, fy and fc) together with a proper set of
parameters for the whole member (L/D and e/D), all of which are decisive for member
behavior. But these tests were limited and it was concluded that to achieve reliable
results it was necessary to provide more data.
The first step, step A, focused on studying the effect of the strength of concrete (from
10 MPa to 100 MPa). We must keep in mind that the study concentrates on slender CFT
columns under axial load and eccentric loading with single curvature.
From the results obtained with step A, the decision was made to extend the study to
other variables (eccentricity, lengths, diameter to thickness ratio D/t, etc). Table 4
condenses the range of variables used in each of the parametric studies and the goal set
Portolés Jl, Romero ML*, Filippou FC and Bonet JL, Simulation and design recommendations of eccentrically loaded slender concrete-filled tubular columns, Engineering Structures 2011: 33 (5) , pp. 1576-1593.
21
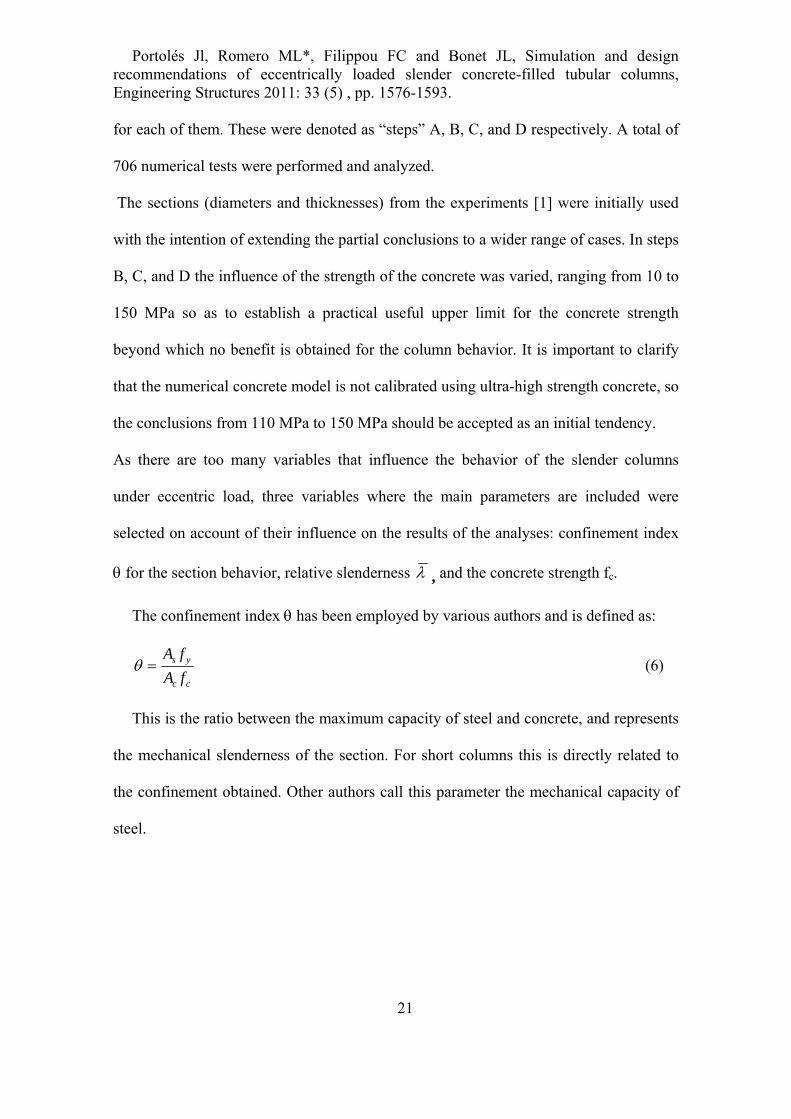
for each of them. These were denoted as “steps” A, B, C, and D respectively. A total of
706 numerical tests were performed and analyzed.
The sections (diameters and thicknesses) from the experiments [1] were initially used
with the intention of extending the partial conclusions to a wider range of cases. In steps
B, C, and D the influence of the strength of the concrete was varied, ranging from 10 to
150 MPa so as to establish a practical useful upper limit for the concrete strength
beyond which no benefit is obtained for the column behavior. It is important to clarify
that the numerical concrete model is not calibrated using ultra-high strength concrete, so
the conclusions from 110 MPa to 150 MPa should be accepted as an initial tendency.
As there are too many variables that influence the behavior of the slender columns
under eccentric load, three variables where the main parameters are included were
selected on account of their influence on the results of the analyses: confinement index
for the section behavior, relative slenderness , and the concrete strength fc.
The confinement index has been employed by various authors and is defined as:
cc
ys
fA
fA (6)
This is the ratio between the maximum capacity of steel and concrete, and represents
the mechanical slenderness of the section. For short columns this is directly related to
the confinement obtained. Other authors call this parameter the mechanical capacity of
steel.

Portolés Jl, Romero ML*, Filippou FC and Bonet JL, Simulation and design recommendations of eccentrically loaded slender concrete-filled tubular columns, Engineering Structures 2011: 33 (5) , pp. 1576-1593.
22
The relative slenderness defined in Eurocode 4 is used (instead of L/D) because it
includes not only the geometric but also the material properties:
2
2
L
EI
fAfA
N
N yscc
cr
pl
(7)
where EI = EsIs+ 0.6Ecm.Ic
and Is and Ic are the second moment of inertia of the steel tube and the concrete core
respectively; Es is the modulus of elasticity of steel; and Ecm is the secant modulus of
elasticity of concrete.
4. FAILURE LOAD
Figure 7 shows the graphs for maximum load in terms of fc, and , for sections
with an external diameter of D = 100 mm and a thickness of 3 and 5 mm respectively
(C100-3, C100-5).
In these graphs, the lines (dashed or continuous) represent the numerical simulation
of the parametric study Step A, while the isolated points correspond to the tests, the data
of which can be obtained from the table of experiments included in the section 2. This
first parametric study (A) is an extension of the experimental tests (37 cases) with more
numerical cases where the strength of concrete varies up to 100 MPa (132 cases).
A satisfactory adjustment is observed between the experiments and the tests as was
previously stated.
The general tendency of the curves from Figure 7a) to Figure 7b) is as expected:
when the eccentricity or the length is increased the maximum load is reduced. In
addition, in these numerical test simulations, when the thickness of the tube or the

Portolés Jl, Romero ML*, Filippou FC and Bonet JL, Simulation and design recommendations of eccentrically loaded slender concrete-filled tubular columns, Engineering Structures 2011: 33 (5) , pp. 1576-1593.
23
strength of the concrete is increased, the load is increased, although this latest increment
is lower when high strength concrete is introduced.
It is also interesting to observe that in the cases where there is more eccentricity
(e = 50 mm) and/or length (L = 3 m), there is only a slight difference between the
maximum load from 50 MPa to 100 MPa of concrete, Figure 7a) and b). This seems to
indicate that failure is due to the steel tube and that increasing the concrete strength
would have barely any effect, so that an expensive HSC might be no more useful than
NSC. But since it is not clear whether any value of the strength of the concrete (fc) is
reached where the failure load does not increase, an extension to 150 MPa is needed.
From Figures 7a) to d) and with the limitation that only two eccentricities and two
lengths are analyzed, it seems that, regardless of the thicknesses, length has a greater
influence than eccentricity on the failure load. Only with confinement indexes () lower
than one is there a small increment of Nmax. The same conclusion can be reached if the
influence of relative slenderness is studied, Figures 7e) and 6f).
To understand these graphs it is important to bear in mind that with the same hollow
tube filled with different concretes, the one with higher strength concrete has higher
relative slenderness. From these last figures it can be also noted that an increase in
eccentricity has a greater effect in the cases of 2 meters (continuous lines) than in the
cases of 3 m (dashed lines). This is because second order effects and imperfections are
lower for the shorter columns.
5. CONCRETE CONTRIBUTION RATIO
One of the objectives of this paper was to establish the importance of the use of high
strength concrete compared with that of normal strength concrete. To do so, the

Portolés Jl, Romero ML*, Filippou FC and Bonet JL, Simulation and design recommendations of eccentrically loaded slender concrete-filled tubular columns, Engineering Structures 2011: 33 (5) , pp. 1576-1593.
24
concrete contribution ratio (CCR) is defined as the ratio between the maximum
numerical load (Nmax,num) of the composite column and the empty hollow steel member,
(Nmax, num, hollow):
hollownum
num
N
NCCR
,max,
max, (8)
Nmax, num, hollow which is obtained from an identical model but with only steel fibers.
There are no effects of local buckling because in all the cases a minimum thickness was
required to avoid local buckling in accordance with Eurocodes 3 and 4.
The concrete contribution ratio (CCR) obtained in parametric study A for the cases
with a diameter D = 100 mm is presented in Figure 8, while Figure 9 shows the cases
with length L = 3 m as an alternative.
Although these figures are similar in aspect to those in Figure 7, they contribute more
information since they denote the benefits which could be achieved by using concrete-
filled columns rather than bare steel columns. It can be inferred from these that if the
strength of concrete (fc) increases, the confinement index () decreases, and the CCR
consequently increases. However, this relationship is not linear and tends to a horizontal
asymptote for higher values of the strength of concrete. Therefore, the benefits from the
use of HSC are reduced drastically.
In addition, if the length of the column (L) or the eccentricity increases, with the D/t
ratio maintained constant, the CCR is reduced, this reduction being more perceptible for
HSC. This statement is in agreement with the observations from the experiments.
Also, for lower ratios of D/t (higher thicknesses), enhancement with respect to the
hollow steel tube is not as high, Figure 8b). The reason for this is that the concrete core
makes less of a mechanical contribution to the composite behavior. It is for this reason
Portolés Jl, Romero ML*, Filippou FC and Bonet JL, Simulation and design recommendations of eccentrically loaded slender concrete-filled tubular columns, Engineering Structures 2011: 33 (5) , pp. 1576-1593.
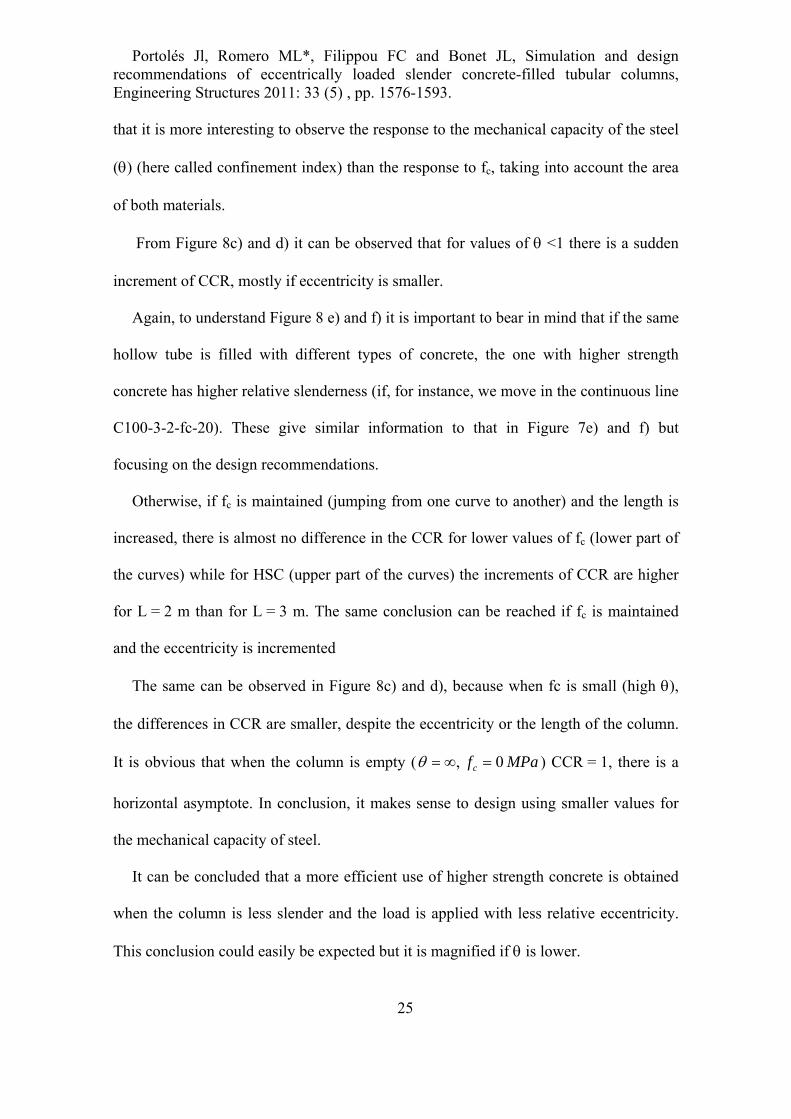
25
that it is more interesting to observe the response to the mechanical capacity of the steel
() (here called confinement index) than the response to fc, taking into account the area
of both materials.
From Figure 8c) and d) it can be observed that for values of <1 there is a sudden
increment of CCR, mostly if eccentricity is smaller.
Again, to understand Figure 8 e) and f) it is important to bear in mind that if the same
hollow tube is filled with different types of concrete, the one with higher strength
concrete has higher relative slenderness (if, for instance, we move in the continuous line
C100-3-2-fc-20). These give similar information to that in Figure 7e) and f) but
focusing on the design recommendations.
Otherwise, if fc is maintained (jumping from one curve to another) and the length is
increased, there is almost no difference in the CCR for lower values of fc (lower part of
the curves) while for HSC (upper part of the curves) the increments of CCR are higher
for L = 2 m than for L = 3 m. The same conclusion can be reached if fc is maintained
and the eccentricity is incremented
The same can be observed in Figure 8c) and d), because when fc is small (high ),
the differences in CCR are smaller, despite the eccentricity or the length of the column.
It is obvious that when the column is empty ( MPafc 0, ) CCR = 1, there is a
horizontal asymptote. In conclusion, it makes sense to design using smaller values for
the mechanical capacity of steel.
It can be concluded that a more efficient use of higher strength concrete is obtained
when the column is less slender and the load is applied with less relative eccentricity.
This conclusion could easily be expected but it is magnified if is lower.

Portolés Jl, Romero ML*, Filippou FC and Bonet JL, Simulation and design recommendations of eccentrically loaded slender concrete-filled tubular columns, Engineering Structures 2011: 33 (5) , pp. 1576-1593.
26
In comparison with previous figures, Figure 9a) to e) present the concrete
contribution ratio (CCR) of the cases with L = 3 m of the parametric study A, but for all
types of section (C100-3, C100-5, C125-5, C160-6).
It can be inferred that if the diameter is maintained but D/t is increased, the CCR is
increased, which indicates that the contribution of the concrete is higher because of the
difference between the composite column and the empty hollow column. However, the
effect of increasing the diameter has a greater influence than that of increasing the
thickness. Thus, the CCR of the series with a C160-6 section (D = 160 mm and
t = 6 mm) is higher than the series with the C100-3 section despite the fact that the D/t
of C160-6 is lower than the C100-3.
As a design recommendation it could be concluded that to make better use of the
HSC and obtain a higher CCR it is more influential to select a lower L/D than a higher
D/t, meaning that the variables which affect the beam-column behavior are more
important than the variables that affect the section behavior.
Figure 9 demonstrates the advantage of using greater diameters (lower L/D), as the
slope of the CCR is higher and the use of HCS is more interesting.
In addition, parametric studies B, C, and D were performed to study the effect of e/D,
L, and D/t respectively. Figure 10 a) and b) show the evolution of the CCR for relative
eccentricities e/D = 0.1, 0.2,…, 0.6 in terms of fc. The strength of concrete (fc) was
varied up to 150 MPa and the asymptote was still not achieved, although it seems that it
is closer for cases of C100-3 than for the larger sections (C160-6). In any case, as the
increment in the maximum load (or CCR) is small it appears to be more convenient to
use medium strength concrete since higher strength concrete is very expensive to use
and does not provide any benefits. Again, it is important to remember that the numerical

Portolés Jl, Romero ML*, Filippou FC and Bonet JL, Simulation and design recommendations of eccentrically loaded slender concrete-filled tubular columns, Engineering Structures 2011: 33 (5) , pp. 1576-1593.
27
concrete model from Hajjar and Gourley [52] is not calibrated for strengths of concrete
higher than 100 MPa, so the conclusions for CCR and SI from 110 MPa to 150 MPa
should be approached with caution.
Figure 10a) and b) (variation of the relative eccentricity) and Figure 10 c) and d)
(variation of the length) expand upon the results from parametric study A. If the relative
eccentricity or the length is increased, the CCR is reduced.
Figure 10a) and c) (on the left) show the evolution for a smaller section (D = 100,
t = 3), and Figure 10b) and d) (on the right) for a bigger section (D = 160, t = 5.7) .
If eccentricity or length are increased, the result is an increase in the total eccentricity
in the mid-span section, either an increase of first order eccentricity (e), or an increase
in second order eccentricity due to the second order bending moments arising from the
displacement of the central section of the column. Clearly, if the section is smaller
(D = 100 mm), second order effects are more important than in the much larger section
(D = 160 mm), because it has a higher geometric slenderness L/D.
It is interesting to notice that for relatively small eccentricities and higher diameters
of the columns, the enhancement of the CFT column can be double that of the empty
hollow steel column, even using HSC.
In conclusion, if the total eccentricity is great, either first order (e/D) or second order
(L/D), the mid-span section is subjected to a higher bending moment. Thus, there is a
higher part of the section under tensile forces, so failure occurs early on. A possible
solution could be to increase the tension resistance of the section using steel fiber
concrete or introducing reinforcements.
The results of parametric study D (variation of D/t) are presented in Figure 11.
Portolés Jl, Romero ML*, Filippou FC and Bonet JL, Simulation and design recommendations of eccentrically loaded slender concrete-filled tubular columns, Engineering Structures 2011: 33 (5) , pp. 1576-1593.
28
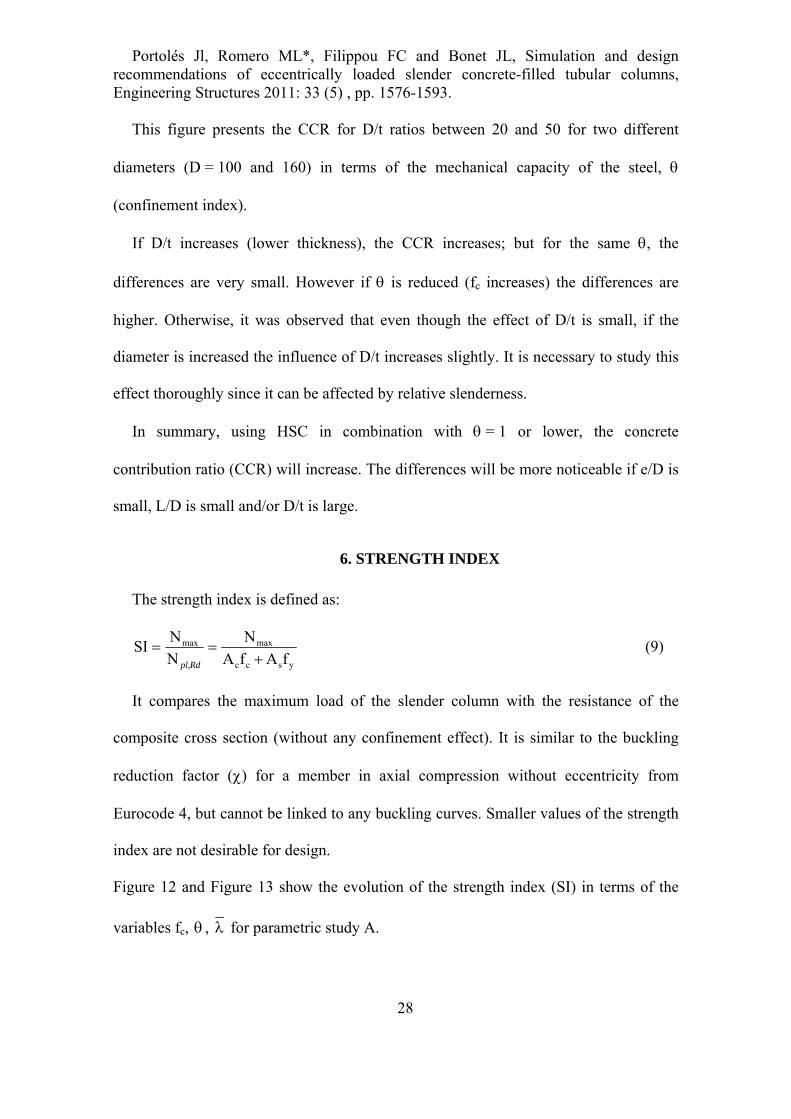
This figure presents the CCR for D/t ratios between 20 and 50 for two different
diameters (D = 100 and 160) in terms of the mechanical capacity of the steel,
(confinement index).
If D/t increases (lower thickness), the CCR increases; but for the same , the
differences are very small. However if is reduced (fc increases) the differences are
higher. Otherwise, it was observed that even though the effect of D/t is small, if the
diameter is increased the influence of D/t increases slightly. It is necessary to study this
effect thoroughly since it can be affected by relative slenderness.
In summary, using HSC in combination with = 1 or lower, the concrete
contribution ratio (CCR) will increase. The differences will be more noticeable if e/D is
small, L/D is small and/or D/t is large.
6. STRENGTH INDEX
The strength index is defined as:
yscc
maxmax
fΑfΑ
Ν
Ν
ΝSI
Rdpl,
(9)
It compares the maximum load of the slender column with the resistance of the
composite cross section (without any confinement effect). It is similar to the buckling
reduction factor () for a member in axial compression without eccentricity from
Eurocode 4, but cannot be linked to any buckling curves. Smaller values of the strength
index are not desirable for design.
Figure 12 and Figure 13 show the evolution of the strength index (SI) in terms of the
variables fc, , for parametric study A.
Portolés Jl, Romero ML*, Filippou FC and Bonet JL, Simulation and design recommendations of eccentrically loaded slender concrete-filled tubular columns, Engineering Structures 2011: 33 (5) , pp. 1576-1593.
29
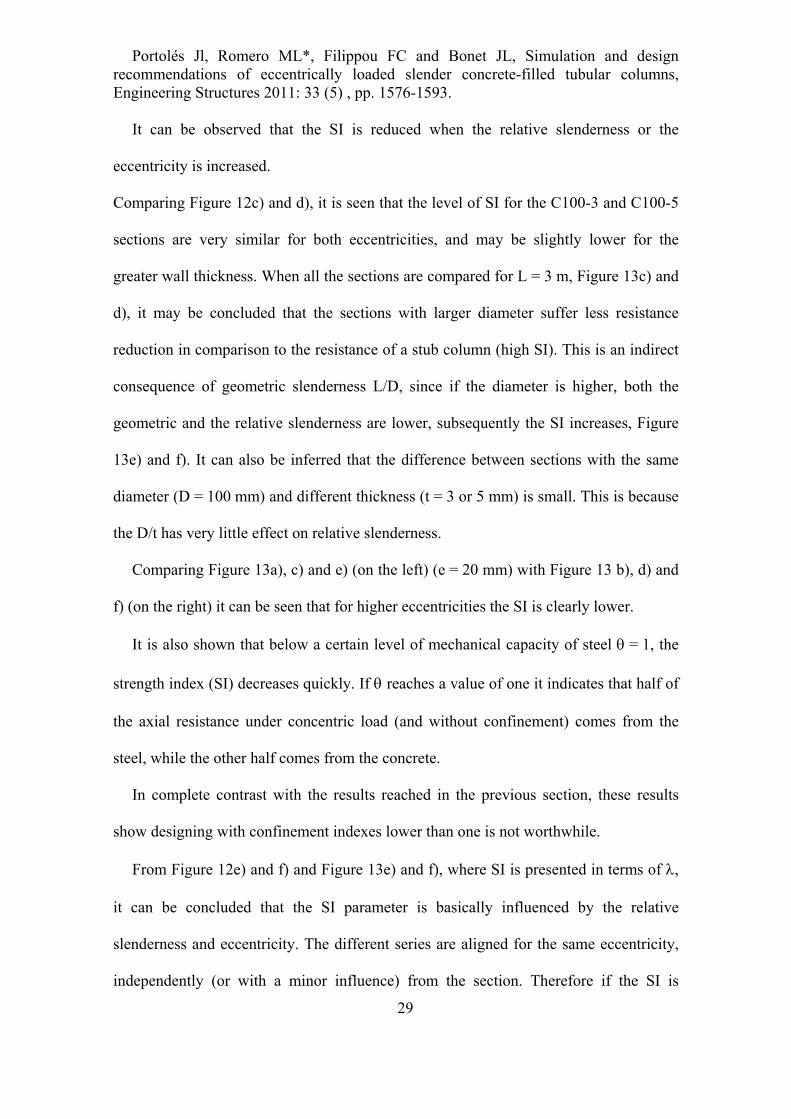
It can be observed that the SI is reduced when the relative slenderness or the
eccentricity is increased.
Comparing Figure 12c) and d), it is seen that the level of SI for the C100-3 and C100-5
sections are very similar for both eccentricities, and may be slightly lower for the
greater wall thickness. When all the sections are compared for L = 3 m, Figure 13c) and
d), it may be concluded that the sections with larger diameter suffer less resistance
reduction in comparison to the resistance of a stub column (high SI). This is an indirect
consequence of geometric slenderness L/D, since if the diameter is higher, both the
geometric and the relative slenderness are lower, subsequently the SI increases, Figure
13e) and f). It can also be inferred that the difference between sections with the same
diameter (D = 100 mm) and different thickness (t = 3 or 5 mm) is small. This is because
the D/t has very little effect on relative slenderness.
Comparing Figure 13a), c) and e) (on the left) (e = 20 mm) with Figure 13 b), d) and
f) (on the right) it can be seen that for higher eccentricities the SI is clearly lower.
It is also shown that below a certain level of mechanical capacity of steel = 1, the
strength index (SI) decreases quickly. If reaches a value of one it indicates that half of
the axial resistance under concentric load (and without confinement) comes from the
steel, while the other half comes from the concrete.
In complete contrast with the results reached in the previous section, these results
show designing with confinement indexes lower than one is not worthwhile.
From Figure 12e) and f) and Figure 13e) and f), where SI is presented in terms of ,
it can be concluded that the SI parameter is basically influenced by the relative
slenderness and eccentricity. The different series are aligned for the same eccentricity,
independently (or with a minor influence) from the section. Therefore if the SI is

Portolés Jl, Romero ML*, Filippou FC and Bonet JL, Simulation and design recommendations of eccentrically loaded slender concrete-filled tubular columns, Engineering Structures 2011: 33 (5) , pp. 1576-1593.
30
presented (for all the numerical tests in parametric study A) in terms of , together with
European buckling curve a, as in Figure 14, the cases with the same eccentricity create
parallel curves. The rest of the cases from parametric studies B, C, and D are in
agreement with this result, but are not presented to avoid complication.
7. DESIGN RECOMMENDATIONS
Portolés et al. [1] stated (using only the experiments) that the tendency of the CCR is
a combination of the relative slenderness (which includes the fc) and the confinement
index, but that more experimental cases or a numerical parametric study were needed to
reach a reliable conclusion.
In the previous section two opposing behaviors were observed. The values of <1
reduce the strength index SI drastically, while the best CCR values are achieved for
<1.
One way to establish the optimum is by using the product of both parameters
CCR*SI. Figure 15 shows the effect of on this product for parametric studies B
(variation of e/D), C (variation of L), and D (variation of D/t). The general response is
that a maximum is reached for values of lower than one. The exact value of the
maximum depends on the eccentricity and the geometric slenderness, which will be
more pronounced for small eccentricities and smaller lengths. If the length or
eccentricity is high, the product CCR*SI is almost constant for larger values of , and is
reduced quickly for <1 (for all cases).
In addition, an increase in D/t (lower thickness) increases the product CCR*SI,
signaling that there is a particular value of D/t which maximizes it, providing that <1,
as in Figure 15d) and e).

Portolés Jl, Romero ML*, Filippou FC and Bonet JL, Simulation and design recommendations of eccentrically loaded slender concrete-filled tubular columns, Engineering Structures 2011: 33 (5) , pp. 1576-1593.
31
The results show that for slender elements the optimum design (with respect to the
contribution of the concrete) is achieved when the mechanical capacity of the steel is
slightly lower than the mechanical capacity of the concrete contribution (1).
As the typical data in the practical design are the length (L), axial load (Nd), bending
moment (Md) and fy, the following steps could be followed to pre-design the columns:
- Calculate the first order eccentricity e = Md/Nd.
- Obtain the diameter of steel necessary to resist half the axial load (Nd/2) using the
lower thickness of a series (t) which avoids local buckling. The diameter must be
the maximum allowed by architectural requirements.
- If e/D is large, increase the diameter and correct the thickness.
- Obtain the corresponding fc to obtain the rest of the axial resistance (Nd/2).
8. CONCLUSIONS
In this paper an efficient numerical model was calibrated in order to perform an
extended parametric study. It has been developed in order to propose some design
recommendations, whose main objectives are to establish the importance of the use of
high strength concrete.
An existing beam finite element model with geometric nonlinearity for the simulation of
the nonlinear buckling behavior of slender circular CFT column was validated. The
model was applied to high strength columns with medium and high eccentricities.
To represent the second order effects along the column length this was subdivided
into four elements and the co-rotational formulation was used for the transformation of
the nodal variables. A section discretization with 2 fibers for the steel tube and 8 fibers
for the concrete in the radial direction, with 16 fibers in the circumferential direction

Portolés Jl, Romero ML*, Filippou FC and Bonet JL, Simulation and design recommendations of eccentrically loaded slender concrete-filled tubular columns, Engineering Structures 2011: 33 (5) , pp. 1576-1593.
32
provided highly accurate results. Despite the lack of a large number of fibers the model
proved to be very efficient computationally because of the uniaxial stress-strain relation
used for the constituent materials. Furthermore, it proved numerically robust.
The validation of the model against the available experimental data shows that the
increase in concrete strength due to confinement by the tube is negligible for slender
columns with medium to high eccentricity of the applied axial load. The confinement
plays an important role for the descending post-peak behavior of the columns. This
effect is captured well by the uniaxial confined concrete model of Hajjar and Gourley
[52].
The initial imperfection of the slender column plays an important role when
determining the buckling load. The correlation studies show that a sine wave with
maximum eccentricity of L/600 produces the best match.
This model is therefore an ideal tool for conducting parametric studies to derive
design recommendations for slender circular CFT columns.
This paper focuses on studying the influence the variables which affect the beam-
column behavior and the variables which affect the section behavior have on global
buckling behavior in this type of column.
The results show that for slender elements the optimum design (with respect to the
contribution of the concrete) is reached when the mechanical capacity of the steel is
slightly lower than the mechanical capacity of the concrete contribution.
As a design recommendation, it could be concluded that to make better use of the
HSC and get a higher CCR it is more effective to select lower L/D and lower e/D than
higher D/t, which means that the variables that affect the beam-column behavior are
more important than the variables that affect the section behavior.
Portolés Jl, Romero ML*, Filippou FC and Bonet JL, Simulation and design recommendations of eccentrically loaded slender concrete-filled tubular columns, Engineering Structures 2011: 33 (5) , pp. 1576-1593.
33
It appears to be more suitable to use medium strength concrete since higher strength
is very expensive to use and does not provide sufficient benefits.
Further work should be carried out to study possible solutions for increasing the
tension resistance of the section using steel fiber concrete or reinforcement bars.
In summary, when employing HSC in combination with = 1 or slightly lower, the
concrete contribution ratio (CCR) will increase. The differences will be more noticeable
if e/D is small, L/D is small and/or D/t is large.
ACKNOWLEDGEMENTS
The authors wish to express their sincere gratitude to the Spanish “Ministerio de
Educación” for help provided with project BIA2005_255, and to the Spanish
“Ministerio de Ciencia e Innovación” with project BIA2009-09411, to the European
Community for FEDER funds, and to the Fundació Caixa Castelló- Bancaixa.
REFERENCES
[1] Portolés J.M., Romero M.L., Bonet J.L. and Filippou F.C., Experimental study of
high strength concrete-filled circular tubular columns under eccentric loading, Journal of Constructional Steel Research 2010; 67:623-633.
[2] European Committee of Standardization. EN 1994-1-1:2004 Eurocode 4: Design of composite steel and concrete structures Part 1-1: General rules and rules for buildings. 2004.
[3] Johansson M., Gylltoft K. Structural behaviour of slender circular steel- concrete composite columns under various means of load application. Steel and Composite Structures 2001; 1(4):393-410.
[4] Johansson, M. Composite Action and Confinement Effects in Tubular Steel-Concrete Columns. Department of Structural Engineering, Chalmers University of Technology, Doctoral Thesis, Publication 02:8, Göteborg, Sweden, November 2002, 173 pp.
[5] Zeghiche J, Chaoui K. An experimental behaviour of concrete-filled steel tubular columns. J Construct Steel Res 2005; 61(1): 53-66.
[6] O’Shea MD, Bridge RQ. Design of circular thin-walled concrete filled steel tubes. J Struct Eng 2000; 126(11):1295-1303.

Portolés Jl, Romero ML*, Filippou FC and Bonet JL, Simulation and design recommendations of eccentrically loaded slender concrete-filled tubular columns, Engineering Structures 2011: 33 (5) , pp. 1576-1593.
34
[7] Han L.H., Tests on concrete filled steel tubular columns with high slenderness ratio, Advances in Structural Engineering 2000; 3(4): 337-344.
[8] Sakino K, Nakahara H, Morino S, Nishiyama A, Behavior of centrally loaded concrete-filled steel-tube short columns, Journal of Structural Engineering-ASCE 2004; 130(2): 180-188.
[9] Fujimoto T, Mukai A, Nishiyama I. Behavior of eccentrically loaded concrete-filled steel tubular columns, Journal of Structural Engineering-ASCE 2004; 130(2): 203-212.
[10] Grauers M. Composite columns of hollow sections filled with high strength concrete. Research report. Chalmers University of Technology, Göteborg, 1993.
[11] Bergmann, R. Load introduction in composite columns filled with high strength concrete, Proceedings of the 6th International Symposium on Tubular Structures, Monash University, Melbourne, Australia, 1994.
[12] Varma AH, Ricles JM, Sause R, Lu L-W. Experimental behaviour of high strength square concrete-filled steel tube beam-columns. J Struct Eng ASCE 2002; 128(3):309-327.
[13] Spacone E, El-Tawil S, Nonlinear analysis of steel-concrete composite structures: State of the art, Journal of Structural Engineering-ASCE 2004; 130 (2): 159-168.
[14] Hajjar, J. F.; Gourley, B. C., A Cyclic Nonlinear Model for Concrete-Filled Tubes, Formulation, Journal of Structural Engineering-ASCE 1997; 123(6):736-744.
[15] M.L. Romero, J.L. Bonet, S. Ivorra, "A Review of Nonlinear Analysis Models for Concrete Filled Tubular Columns", in B.H.V. Topping, (Editor), "Innovation in Civil and Structural Engineering Computing", Saxe-Coburg Publications, Stirlingshire, UK, Chapter 6, pp 119-142, 2005. doi:10.4203/csets.13.6.
[16] De Sousa JBM, Caldas RB, Numerical analysis of composite steel-concrete columns of arbitrary cross section, Journal of Structural Engineering-ASCE 2005;131(11): 1721-1730.
[17] Hajjar, J. F., Schiller, P. H., and Molodan, A. A Distributed Plasticity Model for Concrete-Filled Steel Tube Beam-Columns with Interlayer Slip, Engineering Structures 1998; 20(8): 663-676.
[18] Spacone E, Filippou F, Taucer F. Fibre beam-column model for non-linear analysis of R/C frames. Part 1. Formulation. Earthquake Engineering & Structural Dynamics 1996; 25(7):711-725.
[19] Neuenhofer A, Filippou FC, Geometrically nonlinear flexibility-based frame finite element, Journal of structural engineering-ASCE 1998; 124 (6): 704-711.
[20] De Souza, R. M., "Force-Based Finite Element for Large Displacement Inelastic Analysis of Frames", Ph.D. Dissertation, University of California at Berkeley, Berkeley, CA, 2000.
[21] Valipour H, Foster S. Nonlinear static and cyclic analysis of concrete-filled steel columns. Journal of Constructional Steel Research 2010; 66(6):793-802.
[22] Ayoub A, Filippou F. Mixed formulation of nonlinear steel-concrete composite beam element. Journal of structural engineering 2000; 126(3):371-381.
[23] Limkatanyu S, Spacone E. Reinforced concrete frame element with bond interfaces. I: Displacement-based, force-based, and mixed formulations. Journal of structural engineering-ASCE 2002; 128(3):346-355.

Portolés Jl, Romero ML*, Filippou FC and Bonet JL, Simulation and design recommendations of eccentrically loaded slender concrete-filled tubular columns, Engineering Structures 2011: 33 (5) , pp. 1576-1593.
35
[24] Spacone E, Ciampi V, Filippou FC., Mixed formulation of nonlinear beam finite-element, Computers & Structures 1996; 58(1):71-83.
[25] Taylor R, Filippou F, Saritas A, Auricchio F., Mixed finite element method for beam and frame problems. Computational mechanics 2003; 31(1-2):192-203.
[26] Pi YL, Bradford MA, Uy B. Second order nonlinear inelastic analysis of composite steel-concrete members. I: Theory, Journal of Structural Engineering-ASCE 2006; 132 (5): 751-761.
[27] Tort C, Hajjar J. Mixed Finite-Element Modeling of Rectangular Concrete-Filled Steel Tube Members and Frames under Static and Dynamic Loads. Journal of structural engineering 2010;136(6):654-664.
[28] S. Mazzoni, F. McKenna, M.H. Scott, and G.L. Fenves, Open System for Earthquake Engineering Simulation. User Command-Language Manual, Berkeley, CA: Pacific Earthquake Engineering Research Center. University of California, Berkeley, 2009.
[29] F. Filippou and M. Constantinides, FEDEASLab. Getting Started Guide and Simulation Examples. Technical Report NEESgrid-2004-22, Berkeley, CA: Civil and Environmental Eng. Dept. University of California at Berkeley, 2004.
[30] Gourley, B. C., Tort, C., Denavit, M. D., Schiller, P. H., and Hajjar, J. F. A Synopsis of Studies of the Monotonic and Cyclic Behavior of Concrete-Filled Steel Tube Beam-Columns, Report No. UILU-ENG-2008-1802, Newmark Structural Laboratory Report Series (ISSN 1940-9826), Department of Civil and Environmental Engineering, University of Illinois at Urbana-Champaign, Urbana, Illinois, April. 2008.
[31] European Committee of Standardization. EN 1994-1-1:2004 Eurocode 4: Design of composite steel and concrete structures Part 1-1: General rules and rules for buildings. 2004.
[32] Scott M, Franchin P, Fenves G, Filippou F. Response sensitivity for nonlinear beam-column elements. Journal of structural engineering 2004; 130(9):1281-1288.
[33] M.L. Romero, J.L. Bonet, S. Ivorra, A. Hospitaler, "A Numerical Study of Concrete Filled Tubular Columns with High Strength Concrete", in B.H.V. Topping, (Editor), "Proceedings of the Tenth International Conference on Civil, Structural and Environmental Engineering Computing", Civil-Comp Press, Stirlingshire, UK, Paper 45, 2005. doi:10.4203/ccp.81.45.
[34] Zeghiche J, Chaoui K, An experimental behaviour of concrete-filled steel tubular columns, Journal Of Constructional Steel Research 2005; 61 (1): 53-66.
[35] Rangan BV, Joyce M, Strength Of Eccentrically Loaded Slender Steel Tubular Columns Filled With High-Strength Concrete, ACI STRUCT J 1992; 89 (6): 676-681.
[36] Neogi, P.K.,Sen, H.K., Chapman J.C., Concrete-Filled Tubular Steel Columns under Eccentric Loading, Structural Engineer 1969; 47(5):187-195.
[37] Kilpatrick AE, Rangan BV, Influence of interfacial shear transfer on behavior of concrete-filled steel tubular columns, ACI STRUCT J 1999; 96 (4): 642-648.
[38] M. Menegotto and P.E. Pinto, “Method of analysis for cyclically loaded R.C. plane frames including changes in geometry and non-elastic behavior of elements under combined normal force and bending”, Proc-, IABSE. Symposium on

Portolés Jl, Romero ML*, Filippou FC and Bonet JL, Simulation and design recommendations of eccentrically loaded slender concrete-filled tubular columns, Engineering Structures 2011: 33 (5) , pp. 1576-1593.
36
Resistance and Ultimate Deformability of Structures Acted on by Well Defined Repeated Load, Lisbon: 1973.
[39] M. Tomii and K. Sakino, Elastoplastic behavior of concrete filled square steel tubular beam-columns, Transactions of the Architectural Institute of Japan. 1979; 111-122.
[40] Shams M, Saadeghvaziri M. Nonlinear response of concrete-filled steel tubular columns under axial loading. ACI structural journal 1999; 96(6):1009-1017.
[41] Susantha K, Ge H, Usami T. Uniaxial stress-strain relationship of concrete confined by various shaped steel tubes. Engineering structures 2001; 23(10):1331-1347.
[42] Hatzigeorgiou, G.D. Numerical model for the behavior and capacity of circular CFT columns, Part I: Theory. Engineering structures 2008; 30 (6): 1573-1578.
[43] Xiao Y, He W, Choi K. Confined concrete-filled tubular columns. Journal of structural engineering 2005; 131(3):488-497.
[44] Hu H, Huang C, Wu M, Wu Y. Nonlinear analysis of axially loaded concrete-filled tube columns with confinement effect. Journal of structural engineering-ASCE 2003; 129(10):1322-1329.
[45] F. Richart, A. Brandtzæg, and R. Brown, A study of the failure of concrete under combined compressive stresses, Bull 185, University of Illinois at Urbana Champaign, College of Engineering. Engineering Experiment Station., 1928.
[46] Nakahara H, Sakino K, Inai E. Analytical Model for Compressive Behavior of Concrete Filled Square Steel Tubular Columns. Transactions of the Japan Concrete Institute 1998; 20:171-178.
[47] Uy B. Strength of Concrete Filled Steel Box Columns Incorporating Local Buckling. Journal of Structural Engineering-ASCE 2000; 126(3): 341-352.
[48] Hatzigeorgiou, G.D. Numerical model for the behavior and capacity of circular CFT columns, Part II: Verification and extension. Engineering structures 2008; 30 (6): 1579-1589.
[49] Liang QQ. Nonlinear analysis of short concrete-filled steel tubular beam-columns under axial load and biaxial bending. Journal of Constructional Steel Research 2008; 64(3):295-304.
[50] Hu H, Huang C, Chen Z. Finite element analysis of CFT columns subjected to an axial compressive force and bending moment in combination. Journal of Constructional Steel Research 2005; 61(12):1692-1712.
[51] Liang QQ, Fragomeni S, Nonlinear analysis of circular concrete-filled steel tubular short columns under eccentric loading, Journal of Constructional Steel Research 2010; 66(2): 159-169.
[52] Hajjar, J., and Gourley. B. Representation of concrete-filled steel tube cross-section strength. Journal of Structural Engineering-ASCE 1996; 122 (11): 1327-1336.
[53] Liang QQ, Strength and ductility of high strength concrete-filled steel tubular beam-columns. Journal of Constructional Steel Research 2009; 65(3):687-698.
[54] Varma A, Sause R, Ricles J, Li Q. 2005. Development and validation of fiber model for high-strength square concrete-filled steel tube beam-columns. ACI structural journal 102(1):73-84.
[55] M. Collins, D. Mitchell, and J. MacGregor, Structural Design Considerations for High-Strength Concrete, Concrete International 1993; 15:27-34.

Portolés Jl, Romero ML*, Filippou FC and Bonet JL, Simulation and design recommendations of eccentrically loaded slender concrete-filled tubular columns, Engineering Structures 2011: 33 (5) , pp. 1576-1593.
37
[56] Romero M, Miguel P, Cano J. A parallel procedure for nonlinear analysis of reinforced concrete three-dimensional frames. Computers & Structures 2002; 80(16-17):1337-1350.
[57] Bonet J, Romero M, Miguel P, Fernandez M. A fast stress integration algorithm for reinforced concrete sections with axial loads and biaxial bending. Computers & structures 2004; 82(2-3):213-225.
[58] Comité Euro-international du Béton and Fédération Internationale de la Précontrainte, CEB-FIP model code 1990, T. Telford, 1993.
[59] T.V. Galambos and A.E. Surovek, Structural stability of steel, John Wiley and Sons, 2008.
Portolés Jl, Romero ML*, Filippou FC and Bonet JL, Simulation and design recommendations of eccentrically loaded slender concrete-filled tubular columns, Engineering Structures 2011: 33 (5) , pp. 1576-1593.
38
a) b)
Figure 1. Steel model a) Giuffre-Menegotto-Pinto model b) Force-displacement
response of the hollow column test C100-5-2-00-50.
0 1 2 3 4 5
x 10-3
0
50
100
150
200
250
300
350
400
e
s(M
Pa)
E=210 GPafy=322 MPa
Eh=10500 MPa
r=2.9
Giuffre-Menegotto-Pinto monotonic material
Portolés Jl, Romero ML*, Filippou FC and Bonet JL, Simulation and design recommendations of eccentrically loaded slender concrete-filled tubular columns, Engineering Structures 2011: 33 (5) , pp. 1576-1593.
39
a)
b)
Figure 2. Hajjar and Gourley [52] concrete model a) for different D/t ratios b) for
different strengths of concrete.
-5 0 5 10 15 20
x 10-3
0
10
20
30
40
50
60
70
80
90
100
fc=95.6MPaD/t=24
D/t=64
D/t=33.3
Concrete strain (MPa)
Co
ncre
testr
ess
(me)
-5 0 5 10 15 20
x 10-3
0
10
20
30
40
50
60
70
80
90
Concrete strain (MPa)
Concre
testr
ess
(me)
fc
=90MPa
fc
=60MPa
fc
=30MPa
D/t=33.3
Concrete Strain (10-3) Concrete Strain (10-3)
Con
cret
e S
tres
s (M
Pa)
Con
cret
e S
tres
s (M
Pa)
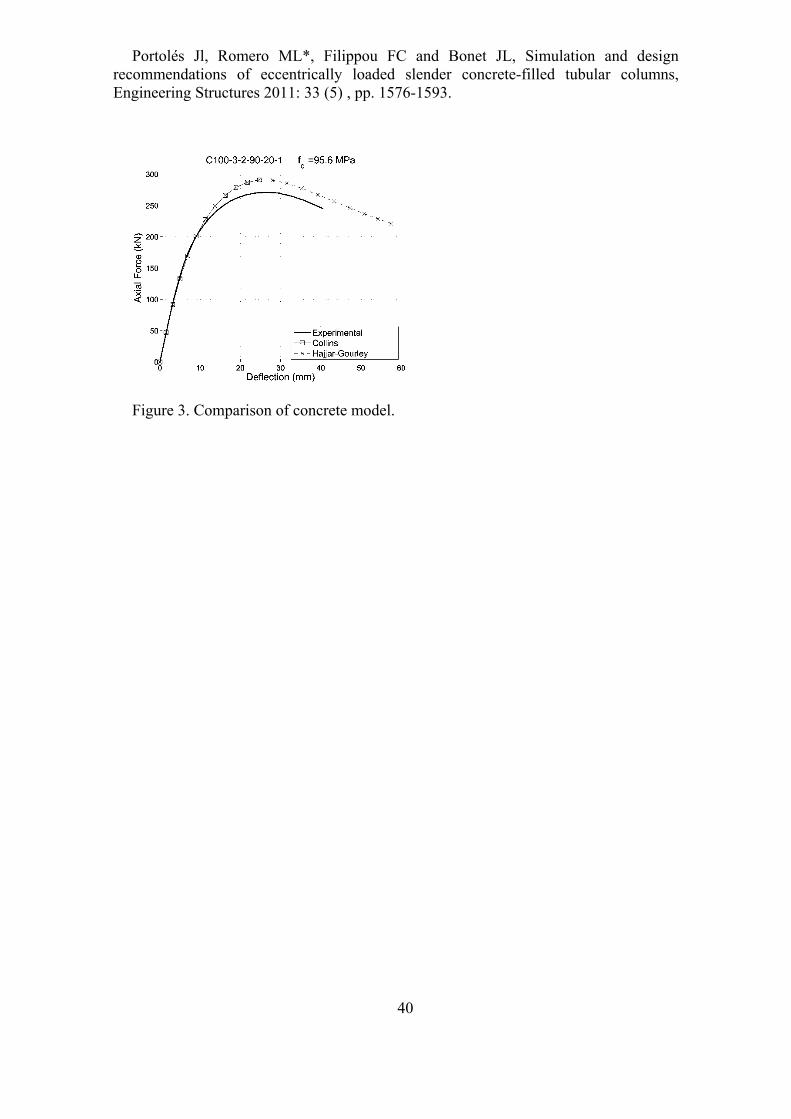
Portolés Jl, Romero ML*, Filippou FC and Bonet JL, Simulation and design recommendations of eccentrically loaded slender concrete-filled tubular columns, Engineering Structures 2011: 33 (5) , pp. 1576-1593.
40
Figure 3. Comparison of concrete model.
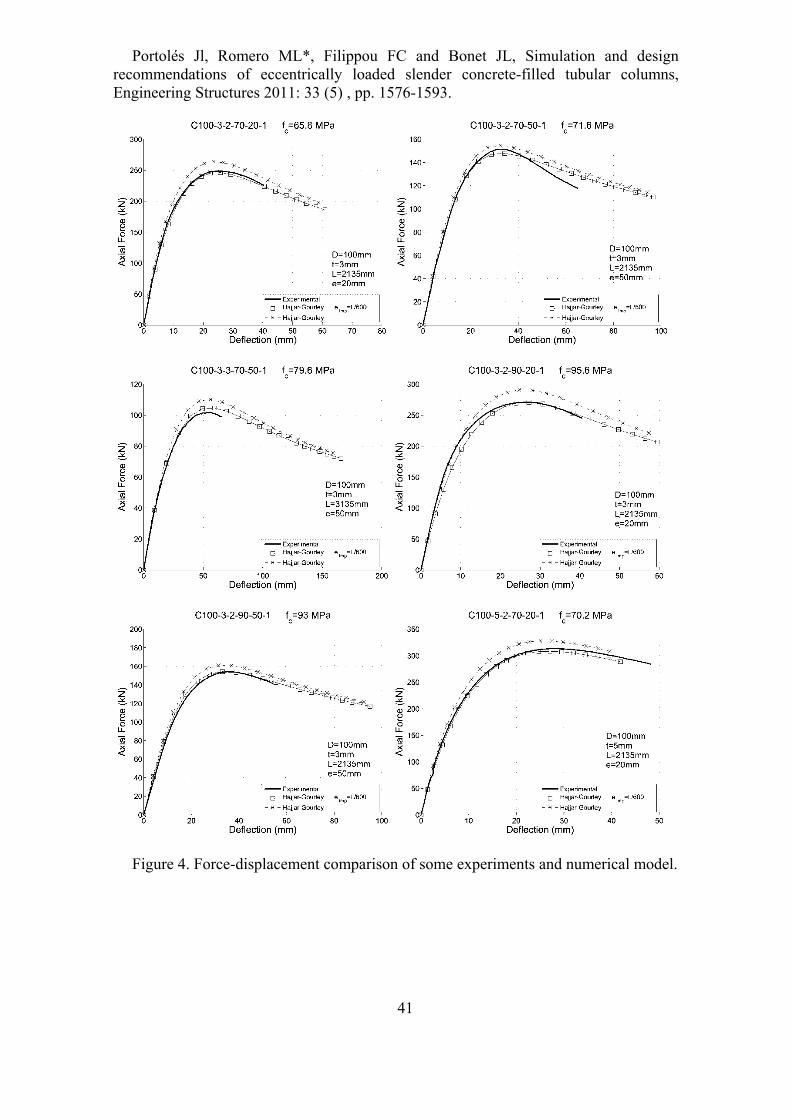
Portolés Jl, Romero ML*, Filippou FC and Bonet JL, Simulation and design recommendations of eccentrically loaded slender concrete-filled tubular columns, Engineering Structures 2011: 33 (5) , pp. 1576-1593.
41
Figure 4. Force-displacement comparison of some experiments and numerical model.
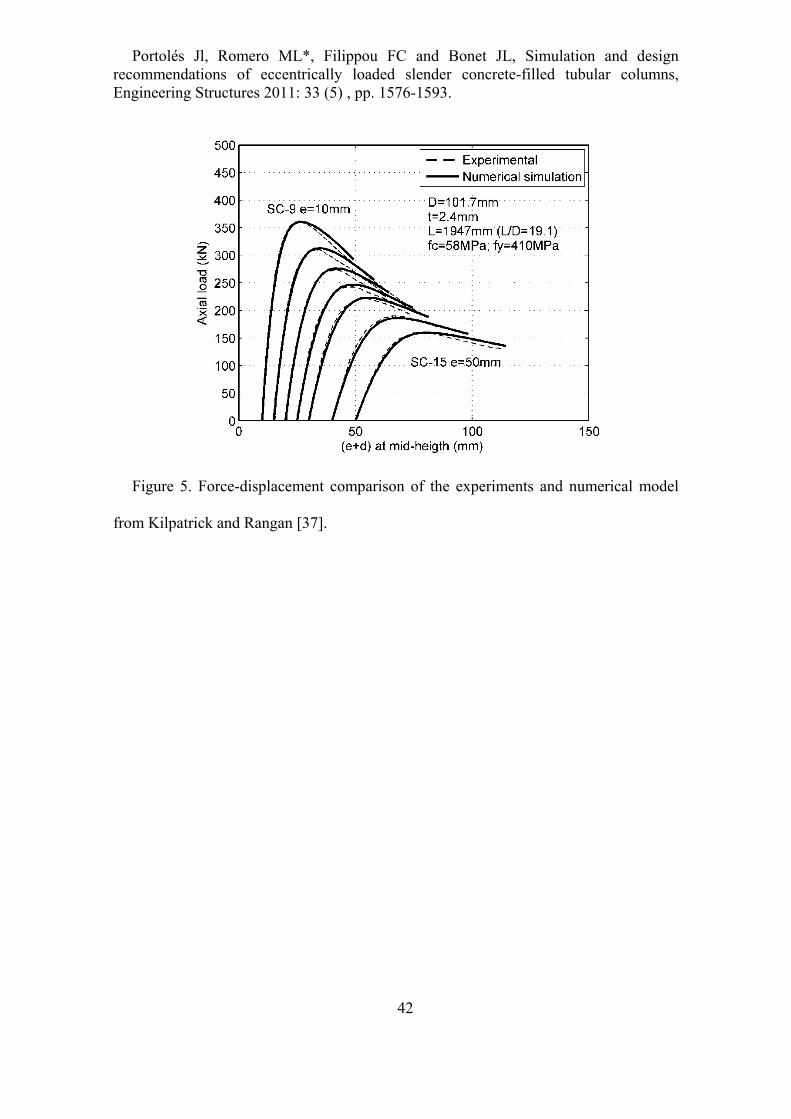
Portolés Jl, Romero ML*, Filippou FC and Bonet JL, Simulation and design recommendations of eccentrically loaded slender concrete-filled tubular columns, Engineering Structures 2011: 33 (5) , pp. 1576-1593.
42
Figure 5. Force-displacement comparison of the experiments and numerical model
from Kilpatrick and Rangan [37].

Portolés Jl, Romero ML*, Filippou FC and Bonet JL, Simulation and design recommendations of eccentrically loaded slender concrete-filled tubular columns, Engineering Structures 2011: 33 (5) , pp. 1576-1593.
43
(a) (b)
(c) (d)
Figure 6. Scatter in terms of: a) Geometric Slenderness L/D, b) Diameter to thickness
ratio D/t, c) Relative eccentricity e/D, d) Strength of concrete fc (MPa).
0.85
0.90
0.95
1.00
1.05
1.10
1.15
18 23 28 33
L/D
0.85
0.90
0.95
1.00
1.05
1.10
1.15
18 23 28 33 38
D/t
0.85
0.90
0.95
1.00
1.05
1.10
1.15
0.10 0.20 0.30 0.40 0.50 0.60e/D
0.85
0.90
0.95
1.00
1.05
1.10
1.15
0 50 100 150
fc (MPa)
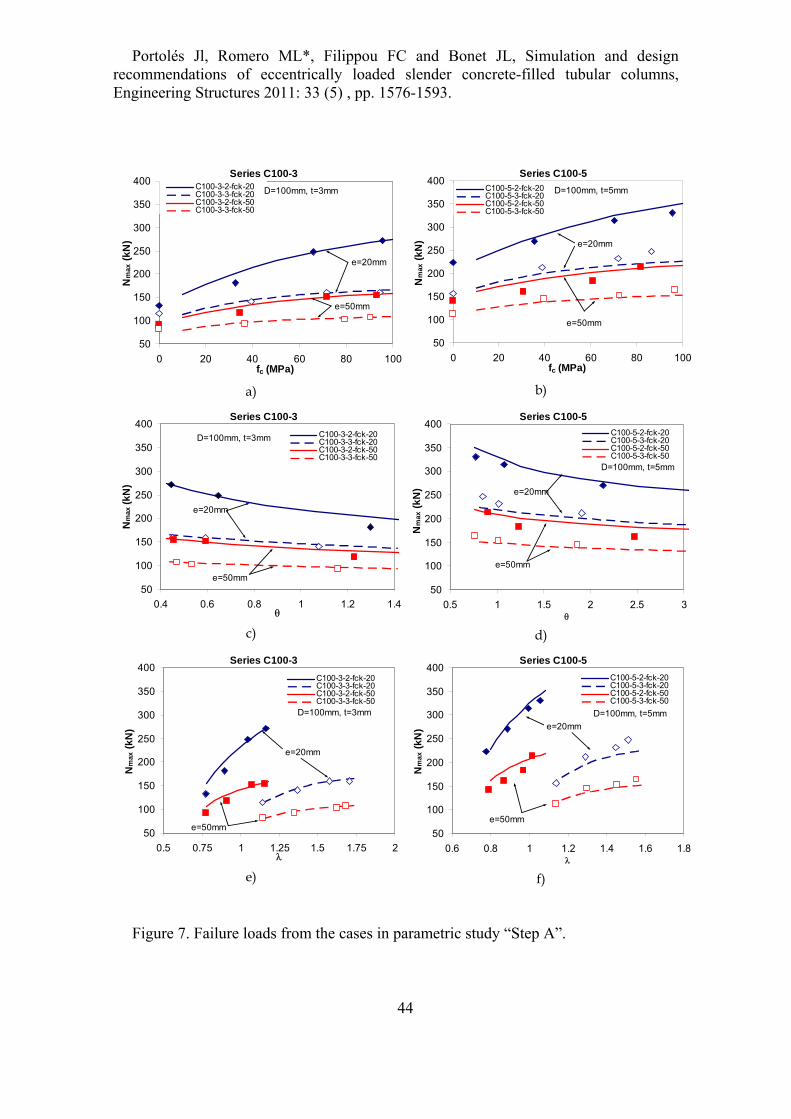
Portolés Jl, Romero ML*, Filippou FC and Bonet JL, Simulation and design recommendations of eccentrically loaded slender concrete-filled tubular columns, Engineering Structures 2011: 33 (5) , pp. 1576-1593.
44
a) b)
c) d)
e) f)
Figure 7. Failure loads from the cases in parametric study “Step A”.
Series C100-3
50
100
150
200
250
300
350
400
0 20 40 60 80 100fc (MPa)
Nm
ax (
kN
)
C100-3-2-fck-20C100-3-3-fck-20C100-3-2-fck-50C100-3-3-fck-50
D=100mm, t=3mm
e=20mm
e=50mm
Series C100-5
50
100
150
200
250
300
350
400
0 20 40 60 80 100fc (MPa)
Nm
ax (
kN
)
C100-5-2-fck-20C100-5-3-fck-20C100-5-2-fck-50C100-5-3-fck-50
D=100mm, t=5mm
e=20mm
e=50mm
Series C100-3
50
100
150
200
250
300
350
400
0.4 0.6 0.8 1 1.2 1.4
Nm
ax (
kN
)
C100-3-2-fck-20C100-3-3-fck-20C100-3-2-fck-50C100-3-3-fck-50
D=100mm, t=3mm
e=20mm
e=50mm
Series C100-5
50
100
150
200
250
300
350
400
0.5 1 1.5 2 2.5 3
Nm
ax (
kN
)
C100-5-2-fck-20C100-5-3-fck-20C100-5-2-fck-50C100-5-3-fck-50
D=100mm, t=5mm
e=20mm
e=50mm
Series C100-3
50
100
150
200
250
300
350
400
0.5 0.75 1 1.25 1.5 1.75 2
Nm
ax (
kN
)
C100-3-2-fck-20C100-3-3-fck-20C100-3-2-fck-50C100-3-3-fck-50
D=100mm, t=3mm
e=20mm
e=50mm
Series C100-5
50
100
150
200
250
300
350
400
0.6 0.8 1 1.2 1.4 1.6 1.8
Nm
ax (
kN
)
C100-5-2-fck-20C100-5-3-fck-20C100-5-2-fck-50C100-5-3-fck-50
D=100mm, t=5mm
e=20mm
e=50mm
Portolés Jl, Romero ML*, Filippou FC and Bonet JL, Simulation and design recommendations of eccentrically loaded slender concrete-filled tubular columns, Engineering Structures 2011: 33 (5) , pp. 1576-1593.
45
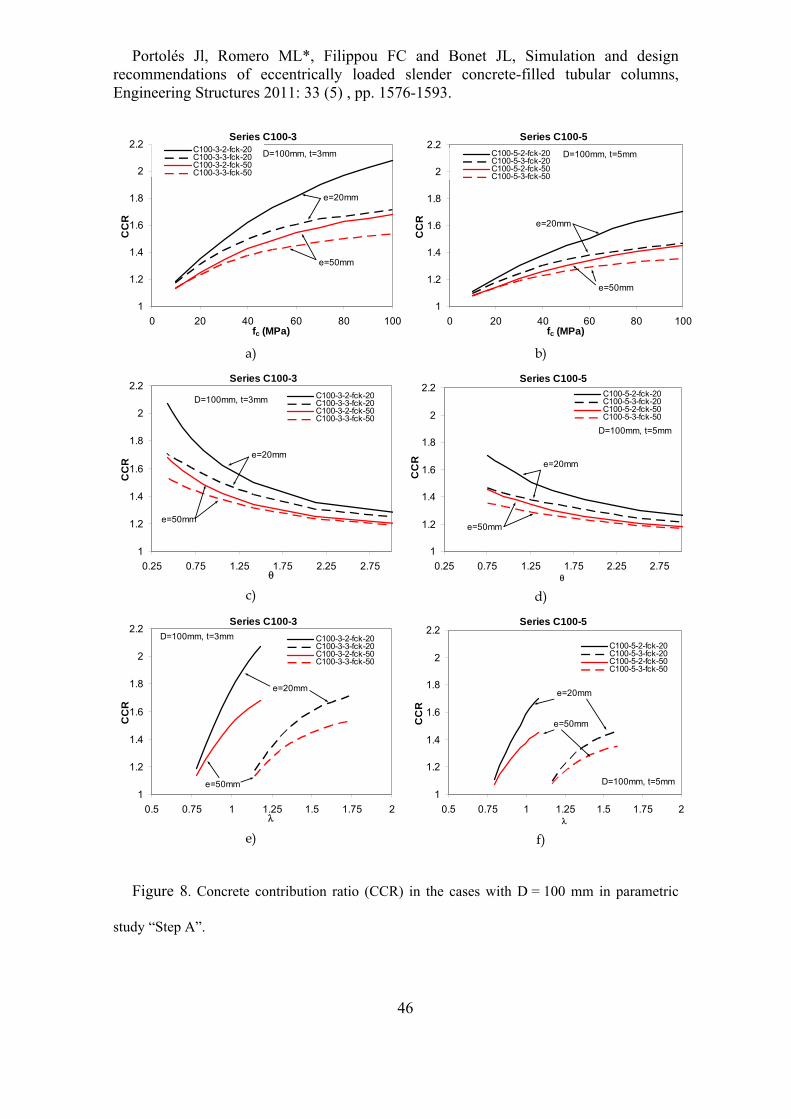
Portolés Jl, Romero ML*, Filippou FC and Bonet JL, Simulation and design recommendations of eccentrically loaded slender concrete-filled tubular columns, Engineering Structures 2011: 33 (5) , pp. 1576-1593.
46
a) b)
c) d)
e) f)
Figure 8. Concrete contribution ratio (CCR) in the cases with D = 100 mm in parametric
study “Step A”.
Series C100-3
1
1.2
1.4
1.6
1.8
2
2.2
0 20 40 60 80 100fc (MPa)
CC
R
C100-3-2-fck-20C100-3-3-fck-20C100-3-2-fck-50C100-3-3-fck-50
D=100mm, t=3mm
e=20mm
e=50mm
Series C100-5
1
1.2
1.4
1.6
1.8
2
2.2
0 20 40 60 80 100fc (MPa)
CC
R
C100-5-2-fck-20C100-5-3-fck-20C100-5-2-fck-50C100-5-3-fck-50
D=100mm, t=5mm
e=20mm
e=50mm
Series C100-3
1
1.2
1.4
1.6
1.8
2
2.2
0.25 0.75 1.25 1.75 2.25 2.75
CC
R
C100-3-2-fck-20C100-3-3-fck-20C100-3-2-fck-50C100-3-3-fck-50
D=100mm, t=3mm
e=20mm
e=50mm
Series C100-5
1
1.2
1.4
1.6
1.8
2
2.2
0.25 0.75 1.25 1.75 2.25 2.75
CC
R
C100-5-2-fck-20C100-5-3-fck-20C100-5-2-fck-50C100-5-3-fck-50
D=100mm, t=5mm
e=20mm
e=50mm
Series C100-3
1
1.2
1.4
1.6
1.8
2
2.2
0.5 0.75 1 1.25 1.5 1.75 2
CC
R
C100-3-2-fck-20C100-3-3-fck-20C100-3-2-fck-50C100-3-3-fck-50
D=100mm, t=3mm
e=20mm
e=50mm
Series C100-5
1
1.2
1.4
1.6
1.8
2
2.2
0.5 0.75 1 1.25 1.5 1.75 2
CC
R
C100-5-2-fck-20C100-5-3-fck-20C100-5-2-fck-50C100-5-3-fck-50
D=100mm, t=5mm
e=50mm
e=20mm

Portolés Jl, Romero ML*, Filippou FC and Bonet JL, Simulation and design recommendations of eccentrically loaded slender concrete-filled tubular columns, Engineering Structures 2011: 33 (5) , pp. 1576-1593.
47
a) b)
c) d)
e) f)
Figure 9. Concrete contribution ratio (CCR) in the cases with L = 3 m in parametric study
“Step A”.
Series L=3m, e=20mm
1
1.2
1.4
1.6
1.8
2
2.2
0 20 40 60 80 100fc (MPa)
CC
R
C100-3 (D/t=33.3)
C100-5(D/t=20)
C125-5(D/t=25)
C160-6(D/t=28.09)
Series L=3m, e=50mm
1
1.2
1.4
1.6
1.8
2
2.2
0 20 40 60 80 100fc (MPa)
CC
R
C100-3 (D/t=33.3)C100-5(D/t=20)
C125-5(D/t=25)
C160-6(D/t=28.09)
Series L=3m, e=20mm
1
1.2
1.4
1.6
1.8
2
2.2
0 2 4 6 8
CC
R
C100-3 (D/t=33.3)
C100-5(D/t=20)
C125-5(D/t=25)
C160-6(D/t=28.09)
Series L=3m, e=50mm
1
1.2
1.4
1.6
1.8
2
2.2
0 2 4 6 8
CC
R
C100-3 (D/t=33.3)
C100-5(D/t=20)
C125-5(D/t=25)
C160-6(D/t=28.09)
Series L=3m, e=20mm
1
1.2
1.4
1.6
1.8
2
2.2
0.5 0.75 1 1.25 1.5 1.75
CC
R
C100-3 (D/t=33.3)
C100-5(D/t=20)
C125-5(D/t=25)
C160-6(D/t=28.09)
Series L=3m, e=50mm
1
1.2
1.4
1.6
1.8
2
2.2
0.5 0.75 1 1.25 1.5 1.75
CC
R C100-3 (D/t=33.3)
C100-5(D/t=20)
C125-5(D/t=25)
C160-6(D/t=28.09)

Portolés Jl, Romero ML*, Filippou FC and Bonet JL, Simulation and design recommendations of eccentrically loaded slender concrete-filled tubular columns, Engineering Structures 2011: 33 (5) , pp. 1576-1593.
48
a) b)
c) d) Figure 10. Influence of the strength of concrete (fc) on the concrete contribution ratio (CCR):
a) and b) for parametric study B (influence of eccentricity), c) and d) for parametric study C
(influence of length).
Series C100-3
1
1.2
1.4
1.6
1.8
2
2.2
2.4
2.6
0 25 50 75 100 125 150 175fc (MPa)
CC
R
D=100mm, t=3mm
e/D=0.1
0.2
0.6
Series C160-6
1
1.2
1.4
1.6
1.8
2
2.2
2.4
2.6
0 25 50 75 100 125 150 175fc (MPa)
CC
R
D=160.1mm, t=5.7mm e/D=0.1
0.2
0.6
Series C100-3
1
1.1
1.2
1.3
1.4
1.5
1.6
1.7
1.8
1.9
2
0 25 50 75 100 125 150 17fc (MPa)
CC
R
D=100mm, t=3mm
2m
3m
4m
5m
Series C160-6
1
1.1
1.2
1.3
1.4
1.5
1.6
1.7
1.8
1.9
2
0 25 50 75 100 125 150 17fc (MPa)
CC
R
D=160.1mm, t=5.7mm 2m
3m
4m
5m
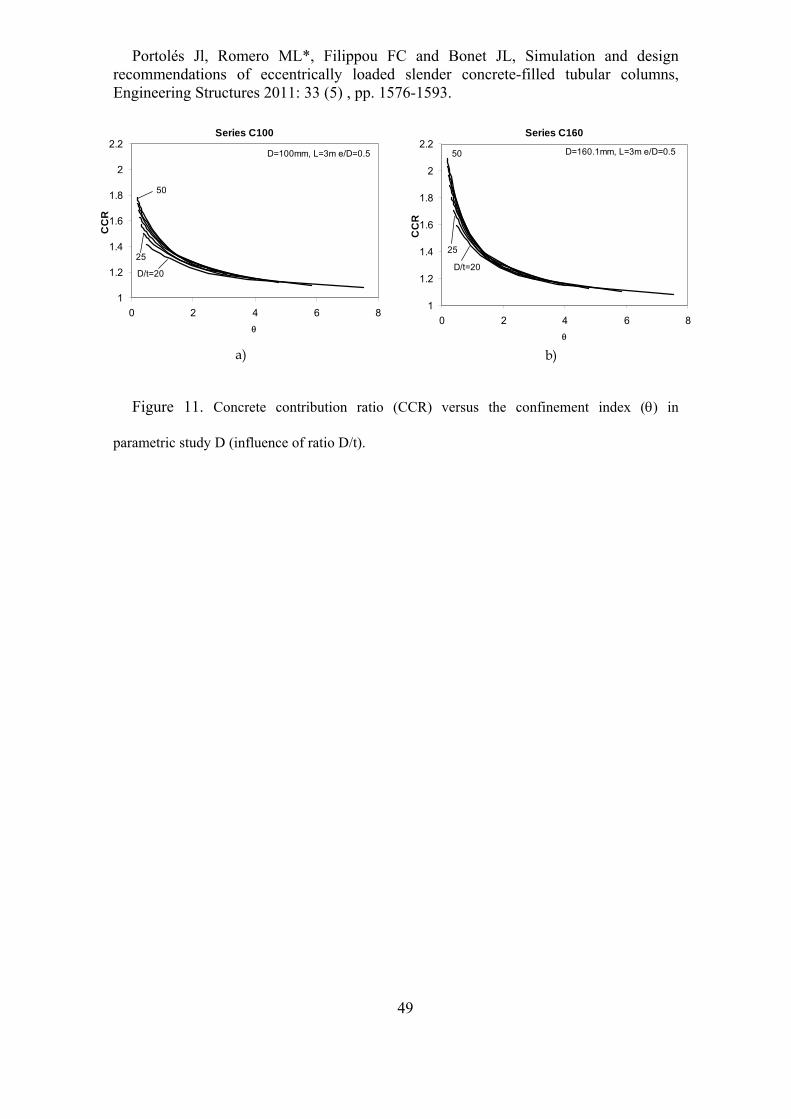
Portolés Jl, Romero ML*, Filippou FC and Bonet JL, Simulation and design recommendations of eccentrically loaded slender concrete-filled tubular columns, Engineering Structures 2011: 33 (5) , pp. 1576-1593.
49
a)
b)
Figure 11. Concrete contribution ratio (CCR) versus the confinement index () in
parametric study D (influence of ratio D/t).
Series C100
1
1.2
1.4
1.6
1.8
2
2.2
0 2 4 6 8
CC
R
D=100mm, L=3m e/D=0.5
D/t=20
25
50
Series C160
1
1.2
1.4
1.6
1.8
2
2.2
0 2 4 6 8
CC
R
D=160.1mm, L=3m e/D=0.5
D/t=20
25
50
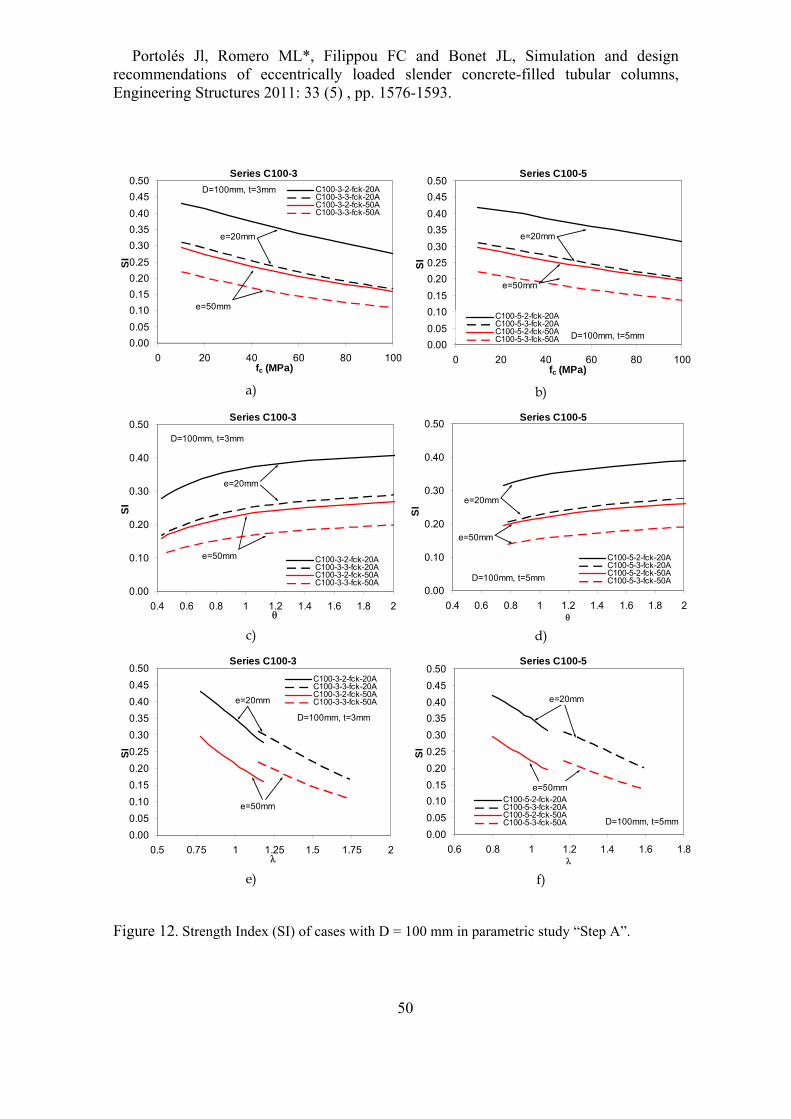
Portolés Jl, Romero ML*, Filippou FC and Bonet JL, Simulation and design recommendations of eccentrically loaded slender concrete-filled tubular columns, Engineering Structures 2011: 33 (5) , pp. 1576-1593.
50
a) b)
c) d)
e) f)
Figure 12. Strength Index (SI) of cases with D = 100 mm in parametric study “Step A”.
Series C100-3
0.00
0.05
0.10
0.15
0.20
0.25
0.30
0.35
0.40
0.45
0.50
0 20 40 60 80 100fc (MPa)
SI
C100-3-2-fck-20AC100-3-3-fck-20AC100-3-2-fck-50AC100-3-3-fck-50A
D=100mm, t=3mm
e=20mm
e=50mm
Series C100-5
0.00
0.05
0.10
0.15
0.20
0.25
0.30
0.35
0.40
0.45
0.50
0 20 40 60 80 100fc (MPa)
SI
C100-5-2-fck-20AC100-5-3-fck-20AC100-5-2-fck-50AC100-5-3-fck-50A D=100mm, t=5mm
e=20mm
e=50mm
Series C100-3
0.00
0.10
0.20
0.30
0.40
0.50
0.4 0.6 0.8 1 1.2 1.4 1.6 1.8 2
SI
C100-3-2-fck-20AC100-3-3-fck-20AC100-3-2-fck-50AC100-3-3-fck-50A
D=100mm, t=3mm
e=20mm
e=50mm
Series C100-5
0.00
0.10
0.20
0.30
0.40
0.50
0.4 0.6 0.8 1 1.2 1.4 1.6 1.8 2
SI
C100-5-2-fck-20AC100-5-3-fck-20AC100-5-2-fck-50AC100-5-3-fck-50AD=100mm, t=5mm
e=20mm
e=50mm
Series C100-3
0.00
0.05
0.10
0.15
0.20
0.25
0.30
0.35
0.40
0.45
0.50
0.5 0.75 1 1.25 1.5 1.75 2
SI
C100-3-2-fck-20AC100-3-3-fck-20AC100-3-2-fck-50AC100-3-3-fck-50A
D=100mm, t=3mm
e=20mm
e=50mm
Series C100-5
0.00
0.05
0.10
0.15
0.20
0.25
0.30
0.35
0.40
0.45
0.50
0.6 0.8 1 1.2 1.4 1.6 1.8
SI
C100-5-2-fck-20AC100-5-3-fck-20AC100-5-2-fck-50AC100-5-3-fck-50A D=100mm, t=5mm
e=20mm
e=50mm
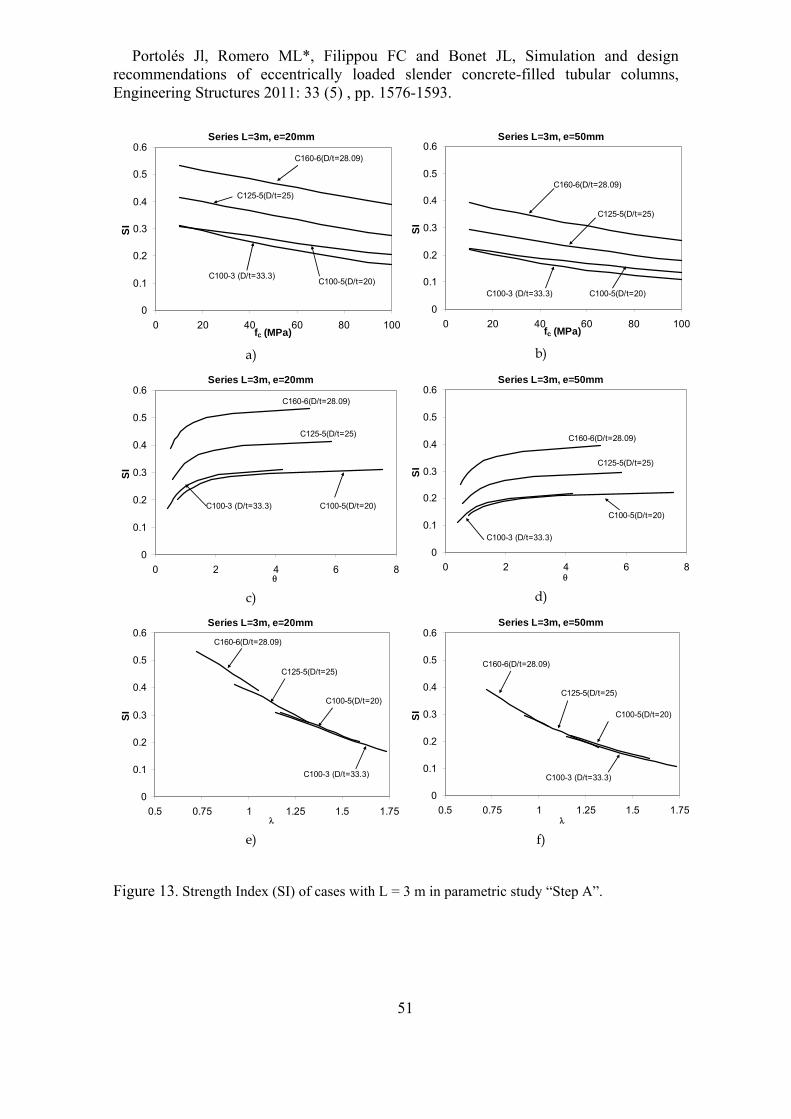
Portolés Jl, Romero ML*, Filippou FC and Bonet JL, Simulation and design recommendations of eccentrically loaded slender concrete-filled tubular columns, Engineering Structures 2011: 33 (5) , pp. 1576-1593.
51
a) b)
c) d)
e) f)
Figure 13. Strength Index (SI) of cases with L = 3 m in parametric study “Step A”.
Series L=3m, e=20mm
0
0.1
0.2
0.3
0.4
0.5
0.6
0 20 40 60 80 100fc (MPa)
SI
C100-3 (D/t=33.3)C100-5(D/t=20)
C125-5(D/t=25)
C160-6(D/t=28.09)
Series L=3m, e=50mm
0
0.1
0.2
0.3
0.4
0.5
0.6
0 20 40 60 80 100fc (MPa)
SI
C100-3 (D/t=33.3) C100-5(D/t=20)
C125-5(D/t=25)
C160-6(D/t=28.09)
Series L=3m, e=20mm
0
0.1
0.2
0.3
0.4
0.5
0.6
0 2 4 6 8
SI
C100-3 (D/t=33.3) C100-5(D/t=20)
C125-5(D/t=25)
C160-6(D/t=28.09)
Series L=3m, e=50mm
0
0.1
0.2
0.3
0.4
0.5
0.6
0 2 4 6 8
SI
C100-3 (D/t=33.3)
C100-5(D/t=20)
C125-5(D/t=25)
C160-6(D/t=28.09)
Series L=3m, e=20mm
0
0.1
0.2
0.3
0.4
0.5
0.6
0.5 0.75 1 1.25 1.5 1.75
SI
C100-3 (D/t=33.3)
C100-5(D/t=20)
C125-5(D/t=25)
C160-6(D/t=28.09)
Series L=3m, e=50mm
0
0.1
0.2
0.3
0.4
0.5
0.6
0.5 0.75 1 1.25 1.5 1.75
SI
C100-3 (D/t=33.3)
C100-5(D/t=20)
C125-5(D/t=25)
C160-6(D/t=28.09)

Portolés Jl, Romero ML*, Filippou FC and Bonet JL, Simulation and design recommendations of eccentrically loaded slender concrete-filled tubular columns, Engineering Structures 2011: 33 (5) , pp. 1576-1593.
52
Figure 14. Comparison between the European buckling curve and the strength index (SI) for all
columns in parametric study A with L = 3 m.
Test with L=3m
0
0.2
0.4
0.6
0.8
1
0.5 0.75 1 1.25 1.5 1.75 2
SI
e=20mm
e=50mm
European buckling curve 'a'

Portolés Jl, Romero ML*, Filippou FC and Bonet JL, Simulation and design recommendations of eccentrically loaded slender concrete-filled tubular columns, Engineering Structures 2011: 33 (5) , pp. 1576-1593.
53
a) b)
c) d)
e) f) Figure 15. Effect of the confinement index () versus the product CCR*SI for parametric
studies B, C, and D.
Series C100-3
0
0.1
0.2
0.3
0.4
0.5
0.6
0.7
0.8
0.9
1
0 1 2 3 4 5
CC
R*S
I
D=100mm, t=3mm, L=3135mm
e/D=0.1
0.2
0.6
Series C160-6
0
0.1
0.2
0.3
0.4
0.5
0.6
0.7
0.8
0.9
1
0 1 2 3 4 5 6
CC
R*S
I
D=160.1mm, t=5.7mm, L=3135mm
e/D=0.1
0.2
0.6
Series C100-3
0
0.1
0.2
0.3
0.4
0.5
0 1 2 3 4 5
CC
R*S
I
D=100mm, t=3mm e/D=0.5
L=2m
3m
4m
5m
Series C160-6
0
0.1
0.2
0.3
0.4
0.5
0 1 2 3 4 5 6
CC
R*S
I
D=160.1mm, t=5.7mm, e/D=0.5
L=2m
3m
4m
5m
Series C100
0.1
0.15
0.2
0.25
0.3
0.35
0.4
0 1 2 3 4 5 6 7 8
CC
R*S
I
D=100mm, L=3m e/D=0.5
D/t=20
2550
Series C160
0.1
0.15
0.2
0.25
0.3
0.35
0.4
0 1 2 3 4 5 6 7 8
CC
R*S
I
D=160.1mm, L=3m e/D=0.5
D/t=2025
50

Portolés Jl, Romero ML*, Filippou FC and Bonet JL, Simulation and design recommendations of eccentrically loaded slender concrete-filled tubular columns, Engineering Structures 2011: 33 (5) , pp. 1576-1593.
54
Table 1. Test properties and results
Test D t L e fc Nmax,Exp Nmax,Num Nu,EC4
(mm) (mm) (mm) (mm) (MPa) (kN) (kN) (kN)C100-3-2-30-20-2 100 3 2135 20 0.77 32.7 181.56 202.19 0.90 203.49C100-3-2-30-50-1 100 3 2135 50 0.82 34.5 117.49 128.56 0.91 126.60C100-3-2-70-20-1 100 3 2135 20 0.90 65.79 248.58 246.51 1.01 240.23C100-3-2-70-50-1 100 3 2135 50 0.91 71.64 151.59 147.95 1.02 139.58C100-3-2-90-20-1 100 3 2135 20 1.05 95.63 271.04 271.18 1.00 255.69C100-3-2-90-50-1 100 3 2135 50 1.07 93.01 154.24 154.43 1.00 144.19C100-3-3-00-20-1 100 3 3135 20 1.17 0 115.66 105.37 1.10 C100-3-3-00-50-1 100 3 3135 50 1.16 0 82.32 75.83 1.09 C100-3-3-30-20-1 100 3 3135 20 1.37 39.43 140.32 144.39 0.97 143.19C100-3-3-30-50-1 100 3 3135 50 1.35 36.68 93.75 94.96 0.99 96.72 C100-3-3-70-20-1 100 3 3135 20 1.58 71.74 159.55 159.74 1.00 152.90C100-3-3-70-50-1 100 3 3135 50 1.62 79.55 102.75 104.71 0.98 104.86C100-3-3-90-20-1 100 3 3135 20 1.71 94.56 160.33 165.84 0.97 157.41C100-3-3-90-50-1 100 3 3135 50 1.68 90.4 106.80 106.12 1.01 106.31C100-5-2-00-20-1 102 5 2135 20 0.79 0 223.37 211.81 1.05 C100-5-2-00-20-2 102 5 2135 20 0.88 0 226.61 211.81 1.07 C100-5-2-00-50-1 100 5 2135 50 1.00 0 142.19 137.73 1.03 C100-5-2-30-20-1 100 5 2135 20 0.97 35.39 270.02 265.19 1.02 278.64C100-5-2-30-50-1 100 5 2135 50 0.77 30.54 161.26 167.87 0.96 177.31C100-5-2-70-20-1 100 5 2135 20 0.77 70.16 313.55 308.77 1.02 324.95C100-5-2-90-20-1 102 5 2135 20 1.05 95.43 330.40 358.56 0.92 362.45C100-5-2-90-50-1 102 5 2135 50 1.02 81.66 213.46 213.28 1.00 212.17C100-5-3-30-20-1 102 5 3135 20 1.29 38.67 212.48 205.37 1.03 209.32C100-5-3-30-50-1 102 5 3135 50 1.30 39.56 144.83 140.89 1.03 146.51C100-5-3-70-20-1 102 5 3135 20 1.45 71.86 231.35 224.24 1.03 226.23C100-5-3-70-50-1 102 5 3135 50 1.45 72.49 153.16 150.92 1.01 155.50C100-5-3-90-20-1 102 5 3135 20 1.51 86.39 246.82 229.20 1.08 229.77C100-5-3-90-50-1 102 5 3135 50 1.55 96.74 164.95 155.03 1.06 159.64C125-5-3-90-20-1 125 5 3135 20 1.28 87.98 474.17 437.35 1.08 428.81C125-5-3-90-50-1 125 5 3135 50 1.31 96.97 317.90 289.98 1.10 284.71C125-5-3-90-20-2 125 5 3135 20 1.35 107.3 489.47 452.79 1.08 437.93C125-5-3-90-50-2 125 5 3135 50 1.31 97.92 322.97 290.32 1.11 285.01C160-6-3-90-20-1 160 5.7 3135 20 1.01 87.38 1012.47 970.89 1.04 933.15C160-6-3-70-50-1 160 5.7 3135 50 0.97 74.75 642.16 615.75 1.04 600.71C160-6-3-90-20-2 160 5.7 3135 20 1.00 83.08 1011.52 956.16 1.06 919.49C160-6-3-90-50-1 160 5.7 3135 50 1.05 98.5 686.21 654.65 1.05 622.82
Mean 1.02 Dev 0.05

Portolés Jl, Romero ML*, Filippou FC and Bonet JL, Simulation and design recommendations of eccentrically loaded slender concrete-filled tubular columns, Engineering Structures 2011: 33 (5) , pp. 1576-1593.
55
Table 2. Variation of the parameters for experimental tests from the literature.
Parameter Range Slenderness (L/D) Relative slenderness ( )
7.95-31.61 0.5 – 1.4
Relative eccentricity (e/D) 0.05-0.5 fc (MPa) 23-102 fy (MPa) 193-435

Portolés Jl, Romero ML*, Filippou FC and Bonet JL, Simulation and design recommendations of eccentrically loaded slender concrete-filled tubular columns, Engineering Structures 2011: 33 (5) , pp. 1576-1593.
56
Table 3. Results of the verification of the model for experimental tests from the
literature.
Authors Numberof Tests
Numerical model m V.C max min
Zeghiche and Chaoui (2005) [34] 8 1 0.03 1.04 0.96Rangan and Joyce (1992) [35] 9 0.99 0.15 1.34 0.83Neogi et al (1969) [36]
18 1.10 0.15 1.49 0.89
Kilpatrick and Rangan (1999)[37] 17 0.97 0.07 1.13 0.88All 52 1.02 0.13 1.49 0.83

Portolés Jl, Romero ML*, Filippou FC and Bonet JL, Simulation and design recommendations of eccentrically loaded slender concrete-filled tubular columns, Engineering Structures 2011: 33 (5) , pp. 1576-1593.
57
Table 4. Parametric studies
Step A Effect of the strength of concrete Section C100-3, C100-5, C125-5, C160.1-5.7 L 2135 mm, 3135 mm E 20 mm, 50 mm fy 322 MPa fc 10, 20, …, 100 MPa Step B Effect of the eccentricity Section C100-3, C160.1-5.7; D/t = 33.3 and 28.08 respectively L 3135 mm e/D 0.1, 0.2, …, 0.6 fy 322 MPa fc 10, 20, …, 150 MPa Step C Effect of the length and geometrical slenderness L/D Section C100-3, C160.1-5.7; D/t = 33.3 and 28.08 respectively L 1.5, 2, 3, 4, 5 m e/D 0.5 fy 322 MPa fc 10, 20, …, 150 MPa Step D Effect of the ratio D/t D 100, 160.1 mm D/t 20, 25, 30, 35, 40, 45, 50 L 3 m e/D 0.5 fy 322 MPa fc 10, 20, …, 150 MPa


![[POPOV] Advances in Design of Eccentrically Braced Frames](https://img.pdfslide.net/doc/110x75/577ccd521a28ab9e788bfddd/popov-advances-in-design-of-eccentrically-braced-frames.jpg)