Embed Size (px)
Citation preview
Simulation of the spark rate in a Micromegas detector with Geant4
Sébastien Procureur CEA-Saclay
Outline
Spark rate simulations Spark review, 25/01/2010 S.Procureur
Introduction – existing data on sparksIntroduction – existing data on sparks
Geant4 simulation of a MM in hadron beamsGeant4 simulation of a MM in hadron beams- Highly Ionizing Particles (HIPs) productionHighly Ionizing Particles (HIPs) production
- Deposited energy- Deposited energy
Spark rate estimationSpark rate estimation- Normalized and real gainsNormalized and real gains
- Systematics (production threshold, integration size)Systematics (production threshold, integration size)
- Comparison with data / effect of the gas mixtureComparison with data / effect of the gas mixture
Predictions and conclusion Predictions and conclusion - Bulk vs non bulk MicromegasBulk vs non bulk Micromegas- Effect of the drift electrode materialEffect of the drift electrode material- Applicability for CLAS12?Applicability for CLAS12?
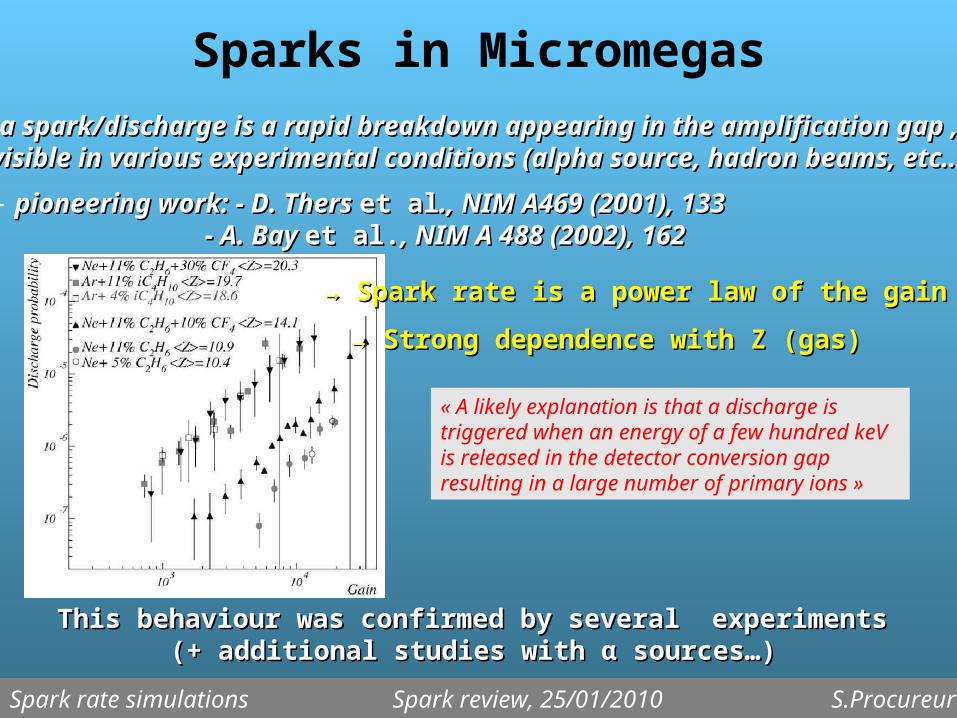
Sparks in Micromegas- a spark/discharge is a rapid breakdown appearing in the amplification gap , a spark/discharge is a rapid breakdown appearing in the amplification gap , visible in various experimental conditions (alpha source, hadron beams, etc…)visible in various experimental conditions (alpha source, hadron beams, etc…)
- pioneering work: - D. Thers pioneering work: - D. Thers et alet al., NIM A469 (2001), 133., NIM A469 (2001), 133 - A. Bay - A. Bay et al.et al., NIM A 488 (2002), 162, NIM A 488 (2002), 162
→ → Spark rate is a power law of the gainSpark rate is a power law of the gain
→ → Strong dependence with Z (gas)Strong dependence with Z (gas)
« A likely explanation is that a discharge is triggered when an energy of a few hundred keV is released in the detector conversion gap resulting in a large number of primary ions »
(+ additional studies with (+ additional studies with αα sources…) sources…)This behaviour was confirmed by several experimentsThis behaviour was confirmed by several experiments
Spark rate simulations Spark review, 25/01/2010 S.Procureur
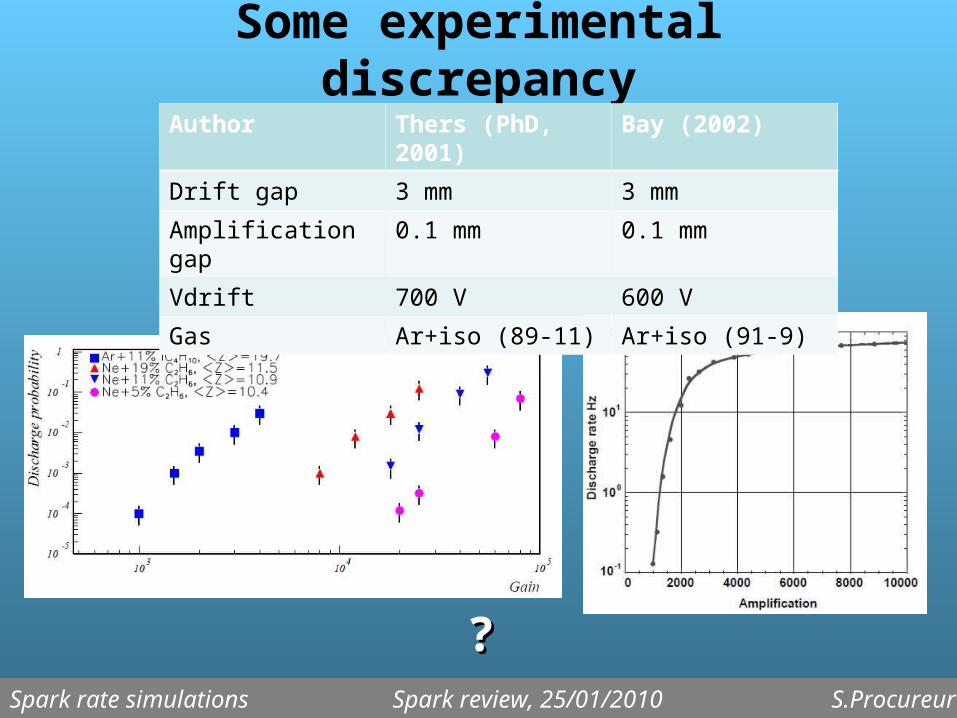
Some experimental discrepancy
Spark rate simulations Spark review, 25/01/2010 S.Procureur
Author Thers (PhD, 2001) Bay (2002)
Drift gap 3 mm 3 mm
Amplification gap 0.1 mm 0.1 mm
Vdrift 700 V 600 V
Gas Ar+iso (89-11) Ar+iso (91-9)
??
Geant4 simulation of a MM
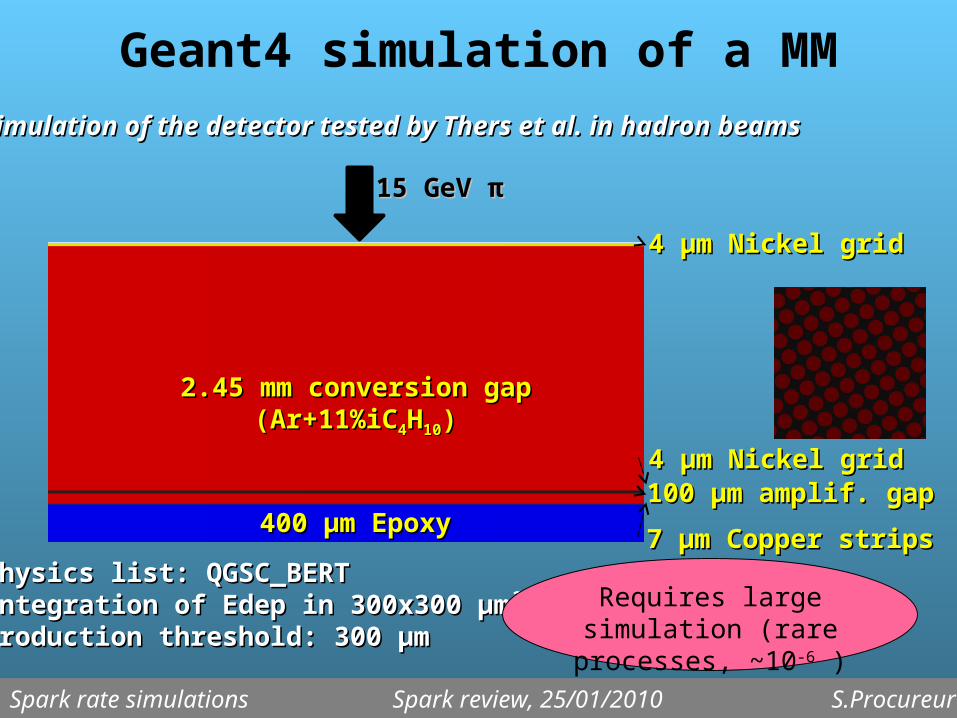
Simulation of the detector tested by Thers et al. in hadron beamsSimulation of the detector tested by Thers et al. in hadron beams
400 µm Epoxy400 µm Epoxy
2.45 mm conversion gap2.45 mm conversion gap(Ar+11%iC(Ar+11%iC44HH1010))
7 µm Copper strips7 µm Copper strips
100 µm amplif. gap100 µm amplif. gap4 µm Nickel grid4 µm Nickel grid
4 µm Nickel grid4 µm Nickel grid
15 GeV 15 GeV ππ
→ → Physics list: QGSC_BERTPhysics list: QGSC_BERT→ → Integration of Edep in 300x300 µm²Integration of Edep in 300x300 µm²→ → Production threshold: 300 µmProduction threshold: 300 µm
Requires large simulation (rare processes, ~10-6 )
Spark rate simulations Spark review, 25/01/2010 S.Procureur
Secondary particles production
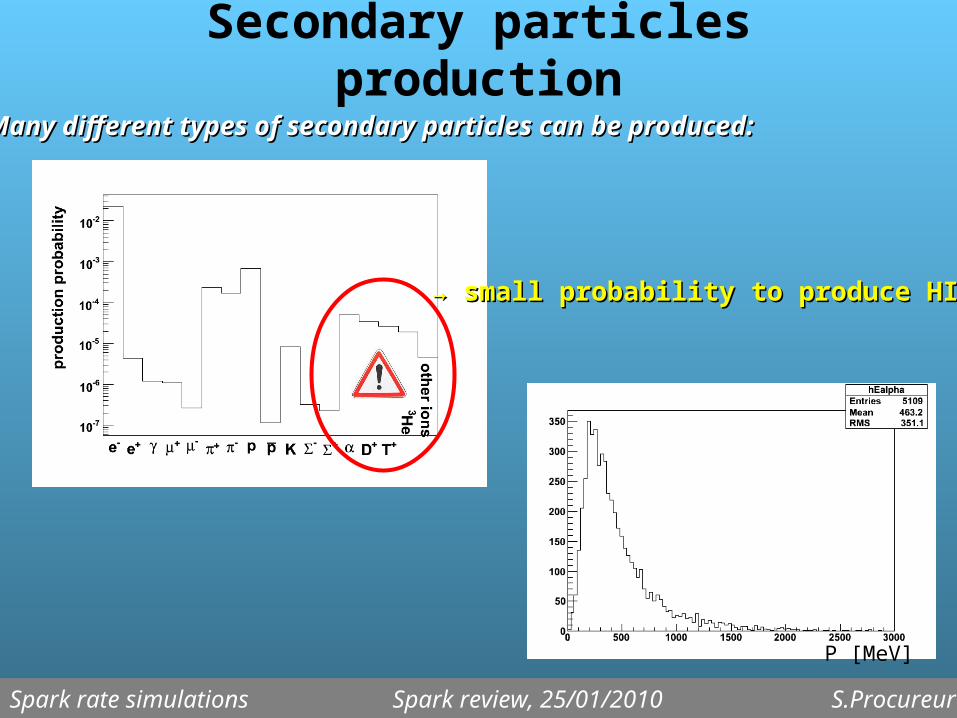
Many different types of secondary particles can be produced:Many different types of secondary particles can be produced:
→ → small probability to produce HIPssmall probability to produce HIPs
P [MeV]
Spark rate simulations Spark review, 25/01/2010 S.Procureur
Origin of the HIPs
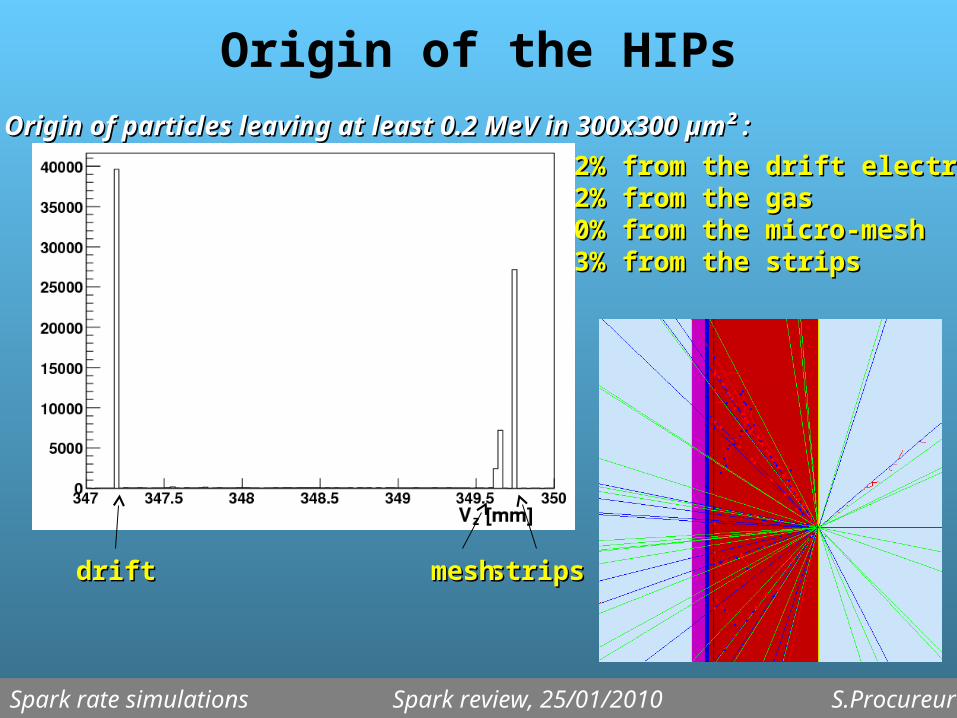
Origin of particles leaving at least 0.2 MeV in 300x300 µm² :Origin of particles leaving at least 0.2 MeV in 300x300 µm² :
→ → 42% from the drift electrode42% from the drift electrode→ → 22% from the gas22% from the gas→ → 10% from the micro-mesh10% from the micro-mesh→ → 23% from the strips23% from the strips
driftdrift stripsstripsmeshmesh
Spark rate simulations Spark review, 25/01/2010 S.Procureur
Deposited energy distribution
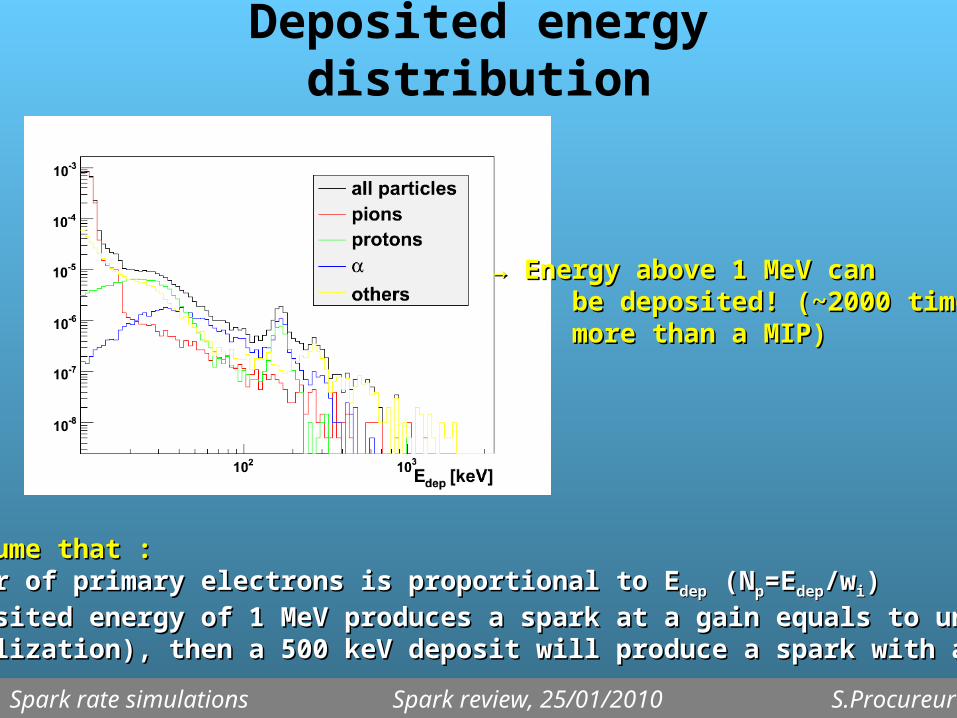
→ → Energy above 1 MeV can Energy above 1 MeV can be deposited! (~2000 times be deposited! (~2000 times more than a MIP)more than a MIP)
We will assume that :We will assume that :→ → the number of primary electrons is proportional to Ethe number of primary electrons is proportional to Edepdep (N (Npp=E=Edepdep/w/wii))
→ → if a deposited energy of 1 MeV produces a spark at a gain equals to unityif a deposited energy of 1 MeV produces a spark at a gain equals to unity (normalization), then a 500 keV deposit will produce a spark with a gain of 2(normalization), then a 500 keV deposit will produce a spark with a gain of 2
Spark rate simulations Spark review, 25/01/2010 S.Procureur
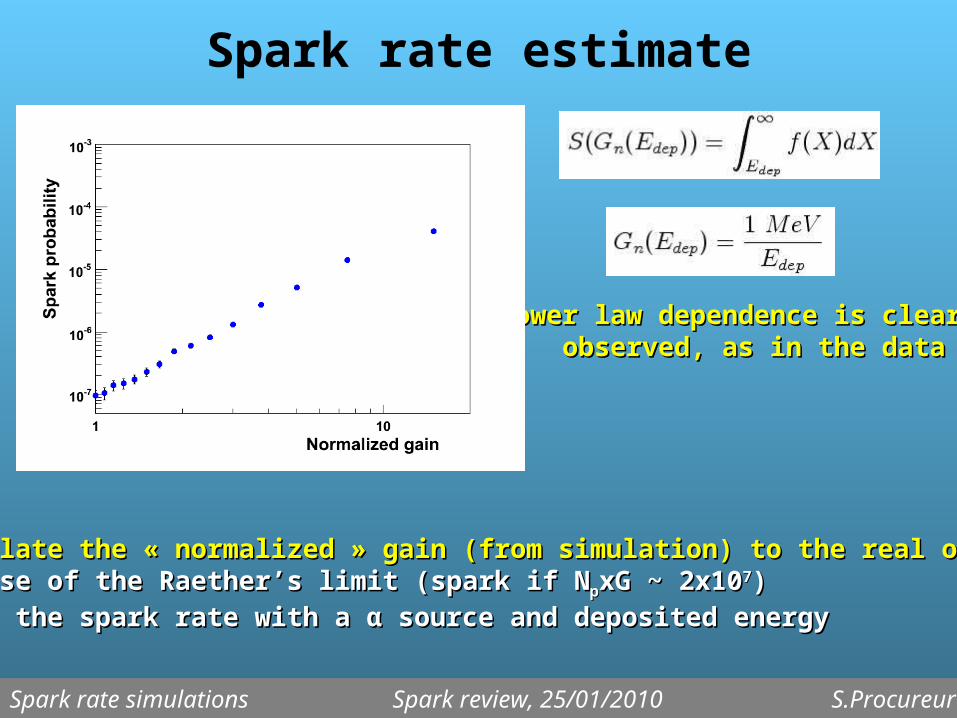
Spark rate estimate
→ → Power law dependence is clearlyPower law dependence is clearly observed, as in the dataobserved, as in the data
How to relate the « normalized » gain (from simulation) to the real one?How to relate the « normalized » gain (from simulation) to the real one?1) Make use of the Raether’s limit (spark if N1) Make use of the Raether’s limit (spark if NppxG ~ 2x10xG ~ 2x1077))
2) Relate the spark rate with a 2) Relate the spark rate with a αα source and deposited energy source and deposited energy
Spark rate simulations Spark review, 25/01/2010 S.Procureur
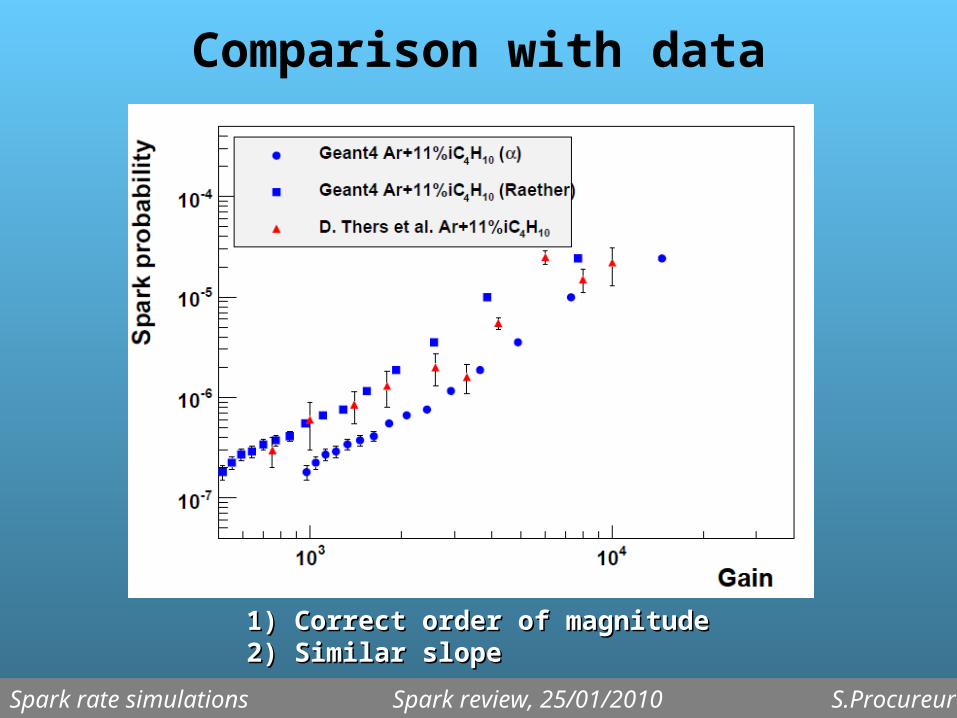
Comparison with data
1)1) Correct order of magnitudeCorrect order of magnitude2)2) Similar slopeSimilar slope
Spark rate simulations Spark review, 25/01/2010 S.Procureur
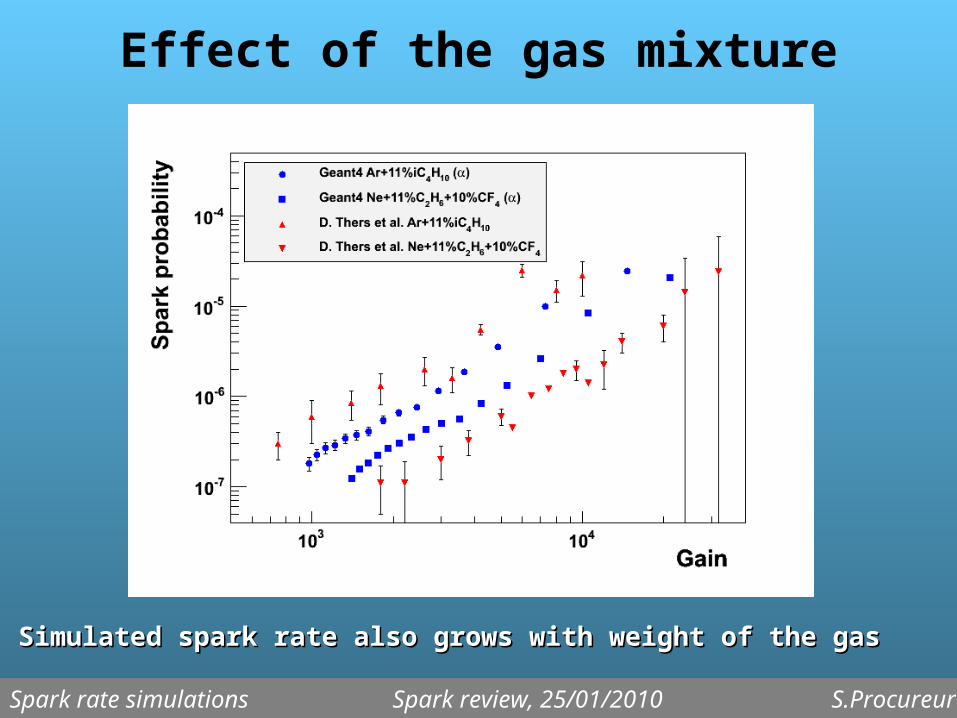
Effect of the gas mixture
Simulated spark rate also grows with weight of the gasSimulated spark rate also grows with weight of the gas
Spark rate simulations Spark review, 25/01/2010 S.Procureur
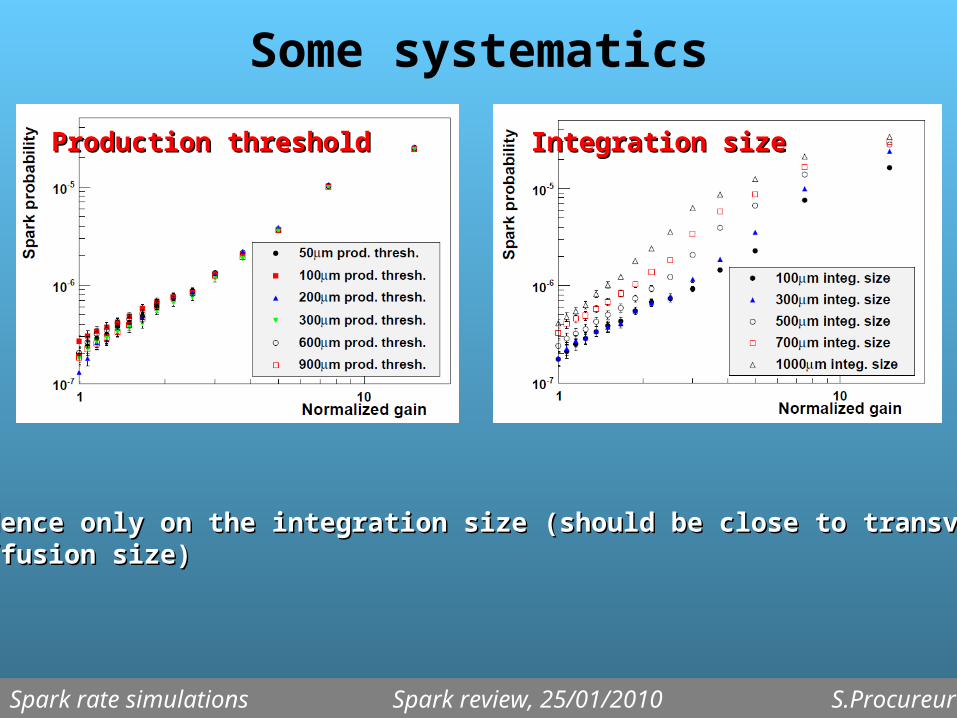
Some systematics
→ → Dependence only on the integration size (should be close to transverse Dependence only on the integration size (should be close to transverse diffusion size)diffusion size)
Production thresholdProduction threshold Integration sizeIntegration size
Spark rate simulations Spark review, 25/01/2010 S.Procureur
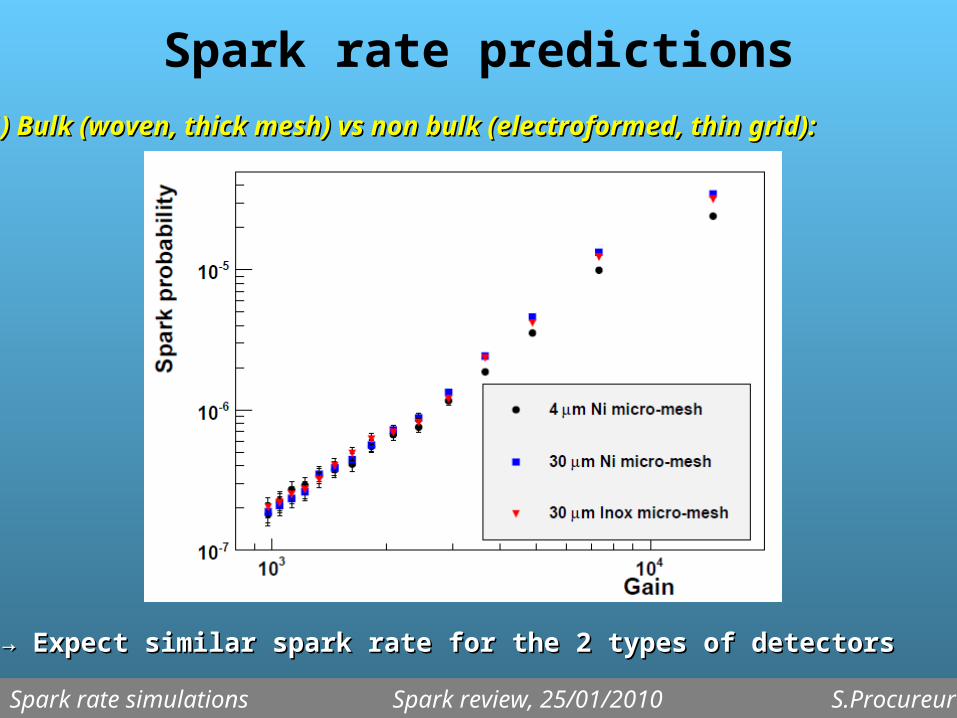
Spark rate predictions
→ → Expect similar spark rate for the 2 types of detectorsExpect similar spark rate for the 2 types of detectors
1) Bulk (woven, thick mesh) vs non bulk (electroformed, thin grid):1) Bulk (woven, thick mesh) vs non bulk (electroformed, thin grid):
Spark rate simulations Spark review, 25/01/2010 S.Procureur
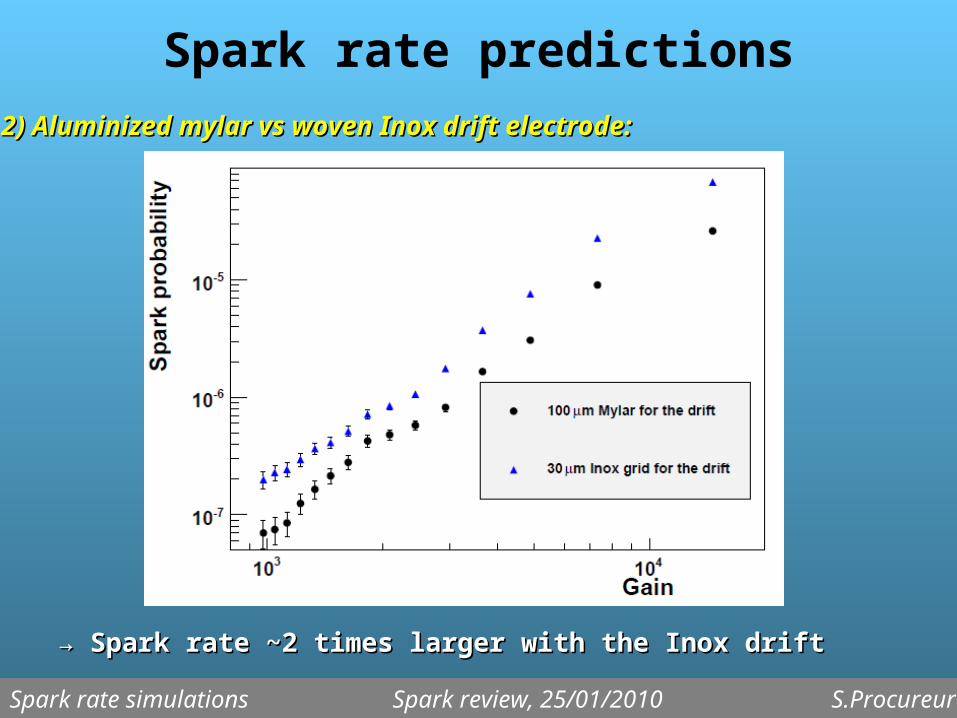
Spark rate predictions
→ → Spark rate ~2 times larger with the Inox driftSpark rate ~2 times larger with the Inox drift
2) Aluminized mylar vs woven Inox drift electrode:2) Aluminized mylar vs woven Inox drift electrode:
Spark rate simulations Spark review, 25/01/2010 S.Procureur
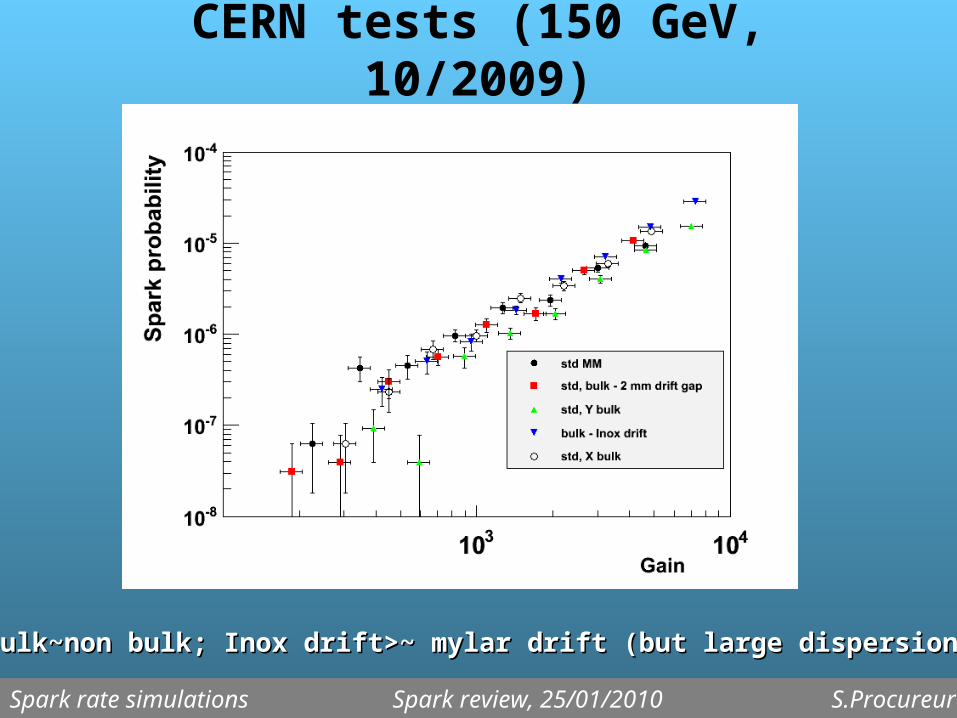
CERN tests (150 GeV, 10/2009)
→ → Bulk~non bulk; Inox drift>~ mylar drift (but large dispersion)Bulk~non bulk; Inox drift>~ mylar drift (but large dispersion)
Spark rate simulations Spark review, 25/01/2010 S.Procureur
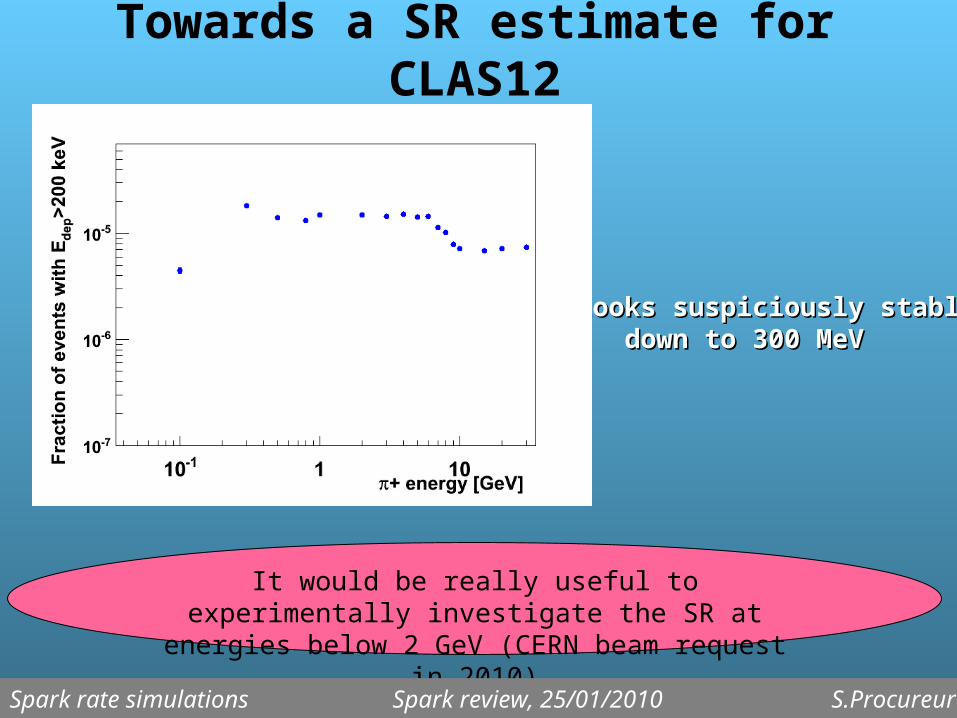
Towards a SR estimate for CLAS12
→ → Looks suspiciously stable Looks suspiciously stable down to 300 MeVdown to 300 MeV
It would be really useful to experimentally investigate the SR at energies below 2 GeV (CERN beam request in 2010)
Spark rate simulations Spark review, 25/01/2010 S.Procureur
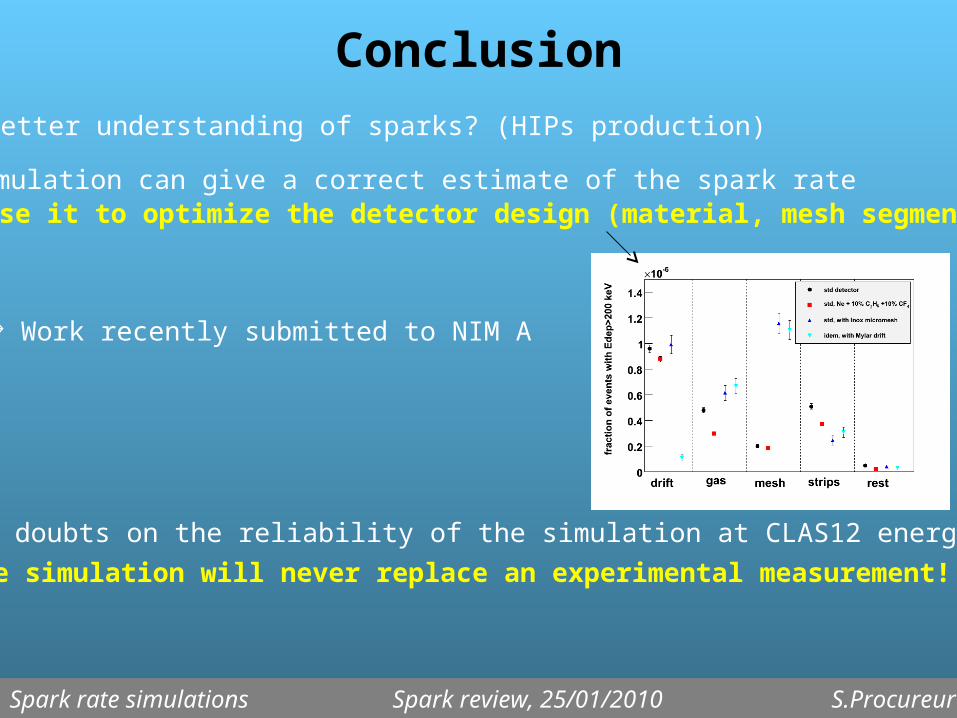
Conclusion Better understanding of sparks? (HIPs production)
Still doubts on the reliability of the simulation at CLAS12 energies
Simulation can give a correct estimate of the spark rate Can use it to optimize the detector design (material, mesh segmentation)
The simulation will never replace an experimental measurement!
Spark rate simulations Spark review, 25/01/2010 S.Procureur
Work recently submitted to NIM A