Embed Size (px)
Citation preview
Thirteenth International Water Technology Conference, IWTC 13 2009, Hurghada, Egypt
���
SIMULATION TIGRIS RIVER FLOOD WAVE IN MOSUL CITY
DUE TO A HYPOTHETICAL MOSUL DAM BREAK
Thair M. Al-Taiee 1 and Anass M. M. Rasheed 2
1 Assist. Prof., Research Center for Dams and Water Resources, Mosul University, Iraq E-mail: [email protected]
2 Lecturer, Research Center for Dams and Water Resources, Mosul University, Iraq ABSTRACT Mosul dam is one of the biggest hydraulic structures in Iraq. It is located on Tigris River north Iraq and was selected as a case study to predict flood disasters caused by a hypothetical Mosul dam failure due to its foundation defect in which the dam had been survive since 1986 (initial time of dam operation). It is an earth-fill zoned dam with 105 meter height and 11.1 billion cubic meter of volume capacity. The objectives of the present research were to predict the characteristics of the flood wave due to a hypothetical Mosul dam break and to estimate damaged areas downstream, specially in Mosul city (the second largest city in Iraq), applying the simplified dam break model (SMPDBK) and utilizing the geographic information system. Many scenarios of dam operation were utilized to simulate dam failure at various degrees of severity. In case of the dam failure of high severity (330 m.a.s.l.) Mosul city locating 60 km from Mosul dam will be inundated with the highest flooding level of 235.2 meter above sea level, the maximum flood discharge will be (207632) m3/sec with an average velocity of 3.5 m/sec, while the highest water level will reach (25.3) meter above the natural Tigris River bed within (9) hours from the beginning of the dam failure. The flooded area between the dam site and Mosul city was 252 km2, while the maximum percentage of the inundated area within Mosul city will be about (54%) of the whole area of the city. The output of the channel routing process between Mosul dam site and Mosul city will be the attenuation of the peak discharge during the dam failure by a percentages ranging from (43 to 38)%. Finally, the main constructions which will be inundated in Mosul city were recognized. Relevant organizations in public sectors can utilize this information and prepare strategic plans to reduce the impact of life loss and assets of government and local people in the downstream areas of the dam. Keywords: Inundation, Mosul dam, Flood, Dam Failure. INTRODUCTION Dam is a ubiquitously disputed subject ranging from its benefits, the effects of dam construction towards the ecology system, the collapse of local communities, and epidemic diseases. In addition, the failure of large dam that might immediately occur could lead to tremendous loss of lives and assets.
Thirteenth International Water Technology Conference, IWTC 13 2009, Hurghada, Egypt ���
Risk assessment studies consider the failure of embankment dams often make use of breach parameter prediction methods that have been developed from analysis of historic dam failures. Similarly, prediction of peak breach outflow can also be using relations developed from case study data. Dam failure can be caused by overtopping a dam due to un-sufficient spillways capacity during large inflow to the reservoir, by seepage or piping through the dam or along internal conduits, slope embankment slides, earthquake damage and liquidation of earthen dams from earthquakes or landslide generated waves within reservoir. When a dam is breached catastrophic flash flooding occurs as the impounded water escape through the gap into downstream channel. The outflow flood hydrograph from a dam failure depends on many factors. The primary factors are the physical characteristics of the dam, the volume of reservoir and mode of failure. The parameters which control magnitude of the peak discharge and the slope of hydrograph include; the breach dimensions; the manner and length of time for breach to develop; the depth and volume of water stored in reservoir and inflow to reservoir at time of failure. A study conducted by Middlebrooks (1952) into causes of 220 earth dam failure during the period 1850-1950 summarizes observed caused agent and their frequency of occurrence prior to 1980s, little analytical work had been done on numerically describing the mechanics of failure. The extent of an affected downstream area by a flood wave resulting from a theoretical dam breach is a function of both the height of the flood wave and the downstream distance and width of the river at a particular location. An associated and important factor is the flood wave travel time (Attalla, 2002). The flood wave should be routed downstream the point where no the effect of the failure will be longer have negative consequences. There are numerous tools available today for analyzing dams’ failures and their resulting outflow hydrographs. Some of the best known and most widely used are the National weather service (NWS) Dam Break Flood forecasting model (DAMBRK); the U.S. Army corps of Engineer Hydrologic Engineering Center Flood Hydrograph package, HEC-1 (Hydrologic Engineering Center, 1981); and the NWS simplified Dam-Break Flood forecasting model, SMPDBRK (Wetmore and Fread 1983). One of these models is DAMBRK which is the most widely used. Wurbs (1987) discussed and compared the state of the art models available at that time and recommended the use of DAMBRK or SMPDBK depending on the level of accuracy required and resources and input data available. Dam break flood routing models e.g. DAMBRK (Fread, 1984) and FLDWAV (Fread, 1993) simulate the outflow from a reservoir and through the downstream valley resulting from a developing breach in a dam. These models focus their computational effort on the routing of the breach outflow hydrograph. The development of the breach is idealized as a parametric process, defined by the shape of the breach, its final size and the time required for its development (often called failure time).
Thirteenth International Water Technology Conference, IWTC 13 2009, Hurghada, Egypt
���
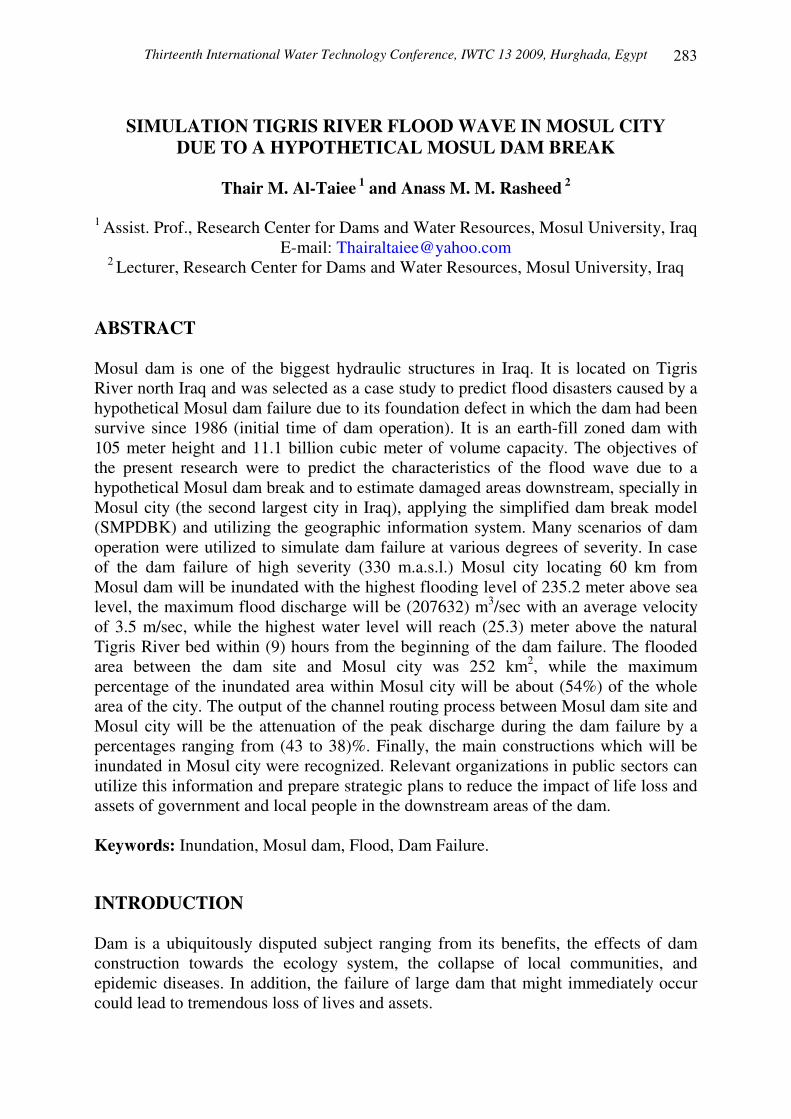
Thompson (1987) also compared DAMBRK and SMPDBK and recommended the use of SMPDBK as a screening tool and DAMBRK for more detailed analysis. Babb and Mermel (1988) summarized over 600 dam incidents throughout the world but high quality detailed information was lacking in most cases. During the 1980s several authors compiled data bases of well documented case studies for breach parameters or peak breach outflows (SCS, 1981; Singh and Snorrason 1982; MacDonald and Langridge_Monopolis, 1984; Costa, 1985; Froehlich, 1987, 1995b; and Singh and Scarlators, 1988). STATEMENT OF THE PROBLEM As being Mosul dam is one of the most significant strategic projects in Iraq since any defect or failure that may happen in the dam God forbid will be a catastrophic effects on the population living downstream of this dam specially on Mosul city located on Tigris River 60 km downstream the dam site and having 1.7 million of population, Figure (1).
The basic problem in this dam is in the continuous deterioration in the dam foundations which contain gypsum and anhydrite formations that dissolve under the
Figure (1) Location Map of the study area
Thirteenth International Water Technology Conference, IWTC 13 2009, Hurghada, Egypt ���
effect of storing water in the dam reservoir head resulting in some phenomena such as fractures and infiltration that need a continuous treatment to reinforce this foundation. Finishing the building of Mosul dam and being into action in 1986, the problem of gypsum dissolving under the dam foundations came out and since the treatment has begun through grouting and cements injections to secure the dam safely which has been going on until now. As a result of this problem number of worrying geological phenomena such as infiltration in the left side, slides beside the right levee of the dam head, cavities in the foundation depth have been occurred and a fractures are appeared very close to the left side of the dam at distance 60 meter from the spillway with the increasing of infiltration quantities from the springs in this area (WWW.The Mosul dams press statement.mht, 2007). Therefore it is an important and mandatory to predict the flood caused by dam failure due to these reasons. This task can be accomplished by developing a model of dam collapse such as SMPDBK model and considering volume of water storage, water level, velocity and time taken for flood wave from dam to downstream area. A map demonstrating the flooded area and estimating the loss from such incident can then be produced. This information can be useful in planning, disasters announcement measures and evacuation of people living downstream area. THE AIM OF THE RESEARCH For all the above reasons, the aim of this research work is to simulate the flood wave in Tigris River downstream Mosul dam as a result of a hypothetical failure describing the inundation area focusing on Mosul city predicting the maximum depth covering the city by preparing maps delineating these flooded areas along the Tigris River and indicating the travel time of flood wave on every significant habitation along the river reach. A computer model called simplified dam break model (SMPDBK) will be used for such problem. This model is adopted due to its simplicity and it allows for the investigation of partial failure occurring over a finite interval of time. The basic equations utilized by the model is the Saint Venant equations of unsteady flow which are the continuity and momentum equations which in-turn based on conservation of mass and momentum equations. Such research work will be useful in accomplishing the evacuation plans that should be taken into consideration by the responsible authority in case if there is a probability of dam collapse to eliminate the hazards and the damages that may occur in the life and the assets downstream the dam. Description of Mosul Dam Mosul dam which has been built since 1985 is 100 meter height and of zoned earth filling type having a mud central core. It is a multipurpose project, for flood control and to store water with a volume of 11.11 billion cubic meters at the maximum operation level of the dam for the generating electric power and exploiting the reservoir behind for irrigation and tourist purposes. It is situated on the Tigris River at
Thirteenth International Water Technology Conference, IWTC 13 2009, Hurghada, Egypt
���
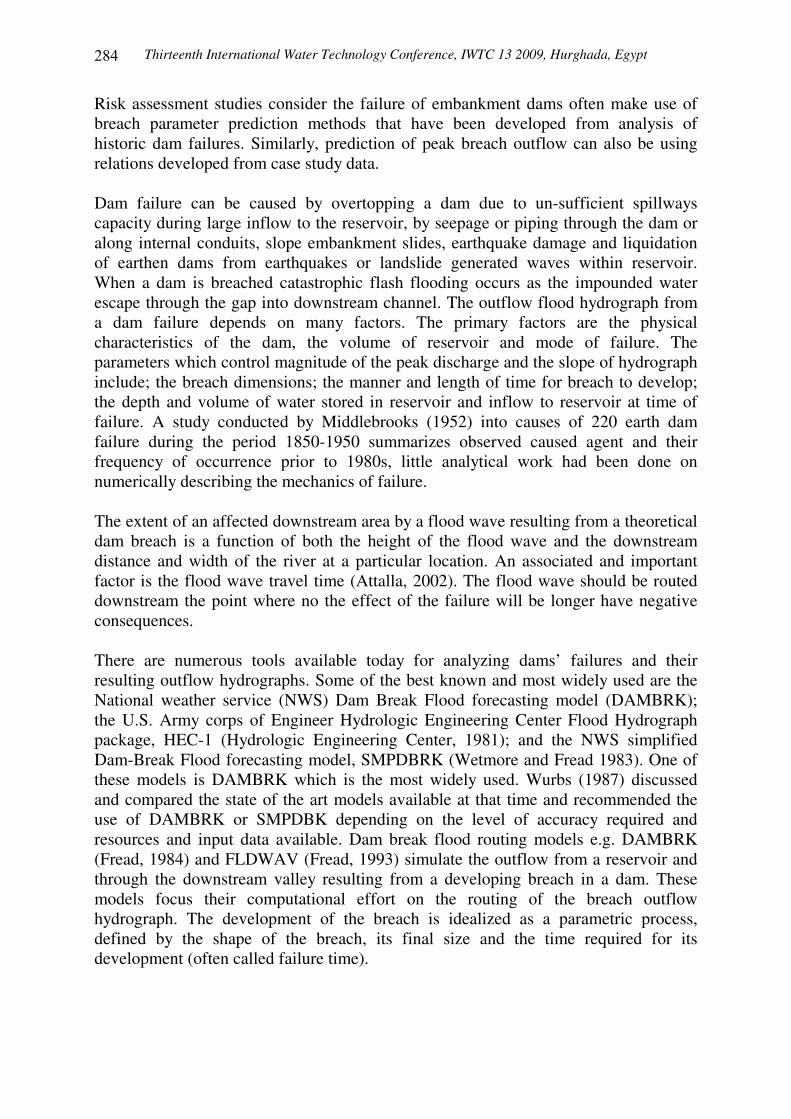
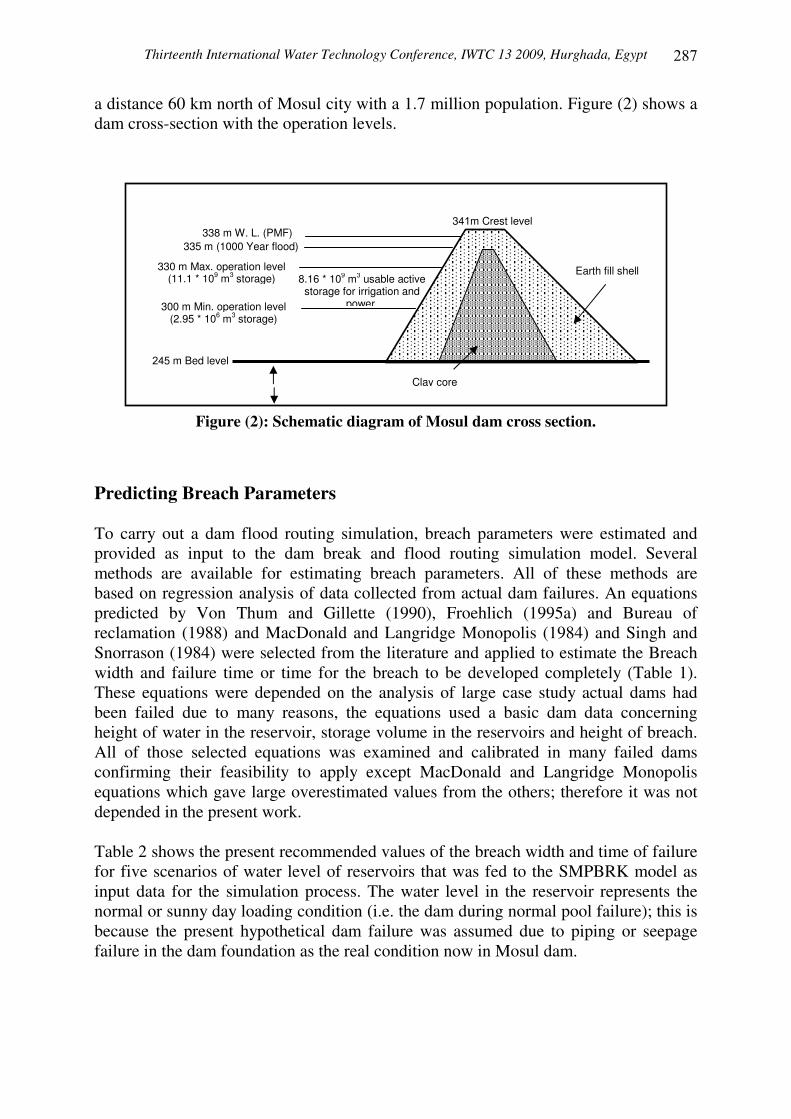
a distance 60 km north of Mosul city with a 1.7 million population. Figure (2) shows a dam cross-section with the operation levels. Predicting Breach Parameters To carry out a dam flood routing simulation, breach parameters were estimated and provided as input to the dam break and flood routing simulation model. Several methods are available for estimating breach parameters. All of these methods are based on regression analysis of data collected from actual dam failures. An equations predicted by Von Thum and Gillette (1990), Froehlich (1995a) and Bureau of reclamation (1988) and MacDonald and Langridge Monopolis (1984) and Singh and Snorrason (1984) were selected from the literature and applied to estimate the Breach width and failure time or time for the breach to be developed completely (Table 1). These equations were depended on the analysis of large case study actual dams had been failed due to many reasons, the equations used a basic dam data concerning height of water in the reservoir, storage volume in the reservoirs and height of breach. All of those selected equations was examined and calibrated in many failed dams confirming their feasibility to apply except MacDonald and Langridge Monopolis equations which gave large overestimated values from the others; therefore it was not depended in the present work. Table 2 shows the present recommended values of the breach width and time of failure for five scenarios of water level of reservoirs that was fed to the SMPBRK model as input data for the simulation process. The water level in the reservoir represents the normal or sunny day loading condition (i.e. the dam during normal pool failure); this is because the present hypothetical dam failure was assumed due to piping or seepage failure in the dam foundation as the real condition now in Mosul dam.
Figure (2): Schematic diagram of Mosul dam cross section.
330 m Max. operation level (11.1 * 109 m3 storage)
�45 m Bed level
338 m W. L. (PMF)
300 m Min. operation level (2.95 * 106 m3 storage)
34�m Crest level
335 m (1000 Year flood)
8.16 * 109 m3 usable active storage for irrigation and
power.
Clay core
Earth fill shell
Thirteenth International Water Technology Conference, IWTC 13 2009, Hurghada, Egypt ���
Table (1) Breach width and failure time
Author Water level in
reservoir (m.a.s.l)
Water height in reservoir
(m)
Breach width (m)
Failure time (hr)
290 40 155 1.05 300 50 189 1.25 310 60 205 1.45 320 70 230 1.65
Von Thum (1990)
330 80 255 1.85 290 40 388 3.55 300 50 431 4.23 310 60 533 6.00 320 70 612 7.57
Froehlich (1995a)
330 80 694 9.30 290 40 120 1.32 300 50 150 1.65 310 60 180 1.98 320 70 210 2.31
Bureau of Reclamation (1988)
330 80 240 2.64 290 40 175 0.25 300 50 210 0.44 310 60 245 0.62 320 70 280 0.82
Singh and Snorrason (1984)
330 80 315 1.00
Table (2) Recommended breach width and failure time
Scenario number
Water level in the dam (m.a.s.l.)
Water height
(m)
Storage volume
(109) m3
Surface area of
reservoir (106) m2
Recommended Breach width
(m)
Recommended Failure time
(hr)
1 290 40 1.8 120 209 1.53 2 300 50 2.5 170 243 1.85 3 310 60 4.85 230 291 2.44 4 320 70 7.5 300 333 2.99 5 330 80 11.1 385 376 3.56
Concerning breach shape, for earth dams it was described as varying from triangular to trapezoidal as the breach processed. The great majority in the dam breach described as trapezoidal in the literature. Froehlich (1995a) suggested a value for the side slope of breach assuming to be 1.4 for overtopping failure or 0.9 for other failure modes noting that the average side slope factor for the 63 case studies of failed dams was nearly 1. In the present simulation process using SMPDBK model, seepage or piping in the dam body was proposed to be the reason of dam failure. Concerning breach shape, although
Thirteenth International Water Technology Conference, IWTC 13 2009, Hurghada, Egypt
���
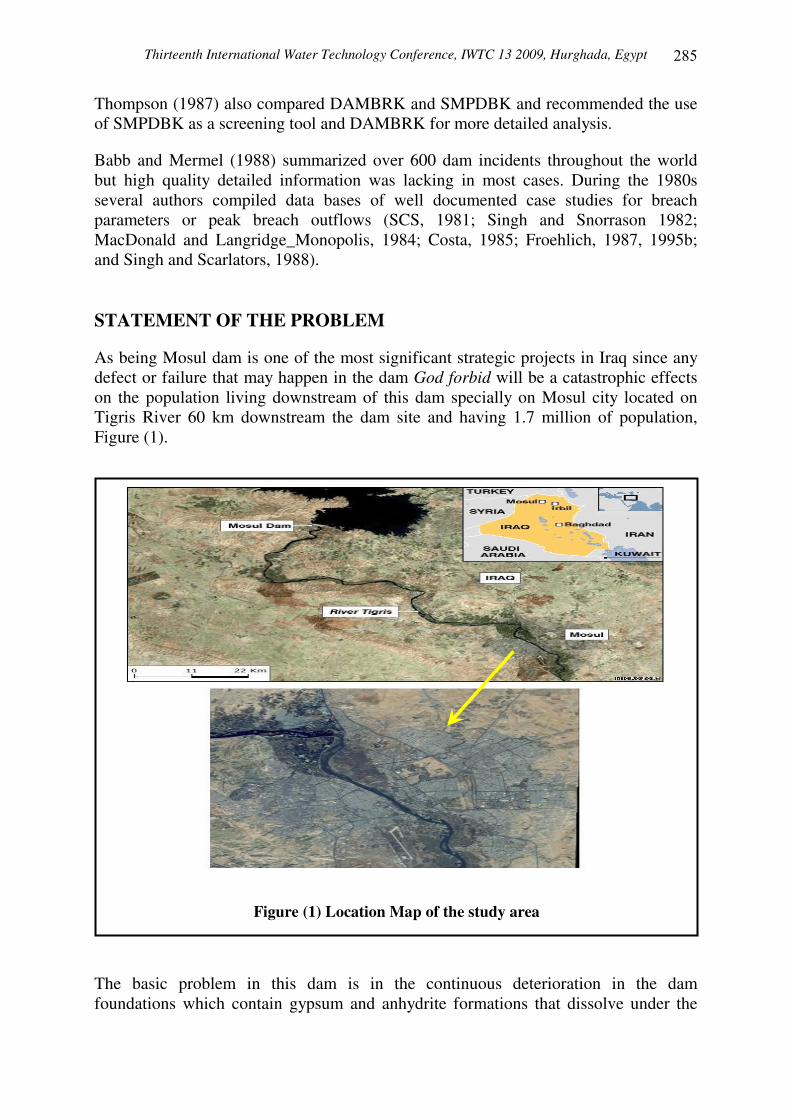
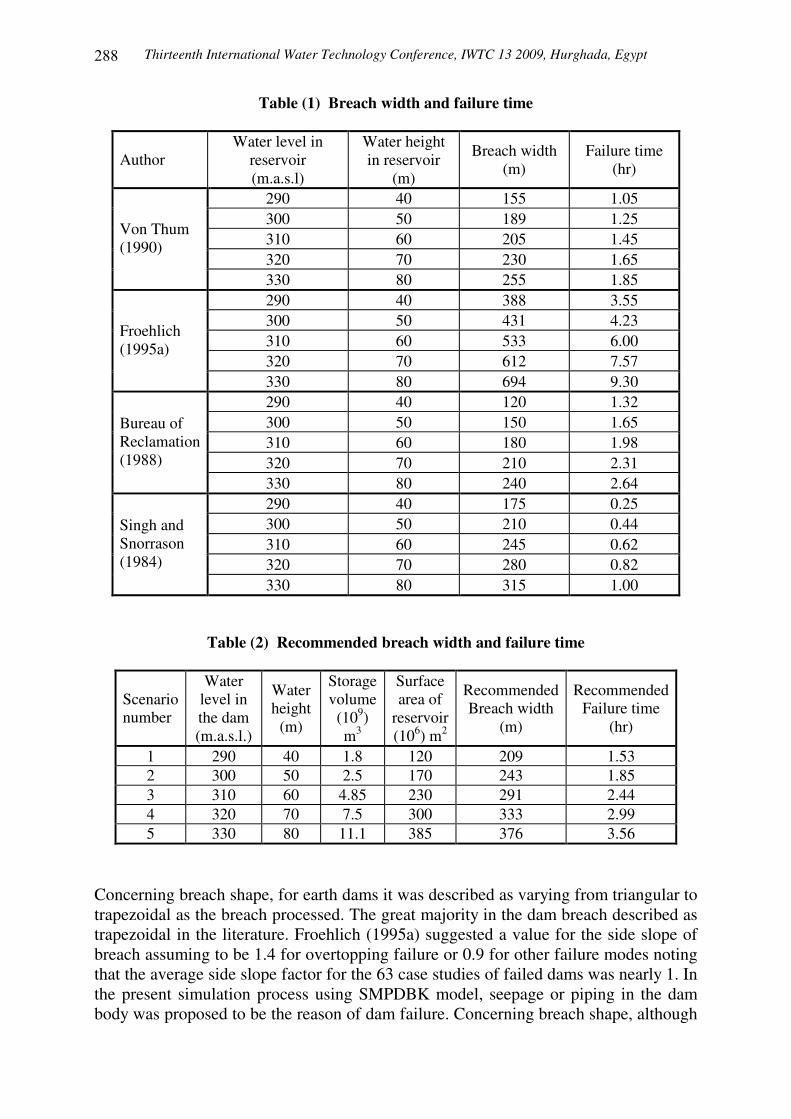
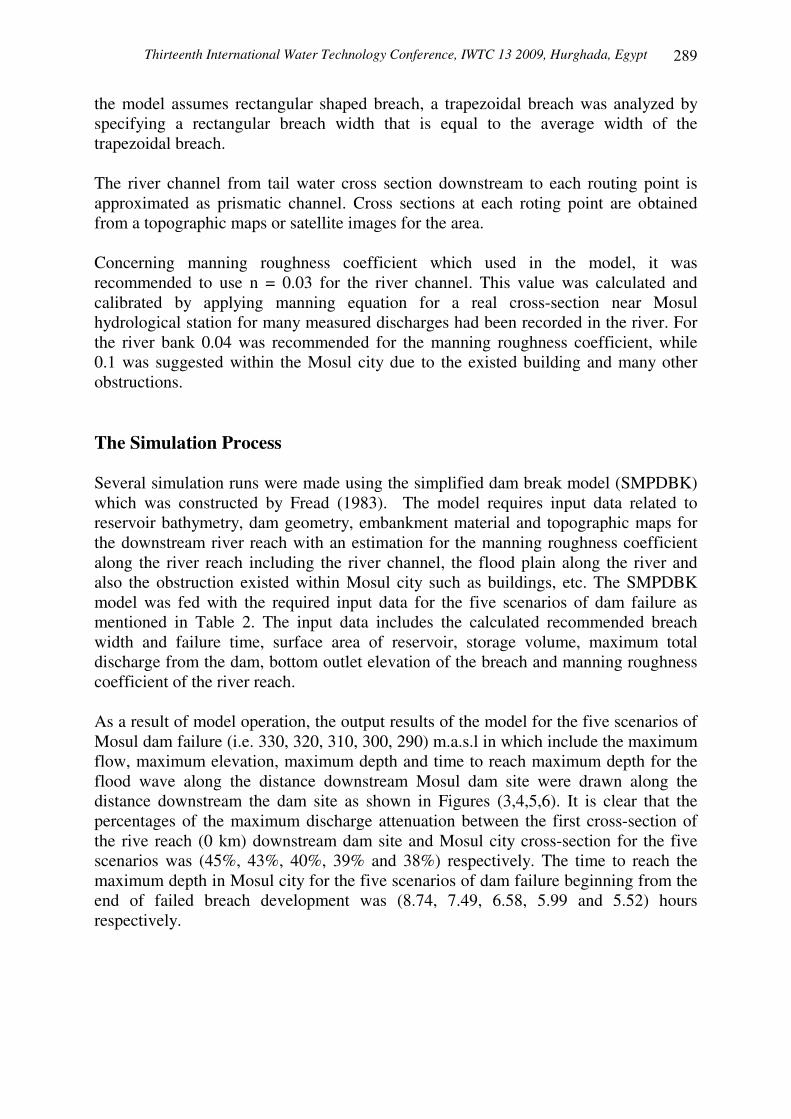
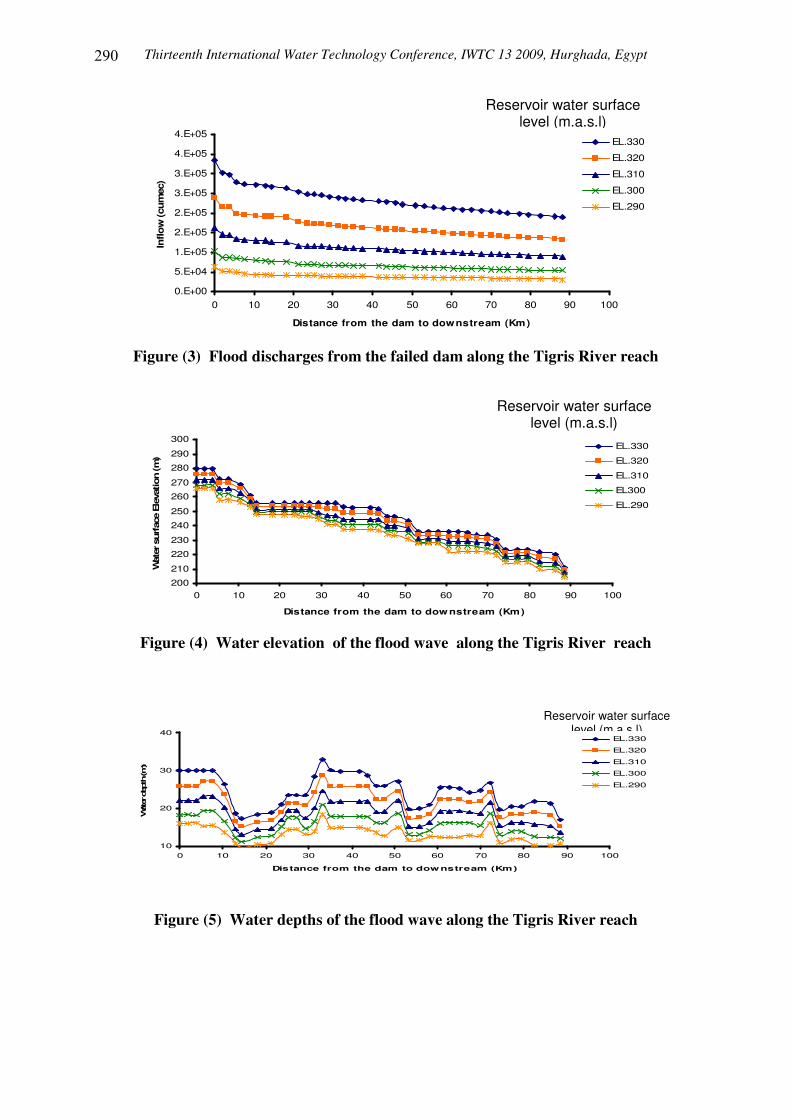
the model assumes rectangular shaped breach, a trapezoidal breach was analyzed by specifying a rectangular breach width that is equal to the average width of the trapezoidal breach. The river channel from tail water cross section downstream to each routing point is approximated as prismatic channel. Cross sections at each roting point are obtained from a topographic maps or satellite images for the area. Concerning manning roughness coefficient which used in the model, it was recommended to use n = 0.03 for the river channel. This value was calculated and calibrated by applying manning equation for a real cross-section near Mosul hydrological station for many measured discharges had been recorded in the river. For the river bank 0.04 was recommended for the manning roughness coefficient, while 0.1 was suggested within the Mosul city due to the existed building and many other obstructions. The Simulation Process Several simulation runs were made using the simplified dam break model (SMPDBK) which was constructed by Fread (1983). The model requires input data related to reservoir bathymetry, dam geometry, embankment material and topographic maps for the downstream river reach with an estimation for the manning roughness coefficient along the river reach including the river channel, the flood plain along the river and also the obstruction existed within Mosul city such as buildings, etc. The SMPDBK model was fed with the required input data for the five scenarios of dam failure as mentioned in Table 2. The input data includes the calculated recommended breach width and failure time, surface area of reservoir, storage volume, maximum total discharge from the dam, bottom outlet elevation of the breach and manning roughness coefficient of the river reach. As a result of model operation, the output results of the model for the five scenarios of Mosul dam failure (i.e. 330, 320, 310, 300, 290) m.a.s.l in which include the maximum flow, maximum elevation, maximum depth and time to reach maximum depth for the flood wave along the distance downstream Mosul dam site were drawn along the distance downstream the dam site as shown in Figures (3,4,5,6). It is clear that the percentages of the maximum discharge attenuation between the first cross-section of the rive reach (0 km) downstream dam site and Mosul city cross-section for the five scenarios was (45%, 43%, 40%, 39% and 38%) respectively. The time to reach the maximum depth in Mosul city for the five scenarios of dam failure beginning from the end of failed breach development was (8.74, 7.49, 6.58, 5.99 and 5.52) hours respectively.
Thirteenth International Water Technology Conference, IWTC 13 2009, Hurghada, Egypt ��
0.E+00
5.E+04
1.E+05
2.E+05
2.E+05
3.E+05
3.E+05
4.E+05
4.E+05
0 10 20 30 40 50 60 70 80 90 100
Distance from the dam to downstream (Km)
Inflo
w (cu
mec
)
EL.330
EL.320
EL.310
EL.300
EL.290
Figure (3) Flood discharges from the failed dam along the Tigris River reach
200
210
220
230
240
250
260
270
280
290
300
0 10 20 30 40 50 60 70 80 90 100
Distance from the dam to downstream (Km)
Wat
er s
urf
ace
Ele
vation (m
)
EL.330
EL.320
EL.310
EL300
EL.290
Figure (4) Water elevation of the flood wave along the Tigris River reach
Figure (5) Water depths of the flood wave along the Tigris River reach
10
20
30
40
0 10 20 30 40 50 60 70 80 90 100
Distance from the dam to downstream (Km)
Wat
er dep
th (m)
EL.330
EL.320
EL.310
EL.300
EL.290
Reservoir water surface level (m.a.s.l)
Reservoir water surface level (m.a.s.l)
Reservoir water surface level (m.a.s.l)
Thirteenth International Water Technology Conference, IWTC 13 2009, Hurghada, Egypt
��
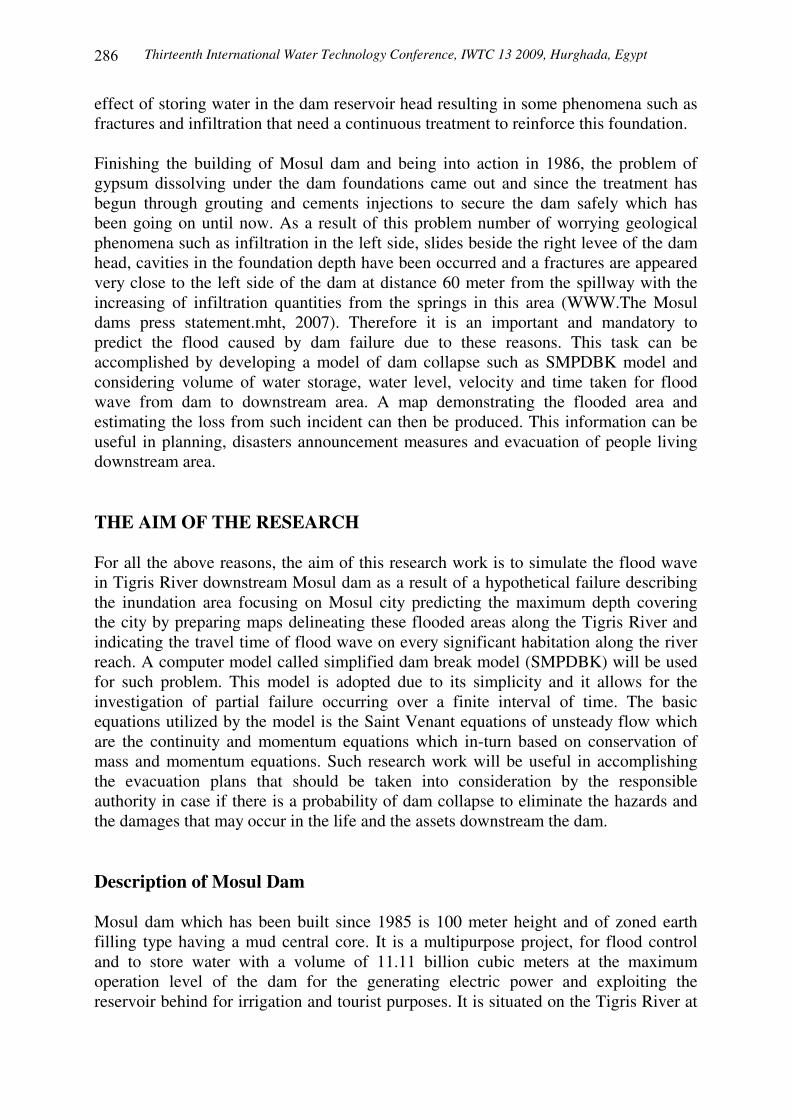
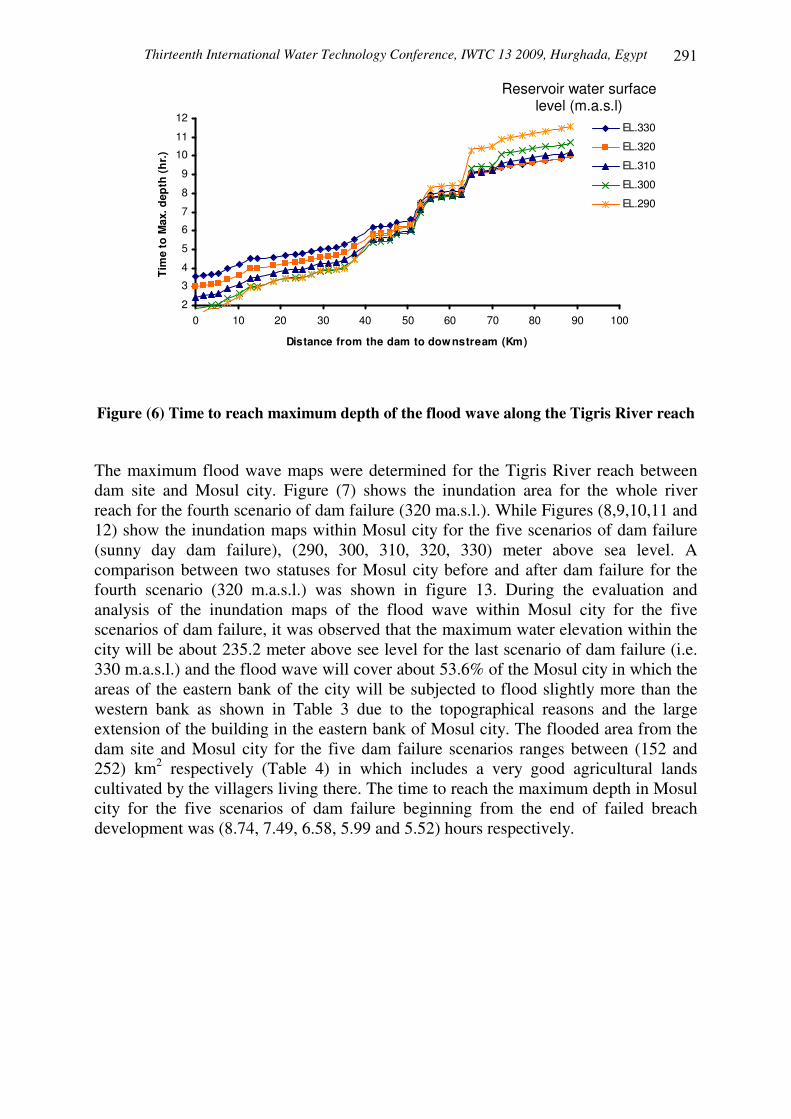
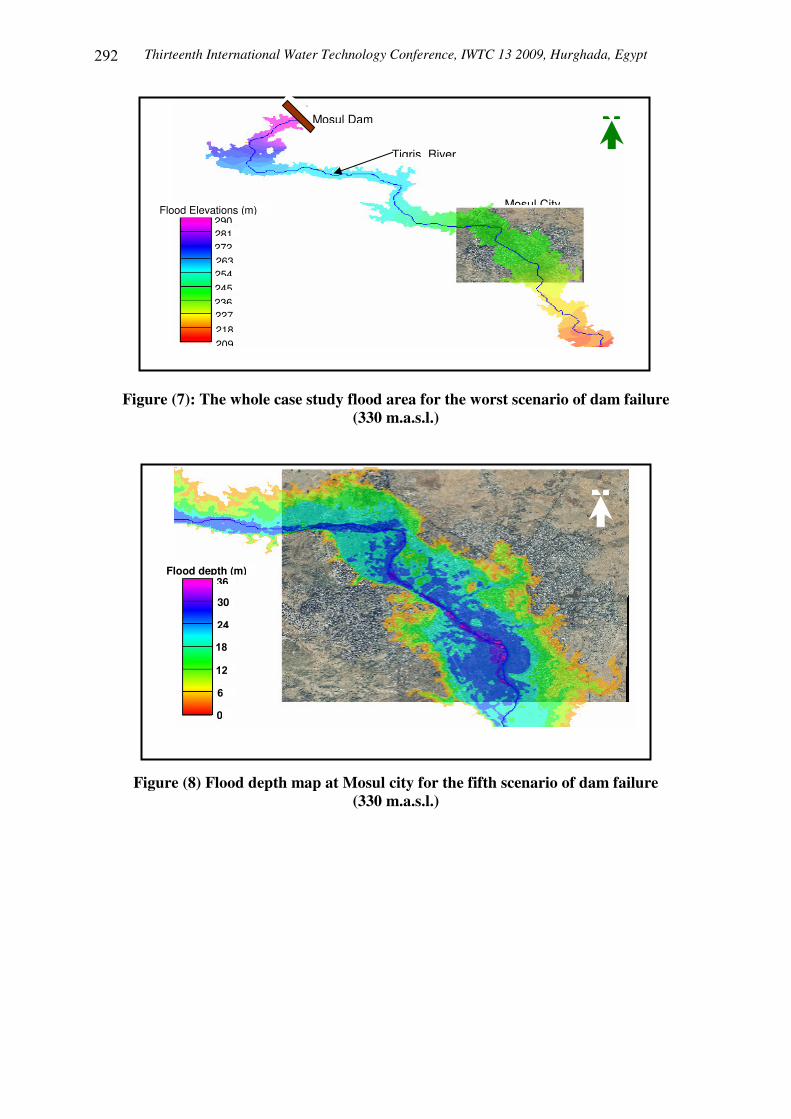
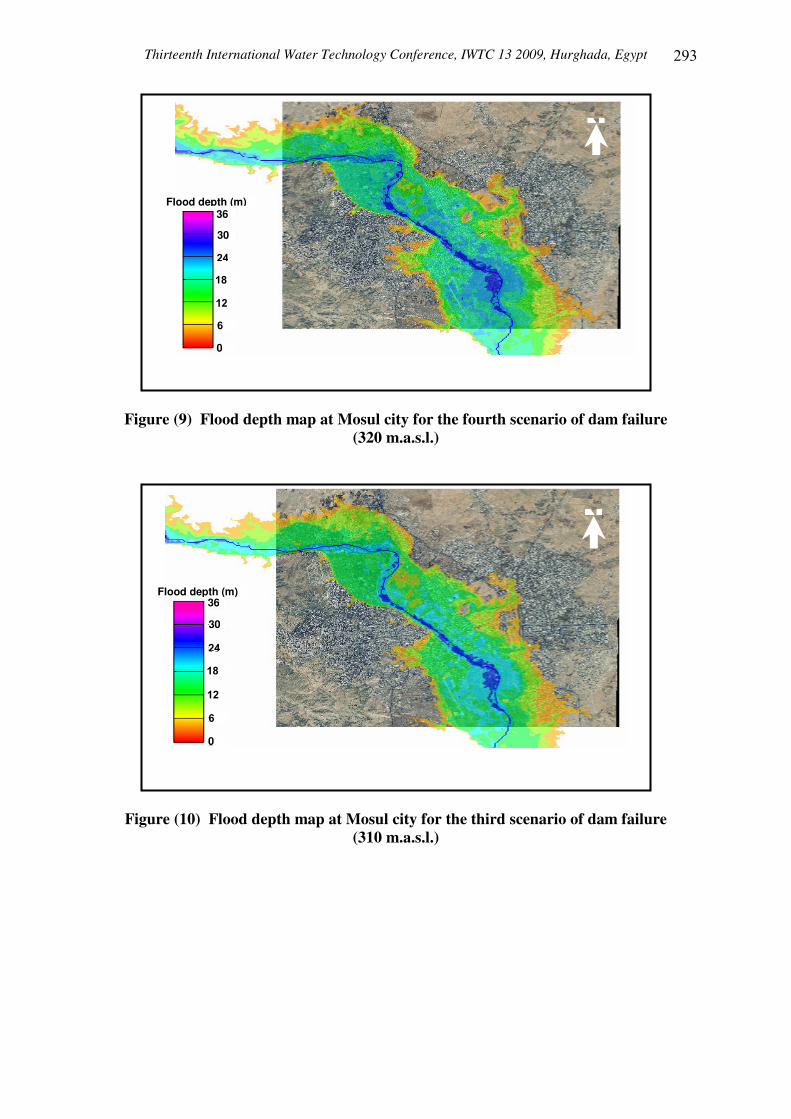
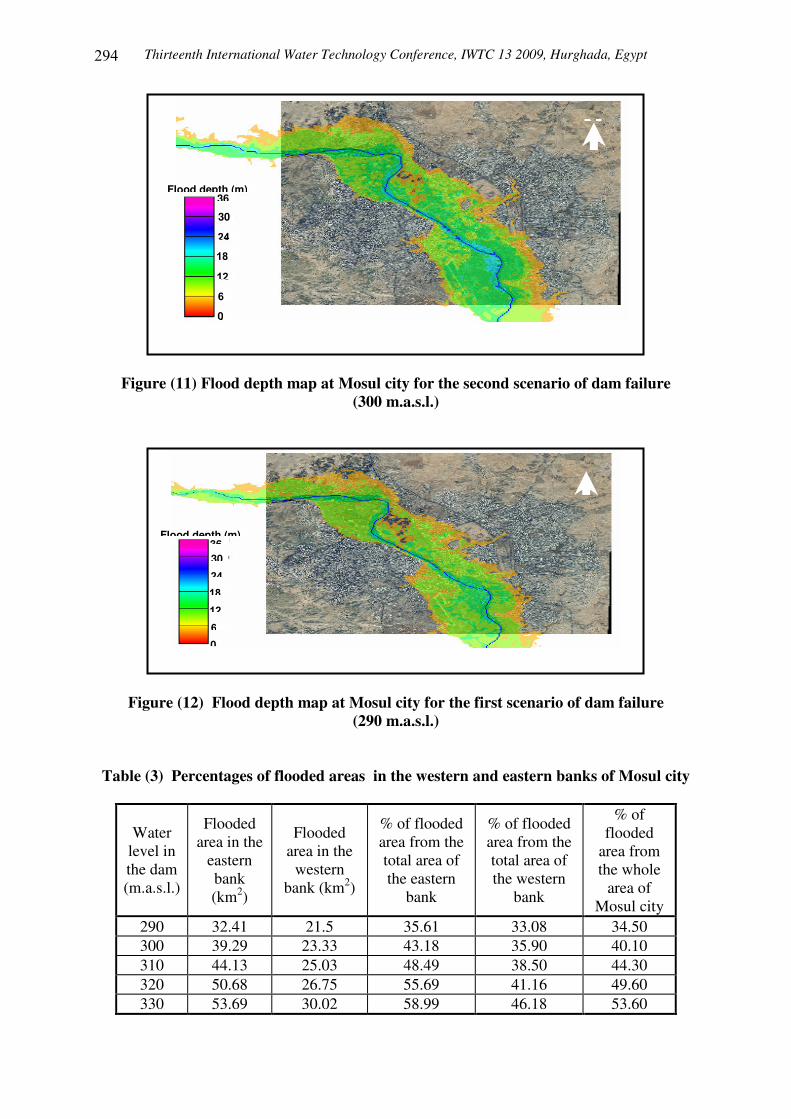
Figure (6) Time to reach maximum depth of the flood wave along the Tigris River reach The maximum flood wave maps were determined for the Tigris River reach between dam site and Mosul city. Figure (7) shows the inundation area for the whole river reach for the fourth scenario of dam failure (320 ma.s.l.). While Figures (8,9,10,11 and 12) show the inundation maps within Mosul city for the five scenarios of dam failure (sunny day dam failure), (290, 300, 310, 320, 330) meter above sea level. A comparison between two statuses for Mosul city before and after dam failure for the fourth scenario (320 m.a.s.l.) was shown in figure 13. During the evaluation and analysis of the inundation maps of the flood wave within Mosul city for the five scenarios of dam failure, it was observed that the maximum water elevation within the city will be about 235.2 meter above see level for the last scenario of dam failure (i.e. 330 m.a.s.l.) and the flood wave will cover about 53.6% of the Mosul city in which the areas of the eastern bank of the city will be subjected to flood slightly more than the western bank as shown in Table 3 due to the topographical reasons and the large extension of the building in the eastern bank of Mosul city. The flooded area from the dam site and Mosul city for the five dam failure scenarios ranges between (152 and 252) km2 respectively (Table 4) in which includes a very good agricultural lands cultivated by the villagers living there. The time to reach the maximum depth in Mosul city for the five scenarios of dam failure beginning from the end of failed breach development was (8.74, 7.49, 6.58, 5.99 and 5.52) hours respectively.
2
3
4
5
6
7
8
9
10
11
12
0 10 20 30 40 50 60 70 80 90 100
Distance from the dam to downstream (Km)
Tim
e to
Max
. dep
th (h
r.)
EL.330
EL.320
EL.310
EL.300
EL.290
Reservoir water surface level (m.a.s.l)
Thirteenth International Water Technology Conference, IWTC 13 2009, Hurghada, Egypt ���
Figure (7): The whole case study flood area for the worst scenario of dam failure (330 m.a.s.l.)
Figure (8) Flood depth map at Mosul city for the fifth scenario of dam failure (330 m.a.s.l.)
0
�
��
��
��
30
36 Flood depth (m)
��
��������
209
290
227 218
281
236 245 254 263 272
Flood Elevations (m)
�������� Mosul Dam
Mosul City
Tigris River
Thirteenth International Water Technology Conference, IWTC 13 2009, Hurghada, Egypt
���
Figure (9) Flood depth map at Mosul city for the fourth scenario of dam failure (320 m.a.s.l.)
Figure (10) Flood depth map at Mosul city for the third scenario of dam failure (310 m.a.s.l.)
0
�
��
��
��
30
36 Flood depth (m)
��������
��
��
��
��
0
�
��
��
��
30
36 Flood depth (m)
��������
Thirteenth International Water Technology Conference, IWTC 13 2009, Hurghada, Egypt ���
Figure (11) Flood depth map at Mosul city for the second scenario of dam failure (300 m.a.s.l.)
Figure (12) Flood depth map at Mosul city for the first scenario of dam failure (290 m.a.s.l.)
Table (3) Percentages of flooded areas in the western and eastern banks of Mosul city
Water level in the dam (m.a.s.l.)
Flooded area in the
eastern bank (km2)
Flooded area in the
western bank (km2)
% of flooded area from the total area of the eastern
bank
% of flooded area from the total area of the western
bank
% of flooded
area from the whole
area of Mosul city
290 32.41 21.5 35.61 33.08 34.50 300 39.29 23.33 43.18 35.90 40.10 310 44.13 25.03 48.49 38.50 44.30 320 50.68 26.75 55.69 41.16 49.60 330 53.69 30.02 58.99 46.18 53.60
��
0
�
��
��
��
30
36 Flood depth (m)
��������
��
0
�
��
�� ��
30 36
Flood depth (m)
��������
Thirteenth International Water Technology Conference, IWTC 13 2009, Hurghada, Egypt
���
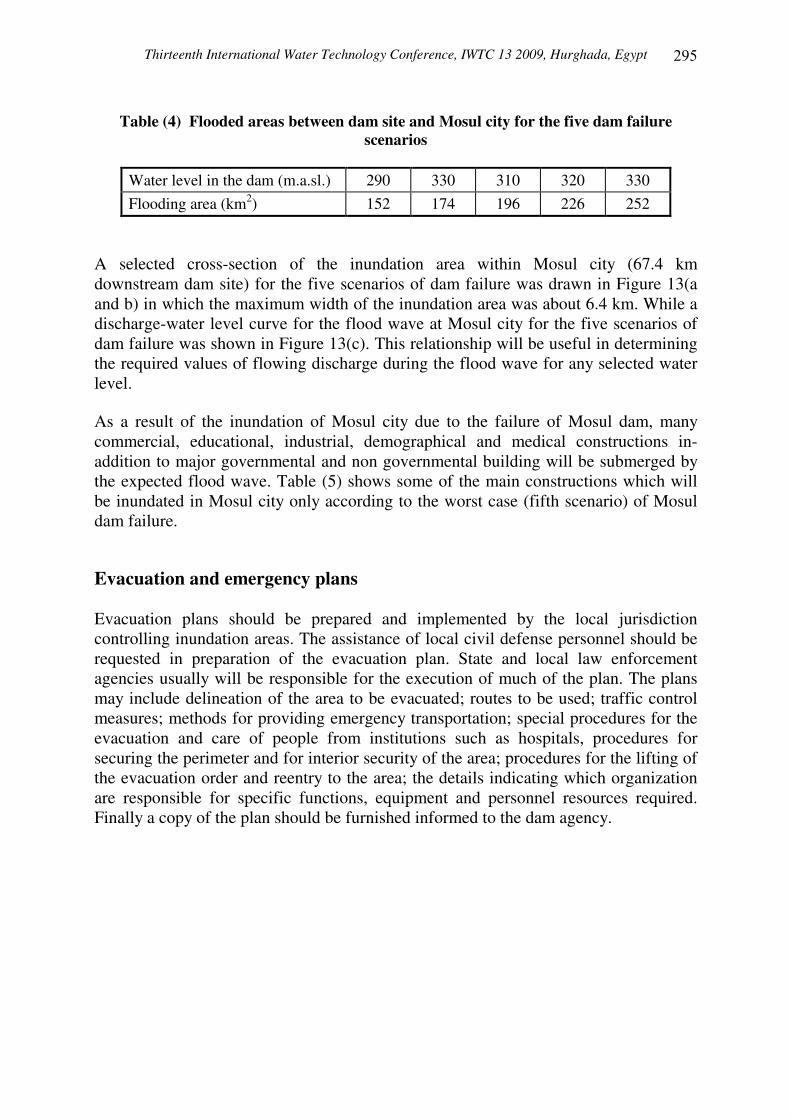
Table (4) Flooded areas between dam site and Mosul city for the five dam failure
scenarios
Water level in the dam (m.a.sl.) 290 330 310 320 330 Flooding area (km2) 152 174 196 226 252
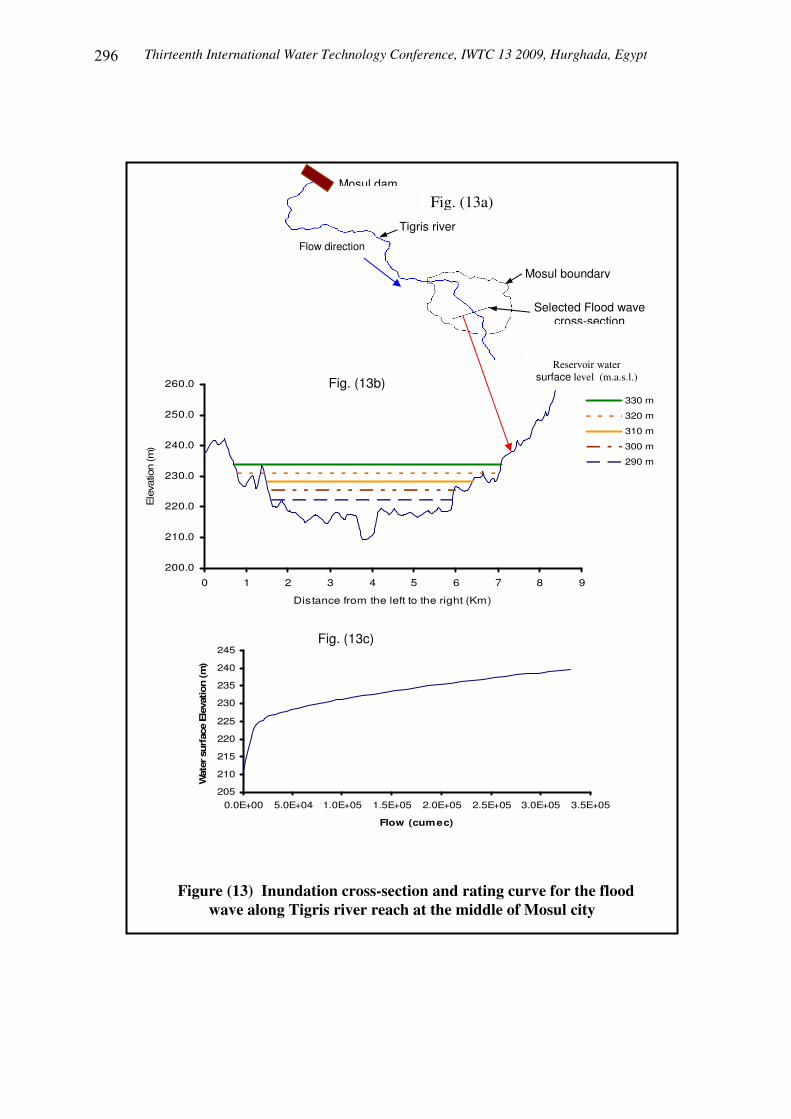
A selected cross-section of the inundation area within Mosul city (67.4 km downstream dam site) for the five scenarios of dam failure was drawn in Figure 13(a and b) in which the maximum width of the inundation area was about 6.4 km. While a discharge-water level curve for the flood wave at Mosul city for the five scenarios of dam failure was shown in Figure 13(c). This relationship will be useful in determining the required values of flowing discharge during the flood wave for any selected water level. As a result of the inundation of Mosul city due to the failure of Mosul dam, many commercial, educational, industrial, demographical and medical constructions in-addition to major governmental and non governmental building will be submerged by the expected flood wave. Table (5) shows some of the main constructions which will be inundated in Mosul city only according to the worst case (fifth scenario) of Mosul dam failure. Evacuation and emergency plans Evacuation plans should be prepared and implemented by the local jurisdiction controlling inundation areas. The assistance of local civil defense personnel should be requested in preparation of the evacuation plan. State and local law enforcement agencies usually will be responsible for the execution of much of the plan. The plans may include delineation of the area to be evacuated; routes to be used; traffic control measures; methods for providing emergency transportation; special procedures for the evacuation and care of people from institutions such as hospitals, procedures for securing the perimeter and for interior security of the area; procedures for the lifting of the evacuation order and reentry to the area; the details indicating which organization are responsible for specific functions, equipment and personnel resources required. Finally a copy of the plan should be furnished informed to the dam agency.
Thirteenth International Water Technology Conference, IWTC 13 2009, Hurghada, Egypt ���
Fig. (13c)��
Fig. (13b)��
Selected Flood wave cross-section
200.0
210.0
220.0
230.0
240.0
250.0
260.0
0 1 2 3 4 5 6 7 8 9
Distance from the left to the right (Km)
Ele
vatio
n (m
)
330 m
320 m
310 m
300 m
290 m
205
210
215
220
225
230
235
240
245
0.0E+00 5.0E+04 1.0E+05 1.5E+05 2.0E+05 2.5E+05 3.0E+05 3.5E+05
Flow (cumec)
Wat
er s
urf
ace
Ele
vation
(m
)
Figure (13) Inundation cross-section and rating curve for the flood wave along Tigris river reach at the middle of Mosul city
��
��
Mosul boundary
Tigris river
Mosul dam
Flow direction
Fig. (13b)
Fig. (13c)
Reservoir water surface level (m.a.s.l.)
Fig. (13a)
Thirteenth International Water Technology Conference, IWTC 13 2009, Hurghada, Egypt
���
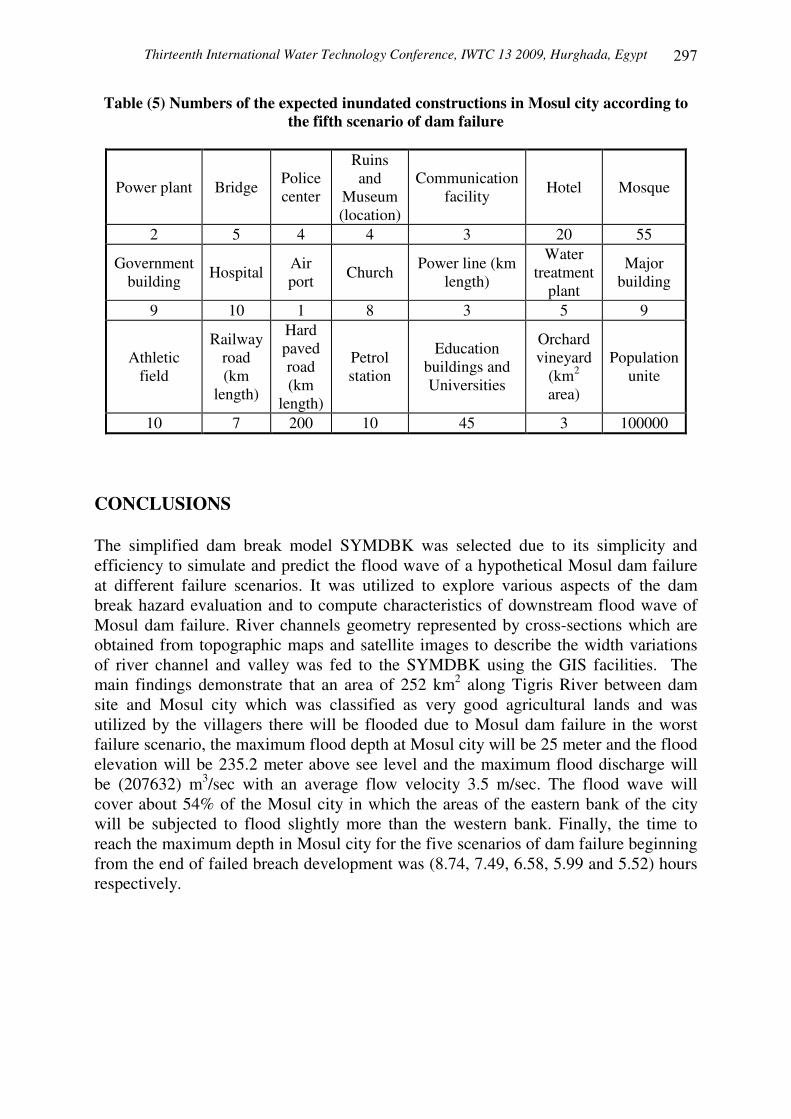
Table (5) Numbers of the expected inundated constructions in Mosul city according to the fifth scenario of dam failure
Power plant Bridge Police center
Ruins and
Museum (location)
Communication facility Hotel Mosque
2 5 4 4 3 20 55
Government building Hospital Air
port Church Power line (km length)
Water treatment
plant
Major building
9 10 1 8 3 5 9
Athletic field
Railway road (km
length)
Hard paved road (km
length)
Petrol station
Education buildings and Universities
Orchard vineyard
(km2 area)
Population unite
10 7 200 10 45 3 100000 CONCLUSIONS The simplified dam break model SYMDBK was selected due to its simplicity and efficiency to simulate and predict the flood wave of a hypothetical Mosul dam failure at different failure scenarios. It was utilized to explore various aspects of the dam break hazard evaluation and to compute characteristics of downstream flood wave of Mosul dam failure. River channels geometry represented by cross-sections which are obtained from topographic maps and satellite images to describe the width variations of river channel and valley was fed to the SYMDBK using the GIS facilities. The main findings demonstrate that an area of 252 km2 along Tigris River between dam site and Mosul city which was classified as very good agricultural lands and was utilized by the villagers there will be flooded due to Mosul dam failure in the worst failure scenario, the maximum flood depth at Mosul city will be 25 meter and the flood elevation will be 235.2 meter above see level and the maximum flood discharge will be (207632) m3/sec with an average flow velocity 3.5 m/sec. The flood wave will cover about 54% of the Mosul city in which the areas of the eastern bank of the city will be subjected to flood slightly more than the western bank. Finally, the time to reach the maximum depth in Mosul city for the five scenarios of dam failure beginning from the end of failed breach development was (8.74, 7.49, 6.58, 5.99 and 5.52) hours respectively.
Thirteenth International Water Technology Conference, IWTC 13 2009, Hurghada, Egypt ���
REFERENCES: Attalla, T.A. (2002). A review on dams and breach parameters estimation. Master of Science Hydrosystem Engineering. Dept. of Civil and Environment. Virgina Polytechnic Institute and State University. Blacksburg. V.A.
Babb, A.O. and T.W. (1968). Cataloge of dam disasters. Failure and Accidents. Bureau of Reclamation, Washington, D.C.
Bureau of reclamation (1988). Downstream hazard classification guidelines. ACER. Tech. Memorandum No. 11, U.S. Dept. of the Interior. Denver, 57.
Costa, J.E. (1985). Floods from dam failure. U.S. geological survey, open File, Rep. No. 85-560, Denver, 54.
Fread, D.L. (1985). DAMBRK: The NWS dam-break flood forecasting model. National weather service. Office of Hydrology. Silver Spring Md.
Fread, D.L. (1993). NWS FLDWAV model; The replacement of Dam-BRK for dam break flood prediction. Dam safety 93 proc. 10th Annual ASDSO Conf. Association State Dam Safety Officials. Lexington, Ky, 177-184.
Froehlich, D.C. (1987). Embankment dam break parameters. Hydraulic Eng. Proc. ASCE National Conf. on Hydraulic Eng., New York, 570-575.
Froehlich, D.C. (1995a). Embankment dam breach parameters revisited. Water Resources Eng. Proc. 1995 ASCE Conf. on Water Resources Eng., New York. 887-891.
Froehlich, D.C. (1995b).Peak outflow from breached embankment dam. J. Water Resources Plan Manage. Div. Am. Soc. Civil Eng. 121(1),90-97.
HEC-1 (1981). Flood Hydrograph package, USERs Manual, Hydrologic Eng. Center, U.S. Army Corps of Engineer, Davis, CA.
MacDonald, T.C. and Langridge-Monopolis, J. (1984). Breaching characteristics of dam failure. J. Hydraulic Eng. 110(5), 567-586.
Middlebrooks, T.A. Earth dam practice in the united stats, ASCE Centennial Transaction paper 2620, 1952. pp 697-722.
Singh, K.P. and Snorrason, A. (1984). Sensitivity of outflow peaks and flood stages to the selection of dam breach parameters and simulation models, J. Hydrology, 68, 295-310.
Singh, V.P. and Scarlatos, P.D. (1985). Breach erosion of earthfill dam flood routing Beed Model, Research Report, Army office, Battelle, Research Triangle Park, North Carolina, 131p.
Soil Conservation Service (SCS). (1981). Simplified dam breach routing procedure; Tech Release No. 66 (Rev.1), 39.

Thirteenth International Water Technology Conference, IWTC 13 2009, Hurghada, Egypt
���
Von Thum, J.L. and Gillette, D.R. (1990). Guidance on breach parameters. Internal Memorandum, U.S. Dept. of the Interior, Bureau of Reclamation Denver, 17.
Wetmore, J.N. and D.L. Fread (1983). The NWS simplified dam break model exution, Brief national weather service office of hydrology. Silver Spring, Maryland.
Wurbs, R.A. (1987). Dam breach flood wave models. Journal of Hydraulic Engineering, Vol. 113.
WWW. The Mosul dam Press. (2007).