Embed Size (px)
Citation preview

J. Fac. Pharm. Ankara / Ankara Ecz. Fak. Derg., 44(3): 506-516, 2020 Doi: 10.33483/jfpau.799897
ORIGINAL ARTICLE / ÖZGÜN MAKALE
SIMULTANEOUS QUANTITATIVE RESOLUTION AND
VALIDATION OF A BINARY MIXTURE IN A PHARMACEUTICAL
DOSAGE FORM BY USING A SPECTROPHOTOMETRIC SIGNAL
PROCESSING TECHNIQUE
FARMASÖTİK BİR PREPARATTAKİ İKİLİ KARIŞIMIN SPEKTROFOTOMETRİK
SİNYAL İŞLEME TEKNİĞİ KULLANILARAK AYNI ANDA MİKTAR TAYİNİ VE
VALİDASYONU
Özgür ÜSTÜNDAĞ* , Erdal DİNÇ
Ankara University, Faculty of Pharmacy, Department of Analytical Chemistry, Ankara, Turkey
ABSTRACT
Objective: In this context, a rapid and powerful signal processing approach, a ratio-derivative
spectrophotometry (RDS) method were developed for the simultaneous determination of irbesartan (IRB)
and hydrochlorothiazide (HCT) in a tablet.
Material and Method: The RDS method was applied to the UV spectra of the IRB and HCT. The
calibration equations were obtained by measuring amplitudes at 236.3 nm for the IRB determination and at
260.0 nm for the HCT determination, respectively. The proposed method was validated by using the recovery
studies, intra-day and inter-day assays and standard addition technique.
Result and Discussion: This study aims to apply a rapid and powerful signal processing method to the
simultaneous quantification of IRB and HCT in their synthetic mixtures and tablets. As can be seen, the UV
spectra of two drugs overlapped strongly in same spectral region. Direct conventional absorbance
measurements do not give expected results for the IRB-HCT tablet analysis mainly due to the spectral
interference. However, in order to reach a reasonable spectral analysis outcome, we focused mainly on the
application of the ratio-derivative spectra treatment to the quantitative resolution of IRB-HCT mixtures
without having to a separation procedure.
Keywords: Derivative, quantitative determination, spectrophotomety, signal processing, validation
* Corresponding Author / Sorumlu Yazar: Özgür Üstündağ
e- mail / e- posta: [email protected]
Submitted / Gönderilme: 25.09.2020 Accepted / Kabul: 30.09.2020

J. Fac. Pharm. Ankara, 44(3): 506-516, 2020 Üstündağ and Dinç 507
ÖZ
Amaç: Bu çalışmada, tablette irbesartan (IRB) ve hidroklorotiyazidin (HCT) aynı anda miktar tayini
için hızlı ve güçlü bir sinyal işleme yaklaşımı, spektrum oranları türev spektrofotometri (RDS) yöntemi
geliştirilmiştir. RDS yöntemi, IRB ve HCT'nin UV spektrumlarına uygulanmıştır. Gereç ve Yöntem: Kalibrasyon denklemleri, sırasıyla IRB tayini için 236.3 nm'de ve HCT tayini için
260.0 nm'de ölçülerek elde edilmiştir. Önerilen yöntem, geri kazanım çalışmaları, gün içi ve günler arası
testler ve standart ekleme tekniği kullanılarak doğrulanmıştır.
Sonuç ve Tartışma: Bu çalışma, IRB ve HCT'nin sentetik karışımları ve tabletlerinde aynı anda miktar
tayini için hızlı ve güçlü bir sinyal işleme yöntemi uygulamayı amaçlamaktadır. Görülebileceği gibi, iki ilacın
UV spektrumları aynı spektral bölgede güçlü bir şekilde örtüşmektedir. Doğrudan geleneksel absorbans
ölçümleri, spektral girişim nedeniyle IRB-HCT tablet analizi için beklenen sonuçları vermemektedir.
Bununla birlikte, makul bir spektral analiz sonucuna ulaşmak için, esas olarak spektrum oranları türev
spektrofotometri işleminin IRB-HCT karışımlarının kantitatif tayinine bir ayırma prosedürüne gerek
kalmadan uygulanmasına odaklanılmıştır.
Anahtar Kelimeler: Kantitatif tayin, spektrofotometri, sinyal işleme, türev, validasyon
INTRODUCTION
New analytical methods or approaches play an increasingly important role in practical
applications such as biomedical, clinical, pharmaceutical analysis, environmental monitoring, quality
control of industrial manufacturing and forensic science. For these purposes, analytical chemists
work to develop more powerful methods and to improve the reliability of existing analytical
techniques to meet the demands for better chemical measurements in many fields of science as well
as the above mentioned areas [1-3].
As described above, the analytical methods e.g. spectrophotometry [4], mass spectrometry
[5], chromatography [6], electrophoresis [7], electrochemistry [8] and their combined devices have
been used for analytical aims. For example, the separation techniques, LC and CE combined with
various spectroscopic systems (hyphenated techniques namely LC-MS and CE-MS) have been
applied to provide additional chemical information and to decrease the complexity of
multicomponent mixtures in material analyses. In addition, LC method has been proposed as main
or comparison method for the analysis of active compounds in pharmaceutical preparations and other
samples. In applications, these chromatographic analysis approaches require a preliminary separation
and other tedious analytical processes during analysis for searching optimal separation and other
chromatographic conditions. In addition to that, these methods using the combined devices bring
high cost and time-consuming for analysis [9-11]. Therefore, the separation methods based on high
technology may not provide successful analytical results in some cases.
Due to the mentioned disadvantageous of the above separation techniques or combined
analytical devices, analytical chemists prefer the spectroscopic methods (instead of separation

Üstündağ and Dinç J. Fac. Pharm. Ankara, 44(3): 506-516, 2020
508
techniques) for rapid analysis with low cost and successful outcome. Particularly derivative
spectrophotometry and its modified versions have been intensively utilized in fast quantitative
resolution of multi-component mixtures without separation step. However, in all cases, these spectral
methods may not lead good analytical results due to characteristics of strongly overlapping spectra
of compounds, interference of main peaks with noise, baseline problems, decreasing signal intensity
and worsening signal-to-noise ratio (S/N) for higher derivative orders [12]. In this context, to
overcome the drawbacks of the above traditional methods, analytical chemists need to develop new
signal analysis techniques, approaches or methods for the efficient quantitative resolution of complex
mixtures. Recent developments in signal processing methods give us more opportunity for the better
quantitative resolution of the complex analytical problems as well as other areas of science [13,14].
One of the newest additions is ratio-derivative spectrophotometry (RDS) method for the spectral
quantification of compounds in mixtures [15]. Ratio-derivative spectrophotometry (RDS) method
has gained wide acceptance as a valuable tool for signal processing tasks, due to their wide range of
applications.
Several analytical methods, including derivative spectrophotometric methods (16-18) and
high performance liquid chromatographic methods (19-22) were reported for the analysis of IRB and
HCT in pharmaceutical and biological studies.
In this context, a rapid and powerful signal processing approach, a ratio-derivative
spectrophotometry (RDS) method were developed for the simultaneous determination of irbesartan
(IRB) and hydrochlorothiazide (HCT) in a tablet. IRB and HCT mixture is a combination of an
angiotensin-II receptor antagonist, irbesartan, and a thiazide diuretic, hydrochlorothiazide. The
binary mixture of IRB and HCT, which have closely overlapping spectra. Direct conventional
absorbance measurements do not give expected results for the IRB-HCT tablet analysis mainly due
to the spectral interference. However, in order to reach a reasonable spectral analysis outcome, we
focused mainly on the application of the ratio-derivative spectra treatment to the quantitative
resolution of IRB-HCT mixtures without having to a separation procedure. The proposed method
was validated by using the recovery studies, intra-day and inter-day assays and standard addition
technique.
MATERIAL AND METHOD
In the UV data collection, the absorption spectra of the compounds and their samples in the
spectral region of 200-305 nm were recorded by using a Shimadzu UV-1601 double beam UV–VIS
spectrophotometer having a fixed slit width (2 nm) connected with a computer loaded with Shimadzu
J. Fac. Pharm. Ankara, 44(3): 506-516, 2020 Üstündağ and Dinç 509
UVPC software and a LEXMARK E-320 printer. In the application of the approaches, the Microsoft
EXCEL and Wavelet Toolbox in Matlab 7.0 software were used for data treatments, regressions and
statistical analysis.
Chemicals and commercial tablet product
A commercial tablet formulation (KARVEZIDE® Tablet, Sanofi-Aventis. Ind., Istanbul,
Turkey), containing 150 mg of IRB and 12.5 mg of HCT per tablet was collected from local Turkish
market. IRB and HCT reference substances were kindly donated from National Pharm. Ind.
Companies, Turkey).
Preparation of standard solutions
A stock standard solution of IRB and HCT was separately prepared by dissolving 25 mg of
each drug in 100 mL methanol. For the spectral analysis, a calibration series for each drug between
4.0-32.0 µg mL-1 for IRB and 2.0-9.0 µg mL-1 for HCT in the above solvent was prepared from the
standard stock solutions. For the standard addition technique, the sample solutions were prepared by
adding the stock solution of each compound to tablets at three different concentration levels for six
replicates to evaluate the interference of excipients on the analysis. In addition, the sample solutions
at three different concentration levels for six times were prepared for testing intra-day and inter-day
analysis.
Sample solutions preparation
For analysis of commercial tablets; twenty tablets containing IRB and HCT were weighed
and crushed into fine powder. A quantity of powder equivalent to one tablet was transferred to in 100
ml volumetric flask and then volume was made up to mark with methanol. The content of the flask
was mechanically shaken for 30 min. After filtration, the supernatant was diluted with methanol to
obtain final concentrations.
RESULT AND DISCUSSION
This study aims to apply rapid and powerful signal processing method to the simultaneous
quantification of IRB and HCT in their synthetic mixtures and tablets. The UV spectra of IRB and
HCT standard series and tablet solution were recorded between 200-305 nm as shown in Figure 1.
As can be seen, the UV spectra of two drugs overlapped strongly in same spectral region.

Üstündağ and Dinç J. Fac. Pharm. Ankara, 44(3): 506-516, 2020
510
Figure 1. The UV absorption spectra of 4.0-32 µg mL-1 IRB (---) and 2.0-9.0 µg mL-1 HCT (─) in
methanol
Direct conventional absorbance measurements do not give expected results for the IRB-HCT
tablet analysis mainly due to the spectral interference. However, in order to reach a reasonable
spectral analysis outcome, we focused mainly on the application of the derivative spectra treatment
to the quantitative resolution of IRB-HCT mixtures without having to a separation procedure.
The UV spectra of the IRB and HCT, and their tablet solution were recorded in the range
200.0-305.0 nm and divided by the standard spectrum of 16 µg mL-1 IRB. The same procedure was
repeated for the standard spectrum of 4 µg mL-1 HCT as a divisor, respectively. The obtained ratio
spectrum was also presented in Figure 2. and Figure 3.
Figure 2. RDS of IRB (---) (4.0-32 µg mL-1) and HCT () (2.0-9.0 µg mL-1) in methanol (Div:
16 µg mL-1 IRB) (=10 nm))
0.00
0.20
0.40
0.60
0.80
1.00
1.20
1.40
1.60
200 220 240 260 280 300
Ab
s.
Dalga boyu (nm)
-0.25
-0.20
-0.15
-0.10
-0.05
0.00
0.05
0.10
0.15
0.20
0.25
200 210 220 230 240 250 260 270 280 290 300
dA/dλ[
AH
CT
/AIR
B]
Dalga boyu (nm)

J. Fac. Pharm. Ankara, 44(3): 506-516, 2020 Üstündağ and Dinç 511
Figure 3. RDS of IRB (---) (4.0-32 µg mL-1) and HCT () (2.0-9.0 µg mL-1) in methanol (Div: 4
µg mL-1 HCT) (=10 nm))
Obtained regression analysis results can be seen in Table 1.
Table 1. Linear regression analysis and its statistical results for the proposed method
Method RDS
Parameter IRB HCT
nm 236.3 260.0
m -7.03x10⁻² 2.26x10⁻²
n -5.43x10⁻² 3.00x10⁻³ r 0.9993 0.9996
SE(m) 1.07x10⁻³ 2.58x10⁻⁴ SE(n) 8.16x10⁻³ 1.54x10⁻³
SE(r) 2.77x10⁻² 1.67x10⁻³
LOD (µg mL-1) 0.98 0.58 LOQ (µg mL-1) 3.28 1.92
m: Slope
n: Intercept
r: Correlation coefficient SE(m): Standart error of slope
SE(n): Standart error of intercept
SE(e): Standart error of regression constant LOD: Limit of detection
LOQ: Limit of quantification
The amount of IRB and HCT in the samples were calculated using the calibration equations
calculated according to the linear regression analysis in the Table 1.
Validation of the Proposed Method
For the validation of the RDS method, a validation set consisting of 16 artificial mixture
solutions at different concentrations was prepared in methanol, within the working range of 4.0-32.0

Üstündağ and Dinç J. Fac. Pharm. Ankara, 44(3): 506-516, 2020
512
µg mL-1 for IRB and 2.0-9.0 µg mL-1 for HCT. The precision and accuracy of the RDS method was
tested using this validation set. The results obtained by applying the RDS method to artificial
mixtures prepared as the validation set can be seen in Table2.
Table 2. Recovery results obtained in synthetic mixtures
SD= Standard deviation
RSD= Relative standard deviation
To evaluate the accuracy and precision of the RDS method, intra-day and inter-day precision
and accuracy studies were performed at three different concentrations (4.0, 16.0 and 30.0 µg mL-1
for IRB and 2.0, 5.0, and 8.0 µg mL-1 for HCT) within the calibration concentration range. 6 different
solutions were used for concentration, and the solutions prepared on the same day and inter days
were used (Table 3).
Table 3. Results obtained from the analysis of intra-day and inter-day samples by the proposed
method
SD= Standard deviation
RSD= Relative standard deviation
RSE= Relative standard error
RDS
Added
(µg mL-1)
Found
(µg mL-1)
Recovery
(%)
IRB HCT IRB HCT IRB HCT
30 2.0 28.98 1.94 96.6 96.9
30 3.0 28.73 2.93 95.8 97.6
30 4.0 28.90 3.95 96.3 98.7 30 5.0 28.73 5.01 95.8 100.3
30 6.0 28.81 5.99 96.0 99.9
30 7.0 28.72 6.96 95.7 99.4 30 8.0 28.82 7.81 96.1 97.7
30 9.0 28.65 8.85 95.5 98.3 4.0 2.5 4.09 2.52 102.3 100.6
8.0 2.5 7.86 2.46 98.2 98.5
12 2.5 12.11 2.53 100.9 101.3 16 2.5 16.28 2.47 101.7 98.7
20 2.5 20.41 2.43 102.0 97.1
24 2.5 24.25 2.44 101.1 97.7 28 2.5 27.98 2.45 99.9 97.9
32 2.5 31.42 2.46 98.2 98.5
X 100.6 98.5
SD 1.41 1.46 RSD 1.40 1.48
Intra-day (n=6) Inter-day (n=6)
Added
(µg mL-1)
Found
(µg mL-1) SD RSD RE Rec. (%)
Found
(µg mL-1) SD RSD RSE Rec. (%)
RD
S IR
B 4.0 3.92 0.08 1.92 -1.90 98.1 3.93 0.08 2.01 -1.72 98.3
16.0 15.89 0.12 0.77 -0.66 99.3 15.82 0.13 0.81 -1.11 98.9
30.0 29.79 0.46 1.56 -0.69 100.1 29.67 0.45 1.51 3.57 96.4
HC
T 2.0 1.99 0.01 0.63 -0.53 99.5 1.96 0.06 2.84 -1.11 98.9
5.0 4.90 0.10 1.95 -2.08 97.9 4.83 0.07 1.35 -3.34 96.7
8.0 7.93 0.13 1.60 -0.82 99.2 7.75 0.18 2.31 -3.34 96.8
J. Fac. Pharm. Ankara, 44(3): 506-516, 2020 Üstündağ and Dinç 513
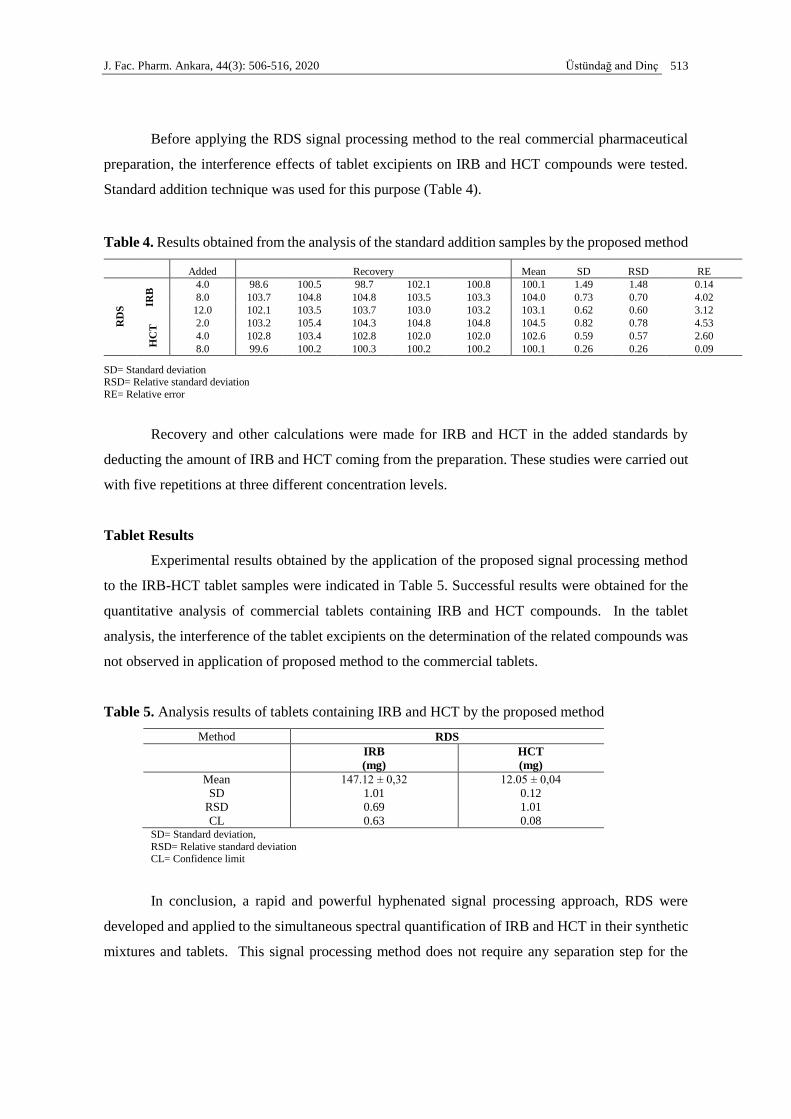
Before applying the RDS signal processing method to the real commercial pharmaceutical
preparation, the interference effects of tablet excipients on IRB and HCT compounds were tested.
Standard addition technique was used for this purpose (Table 4).
Table 4. Results obtained from the analysis of the standard addition samples by the proposed method
Added Recovery Mean SD RSD RE
RD
S IR
B
4.0 98.6 100.5 98.7 102.1 100.8 100.1 1.49 1.48 0.14
8.0 103.7 104.8 104.8 103.5 103.3 104.0 0.73 0.70 4.02
12.0 102.1 103.5 103.7 103.0 103.2 103.1 0.62 0.60 3.12
HC
T 2.0 103.2 105.4 104.3 104.8 104.8 104.5 0.82 0.78 4.53
4.0 102.8 103.4 102.8 102.0 102.0 102.6 0.59 0.57 2.60
8.0 99.6 100.2 100.3 100.2 100.2 100.1 0.26 0.26 0.09
SD= Standard deviation RSD= Relative standard deviation
RE= Relative error
Recovery and other calculations were made for IRB and HCT in the added standards by
deducting the amount of IRB and HCT coming from the preparation. These studies were carried out
with five repetitions at three different concentration levels.
Tablet Results
Experimental results obtained by the application of the proposed signal processing method
to the IRB-HCT tablet samples were indicated in Table 5. Successful results were obtained for the
quantitative analysis of commercial tablets containing IRB and HCT compounds. In the tablet
analysis, the interference of the tablet excipients on the determination of the related compounds was
not observed in application of proposed method to the commercial tablets.
Table 5. Analysis results of tablets containing IRB and HCT by the proposed method
Method RDS
IRB
(mg)
HCT
(mg)
Mean 147.12 ± 0,32 12.05 ± 0,04
SD 1.01 0.12
RSD 0.69 1.01
CL 0.63 0.08 SD= Standard deviation,
RSD= Relative standard deviation CL= Confidence limit
In conclusion, a rapid and powerful hyphenated signal processing approach, RDS were
developed and applied to the simultaneous spectral quantification of IRB and HCT in their synthetic
mixtures and tablets. This signal processing method does not require any separation step for the

Üstündağ and Dinç J. Fac. Pharm. Ankara, 44(3): 506-516, 2020
514
analysis of both compounds having the strong overlapping spectra in the same spectral region (see
Figure 1). In order to demonstrate the validity and applicability of the methods, the optimal control
processes of the proposed methods were performed by using the analytical validation parameters.
The proposed methods can be used for the quantitative estimation and routine quality control
of the tablets containing mentioned drugs.
CONFLICT OF INTEREST
The authors confirm that this article content has no conflict of interest.
REFERENCES
1. Siddiqui, M.R., Al Othman, Z.A., Rahman, N. (2017). Analytical techniques in
pharmaceutical analysis: A review. Arabian Journal of Chemistry, 10, 1409-1421.
2. Valagaleti, R., Burns, P.K., Gill, M. (2003). Analytical support for drug manufacturing in
the United States—from active pharmaceutical ingredient synthesis to drug product shelf
life. Drug Inform. J., 37, 407-438.
3. Ju, H. (2013). Grand challenges in analytical chemistry: towards more bright eyes for
scientific research, social events and human health. Front. Chem.,
https://doi.org/10.3389/fchem.2013.00005.
4. El-Didamony, A. M., Saad, M. Z., Saleem, N. O. (2015). Spectrophotometric determination
of some analgesic drugs in pharmaceutical formulations using N-bromosuccinimide as an
oxidant. Journal of the Association of Arab Universities for Basic and Applied Sciences, 17,
43-50.
5. Baghel, U. S., Singh, A., Singh, D., Sinha, M. (2017). Application of mass spectroscopy in
pharmaceutical and biomedical analysis. Spectroscopic Analyses - Developments and
Applications, DOI: 10.5772/intechopen.70655
6. Khateeb, L. A., Al-Hakami, W.E. (2020). Reliable chromatographic determination of non-
steroidal anti-inflammatory drugs in real samples matrices. International Journal of
Environmental Analytical Chemistry, https://doi.org/10.1080/03067319.2019.1689967.
7. Baciu, T., Botello, I., Borrull, F., Calull, M. Aguilar, C. (2015). Capillary electrophoresis
and related techniques in the determination of drugs of abuse and their metabolites. TrAC
Trends in Analytical Chemistry, 74, 89-108.
8. Özdokur, K. V. (2019). Voltammetric determination of isoniazid drug in various matrix by
using CuOx decorated mw‐cnt modified glassy carbon electrode. Electroanalysis,
https://doi.org/10.1002/elan.201900307.

J. Fac. Pharm. Ankara, 44(3): 506-516, 2020 Üstündağ and Dinç 515
9. Chhonker, Y. S., Edi, C., Murry, D. J. (2018). LC–MS/MS method for simultaneous
determination of diethylcarbamazine, albendazole and albendazole metabolites in human
plasma: Application to a clinical pharmacokinetic study. J. Pharm. Biomed. Anal., 20-151,
84–90.
10. Sáiz, J., García-Ruiz, C., Gómara, B. (2017). Comparison of different GC-MS
configurations for the determination of prevalent drugs and related metabolites. Analytical
Methods, 9, 2897-2908.
11. Maurer, H. H. (1994). Toxicological analysis of drugs: GC-MS screening and confirmation.
Acta Medicinæ Legalis, XLIV, 489-492.
12. Daubechies, I. (1992). Ten Lectures on Wavelets, Society for Industrial and Applied
Mathematics, Philadelphia, 1-357.
13. Dinç, E., Baleanu, D. (2007). Continuous wavelet transform applied to the overlapping
absorption signals and their ratio signals for the quantitative resolution of mixture of
oxfendazole and oxyclozanide in bolus. J. Food Drug Anal., 15(2), 109-117.
14. Dinç, E., Baleanu, D., Üstündağ, Ö. (2003). An approach to quantitative two-component
analysis of a mixture containing hydrochlorothiazide and spironolactone in tablets by one
dimensional continuous daubechies and biorthogonal wavelet analysis of UV-spectra.
Spectrosc. Lett., 36, 341-355.
15. Redasani, V. K., Patel, P. R., Marathe, D.Y., Chaudhari, S. R., Shirkhedkar, A. A., Surana,
S. J. (2018). A revıew on derivative uv-spectrophotometry analysis of drugs in
pharmaceutical formulations and biological samples review. Journal of the Chilean
Chemical Society, http://dx.doi.org/10.4067/s0717-97072018000304126.
16. Albero, I., Rodenas, V., Garcia, S., Sanchez, C. (2002). Determination of irbesartan in the
presence of hydrochlorothiazide by derivative spectrophotometry. J. Pharmaceut. Biomed.,
29(1-2), 299-305.
17. El-Yazbi, A., Hammud, H., Sonji, M. (2007). Analysis of eprosartan-hydrochlorothiazide
and irbesartan -hydrochlorothiazide binary mixtures by derivative spectrophotometry. Int. J.
App. Chem., 3(1), 1-12.
18. Joseph, J., Brault, S., Boyer, C., Langlois, M., Cabrero, L., Dubost, J. (2003). Simultaneous
determination of irbesartan and hydrochlorothiazide in tablets by derivative
spectrophotometry. Anal. Lett., 36(11), 2485-2495.
19. Zhu, J., You, S., Meng, X. (2003). Determination of irbesartan and hydrochlorothiazide in
compound irbesartan tablets by HPLC. Zhongguo Yiyao Gongye Zazhi, 34(11), 567-569.
20. Tutunji, L. F., Tutunji, M. F., Alzoubi, M. I., Khabbas, M. H., Arida, A. I. (2009).
Simultaneous determination of irbesartan and hydrochlorothiazide in human plasma using
HPLC coupled with tandem mass spectrometry:Application to bioequivalence studies. J.
Pharmaceut. Biomed., 51(4), 985-990.

Üstündağ and Dinç J. Fac. Pharm. Ankara, 44(3): 506-516, 2020
516
21. Alanazi, A. M., Abdelhameed, A. S., Khalil, N.Y., Khan, A. A., Darwish, I. A. (2014). HPLC
method with monolithic column for simultaneous determination of irbesartan and
hydrochlorothiazide in tablets. Acta Pharm., 64, 187-198.
22. Kalyani, G., Adjuad, B. (2019). Stability indicating assay and estimation of irbesartan by
first order uv derivative spectrophotometry. International Journal of Pharmaceutical
Sciences and Research, 23, 3817-3821.
![Guide to Method Validation for Quantitative Analysis in ... to Method Validation … · [11] ISO 3534-1:1993: ... PS15 Guide to Method Validation for Quantitative Analysis in Chemical](https://img.pdfslide.net/doc/110x75/6020e0046e847a153b29c6c8/guide-to-method-validation-for-quantitative-analysis-in-to-method-validation.jpg)