Embed Size (px)
Citation preview
SINGAPORE ENERGY STATISTICS 2015
ENERGY MARKET AUTHORITY
The Energy Market Authority (EMA) is a statutory board under the Ministry of Trade and Industry (MTI). Our main goals are to promote effective competition in the energy market, ensure a reliable and secure energy supply, and develop a dynamic energy sector in Singapore. Through our work, we seek to forge a progressive energy landscape for sustained growth.
ISSN 2251-2624
©Research and Statistics Unit, Energy Market Authority
All rights reserved. No part of this publication may be reproduced in any material form (including photocopy or storing it in any medium by electronic means and whether or not transiently or incidentally to some other use of this publication) without prior written permission of the copyright owner except in accordance with the provision of the Copyright Act (Cap. 63). Applications for the copyright owner’s written permission to reproduce any part of this publication should be addressed to:
DirectorPlanning DepartmentResearch and Statistics UnitEnergy Market Authority991G Alexandra Road #02-29Singapore 119975Republic of Singapore
I am happy to present to you the Singapore Energy Statistics (SES) 2015. This is the Energy Market Authority of Singapore’s (EMA) annual statistical publication, which provides a broad overview of Singapore’s energy landscape. This edition of the SES – its fifth – marks an important milestone for EMA in developing a dynamic energy sector. This is part of our efforts to enhance service delivery to the public, and facilitate co-creation opportunities.
When we first published SES in Oct 2011, we had nine data tables spanning five sections. Over time, we progressively built on the positive feedback received from both the industry and the general public, and expanded SES’s coverage of energy statistics.
Today, we are proud to share with you SES 2015, which contains 43 data tables spanning seven sections. Amongst these are new datasets on power sector manpower statistics, and final energy consumption.
For the first time, we are releasing the report earlier in June, 4 months ahead of our previous schedule, to meet users’ demand for timely statistics. In 3Q2015, SES will also be made available through an interactive, mobile-friendly format on EMA’s website *.
SES 2015 starts by depicting the supply of energy into Singapore (Energy Supply), how these are used in the Transformation sector (Energy Transformation) and their subsequent consumption by end-users (Energy Consumption).
We then move onto a summary of these energy product flows through Commodity Balance Tables (Energy Balances), before presenting detailed prices of energy products in Singapore (Energy Prices). We then focus on our solar PV landscape and its distribution across the island (Renewables) as well as other energy-related statistics such as Grid Emission Factors, and power sector manpower data.
The technical notes and glossary, with key definitions and concepts, completes the publication.
The publication of this report is made possible only through the co-operation and support of the many organisations, government ministries and statutory boards that have provided information. I would like to express my gratitude to all who have contributed towards this new milestone. We look forward to your continued support.
Bernard NeeAssistant Chief ExecutiveEnergy Planning and Development DivisionEnergy Market AuthoritySingapore
June 2015
* http://www.ema.gov.sg/Singapore_Energy_Statistics.aspx
PREFACE
2 3
TABLE OF CONTENTSSingapore Energy Statistics 2015
TABLE OF CONTENTSSingapore Energy Statistics 2015
ENERGY SNAPSHOT OF SINGAPORE
EXECUTIVE SUMMARY
SECTION 1 • ENERGY SUPPLY
Table 1.1 Imports of Energy ProductsTable 1.2 Exports of Energy ProductsTable 1.2.1 Domestic Exports of Energy ProductsTable 1.2.2 Re-Exports of Energy ProductsTable 1.3 Stock Change
SECTION 2 • ENERGY TRANSFORMATION Electricity GenerationTable 2.1 Energy Flows in Electricity Generation SectorTable 2.2 Annual Fuel Mix for Electricity Generation by Energy ProductsTable 2.2.1 Monthly Fuel Mix for Electricity Generation by Energy Products Table 2.3 Licensed Generation Capacity by Technology TypeTable 2.3.1 Licensed Generation Capacity by Generation CompanyTable 2.4 Plant Technology Share for Electricity Generation Table 2.5 Market Share of Electricity GeneratedOil RefiningTable 2.6 Energy Flows in the Oil Refining Sector
SECTION 3 • ENERGY CONSUMPTION ElectricityTable 3.1 Market Share for Electricity RetailTable 3.2 Electricity Consumption by Sub-Sector (Total)Table 3.2.1 Electricity Consumption by Sub-Sector (Contestable Consumers)Table 3.2.2 Electricity Consumption by Sub-Sector (Non-Contestable Consumers)Table 3.3 Total Household Electricity Consumption by Dwelling TypeTable 3.4 Average Monthly Household Electricity Consumption by Dwelling TypeTable 3.5 Average Monthly Electricity Consumption by Planning Area & Dwelling Type (Annual)Natural GasTable 3.6 Market Share for Natural Gas RetailTable 3.7 Natural Gas Consumption by Sub-SectorTable 3.8 Total Household Town Gas Consumption by Dwelling TypeTable 3.9 Average Monthly Household Town Gas Consumption by Dwelling TypeTable 3.10 Average Monthly Household Town Gas Consumption by Planning Area and Dwelling Type (Annual)OilTable 3.11 Total Oil Consumption by SectorFinal energy consumptionTable 3.12 Total Final Energy Consumption
SECTION 4 • ENERGY BALANCES
Table 4.1 Electricity Balance TableTable 4.2 Natural Gas Balance Table
SECTION 5 • ENERGY PRICES
Table 5.1 Electricity and Gas TariffsTable 5.2 Quarterly Electricity Tariffs (Low Tension Tariffs)Table 5.3 Annual Electricity Tariffs by Components (Low Tension Tariffs)Table 5.4 Quarterly Town Gas TariffsTable 5.5 Consumer Price Index for Selected Energy Products (Base index of 100 at 2014)Table 5.6 Producer and International Trade Price Indices of Mineral Fuels, Lubricants and Related Materials (Base index of 100 at 2012)
SECTION 6 • SOLAR
Table 6.1 Installed Capacity of Grid-Connected Solar Photovoltaic (PV) SystemsTable 6.2 Number of Grid-Connected Solar Photovoltaic (PV) Installations Table 6.3 Solar PV Installations by URA Planning Region as of end of Period
SECTION 7 • OTHER ENERGY-RELATED STATISTICS
Table 7.1 Electricity Grid Emission Factor and Upstream Fugitive Methane Emission FactorTable 7.2 Peak System Demand Table 7.3 Number of Power Sector Employees by OccupationTable 7.4 Number of Power Sector Employees by Residency StatusTable 7.5 Number of Licensed Electrical, Gas Service and Cable Detection Workers
TECHNICAL NOTES
GLOSSARY
4
6
8
1313141415
16
25252626283030
30
16
43434445465054
5959606468
73
73
74
8081
82
8686868788
88
90
949495
98
102
102102103103
98
110
Notes:
a. This publication contains statistics that are the most recently available at the time of its preparation.
b. Numbers may not add up to the totals due to rounding.
c. Some statistics, particularly for the most recent time periods, are provisional and may be subject to revision in later issues.
d. All statistical tables above are available in machine-readable format on http://www.ema.gov.sg/singapore_energy_statistics.aspx.
Notations:
- nil, negligible or not applicable
“s” - Suppressed to avoid disclosure of individual data
4 5
6 7
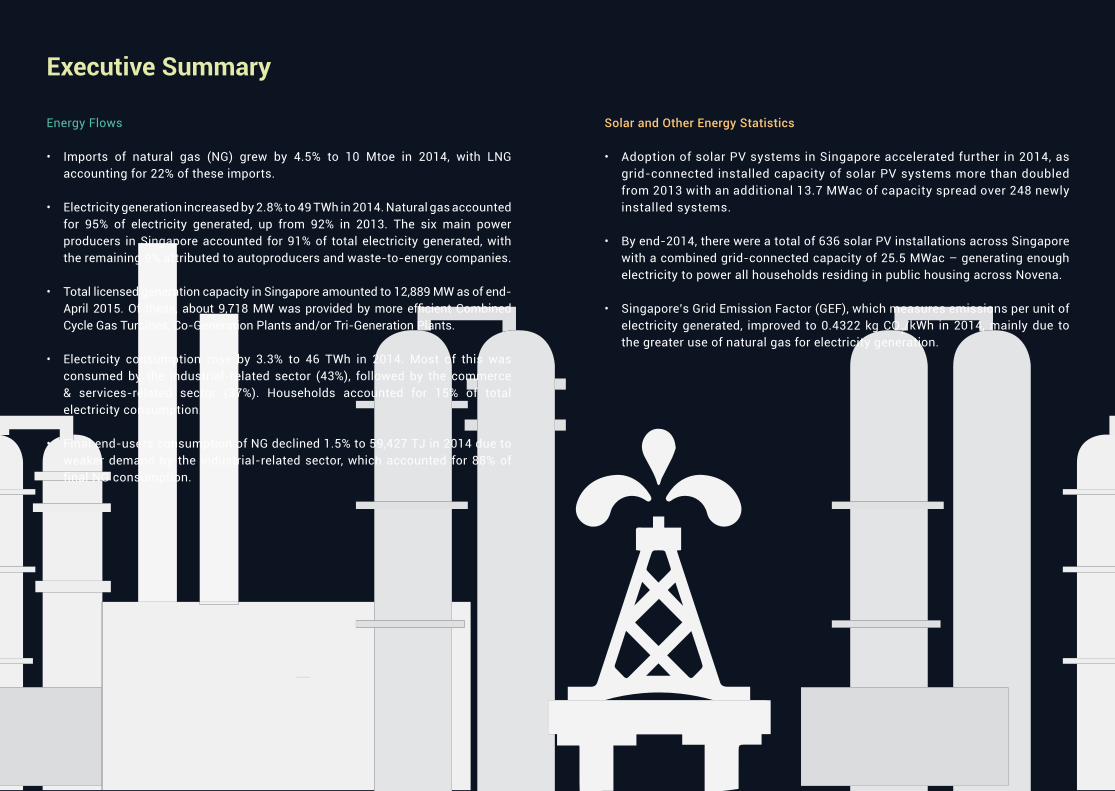
Energy Flows • Imports of natural gas (NG) grew by 4.5% to 10 Mtoe in 2014, with LNG
accounting for 22% of these imports.
• Electricity generation increased by 2.8% to 49 TWh in 2014. Natural gas accounted for 95% of electricity generated, up from 92% in 2013. The six main power producers in Singapore accounted for 91% of total electricity generated, with the remaining 9% attributed to autoproducers and waste-to-energy companies.
• Total licensed generation capacity in Singapore amounted to 12,889 MW as of end-April 2015. Of these, about 9,718 MW was provided by more efficient Combined Cycle Gas Turbines, Co-Generation Plants and/or Tri-Generation Plants.
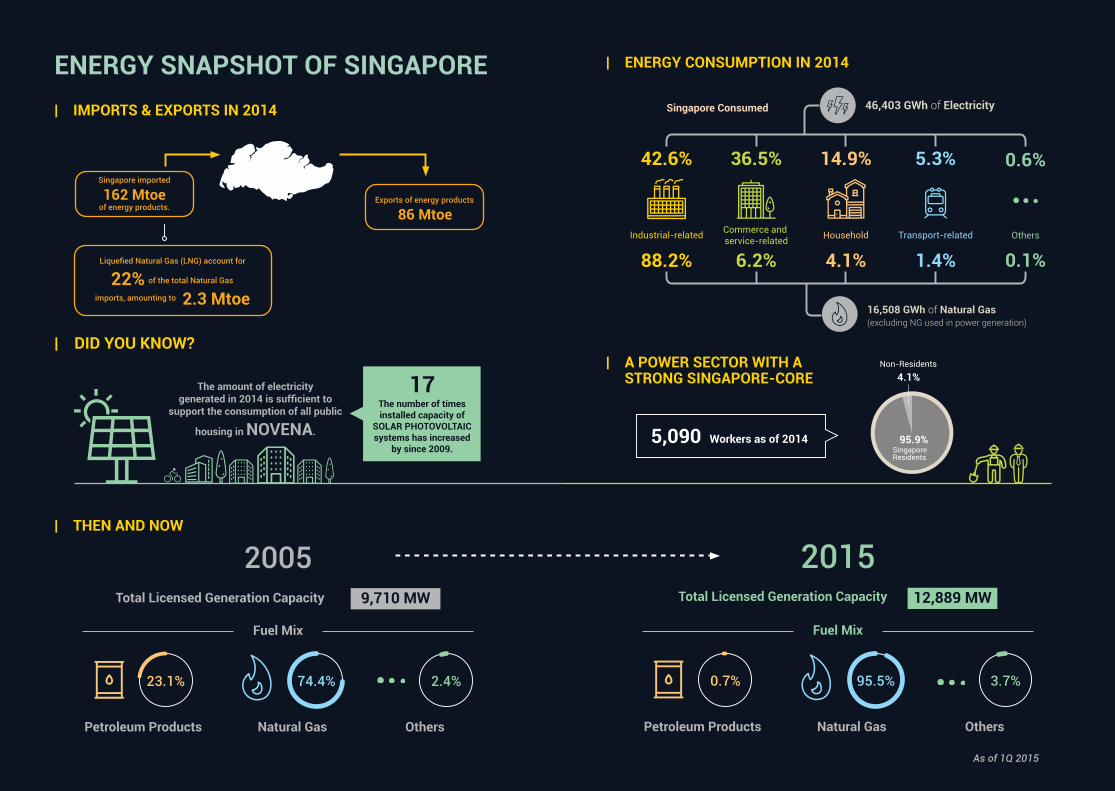
• Electricity consumption rose by 3.3% to 46 TWh in 2014. Most of this was consumed by the industrial-related sector (43%), followed by the commerce & services-related sector (37%). Households accounted for 15% of total electricity consumption.
• Final end-users consumption of NG declined 1.5% to 59,427 TJ in 2014 due to weaker demand by the industrial-related sector, which accounted for 88% of final NG consumption.
Solar and Other Energy Statistics • Adoption of solar PV systems in Singapore accelerated further in 2014, as
grid-connected installed capacity of solar PV systems more than doubled from 2013 with an additional 13.7 MWac of capacity spread over 248 newly installed systems.
• By end-2014, there were a total of 636 solar PV installations across Singapore with a combined grid-connected capacity of 25.5 MWac – generating enough electricity to power all households residing in public housing across Novena.
• Singapore’s Grid Emission Factor (GEF), which measures emissions per unit of electricity generated, improved to 0.4322 kg CO2/kWh in 2014, mainly due to the greater use of natural gas for electricity generation.
Executive Summary
We ensure Singapore’s energy security through strategic planning and diversification of energy sources.
01 ENERGY SUPPLY
10 11
ENERGY SUPPLYImports and Exports
ENERGY SUPPLYImports and Exports
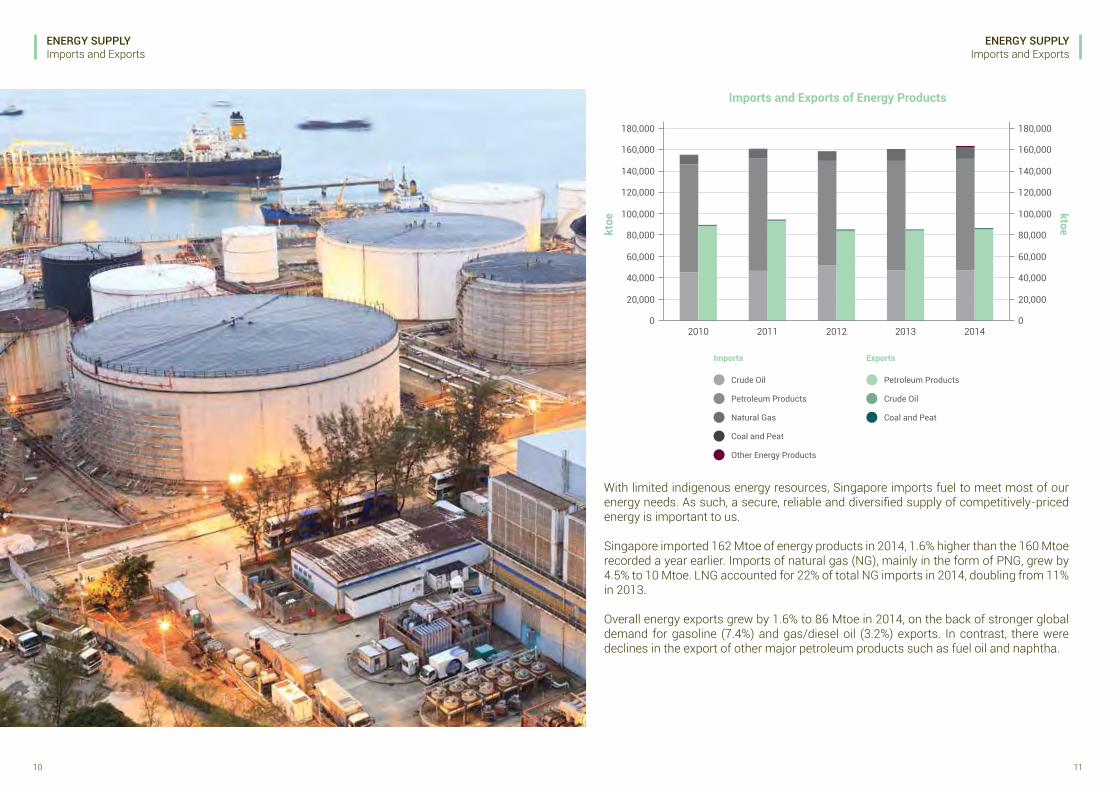
With limited indigenous energy resources, Singapore imports fuel to meet most of our energy needs. As such, a secure, reliable and diversified supply of competitively-priced energy is important to us.
Singapore imported 162 Mtoe of energy products in 2014, 1.6% higher than the 160 Mtoe recorded a year earlier. Imports of natural gas (NG), mainly in the form of PNG, grew by 4.5% to 10 Mtoe. LNG accounted for 22% of total NG imports in 2014, doubling from 11% in 2013.
Overall energy exports grew by 1.6% to 86 Mtoe in 2014, on the back of stronger global demand for gasoline (7.4%) and gas/diesel oil (3.2%) exports. In contrast, there were declines in the export of other major petroleum products such as fuel oil and naphtha.
Imports and Exports of Energy Products
Imports
Crude Oil
Other Energy Products
Coal and Peat
Natural Gas
Petroleum Products
Exports
Crude Oil
Coal and Peat
Petroleum Products
140,000
80,000
20,000
0
160,000
100,000
40,000
180,000
120,000
60,000
140,000
80,000
20,000
0
160,000
100,000
40,000
180,000
120,000
60,000
ktoe
ktoe
2010 2011 2012 2013 2014
12 13
ENERGY SUPPLYStock Change
ENERGY SUPPLY
Sources: International Enterprise (IE) Singapore and Energy Market Authority (EMA)
Notes:a. All data are compiled from IE’s trade statistics except Natural Gas and Other Energy Products data, which are compiled from EMA’s administrative returns b. IE releases trade data in mass units. EMA releases similar data in energy units (ktoe). c.TheproductclassificationofenergyproductsdiffersfromthatusedbyIEfortradestatistics.
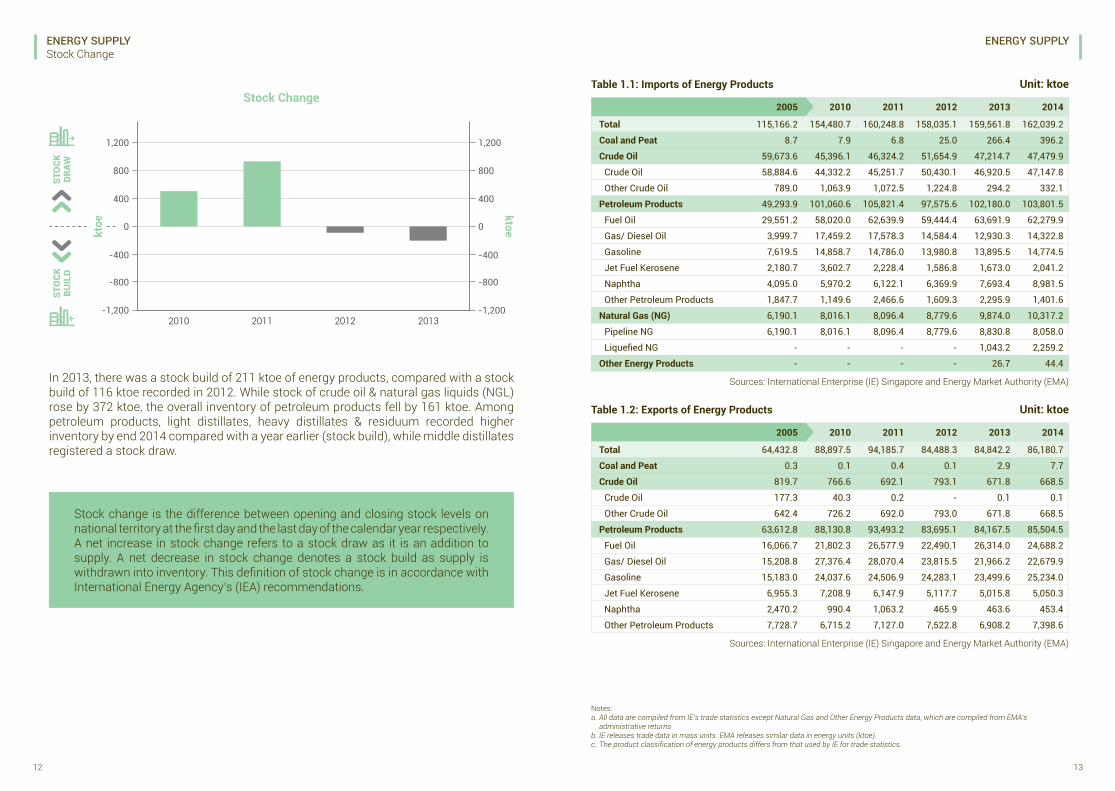
Unit: ktoeTable 1.1: Imports of Energy Products
2005 2010 2011 2012 2013 2014
Total 115,166.2 154,480.7 160,248.8 158,035.1 159,561.8 162,039.2
Coal and Peat 8.7 7.9 6.8 25.0 266.4 396.2
Crude Oil 59,673.6 45,396.1 46,324.2 51,654.9 47,214.7 47,479.9
Crude Oil 58,884.6 44,332.2 45,251.7 50,430.1 46,920.5 47,147.8
Other Crude Oil 789.0 1,063.9 1,072.5 1,224.8 294.2 332.1
Petroleum Products 49,293.9 101,060.6 105,821.4 97,575.6 102,180.0 103,801.5
Fuel Oil 29,551.2 58,020.0 62,639.9 59,444.4 63,691.9 62,279.9
Gas/ Diesel Oil 3,999.7 17,459.2 17,578.3 14,584.4 12,930.3 14,322.8
Gasoline 7,619.5 14,858.7 14,786.0 13,980.8 13,895.5 14,774.5
Jet Fuel Kerosene 2,180.7 3,602.7 2,228.4 1,586.8 1,673.0 2,041.2
Naphtha 4,095.0 5,970.2 6,122.1 6,369.9 7,693.4 8,981.5
Other Petroleum Products 1,847.7 1,149.6 2,466.6 1,609.3 2,295.9 1,401.6
Natural Gas (NG) 6,190.1 8,016.1 8,096.4 8,779.6 9,874.0 10,317.2
Pipeline NG 6,190.1 8,016.1 8,096.4 8,779.6 8,830.8 8,058.0
Liquefied NG - - - - 1,043.2 2,259.2
Other Energy Products - - - - 26.7 44.4
Sources: International Enterprise (IE) Singapore and Energy Market Authority (EMA)
Unit: ktoeTable 1.2: Exports of Energy Products
2005 2010 2011 2012 2013 2014
Total 64,432.8 88,897.5 94,185.7 84,488.3 84,842.2 86,180.7
Coal and Peat 0.3 0.1 0.4 0.1 2.9 7.7
Crude Oil 819.7 766.6 692.1 793.1 671.8 668.5
Crude Oil 177.3 40.3 0.2 - 0.1 0.1
Other Crude Oil 642.4 726.2 692.0 793.0 671.8 668.5
Petroleum Products 63,612.8 88,130.8 93,493.2 83,695.1 84,167.5 85,504.5
Fuel Oil 16,066.7 21,802.3 26,577.9 22,490.1 26,314.0 24,688.2
Gas/ Diesel Oil 15,208.8 27,376.4 28,070.4 23,815.5 21,966.2 22,679.9
Gasoline 15,183.0 24,037.6 24,506.9 24,283.1 23,499.6 25,234.0
Jet Fuel Kerosene 6,955.3 7,208.9 6,147.9 5,117.7 5,015.8 5,050.3
Naphtha 2,470.2 990.4 1,063.2 465.9 463.6 453.4
Other Petroleum Products 7,728.7 6,715.2 7,127.0 7,522.8 6,908.2 7,398.6
In 2013, there was a stock build of 211 ktoe of energy products, compared with a stock build of 116 ktoe recorded in 2012. While stock of crude oil & natural gas liquids (NGL) rose by 372 ktoe, the overall inventory of petroleum products fell by 161 ktoe. Among petroleum products, light distillates, heavy distillates & residuum recorded higher inventory by end 2014 compared with a year earlier (stock build), while middle distillates registered a stock draw.
Stock change is the difference between opening and closing stock levels on national territory at the first day and the last day of the calendar year respectively. A net increase in stock change refers to a stock draw as it is an addition to supply. A net decrease in stock change denotes a stock build as supply is withdrawn into inventory. This definition of stock change is in accordance with International Energy Agency’s (IEA) recommendations.
Stock Change
STO
CKDR
AWST
OCK
BUIL
D
400
-800
800
-400
1,200
0
-1,200
ktoe
400
-800
800
-400
1,200
0
-1,200
ktoe
2010 2011 2012 2013
14 15
ENERGY SUPPLY ENERGY SUPPLY
Notes:a. Stock change refers to the net increase (stock draw) or net decrease (stock build) in the quantity of energy products over the reference year. They are calculated as a difference between the opening and closing inventory at the start and end of the calendar year respectively. b.Anegativefiguredenotesastockbuild.Apositivefiguredenotesastockdraw. c. MPA releases marine bunker data in mass units. EMA releases similar data in energy units (Mtoe).
Source: Energy Market Authority (EMA)
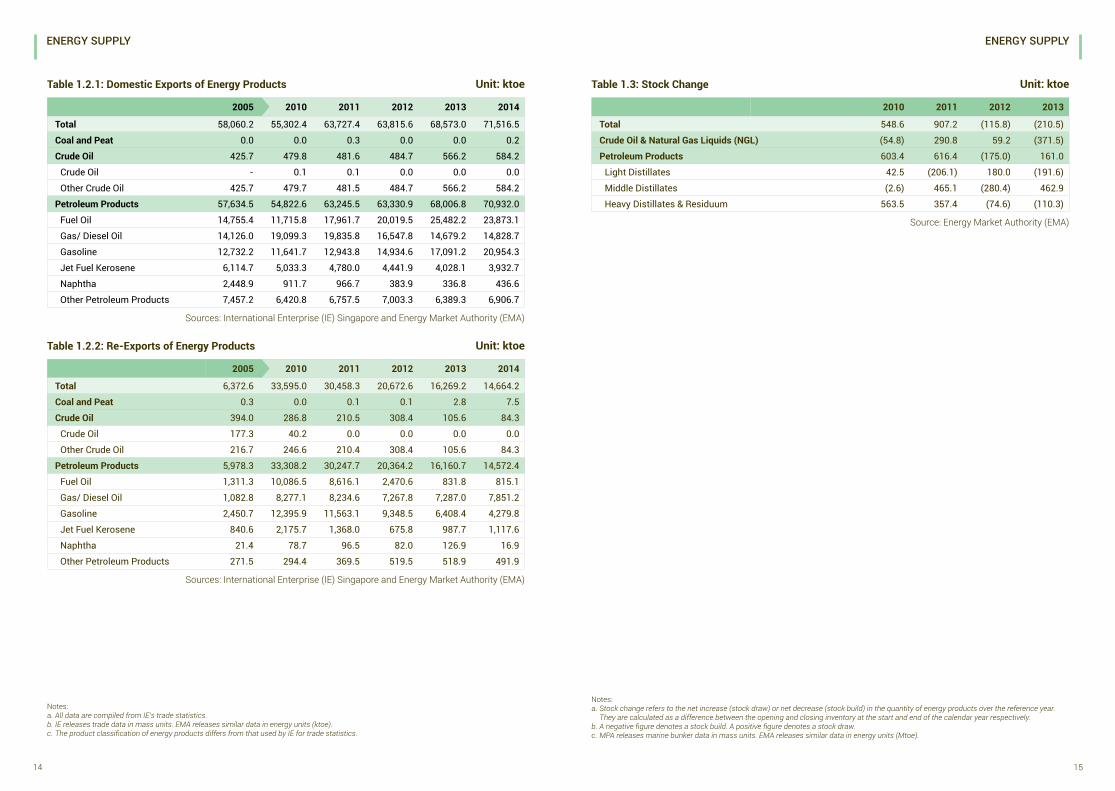
Unit: ktoeTable 1.3: Stock Change
2010 2011 2012 2013
Total 548.6 907.2 (115.8) (210.5)
Crude Oil & Natural Gas Liquids (NGL) (54.8) 290.8 59.2 (371.5)
Petroleum Products 603.4 616.4 (175.0) 161.0
Light Distillates 42.5 (206.1) 180.0 (191.6)
Middle Distillates (2.6) 465.1 (280.4) 462.9
Heavy Distillates & Residuum 563.5 357.4 (74.6) (110.3)
Sources: International Enterprise (IE) Singapore and Energy Market Authority (EMA)
Unit: ktoeTable 1.2.1: Domestic Exports of Energy Products
2005 2010 2011 2012 2013 2014
Total 58,060.2 55,302.4 63,727.4 63,815.6 68,573.0 71,516.5
Coal and Peat 0.0 0.0 0.3 0.0 0.0 0.2
Crude Oil 425.7 479.8 481.6 484.7 566.2 584.2
Crude Oil - 0.1 0.1 0.0 0.0 0.0
Other Crude Oil 425.7 479.7 481.5 484.7 566.2 584.2
Petroleum Products 57,634.5 54,822.6 63,245.5 63,330.9 68,006.8 70,932.0
Fuel Oil 14,755.4 11,715.8 17,961.7 20,019.5 25,482.2 23,873.1
Gas/ Diesel Oil 14,126.0 19,099.3 19,835.8 16,547.8 14,679.2 14,828.7
Gasoline 12,732.2 11,641.7 12,943.8 14,934.6 17,091.2 20,954.3
Jet Fuel Kerosene 6,114.7 5,033.3 4,780.0 4,441.9 4,028.1 3,932.7
Naphtha 2,448.9 911.7 966.7 383.9 336.8 436.6
Other Petroleum Products 7,457.2 6,420.8 6,757.5 7,003.3 6,389.3 6,906.7
Notes:a. All data are compiled from IE’s trade statistics. b. IE releases trade data in mass units. EMA releases similar data in energy units (ktoe).c.TheproductclassificationofenergyproductsdiffersfromthatusedbyIEfortradestatistics.
Sources: International Enterprise (IE) Singapore and Energy Market Authority (EMA)
Unit: ktoeTable 1.2.2: Re-Exports of Energy Products
2005 2010 2011 2012 2013 2014
Total 6,372.6 33,595.0 30,458.3 20,672.6 16,269.2 14,664.2
Coal and Peat 0.3 0.0 0.1 0.1 2.8 7.5
Crude Oil 394.0 286.8 210.5 308.4 105.6 84.3
Crude Oil 177.3 40.2 0.0 0.0 0.0 0.0
Other Crude Oil 216.7 246.6 210.4 308.4 105.6 84.3
Petroleum Products 5,978.3 33,308.2 30,247.7 20,364.2 16,160.7 14,572.4
Fuel Oil 1,311.3 10,086.5 8,616.1 2,470.6 831.8 815.1
Gas/ Diesel Oil 1,082.8 8,277.1 8,234.6 7,267.8 7,287.0 7,851.2
Gasoline 2,450.7 12,395.9 11,563.1 9,348.5 6,408.4 4,279.8
Jet Fuel Kerosene 840.6 2,175.7 1,368.0 675.8 987.7 1,117.6
Naphtha 21.4 78.7 96.5 82.0 126.9 16.9
Other Petroleum Products 271.5 294.4 369.5 519.5 518.9 491.9
We oversee power generation and delivery of energy round the clock.
02 ENERGY TRANSFORMATION
18 19
ENERGY TRANSFORMATIONElectricity Generation
ENERGY TRANSFORMATIONElectricity Generation
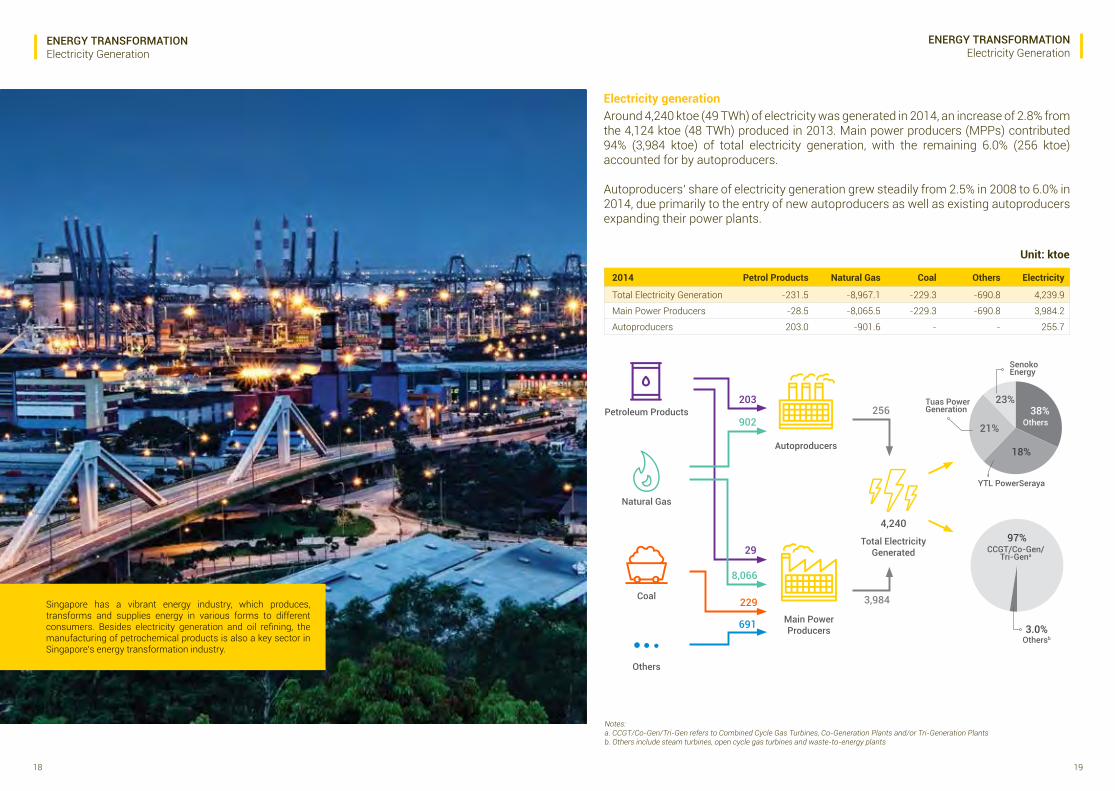
Electricity generationAround 4,240 ktoe (49 TWh) of electricity was generated in 2014, an increase of 2.8% from the 4,124 ktoe (48 TWh) produced in 2013. Main power producers (MPPs) contributed 94% (3,984 ktoe) of total electricity generation, with the remaining 6.0% (256 ktoe) accounted for by autoproducers.
Autoproducers’ share of electricity generation grew steadily from 2.5% in 2008 to 6.0% in 2014, due primarily to the entry of new autoproducers as well as existing autoproducers expanding their power plants.
Singapore has a vibrant energy industry, which produces, transforms and supplies energy in various forms to different consumers. Besides electricity generation and oil refining, the manufacturing of petrochemical products is also a key sector in Singapore’s energy transformation industry.
Unit: ktoe
2014 Petrol Products Natural Gas Coal Others Electricity
Total Electricity Generation -231.5 -8,967.1 -229.3 -690.8 4,239.9
Main Power Producers -28.5 -8,065.5 -229.3 -690.8 3,984.2
Autoproducers 203.0 -901.6 - - 255.7
Total Electricity Generated
Petroleum Products
Natural Gas
Coal
Others
256
3,984
38%23%
21%
18%
3.0%
97%
Others
Senoko Energy
Tuas Power Generation
YTL PowerSeraya
4,240
Autoproducers
203
902
Main PowerProducers
29
8,066
691
229
Othersb
CCGT/Co-Gen/Tri-Gena
Notes:a. CCGT/Co-Gen/Tri-Gen refers to Combined Cycle Gas Turbines, Co-Generation Plants and/or Tri-Generation Plantsb. Others include steam turbines, open cycle gas turbines and waste-to-energy plants
20 21
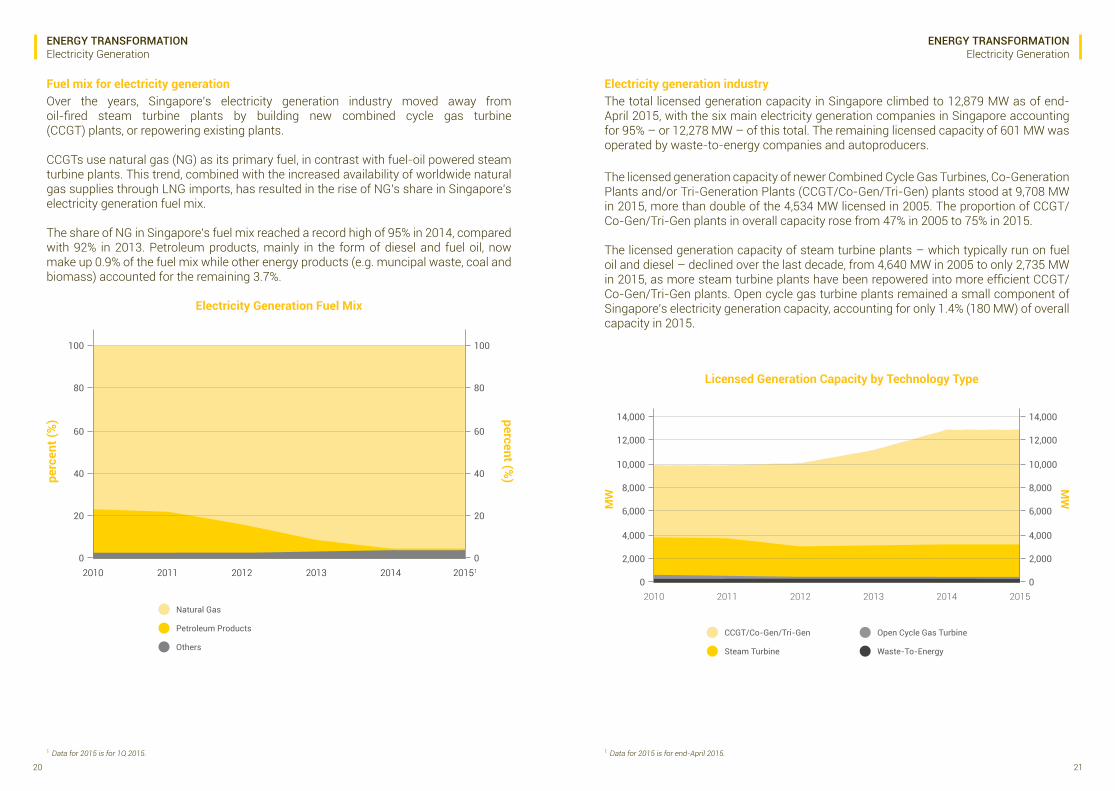
Fuel mix for electricity generationOver the years, Singapore’s electricity generation industry moved away from oil-fired steam turbine plants by building new combined cycle gas turbine (CCGT) plants, or repowering existing plants.
CCGTs use natural gas (NG) as its primary fuel, in contrast with fuel-oil powered steam turbine plants. This trend, combined with the increased availability of worldwide natural gas supplies through LNG imports, has resulted in the rise of NG’s share in Singapore’s electricity generation fuel mix.
The share of NG in Singapore’s fuel mix reached a record high of 95% in 2014, compared with 92% in 2013. Petroleum products, mainly in the form of diesel and fuel oil, now make up 0.9% of the fuel mix while other energy products (e.g. muncipal waste, coal and biomass) accounted for the remaining 3.7%.
1 Data for 2015 is for 1Q 2015.
ENERGY TRANSFORMATIONElectricity Generation
ENERGY TRANSFORMATIONElectricity Generation
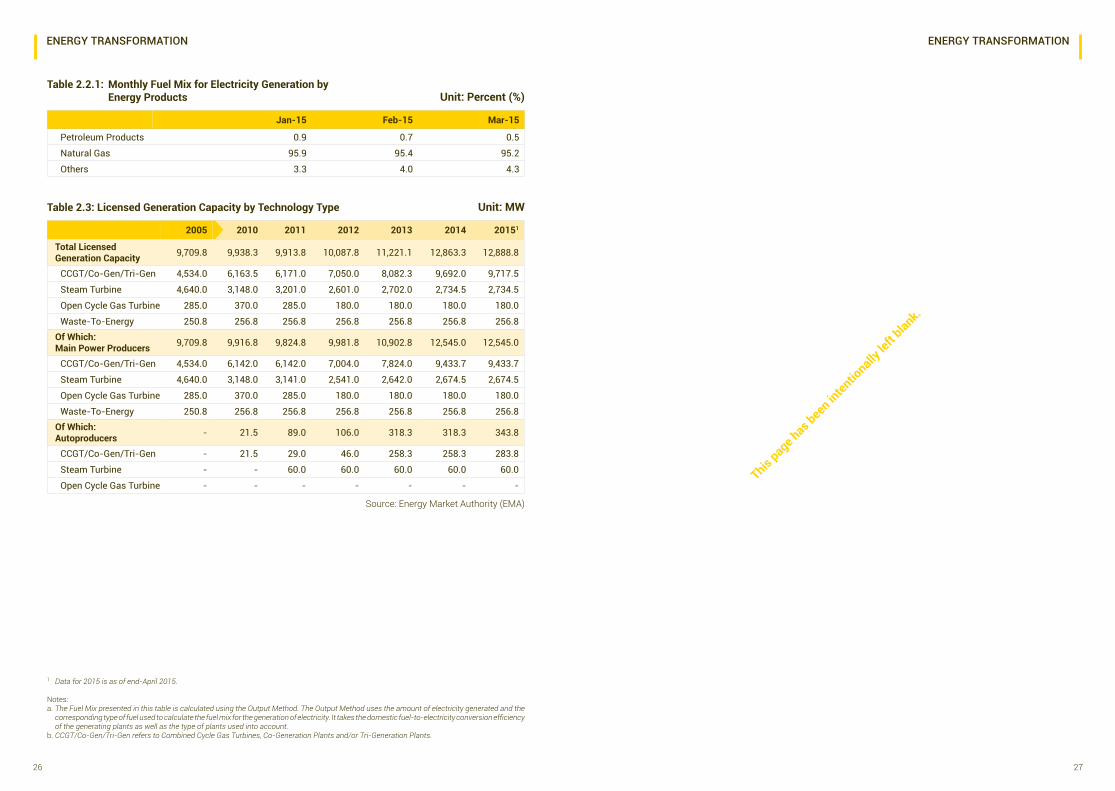
Electricity generation industryThe total licensed generation capacity in Singapore climbed to 12,879 MW as of end-April 2015, with the six main electricity generation companies in Singapore accounting for 95% – or 12,278 MW – of this total. The remaining licensed capacity of 601 MW was operated by waste-to-energy companies and autoproducers.
The licensed generation capacity of newer Combined Cycle Gas Turbines, Co-Generation Plants and/or Tri-Generation Plants (CCGT/Co-Gen/Tri-Gen) plants stood at 9,708 MW in 2015, more than double of the 4,534 MW licensed in 2005. The proportion of CCGT/Co-Gen/Tri-Gen plants in overall capacity rose from 47% in 2005 to 75% in 2015.
The licensed generation capacity of steam turbine plants – which typically run on fuel oil and diesel – declined over the last decade, from 4,640 MW in 2005 to only 2,735 MW in 2015, as more steam turbine plants have been repowered into more efficient CCGT/Co-Gen/Tri-Gen plants. Open cycle gas turbine plants remained a small component of Singapore’s electricity generation capacity, accounting for only 1.4% (180 MW) of overall capacity in 2015.
1 Data for 2015 is for end-April 2015.
Electricity Generation Fuel Mix
perc
ent (
%)
100
80
60
40
20
0
100
80
60
40
20
0
percent (%)
2010 2011 2012 2013 2014 20151
Natural Gas
Others
Petroleum Products
Licensed Generation Capacity by Technology Type
MW
MW
2010 2011 2012 2013 2014 2015
14,000
10,000
4,000
12,000
6,000
8,000
2,000
0
14,000
10,000
4,000
12,000
6,000
8,000
2,000
0
CCGT/Co-Gen/Tri-Gen
Steam Turbine Waste-To-Energy
Open Cycle Gas Turbine
22 23
0% 20% 40% 60% 80% 100%
2010
2011
2012
2013
2014
2010
2011
2012
2013
2014
ENERGY TRANSFORMATIONElectricity Generation
ENERGY TRANSFORMATIONElectricity Generation
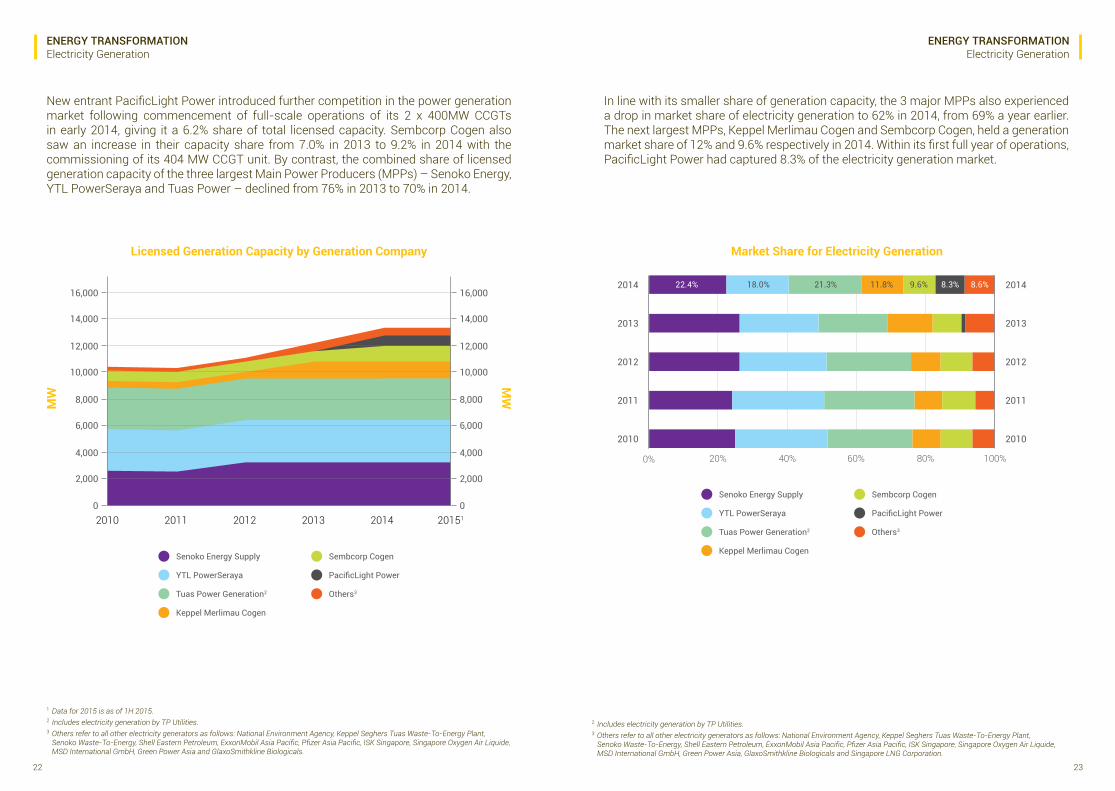
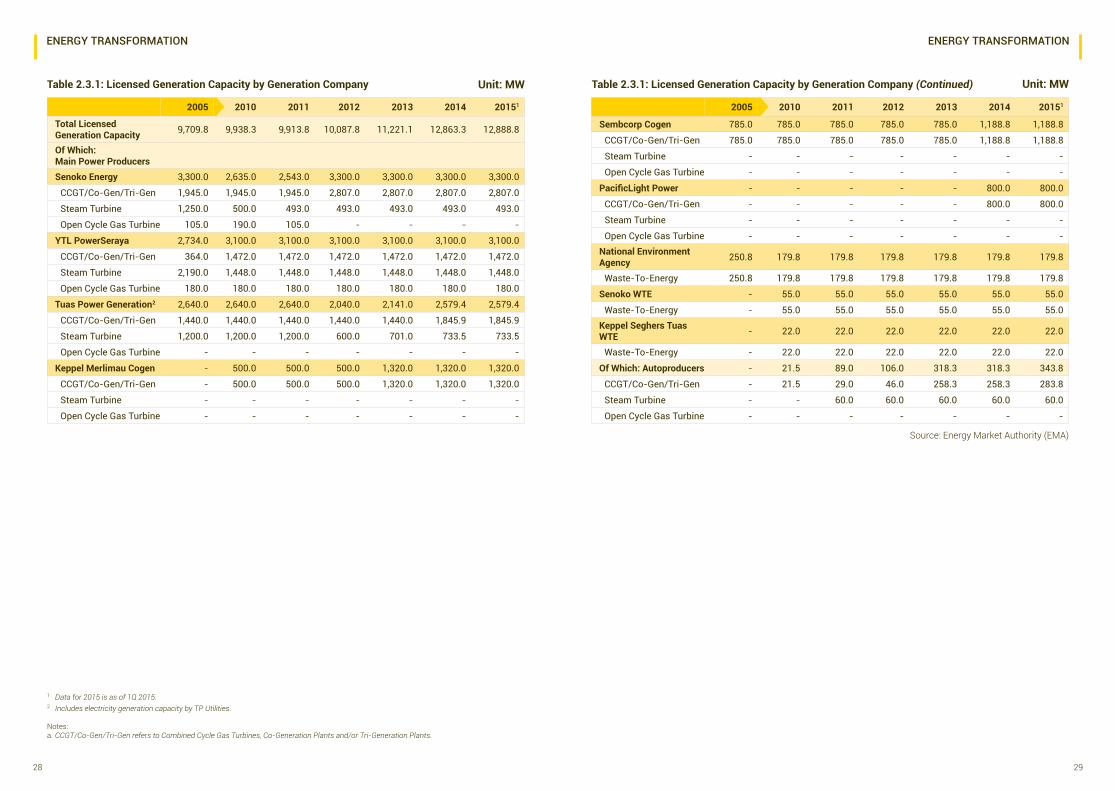
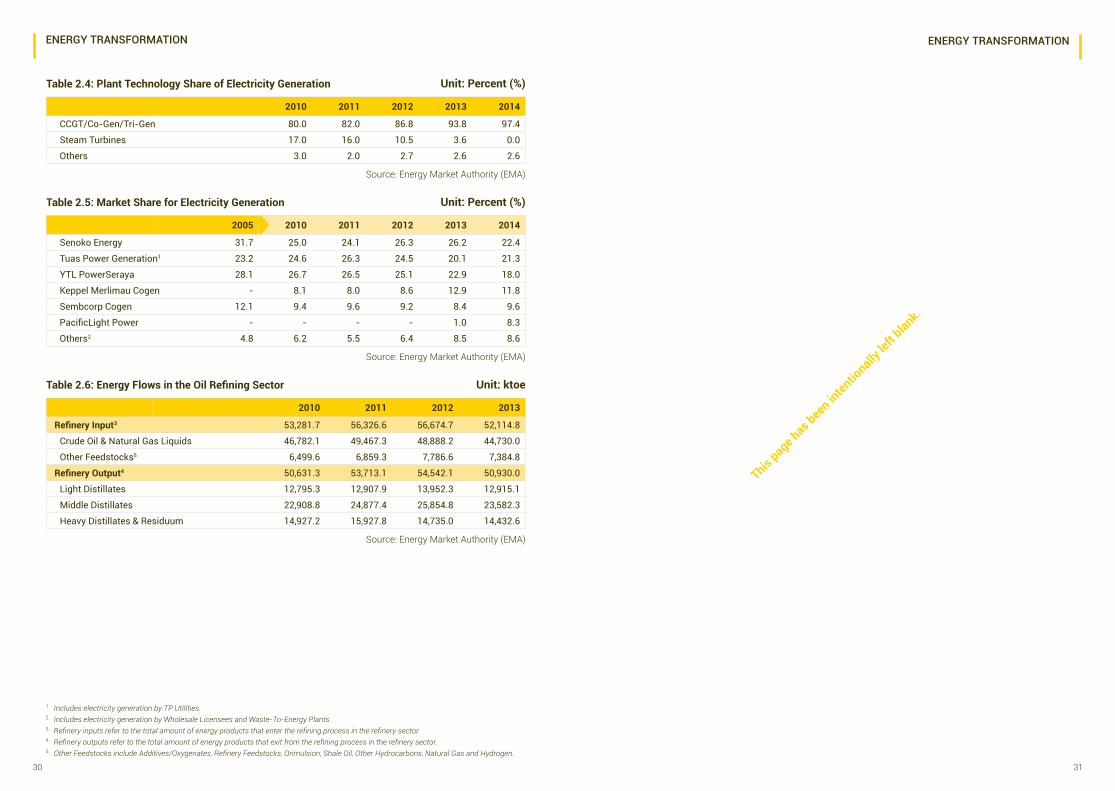
New entrant PacificLight Power introduced further competition in the power generation market following commencement of full-scale operations of its 2 x 400MW CCGTs in early 2014, giving it a 6.2% share of total licensed capacity. Sembcorp Cogen also saw an increase in their capacity share from 7.0% in 2013 to 9.2% in 2014 with the commissioning of its 404 MW CCGT unit. By contrast, the combined share of licensed generation capacity of the three largest Main Power Producers (MPPs) – Senoko Energy, YTL PowerSeraya and Tuas Power – declined from 76% in 2013 to 70% in 2014.
In line with its smaller share of generation capacity, the 3 major MPPs also experienced a drop in market share of electricity generation to 62% in 2014, from 69% a year earlier. The next largest MPPs, Keppel Merlimau Cogen and Sembcorp Cogen, held a generation market share of 12% and 9.6% respectively in 2014. Within its first full year of operations, PacificLight Power had captured 8.3% of the electricity generation market.
1 Data for 2015 is as of 1H 2015.2 Includes electricity generation by TP Utilities. 3 Others refer to all other electricity generators as follows: National Environment Agency, Keppel Seghers Tuas Waste-To-Energy Plant, SenokoWaste-To-Energy,ShellEasternPetroleum,ExxonMobilAsiaPacific,PfizerAsiaPacific,ISKSingapore,SingaporeOxygenAirLiquide, MSD International GmbH, Green Power Asia and GlaxoSmithkline Biologicals.
2 Includes electricity generation by TP Utilities. 3 Others refer to all other electricity generators as follows: National Environment Agency, Keppel Seghers Tuas Waste-To-Energy Plant, SenokoWaste-To-Energy,ShellEasternPetroleum,ExxonMobilAsiaPacific,PfizerAsiaPacific,ISKSingapore,SingaporeOxygenAirLiquide, MSDInternationalGmbH,GreenPowerAsia,GlaxoSmithklineBiologicalsandSingaporeLNGCorporation.
Market Share for Electricity GenerationLicensed Generation Capacity by Generation Company
MW
2,000
4,000
6,000
8,000
10,000
12,000
14,000
16,000
0
2,000
4,000
6,000
8,000
10,000
12,000
14,000
16,000
02010 2011 2012 2013 2014 20151
MW
Senoko Energy Supply
Keppel Merlimau Cogen
Tuas Power Generation2
YTL PowerSeraya PacificLight Power
Others3
Sembcorp Cogen
Senoko Energy Supply
Keppel Merlimau Cogen
Tuas Power Generation2
YTL PowerSeraya PacificLight Power
Others3
Sembcorp Cogen
22.4% 8.3% 8.6%18.0% 21.3% 11.8% 9.6%
24 25
ENERGY TRANSFORMATIONOil Refining
ENERGY TRANSFORMATION
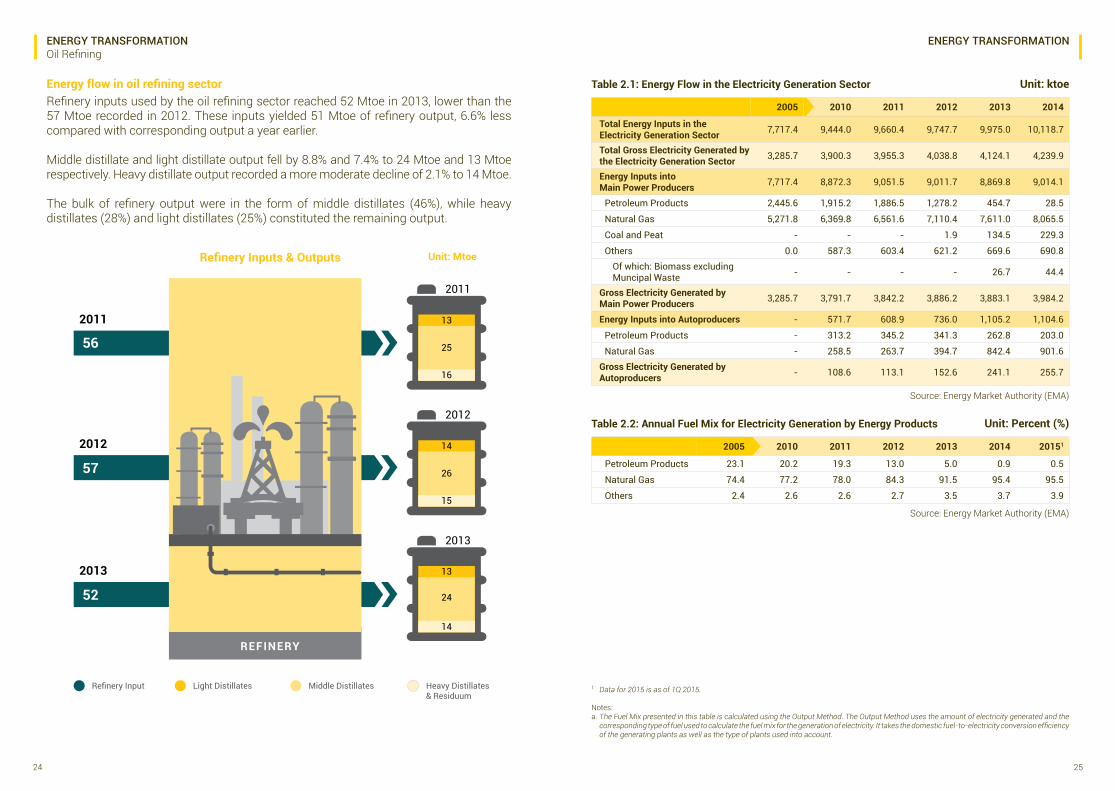
Energy flow in oil refining sectorRefinery inputs used by the oil refining sector reached 52 Mtoe in 2013, lower than the 57 Mtoe recorded in 2012. These inputs yielded 51 Mtoe of refinery output, 6.6% less compared with corresponding output a year earlier.
Middle distillate and light distillate output fell by 8.8% and 7.4% to 24 Mtoe and 13 Mtoe respectively. Heavy distillate output recorded a more moderate decline of 2.1% to 14 Mtoe.
The bulk of refinery output were in the form of middle distillates (46%), while heavy distillates (28%) and light distillates (25%) constituted the remaining output.
13
14
13
25
26
24
16
15
14
2011
2011
2012
2013
2012
2013
Refinery Inputs & Outputs Unit: Mtoe
REFINERY
56
57
52
Refinery Input Light Distillates Middle Distillates Heavy Distillates & Residuum
Unit: ktoeTable 2.1: Energy Flow in the Electricity Generation Sector
2005 2010 2011 2012 2013 2014
Total Energy Inputs in the Electricity Generation Sector 7,717.4 9,444.0 9,660.4 9,747.7 9,975.0 10,118.7
Total Gross Electricity Generated by the Electricity Generation Sector 3,285.7 3,900.3 3,955.3 4,038.8 4,124.1 4,239.9
Energy Inputs into Main Power Producers 7,717.4 8,872.3 9,051.5 9,011.7 8,869.8 9,014.1
Petroleum Products 2,445.6 1,915.2 1,886.5 1,278.2 454.7 28.5
Natural Gas 5,271.8 6,369.8 6,561.6 7,110.4 7,611.0 8,065.5
Coal and Peat - - - 1.9 134.5 229.3
Others 0.0 587.3 603.4 621.2 669.6 690.8 Of which: Biomass excluding Muncipal Waste - - - - 26.7 44.4
Gross Electricity Generated by Main Power Producers 3,285.7 3,791.7 3,842.2 3,886.2 3,883.1 3,984.2
Energy Inputs into Autoproducers - 571.7 608.9 736.0 1,105.2 1,104.6
Petroleum Products - 313.2 345.2 341.3 262.8 203.0
Natural Gas - 258.5 263.7 394.7 842.4 901.6 Gross Electricity Generated by Autoproducers - 108.6 113.1 152.6 241.1 255.7
Source: Energy Market Authority (EMA)
Unit: Percent (%)Table 2.2: Annual Fuel Mix for Electricity Generation by Energy Products
2005 2010 2011 2012 2013 2014 20151
Petroleum Products 23.1 20.2 19.3 13.0 5.0 0.9 0.5
Natural Gas 74.4 77.2 78.0 84.3 91.5 95.4 95.5
Others 2.4 2.6 2.6 2.7 3.5 3.7 3.9
Source: Energy Market Authority (EMA)
1 Data for 2015 is as of 1Q 2015.
Notes:a. The Fuel Mix presented in this table is calculated using the Output Method. The Output Method uses the amount of electricity generated and the correspondingtypeoffuelusedtocalculatethefuelmixforthegenerationofelectricity.Ittakesthedomesticfuel-to-electricityconversionefficiency of the generating plants as well as the type of plants used into account.
26 27
ENERGY TRANSFORMATION ENERGY TRANSFORMATION
Unit: MWTable 2.3: Licensed Generation Capacity by Technology Type
2005 2010 2011 2012 2013 2014 20151
Total Licensed Generation Capacity 9,709.8 9,938.3 9,913.8 10,087.8 11,221.1 12,863.3 12,888.8
CCGT/Co-Gen/Tri-Gen 4,534.0 6,163.5 6,171.0 7,050.0 8,082.3 9,692.0 9,717.5
Steam Turbine 4,640.0 3,148.0 3,201.0 2,601.0 2,702.0 2,734.5 2,734.5
Open Cycle Gas Turbine 285.0 370.0 285.0 180.0 180.0 180.0 180.0
Waste-To-Energy 250.8 256.8 256.8 256.8 256.8 256.8 256.8 Of Which: Main Power Producers 9,709.8 9,916.8 9,824.8 9,981.8 10,902.8 12,545.0 12,545.0
CCGT/Co-Gen/Tri-Gen 4,534.0 6,142.0 6,142.0 7,004.0 7,824.0 9,433.7 9,433.7
Steam Turbine 4,640.0 3,148.0 3,141.0 2,541.0 2,642.0 2,674.5 2,674.5
Open Cycle Gas Turbine 285.0 370.0 285.0 180.0 180.0 180.0 180.0
Waste-To-Energy 250.8 256.8 256.8 256.8 256.8 256.8 256.8 Of Which: Autoproducers - 21.5 89.0 106.0 318.3 318.3 343.8
CCGT/Co-Gen/Tri-Gen - 21.5 29.0 46.0 258.3 258.3 283.8
Steam Turbine - - 60.0 60.0 60.0 60.0 60.0
Open Cycle Gas Turbine - - - - - - -
Source: Energy Market Authority (EMA)
Unit: Percent (%)Table 2.2.1: Monthly Fuel Mix for Electricity Generation by Energy Products
Jan-15 Feb-15 Mar-15
Petroleum Products 0.9 0.7 0.5
Natural Gas 95.9 95.4 95.2
Others 3.3 4.0 4.3
1 Data for 2015 is as of end-April 2015.
Notes:a. The Fuel Mix presented in this table is calculated using the Output Method. The Output Method uses the amount of electricity generated and the correspondingtypeoffuelusedtocalculatethefuelmixforthegenerationofelectricity.Ittakesthedomesticfuel-to-electricityconversionefficiency of the generating plants as well as the type of plants used into account.b. CCGT/Co-Gen/Tri-Gen refers to Combined Cycle Gas Turbines, Co-Generation Plants and/or Tri-Generation Plants.
This page h
as bee
n inten
tionally
left
blank.
28 29
ENERGY TRANSFORMATION ENERGY TRANSFORMATION
Unit: MW
2005 2010 2011 2012 2013 2014 20151
Sembcorp Cogen 785.0 785.0 785.0 785.0 785.0 1,188.8 1,188.8
CCGT/Co-Gen/Tri-Gen 785.0 785.0 785.0 785.0 785.0 1,188.8 1,188.8
Steam Turbine - - - - - - -
Open Cycle Gas Turbine - - - - - - -
PacificLight Power - - - - - 800.0 800.0
CCGT/Co-Gen/Tri-Gen - - - - - 800.0 800.0
Steam Turbine - - - - - - -
Open Cycle Gas Turbine - - - - - - - National Environment Agency 250.8 179.8 179.8 179.8 179.8 179.8 179.8
Waste-To-Energy 250.8 179.8 179.8 179.8 179.8 179.8 179.8
Senoko WTE - 55.0 55.0 55.0 55.0 55.0 55.0
Waste-To-Energy - 55.0 55.0 55.0 55.0 55.0 55.0 Keppel Seghers Tuas WTE - 22.0 22.0 22.0 22.0 22.0 22.0
Waste-To-Energy - 22.0 22.0 22.0 22.0 22.0 22.0
Of Which: Autoproducers - 21.5 89.0 106.0 318.3 318.3 343.8
CCGT/Co-Gen/Tri-Gen - 21.5 29.0 46.0 258.3 258.3 283.8
Steam Turbine - - 60.0 60.0 60.0 60.0 60.0
Open Cycle Gas Turbine - - - - - - -
Source: Energy Market Authority (EMA)
Table 2.3.1: Licensed Generation Capacity by Generation Company Table 2.3.1: Licensed Generation Capacity by Generation Company (Continued)
2005 2010 2011 2012 2013 2014 20151
Total Licensed Generation Capacity 9,709.8 9,938.3 9,913.8 10,087.8 11,221.1 12,863.3 12,888.8
Of Which: Main Power ProducersSenoko Energy 3,300.0 2,635.0 2,543.0 3,300.0 3,300.0 3,300.0 3,300.0
CCGT/Co-Gen/Tri-Gen 1,945.0 1,945.0 1,945.0 2,807.0 2,807.0 2,807.0 2,807.0
Steam Turbine 1,250.0 500.0 493.0 493.0 493.0 493.0 493.0
Open Cycle Gas Turbine 105.0 190.0 105.0 - - - -
YTL PowerSeraya 2,734.0 3,100.0 3,100.0 3,100.0 3,100.0 3,100.0 3,100.0
CCGT/Co-Gen/Tri-Gen 364.0 1,472.0 1,472.0 1,472.0 1,472.0 1,472.0 1,472.0
Steam Turbine 2,190.0 1,448.0 1,448.0 1,448.0 1,448.0 1,448.0 1,448.0
Open Cycle Gas Turbine 180.0 180.0 180.0 180.0 180.0 180.0 180.0
Tuas Power Generation2 2,640.0 2,640.0 2,640.0 2,040.0 2,141.0 2,579.4 2,579.4
CCGT/Co-Gen/Tri-Gen 1,440.0 1,440.0 1,440.0 1,440.0 1,440.0 1,845.9 1,845.9
Steam Turbine 1,200.0 1,200.0 1,200.0 600.0 701.0 733.5 733.5
Open Cycle Gas Turbine - - - - - - -
Keppel Merlimau Cogen - 500.0 500.0 500.0 1,320.0 1,320.0 1,320.0
CCGT/Co-Gen/Tri-Gen - 500.0 500.0 500.0 1,320.0 1,320.0 1,320.0
Steam Turbine - - - - - - -
Open Cycle Gas Turbine - - - - - - -
1 Data for 2015 is as of 1Q 2015. 2 Includes electricity generation capacity by TP Utilities.
Notes:a. CCGT/Co-Gen/Tri-Gen refers to Combined Cycle Gas Turbines, Co-Generation Plants and/or Tri-Generation Plants.
Unit: MW
30 31
ENERGY TRANSFORMATION ENERGY TRANSFORMATION
Unit: Percent (%)Table 2.4: Plant Technology Share of Electricity Generation
2010 2011 2012 2013 2014
CCGT/Co-Gen/Tri-Gen 80.0 82.0 86.8 93.8 97.4
Steam Turbines 17.0 16.0 10.5 3.6 0.0
Others 3.0 2.0 2.7 2.6 2.6
Source: Energy Market Authority (EMA)
1 Includes electricity generation by TP Utilities. 2 IncludeselectricitygenerationbyWholesaleLicenseesandWaste-To-EnergyPlants.3 Refineryinputsrefertothetotalamountofenergyproductsthatentertherefiningprocessintherefinerysector.4 Refineryoutputsrefertothetotalamountofenergyproductsthatexitfromtherefiningprocessintherefinerysector.5 OtherFeedstocksincludeAdditives/Oxygenates,RefineryFeedstocks,Orimulsion,ShaleOil,OtherHydrocarbons,NaturalGasandHydrogen.
Unit: Percent (%)Table 2.5: Market Share for Electricity Generation
2005 2010 2011 2012 2013 2014
Senoko Energy 31.7 25.0 24.1 26.3 26.2 22.4
Tuas Power Generation1 23.2 24.6 26.3 24.5 20.1 21.3
YTL PowerSeraya 28.1 26.7 26.5 25.1 22.9 18.0
Keppel Merlimau Cogen - 8.1 8.0 8.6 12.9 11.8
Sembcorp Cogen 12.1 9.4 9.6 9.2 8.4 9.6
PacificLight Power - - - - 1.0 8.3
Others2 4.8 6.2 5.5 6.4 8.5 8.6
Source: Energy Market Authority (EMA)
Unit: ktoeTable 2.6: Energy Flows in the Oil Refining Sector
2010 2011 2012 2013
Refinery Input3 53,281.7 56,326.6 56,674.7 52,114.8
Crude Oil & Natural Gas Liquids 46,782.1 49,467.3 48,888.2 44,730.0
Other Feedstocks5 6,499.6 6,859.3 7,786.6 7,384.8
Refinery Output4 50,631.3 53,713.1 54,542.1 50,930.0
Light Distillates 12,795.3 12,907.9 13,952.3 12,915.1
Middle Distillates 22,908.8 24,877.4 25,854.8 23,582.3
Heavy Distillates & Residuum 14,927.2 15,927.8 14,735.0 14,432.6
Source: Energy Market Authority (EMA)
This page h
as bee
n inten
tionally
left
blank.
We encourage the energy market to innovate and promote the efficient use of energy.
03 ENERGY CONSUMPTION
34 35
ENERGY CONSUMPTIONElectricity
ENERGY CONSUMPTIONElectricity
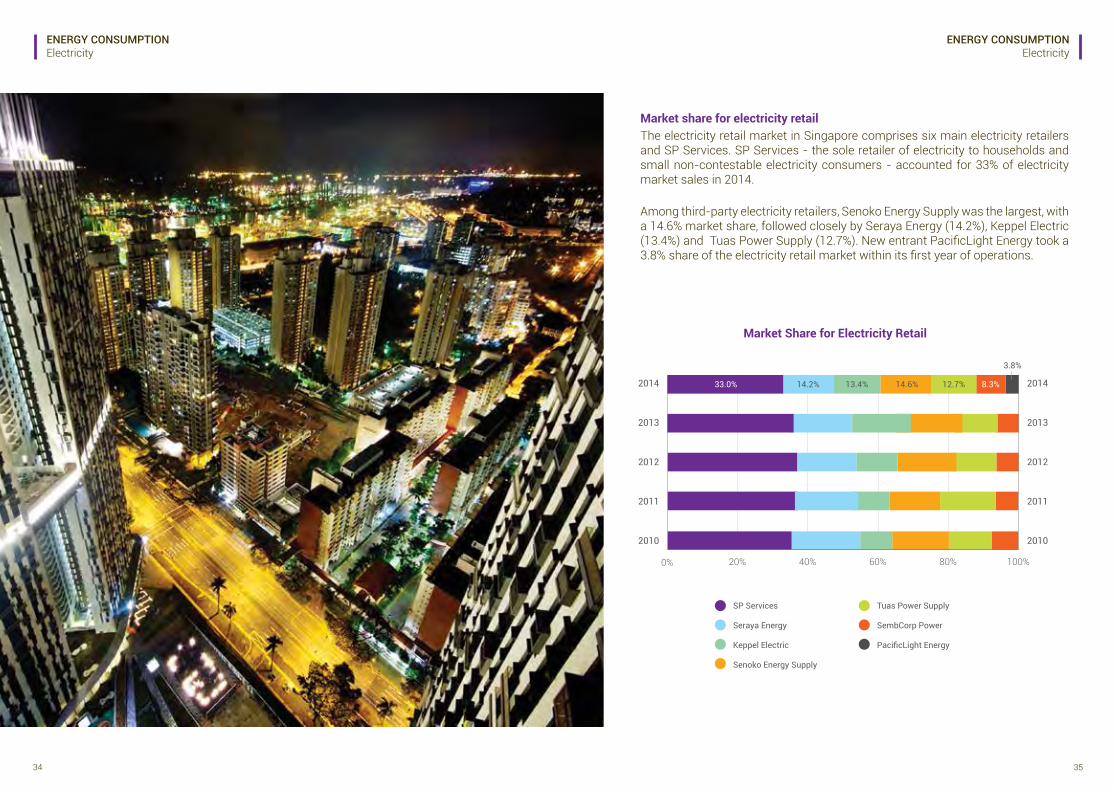
Market share for electricity retailThe electricity retail market in Singapore comprises six main electricity retailers and SP Services. SP Services - the sole retailer of electricity to households and small non-contestable electricity consumers - accounted for 33% of electricity market sales in 2014.
Among third-party electricity retailers, Senoko Energy Supply was the largest, with a 14.6% market share, followed closely by Seraya Energy (14.2%), Keppel Electric (13.4%) and Tuas Power Supply (12.7%). New entrant PacificLight Energy took a 3.8% share of the electricity retail market within its first year of operations.
Market Share for Electricity Retail
2014
2013
2012
2011
2010
2014
2013
2012
2011
2010
0% 20% 40% 60% 80% 100%
SP Services
Seraya Energy
Keppel Electric
Senoko Energy Supply
Tuas Power Supply
SembCorp Power
PacificLight Energy
33.0% 8.3%
3.8%
14.2% 13.4% 14.6% 12.7%
36 37
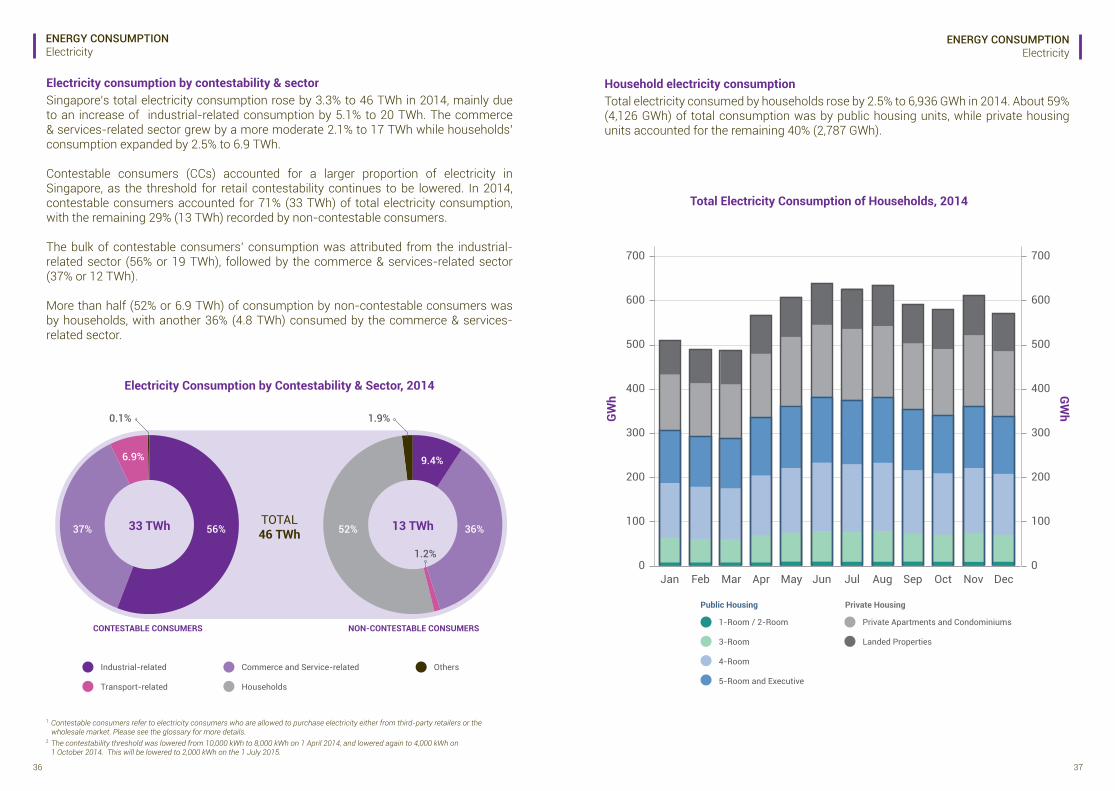
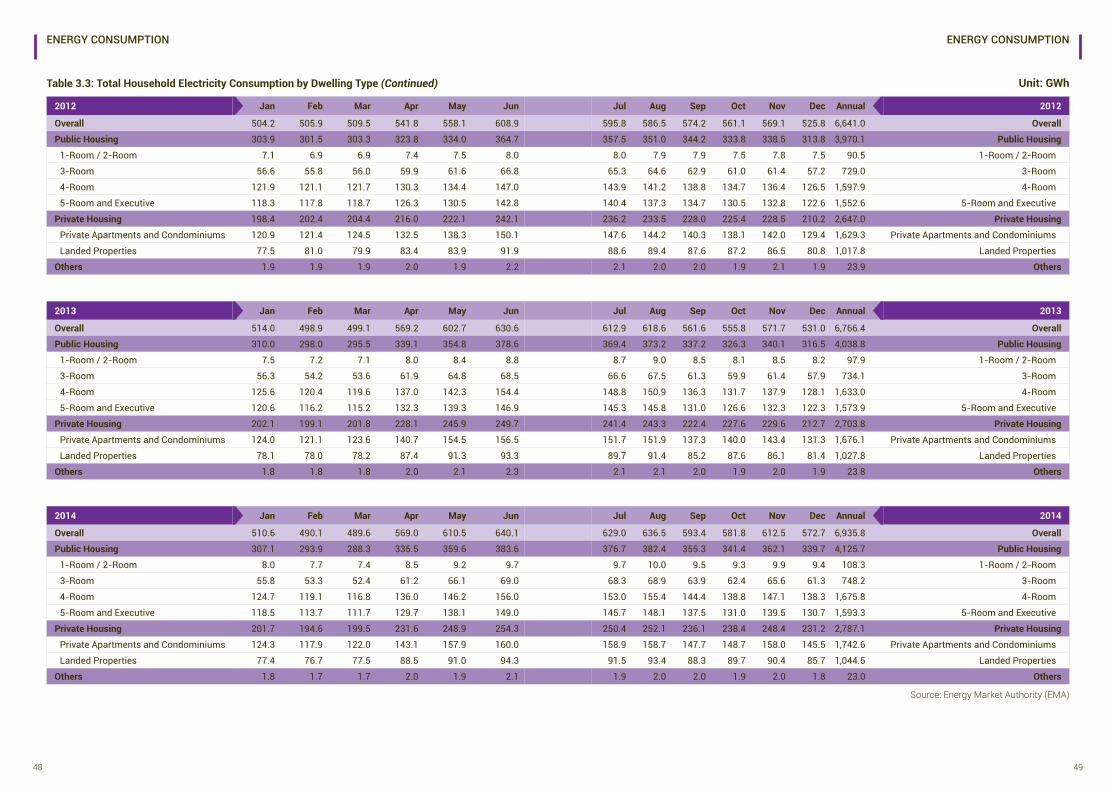
Household electricity consumptionTotal electricity consumed by households rose by 2.5% to 6,936 GWh in 2014. About 59% (4,126 GWh) of total consumption was by public housing units, while private housing units accounted for the remaining 40% (2,787 GWh).
Total Electricity Consumption of Households, 2014
700
600
500
400
300
200
100
0
700
600
500
400
300
200
100
0
GWh GW
h
Jan Feb Mar Apr May Jun Jul Aug Sep Oct Nov Dec
1-Room / 2-Room
3-Room
4-Room
5-Room and Executive
Private Apartments and Condominiums
Landed Properties
Public Housing Private Housing
ENERGY CONSUMPTIONElectricity
ENERGY CONSUMPTIONElectricity
1 Contestable consumers refer to electricity consumers who are allowed to purchase electricity either from third-party retailers or the wholesale market. Please see the glossary for more details.2 The contestability threshold was lowered from 10,000 kWh to 8,000 kWh on 1 April 2014, and lowered again to 4,000 kWh on 1 October 2014. This will be lowered to 2,000 kWh on the 1 July 2015.
Electricity consumption by contestability & sectorSingapore’s total electricity consumption rose by 3.3% to 46 TWh in 2014, mainly due to an increase of industrial-related consumption by 5.1% to 20 TWh. The commerce & services-related sector grew by a more moderate 2.1% to 17 TWh while households’ consumption expanded by 2.5% to 6.9 TWh.
Contestable consumers (CCs) accounted for a larger proportion of electricity in Singapore, as the threshold for retail contestability continues to be lowered. In 2014, contestable consumers accounted for 71% (33 TWh) of total electricity consumption, with the remaining 29% (13 TWh) recorded by non-contestable consumers.
The bulk of contestable consumers’ consumption was attributed from the industrial-related sector (56% or 19 TWh), followed by the commerce & services-related sector (37% or 12 TWh).
More than half (52% or 6.9 TWh) of consumption by non-contestable consumers was by households, with another 36% (4.8 TWh) consumed by the commerce & services-related sector.
Industrial-related
Transport-related
Commerce and Service-related
Households
Others
Electricity Consumption by Contestability & Sector, 2014
CONTESTABLE CONSUMERS
TOTAL46 TWh
NON-CONTESTABLE CONSUMERS
56%37%
6.9%
0.1%
33 TWh 52% 36%
9.4%
13 TWh
1.9%
1.2%
38 39
1 Final end-users or consumers exclude those involved in power generation (as main power producers or autoproducers) and oil refining.
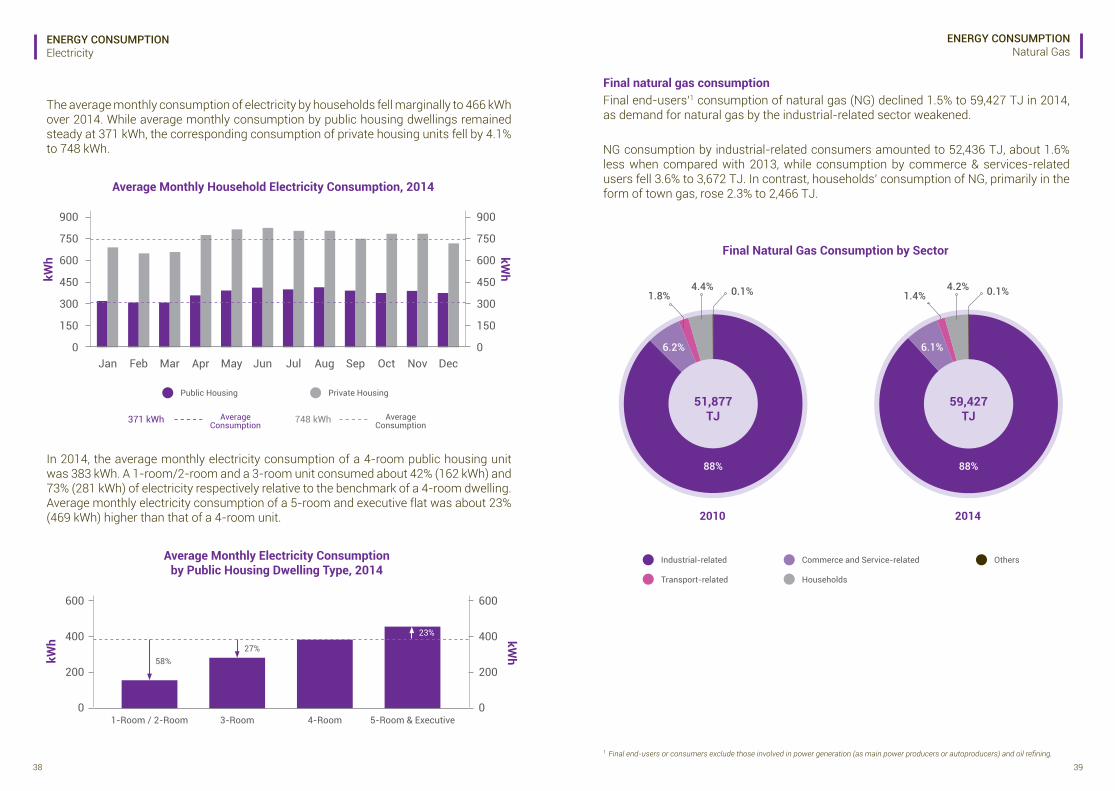
Final natural gas consumptionFinal end-users’1 consumption of natural gas (NG) declined 1.5% to 59,427 TJ in 2014, as demand for natural gas by the industrial-related sector weakened.
NG consumption by industrial-related consumers amounted to 52,436 TJ, about 1.6% less when compared with 2013, while consumption by commerce & services-related users fell 3.6% to 3,672 TJ. In contrast, households’ consumption of NG, primarily in the form of town gas, rose 2.3% to 2,466 TJ.
ENERGY CONSUMPTIONElectricity
ENERGY CONSUMPTIONNatural Gas
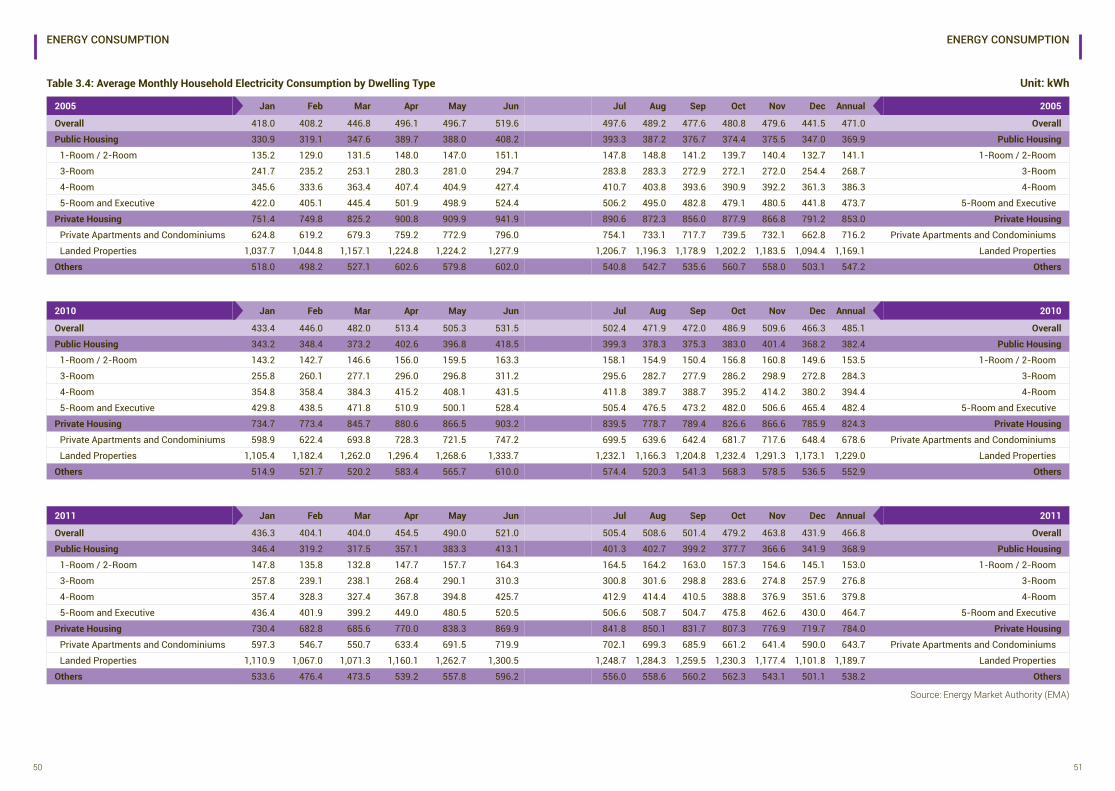
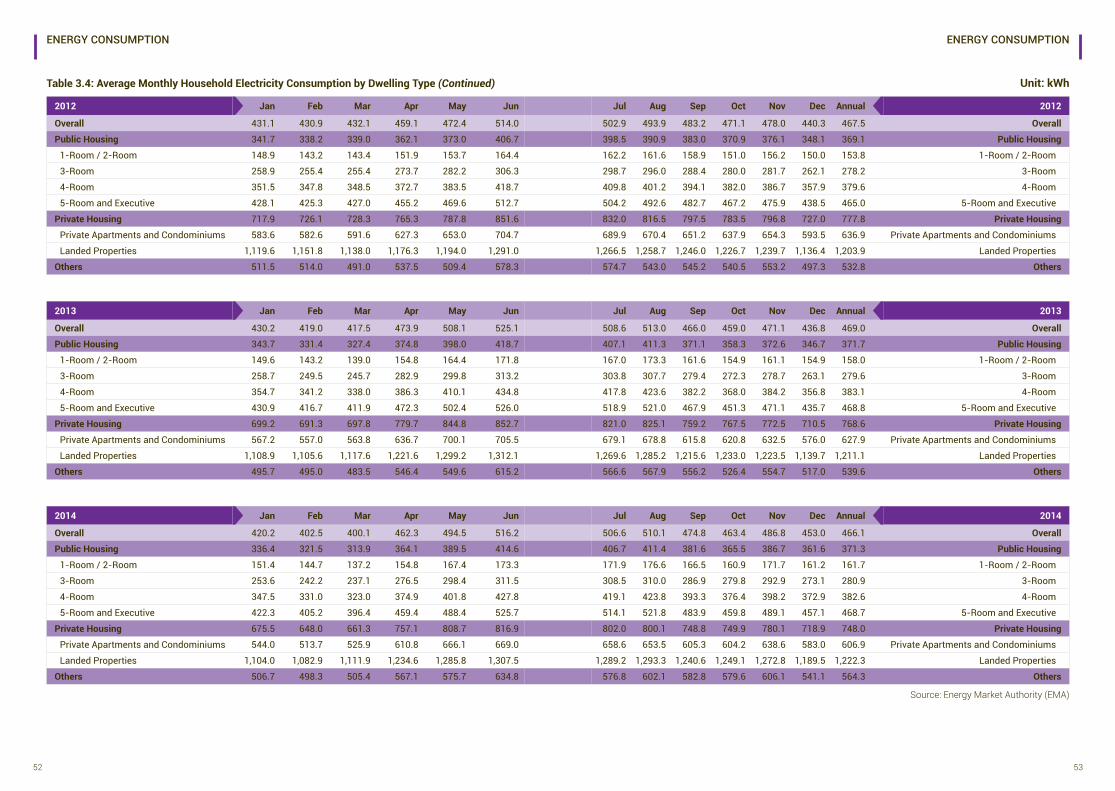
The average monthly consumption of electricity by households fell marginally to 466 kWh over 2014. While average monthly consumption by public housing dwellings remained steady at 371 kWh, the corresponding consumption of private housing units fell by 4.1% to 748 kWh.
In 2014, the average monthly electricity consumption of a 4-room public housing unit was 383 kWh. A 1-room/2-room and a 3-room unit consumed about 42% (162 kWh) and 73% (281 kWh) of electricity respectively relative to the benchmark of a 4-room dwelling. Average monthly electricity consumption of a 5-room and executive flat was about 23% (469 kWh) higher than that of a 4-room unit.
900
750
600
450
300
150
0
900
750
600
450
300
150
0Jan Feb Mar Apr May Jun Jul Aug Sep Oct Nov Dec
Average Monthly Household Electricity Consumption, 2014
kWh kW
h
Public Housing Private Housing
AverageConsumption
AverageConsumption
600
400
200
0
600
400
200
01-Room / 2-Room 3-Room 4-Room 5-Room & Executive
Average Monthly Electricity Consumptionby Public Housing Dwelling Type, 2014
kWhkW
h
58%27%
23%
Final Natural Gas Consumption by Sector
88%
6.2%
51,877 TJ
59,427TJ
1.8%4.4% 0.1%
2010 2014
1.4%4.2% 0.1%
6.1%
88%
Industrial-related
Transport-related
Commerce and Service-related
Households
Others
371 kWh 748 kWh
40 41
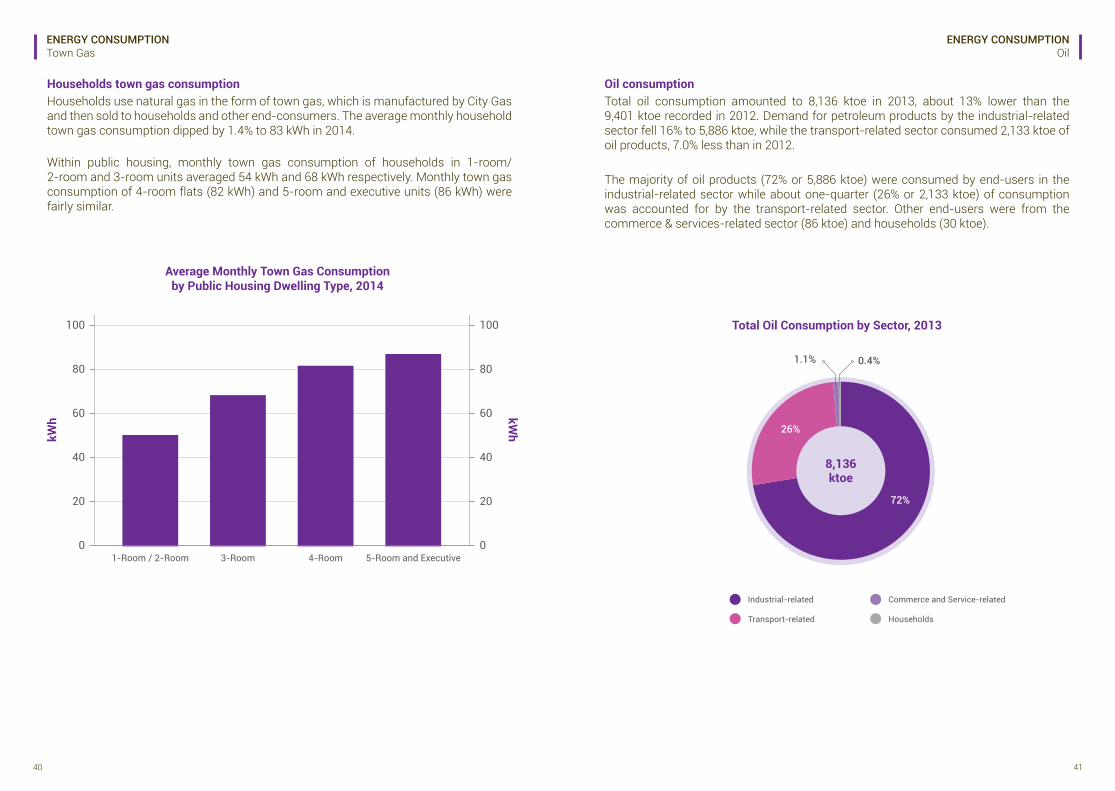
Oil consumptionTotal oil consumption amounted to 8,136 ktoe in 2013, about 13% lower than the 9,401 ktoe recorded in 2012. Demand for petroleum products by the industrial-related sector fell 16% to 5,886 ktoe, while the transport-related sector consumed 2,133 ktoe of oil products, 7.0% less than in 2012.
The majority of oil products (72% or 5,886 ktoe) were consumed by end-users in the industrial-related sector while about one-quarter (26% or 2,133 ktoe) of consumption was accounted for by the transport-related sector. Other end-users were from the commerce & services-related sector (86 ktoe) and households (30 ktoe).
ENERGY CONSUMPTIONTown Gas
ENERGY CONSUMPTIONOil
Households town gas consumptionHouseholds use natural gas in the form of town gas, which is manufactured by City Gas and then sold to households and other end-consumers. The average monthly household town gas consumption dipped by 1.4% to 83 kWh in 2014.
Within public housing, monthly town gas consumption of households in 1-room/ 2-room and 3-room units averaged 54 kWh and 68 kWh respectively. Monthly town gas consumption of 4-room flats (82 kWh) and 5-room and executive units (86 kWh) were fairly similar.
100
80
60
40
20
0
100
80
60
40
20
01-Room / 2-Room 3-Room 4-Room 5-Room and Executive
Average Monthly Town Gas Consumptionby Public Housing Dwelling Type, 2014
Total Oil Consumption by Sector, 2013
kWhkW
h
72%
26%
1.1% 0.4%
8,136 ktoe
Industrial-related
Transport-related
Commerce and Service-related
Households
42 43
2005 2010 2011 2012 2013 2014
Overall 35,489.3 42,251.7 43,007.1 44,200.7 44,923.0 46,403.0
Industrial-related 14,842.0 17,762.2 18,060.8 18,579.7 18,830.2 19,788.5
Manufacturing 14,154.4 16,457.2 16,672.4 17,055.5 17,266.9 18,083.1
Construction 222.2 326.7 352.5 431.2 479.0 517.0
Utilities 441.7 950.3 1,008.0 1,067.6 1,047.4 1,150.6
Other Industrial-related 23.7 27.9 27.8 25.4 36.9 37.7
Commerce and Service-related 12,640.7 15,163.9 15,714.6 16,134.7 16,605.6 16,954.3
Wholesale and Retail Trade 2,177.2 2,119.3 2,112.8 2,041.3 1,986.5 1,985.7
Accommodation and
Food Services1,025.2 1,188.4 1,192.8 1,214.9 1,294.6 1,315.4
Information and Communications 637.2 873.9 942.9 1,047.6 1,145.3 1,299.5
Financial and Insurance Activities 1,096.8 1,813.3 2,015.7 2,262.2 2,262.4 2,606.8
Real Estate Activities 3,719.9 4,242.7 4,265.9 4,261.0 4,487.5 4,448.5
Professional, Scientific &
Technical, Administration &
Support Activities
435.0 754.4 907.4 937.3 934.7 704.6
Other Commerce and Service-related 3,549.4 4,172.0 4,277.2 4,370.3 4,494.5 4,593.9
Transport-related 1,226.7 2,143.3 2,278.6 2,391.0 2,370.0 2,439.4
Households 6,096.4 6,647.5 6,494.1 6,641.0 6,766.4 6,935.8
Others 683.5 534.9 459.0 454.3 350.8 284.9
Source: Energy Market Authority (EMA)
Unit: GWhTable 3.2: Electricity Consumption by Sub-Sector (Total)
Source: Energy Market Authority (EMA)
Unit: Percent (%)Table 3.1: Market Share for Electricity Retail
2005 2010 2011 2012 2013 2014
SP Services 41.7 35.5 36.7 36.7 35.8 33.0
Senoko Energy Supply 17.5 15.6 13.6 15.9 14.5 14.6
Seraya Energy 16.8 19.1 15.8 17.1 16.9 14.2
Keppel Electric 3.1 9.5 11.4 11.4 16.6 13.4
Tuas Power Supply 13.3 12.8 16.2 12.3 10.3 12.7
SembCorp Power 7.6 7.5 6.4 6.6 5.9 8.3
PacificLight Energy - - - - - 3.8
ENERGY CONSUMPTIONOverall Consumption
ENERGY CONSUMPTION
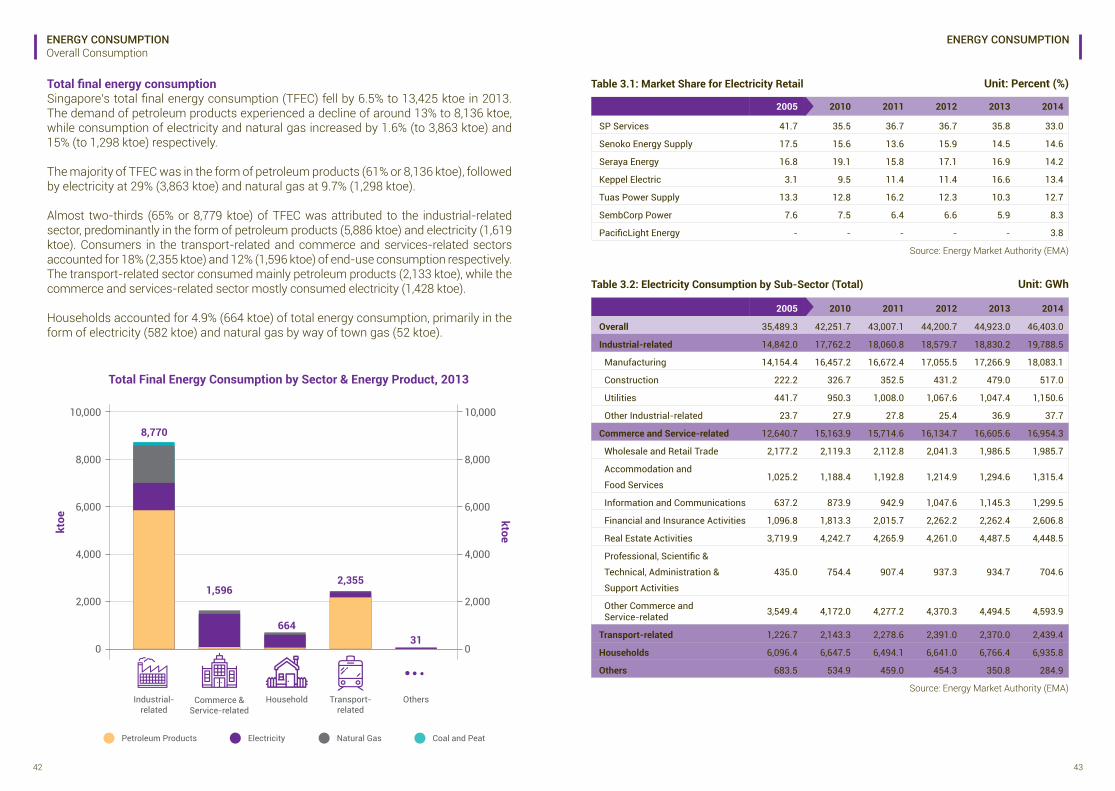
Total final energy consumptionSingapore’s total final energy consumption (TFEC) fell by 6.5% to 13,425 ktoe in 2013. The demand of petroleum products experienced a decline of around 13% to 8,136 ktoe, while consumption of electricity and natural gas increased by 1.6% (to 3,863 ktoe) and 15% (to 1,298 ktoe) respectively. The majority of TFEC was in the form of petroleum products (61% or 8,136 ktoe), followed by electricity at 29% (3,863 ktoe) and natural gas at 9.7% (1,298 ktoe).
Almost two-thirds (65% or 8,779 ktoe) of TFEC was attributed to the industrial-related sector, predominantly in the form of petroleum products (5,886 ktoe) and electricity (1,619 ktoe). Consumers in the transport-related and commerce and services-related sectors accounted for 18% (2,355 ktoe) and 12% (1,596 ktoe) of end-use consumption respectively. The transport-related sector consumed mainly petroleum products (2,133 ktoe), while the commerce and services-related sector mostly consumed electricity (1,428 ktoe).
Households accounted for 4.9% (664 ktoe) of total energy consumption, primarily in the form of electricity (582 ktoe) and natural gas by way of town gas (52 ktoe).
10,000
8,000
6,000
4,000
2,000
0
10,000
8,000
6,000
4,000
2,000
0
Industrial-related
Commerce & Service-related
Household Transport-related
Others
Total Final Energy Consumption by Sector & Energy Product, 2013
ktoektoe
8,770
1,596
664
2,355
31
Petroleum Products Electricity Natural Gas Coal and Peat
44 45
Source: Energy Market Authority (EMA)
Unit: GWhTable 3.2.1: Electricity Consumption by Sub-Sector (Contestable Consumers)
2005 2010 2011 2012 2013 2014
Overall 22,833.4 28,963.4 29,422.6 30,051.2 30,831.1 33,004.2
Industrial-related 14,164.6 16,653.4 16,792.5 17,186.2 17,378.5 18,528.2
Manufacturing 13,663.4 15,666.9 15,752.9 16,088.5 16,296.9 17,314.4
Construction 71.0 74.7 62.0 68.9 71.7 104.2
Utilities 413.6 892.4 960.9 1,017.7 990.8 1,088.2
Other Industrial-related 16.6 19.5 16.7 11.1 19.0 21.5
Commerce and Service-related 7,488.9 10,231.4 10,459.9 10,560.5 11,228.8 12,163.5
Wholesale and Retail Trade 1,406.2 1,314.4 1,238.6 1,096.1 1,062.5 1,220.1 Accommodation and Food Services 649.0 795.4 759.4 731.7 775.9 819.9
Information and Communications 483.5 671.1 715.0 744.5 821.2 1,020.4
Financial and Insurance Activities 723.8 1,448.5 1,593.5 1,812.2 1,839.7 2,219.3
Real Estate Activities 1,350.8 2,329.2 2,324.2 2,297.1 2,525.7 2,729.1 Professional, Scientific & Technical, Administration & Support Activities
186.1 452.4 581.6 580.3 635.7 425.7
Other Commerce and Service-related 2,689.7 3,220.3 3,247.5 3,298.7 3,568.0 3,729.1
Transport-related 1,087.4 2,005.7 2,126.1 2,221.7 2,194.4 2,284.0
Households - - - - - -
Others 92.4 72.9 44.1 82.7 29.5 28.5
Source: Energy Market Authority (EMA)
Unit: GWhTable 3.2.2: Electricity Consumption by Sub-Sector (Non-Contestable Consumers)
2005 2010 2011 2012 2013 2014
Overall 12,655.8 13,288.3 13,584.5 14,149.5 14,091.8 13,398.7
Industrial-related 677.4 1,108.7 1,268.3 1,393.5 1,451.7 1,260.3
Manufacturing 491.0 790.3 919.6 967.0 969.9 768.7
Construction 151.2 252.1 290.6 362.3 407.2 412.8
Utilities 28.1 57.9 47.1 49.9 56.6 62.5
Other Industrial-related 7.1 8.4 11.1 14.3 17.9 16.3
Commerce and Service-related 5,151.8 4,932.5 5,254.7 5,574.1 5,376.8 4,790.8
Wholesale and Retail Trade 771.0 804.8 874.2 945.2 924.0 765.6
Accommodation and Food Services 376.3 393.0 433.4 483.3 518.7 495.5
Information and Communications 153.7 202.8 227.9 303.1 324.2 279.1
Financial and Insurance Activities 373.0 364.7 422.2 450.0 422.7 387.5
Real Estate Activities 2,369.1 1,913.5 1,941.7 1,963.9 1,961.8 1,719.4
Professional, Scientific & Technical, Administration & Support Activities
248.9 302.0 325.7 357.1 299.0 279.0
Other Commerce and Service-related 859.7 951.7 1,029.7 1,071.6 926.5 864.8
Transport-related 139.2 137.6 152.5 169.3 175.6 155.4 Households 6,096.4 6,647.5 6,494.1 6,641.0 6,766.4 6,935.8 Others 591.0 462.1 414.9 371.6 321.4 256.4
ENERGY CONSUMPTION ENERGY CONSUMPTION
46 47
Table 3.3: Total Household Electricity Consumption by Dwelling Type Unit: GWh
2005 Jan Feb Mar Apr May Jun
Overall 448.1 437.4 480.0 533.9 535.3 560.6
Public Housing 280.7 270.8 295.4 331.6 330.5 347.9
1-Room / 2-Room 6.3 6.0 6.1 6.9 6.8 7.0
3-Room 52.9 51.5 55.4 61.4 61.5 64.4
4-Room 111.1 107.3 117.1 131.5 130.9 138.3
5-Room and Executive 110.4 106.0 116.8 131.8 131.2 138.1
Private Housing 166.2 165.5 183.3 200.9 203.5 211.3
Private Apartments and Condominiums 95.8 94.8 104.8 117.9 120.4 124.5
Landed Properties 70.4 70.7 78.5 83.1 83.1 86.8
Others 1.2 1.2 1.2 1.4 1.4 1.4
Jul Aug Sep Oct Nov Dec Annual 2005
537.7 529.1 516.7 520.4 518.9 478.3 6,096.4 Overall
335.3 330.1 321.0 319.0 319.7 295.4 3,777.4 Public Housing
6.9 7.0 6.6 6.5 6.4 6.0 78.4 1-Room / 2-Room
61.9 61.7 59.4 59.1 59.1 55.3 703.5 3-Room
133.0 130.8 127.5 126.6 127.0 117.0 1,498.3 4-Room
133.5 130.7 127.6 126.8 127.2 117.2 1,497.2 5-Room and Executive
201.1 197.7 194.3 200.0 197.8 181.6 2,303.0 Private Housing
118.9 116.2 114.1 118.1 117.2 106.9 1,349.4 Private Apartments and Condominiums
82.2 81.4 80.2 81.9 80.6 74.7 953.6 Landed Properties
1.3 1.3 1.3 1.4 1.4 1.3 15.9 Others
2010 Jan Feb Mar Apr May Jun
Overall 491.5 504.8 548.5 586.0 574.5 607.0
Public Housing 298.7 302.9 325.9 352.0 345.9 365.6
1-Room / 2-Room 6.2 6.1 6.4 6.8 7.0 7.2
3-Room 55.6 56.5 60.4 64.6 64.6 67.8
4-Room 119.0 120.2 129.4 140.2 137.3 145.6
5-Room and Executive 117.9 120.1 129.7 140.4 137.0 145.0
Private Housing 190.9 199.9 220.7 231.7 226.5 239.1
Private Apartments and Condominiums 113.9 117.5 132.7 140.3 138.6 145.2
Landed Properties 77.0 82.4 88.0 91.5 87.9 93.9
Others 1.9 2.0 2.0 2.2 2.1 2.3
Jul Aug Sep Oct Nov Dec Annual 2010
576.2 540.6 540.1 558.7 582.4 537.1 6,647.5 Overall
349.9 331.2 328.3 335.8 351.2 323.7 4,011.0 Public Housing
7.0 6.9 6.7 7.0 7.2 6.8 81.2 1-Room / 2-Room
64.7 61.8 60.8 62.7 65.3 59.9 744.6 3-Room
139.2 131.6 131.2 133.8 139.9 129.1 1,596.6 4-Room
139.0 130.8 129.6 132.4 138.8 127.9 1,588.5 5-Room and Executive
224.1 207.5 209.8 220.7 229.1 211.4 2,611.3 Private Housing
137.7 125.4 126.1 134.1 140.4 128.7 1,580.6 Private Apartments and Condominiums
86.4 82.1 83.7 86.6 88.7 82.7 1,030.7 Landed Properties
2.2 2.0 2.1 2.2 2.2 2.0 25.2 Others
2011 Jan Feb Mar Apr May Jun
Overall 500.2 462.6 466.6 525.3 566.0 603.8
Public Housing 303.6 279.3 279.9 314.6 337.9 364.7
1-Room / 2-Room 6.7 6.1 6.1 6.7 7.2 7.6
3-Room 56.4 52.1 52.2 58.7 63.4 67.8
4-Room 121.1 111.2 111.8 125.7 135.2 146.0
5-Room and Executive 119.4 109.9 109.9 123.5 132.1 143.3
Private Housing 194.7 181.5 184.9 208.6 226.0 236.8
Private Apartments and Condominiums 117.9 107.3 110.1 127.1 138.5 145.4
Landed Properties 76.8 74.2 74.8 81.5 87.5 91.5
Others 2.0 1.8 1.8 2.0 2.1 2.3
Jul Aug Sep Oct Nov Dec Annual 2011
587.0 591.6 583.6 558.7 542.0 506.8 6,494.1 Overall
354.9 356.5 354.0 335.3 326.0 304.8 3,911.6 Public Housing
7.6 7.7 7.6 7.4 7.3 6.9 85.0 1-Room / 2-Room
65.9 66.0 65.4 62.1 60.2 56.6 726.5 3-Room
141.8 142.7 141.6 134.4 130.5 122.2 1,564.4 4-Room
139.6 140.1 139.3 131.4 128.0 119.1 1,535.7 5-Room and Executive
229.9 232.9 227.5 221.2 213.9 200.0 2,558.0 Private Housing
142.8 142.2 139.9 134.7 132.0 122.4 1,560.3 Private Apartments and Condominiums
87.1 90.7 87.6 86.5 82.0 77.6 997.7 Landed Properties
2.1 2.1 2.1 2.1 2.0 1.9 24.4 Others
Source: Energy Market Authority (EMA)
ENERGY CONSUMPTION ENERGY CONSUMPTION
48 49
Table 3.3: Total Household Electricity Consumption by Dwelling Type (Continued) Unit: GWh
2012 Jan Feb Mar Apr May Jun
Overall 504.2 505.9 509.5 541.8 558.1 608.9
Public Housing 303.9 301.5 303.3 323.8 334.0 364.7
1-Room / 2-Room 7.1 6.9 6.9 7.4 7.5 8.0
3-Room 56.6 55.8 56.0 59.9 61.6 66.8
4-Room 121.9 121.1 121.7 130.3 134.4 147.0
5-Room and Executive 118.3 117.8 118.7 126.3 130.5 142.8
Private Housing 198.4 202.4 204.4 216.0 222.1 242.1
Private Apartments and Condominiums 120.9 121.4 124.5 132.5 138.3 150.1
Landed Properties 77.5 81.0 79.9 83.4 83.9 91.9
Others 1.9 1.9 1.9 2.0 1.9 2.2
Jul Aug Sep Oct Nov Dec Annual 2012
595.8 586.5 574.2 561.1 569.1 525.8 6,641.0 Overall
357.5 351.0 344.2 333.8 338.5 313.8 3,970.1 Public Housing
8.0 7.9 7.9 7.5 7.8 7.5 90.5 1-Room / 2-Room
65.3 64.6 62.9 61.0 61.4 57.2 729.0 3-Room
143.9 141.2 138.8 134.7 136.4 126.5 1,597.9 4-Room
140.4 137.3 134.7 130.5 132.8 122.6 1,552.6 5-Room and Executive
236.2 233.5 228.0 225.4 228.5 210.2 2,647.0 Private Housing
147.6 144.2 140.3 138.1 142.0 129.4 1,629.3 Private Apartments and Condominiums
88.6 89.4 87.6 87.2 86.5 80.8 1,017.8 Landed Properties
2.1 2.0 2.0 1.9 2.1 1.9 23.9 Others
2013 Jan Feb Mar Apr May Jun
Overall 514.0 498.9 499.1 569.2 602.7 630.6
Public Housing 310.0 298.0 295.5 339.1 354.8 378.6
1-Room / 2-Room 7.5 7.2 7.1 8.0 8.4 8.8
3-Room 56.3 54.2 53.6 61.9 64.8 68.5
4-Room 125.6 120.4 119.6 137.0 142.3 154.4
5-Room and Executive 120.6 116.2 115.2 132.3 139.3 146.9
Private Housing 202.1 199.1 201.8 228.1 245.9 249.7
Private Apartments and Condominiums 124.0 121.1 123.6 140.7 154.5 156.5
Landed Properties 78.1 78.0 78.2 87.4 91.3 93.3
Others 1.8 1.8 1.8 2.0 2.1 2.3
Jul Aug Sep Oct Nov Dec Annual 2013
612.9 618.6 561.6 555.8 571.7 531.0 6,766.4 Overall
369.4 373.2 337.2 326.3 340.1 316.5 4,038.8 Public Housing
8.7 9.0 8.5 8.1 8.5 8.2 97.9 1-Room / 2-Room
66.6 67.5 61.3 59.9 61.4 57.9 734.1 3-Room
148.8 150.9 136.3 131.7 137.9 128.1 1,633.0 4-Room
145.3 145.8 131.0 126.6 132.3 122.3 1,573.9 5-Room and Executive
241.4 243.3 222.4 227.6 229.6 212.7 2,703.8 Private Housing
151.7 151.9 137.3 140.0 143.4 131.3 1,676.1 Private Apartments and Condominiums
89.7 91.4 85.2 87.6 86.1 81.4 1,027.8 Landed Properties
2.1 2.1 2.0 1.9 2.0 1.9 23.8 Others
2014 Jan Feb Mar Apr May Jun
Overall 510.6 490.1 489.6 569.0 610.5 640.1
Public Housing 307.1 293.9 288.3 335.5 359.6 383.6
1-Room / 2-Room 8.0 7.7 7.4 8.5 9.2 9.7
3-Room 55.8 53.3 52.4 61.2 66.1 69.0
4-Room 124.7 119.1 116.8 136.0 146.2 156.0
5-Room and Executive 118.5 113.7 111.7 129.7 138.1 149.0
Private Housing 201.7 194.6 199.5 231.6 248.9 254.3
Private Apartments and Condominiums 124.3 117.9 122.0 143.1 157.9 160.0
Landed Properties 77.4 76.7 77.5 88.5 91.0 94.3
Others 1.8 1.7 1.7 2.0 1.9 2.1
Jul Aug Sep Oct Nov Dec Annual 2014
629.0 636.5 593.4 581.8 612.5 572.7 6,935.8 Overall
376.7 382.4 355.3 341.4 362.1 339.7 4,125.7 Public Housing
9.7 10.0 9.5 9.3 9.9 9.4 108.3 1-Room / 2-Room
68.3 68.9 63.9 62.4 65.6 61.3 748.2 3-Room
153.0 155.4 144.4 138.8 147.1 138.3 1,675.8 4-Room
145.7 148.1 137.5 131.0 139.5 130.7 1,593.3 5-Room and Executive
250.4 252.1 236.1 238.4 248.4 231.2 2,787.1 Private Housing
158.9 158.7 147.7 148.7 158.0 145.5 1,742.6 Private Apartments and Condominiums
91.5 93.4 88.3 89.7 90.4 85.7 1,044.5 Landed Properties
1.9 2.0 2.0 1.9 2.0 1.8 23.0 Others
Source: Energy Market Authority (EMA)
ENERGY CONSUMPTION ENERGY CONSUMPTION
50 51
Table 3.4: Average Monthly Household Electricity Consumption by Dwelling Type Unit: kWh
2005 Jan Feb Mar Apr May Jun
Overall 418.0 408.2 446.8 496.1 496.7 519.6
Public Housing 330.9 319.1 347.6 389.7 388.0 408.2
1-Room / 2-Room 135.2 129.0 131.5 148.0 147.0 151.1
3-Room 241.7 235.2 253.1 280.3 281.0 294.7
4-Room 345.6 333.6 363.4 407.4 404.9 427.4
5-Room and Executive 422.0 405.1 445.4 501.9 498.9 524.4
Private Housing 751.4 749.8 825.2 900.8 909.9 941.9
Private Apartments and Condominiums 624.8 619.2 679.3 759.2 772.9 796.0
Landed Properties 1,037.7 1,044.8 1,157.1 1,224.8 1,224.2 1,277.9
Others 518.0 498.2 527.1 602.6 579.8 602.0
Jul Aug Sep Oct Nov Dec Annual 2005
497.6 489.2 477.6 480.8 479.6 441.5 471.0 Overall
393.3 387.2 376.7 374.4 375.5 347.0 369.9 Public Housing
147.8 148.8 141.2 139.7 140.4 132.7 141.1 1-Room / 2-Room
283.8 283.3 272.9 272.1 272.0 254.4 268.7 3-Room
410.7 403.8 393.6 390.9 392.2 361.3 386.3 4-Room
506.2 495.0 482.8 479.1 480.5 441.8 473.7 5-Room and Executive
890.6 872.3 856.0 877.9 866.8 791.2 853.0 Private Housing
754.1 733.1 717.7 739.5 732.1 662.8 716.2 Private Apartments and Condominiums
1,206.7 1,196.3 1,178.9 1,202.2 1,183.5 1,094.4 1,169.1 Landed Properties
540.8 542.7 535.6 560.7 558.0 503.1 547.2 Others
2010 Jan Feb Mar Apr May Jun
Overall 433.4 446.0 482.0 513.4 505.3 531.5
Public Housing 343.2 348.4 373.2 402.6 396.8 418.5
1-Room / 2-Room 143.2 142.7 146.6 156.0 159.5 163.3
3-Room 255.8 260.1 277.1 296.0 296.8 311.2
4-Room 354.8 358.4 384.3 415.2 408.1 431.5
5-Room and Executive 429.8 438.5 471.8 510.9 500.1 528.4
Private Housing 734.7 773.4 845.7 880.6 866.5 903.2
Private Apartments and Condominiums 598.9 622.4 693.8 728.3 721.5 747.2
Landed Properties 1,105.4 1,182.4 1,262.0 1,296.4 1,268.6 1,333.7
Others 514.9 521.7 520.2 583.4 565.7 610.0
Jul Aug Sep Oct Nov Dec Annual 2010
502.4 471.9 472.0 486.9 509.6 466.3 485.1 Overall
399.3 378.3 375.3 383.0 401.4 368.2 382.4 Public Housing
158.1 154.9 150.4 156.8 160.8 149.6 153.5 1-Room / 2-Room
295.6 282.7 277.9 286.2 298.9 272.8 284.3 3-Room
411.8 389.7 388.7 395.2 414.2 380.2 394.4 4-Room
505.4 476.5 473.2 482.0 506.6 465.4 482.4 5-Room and Executive
839.5 778.7 789.4 826.6 866.6 785.9 824.3 Private Housing
699.5 639.6 642.4 681.7 717.6 648.4 678.6 Private Apartments and Condominiums
1,232.1 1,166.3 1,204.8 1,232.4 1,291.3 1,173.1 1,229.0 Landed Properties
574.4 520.3 541.3 568.3 578.5 536.5 552.9 Others
2011 Jan Feb Mar Apr May Jun
Overall 436.3 404.1 404.0 454.5 490.0 521.0
Public Housing 346.4 319.2 317.5 357.1 383.3 413.1
1-Room / 2-Room 147.8 135.8 132.8 147.7 157.7 164.3
3-Room 257.8 239.1 238.1 268.4 290.1 310.3
4-Room 357.4 328.3 327.4 367.8 394.8 425.7
5-Room and Executive 436.4 401.9 399.2 449.0 480.5 520.5
Private Housing 730.4 682.8 685.6 770.0 838.3 869.9
Private Apartments and Condominiums 597.3 546.7 550.7 633.4 691.5 719.9
Landed Properties 1,110.9 1,067.0 1,071.3 1,160.1 1,262.7 1,300.5
Others 533.6 476.4 473.5 539.2 557.8 596.2
Jul Aug Sep Oct Nov Dec Annual 2011
505.4 508.6 501.4 479.2 463.8 431.9 466.8 Overall
401.3 402.7 399.2 377.7 366.6 341.9 368.9 Public Housing
164.5 164.2 163.0 157.3 154.6 145.1 153.0 1-Room / 2-Room
300.8 301.6 298.8 283.6 274.8 257.9 276.8 3-Room
412.9 414.4 410.5 388.8 376.9 351.6 379.8 4-Room
506.6 508.7 504.7 475.8 462.6 430.0 464.7 5-Room and Executive
841.8 850.1 831.7 807.3 776.9 719.7 784.0 Private Housing
702.1 699.3 685.9 661.2 641.4 590.0 643.7 Private Apartments and Condominiums
1,248.7 1,284.3 1,259.5 1,230.3 1,177.4 1,101.8 1,189.7 Landed Properties
556.0 558.6 560.2 562.3 543.1 501.1 538.2 Others
Source: Energy Market Authority (EMA)
ENERGY CONSUMPTION ENERGY CONSUMPTION
52 53
Table 3.4: Average Monthly Household Electricity Consumption by Dwelling Type (Continued) Unit: kWh
2012 Jan Feb Mar Apr May Jun
Overall 431.1 430.9 432.1 459.1 472.4 514.0
Public Housing 341.7 338.2 339.0 362.1 373.0 406.7
1-Room / 2-Room 148.9 143.2 143.4 151.9 153.7 164.4
3-Room 258.9 255.4 255.4 273.7 282.2 306.3
4-Room 351.5 347.8 348.5 372.7 383.5 418.7
5-Room and Executive 428.1 425.3 427.0 455.2 469.6 512.7
Private Housing 717.9 726.1 728.3 765.3 787.8 851.6
Private Apartments and Condominiums 583.6 582.6 591.6 627.3 653.0 704.7
Landed Properties 1,119.6 1,151.8 1,138.0 1,176.3 1,194.0 1,291.0
Others 511.5 514.0 491.0 537.5 509.4 578.3
Jul Aug Sep Oct Nov Dec Annual 2012
502.9 493.9 483.2 471.1 478.0 440.3 467.5 Overall
398.5 390.9 383.0 370.9 376.1 348.1 369.1 Public Housing
162.2 161.6 158.9 151.0 156.2 150.0 153.8 1-Room / 2-Room
298.7 296.0 288.4 280.0 281.7 262.1 278.2 3-Room
409.8 401.2 394.1 382.0 386.7 357.9 379.6 4-Room
504.2 492.6 482.7 467.2 475.9 438.5 465.0 5-Room and Executive
832.0 816.5 797.5 783.5 796.8 727.0 777.8 Private Housing
689.9 670.4 651.2 637.9 654.3 593.5 636.9 Private Apartments and Condominiums
1,266.5 1,258.7 1,246.0 1,226.7 1,239.7 1,136.4 1,203.9 Landed Properties
574.7 543.0 545.2 540.5 553.2 497.3 532.8 Others
2013 Jan Feb Mar Apr May Jun
Overall 430.2 419.0 417.5 473.9 508.1 525.1
Public Housing 343.7 331.4 327.4 374.8 398.0 418.7
1-Room / 2-Room 149.6 143.2 139.0 154.8 164.4 171.8
3-Room 258.7 249.5 245.7 282.9 299.8 313.2
4-Room 354.7 341.2 338.0 386.3 410.1 434.8
5-Room and Executive 430.9 416.7 411.9 472.3 502.4 526.0
Private Housing 699.2 691.3 697.8 779.7 844.8 852.7
Private Apartments and Condominiums 567.2 557.0 563.8 636.7 700.1 705.5
Landed Properties 1,108.9 1,105.6 1,117.6 1,221.6 1,299.2 1,312.1
Others 495.7 495.0 483.5 546.4 549.6 615.2
Jul Aug Sep Oct Nov Dec Annual 2013
508.6 513.0 466.0 459.0 471.1 436.8 469.0 Overall
407.1 411.3 371.1 358.3 372.6 346.7 371.7 Public Housing
167.0 173.3 161.6 154.9 161.1 154.9 158.0 1-Room / 2-Room
303.8 307.7 279.4 272.3 278.7 263.1 279.6 3-Room
417.8 423.6 382.2 368.0 384.2 356.8 383.1 4-Room
518.9 521.0 467.9 451.3 471.1 435.7 468.8 5-Room and Executive
821.0 825.1 759.2 767.5 772.5 710.5 768.6 Private Housing
679.1 678.8 615.8 620.8 632.5 576.0 627.9 Private Apartments and Condominiums
1,269.6 1,285.2 1,215.6 1,233.0 1,223.5 1,139.7 1,211.1 Landed Properties
566.6 567.9 556.2 526.4 554.7 517.0 539.6 Others
2014 Jan Feb Mar Apr May Jun
Overall 420.2 402.5 400.1 462.3 494.5 516.2
Public Housing 336.4 321.5 313.9 364.1 389.5 414.6
1-Room / 2-Room 151.4 144.7 137.2 154.8 167.4 173.3
3-Room 253.6 242.2 237.1 276.5 298.4 311.5
4-Room 347.5 331.0 323.0 374.9 401.8 427.8
5-Room and Executive 422.3 405.2 396.4 459.4 488.4 525.7
Private Housing 675.5 648.0 661.3 757.1 808.7 816.9
Private Apartments and Condominiums 544.0 513.7 525.9 610.8 666.1 669.0
Landed Properties 1,104.0 1,082.9 1,111.9 1,234.6 1,285.8 1,307.5
Others 506.7 498.3 505.4 567.1 575.7 634.8
Jul Aug Sep Oct Nov Dec Annual 2014
506.6 510.1 474.8 463.4 486.8 453.0 466.1 Overall
406.7 411.4 381.6 365.5 386.7 361.6 371.3 Public Housing
171.9 176.6 166.5 160.9 171.7 161.2 161.7 1-Room / 2-Room
308.5 310.0 286.9 279.8 292.9 273.1 280.9 3-Room
419.1 423.8 393.3 376.4 398.2 372.9 382.6 4-Room
514.1 521.8 483.9 459.8 489.1 457.1 468.7 5-Room and Executive
802.0 800.1 748.8 749.9 780.1 718.9 748.0 Private Housing
658.6 653.5 605.3 604.2 638.6 583.0 606.9 Private Apartments and Condominiums
1,289.2 1,293.3 1,240.6 1,249.1 1,272.8 1,189.5 1,222.3 Landed Properties
576.8 602.1 582.8 579.6 606.1 541.1 564.3 Others
Source: Energy Market Authority (EMA)
ENERGY CONSUMPTION ENERGY CONSUMPTION
54 55
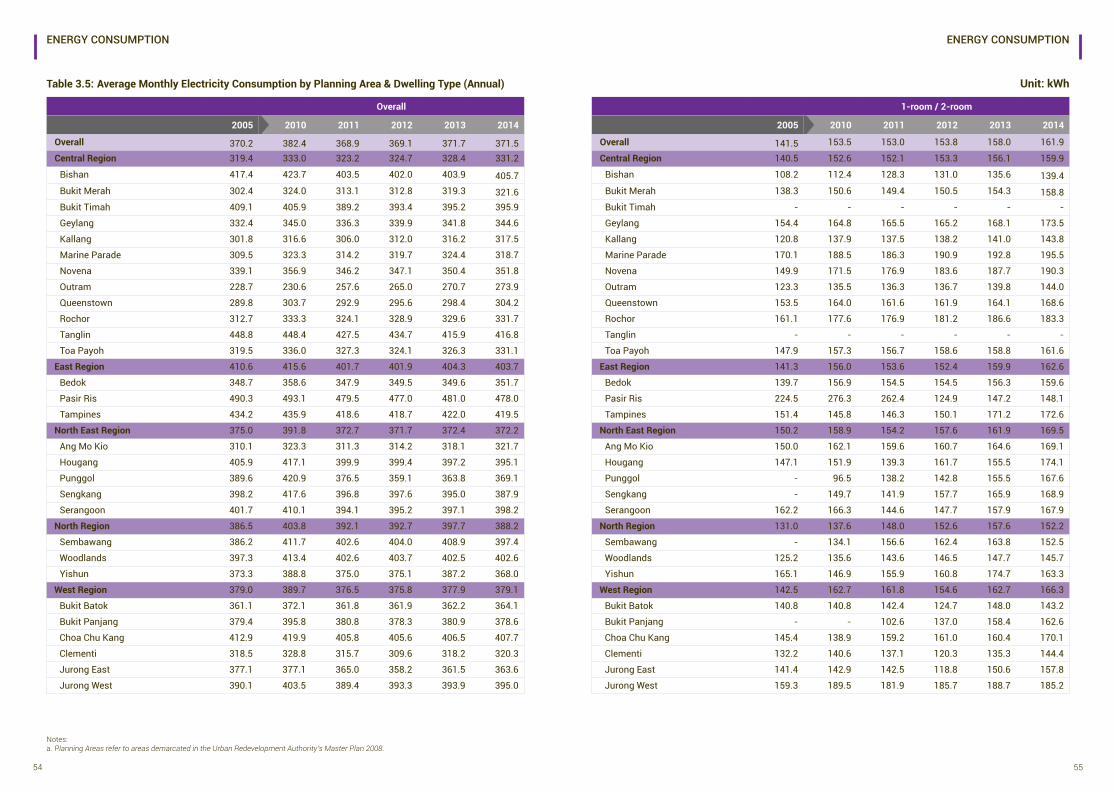
Notes:a. Planning Areas refer to areas demarcated in the Urban Redevelopment Authority’s Master Plan 2008.
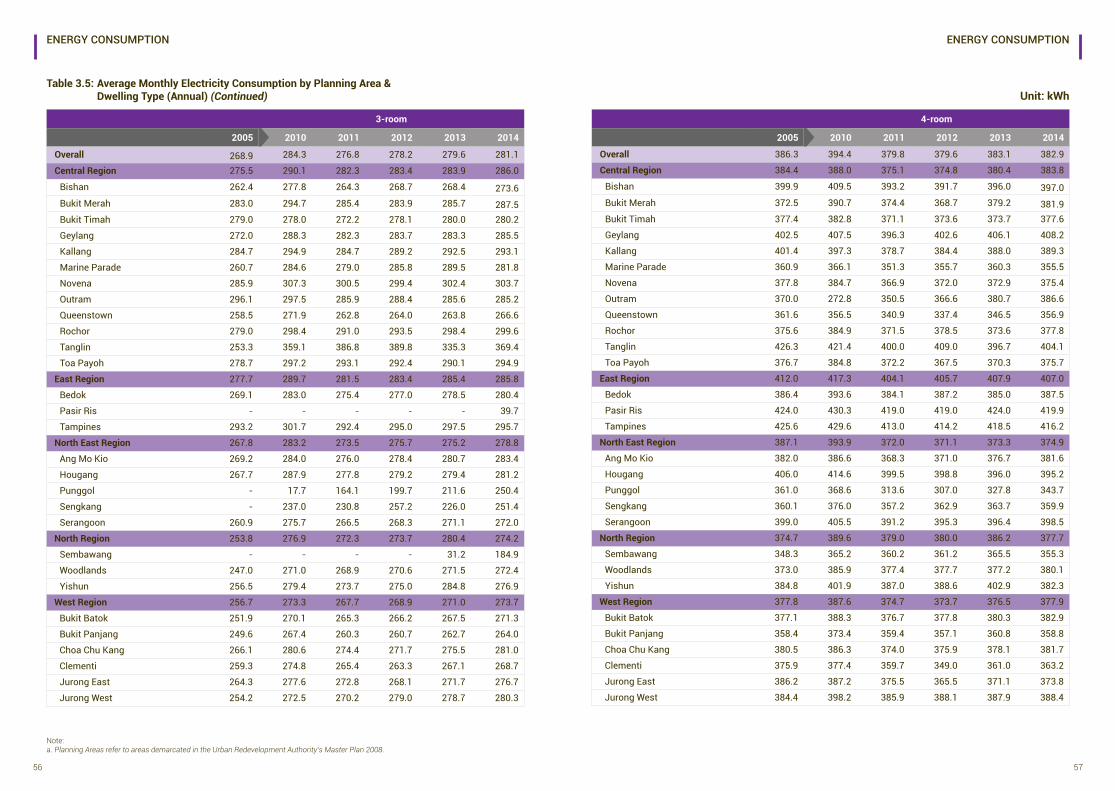
Table 3.5: Average Monthly Electricity Consumption by Planning Area & Dwelling Type (Annual)
Overall
2005 2010 2011 2012 2013 2014
Overall 370.2 382.4 368.9 369.1 371.7 371.5 Central Region 319.4 333.0 323.2 324.7 328.4 331.2
Bishan 417.4 423.7 403.5 402.0 403.9 405.7Bukit Merah 302.4 324.0 313.1 312.8 319.3 321.6Bukit Timah 409.1 405.9 389.2 393.4 395.2 395.9
Geylang 332.4 345.0 336.3 339.9 341.8 344.6
Kallang 301.8 316.6 306.0 312.0 316.2 317.5
Marine Parade 309.5 323.3 314.2 319.7 324.4 318.7
Novena 339.1 356.9 346.2 347.1 350.4 351.8
Outram 228.7 230.6 257.6 265.0 270.7 273.9
Queenstown 289.8 303.7 292.9 295.6 298.4 304.2
Rochor 312.7 333.3 324.1 328.9 329.6 331.7
Tanglin 448.8 448.4 427.5 434.7 415.9 416.8
Toa Payoh 319.5 336.0 327.3 324.1 326.3 331.1
East Region 410.6 415.6 401.7 401.9 404.3 403.7
Bedok 348.7 358.6 347.9 349.5 349.6 351.7
Pasir Ris 490.3 493.1 479.5 477.0 481.0 478.0
Tampines 434.2 435.9 418.6 418.7 422.0 419.5
North East Region 375.0 391.8 372.7 371.7 372.4 372.2
Ang Mo Kio 310.1 323.3 311.3 314.2 318.1 321.7
Hougang 405.9 417.1 399.9 399.4 397.2 395.1
Punggol 389.6 420.9 376.5 359.1 363.8 369.1
Sengkang 398.2 417.6 396.8 397.6 395.0 387.9
Serangoon 401.7 410.1 394.1 395.2 397.1 398.2
North Region 386.5 403.8 392.1 392.7 397.7 388.2
Sembawang 386.2 411.7 402.6 404.0 408.9 397.4
Woodlands 397.3 413.4 402.6 403.7 402.5 402.6
Yishun 373.3 388.8 375.0 375.1 387.2 368.0
West Region 379.0 389.7 376.5 375.8 377.9 379.1
Bukit Batok 361.1 372.1 361.8 361.9 362.2 364.1
Bukit Panjang 379.4 395.8 380.8 378.3 380.9 378.6
Choa Chu Kang 412.9 419.9 405.8 405.6 406.5 407.7
Clementi 318.5 328.8 315.7 309.6 318.2 320.3
Jurong East 377.1 377.1 365.0 358.2 361.5 363.6
Jurong West 390.1 403.5 389.4 393.3 393.9 395.0
1-room / 2-room
2005 2010 2011 2012 2013 2014
Overall 141.5 153.5 153.0 153.8 158.0 161.9
Central Region 140.5 152.6 152.1 153.3 156.1 159.9
Bishan 108.2 112.4 128.3 131.0 135.6 139.4Bukit Merah 138.3 150.6 149.4 150.5 154.3 158.8Bukit Timah - - - - - -
Geylang 154.4 164.8 165.5 165.2 168.1 173.5
Kallang 120.8 137.9 137.5 138.2 141.0 143.8
Marine Parade 170.1 188.5 186.3 190.9 192.8 195.5
Novena 149.9 171.5 176.9 183.6 187.7 190.3
Outram 123.3 135.5 136.3 136.7 139.8 144.0
Queenstown 153.5 164.0 161.6 161.9 164.1 168.6
Rochor 161.1 177.6 176.9 181.2 186.6 183.3
Tanglin - - - - - -
Toa Payoh 147.9 157.3 156.7 158.6 158.8 161.6
East Region 141.3 156.0 153.6 152.4 159.9 162.6
Bedok 139.7 156.9 154.5 154.5 156.3 159.6
Pasir Ris 224.5 276.3 262.4 124.9 147.2 148.1
Tampines 151.4 145.8 146.3 150.1 171.2 172.6
North East Region 150.2 158.9 154.2 157.6 161.9 169.5
Ang Mo Kio 150.0 162.1 159.6 160.7 164.6 169.1
Hougang 147.1 151.9 139.3 161.7 155.5 174.1
Punggol - 96.5 138.2 142.8 155.5 167.6
Sengkang - 149.7 141.9 157.7 165.9 168.9
Serangoon 162.2 166.3 144.6 147.7 157.9 167.9
North Region 131.0 137.6 148.0 152.6 157.6 152.2
Sembawang - 134.1 156.6 162.4 163.8 152.5
Woodlands 125.2 135.6 143.6 146.5 147.7 145.7
Yishun 165.1 146.9 155.9 160.8 174.7 163.3
West Region 142.5 162.7 161.8 154.6 162.7 166.3
Bukit Batok 140.8 140.8 142.4 124.7 148.0 143.2
Bukit Panjang - - 102.6 137.0 158.4 162.6
Choa Chu Kang 145.4 138.9 159.2 161.0 160.4 170.1
Clementi 132.2 140.6 137.1 120.3 135.3 144.4
Jurong East 141.4 142.9 142.5 118.8 150.6 157.8
Jurong West 159.3 189.5 181.9 185.7 188.7 185.2
Unit: kWh
ENERGY CONSUMPTION ENERGY CONSUMPTION
56 57
Table 3.5: Average Monthly Electricity Consumption by Planning Area & Dwelling Type (Annual) (Continued)
3-room
2005 2010 2011 2012 2013 2014
Overall 268.9 284.3 276.8 278.2 279.6 281.1
Central Region 275.5 290.1 282.3 283.4 283.9 286.0
Bishan 262.4 277.8 264.3 268.7 268.4 273.6Bukit Merah 283.0 294.7 285.4 283.9 285.7 287.5Bukit Timah 279.0 278.0 272.2 278.1 280.0 280.2
Geylang 272.0 288.3 282.3 283.7 283.3 285.5
Kallang 284.7 294.9 284.7 289.2 292.5 293.1
Marine Parade 260.7 284.6 279.0 285.8 289.5 281.8
Novena 285.9 307.3 300.5 299.4 302.4 303.7
Outram 296.1 297.5 285.9 288.4 285.6 285.2
Queenstown 258.5 271.9 262.8 264.0 263.8 266.6
Rochor 279.0 298.4 291.0 293.5 298.4 299.6
Tanglin 253.3 359.1 386.8 389.8 335.3 369.4
Toa Payoh 278.7 297.2 293.1 292.4 290.1 294.9
East Region 277.7 289.7 281.5 283.4 285.4 285.8
Bedok 269.1 283.0 275.4 277.0 278.5 280.4
Pasir Ris - - - - - 39.7
Tampines 293.2 301.7 292.4 295.0 297.5 295.7
North East Region 267.8 283.2 273.5 275.7 275.2 278.8
Ang Mo Kio 269.2 284.0 276.0 278.4 280.7 283.4
Hougang 267.7 287.9 277.8 279.2 279.4 281.2
Punggol - 17.7 164.1 199.7 211.6 250.4
Sengkang - 237.0 230.8 257.2 226.0 251.4
Serangoon 260.9 275.7 266.5 268.3 271.1 272.0
North Region 253.8 276.9 272.3 273.7 280.4 274.2
Sembawang - - - - 31.2 184.9
Woodlands 247.0 271.0 268.9 270.6 271.5 272.4
Yishun 256.5 279.4 273.7 275.0 284.8 276.9
West Region 256.7 273.3 267.7 268.9 271.0 273.7
Bukit Batok 251.9 270.1 265.3 266.2 267.5 271.3
Bukit Panjang 249.6 267.4 260.3 260.7 262.7 264.0
Choa Chu Kang 266.1 280.6 274.4 271.7 275.5 281.0
Clementi 259.3 274.8 265.4 263.3 267.1 268.7
Jurong East 264.3 277.6 272.8 268.1 271.7 276.7
Jurong West 254.2 272.5 270.2 279.0 278.7 280.3
4-room
2005 2010 2011 2012 2013 2014
Overall 386.3 394.4 379.8 379.6 383.1 382.9
Central Region 384.4 388.0 375.1 374.8 380.4 383.8
Bishan 399.9 409.5 393.2 391.7 396.0 397.0Bukit Merah 372.5 390.7 374.4 368.7 379.2 381.9Bukit Timah 377.4 382.8 371.1 373.6 373.7 377.6
Geylang 402.5 407.5 396.3 402.6 406.1 408.2
Kallang 401.4 397.3 378.7 384.4 388.0 389.3
Marine Parade 360.9 366.1 351.3 355.7 360.3 355.5
Novena 377.8 384.7 366.9 372.0 372.9 375.4
Outram 370.0 272.8 350.5 366.6 380.7 386.6
Queenstown 361.6 356.5 340.9 337.4 346.5 356.9
Rochor 375.6 384.9 371.5 378.5 373.6 377.8
Tanglin 426.3 421.4 400.0 409.0 396.7 404.1
Toa Payoh 376.7 384.8 372.2 367.5 370.3 375.7
East Region 412.0 417.3 404.1 405.7 407.9 407.0
Bedok 386.4 393.6 384.1 387.2 385.0 387.5
Pasir Ris 424.0 430.3 419.0 419.0 424.0 419.9
Tampines 425.6 429.6 413.0 414.2 418.5 416.2
North East Region 387.1 393.9 372.0 371.1 373.3 374.9
Ang Mo Kio 382.0 386.6 368.3 371.0 376.7 381.6
Hougang 406.0 414.6 399.5 398.8 396.0 395.2
Punggol 361.0 368.6 313.6 307.0 327.8 343.7
Sengkang 360.1 376.0 357.2 362.9 363.7 359.9
Serangoon 399.0 405.5 391.2 395.3 396.4 398.5
North Region 374.7 389.6 379.0 380.0 386.2 377.7
Sembawang 348.3 365.2 360.2 361.2 365.5 355.3
Woodlands 373.0 385.9 377.4 377.7 377.2 380.1
Yishun 384.8 401.9 387.0 388.6 402.9 382.3
West Region 377.8 387.6 374.7 373.7 376.5 377.9
Bukit Batok 377.1 388.3 376.7 377.8 380.3 382.9
Bukit Panjang 358.4 373.4 359.4 357.1 360.8 358.8
Choa Chu Kang 380.5 386.3 374.0 375.9 378.1 381.7
Clementi 375.9 377.4 359.7 349.0 361.0 363.2
Jurong East 386.2 387.2 375.5 365.5 371.1 373.8
Jurong West 384.4 398.2 385.9 388.1 387.9 388.4
Note:a. Planning Areas refer to areas demarcated in the Urban Redevelopment Authority’s Master Plan 2008.
Unit: kWh
ENERGY CONSUMPTION ENERGY CONSUMPTION
58 59
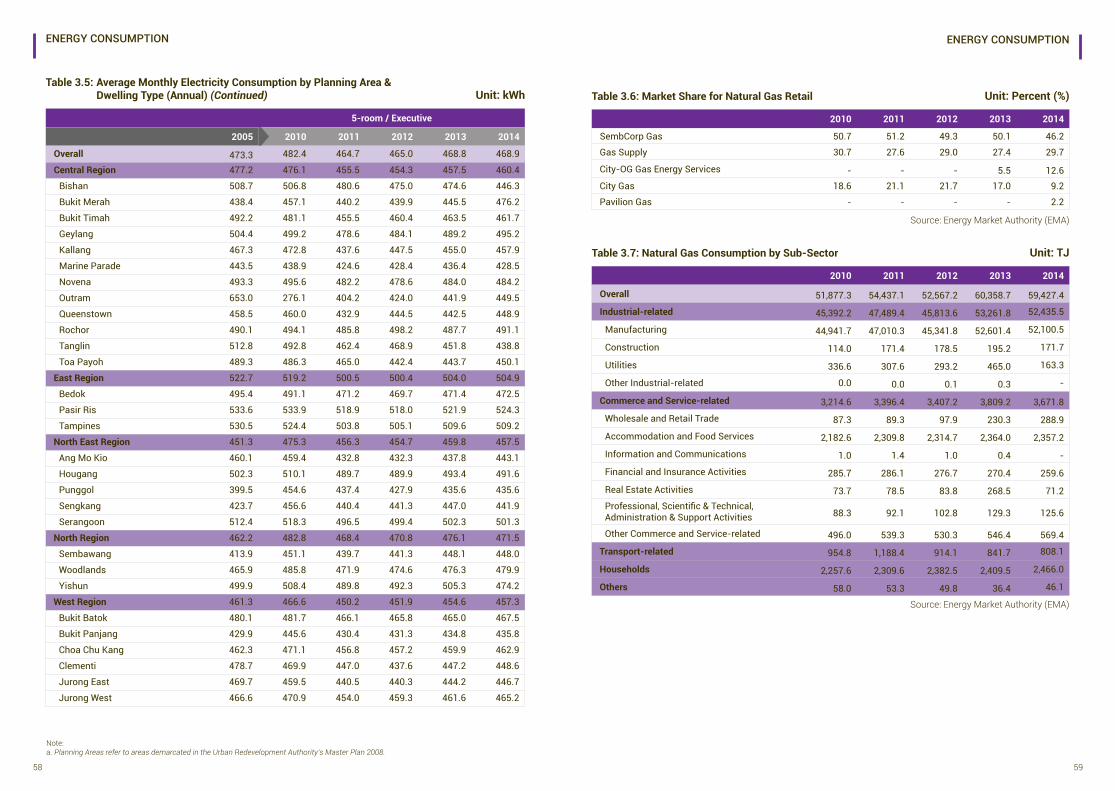
Table 3.5: Average Monthly Electricity Consumption by Planning Area & Dwelling Type (Annual) (Continued)
5-room / Executive
2005 2010 2011 2012 2013 2014
Overall 473.3 482.4 464.7 465.0 468.8 468.9
Central Region 477.2 476.1 455.5 454.3 457.5 460.4
Bishan 508.7 506.8 480.6 475.0 474.6 446.3
Bukit Merah 438.4 457.1 440.2 439.9 445.5 476.2
Bukit Timah 492.2 481.1 455.5 460.4 463.5 461.7
Geylang 504.4 499.2 478.6 484.1 489.2 495.2
Kallang 467.3 472.8 437.6 447.5 455.0 457.9
Marine Parade 443.5 438.9 424.6 428.4 436.4 428.5
Novena 493.3 495.6 482.2 478.6 484.0 484.2
Outram 653.0 276.1 404.2 424.0 441.9 449.5
Queenstown 458.5 460.0 432.9 444.5 442.5 448.9
Rochor 490.1 494.1 485.8 498.2 487.7 491.1
Tanglin 512.8 492.8 462.4 468.9 451.8 438.8
Toa Payoh 489.3 486.3 465.0 442.4 443.7 450.1
East Region 522.7 519.2 500.5 500.4 504.0 504.9
Bedok 495.4 491.1 471.2 469.7 471.4 472.5
Pasir Ris 533.6 533.9 518.9 518.0 521.9 524.3
Tampines 530.5 524.4 503.8 505.1 509.6 509.2
North East Region 451.3 475.3 456.3 454.7 459.8 457.5
Ang Mo Kio 460.1 459.4 432.8 432.3 437.8 443.1
Hougang 502.3 510.1 489.7 489.9 493.4 491.6
Punggol 399.5 454.6 437.4 427.9 435.6 435.6
Sengkang 423.7 456.6 440.4 441.3 447.0 441.9
Serangoon 512.4 518.3 496.5 499.4 502.3 501.3
North Region 462.2 482.8 468.4 470.8 476.1 471.5
Sembawang 413.9 451.1 439.7 441.3 448.1 448.0
Woodlands 465.9 485.8 471.9 474.6 476.3 479.9
Yishun 499.9 508.4 489.8 492.3 505.3 474.2
West Region 461.3 466.6 450.2 451.9 454.6 457.3
Bukit Batok 480.1 481.7 466.1 465.8 465.0 467.5
Bukit Panjang 429.9 445.6 430.4 431.3 434.8 435.8
Choa Chu Kang 462.3 471.1 456.8 457.2 459.9 462.9
Clementi 478.7 469.9 447.0 437.6 447.2 448.6
Jurong East 469.7 459.5 440.5 440.3 444.2 446.7
Jurong West 466.6 470.9 454.0 459.3 461.6 465.2
Note:a. Planning Areas refer to areas demarcated in the Urban Redevelopment Authority’s Master Plan 2008.
Unit: kWh
Source: Energy Market Authority (EMA)
Unit: Percent (%)Table 3.6: Market Share for Natural Gas Retail
2010 2011 2012 2013 2014
SembCorp Gas 50.7 51.2 49.3 50.1 46.2
Gas Supply 30.7 27.6 29.0 27.4 29.7
City-OG Gas Energy Services - - - 5.5 12.6 City Gas 18.6 21.1 21.7 17.0 9.2
Pavilion Gas - - - - 2.2
Source: Energy Market Authority (EMA)
Unit: TJTable 3.7: Natural Gas Consumption by Sub-Sector
2010 2011 2012 2013 2014
Overall 51,877.3 54,437.1 52,567.2 60,358.7 59,427.4
Industrial-related 45,392.2 47,489.4 45,813.6 53,261.8 52,435.5
Manufacturing 44,941.7 47,010.3 45,341.8 52,601.4 52,100.5
Construction 114.0 171.4 178.5 195.2 171.7
Utilities 336.6 307.6 293.2 465.0 163.3
Other Industrial-related 0.0 0.0 0.1 0.3 -
Commerce and Service-related 3,214.6 3,396.4 3,407.2 3,809.2 3,671.8
Wholesale and Retail Trade 87.3 89.3 97.9 230.3 288.9
Accommodation and Food Services 2,182.6 2,309.8 2,314.7 2,364.0 2,357.2
Information and Communications 1.0 1.4 1.0 0.4 -
Financial and Insurance Activities 285.7 286.1 276.7 270.4 259.6
Real Estate Activities 73.7 78.5 83.8 268.5 71.2 Professional, Scientific & Technical, Administration & Support Activities 88.3 92.1 102.8 129.3 125.6
Other Commerce and Service-related 496.0 539.3 530.3 546.4 569.4
Transport-related 954.8 1,188.4 914.1 841.7 808.1
Households 2,257.6 2,309.6 2,382.5 2,409.5 2,466.0
Others 58.0 53.3 49.8 36.4 46.1
ENERGY CONSUMPTION ENERGY CONSUMPTION
60 61
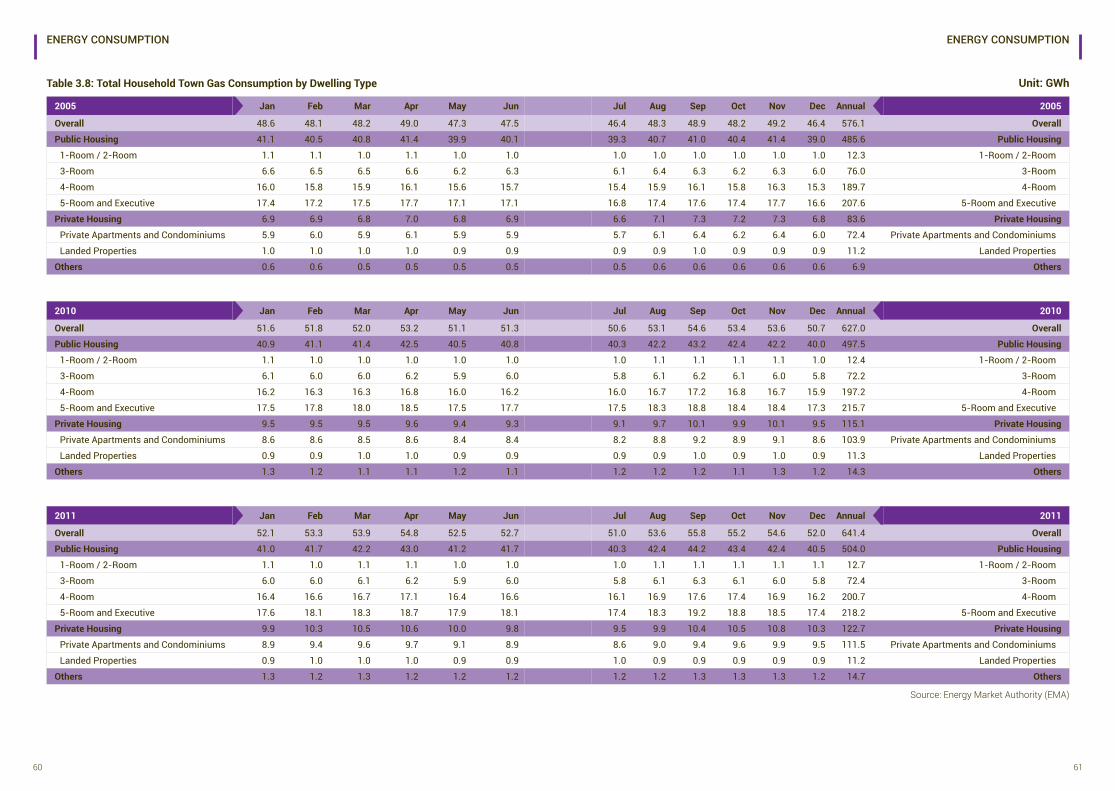
Table 3.8: Total Household Town Gas Consumption by Dwelling Type Unit: GWh
2005 Jan Feb Mar Apr May Jun
Overall 48.6 48.1 48.2 49.0 47.3 47.5
Public Housing 41.1 40.5 40.8 41.4 39.9 40.1
1-Room / 2-Room 1.1 1.1 1.0 1.1 1.0 1.0
3-Room 6.6 6.5 6.5 6.6 6.2 6.3
4-Room 16.0 15.8 15.9 16.1 15.6 15.7
5-Room and Executive 17.4 17.2 17.5 17.7 17.1 17.1
Private Housing 6.9 6.9 6.8 7.0 6.8 6.9
Private Apartments and Condominiums 5.9 6.0 5.9 6.1 5.9 5.9
Landed Properties 1.0 1.0 1.0 1.0 0.9 0.9
Others 0.6 0.6 0.5 0.5 0.5 0.5
Jul Aug Sep Oct Nov Dec Annual 2005
46.4 48.3 48.9 48.2 49.2 46.4 576.1 Overall
39.3 40.7 41.0 40.4 41.4 39.0 485.6 Public Housing
1.0 1.0 1.0 1.0 1.0 1.0 12.3 1-Room / 2-Room
6.1 6.4 6.3 6.2 6.3 6.0 76.0 3-Room
15.4 15.9 16.1 15.8 16.3 15.3 189.7 4-Room
16.8 17.4 17.6 17.4 17.7 16.6 207.6 5-Room and Executive
6.6 7.1 7.3 7.2 7.3 6.8 83.6 Private Housing
5.7 6.1 6.4 6.2 6.4 6.0 72.4 Private Apartments and Condominiums
0.9 0.9 1.0 0.9 0.9 0.9 11.2 Landed Properties
0.5 0.6 0.6 0.6 0.6 0.6 6.9 Others
2010 Jan Feb Mar Apr May Jun
Overall 51.6 51.8 52.0 53.2 51.1 51.3
Public Housing 40.9 41.1 41.4 42.5 40.5 40.8
1-Room / 2-Room 1.1 1.0 1.0 1.0 1.0 1.0
3-Room 6.1 6.0 6.0 6.2 5.9 6.0
4-Room 16.2 16.3 16.3 16.8 16.0 16.2
5-Room and Executive 17.5 17.8 18.0 18.5 17.5 17.7
Private Housing 9.5 9.5 9.5 9.6 9.4 9.3
Private Apartments and Condominiums 8.6 8.6 8.5 8.6 8.4 8.4
Landed Properties 0.9 0.9 1.0 1.0 0.9 0.9
Others 1.3 1.2 1.1 1.1 1.2 1.1
Jul Aug Sep Oct Nov Dec Annual 2010
50.6 53.1 54.6 53.4 53.6 50.7 627.0 Overall
40.3 42.2 43.2 42.4 42.2 40.0 497.5 Public Housing
1.0 1.1 1.1 1.1 1.1 1.0 12.4 1-Room / 2-Room
5.8 6.1 6.2 6.1 6.0 5.8 72.2 3-Room
16.0 16.7 17.2 16.8 16.7 15.9 197.2 4-Room
17.5 18.3 18.8 18.4 18.4 17.3 215.7 5-Room and Executive
9.1 9.7 10.1 9.9 10.1 9.5 115.1 Private Housing
8.2 8.8 9.2 8.9 9.1 8.6 103.9 Private Apartments and Condominiums
0.9 0.9 1.0 0.9 1.0 0.9 11.3 Landed Properties
1.2 1.2 1.2 1.1 1.3 1.2 14.3 Others
2011 Jan Feb Mar Apr May Jun
Overall 52.1 53.3 53.9 54.8 52.5 52.7
Public Housing 41.0 41.7 42.2 43.0 41.2 41.7
1-Room / 2-Room 1.1 1.0 1.1 1.1 1.0 1.0
3-Room 6.0 6.0 6.1 6.2 5.9 6.0
4-Room 16.4 16.6 16.7 17.1 16.4 16.6
5-Room and Executive 17.6 18.1 18.3 18.7 17.9 18.1
Private Housing 9.9 10.3 10.5 10.6 10.0 9.8
Private Apartments and Condominiums 8.9 9.4 9.6 9.7 9.1 8.9
Landed Properties 0.9 1.0 1.0 1.0 0.9 0.9
Others 1.3 1.2 1.3 1.2 1.2 1.2
Jul Aug Sep Oct Nov Dec Annual 2011
51.0 53.6 55.8 55.2 54.6 52.0 641.4 Overall
40.3 42.4 44.2 43.4 42.4 40.5 504.0 Public Housing
1.0 1.1 1.1 1.1 1.1 1.1 12.7 1-Room / 2-Room
5.8 6.1 6.3 6.1 6.0 5.8 72.4 3-Room
16.1 16.9 17.6 17.4 16.9 16.2 200.7 4-Room
17.4 18.3 19.2 18.8 18.5 17.4 218.2 5-Room and Executive
9.5 9.9 10.4 10.5 10.8 10.3 122.7 Private Housing
8.6 9.0 9.4 9.6 9.9 9.5 111.5 Private Apartments and Condominiums
1.0 0.9 0.9 0.9 0.9 0.9 11.2 Landed Properties
1.2 1.2 1.3 1.3 1.3 1.2 14.7 Others
Source: Energy Market Authority (EMA)
ENERGY CONSUMPTION ENERGY CONSUMPTION
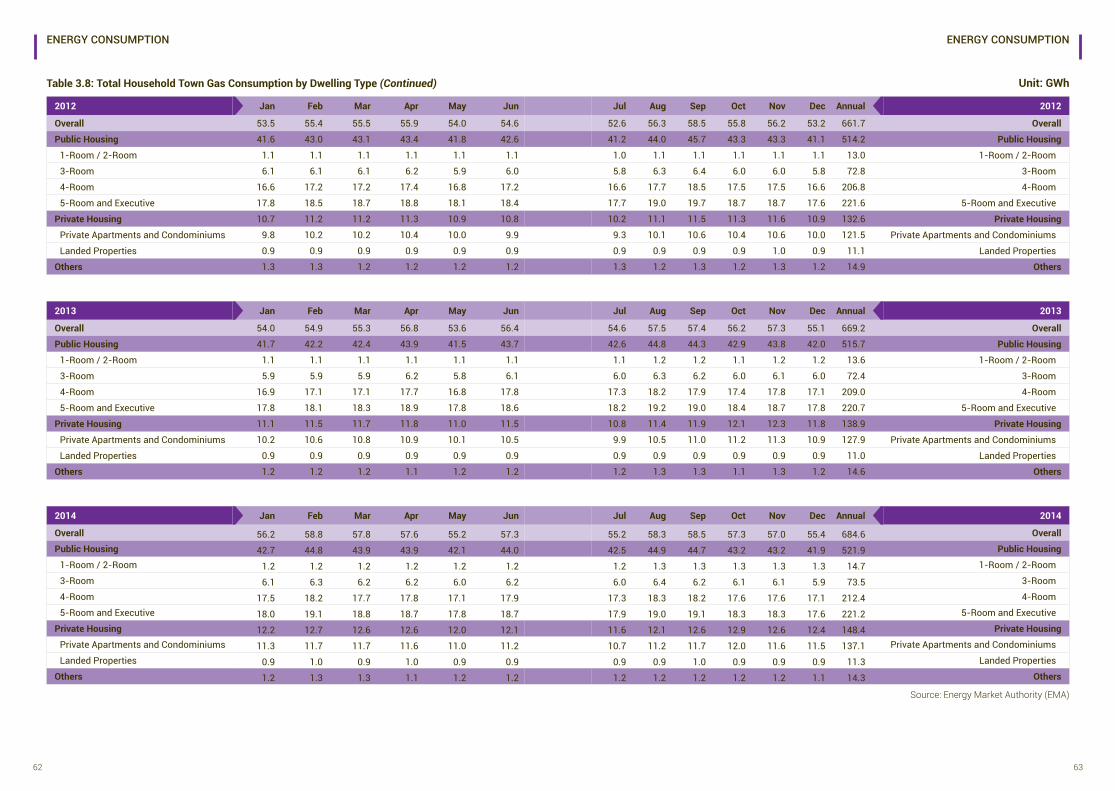
62 63
Table 3.8: Total Household Town Gas Consumption by Dwelling Type (Continued) Unit: GWh
2012 Jan Feb Mar Apr May Jun
Overall 53.5 55.4 55.5 55.9 54.0 54.6
Public Housing 41.6 43.0 43.1 43.4 41.8 42.6
1-Room / 2-Room 1.1 1.1 1.1 1.1 1.1 1.1
3-Room 6.1 6.1 6.1 6.2 5.9 6.0
4-Room 16.6 17.2 17.2 17.4 16.8 17.2
5-Room and Executive 17.8 18.5 18.7 18.8 18.1 18.4
Private Housing 10.7 11.2 11.2 11.3 10.9 10.8
Private Apartments and Condominiums 9.8 10.2 10.2 10.4 10.0 9.9
Landed Properties 0.9 0.9 0.9 0.9 0.9 0.9
Others 1.3 1.3 1.2 1.2 1.2 1.2
Jul Aug Sep Oct Nov Dec Annual 2012
52.6 56.3 58.5 55.8 56.2 53.2 661.7 Overall
41.2 44.0 45.7 43.3 43.3 41.1 514.2 Public Housing
1.0 1.1 1.1 1.1 1.1 1.1 13.0 1-Room / 2-Room
5.8 6.3 6.4 6.0 6.0 5.8 72.8 3-Room
16.6 17.7 18.5 17.5 17.5 16.6 206.8 4-Room
17.7 19.0 19.7 18.7 18.7 17.6 221.6 5-Room and Executive
10.2 11.1 11.5 11.3 11.6 10.9 132.6 Private Housing
9.3 10.1 10.6 10.4 10.6 10.0 121.5 Private Apartments and Condominiums
0.9 0.9 0.9 0.9 1.0 0.9 11.1 Landed Properties
1.3 1.2 1.3 1.2 1.3 1.2 14.9 Others
2013 Jan Feb Mar Apr May Jun
Overall 54.0 54.9 55.3 56.8 53.6 56.4
Public Housing 41.7 42.2 42.4 43.9 41.5 43.7
1-Room / 2-Room 1.1 1.1 1.1 1.1 1.1 1.1
3-Room 5.9 5.9 5.9 6.2 5.8 6.1
4-Room 16.9 17.1 17.1 17.7 16.8 17.8
5-Room and Executive 17.8 18.1 18.3 18.9 17.8 18.6
Private Housing 11.1 11.5 11.7 11.8 11.0 11.5
Private Apartments and Condominiums 10.2 10.6 10.8 10.9 10.1 10.5
Landed Properties 0.9 0.9 0.9 0.9 0.9 0.9
Others 1.2 1.2 1.2 1.1 1.2 1.2
Jul Aug Sep Oct Nov Dec Annual 2013
54.6 57.5 57.4 56.2 57.3 55.1 669.2 Overall
42.6 44.8 44.3 42.9 43.8 42.0 515.7 Public Housing
1.1 1.2 1.2 1.1 1.2 1.2 13.6 1-Room / 2-Room
6.0 6.3 6.2 6.0 6.1 6.0 72.4 3-Room
17.3 18.2 17.9 17.4 17.8 17.1 209.0 4-Room
18.2 19.2 19.0 18.4 18.7 17.8 220.7 5-Room and Executive
10.8 11.4 11.9 12.1 12.3 11.8 138.9 Private Housing
9.9 10.5 11.0 11.2 11.3 10.9 127.9 Private Apartments and Condominiums
0.9 0.9 0.9 0.9 0.9 0.9 11.0 Landed Properties
1.2 1.3 1.3 1.1 1.3 1.2 14.6 Others
2014 Jan Feb Mar Apr May Jun
Overall 56.2 58.8 57.8 57.6 55.2 57.3Public Housing 42.7 44.8 43.9 43.9 42.1 44.0
1-Room / 2-Room 1.2 1.2 1.2 1.2 1.2 1.23-Room 6.1 6.3 6.2 6.2 6.0 6.24-Room 17.5 18.2 17.7 17.8 17.1 17.95-Room and Executive 18.0 19.1 18.8 18.7 17.8 18.7
Private Housing 12.2 12.7 12.6 12.6 12.0 12.1Private Apartments and Condominiums 11.3 11.7 11.7 11.6 11.0 11.2Landed Properties 0.9 1.0 0.9 1.0 0.9 0.9
Others 1.2 1.3 1.3 1.1 1.2 1.2
Jul Aug Sep Oct Nov Dec Annual 2014
55.2 58.3 58.5 57.3 57.0 55.4 684.6 Overall
42.5 44.9 44.7 43.2 43.2 41.9 521.9 Public Housing
1.2 1.3 1.3 1.3 1.3 1.3 14.7 1-Room / 2-Room
6.0 6.4 6.2 6.1 6.1 5.9 73.5 3-Room
17.3 18.3 18.2 17.6 17.6 17.1 212.4 4-Room
17.9 19.0 19.1 18.3 18.3 17.6 221.2 5-Room and Executive
11.6 12.1 12.6 12.9 12.6 12.4 148.4 Private Housing
10.7 11.2 11.7 12.0 11.6 11.5 137.1 Private Apartments and Condominiums
0.9 0.9 1.0 0.9 0.9 0.9 11.3 Landed Properties
1.2 1.2 1.2 1.2 1.2 1.1 14.3 Others
Source: Energy Market Authority (EMA)
ENERGY CONSUMPTION ENERGY CONSUMPTION
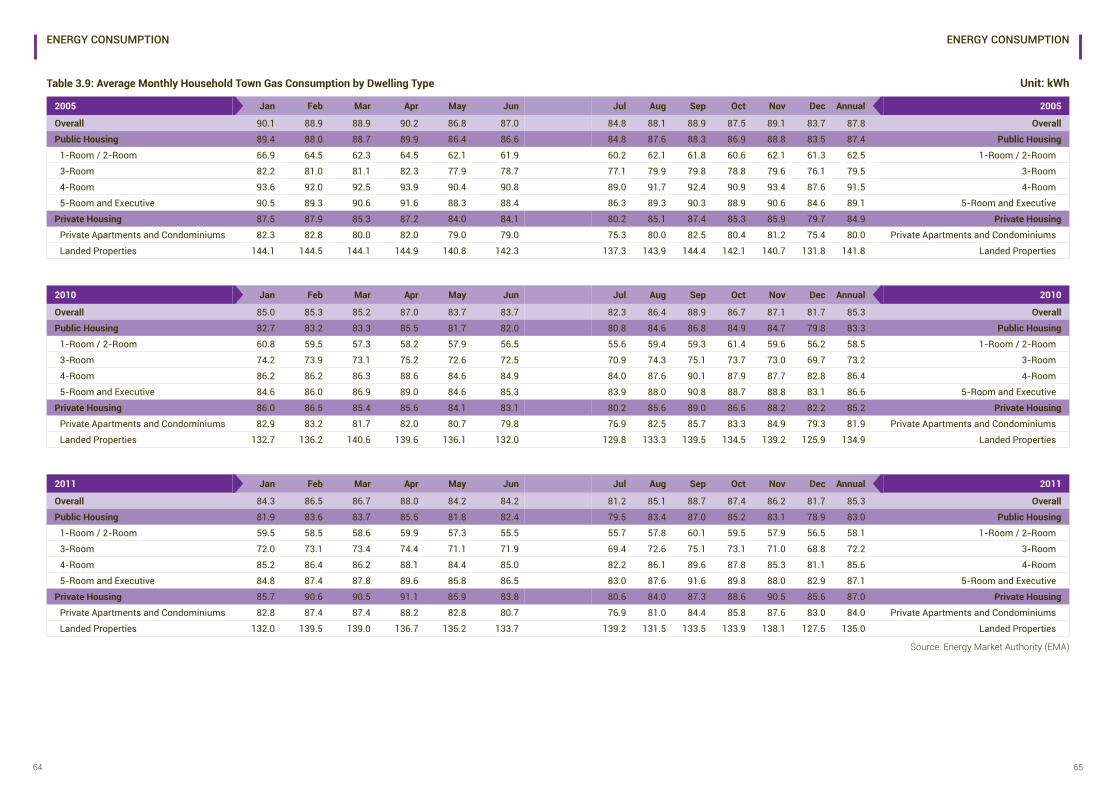
64 65
Table 3.9: Average Monthly Household Town Gas Consumption by Dwelling Type Unit: kWh
2005 Jan Feb Mar Apr May Jun
Overall 90.1 88.9 88.9 90.2 86.8 87.0
Public Housing 89.4 88.0 88.7 89.9 86.4 86.6
1-Room / 2-Room 66.9 64.5 62.3 64.5 62.1 61.9
3-Room 82.2 81.0 81.1 82.3 77.9 78.7
4-Room 93.6 92.0 92.5 93.9 90.4 90.8
5-Room and Executive 90.5 89.3 90.6 91.6 88.3 88.4
Private Housing 87.5 87.9 85.3 87.2 84.0 84.1
Private Apartments and Condominiums 82.3 82.8 80.0 82.0 79.0 79.0
Landed Properties 144.1 144.5 144.1 144.9 140.8 142.3
Jul Aug Sep Oct Nov Dec Annual 2005
84.8 88.1 88.9 87.5 89.1 83.7 87.8 Overall
84.8 87.6 88.3 86.9 88.8 83.5 87.4 Public Housing
60.2 62.1 61.8 60.6 62.1 61.3 62.5 1-Room / 2-Room
77.1 79.9 79.8 78.8 79.6 76.1 79.5 3-Room
89.0 91.7 92.4 90.9 93.4 87.6 91.5 4-Room
86.3 89.3 90.3 88.9 90.6 84.6 89.1 5-Room and Executive
80.2 85.1 87.4 85.3 85.9 79.7 84.9 Private Housing
75.3 80.0 82.5 80.4 81.2 75.4 80.0 Private Apartments and Condominiums
137.3 143.9 144.4 142.1 140.7 131.8 141.8 Landed Properties
2010 Jan Feb Mar Apr May Jun
Overall 85.0 85.3 85.2 87.0 83.7 83.7
Public Housing 82.7 83.2 83.3 85.5 81.7 82.0
1-Room / 2-Room 60.8 59.5 57.3 58.2 57.9 56.5
3-Room 74.2 73.9 73.1 75.2 72.6 72.5
4-Room 86.2 86.2 86.3 88.6 84.6 84.9
5-Room and Executive 84.6 86.0 86.9 89.0 84.6 85.3
Private Housing 86.0 86.5 85.4 85.6 84.1 83.1
Private Apartments and Condominiums 82.9 83.2 81.7 82.0 80.7 79.8
Landed Properties 132.7 136.2 140.6 139.6 136.1 132.0
Jul Aug Sep Oct Nov Dec Annual 2010
82.3 86.4 88.9 86.7 87.1 81.7 85.3 Overall
80.8 84.6 86.8 84.9 84.7 79.8 83.3 Public Housing
55.6 59.4 59.3 61.4 59.6 56.2 58.5 1-Room / 2-Room
70.9 74.3 75.1 73.7 73.0 69.7 73.2 3-Room
84.0 87.6 90.1 87.9 87.7 82.8 86.4 4-Room
83.9 88.0 90.8 88.7 88.8 83.1 86.6 5-Room and Executive
80.2 85.6 89.0 86.5 88.2 82.2 85.2 Private Housing
76.9 82.5 85.7 83.3 84.9 79.3 81.9 Private Apartments and Condominiums
129.8 133.3 139.5 134.5 139.2 125.9 134.9 Landed Properties
2011 Jan Feb Mar Apr May Jun
Overall 84.3 86.5 86.7 88.0 84.2 84.2
Public Housing 81.9 83.6 83.7 85.5 81.8 82.4
1-Room / 2-Room 59.5 58.5 58.6 59.9 57.3 55.5
3-Room 72.0 73.1 73.4 74.4 71.1 71.9
4-Room 85.2 86.4 86.2 88.1 84.4 85.0
5-Room and Executive 84.8 87.4 87.8 89.6 85.8 86.5
Private Housing 85.7 90.6 90.5 91.1 85.9 83.8
Private Apartments and Condominiums 82.8 87.4 87.4 88.2 82.8 80.7
Landed Properties 132.0 139.5 139.0 136.7 135.2 133.7
Jul Aug Sep Oct Nov Dec Annual 2011
81.2 85.1 88.7 87.4 86.2 81.7 85.3 Overall
79.5 83.4 87.0 85.2 83.1 78.9 83.0 Public Housing
55.7 57.8 60.1 59.5 57.9 56.5 58.1 1-Room / 2-Room
69.4 72.6 75.1 73.1 71.0 68.8 72.2 3-Room
82.2 86.1 89.6 87.8 85.3 81.1 85.6 4-Room
83.0 87.6 91.6 89.8 88.0 82.9 87.1 5-Room and Executive
80.6 84.0 87.3 88.6 90.5 85.6 87.0 Private Housing
76.9 81.0 84.4 85.8 87.6 83.0 84.0 Private Apartments and Condominiums
139.2 131.5 133.5 133.9 138.1 127.5 135.0 Landed Properties
Source: Energy Market Authority (EMA)
ENERGY CONSUMPTION ENERGY CONSUMPTION
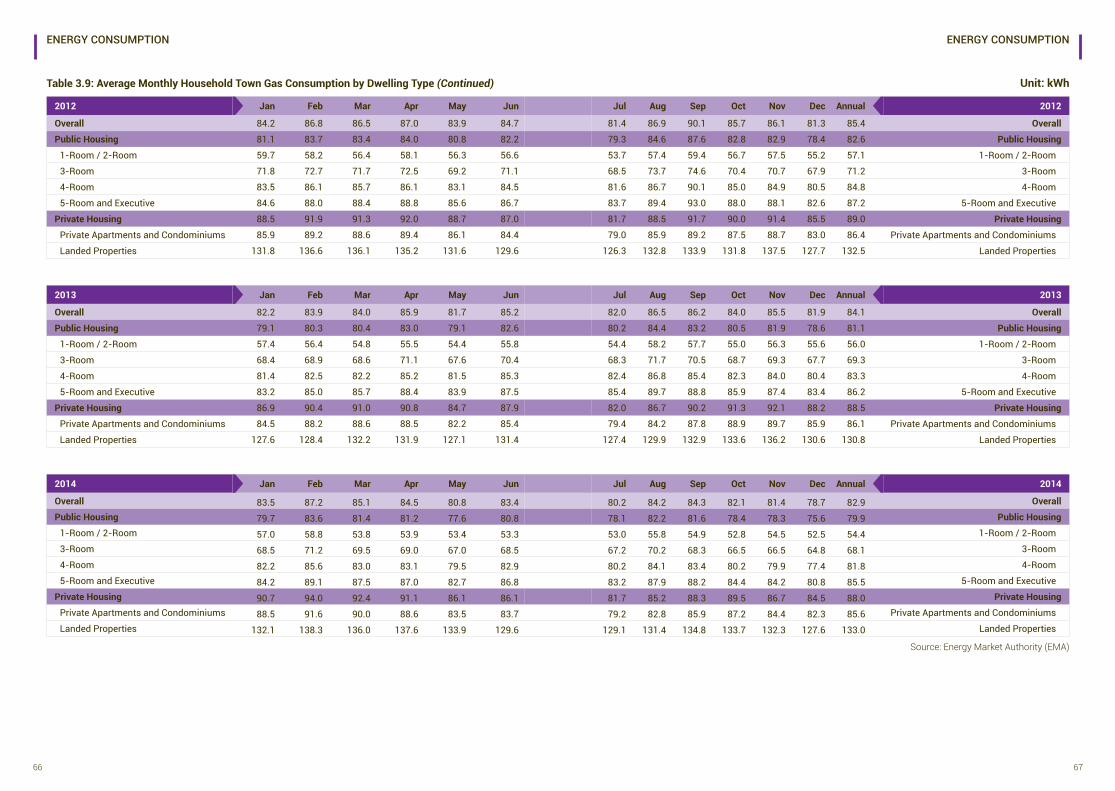
66 67
Table 3.9: Average Monthly Household Town Gas Consumption by Dwelling Type (Continued) Unit: kWh
2012 Jan Feb Mar Apr May Jun
Overall 84.2 86.8 86.5 87.0 83.9 84.7
Public Housing 81.1 83.7 83.4 84.0 80.8 82.2
1-Room / 2-Room 59.7 58.2 56.4 58.1 56.3 56.6
3-Room 71.8 72.7 71.7 72.5 69.2 71.1
4-Room 83.5 86.1 85.7 86.1 83.1 84.5
5-Room and Executive 84.6 88.0 88.4 88.8 85.6 86.7
Private Housing 88.5 91.9 91.3 92.0 88.7 87.0
Private Apartments and Condominiums 85.9 89.2 88.6 89.4 86.1 84.4
Landed Properties 131.8 136.6 136.1 135.2 131.6 129.6
Jul Aug Sep Oct Nov Dec Annual 2012
81.4 86.9 90.1 85.7 86.1 81.3 85.4 Overall
79.3 84.6 87.6 82.8 82.9 78.4 82.6 Public Housing
53.7 57.4 59.4 56.7 57.5 55.2 57.1 1-Room / 2-Room
68.5 73.7 74.6 70.4 70.7 67.9 71.2 3-Room
81.6 86.7 90.1 85.0 84.9 80.5 84.8 4-Room
83.7 89.4 93.0 88.0 88.1 82.6 87.2 5-Room and Executive
81.7 88.5 91.7 90.0 91.4 85.5 89.0 Private Housing
79.0 85.9 89.2 87.5 88.7 83.0 86.4 Private Apartments and Condominiums
126.3 132.8 133.9 131.8 137.5 127.7 132.5 Landed Properties
2013 Jan Feb Mar Apr May Jun
Overall 82.2 83.9 84.0 85.9 81.7 85.2
Public Housing 79.1 80.3 80.4 83.0 79.1 82.6
1-Room / 2-Room 57.4 56.4 54.8 55.5 54.4 55.8
3-Room 68.4 68.9 68.6 71.1 67.6 70.4
4-Room 81.4 82.5 82.2 85.2 81.5 85.3
5-Room and Executive 83.2 85.0 85.7 88.4 83.9 87.5
Private Housing 86.9 90.4 91.0 90.8 84.7 87.9
Private Apartments and Condominiums 84.5 88.2 88.6 88.5 82.2 85.4
Landed Properties 127.6 128.4 132.2 131.9 127.1 131.4
Jul Aug Sep Oct Nov Dec Annual 2013
82.0 86.5 86.2 84.0 85.5 81.9 84.1 Overall
80.2 84.4 83.2 80.5 81.9 78.6 81.1 Public Housing
54.4 58.2 57.7 55.0 56.3 55.6 56.0 1-Room / 2-Room
68.3 71.7 70.5 68.7 69.3 67.7 69.3 3-Room
82.4 86.8 85.4 82.3 84.0 80.4 83.3 4-Room
85.4 89.7 88.8 85.9 87.4 83.4 86.2 5-Room and Executive
82.0 86.7 90.2 91.3 92.1 88.2 88.5 Private Housing
79.4 84.2 87.8 88.9 89.7 85.9 86.1 Private Apartments and Condominiums
127.4 129.9 132.9 133.6 136.2 130.6 130.8 Landed Properties
2014 Jan Feb Mar Apr May Jun
Overall 83.5 87.2 85.1 84.5 80.8 83.4Public Housing 79.7 83.6 81.4 81.2 77.6 80.8
1-Room / 2-Room 57.0 58.8 53.8 53.9 53.4 53.33-Room 68.5 71.2 69.5 69.0 67.0 68.54-Room 82.2 85.6 83.0 83.1 79.5 82.95-Room and Executive 84.2 89.1 87.5 87.0 82.7 86.8
Private Housing 90.7 94.0 92.4 91.1 86.1 86.1Private Apartments and Condominiums 88.5 91.6 90.0 88.6 83.5 83.7Landed Properties 132.1 138.3 136.0 137.6 133.9 129.6
Jul Aug Sep Oct Nov Dec Annual 2014
80.2 84.2 84.3 82.1 81.4 78.7 82.9 Overall
78.1 82.2 81.6 78.4 78.3 75.6 79.9 Public Housing
53.0 55.8 54.9 52.8 54.5 52.5 54.4 1-Room / 2-Room
67.2 70.2 68.3 66.5 66.5 64.8 68.1 3-Room
80.2 84.1 83.4 80.2 79.9 77.4 81.8 4-Room
83.2 87.9 88.2 84.4 84.2 80.8 85.5 5-Room and Executive
81.7 85.2 88.3 89.5 86.7 84.5 88.0 Private Housing
79.2 82.8 85.9 87.2 84.4 82.3 85.6 Private Apartments and Condominiums
129.1 131.4 134.8 133.7 132.3 127.6 133.0 Landed Properties
Source: Energy Market Authority (EMA)
ENERGY CONSUMPTION ENERGY CONSUMPTION
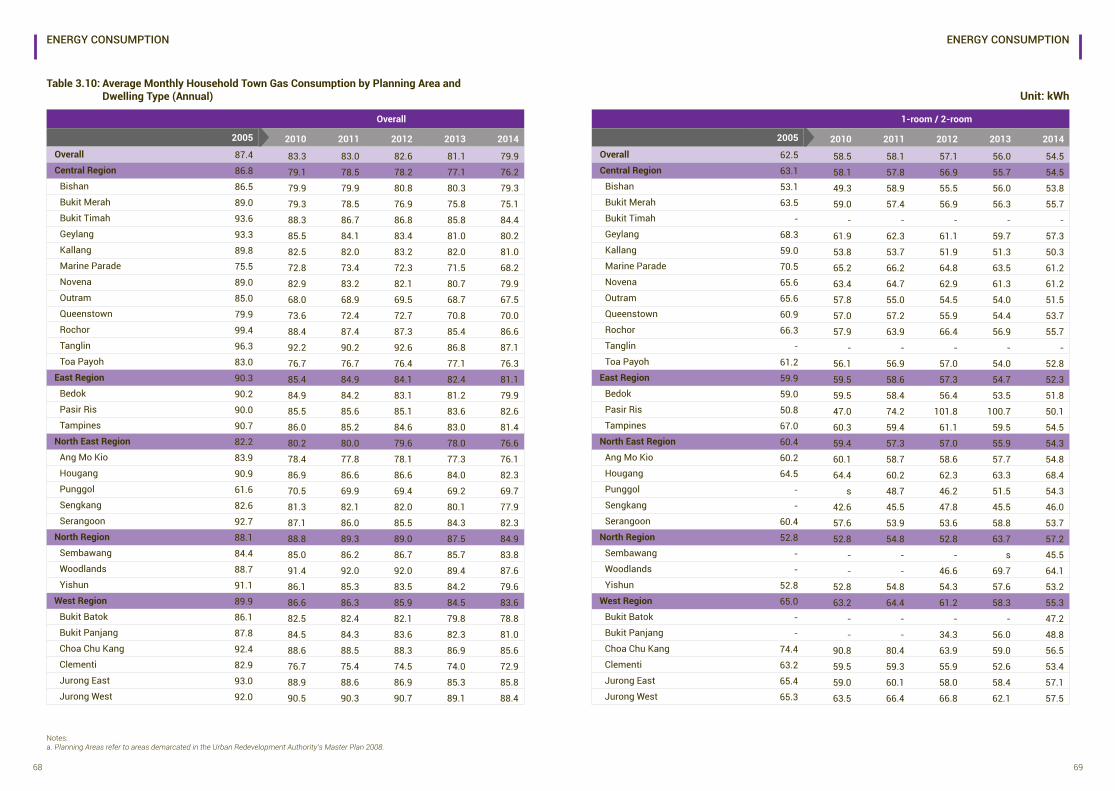
68 69
Notes:a. Planning Areas refer to areas demarcated in the Urban Redevelopment Authority’s Master Plan 2008.
Table 3.10: Average Monthly Household Town Gas Consumption by Planning Area and Dwelling Type (Annual)
Overall
2005 2010 2011 2012 2013 2014Overall 87.4 83.3 83.0 82.6 81.1 79.9Central Region 86.8 79.1 78.5 78.2 77.1 76.2
Bishan 86.5 79.9 79.9 80.8 80.3 79.3Bukit Merah 89.0 79.3 78.5 76.9 75.8 75.1Bukit Timah 93.6 88.3 86.7 86.8 85.8 84.4Geylang 93.3 85.5 84.1 83.4 81.0 80.2Kallang 89.8 82.5 82.0 83.2 82.0 81.0Marine Parade 75.5 72.8 73.4 72.3 71.5 68.2Novena 89.0 82.9 83.2 82.1 80.7 79.9Outram 85.0 68.0 68.9 69.5 68.7 67.5Queenstown 79.9 73.6 72.4 72.7 70.8 70.0Rochor 99.4 88.4 87.4 87.3 85.4 86.6Tanglin 96.3 92.2 90.2 92.6 86.8 87.1Toa Payoh 83.0 76.7 76.7 76.4 77.1 76.3
East Region 90.3 85.4 84.9 84.1 82.4 81.1Bedok 90.2 84.9 84.2 83.1 81.2 79.9Pasir Ris 90.0 85.5 85.6 85.1 83.6 82.6Tampines 90.7 86.0 85.2 84.6 83.0 81.4
North East Region 82.2 80.2 80.0 79.6 78.0 76.6Ang Mo Kio 83.9 78.4 77.8 78.1 77.3 76.1Hougang 90.9 86.9 86.6 86.6 84.0 82.3Punggol 61.6 70.5 69.9 69.4 69.2 69.7Sengkang 82.6 81.3 82.1 82.0 80.1 77.9Serangoon 92.7 87.1 86.0 85.5 84.3 82.3
North Region 88.1 88.8 89.3 89.0 87.5 84.9Sembawang 84.4 85.0 86.2 86.7 85.7 83.8Woodlands 88.7 91.4 92.0 92.0 89.4 87.6Yishun 91.1 86.1 85.3 83.5 84.2 79.6
West Region 89.9 86.6 86.3 85.9 84.5 83.6Bukit Batok 86.1 82.5 82.4 82.1 79.8 78.8Bukit Panjang 87.8 84.5 84.3 83.6 82.3 81.0Choa Chu Kang 92.4 88.6 88.5 88.3 86.9 85.6Clementi 82.9 76.7 75.4 74.5 74.0 72.9Jurong East 93.0 88.9 88.6 86.9 85.3 85.8Jurong West 92.0 90.5 90.3 90.7 89.1 88.4
1-room / 2-room
2005 2010 2011 2012 2013 2014Overall 62.5 58.5 58.1 57.1 56.0 54.5Central Region 63.1 58.1 57.8 56.9 55.7 54.5
Bishan 53.1 49.3 58.9 55.5 56.0 53.8Bukit Merah 63.5 59.0 57.4 56.9 56.3 55.7Bukit Timah - - - - - -Geylang 68.3 61.9 62.3 61.1 59.7 57.3Kallang 59.0 53.8 53.7 51.9 51.3 50.3Marine Parade 70.5 65.2 66.2 64.8 63.5 61.2Novena 65.6 63.4 64.7 62.9 61.3 61.2Outram 65.6 57.8 55.0 54.5 54.0 51.5Queenstown 60.9 57.0 57.2 55.9 54.4 53.7Rochor 66.3 57.9 63.9 66.4 56.9 55.7Tanglin - - - - - -Toa Payoh 61.2 56.1 56.9 57.0 54.0 52.8
East Region 59.9 59.5 58.6 57.3 54.7 52.3Bedok 59.0 59.5 58.4 56.4 53.5 51.8Pasir Ris 50.8 47.0 74.2 101.8 100.7 50.1Tampines 67.0 60.3 59.4 61.1 59.5 54.5
North East Region 60.4 59.4 57.3 57.0 55.9 54.3Ang Mo Kio 60.2 60.1 58.7 58.6 57.7 54.8Hougang 64.5 64.4 60.2 62.3 63.3 68.4Punggol - s 48.7 46.2 51.5 54.3Sengkang - 42.6 45.5 47.8 45.5 46.0Serangoon 60.4 57.6 53.9 53.6 58.8 53.7
North Region 52.8 52.8 54.8 52.8 63.7 57.2Sembawang - - - - s 45.5Woodlands - - - 46.6 69.7 64.1Yishun 52.8 52.8 54.8 54.3 57.6 53.2
West Region 65.0 63.2 64.4 61.2 58.3 55.3Bukit Batok - - - - - 47.2Bukit Panjang - - - 34.3 56.0 48.8Choa Chu Kang 74.4 90.8 80.4 63.9 59.0 56.5Clementi 63.2 59.5 59.3 55.9 52.6 53.4Jurong East 65.4 59.0 60.1 58.0 58.4 57.1Jurong West 65.3 63.5 66.4 66.8 62.1 57.5
Unit: kWh
ENERGY CONSUMPTION ENERGY CONSUMPTION
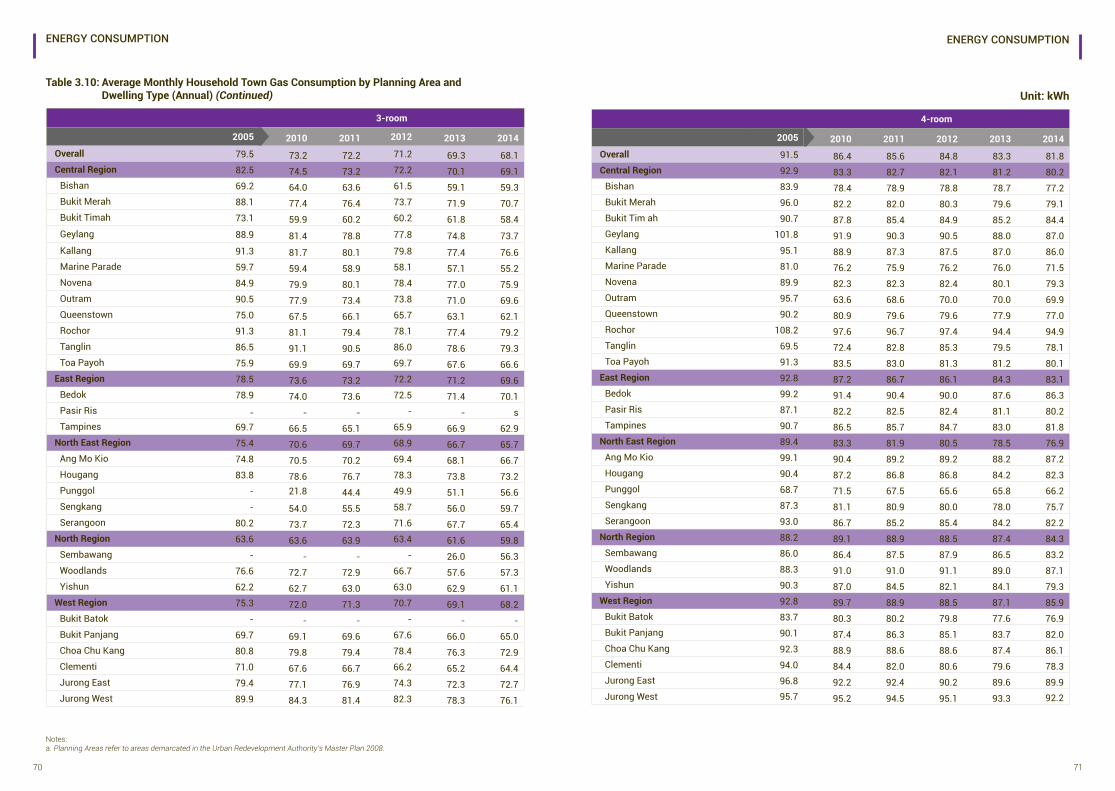
70 71
Table 3.10: Average Monthly Household Town Gas Consumption by Planning Area and Dwelling Type (Annual) (Continued)
3-room
2005 2010 2011 2012 2013 2014Overall 79.5 73.2 72.2 71.2 69.3 68.1Central Region 82.5 74.5 73.2 72.2 70.1 69.1
Bishan 69.2 64.0 63.6 61.5 59.1 59.3Bukit Merah 88.1 77.4 76.4 73.7 71.9 70.7Bukit Timah 73.1 59.9 60.2 60.2 61.8 58.4Geylang 88.9 81.4 78.8 77.8 74.8 73.7Kallang 91.3 81.7 80.1 79.8 77.4 76.6Marine Parade 59.7 59.4 58.9 58.1 57.1 55.2Novena 84.9 79.9 80.1 78.4 77.0 75.9Outram 90.5 77.9 73.4 73.8 71.0 69.6Queenstown 75.0 67.5 66.1 65.7 63.1 62.1Rochor 91.3 81.1 79.4 78.1 77.4 79.2Tanglin 86.5 91.1 90.5 86.0 78.6 79.3Toa Payoh 75.9 69.9 69.7 69.7 67.6 66.6
East Region 78.5 73.6 73.2 72.2 71.2 69.6Bedok 78.9 74.0 73.6 72.5 71.4 70.1Pasir Ris - - - - - sTampines 69.7 66.5 65.1 65.9 66.9 62.9
North East Region 75.4 70.6 69.7 68.9 66.7 65.7Ang Mo Kio 74.8 70.5 70.2 69.4 68.1 66.7Hougang 83.8 78.6 76.7 78.3 73.8 73.2Punggol - 21.8 44.4 49.9 51.1 56.6Sengkang - 54.0 55.5 58.7 56.0 59.7Serangoon 80.2 73.7 72.3 71.6 67.7 65.4
North Region 63.6 63.6 63.9 63.4 61.6 59.8Sembawang - - - - 26.0 56.3Woodlands 76.6 72.7 72.9 66.7 57.6 57.3Yishun 62.2 62.7 63.0 63.0 62.9 61.1
West Region 75.3 72.0 71.3 70.7 69.1 68.2Bukit Batok - - - - - -Bukit Panjang 69.7 69.1 69.6 67.6 66.0 65.0Choa Chu Kang 80.8 79.8 79.4 78.4 76.3 72.9Clementi 71.0 67.6 66.7 66.2 65.2 64.4Jurong East 79.4 77.1 76.9 74.3 72.3 72.7Jurong West 89.9 84.3 81.4 82.3 78.3 76.1
4-room
2005 2010 2011 2012 2013 2014Overall 91.5 86.4 85.6 84.8 83.3 81.8Central Region 92.9 83.3 82.7 82.1 81.2 80.2
Bishan 83.9 78.4 78.9 78.8 78.7 77.2Bukit Merah 96.0 82.2 82.0 80.3 79.6 79.1Bukit Tim ah 90.7 87.8 85.4 84.9 85.2 84.4Geylang 101.8 91.9 90.3 90.5 88.0 87.0Kallang 95.1 88.9 87.3 87.5 87.0 86.0Marine Parade 81.0 76.2 75.9 76.2 76.0 71.5Novena 89.9 82.3 82.3 82.4 80.1 79.3Outram 95.7 63.6 68.6 70.0 70.0 69.9Queenstown 90.2 80.9 79.6 79.6 77.9 77.0Rochor 108.2 97.6 96.7 97.4 94.4 94.9Tanglin 69.5 72.4 82.8 85.3 79.5 78.1Toa Payoh 91.3 83.5 83.0 81.3 81.2 80.1
East Region 92.8 87.2 86.7 86.1 84.3 83.1Bedok 99.2 91.4 90.4 90.0 87.6 86.3Pasir Ris 87.1 82.2 82.5 82.4 81.1 80.2Tampines 90.7 86.5 85.7 84.7 83.0 81.8
North East Region 89.4 83.3 81.9 80.5 78.5 76.9Ang Mo Kio 99.1 90.4 89.2 89.2 88.2 87.2Hougang 90.4 87.2 86.8 86.8 84.2 82.3Punggol 68.7 71.5 67.5 65.6 65.8 66.2Sengkang 87.3 81.1 80.9 80.0 78.0 75.7Serangoon 93.0 86.7 85.2 85.4 84.2 82.2
North Region 88.2 89.1 88.9 88.5 87.4 84.3Sembawang 86.0 86.4 87.5 87.9 86.5 83.2Woodlands 88.3 91.0 91.0 91.1 89.0 87.1Yishun 90.3 87.0 84.5 82.1 84.1 79.3
West Region 92.8 89.7 88.9 88.5 87.1 85.9Bukit Batok 83.7 80.3 80.2 79.8 77.6 76.9Bukit Panjang 90.1 87.4 86.3 85.1 83.7 82.0Choa Chu Kang 92.3 88.9 88.6 88.6 87.4 86.1Clementi 94.0 84.4 82.0 80.6 79.6 78.3Jurong East 96.8 92.2 92.4 90.2 89.6 89.9Jurong West 95.7 95.2 94.5 95.1 93.3 92.2
Unit: kWh
ENERGY CONSUMPTION ENERGY CONSUMPTION
Notes:a. Planning Areas refer to areas demarcated in the Urban Redevelopment Authority’s Master Plan 2008.
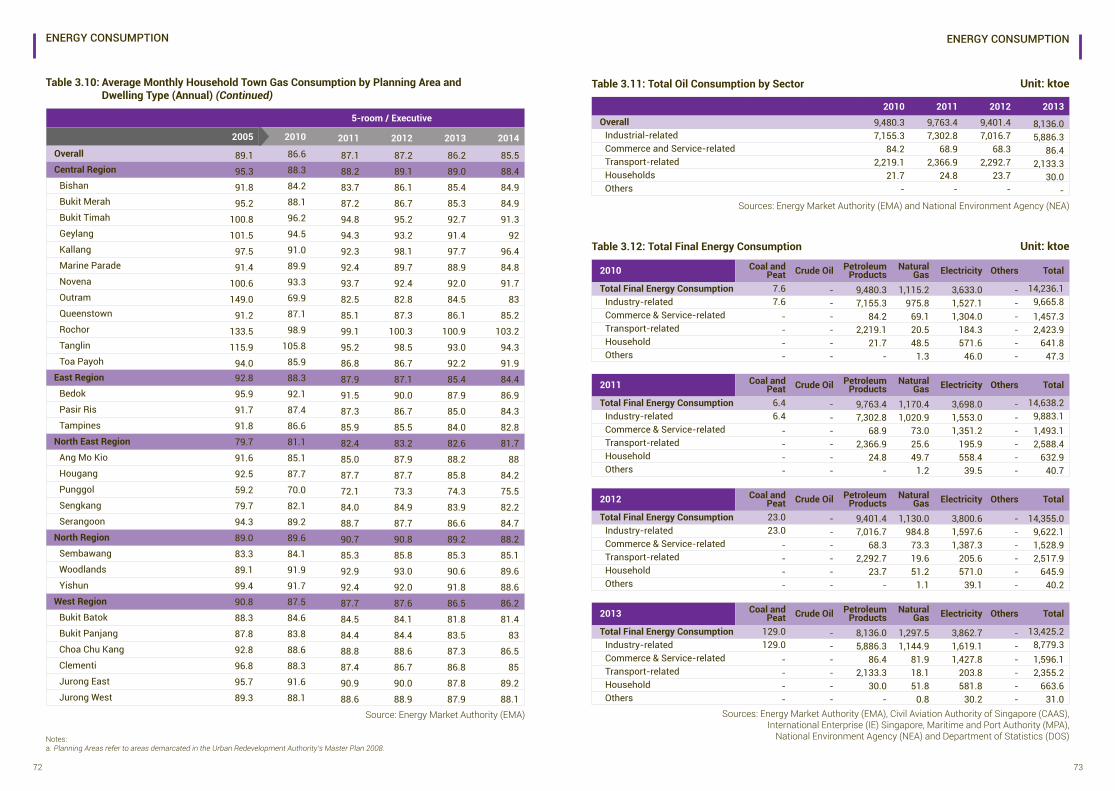
72 73
Table 3.10: Average Monthly Household Town Gas Consumption by Planning Area and Dwelling Type (Annual) (Continued)
5-room / Executive
2005 2010 2011 2012 2013 2014Overall 89.1 86.6 87.1 87.2 86.2 85.5Central Region 95.3 88.3 88.2 89.1 89.0 88.4
Bishan 91.8 84.2 83.7 86.1 85.4 84.9Bukit Merah 95.2 88.1 87.2 86.7 85.3 84.9Bukit Timah 100.8 96.2 94.8 95.2 92.7 91.3Geylang 101.5 94.5 94.3 93.2 91.4 92Kallang 97.5 91.0 92.3 98.1 97.7 96.4Marine Parade 91.4 89.9 92.4 89.7 88.9 84.8Novena 100.6 93.3 93.7 92.4 92.0 91.7Outram 149.0 69.9 82.5 82.8 84.5 83Queenstown 91.2 87.1 85.1 87.3 86.1 85.2Rochor 133.5 98.9 99.1 100.3 100.9 103.2Tanglin 115.9 105.8 95.2 98.5 93.0 94.3Toa Payoh 94.0 85.9 86.8 86.7 92.2 91.9
East Region 92.8 88.3 87.9 87.1 85.4 84.4Bedok 95.9 92.1 91.5 90.0 87.9 86.9Pasir Ris 91.7 87.4 87.3 86.7 85.0 84.3Tampines 91.8 86.6 85.9 85.5 84.0 82.8
North East Region 79.7 81.1 82.4 83.2 82.6 81.7Ang Mo Kio 91.6 85.1 85.0 87.9 88.2 88Hougang 92.5 87.7 87.7 87.7 85.8 84.2Punggol 59.2 70.0 72.1 73.3 74.3 75.5Sengkang 79.7 82.1 84.0 84.9 83.9 82.2Serangoon 94.3 89.2 88.7 87.7 86.6 84.7
North Region 89.0 89.6 90.7 90.8 89.2 88.2Sembawang 83.3 84.1 85.3 85.8 85.3 85.1Woodlands 89.1 91.9 92.9 93.0 90.6 89.6Yishun 99.4 91.7 92.4 92.0 91.8 88.6
West Region 90.8 87.5 87.7 87.6 86.5 86.2Bukit Batok 88.3 84.6 84.5 84.1 81.8 81.4Bukit Panjang 87.8 83.8 84.4 84.4 83.5 83Choa Chu Kang 92.8 88.6 88.8 88.6 87.3 86.5Clementi 96.8 88.3 87.4 86.7 86.8 85Jurong East 95.7 91.6 90.9 90.0 87.8 89.2Jurong West 89.3 88.1 88.6 88.9 87.9 88.1
Sources: Energy Market Authority (EMA) and National Environment Agency (NEA)
Source: Energy Market Authority (EMA)
Unit: ktoeTable 3.11: Total Oil Consumption by Sector
2010 2011 2012 2013Overall 9,480.3 9,763.4 9,401.4 8,136.0
Industrial-related 7,155.3 7,302.8 7,016.7 5,886.3 Commerce and Service-related 84.2 68.9 68.3 86.4 Transport-related 2,219.1 2,366.9 2,292.7 2,133.3 Households 21.7 24.8 23.7 30.0 Others - - - -
Sources: Energy Market Authority (EMA), Civil Aviation Authority of Singapore (CAAS), International Enterprise (IE) Singapore, Maritime and Port Authority (MPA), National Environment Agency (NEA) and Department of Statistics (DOS)
Unit: ktoeTable 3.12: Total Final Energy Consumption
2010 Coal and Peat Crude Oil Petroleum
ProductsNatural
Gas Electricity Others Total
Total Final Energy Consumption 7.6 - 9,480.3 1,115.2 3,633.0 - 14,236.1 Industry-related 7.6 - 7,155.3 975.8 1,527.1 - 9,665.8 Commerce & Service-related - - 84.2 69.1 1,304.0 - 1,457.3 Transport-related - - 2,219.1 20.5 184.3 - 2,423.9 Household - - 21.7 48.5 571.6 - 641.8 Others - - - 1.3 46.0 - 47.3
2012 Coal and Peat Crude Oil Petroleum
ProductsNatural
Gas Electricity Others Total
Total Final Energy Consumption 23.0 - 9,401.4 1,130.0 3,800.6 - 14,355.0 Industry-related 23.0 - 7,016.7 984.8 1,597.6 - 9,622.1 Commerce & Service-related - - 68.3 73.3 1,387.3 - 1,528.9 Transport-related - - 2,292.7 19.6 205.6 - 2,517.9 Household - - 23.7 51.2 571.0 - 645.9 Others - - - 1.1 39.1 - 40.2
2011 Coal and Peat Crude Oil Petroleum
ProductsNatural
Gas Electricity Others Total
Total Final Energy Consumption 6.4 - 9,763.4 1,170.4 3,698.0 - 14,638.2 Industry-related 6.4 - 7,302.8 1,020.9 1,553.0 - 9,883.1 Commerce & Service-related - - 68.9 73.0 1,351.2 - 1,493.1 Transport-related - - 2,366.9 25.6 195.9 - 2,588.4 Household - - 24.8 49.7 558.4 - 632.9 Others - - - 1.2 39.5 - 40.7
2013 Coal and Peat Crude Oil Petroleum
ProductsNatural
Gas Electricity Others Total
Total Final Energy Consumption 129.0 - 8,136.0 1,297.5 3,862.7 - 13,425.2 Industry-related 129.0 - 5,886.3 1,144.9 1,619.1 - 8,779.3 Commerce & Service-related - - 86.4 81.9 1,427.8 - 1,596.1 Transport-related - - 2,133.3 18.1 203.8 - 2,355.2 Household - - 30.0 51.8 581.8 - 663.6 Others - - - 0.8 30.2 - 31.0
ENERGY CONSUMPTION ENERGY CONSUMPTION
Notes:a. Planning Areas refer to areas demarcated in the Urban Redevelopment Authority’s Master Plan 2008.
We map energy flows in Singapore, from energy supply to consumption.
04 ENERGY BALANCE
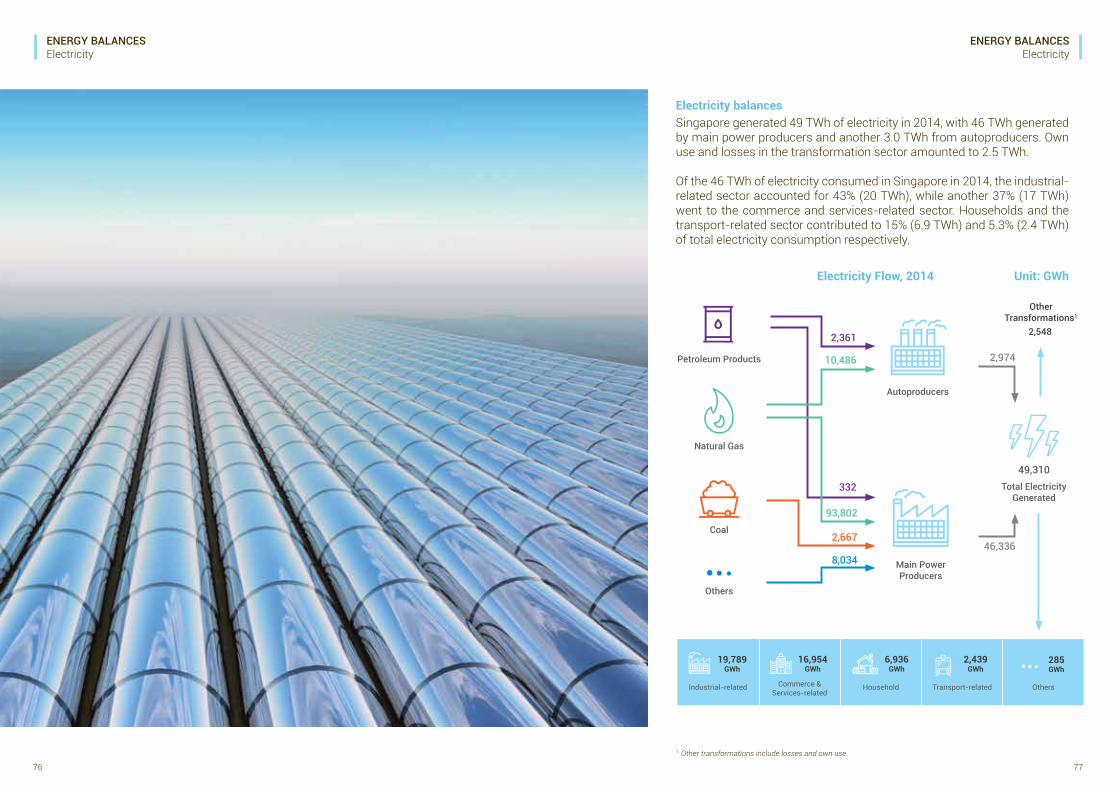
76 77
ENERGY BALANCESElectricity
ENERGY BALANCESElectricity
1 Other transformations include losses and own use.
Electricity balancesSingapore generated 49 TWh of electricity in 2014, with 46 TWh generated by main power producers and another 3.0 TWh from autoproducers. Own use and losses in the transformation sector amounted to 2.5 TWh.
Of the 46 TWh of electricity consumed in Singapore in 2014, the industrial-related sector accounted for 43% (20 TWh), while another 37% (17 TWh) went to the commerce and services-related sector. Households and the transport-related sector contributed to 15% (6.9 TWh) and 5.3% (2.4 TWh) of total electricity consumption respectively.
Total Electricity Generated
2,974
46,336
49,310
Electricity Flow, 2014 Unit: GWh
Industrial-related Commerce & Services-related
Household Transport-related Others
19,789GWh
16,954GWh
6,936 GWh
2,439 GWh
285 GWh
OtherTransformations1
2,548
Petroleum Products
Natural Gas
Coal
Others
Autoproducers
2,361
10,486
Main PowerProducers
332
93,802
8,034
2,667
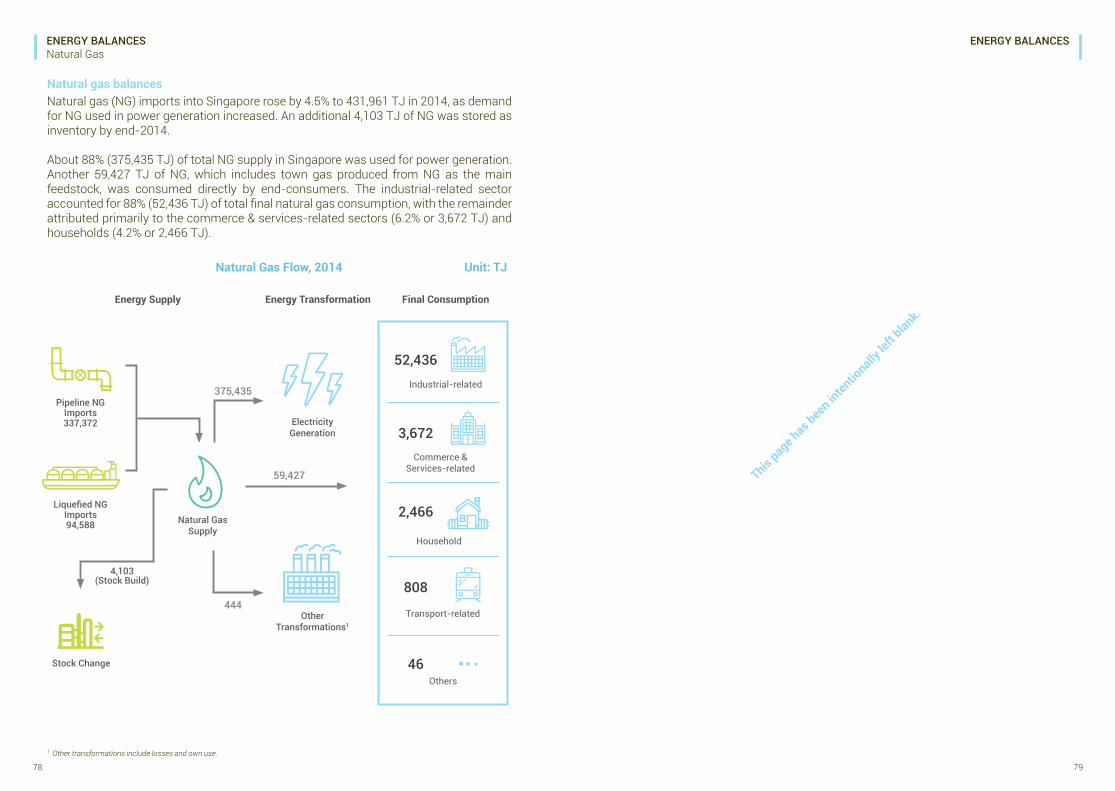
78 79
ENERGY BALANCESNatural Gas
ENERGY BALANCESTotal Primary Energy Supply
1 Other transformations include losses and own use.
Natural gas balancesNatural gas (NG) imports into Singapore rose by 4.5% to 431,961 TJ in 2014, as demand for NG used in power generation increased. An additional 4,103 TJ of NG was stored as inventory by end-2014.
About 88% (375,435 TJ) of total NG supply in Singapore was used for power generation. Another 59,427 TJ of NG, which includes town gas produced from NG as the main feedstock, was consumed directly by end-consumers. The industrial-related sector accounted for 88% (52,436 TJ) of total final natural gas consumption, with the remainder attributed primarily to the commerce & services-related sectors (6.2% or 3,672 TJ) and households (4.2% or 2,466 TJ).
Natural Gas Supply
4,103(Stock Build)
Liquefied NG Imports94,588
Stock Change
Pipeline NG Imports337,372 Electricity
Generation
OtherTransformations1
Industrial-related
Commerce & Services-related
Household
Transport-related
Others
375,435
59,427
52,436
3,672
2,466
808
46
444
Natural Gas Flow, 2014
Energy Supply Energy Transformation Final Consumption
Unit: TJ
This page h
as bee
n inten
tionally
left
blank.
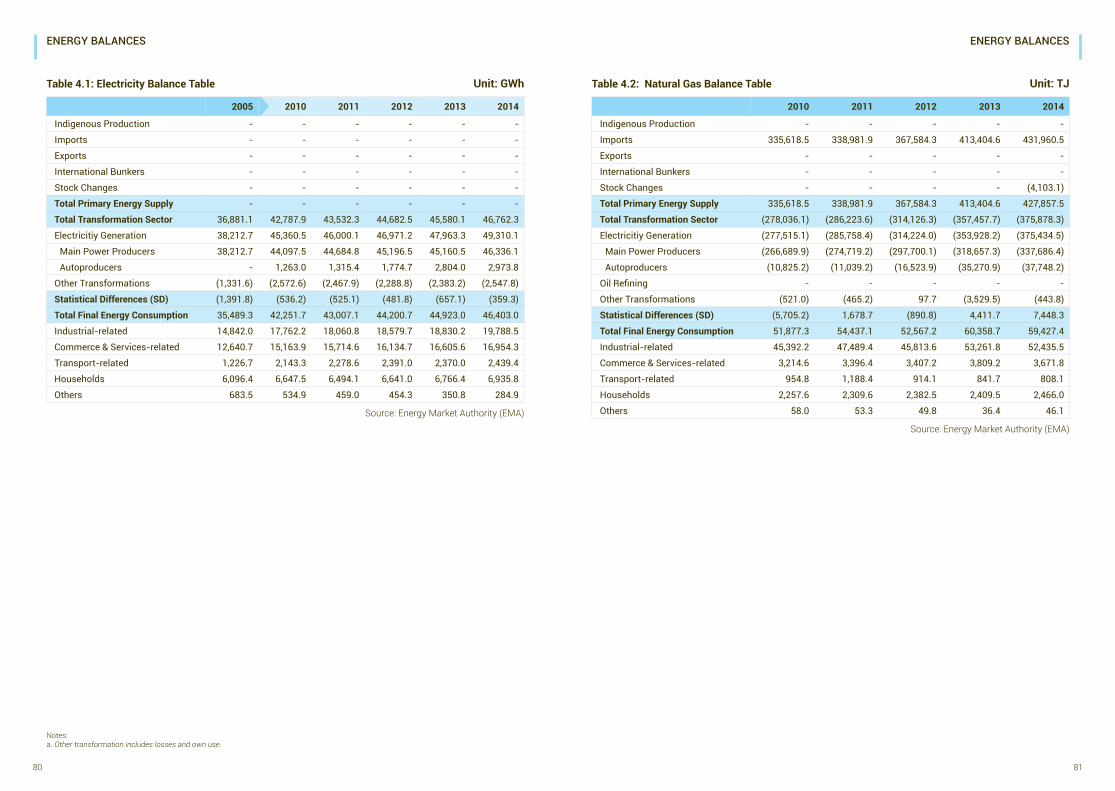
80 81
ENERGY BALANCES ENERGY BALANCES
Source: Energy Market Authority (EMA)
Source: Energy Market Authority (EMA)
Unit: GWh Unit: TJTable 4.1: Electricity Balance Table Table 4.2: Natural Gas Balance Table
2005 2010 2011 2012 2013 2014
Indigenous Production - - - - - -
Imports - - - - - -
Exports - - - - - -
International Bunkers - - - - - -
Stock Changes - - - - - -
Total Primary Energy Supply - - - - - -
Total Transformation Sector 36,881.1 42,787.9 43,532.3 44,682.5 45,580.1 46,762.3
Electricitiy Generation 38,212.7 45,360.5 46,000.1 46,971.2 47,963.3 49,310.1
Main Power Producers 38,212.7 44,097.5 44,684.8 45,196.5 45,160.5 46,336.1
Autoproducers - 1,263.0 1,315.4 1,774.7 2,804.0 2,973.8
Other Transformations (1,331.6) (2,572.6) (2,467.9) (2,288.8) (2,383.2) (2,547.8)
Statistical Differences (SD) (1,391.8) (536.2) (525.1) (481.8) (657.1) (359.3)
Total Final Energy Consumption 35,489.3 42,251.7 43,007.1 44,200.7 44,923.0 46,403.0
Industrial-related 14,842.0 17,762.2 18,060.8 18,579.7 18,830.2 19,788.5
Commerce & Services-related 12,640.7 15,163.9 15,714.6 16,134.7 16,605.6 16,954.3
Transport-related 1,226.7 2,143.3 2,278.6 2,391.0 2,370.0 2,439.4
Households 6,096.4 6,647.5 6,494.1 6,641.0 6,766.4 6,935.8
Others 683.5 534.9 459.0 454.3 350.8 284.9
2010 2011 2012 2013 2014
Indigenous Production - - - - -
Imports 335,618.5 338,981.9 367,584.3 413,404.6 431,960.5
Exports - - - - -
International Bunkers - - - - -
Stock Changes - - - - (4,103.1)
Total Primary Energy Supply 335,618.5 338,981.9 367,584.3 413,404.6 427,857.5
Total Transformation Sector (278,036.1) (286,223.6) (314,126.3) (357,457.7) (375,878.3)
Electricitiy Generation (277,515.1) (285,758.4) (314,224.0) (353,928.2) (375,434.5)
Main Power Producers (266,689.9) (274,719.2) (297,700.1) (318,657.3) (337,686.4)
Autoproducers (10,825.2) (11,039.2) (16,523.9) (35,270.9) (37,748.2)
Oil Refining - - - - -
Other Transformations (521.0) (465.2) 97.7 (3,529.5) (443.8)
Statistical Differences (SD) (5,705.2) 1,678.7 (890.8) 4,411.7 7,448.3
Total Final Energy Consumption 51,877.3 54,437.1 52,567.2 60,358.7 59,427.4
Industrial-related 45,392.2 47,489.4 45,813.6 53,261.8 52,435.5
Commerce & Services-related 3,214.6 3,396.4 3,407.2 3,809.2 3,671.8
Transport-related 954.8 1,188.4 914.1 841.7 808.1
Households 2,257.6 2,309.6 2,382.5 2,409.5 2,466.0
Others 58.0 53.3 49.8 36.4 46.1
Notes:a. Other transformation includes losses and own use.
We keep our energy options open and energy policies flexible to respond to market developments.
05 ENERGY PRICE
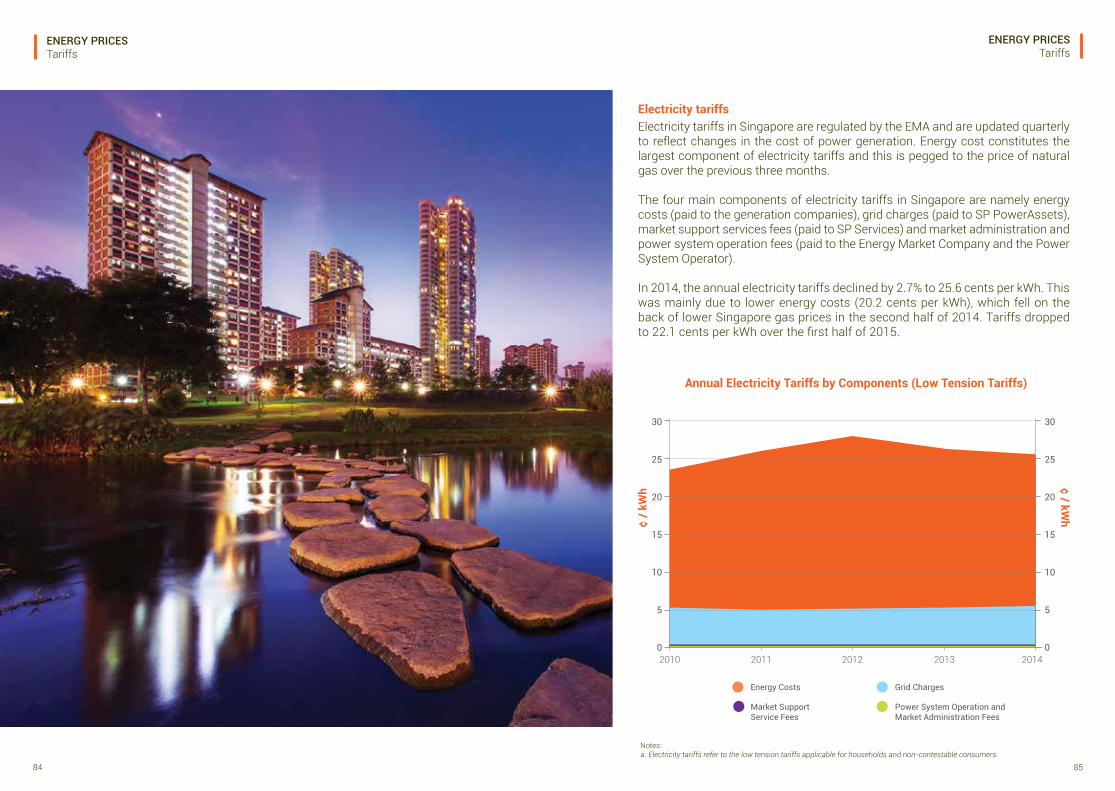
84 85
ENERGY PRICESTariffs
ENERGY PRICESTariffs
Electricity tariffsElectricity tariffs in Singapore are regulated by the EMA and are updated quarterly to reflect changes in the cost of power generation. Energy cost constitutes the largest component of electricity tariffs and this is pegged to the price of natural gas over the previous three months.
The four main components of electricity tariffs in Singapore are namely energy costs (paid to the generation companies), grid charges (paid to SP PowerAssets), market support services fees (paid to SP Services) and market administration and power system operation fees (paid to the Energy Market Company and the Power System Operator).
In 2014, the annual electricity tariffs declined by 2.7% to 25.6 cents per kWh. This was mainly due to lower energy costs (20.2 cents per kWh), which fell on the back of lower Singapore gas prices in the second half of 2014. Tariffs dropped to 22.1 cents per kWh over the first half of 2015.
Notes:a. Electricity tariffs refer to the low tension tariffs applicable for households and non-contestable consumers.
Annual Electricity Tariffs by Components (Low Tension Tariffs)
30
25
20
15
10
5
0
30
25
20
15
10
5
0¢
/ kW
h ¢ / kWh
2010 2011 2012 2013 2014
Energy Costs
Market Support Service Fees
Grid Charges
Power System Operation and Market Administration Fees
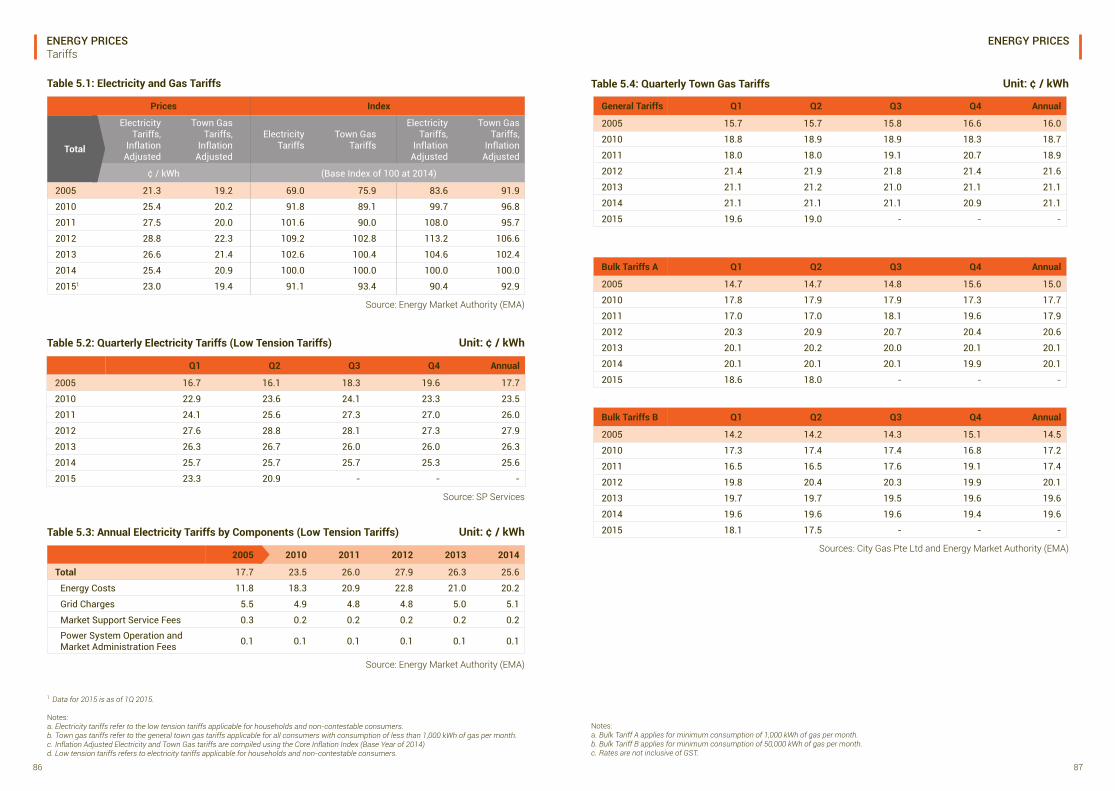
86 87
ENERGY PRICESTariffs
ENERGY PRICES
Source: Energy Market Authority (EMA)
Unit: ¢ / kWhTable 5.3: Annual Electricity Tariffs by Components (Low Tension Tariffs)
2005 2010 2011 2012 2013 2014
Total 17.7 23.5 26.0 27.9 26.3 25.6
Energy Costs 11.8 18.3 20.9 22.8 21.0 20.2
Grid Charges 5.5 4.9 4.8 4.8 5.0 5.1
Market Support Service Fees 0.3 0.2 0.2 0.2 0.2 0.2Power System Operation and Market Administration Fees 0.1 0.1 0.1 0.1 0.1 0.1
Source: SP Services
Unit: ¢ / kWhTable 5.2: Quarterly Electricity Tariffs (Low Tension Tariffs)
Q1 Q2 Q3 Q4 Annual
2005 16.7 16.1 18.3 19.6 17.7
2010 22.9 23.6 24.1 23.3 23.5
2011 24.1 25.6 27.3 27.0 26.0
2012 27.6 28.8 28.1 27.3 27.9
2013 26.3 26.7 26.0 26.0 26.3
2014 25.7 25.7 25.7 25.3 25.6
2015 23.3 20.9 - - -
1 Data for 2015 is as of 1Q 2015.
Notes:a. Electricity tariffs refer to the low tension tariffs applicable for households and non-contestable consumers. b. Town gas tariffs refer to the general town gas tariffs applicable for all consumers with consumption of less than 1,000 kWh of gas per month. c. Inflation Adjusted Electricity and Town Gas tariffs are compiled using the Core Inflation Index (Base Year of 2014) d. Low tension tariffs refers to electricity tariffs applicable for households and non-contestable consumers.
Source: Energy Market Authority (EMA)
Table 5.1: Electricity and Gas Tariffs
Prices Index
Total
Electricity Tariffs,
Inflation Adjusted
Town Gas Tariffs,
Inflation Adjusted
Electricity Tariffs
Town Gas Tariffs
Electricity Tariffs,
Inflation Adjusted
Town Gas Tariffs,
Inflation Adjusted
¢ / kWh (Base Index of 100 at 2014)
2005 21.3 19.2 69.0 75.9 83.6 91.9
2010 25.4 20.2 91.8 89.1 99.7 96.8
2011 27.5 20.0 101.6 90.0 108.0 95.7
2012 28.8 22.3 109.2 102.8 113.2 106.6
2013 26.6 21.4 102.6 100.4 104.6 102.4
2014 25.4 20.9 100.0 100.0 100.0 100.0
20151 23.0 19.4 91.1 93.4 90.4 92.9
Unit: ¢ / kWhTable 5.4: Quarterly Town Gas Tariffs
General Tariffs Q1 Q2 Q3 Q4 Annual
2005 15.7 15.7 15.8 16.6 16.0
2010 18.8 18.9 18.9 18.3 18.7
2011 18.0 18.0 19.1 20.7 18.9
2012 21.4 21.9 21.8 21.4 21.6
2013 21.1 21.2 21.0 21.1 21.1
2014 21.1 21.1 21.1 20.9 21.1
2015 19.6 19.0 - - -
Bulk Tariffs A Q1 Q2 Q3 Q4 Annual
2005 14.7 14.7 14.8 15.6 15.0
2010 17.8 17.9 17.9 17.3 17.7
2011 17.0 17.0 18.1 19.6 17.9
2012 20.3 20.9 20.7 20.4 20.6
2013 20.1 20.2 20.0 20.1 20.1
2014 20.1 20.1 20.1 19.9 20.1
2015 18.6 18.0 - - -
Sources: City Gas Pte Ltd and Energy Market Authority (EMA)
Bulk Tariffs B Q1 Q2 Q3 Q4 Annual
2005 14.2 14.2 14.3 15.1 14.5
2010 17.3 17.4 17.4 16.8 17.2
2011 16.5 16.5 17.6 19.1 17.4
2012 19.8 20.4 20.3 19.9 20.1
2013 19.7 19.7 19.5 19.6 19.6
2014 19.6 19.6 19.6 19.4 19.6
2015 18.1 17.5 - - -
Notes:a. Bulk Tariff A applies for minimum consumption of 1,000 kWh of gas per month. b. Bulk Tariff B applies for minimum consumption of 50,000 kWh of gas per month. c. Rates are not inclusive of GST.
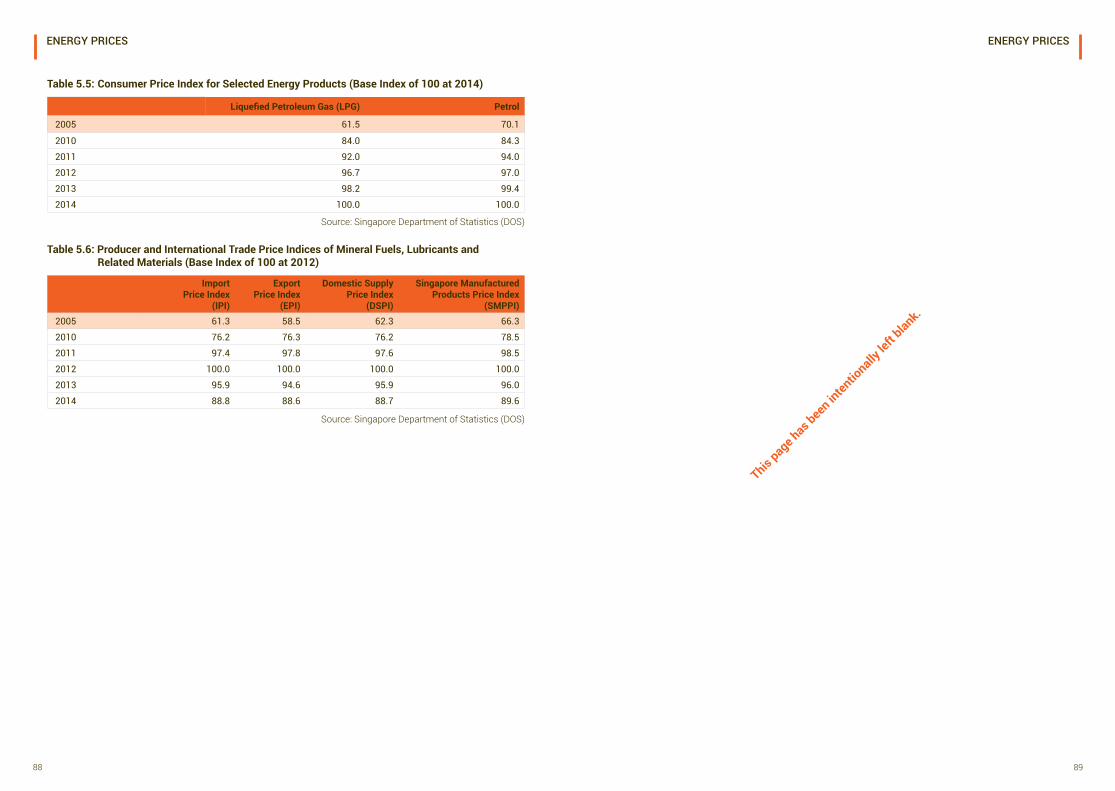
88 89
ENERGY PRICES ENERGY PRICES
Source: Singapore Department of Statistics (DOS)
Liquefied Petroleum Gas (LPG) Petrol
2005 61.5 70.1
2010 84.0 84.3
2011 92.0 94.0
2012 96.7 97.0
2013 98.2 99.4
2014 100.0 100.0
Table 5.5: Consumer Price Index for Selected Energy Products (Base Index of 100 at 2014)
Source: Singapore Department of Statistics (DOS)
Import Price Index
(IPI)
Export Price Index
(EPI)
Domestic Supply Price Index
(DSPI)
Singapore Manufactured Products Price Index
(SMPPI)2005 61.3 58.5 62.3 66.3
2010 76.2 76.3 76.2 78.5
2011 97.4 97.8 97.6 98.5
2012 100.0 100.0 100.0 100.0
2013 95.9 94.6 95.9 96.0
2014 88.8 88.6 88.7 89.6
Table 5.6: Producer and International Trade Price Indices of Mineral Fuels, Lubricants and Related Materials (Base Index of 100 at 2012)
This page h
as bee
n inten
tionally
left
blank.
We facilitate the adoption of solar energy to diversify Singapore’s energy portfolio.
06 SOLAR
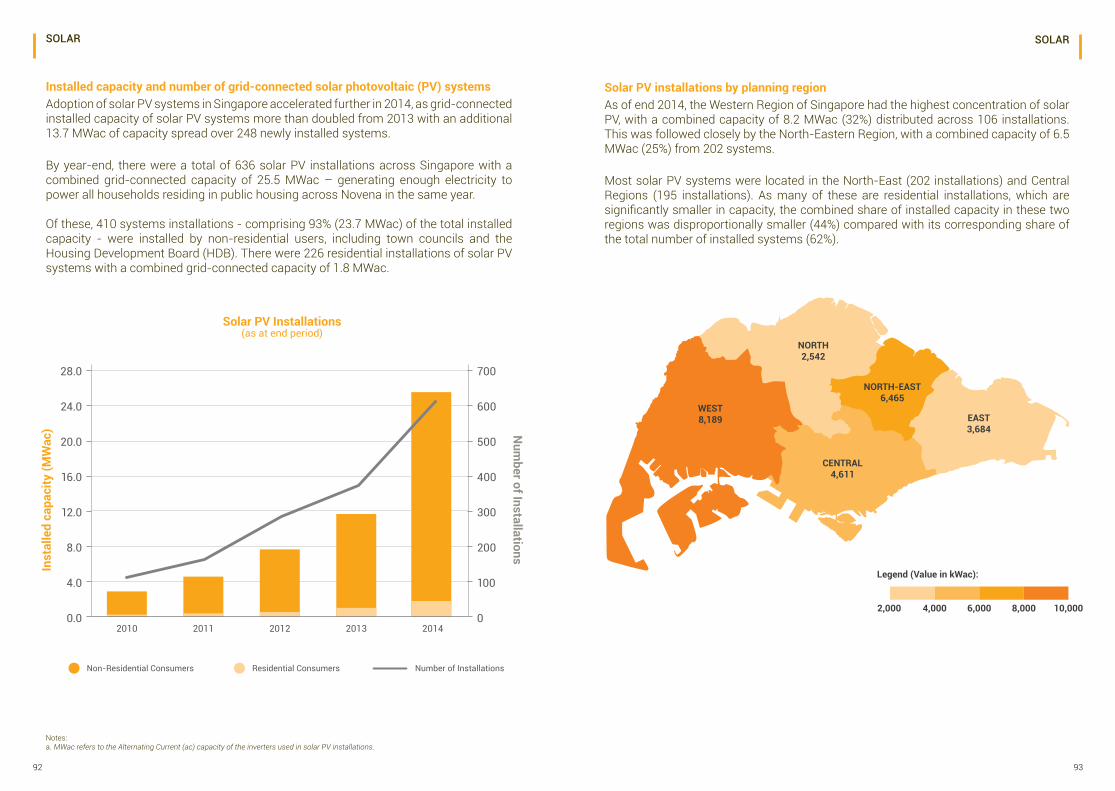
92 93
SOLAR SOLAR
Installed capacity and number of grid-connected solar photovoltaic (PV) systemsAdoption of solar PV systems in Singapore accelerated further in 2014, as grid-connected installed capacity of solar PV systems more than doubled from 2013 with an additional 13.7 MWac of capacity spread over 248 newly installed systems.
By year-end, there were a total of 636 solar PV installations across Singapore with a combined grid-connected capacity of 25.5 MWac – generating enough electricity to power all households residing in public housing across Novena in the same year.
Of these, 410 systems installations - comprising 93% (23.7 MWac) of the total installed capacity - were installed by non-residential users, including town councils and the Housing Development Board (HDB). There were 226 residential installations of solar PV systems with a combined grid-connected capacity of 1.8 MWac.
Solar PV installations by planning regionAs of end 2014, the Western Region of Singapore had the highest concentration of solar PV, with a combined capacity of 8.2 MWac (32%) distributed across 106 installations. This was followed closely by the North-Eastern Region, with a combined capacity of 6.5 MWac (25%) from 202 systems.
Most solar PV systems were located in the North-East (202 installations) and Central Regions (195 installations). As many of these are residential installations, which are significantly smaller in capacity, the combined share of installed capacity in these two regions was disproportionally smaller (44%) compared with its corresponding share of the total number of installed systems (62%).
Notes:a. MWac refers to the Alternating Current (ac) capacity of the inverters used in solar PV installations.
NORTH2,542
WEST8,189
CENTRAL4,611
Legend (Value in kWac):
2,000 4,000 6,000 8,000 10,000
NORTH-EAST6,465
EAST3,684
28.0
24.0
20.0
16.0
12.0
8.0
4.0
0.0
700
600
500
400
300
200
100
02010 2011 2012 2013 2014
Solar PV Installations(as at end period)
Inst
alle
d ca
paci
ty (M
Wac
) Num
ber of Installations
Non-Residential Consumers Residential Consumers Number of Installations
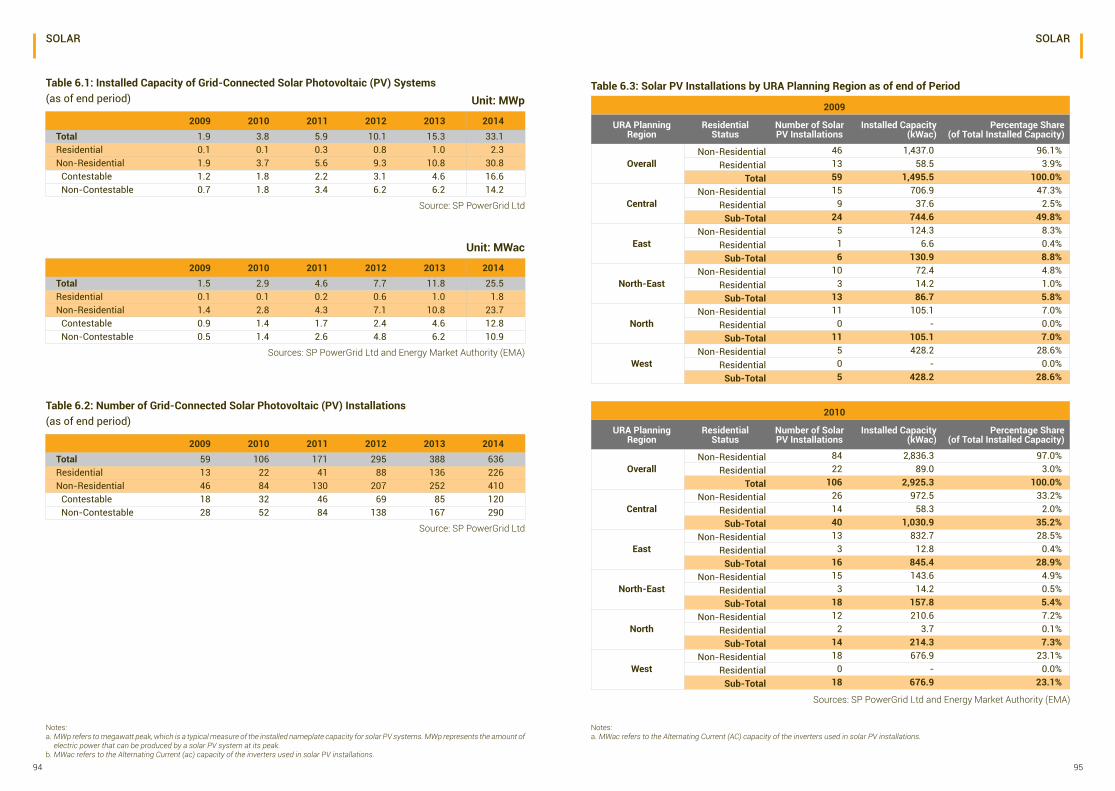
94 95
SOLAR SOLAR
Table 6.3: Solar PV Installations by URA Planning Region as of end of PeriodTable 6.1: Installed Capacity of Grid-Connected Solar Photovoltaic (PV) Systems(as of end period)
Table 6.2: Number of Grid-Connected Solar Photovoltaic (PV) Installations (as of end period)
2009
URA Planning Region
Residential Status
Number of Solar PV Installations
Installed Capacity (kWac)
Percentage Share (of Total Installed Capacity)
OverallNon-Residential 46 1,437.0 96.1%
Residential 13 58.5 3.9%Total 59 1,495.5 100.0%
CentralNon-Residential 15 706.9 47.3%
Residential 9 37.6 2.5%Sub-Total 24 744.6 49.8%
EastNon-Residential 5 124.3 8.3%
Residential 1 6.6 0.4%Sub-Total 6 130.9 8.8%
North-EastNon-Residential 10 72.4 4.8%
Residential 3 14.2 1.0%Sub-Total 13 86.7 5.8%
NorthNon-Residential 11 105.1 7.0%
Residential 0 - 0.0%Sub-Total 11 105.1 7.0%
WestNon-Residential 5 428.2 28.6%
Residential 0 - 0.0%Sub-Total 5 428.2 28.6%
2009 2010 2011 2012 2013 2014Total 1.9 3.8 5.9 10.1 15.3 33.1Residential 0.1 0.1 0.3 0.8 1.0 2.3Non-Residential 1.9 3.7 5.6 9.3 10.8 30.8
Contestable 1.2 1.8 2.2 3.1 4.6 16.6Non-Contestable 0.7 1.8 3.4 6.2 6.2 14.2
2009 2010 2011 2012 2013 2014Total 59 106 171 295 388 636Residential 13 22 41 88 136 226Non-Residential 46 84 130 207 252 410
Contestable 18 32 46 69 85 120Non-Contestable 28 52 84 138 167 290
2009 2010 2011 2012 2013 2014Total 1.5 2.9 4.6 7.7 11.8 25.5 Residential 0.1 0.1 0.2 0.6 1.0 1.8 Non-Residential 1.4 2.8 4.3 7.1 10.8 23.7
Contestable 0.9 1.4 1.7 2.4 4.6 12.8 Non-Contestable 0.5 1.4 2.6 4.8 6.2 10.9
2010
URA Planning Region
Residential Status
Number of Solar PV Installations
Installed Capacity (kWac)
Percentage Share (of Total Installed Capacity)
OverallNon-Residential 84 2,836.3 97.0%
Residential 22 89.0 3.0%Total 106 2,925.3 100.0%
CentralNon-Residential 26 972.5 33.2%
Residential 14 58.3 2.0%Sub-Total 40 1,030.9 35.2%
EastNon-Residential 13 832.7 28.5%
Residential 3 12.8 0.4%Sub-Total 16 845.4 28.9%
North-EastNon-Residential 15 143.6 4.9%
Residential 3 14.2 0.5%Sub-Total 18 157.8 5.4%
NorthNon-Residential 12 210.6 7.2%
Residential 2 3.7 0.1%Sub-Total 14 214.3 7.3%
WestNon-Residential 18 676.9 23.1%
Residential 0 - 0.0%Sub-Total 18 676.9 23.1%
Notes:a. MWac refers to the Alternating Current (AC) capacity of the inverters used in solar PV installations.
Notes:a. MWp refers to megawatt peak, which is a typical measure of the installed nameplate capacity for solar PV systems. MWp represents the amount of electric power that can be produced by a solar PV system at its peak.b. MWac refers to the Alternating Current (ac) capacity of the inverters used in solar PV installations.
Sources: SP PowerGrid Ltd and Energy Market Authority (EMA)
Source: SP PowerGrid Ltd
Source: SP PowerGrid Ltd
Sources: SP PowerGrid Ltd and Energy Market Authority (EMA)
Unit: MWp
Unit: MWac
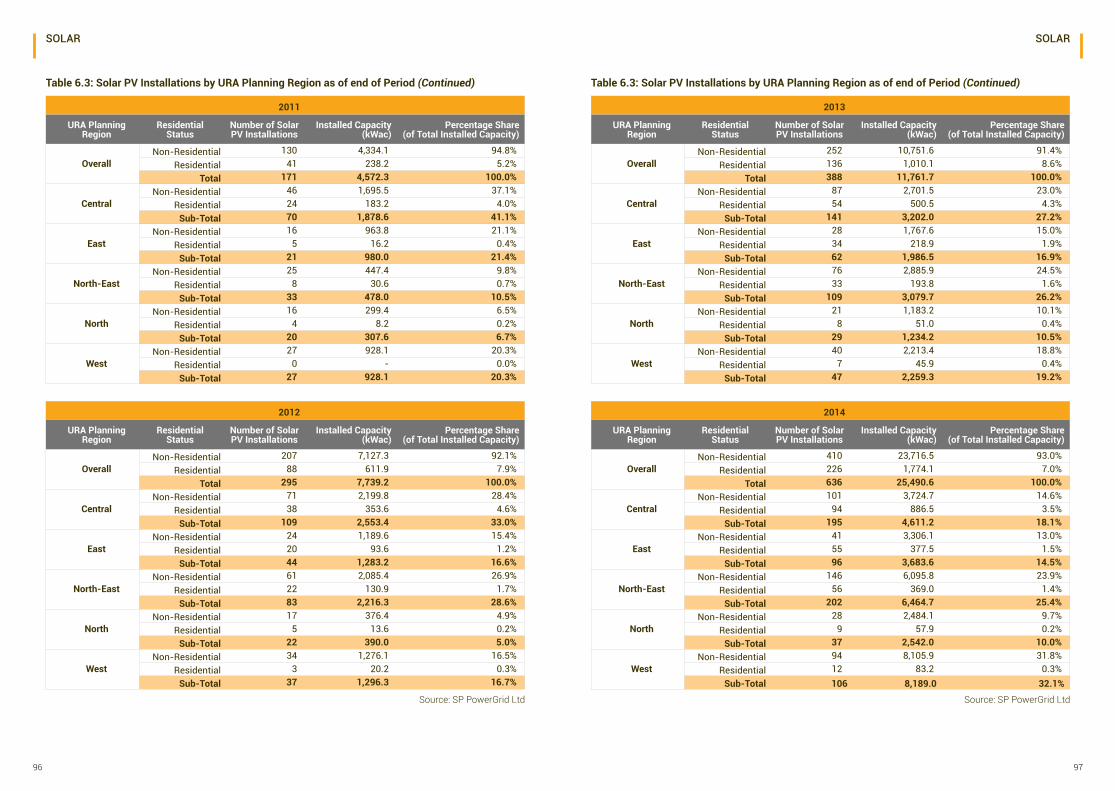
96 97
SOLAR SOLAR
Table 6.3: Solar PV Installations by URA Planning Region as of end of Period (Continued)
2014
URA Planning Region
Residential Status
Number of Solar PV Installations
Installed Capacity (kWac)
Percentage Share (of Total Installed Capacity)
OverallNon-Residential 410 23,716.5 93.0%
Residential 226 1,774.1 7.0%Total 636 25,490.6 100.0%
CentralNon-Residential 101 3,724.7 14.6%
Residential 94 886.5 3.5%Sub-Total 195 4,611.2 18.1%
EastNon-Residential 41 3,306.1 13.0%
Residential 55 377.5 1.5%Sub-Total 96 3,683.6 14.5%
North-EastNon-Residential 146 6,095.8 23.9%
Residential 56 369.0 1.4%Sub-Total 202 6,464.7 25.4%
NorthNon-Residential 28 2,484.1 9.7%
Residential 9 57.9 0.2%Sub-Total 37 2,542.0 10.0%
WestNon-Residential 94 8,105.9 31.8%
Residential 12 83.2 0.3%Sub-Total 106 8,189.0 32.1%
Source: SP PowerGrid Ltd
Table 6.3: Solar PV Installations by URA Planning Region as of end of Period (Continued)
2012
URA Planning Region
Residential Status
Number of Solar PV Installations
Installed Capacity (kWac)
Percentage Share (of Total Installed Capacity)
OverallNon-Residential 207 7,127.3 92.1%
Residential 88 611.9 7.9%Total 295 7,739.2 100.0%
CentralNon-Residential 71 2,199.8 28.4%
Residential 38 353.6 4.6%Sub-Total 109 2,553.4 33.0%
EastNon-Residential 24 1,189.6 15.4%
Residential 20 93.6 1.2%Sub-Total 44 1,283.2 16.6%
North-EastNon-Residential 61 2,085.4 26.9%
Residential 22 130.9 1.7%Sub-Total 83 2,216.3 28.6%
NorthNon-Residential 17 376.4 4.9%
Residential 5 13.6 0.2%Sub-Total 22 390.0 5.0%
WestNon-Residential 34 1,276.1 16.5%
Residential 3 20.2 0.3%Sub-Total 37 1,296.3 16.7%
Source: SP PowerGrid Ltd
2013
URA Planning Region
Residential Status
Number of Solar PV Installations
Installed Capacity (kWac)
Percentage Share (of Total Installed Capacity)
OverallNon-Residential 252 10,751.6 91.4%
Residential 136 1,010.1 8.6%Total 388 11,761.7 100.0%
CentralNon-Residential 87 2,701.5 23.0%
Residential 54 500.5 4.3%Sub-Total 141 3,202.0 27.2%
EastNon-Residential 28 1,767.6 15.0%
Residential 34 218.9 1.9%Sub-Total 62 1,986.5 16.9%
North-EastNon-Residential 76 2,885.9 24.5%
Residential 33 193.8 1.6%Sub-Total 109 3,079.7 26.2%
NorthNon-Residential 21 1,183.2 10.1%
Residential 8 51.0 0.4%Sub-Total 29 1,234.2 10.5%
WestNon-Residential 40 2,213.4 18.8%
Residential 7 45.9 0.4%Sub-Total 47 2,259.3 19.2%
2011
URA Planning Region
Residential Status
Number of Solar PV Installations
Installed Capacity (kWac)
Percentage Share (of Total Installed Capacity)
OverallNon-Residential 130 4,334.1 94.8%
Residential 41 238.2 5.2%Total 171 4,572.3 100.0%
CentralNon-Residential 46 1,695.5 37.1%
Residential 24 183.2 4.0%Sub-Total 70 1,878.6 41.1%
EastNon-Residential 16 963.8 21.1%
Residential 5 16.2 0.4%Sub-Total 21 980.0 21.4%
North-EastNon-Residential 25 447.4 9.8%
Residential 8 30.6 0.7%Sub-Total 33 478.0 10.5%
NorthNon-Residential 16 299.4 6.5%
Residential 4 8.2 0.2%Sub-Total 20 307.6 6.7%
WestNon-Residential 27 928.1 20.3%
Residential 0 - 0.0%Sub-Total 27 928.1 20.3%
07 OTHERS
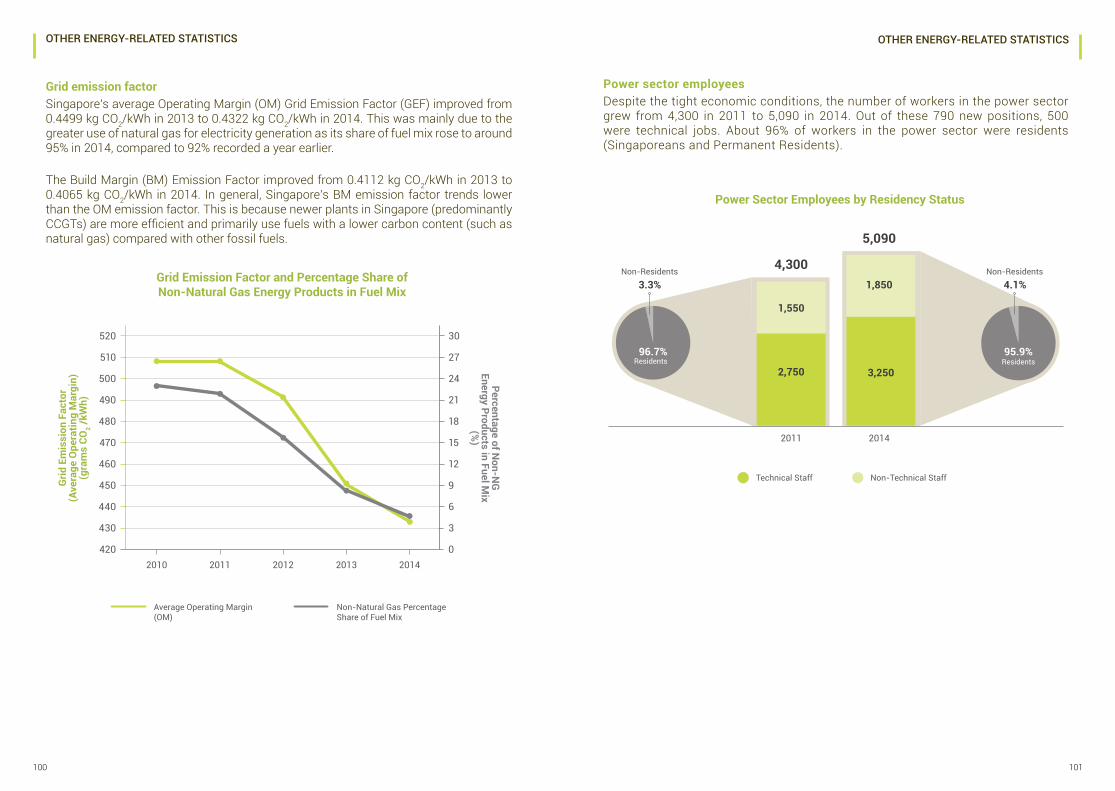
100 101
OTHER ENERGY-RELATED STATISTICS OTHER ENERGY-RELATED STATISTICS
Grid emission factorSingapore’s average Operating Margin (OM) Grid Emission Factor (GEF) improved from 0.4499 kg CO2/kWh in 2013 to 0.4322 kg CO2/kWh in 2014. This was mainly due to the greater use of natural gas for electricity generation as its share of fuel mix rose to around 95% in 2014, compared to 92% recorded a year earlier.
The Build Margin (BM) Emission Factor improved from 0.4112 kg CO2/kWh in 2013 to 0.4065 kg CO2/kWh in 2014. In general, Singapore’s BM emission factor trends lower than the OM emission factor. This is because newer plants in Singapore (predominantly CCGTs) are more efficient and primarily use fuels with a lower carbon content (such as natural gas) compared with other fossil fuels.
Power sector employeesDespite the tight economic conditions, the number of workers in the power sector grew from 4,300 in 2011 to 5,090 in 2014. Out of these 790 new positions, 500 were technical jobs. About 96% of workers in the power sector were residents (Singaporeans and Permanent Residents).
2011 2014
Technical Staff Non-Technical Staff
Non-Residents Non-Residents
Power Sector Employees by Residency Status
2,750
1,550
4,300
5,090
3,250
96.7% 95.9%
3.3% 4.1%
Residents Residents
1,850Grid Emission Factor and Percentage Share of Non-Natural Gas Energy Products in Fuel Mix
520
510
500
490
480
470
460
450
440
430
420
30
27
24
21
18
15
12
9
6
3
02010 2011 2012 2013 2014
Grid
Em
issi
on F
acto
r(A
vera
ge O
pera
ting
Mar
gin)
(gra
ms
CO2 /
kWh)
Percentage of Non-N
GEnergy Products in Fuel M
ix(%
)
Average Operating Margin(OM)
Non-Natural Gas PercentageShare of Fuel Mix
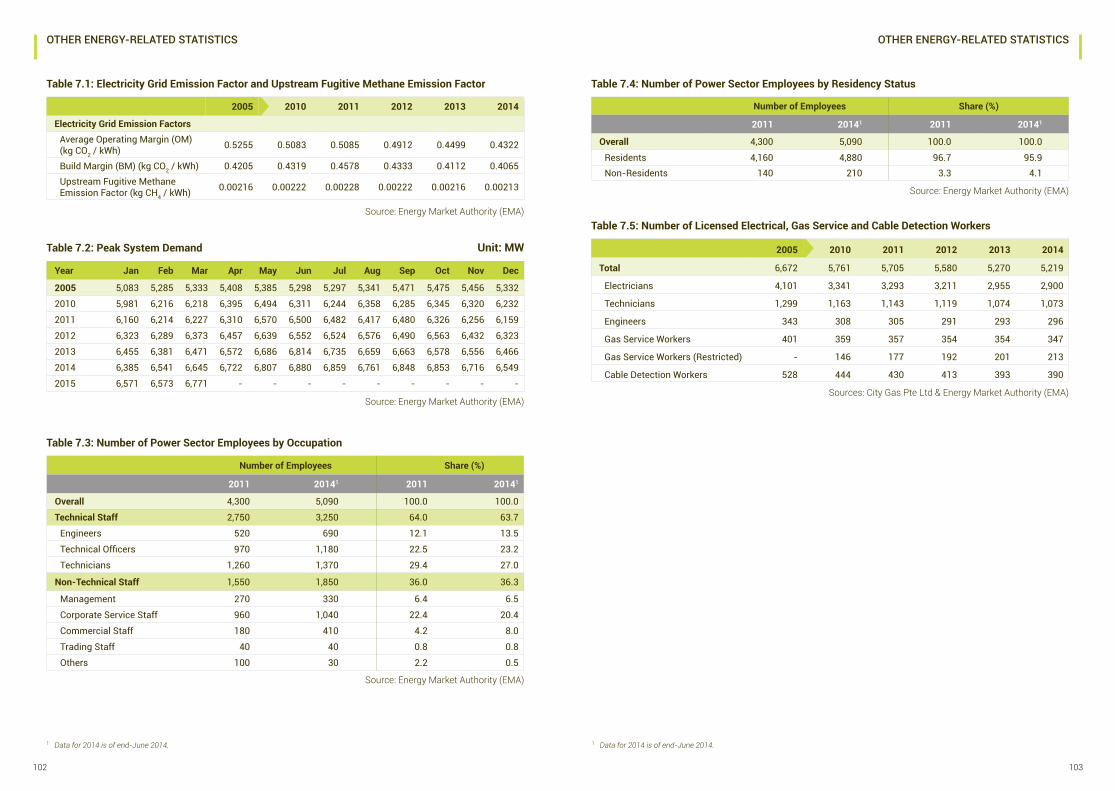
102 103
Sources: City Gas Pte Ltd & Energy Market Authority (EMA)
Table 7.5: Number of Licensed Electrical, Gas Service and Cable Detection Workers
2005 2010 2011 2012 2013 2014
Total 6,672 5,761 5,705 5,580 5,270 5,219
Electricians 4,101 3,341 3,293 3,211 2,955 2,900
Technicians 1,299 1,163 1,143 1,119 1,074 1,073
Engineers 343 308 305 291 293 296
Gas Service Workers 401 359 357 354 354 347
Gas Service Workers (Restricted) - 146 177 192 201 213
Cable Detection Workers 528 444 430 413 393 390
Source: Energy Market Authority (EMA)
Table 7.4: Number of Power Sector Employees by Residency Status
Number of Employees Share (%)
2011 20141 2011 20141
Overall 4,300 5,090 100.0 100.0
Residents 4,160 4,880 96.7 95.9Non-Residents 140 210 3.3 4.1
Source: Energy Market Authority (EMA)
Table 7.1: Electricity Grid Emission Factor and Upstream Fugitive Methane Emission Factor
2005 2010 2011 2012 2013 2014
Electricity Grid Emission Factors Average Operating Margin (OM) (kg CO2 / kWh) 0.5255 0.5083 0.5085 0.4912 0.4499 0.4322
Build Margin (BM) (kg CO2 / kWh) 0.4205 0.4319 0.4578 0.4333 0.4112 0.4065Upstream Fugitive Methane Emission Factor (kg CH4 / kWh) 0.00216 0.00222 0.00228 0.00222 0.00216 0.00213
Source: Energy Market Authority (EMA)
Table 7.2: Peak System Demand
Year Jan Feb Mar Apr May Jun Jul Aug Sep Oct Nov Dec
2005 5,083 5,285 5,333 5,408 5,385 5,298 5,297 5,341 5,471 5,475 5,456 5,332
2010 5,981 6,216 6,218 6,395 6,494 6,311 6,244 6,358 6,285 6,345 6,320 6,232
2011 6,160 6,214 6,227 6,310 6,570 6,500 6,482 6,417 6,480 6,326 6,256 6,159
2012 6,323 6,289 6,373 6,457 6,639 6,552 6,524 6,576 6,490 6,563 6,432 6,323
2013 6,455 6,381 6,471 6,572 6,686 6,814 6,735 6,659 6,663 6,578 6,556 6,466
2014 6,385 6,541 6,645 6,722 6,807 6,880 6,859 6,761 6,848 6,853 6,716 6,549
2015 6,571 6,573 6,771 - - - - - - - - -
Unit: MW
Source: Energy Market Authority (EMA)
Table 7.3: Number of Power Sector Employees by Occupation
Number of Employees Share (%)
2011 20141 2011 20141
Overall 4,300 5,090 100.0 100.0
Technical Staff 2,750 3,250 64.0 63.7
Engineers 520 690 12.1 13.5
Technical Officers 970 1,180 22.5 23.2
Technicians 1,260 1,370 29.4 27.0
Non-Technical Staff 1,550 1,850 36.0 36.3
Management 270 330 6.4 6.5
Corporate Service Staff 960 1,040 22.4 20.4
Commercial Staff 180 410 4.2 8.0
Trading Staff 40 40 0.8 0.8
Others 100 30 2.2 0.5
OTHER ENERGY-RELATED STATISTICS OTHER ENERGY-RELATED STATISTICS
1 Data for 2014 is of end-June 2014. 1 Data for 2014 is of end-June 2014.

TECHNICAL NOTES
106 107
TECHNICAL NOTES TECHNICAL NOTES
ObjectivesSingapore Energy Statistics 2015 provides users with findings and statistics relating to Singapore’s energy supply, transformation and demand.
Sources of dataThe data used in the publication were mainly obtained through administrative returns from licensees and through surveys. EMA licensees are required to submit regulatory returns under the Electricity and Gas Acts. Energy statistics collected through the Joint Energy and Emissions Statistics Survey were also used in this publication. This survey is conducted by EMA Research and Statistics Unit (RSU) together with those of the Economic Development Board (EDB) and the National Environment Agency (NEA) under the Statistics Act.
Other sources of data featured in this publication include energy products trade statistics from International Enterprise (IE) Singapore, energy consumption statistics from the NEA, and prices statistics from the Singapore Department of Statistics (DOS).
Compilation framework and methodologyIn compiling the energy statistics, EMA follows closely the recommended principles and methodologies set out in the International Energy Agency (IEA)’s Energy Statistics Manual. For the computation of the electricity grid emission factors and upstream fugitive methane emission factor, methodologies recommended by the Intergovernmental Panel on Climate Change (IPCC) were adopted.
Units of measurementEnergy products are recorded in their original units of measure. As these units of measure vary, quantities of energy products need to be converted into a common unit to allow for comparison and aggregation. The common unit of measurement used to measure energy products in this publication is the tonne of oil equivalent (toe). According to the IEA, the tonne of oil equivalent is defined as follows
1 tonne of oil equivalent = 41.868 gigajoules (GJ) = 11,630 kilowatt hours (kWh)
Tonne of oil equivalent should be regarded as a measure of energy content rather than a physical quantity. One tonne of oil is not equal to one tonne of oil equivalent.
The following prefixes are used for multiples of joules, watts and watt hours: kilo (k) = 1,000 or 103
mega (M) = 1,000,000 or 106
giga (G) = 1,000,000,000 or 109
tera (T) = 1,000,000,000,000 or 1012
All prices and tariffs are presented in Singapore dollars.
Calorific valuesEMA uses Net Calorific Values (NCVs) to convert all fuels, except natural gas, from their original units to tonnes of oil equivalent (toe). Gross Calorific Values (GCVs) were used for unit conversion of Natural Gas, unless otherwise stated.
Energy balanceAn energy balance is an accounting framework for compilation and reconciliation of data on all energy products entering, exiting, and used within the national territory of a given country during a reference period.
This table expresses all forms of energy in a common accounting unit and shows the relationships between the inputs to and the outputs from the energy transformation industries.
The balance is divided into three main blocks: (a) The top block (Energy Supply) which shows the flow representing energy entering and leaving the national territory, as well as stock changes to provide information on total energy supply on the national territory during the reference period; (b) The middle block (Energy Transformation) which shows how energy is transformed, transferred, used by energy industries for own use and losses in distribution and transmission; and (c) The bottom block (Final Consumption) which shows final energy consumption by energy consumers.
Fuel mix for electricity generationThe fuel mix for electricity generation can be calculated using the input or output method. This publication presents fuel mix data compiled by the output method.
The input method calculates the fuel mix for electricity generation based on the ratio of volume of fuel input to generation units. It does not take into account variations in energy content of fuel used by different companies for electricity generation, or variations in fuel-to-electricity conversion efficiency of the generating plants.
The output method uses the amount of electricity generated and the corresponding type of fuel used to calculate the fuel mix for the generation of electricity. It takes the domestic fuel-to-electricity conversion efficiency of the generating plants as well as the type of plants used into account.
108 109
TECHNICAL NOTES TECHNICAL NOTES
Electricity and gas tariffsAnnual and quarterly electricity and gas tariffs refer to the weighted average of tariffs for the specific periods as they may be adjusted at various period throughout the year.
Re-referencing price indicesIn order to allow comparisons to be made between the movements of different prices, it is practical to express the series in relation to a reference year. The shift from expressing the price indices in relation to a specific base year, to expressing the price indices in relation to a reference year common across all price indices, requires the series to be re-referenced.
Grid Emission Factors and Methane Emission FactorsThe methodologies for the compilation of grid emission factors are based on the United Nations Framework Convention on Climate Change (UNFCCC) Clean Development Mechanism (CDM) Methodological Tool called “Tool to calculate the emission factor for an electricity system” and the UNFCCC CDM Approved Baseline Methodology (AM) 0029 Baseline Methodology for grid connected electricity generation plants using natural gas.
Grid Emission Factor (GEF) measures average CO2 emission emitted per unit net electricity generated, and is calculated using the Average Operating Margin (OM) method. This is the generation-weighted average CO2 emission per unit net electricity generation of all generating power plants serving the electricity grid. GEF by Build Margin (BM) method refers to the generation-weighted average CO2 emission per unit net electricity generation of the five most recently built power units and/or the set of power capacity additions that comprise at least 20% of the total system electricity generation.
Upstream fugitive Methane Emission Factor (MEF) from electricity generation measures the average CH4 emission per unit net electricity generated. The methodology is similar to the BM method except that it is based on the five most recently built power units that run on natural gas. These five plants should also generate at least 20% of total system electricity generation.
CLASSIFICATION
Energy productsEnergy products refer to products exclusively or mainly used as a source of energy. They include energy in forms suitable for direct use (for instance, electricity and heat) and energy products that release energy while undergoing some chemical or other process (such as combustion). The classification of energy products is based on the Singapore Trade Classification, Customs & Excise Duties 2012 (STCCED 2012 or HS 2012). STCCED classification adopts the ASEAN Harmonised Tariff Nomenclature 2012 (AHTN 2012), which is based on the 6-digit Harmonised Commodity Description and Coding System developed by the World Customs Organisation (WCO) for the classification of goods.
Industrial activityIndustrial activity refers to the principal activity undertaken by the enterprise and to which the enterprise devotes most of its resources; or from which it derives most of its income. The classification of the principal activity of the enterprise is based on the Singapore Standard Industrial Classification, 2010 (SSIC 2010). SSIC 2010 adopts the basic framework of the International Standard Industrial Classification Revision 4 (ISIC Rev. 4).
Planning Region/AreaPlanning Region/Area refer to those demarcated in the Urban Redevelopment Authority’s Master Plan 2008.

GLOSSARY
112 113
Energy productsCoal and peat products
Coal and peat products include all coals, both primary (including hard coal and lignite/brown coal) and derived fuels (including patent fuel, coke over coke, gas coke, BKB, coke oven gas, blast furnace gas and oxygen steel furnace gas). Peat is also included in this category. The energy products and their corresponding HS 2012 codes under this category are:
Hard Coal - 27011210, 27011290, 27011900 Anthracite - 27011100 Lignite - 27021000, 27022000 Peat - 27030010, 27030020 Coke Oven Coke - 27040010, 27040020, 27040030 Coal Tar - 27060000 BKB/PB6 - 27012000 Gas Works Gas - 27050000
Crude oil products Crude oil products include crude oil, natural gas liquids, refinery feedstocks and additives as well as other hydrocarbons. The energy products and their corresponding HS 2012 codes under this category are:
Crude Oil - 27090010, 27090020, 27090090 Natural Gas Liquids - 27111410, 27111490, 27112900 Refinery Feedstocks - 27101920Additives/Oxygenates - 29091100, 29091900, 29092000, 29093000, 29094100, 29094300, 29094400, 29094900, 29095000, 29096000, 38112110, 38112190, 38112900, 38119090
Petroleum products Petroleum products include ethane, LPG, aviation gasoline, motor gasoline, jet fuel, kerosene, gas/diesel oil, fuel oil, naphtha, white spirit, lubricants, bitumen, paraffin waxes, petroleum coke and other petroleum products. The energy products and their corresponding HS 2012 codes under this category are:
Light distillatesGasoline (Aviation) - 27101220Gasoline (Motor) - 27101211, 27101212, 27101213, 27101214, 27101215, 27101216Liquefied Petroleum Gas (LPG) - 27111200, 27111300, 27111900Naphtha - 27101270White Spirit SBP - 27101230, 27101240, 27101250, 27101260, 27101280, 27101290
Petroleum products (Continue)
Middle distillatesGas/Diesel Oil - 27101971, 27101972Jet Fuel Kerosene - 27101981, 27101982 Other Kerosenes - 27101983
Heavy distillates & residuumBitumen - 27132000, 27139000, 27141000, 27149000, 27150000Fuel Oil - 27101979 Lubricants - 27101941, 27101942, 27101943, 27101944, 27101950Other Petroleum Products - 27071000, 27072000, 27073000, 27074000, 27075000, 27079100, 27079910, 27079990, 27081000, 27082000, 27101930, 27101960, 27101989, 27101990, 27102000, 27109100, 27109900 Paraffin Waxes - 27121000, 27122000, 27129010, 27129090 Petroleum Coke - 27131100, 27131200
Natural Gas Natural Gas includes natural gas (excluding Natural Gas Liquids) and town gas. The energy products and their corresponding HS 2012 codes under this category are:
Natural Gas - 27112190Liquefied Natural Gas - 27111100
Others(Energy Products)
Others refer to other energy products that are not classified. These include solar, biomass and waste (such as municipal waste and biogas). Municipal waste is waste produced by residential, commercial and public services that is collected by local authorities for disposal in a central location for the production of electricity and/or heat.
GLOSSARY GLOSSARY
114 115
Electricity generationMain Power Producers
These are enterprises that produce electricity as their principal activity.
Autoproducers These are enterprises that produce electricity but for whom the production is not their principal activity.
Own Use Own use in electricity generation refers to the part of electricity generated which is consumed by the auxiliary equipment of the generation plant (such as pumps, fans and motors) under normal operations.
Licensed GenerationCapacity
The licensed capacity of a generation or wholesaler licensee is the authorised capacity that EMA grants to a licensee for the generation of electricity.
Combined Cycle Gas Turbine (CCGT) Plant
Combined Cycle Gas Turbines (CCGT) are a form of highly efficient energy generation technology that combines a gas-fired turbine with a steam turbine.
The design uses a gas turbine to create electricity and then captures the resulting waste heat to create steam, which in turn drives a steam turbine significantly increasing the system’s power output without any increase in fuel.
Co-Generation (Co-Gen) Plant
Co-generation plants (also known as combined heat plants) are those which simultaneously generates both electricity and useful heat from a common fuel source, improving overall thermodynamical efficiency.
Tri-Generation (Tri-Gen) Plant`
Tri-generation plants are those which simultaneously generates electricity, useful heat and cooling from a common fuel source, improving overall thermodynamical efficiency.
Open Cycle Gas Turbine (OCGT) Plant
An open cycle gas turbine plant is a gas turbine power plant in which the heat content of the exhaust gases exiting the turbine is discarded, as opposed to using a heat exchanger or recovered in a heat recovery steam generator (HRSG) as in a CCGT.
Steam Turbine Plant A steam turbine is a turbine that is driven by the pressure of steam discharged at high velocity against the turbine vanes.
Waste-To-Energy (WTE) Plant
A Waste-To-Energy plant is a power plant which generates power from the incineration of waste.
Electricity and natural gas consumptionElectricity Consumption
This refers to total electricity consumption by end users, including (embedded) consumption by autoproducers.
Contestable Consumers
Contestable consumers are large non-residential consumers with an average monthly consumption of 10,000 kWh or more (before 1 Apr 2014) at a single location. They are eligible for contestability i.e. They can choose to buy electricity from electricity retailers, the wholesale electricity market at half-hourly spot prices or remain with SP Services to buy electricity at regulated tariffs. EMA lowered the contestability threshold from 10,000 kWh to 8,000 kWh on 1 Apr 2014, and then to 4,000 kWh on 1 Oct 2014. This will be further lowered to 2,000 kWh on 1 July 2015.
Final Natural GasConsumption
This refers to total natural gas consumption by end users, excluding consumption for electricity generation.
GLOSSARY GLOSSARY
116 117
Transport-related Transport-related consumption is specified in the following subsectors according to Singapore Standard Industrial Classification 2010 (SSIC 2010).
• Transport and Storage [SSIC Section H, Division 49-53]• Land Transport [SSIC Division 49]• Water Transport [SSIC Division 50]• Air Transport [SSIC Division 51]• Warehousing and Support Activities for Transportation [SSIC Division 52]• Postal and Courier Activities [SSIC Division 53]
Others Others refer to sectors or activities not adequately defined in SSIC 2010.
Sectoral activitiesIndustrial-related Industrial-related consumption is specified in the following
subsector according to Singapore Standard Industrial Classification 2010 (SSIC 2010).
• Agriculture and Fishing [SSIC Section A, Division 1-3]• Mining and Quarrying [SSIC Section B, Division 8-9]• Manufacturing [SSIC Section C, Division 10-32]• Utilities [SSIC Section D and E, Division 35-38]• Construction [SSIC Section F, Division 41-43]
Commerce & Services-related
Commerce & Services-related consumption is specified in the following subsectors according to Singapore Standard Industrial Classification 2010 (SSIC 2010).
• Wholesale and Retail Trade [SSIC Section G, Division 46-47]• Accommodation and Food Services Activities [SSIC Section I, Division 55 – 56]• Information and Communications [SSIC Section J, Division 58-63]• Financial and Insurance Activities [SSIC Section K, Division 64-66]• Real Estate Activities [SSIC Section L, Division 68]• Professional, Scientific and Technical Activities [SSIC Section M, Division 69-75]• Administrative and Support Services Activities [SSIC Section N, Division 77-82]• Public Administration and Defence [SSIC Section O, Division 84]• Education [SSIC Section P, Division 85]• Health and Social Services [SSIC Section Q, Division 86-88]• Arts, Entertainment and Recreation [SSIC Section R, Division 90-93]• Other Service Activities [SSIC Section S, Division 94-96]• Activities of Households as Employers of Domestic Personnel [SSIC Section T, Division 97]• Activities of Extra-Territorial Organisations and Bodies [SSIC Section U, Division 99]
Households The scope of the households sector includes all households in their capacity as final consumers.
GLOSSARY GLOSSARY
Planning areaCentral Region Bishan, Bukit Merah, Bukit Timah, Downtown Core, Geylang,
Kallang, Marine Parade, Marina East, Marina South, Museum, Newton, Novena, Orchard, Outram, Queenstown, River Valley, Rochor, Singapore River, Southern Islands, Straits View, Tanglin, Toa Payoh
East Region Bedok, Changi, Changi Bay, Paya Lebar, Pasir Ris, Tampines
North-East Region Ang Mo Kio, Hougang, Punggol, North Eastern Islands, Seletar, Sengkang, Serangoon
North Region Central Water Catchment, Lim Chu Kang, Mandai, Simpang, Sembawang, Sungei Kadut, Woodlands, Yishun
West Region Boon Lay, Bukit Batok, Bukit Panjang, Choa Chu Kang, Clementi, Jurong East, Jurong West, Jurong Island, Pioneer, Tengah, Tuas, Western Islands, Western Water Catchment
118 119
GLOSSARY GLOSSARY
Electricity tariffs componentsEnergy Costs This is paid to the generation companies and reflects the cost of
power generation.
Grid Charges This is paid to SP Power Assets to recover the costs of transporting electricity through the grid.
Market support services fees
This is paid to SP Services to recover the costs of billing and meter reading.
Power System operation and market Administration Fees
This is paid to the Power System Operator and Energy Market Company to recover the costs of operating the power system and electricity wholesale market.
Price indicesConsumer Price Index (CPI)
This price index measures the average price changes in a fixed basket of consumption goods and services commonly purchased by the households over time.
Import Price Index (IPI)
This price index measure changes in the prices of goods imported into Singapore over time.
Export Price Index (EPI)
This price index measures changes in the price of all exports of merchandise from Singapore, including re-exports.
Domestic Supply Price Index (DSPI)
This is an Input-based Producer Price Index of goods. It measures the price changes of locally manufactured goods and imports which are retained for use in the domestic market.
Singapore ManufacturedProduct Price Index(SMPPI)
This is an Output-based Producer Price Index of the manufacturing sector. It measures changes in the prices of goods produced by local manufacturers for sale in the local and international markets.
Grid emission factorGrid Emission Factor(GEF)
The Grid Emission Factor (GEF) measures average CO2 emission emitted per MWh of electricity, and is calculated using the Average Operating Margin (OM) method. This is the generation-weighted average CO2 emissions per unit net electricity generation of all generating power plants serving the system.
Build Margin (BM)Emission Factor
The Build Margin (BM) Emission Factor refers to the generation-weighted average CO2 emissions per unit net electricity generation, of the set of five power units most recently built; and/or the set of power capacity additions that comprise 20% of system generation that have been built recently.
Methane EmissionFactor (MEF)
The Methane Emission Factor (MEF) measures average CH4 emission emitted per MWh of the set of five power units as defined in the BM.
Job Categories for Power Sector EmployeesManagement Management refers to Chief Executive Officer and Head of
Division/Department/Section.
Engineers Engineers refer to Senior Engineer, Engineer, Executive Engineer, Principal Engineer, Shift Manager, Team Leader and Deputy Team Leader.
Technical Officer Technical Officer refer to Principal Technical Officer, Senior Technical Officer and Technical Officer.
Technician Technican refers to Senior Technician, Technician, Mechanic and Electrician.
Corporate Service Staff
Corporate Service Staff refers to those in Finance, Human Resource, Legal, Administration, Information Technology and Corporate Communications.
Corporate Service Staff
Corporate Service Staff refers to those in Finance, Human Resource, Legal, Administration, Information Technology and Corporate Communications.
Commercial Staff Commercial Staff refers to Customer Accounts Manager, Business Analyst and those in Business Development, Sales and Marketing.
Trading Staff Trading Staff refer to System Balance Trader, Position Trader and Quantitative Analyst.
Others Others include Assistant Technician, Semi-skilled Staff and Artisan and other occupations not elsewhere classified.
120 121
GLOSSARY GLOSSARY
Electrician An electrician’s licence entitles the holder to carry out the following electrical work:
(a) design, install, repair, maintain, operate, inspect and test an electrical/ supply installation where the operating voltage of such installation does not exceed 1000 volts and the approved load of such installation does not exceed 45 kVA;
(b) install, repair, maintain and operate, under the supervision of an electrical technician, an electrical / supply installation where the operating voltage of such installation does not exceed 1000 volts and the approved load of such installation is more than 45 kVA but does not exceed 500 kVA; and (c) carry out any work as instructed by or under the supervision of an authorised high voltage switching engineer.
Gas service worker A gas service worker licence entitles the holder to carry out the following gas service work where the operating pressure is not more than 30 mbar:
(a) to construct, fix, alter, repair and renew gas pipes and fittings;
(b) to install, maintain, repair and test gas appliances; and
(c) to install or remove gas meters and to turn-on gas supply on behalf of a gas licensee.
Gas service worker (Restricted)
A gas service worker licence (restricted) entitles the holder to carry out the following gas service work where the operating pressure is not more than 30 mbar:
(a) to install, maintain, repair and test gas appliances; and
(b) to install or remove gas meters and to turn-on gas supply on behalf of a gas licensee.
Cable Detection workers
A licensed cable detection worker is entitled to perform cable detection work.To minimise damages to electricity cables, it is a mandatory requirement to perform cable detection work prior to the commencement of any earthworks.
Cable detection work must be carried out by a licensed cable detection worker. He should inform or advise the earthworks contractor, who engaged him, of the location of the cables detected within the worksite.
Licensed electrical, gas and cable detection workersElectrical Engineer An electrical engineer’s license entitles the holder to carry out
the following electrical work:
(a) design, install, repair, maintain, operate, inspect, test and take full charge and responsibility for any electrical installation.
(b) An electrical engineer’s licence has a range of operation voltage restrictions. They are as follows:-
(i) in operation : “up to 1000 volts” (ii) in operation : “up to 22000 volts” (iii) in operation : “up to 66000 volts” (iv) in operation : “up to 230000 volts” (v) restricted to particular installations.
Electrical Technician
An electrical technician’s licence entitles the holder to carry out the following electrical work:
(a) install, repair, maintain, operate, inspect and test an electrical installation where the operating voltage of such installation does not exceed 1000 volts and the approved load of such installation does not exceed 500 kVA;
(b) design and submit plans and drawings of an electrical installation where the operating voltage of such installation does not exceed 1000 volts and the approved load of such installation does not exceed 150 kVA, except that the limitation of 1000 volts shall not apply in the case of an Electric Discharge Lighting Circuit; and
(c) carry out any work or switching operation as instructed by or under thesupervision of an authorised high voltage switching engineer.
122 123
124
NOTES
Comments on this publication and suggestions forfurther issues of SES are welcome. Please write to:
Research & Statistics UnitPlanning Department
Energy Planning & Development DivisionEnergy Market Authority
991G Alexandra Road #01/02-29Singapore 119975
Republic of Singapore
Email: [email protected]: +65 6835 8000Facsimile: +65 6835 8020