Embed Size (px)
Citation preview
Institutions and EconomiesVol. 5, No. 2, July 2013, pp. 101-130
Singaporean Economic Development and Peculiar Observations on Saving, Labour Share,
Productivity and Current Account Surplus
Toh Mun Heng*Department of Business Policy
National University of Singapore
Abstract: Singapore’s development experience in relation to various crucial phases of its economic development is reviewed in this paper. The first objective is to provide a quick profile of the Singaporean economy’s development history from 1960 to the present. Singapore is often perceived to be an economy that is high in saving rate and current account surplus, low in labour share and productivity. Hence, a second objective is to clarify some popular misconceptions and uncommon phenomena about Singapore’s economy and hence consider its prospects. Its economic development experience is not so unique as to defy the usual laws of economics, but rather, can be a useful reference for other economies to emulate.
Key words: Labor Shares, Economic Restructuring, Consumption Ratio, Total Factor Productivity, Unit Labor Cost, Singapore.
JEL classifications: E61,O47
1. Introduction
This paper reviews the Singaporean development experience in relation to its various crucial phases of economic development. There are two main objectives, the first being to provide a brief profile of the Singaporean economy’s development history from 1960 to the present. An evaluation of the effectiveness or otherwise of the development strategies implemented at different phases of development is attempted. The second objective is to clarify some popular misconceptions about and uncommon phenomena within Singapore’s economy. However, its economic development experience is not so unique that it defies the usual law of economics. Could its development experience be a useful reference for other economies to emulate?
Over the period 1960 to 2011, the gross domestic product (GDP) at constant prices grew at an average of 7.8 per cent per annum. This is more than twice the average growth rate for developed industrialised economies. According to
Toh Mun Heng102
the IMF computation of the GDP per capita measured at Purchasing Power Parity (PPP), Singapore ranked third in the world with US$59,711 in 2011. A statistical summary of macroeconomic indicators is provided in the Appendix.
In this paper, we begin in section 2, with an overview of the economic development strategies adopted by Singapore in emancipation from a regional trading post to a modern industrial economy. Industrialization, foreign investment, export expansion, national innovation system and cooperative labour union play important role in achieving remarkable economic growth. Following that, in section 3, we consider the misconceptions relating to excessive saving, low labour share, low productivity and high current account surpluses observed in the Singapore economy. Section 4 concludes the paper.
2. Singapore’s Economic Development Efforts in Different Phases of Economic Development
Singapore was founded by Sir Stamford Raffles in 1819. A brief summary of the history of Singapore before its independence is tabulated in Table 1.
Table 1: A Brief History of Singapore
Year Key Historical Milestones
1819 Founded by Sir Stamford Raffles who was an executive of the British East India Company
1826 Became part of the Straits Settlements together with Penang and Malacca
1867 The Straits Settlements became a Crown Colony under the British jurisdiction
1942 - 45 The Japanese occupied Malaya and Singapore
1946 Return of British rule; Singapore became a separate Crown Colony in April while Penang and Malacca became a part of the Malayan Union
1958 An agreement for a new Singapore Constitution which provided for full internal self-government was reached with the British in May
1959 The People’s Action Party (PAP) led by Mr Lee Kuan Yew contested the May election and won 43 of the 51 seats and formed the Government
1963 Malaysia, consisting of Malaya, Singapore, Sarawak and North Borneo was formed in September
1965 Separated from Malaysia and proclaimed its independence as a republic on 9 August
Source: Compiled by author.
In the early 1960s, Singapore embarked on an industrialisation drive to jumpstart its economy, which at that time had a high unemployment rate together with high birth rate and was mired in uncertainty regarding its future as an entrepôt to the region. Faced with a lack of local industrial entrepreneurs and a small domestic market, the country had to rely on foreign capital, technology,
103Singaporean Economic Development and Peculiar Observations on Saving, Labour Share, Productivity and Current Account Surplus
and management techniques as well as access to the world market to move into an alternative economic niche.
The primary institution to drive Singapore’s industrialisation program is the Economic Development Board (EDB) set up in 1961. Following the recommendation by the World Bank, an import substitution strategy was adopted to jump start the industrialisation program. Major infrastructure, like the Jurong Industrial Estate, was developed earnestly in 1961 to attract and house foreign and local manufacturing industries. To help earn much needed foreign exchange and to give the tourism industry a lift, the Singapore Tourism Promotion Board (STPB) was formed in 1964. In spite of some political turbulence, such as the confrontation with Indonesia, and Singapore’s inclusion and expulsion from Malaysia, the Singaporean economy managed to stutter with some respectable growth. Between 1960 and 1965 (the year in which Singapore become an independent sovereign), GDP growth averaged 5.7 per cent per annum during this period and the manufacturing sector’s share of GDP grew from 15 per cent in 1960 to 18 per cent in 1965.
In the subsequent sub-sections, we delineate the major economic policies and institutional changes made in each decade to foster economic growth amidst changing local and international conditions.
2.1 The Economy from Independence to the 1970s
As an independent nation in 1965, Singapore could not rely on the pan-Malayan market to sustain its industrialisation drive. It turned to an export-led industrialisation strategy, inviting foreign capital, technology and management know-how to supplement the dearth of domestic capital, weak entrepreneurship and technological competence. Where necessary, the government participated in joint ventures with private enterprises in areas where the private sector lacked capital or expertise. It did not shy away from investing in business fields that are crucial for Singapore’s long term interest as a regional logistic centre and financial hub. Government linked companies (GLCs) such as Singapore Airlines, Neptune Orient Lines, Keppel Shipyard, Sembawang Shipyard and the Development Bank of Singapore have become well known entities in the business world. Foreign exchange controls were removed and various financial incentives introduced. The Asian Dollar Market, an offshore banking sector whose transactions are primarily US$ denominated was established in 1968.
Measures to ensure orderly and peaceful industrial relations and hence an improved labour climate and investment environment included legislating an industrial relations system providing for the restoration of the management’s common law rights and procedures for the prevention and speedy settlement of disputes. The Employment Act (1968) was enacted to lay down standards of employment to help resolve industrial disputes. The National Trades Union
Toh Mun Heng104
Congress (NTUC) was also formed to help promote better labour-management relations. With the relaxation of immigration laws, more than 100,000 foreign workers (most of whom were Malaysians) supplemented the domestic workforce of 700,000 by 1973. In addition, it was recognized that the creativity culture and innovation system were weak, and remedial and uplifting effects could be derived from boosting R&D capabilities.
2.1.1 Successful Export-Oriented Industrialisation in the 1970s
The Singapore Government’s industrialisation strategy in the 1960s and 70s had met with success judging from the following evidence:• high GDP growth (real GDP grew by 8.9 per cent per annum during the
period 1970-79);• large absorption of foreign direct investment (FDI) during this period
(an average of US$0.3 billion yearly making it the fifth largest recipient among developing countries);
• manufacturing became the largest sector with its share of GDP rising from 23 per cent in 1970 to 27 per cent in 1979;
• exports of goods made in Singapore became more important than re-exports, rising from 39 per cent of total exports in 1970 to 59 per cent in 1979;
• the financial sector grew rapidly, with the Asian Dollar Market growing from US$31 million in 1968 to US$38 billion in 1979;
• the commerce sector grew rapidly from a new source – tourism, where the number of visitors grew from 500,000 in 1970 to 2.2 million in 1979;
• unemployment fell from 6.0 per cent in 1970 to 3.3 per cent in 1979, during which period a total of 430,000 new jobs were created, with the manufacturing sector generating nearly half, while full employment was attained in the early 1970s.
2.2 The Economy undergoing Restructuring in the 1980s
Driven by the decline in domestic labour supply, competition from resource abundant low-cost developing neighbouring countries which were moving into labour intensive export oriented manufacturing, and by the threat of rising protectionism in industrialised countries, the Singapore Government decided to restructure its economy in 1979 toward higher value-added activities. In particular, the focus shifted to transforming the economy into one which is high in skill content, high technology and more capital intensive.
With the help of the National Wage Council (NWC),1 a three-year wage correction policy to reflect the tight labour market was introduced to induce
105Singaporean Economic Development and Peculiar Observations on Saving, Labour Share, Productivity and Current Account Surplus
efficient use of labour. Employers are required to contribute to the Skill Development Fund (SDF) established in 1979. The SDF’s primary objective is to encourage employers to invest in workforce skills upgrading. The fund would reimburse employers with 70 per cent of the cost of retraining workers in selected activities. A foreign worker levy was introduced in 1982 to discourage excessive reliance on foreign workers. Moreover, a computerisation program initiated within government ministries was designed to catalyse the adoption and use of information technology and computers in the private sector. A cluster development concept was adopted to manage and develop the portfolio of manufacturing industries in the economy. In cluster development, industrial strategy is refined to leverage on synergies at the firm and industry levels. Mutually supporting industries were identified and developed to entrench entire clusters in niche areas, e.g. electronics, petrochemical and engineering. By competing on the basis of clusters, Singapore could formulate cluster development plans with emphasis on core capabilities that were common to industries within the cluster (Low and Toh, 1993).
In 1985 Singapore’s economy went into a severe recession contracting by 1.4 per cent. This was attributed to stiff overseas competition and a severe reduction in external demand in the ship building and oil refining industries, as well as high domestic unit labour costs. In 1986 the economy grew by only 2.1 per cent. In March 1985 the Government appointed an Economic Committee to review progress of the economy and to identify new directions for its future growth. The Report of the Economic Committee recommended that Singapore become as developed economically as the West by the 1990s and yet more competitive. It proposed ways in which to prepare for this. Its recommendations for education and training included:1. upgrading the median educational level of the workforce (in 1980, 72.6
per cent had only primary or no education, and only 3.5 per cent had university education);
2. providing continuous training and retraining of the workforce; and 3. expanding and improving education at the post-secondary and tertiary
levels, and increasing their intake in particular.
Adopting the recommendations on training, the Government moved to upgrade the education and skills of the existing workforce (Low et al., 1991). A series of national programmes was implemented through national training agencies like the Vocational and Industrial Training Board (later renamed the Institute of Technical Education) and the National Productivity Board (subsequently renamed the Productivity and Standards Board and most recently, SPRING).
Toh Mun Heng106
2.2.1 Emphasis on R&D Capability
To support economic restructuring, greater emphasis was placed on developing Singapore’s R&D capability. An emphasis on science and technology had already begun in 1968 when the Ministry of Science and Technology was established to promote the role of science and technology in the education system and the economy. In 1967 the Singapore Science Council was established as an advisory body on manpower training and R&D in industry. The Ministry was disbanded in 1981. The issue of developing R&D capability was the subject of the report of the Economic Committee. Its recommendations included: developing competence in information technology, biotechnology, robotics and artificial intelligence, microelectronics, laser technology and optics and communications technology; the establishment of centres of competence in selected areas; greater community-industry interaction; and expansion of post-graduate education to train more research scientists and engineers.
As a result, a number of high technology research oriented institutes were set up including the Institute of Systems Science, the Institute of Molecular and Cell Biology, the Industrial Collaboration Centre of the National University of Singapore’s Science Faculty, and the Innovation Centre of the National University of Singapore’s Engineering Faculty. Interaction between tertiary institutions, the Government and MNCs increased. The National University of Singapore forged new links with outside organisations and set up joint research committees with the Ministry of Trade and the Ministry of National Development. A Science Park was established to facilitate R&D activities. To boost R&D manpower, the National University of Singapore expanded its Master and Doctoral programmes. In 1987 its intake of post-graduate students increased by 12 per cent over the previous year.
2.2.2 Successful Economic Restructuring in the 1980s
The economic restructuring efforts in the 1980s had met with success. By the later part of the decade, the economy had recovered and grew at 9.7 per cent per annum from 1987 to 1989. This meant that the economy grew at the rate of 7.5 per cent per year for the 1980s. Singapore was the largest recipient of FDI among developing countries, receiving an average of US$2.3 billion per year.
Manufacturing remained the largest sector, accounting for 26.3 per cent of GDP in 1990. The trend was for the development of manufacturing services like testing, financing, warehousing and purchasing. Existing labour intensive industries like the consumer electronics and furniture industries upgraded and/or relocated parts of their operations to neighbouring countries. New industries like petrochemicals, biotechnology, aerospace, and information technology were set up. The financial and business services sector grew to 26 per cent of GDP.
107Singaporean Economic Development and Peculiar Observations on Saving, Labour Share, Productivity and Current Account Surplus
Tax incentives were given by the Government for the setting up of an overseas headquarter (HQ) centre and international purchasing offices.
At the end of the 1980s, one of the biggest achievements was that the unemployment rate was at 1.8 per cent, a record low and envied by many countries. Some 346,000 new jobs were created in the 1980s. Sources of new employment were more diversified – not just manufacturing but also commerce and the financial and business services sector. Professional, technical, administrative and managerial workers formed 18.5 per cent of the total workforce in 1988 compared to 13.7 per cent in 1980. The number of blue collar workers declined from 40.4 per cent in 1980 to 35.3 per cent in 1988. White collar workers like clerks and sales and service personnel rose to 40.9 per cent in 1988 from 38.2 per cent in 1980.
Upgrading of the economy bore fruits. Productivity growth was 5.0 per cent per annum in the 1980s compared to 4.3 per cent per annum in the 1970s. It accounted for a larger share of economic growth, 55 per cent in the 1980s compared to 45 per cent in the 1970s.
There was also a marked improvement in the quality of the workforce. In 1970 some 83.6 per cent of the labour force had less than secondary education. In 1990 the proportion fell to 53.6 per cent. The percentage of those with university education rose from 2.4 per cent in 1970 to 6.0 per cent in 1990 (Tan, 1997).
Steady progress in R&D was made during the period 1978-1990. National R&D expenditure rose from 0.2 per cent of GDP in 1978 to 1.0 per cent of GDP in 1990. The number of people doing R&D work was 7,004 in 1990, up from 1,672 in 1978. The proportion of research scientists and engineers was 61 per cent in 1990 compared to 49 per cent in 1984. In terms of research scientists and engineers per 10,000 labour force, the number increased from 8 in 1978 to 78 in 1990.
2.3 The Economy in the 1990s and Beyond
The decade of 1990s is often named as a decade of triumph for capitalism. Privatization, corporatization and marketization became new ‘buzz’ words. Hyper growth performances by several East Asian economies highlighted by the Word Bank report were heralded as growth miracles. Yet before the decade ended, the Asian Financial Crisis in 1997, somewhat overturned the notion of miracles into mirages. More crises followed in the 2000s. These make steering an economy for further growth even more challenging and uncertain.
2.3.1 The Economy in the 1990s
The 1990s presented a different set of challenges to Singapore. Internationally, there was the fall of the Berlin Wall, the Washington Consensus (the slant toward
Toh Mun Heng108
capitalism and markets), the Rise of China (with imminent return of Hong Kong to China in 1997 as a Special Administrative Region), the completion of the Uruguay Round and the problem of an ageing society in Asia and Singapore. Globalisation was getting more intense with FDI rising to an all-time high while domestically Singapore’s low Total Factor Productivity became a talking point. In addition, regional economic integration and regionalisation2 as a strategy to expand Singapore’s economic space and promoting entrepreneurship were topical issues. Worst of all, the East Asian Miracle and promising capitalism was dealt a severe blow by the 1997 Asian Financial Crisis.
Having successfully transformed its economy in the 1980s, Singapore progressed on this basis to guide it into the next decade. In October 1991, the Government published the Strategic Economic Plan as its national guide for Singapore’s next phase of economic development (Ministry of Trade and Industry, 1991). The Strategic Economic Plan sets out eight strategic thrusts to turn the Republic into a first league developed nation within the next 30 to 40 years. Singapore aims to catch up (on a moving target basis) with the GNP per capita of the US by 2030 or the Netherlands by 2020. These strategic thrusts are: enhancing human resources; promoting national teamwork; becoming internationally oriented; creating a climate conducive to innovation; developing manufacturing/service clusters; spearheading economic redevelopment; maintaining international competitiveness and reducing vulnerability (Tow and Tan, 1998).
The key features of Singapore’s economic strategy in the 1990s were:• Singapore’s aspiration to be a Knowledge-Based Economy;• an emphasis on both the manufacturing and service sectors; • encouragement of local enterprises to diversify, upgrade and develop into
strong export oriented companies;• promotion of regional investments; and• advocacy of regionalisation to encourage leveraging on the potential of
the Asian markets in order to overcome local resource/market constraints and complement Singapore’s established links to the OECD countries.
The rationale for promoting manufacturing and services as twin pillars of the economy was to diversify Singapore’s sectoral and market dependency, reduce vulnerability, and promote a broader base for the economy (Low et al., 1993). For this purpose, many incentives offered for manufacturing investments, e.g. pioneer status, investment allowances, were also extended to investments in service sectors.
Since the last recession in 1985, GDP growth averaged 8.6 per cent per annum during the period from 1986 to 1997. Share of financial and business
109Singaporean Economic Development and Peculiar Observations on Saving, Labour Share, Productivity and Current Account Surplus
services sectors in total GDP grew from 21 per cent in 1986 to 26 per cent in 1997. The number of research scientists and engineers grew from 3,361 in 1987 to reach 11,302 in 1997. Stock of direct investments abroad increased from $16.9 billion in 1990 to reach $75.8 billion in 1997.
In July 1997, the Singapore economy was hit by the regional crisis that started with the devaluation of the Thai Baht. Although its financial and economic fundamentals were sound, the rapidly deteriorating external environment adversely affected Singapore due to its close linkages with the regional economies. The Singapore economy contracted 1.4 per cent in 1998, after achieving 8.3 per cent growth in 1997. It recovered rapidly to record GDP growth of 7.2 per cent in 1999 and 10.1 per cent in 2000.
2.3.2 Science and Technology Policy
To guide the economy through the next phase, in 1991 the Government set up the National Science and Technology Board. The National Technology Plan 1991 (outlining a comprehensive and coordinated national strategy for R&D for the next 5 years) was produced in the same year. This plan emphasised the role of R&D in providing industrial competitiveness. A list of selected technologies, identified by the Economic Committee, was expanded to include food and agro-technology, manufacturing technology, materials technology and medical sciences. The major recommendations within the plan were:
• establishment of a S$2 billion R&D fund to promote industry driven R&D;
• provision of grants and fiscal incentives to encourage more private sector R&D;
• assistance in the development and recruitment of R&D manpower; • support for the establishment and funding of research institutes and centres;
and • help in infrastructure support and the commercialisation of research
findings.
Three targets were set for achievement by 1995: a national R&D expenditure of 2 per cent; 50 per cent private sector share of total R&D expenditure; and a ratio of 40 research scientists and engineers per 10,000 working people.
Considerable progress was achieved in R&D from 1991 to 1995. National expenditure for R&D rose to 1.12 per cent in 1994, short of the target of 2 per cent. However the number of research scientists and engineers per 10,000 workers reached 41.9 in 1994. In 1994 the contribution of the private sector toward total R&D expenditure was 62.7 per cent.
Toh Mun Heng110
A technology infrastructure of 13 research institutes and centres to support R&D by industry has been set up. Virtually all these research institutes and centres were associated with the two universities: National University of Singapore and Nanyang Technological University. Strategic research and R&D relevant to Singapore’s economic strategy were fostered in the two universities. A network of international linkages for collaborative R&D was established.
In August 1996, the National Science and Technology Board announced its National Science and Technology Plan (NSTP) 2000 for the next 5 years. The vision for the next 10-15 years is for Singapore to build world class science and technology capabilities in areas which best support the Republic’s key industries and spur the growth of new high value added industries. An R&D Fund of S$4 billion was provided.
According to the NSTP 2000, by the year 2000, the Gross R&D Expenditure (GERD) should have been 1.6 per cent of GDP while the number of research scientists and engineers (RSEs) per 10,000 working population would be about 65. These targets were exceeded as the GERD to GDP ratio was 1.89 per cent and the number of RSEs per 10,000 labour force was 66.1.
The NSTP 2000 identified four main challenges in R&D:
1. Meeting the demand for manpower. Another 5,000 research scientists and engineers will be needed for the next 5 years to help set up world class research laboratories, lead complex R&D programmes and train local R&D personnel.
2. Strengthening technological capability. More resources will be spent to deepen and expand the R&D capabilities in areas which will best help key industries to pre-position themselves for the next generation of products and processes. By the year 2000 the two universities should have 12-15 first class research centres.
3. Making it conducive for industry to undertake R&D. For short term technologies, co-funding by government will be up to 50 per cent while for projects strategic to the economy, the funding can be more. The Economic Development Board launched in 1995 a S$500 million Innovation Development Scheme to promote innovation projects in both service and manufacturing companies. Companies can apply to defray up to 70 per cent of the cost of innovation projects.
4. Fostering technology innovation and commercialisation. A process to match technological innovations to industry requirements will be evolved and an environment conducive to technological start-ups developed.
The NSTP 2000 was met with varying degrees of success. The total R&D expenditure for the year 2000 was S$3 billion, up from S$1.8 billion
111Singaporean Economic Development and Peculiar Observations on Saving, Labour Share, Productivity and Current Account Surplus
in 1996. However, from 1996 to 2000, a net total of 4,330 RSEs were added and the proportion of postgraduate researchers was 46.7 per cent, lower than the targets set. In terms of patents awarded, there was an increase from 91 in 1996 to 239 in 2000.3
2.3.3 The Economy in the New Millennium
The starting decade of the New Millennium was no less eventful than the closing decade of the 20th Century. The Y2K problem which was expected to pervade the cyber world linked by PCs and the Internet apparently passed without much harm. What was perhaps more serious in its place was the global slump in the demand for electronic goods following the dot.com bust in 2001. With more than 40 per cent of industrial output and 60 per cent of domestic export dependent on electronic products, Singapore was hit by another recession in 2001. The synchronised downturns in the major developed economies as well as the global electronics industry led to a sharp deceleration in global growth. The terrorist attacks on 11 September 2001 further aggravated the slowdown. As a result, Singapore’s GDP fell by 2.4 per cent, down from 10.1 per cent growth in 2000. The rise of large new players like China and India brought both challenges and opportunities.
In October 2001, Prime Minister Goh Chok Tong announced the establishment of the Economic Review Committee (ERC) to fundamentally review the development strategy and formulate a blueprint to restructure the economy, amidst effort made to ride out the ensuing recession. After two years of deliberation and intensive consultation, the ERC Report presented 6 key strategies for guiding the growth and development of the Singapore economy over the next 15 years.
In the 21st Century, Singapore aims to become a globalised, entrepreneurial and diversified economy, with economic growth of 3-5 per cent per annum over the medium term. There is a need to develop new growth industries. The key strategies are (Ministry of Trade and Industry, 2003):
• Expanding external ties – embracing globalisation through the multilateral trading framework of the WTO and regional co-operation inclusive of bilateral Free Trade Agreements.
• Maintaining competitiveness and flexibility – keeping the burden of taxes and the Central Provident Fund on the economy as low as possible, reviewing the labour market and wage system to make them more flexible, and pricing factors of production competitively.
• Promoting entrepreneurship and domestic companies – encouraging people to be innovative and improving the ability of firms to develop new
Toh Mun Heng112
ideas and businesses, tap new export markets and broaden their economic base.
• Growing manufacturing and services – upgrading these sectors by improving cost competitiveness, equipping the labour force with relevant skills, and developing new capabilities and industries.
• Developing human capital – investing in education, helping workers train and upgrade, and welcoming global talent to augment the indigenous talent pool. A continuous education and training (CET) framework for workers to be established.4
To be a diversified economy, the Government embarked on identifying new key engines of growth for the economy in the 21st Century. Concerted efforts are put in by the many government ministries and main agencies to implement the strategies delineated.
Expanding External TiesAn island state very dependent on trade for economic survival, Singapore is fully committed to an environment where trade and investments flow freely and unfettered. A rule-based trading environment is one that will ensure fair treatment of all traders, big and small. With the limited progress seen in the global multi-lateral trade liberalisation championed by the WTO, Singapore had embarked on a very intensive program to establish bilateral free trade agreements with its trading partners. The existing ASEAN Free Trade Agreement (AFTA) is an important first step for regional economic integration though there is still much more that can be done. FTAs are superhighways that connect Singapore to major economies and new markets. With FTAs, Singapore-based exporters and investors stand to enjoy a myriad of benefits like tariff concessions, preferential access to certain sectors, faster entry into markets and Intellectual Property (IP) protection (IES, 2006). In fact, Singapore is the most ‘promiscuous’ country in the world in establishing free trade agreements (Toh, 2006). Singapore is well-connected to the world through our extensive network of FTAs. It has so far concluded 18 Regional and Bilateral FTAs, and is actively negotiating 10 more. In terms of economic output, the 83 FTA partners together account for over 50 per cent of the world’s GDP. They also represent most of Singapore’s major trading partners, accounting for more than 30 per cent of its domestic exports.
The Search for New Growth Engines: Science and Technology Based Industries The agency for Science, Technology and Research (A*STAR, formerly known as the National Science and Technology Board) comprises 12 Research Institutes (RIs), with five under the Biomedical Research Council (BMRC) and seven under the Science and Engineering Research Council (SERC). A*STAR has a
113Singaporean Economic Development and Peculiar Observations on Saving, Labour Share, Productivity and Current Account Surplus
rich talent pool of more than 1,800 Research Scientists and Engineers, half of whom have PhD training. These researchers come from over 50 countries in the world (A*STAR, 2010).
A*STAR is tasked to chart the course for Singapore’s Science and Technology R&D. One such area is biomedical sciences. Established in October 2000, the Biomedical Research Council (BMRC) supports, oversees and coordinates public sector biomedical research and development activities in Singapore. Together with the EDB, the BMRC is to develop Singapore into the Biopolis of Asia – an international biomedical sciences hub advancing human healthcare, through the pursuit of excellence in R&D, manufacturing, and healthcare delivery.
The Info-communications Development Authority of Singapore (IDA) has a national role to identify and facilitate the adoption of specific strategic info-comm technologies to enhance Singapore’s competitiveness (IDA, 2010). By 2012, Singapore will have the Next Generation Broadband Network in place. This network is expected to stimulate the creation of new enterprises and new products.
Worldwide, the creative cluster (arts and culture, design and media) has been observed to be among the fastest growing sectors of developed economies such as the UK and the US. Creative industries not only contribute toward the economy directly, they also have a powerful, indirect impact on the rest of the economy – by adding style, aesthetics and freshness to differentiate our products and services. To succeed and thrive, Singapore must tap into the creative cluster (arts and culture, design, media) and recognise them as one of the vanguards of economic growth. Singapore planners have exercised initiative and creativity in combining entertainment, casino, theme park, convention and life style pursuit – the building of two mega Integrated Resorts in Singapore. These are expected to draw in another 5-8 million visitors and to give the tourism sector and the economy another new lease of life.
The emphasis on technology remains pertinent for continued growth and sustainability. The National Technology Plan (NTP) implemented since 1995 was reviewed and continued with a new agenda and new targets under the NTP II launched in 2005. In particular, the target for Gross expenditure on R&D (GERD) is 3 per cent of GDP by 2010, a level that is prevalent among developed industrialised economies. Between 1990 and 2007, gross expenditure on R&D (GERD) increased from 0.85 per cent to 2.36 per cent of GDP and 66.5 per cent of GERD is contributed by the private sector. Researchers, Scientists and Engineers (RSEs) per 10,000 labour force have increased from 28 to 90 during the same period.
Perhaps the first decade of the Millennium in Singapore is best remembered for the breakthrough in ‘NEWater’. The Singapore Water Reclamation Study
Toh Mun Heng114
(NEWater Study) was initiated in 1998 as a joint initiative between the Public Utilities Board (PUB) and the Ministry of the Environment and Water Resources (MEWR). The primary objective of the joint initiative was to determine the suitability of using NEWater as a source of raw water to supplement Singapore’s water supply. NEWater is treated used water that has undergone stringent purification and treatment process using advanced dual-membrane (microfiltration and reverse osmosis) and ultraviolet technologies. NEWater and desalination were explored as means to reduce reliance on water imported from Malaysia, which has been a source of friction over the years.5 The water friction with Malaysia has helped to spawn a new industry ‘Environment and Water Treatment’ (EWT). This industry includes key players like Hyflux and Chevron, and they have expanded their business domestically and abroad in China, Middle East and Africa.
3. Clearing some Myths and Misconceptions about the Singapore Economy
3.1 Low Consumption Ratios
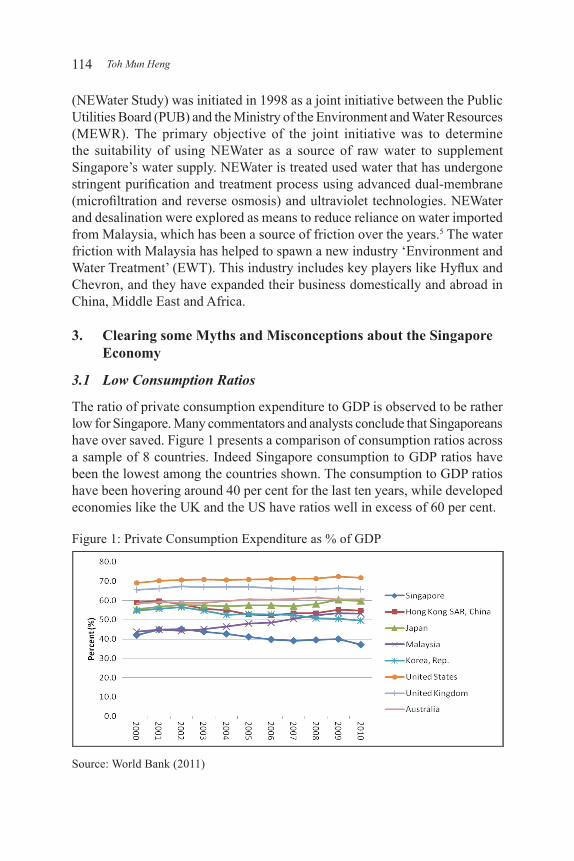
The ratio of private consumption expenditure to GDP is observed to be rather low for Singapore. Many commentators and analysts conclude that Singaporeans have over saved. Figure 1 presents a comparison of consumption ratios across a sample of 8 countries. Indeed Singapore consumption to GDP ratios have been the lowest among the countries shown. The consumption to GDP ratios have been hovering around 40 per cent for the last ten years, while developed economies like the UK and the US have ratios well in excess of 60 per cent.
Figure 1: Private Consumption Expenditure as % of GDP
Source: World Bank (2011)
115Singaporean Economic Development and Peculiar Observations on Saving, Labour Share, Productivity and Current Account Surplus
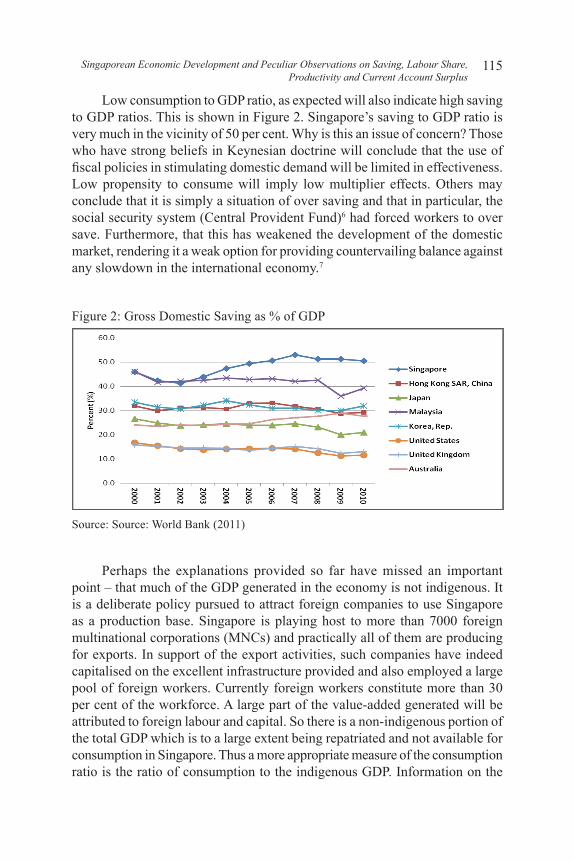
Low consumption to GDP ratio, as expected will also indicate high saving to GDP ratios. This is shown in Figure 2. Singapore’s saving to GDP ratio is very much in the vicinity of 50 per cent. Why is this an issue of concern? Those who have strong beliefs in Keynesian doctrine will conclude that the use of fiscal policies in stimulating domestic demand will be limited in effectiveness. Low propensity to consume will imply low multiplier effects. Others may conclude that it is simply a situation of over saving and that in particular, the social security system (Central Provident Fund)6 had forced workers to over save. Furthermore, that this has weakened the development of the domestic market, rendering it a weak option for providing countervailing balance against any slowdown in the international economy.7
Figure 2: Gross Domestic Saving as % of GDP
Source: Source: World Bank (2011)
Perhaps the explanations provided so far have missed an important point – that much of the GDP generated in the economy is not indigenous. It is a deliberate policy pursued to attract foreign companies to use Singapore as a production base. Singapore is playing host to more than 7000 foreign multinational corporations (MNCs) and practically all of them are producing for exports. In support of the export activities, such companies have indeed capitalised on the excellent infrastructure provided and also employed a large pool of foreign workers. Currently foreign workers constitute more than 30 per cent of the workforce. A large part of the value-added generated will be attributed to foreign labour and capital. So there is a non-indigenous portion of the total GDP which is to a large extent being repatriated and not available for consumption in Singapore. Thus a more appropriate measure of the consumption ratio is the ratio of consumption to the indigenous GDP. Information on the
Toh Mun Heng116
indigenous GDP is available in the Annual Yearbook of Statistics. Table 2 presents information on the indigenous GDP and its relative size with respect to the total GDP. As shown in the Table 2, the share of indigenous GDP in total GDP has declined over the years from about 68% in 1990 to 56% in 2011. We can write the consumption ratio PCE/GDP as
PCE = PCE x Ind-GDPGDP Ind-GDP GDP
A low PCE/GDP ratio can be attributed to the low share of indigenous GDP in total GDP.
Table 2: Total GDP, Indigenous GDP and Private Consumption Expenditure (PCE), 1990 to 2011
Overall GDP at Current
Prices
Indigenous GDP at Current Prices
Indigenous GDP as %
of Total GDP
Private Consumption
(PCE)
PCE as % of GDP
PCE as % of
Indigenous GDP
S$ Million S$ Million % S$ Million % %
1990 66,778 45,291 67.8 30,905.4 46.3 68.1
1995 119,470 80,719 67.6 50,488.4 42.3 62.6
2000 159,840 100,181 62.7 67,526.5 42.2 67.4
2005 201,313 116,437 57.8 89,786.9 40.6 70.2
2010 310,037 177,829 57.4 128,684.3 38.4 66.9
2011 326,832 182,604 55.9 89,786.9 39.4 70.5
Source: Author’s calculations and Singapore Yearbook of Statistics, various years.
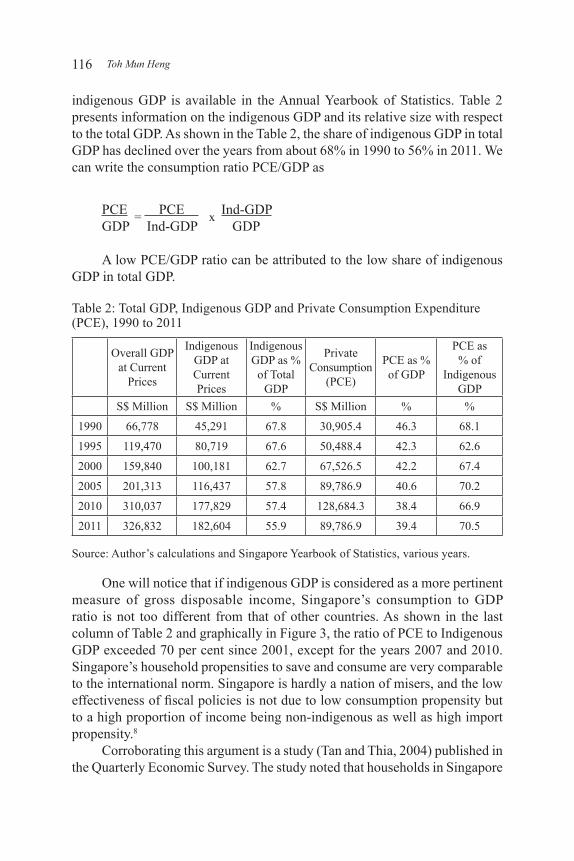
One will notice that if indigenous GDP is considered as a more pertinent measure of gross disposable income, Singapore’s consumption to GDP ratio is not too different from that of other countries. As shown in the last column of Table 2 and graphically in Figure 3, the ratio of PCE to Indigenous GDP exceeded 70 per cent since 2001, except for the years 2007 and 2010. Singapore’s household propensities to save and consume are very comparable to the international norm. Singapore is hardly a nation of misers, and the low effectiveness of fiscal policies is not due to low consumption propensity but to a high proportion of income being non-indigenous as well as high import propensity.8
Corroborating this argument is a study (Tan and Thia, 2004) published in the Quarterly Economic Survey. The study noted that households in Singapore
117Singaporean Economic Development and Peculiar Observations on Saving, Labour Share, Productivity and Current Account Surplus
are already spending 80 per cent of their disposable income. Unfortunately time series information on disposable income in Singapore is unavailable.
Figure 3: Ratio of PCE to Total GDP and to Indigenous GDP
Source: Author’s calculations and Singapore Yearbook of Statistics, various years
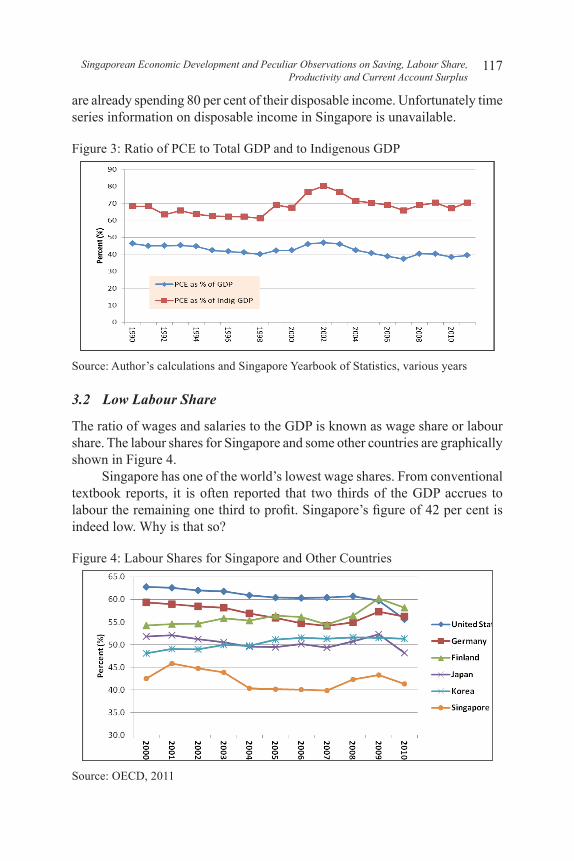
3.2 Low Labour Share
The ratio of wages and salaries to the GDP is known as wage share or labour share. The labour shares for Singapore and some other countries are graphically shown in Figure 4.
Singapore has one of the world’s lowest wage shares. From conventional textbook reports, it is often reported that two thirds of the GDP accrues to labour the remaining one third to profit. Singapore’s figure of 42 per cent is indeed low. Why is that so?
Figure 4: Labour Shares for Singapore and Other Countries
Source: OECD, 2011
Toh Mun Heng118
One argument is that the low wage share is the price to be paid by Singapore in order to have foreign capital residing in the economy. Capital is awarded almost 60 per cent of the GDP, 27 percentage points above the conventional figure of 33 per cent observed in the developed economies. Perhaps a more serious structural ‘defect’ is present to perpetuate the situation of low wage share.
The definition of unit labour cost (ULC) is simply the ratio of nominal wage to average labour productivity. So ULC =
WY/L
, where W is the nominal
wage rate and (Y/L) is the output (Y) per worker (L).On the other hand the wage share (Sw) is simply the ratio of wage bill (WL) to
value of the output (PY). That is, Sw = WLPY =
1P( ) W
Y/L( )= 1P( ) ULC
Hence, we can write ULC = PSw = Price x Wage Share
For a small open economy, the general price level is considered as fixed as it is determined by external market forces. When competing for international capital, getting MNCs to Singapore based on having a low ULC is synonymous with having a low wage share. So a low wage share is both a strategic decision and a consequence.
In order to have a lower ULC, that means either having lower W (nominal wage rate) or higher labour productivity. It is relatively more difficult to achieve higher productivity than to have lower W. One avenue for having a lower W is to allow the employment of cheap foreign workers. Alas! This is the beginning of a vicious cycle as a lower nominal wage rate through having more foreign workers, in turn leads to lower labour productivity which makes employers yearn for more cheap labour and more foreign workers.
One would argue that the ends justify the means. It may be a prudent strategy to get foreign capital into the economy by having the workers (especially local workers) making some sacrifice. The sacrifice may be ‘sustainable’ if the government is able to make use of the return from capital or taxation from capital to compensate the workers. However, this is very much curtailed if the companies are not owned by the government, and cross country competition would have pushed the tax revenue down when low corporate tax rates together with tax holidays are used as incentives for attracting and promoting investment. This shift into more capital- and skill-intensive activities, dictated by market forces as well as deliberate state strategy, probably increased income inequality by raising the returns to capital relative to the returns to labour, especially low-skilled labour.
What are the empirical evidences for such an ‘adverse’ scenario in Singapore? Table 3 presents the relative change in the ULC for the Singapore

119Singaporean Economic Development and Peculiar Observations on Saving, Labour Share, Productivity and Current Account Surplus
economy and the Manufacturing sector for the period 2006 to 2010. During that period, the economy wide ULC has increased by 2.0 per cent per annum and this is resulting from a wage growth of 2.4 per cent and productivity improvement of only 0.4 per cent. The performance of the manufacturing sector is somewhat better. The manufacturing ULC declined by 1.1 per cent per annum attributed to a productivity growth of 2.0 per cent and wage growth of 0.9 per cent. Nonetheless, the apparent good performance of the manufacturing sector is much influenced by the exceptional productivity improvement recorded for 2010. Closer scrutiny of data reviewed that the positive productivity shock is more of a technical adjustment following the global spillover of the US sub-prime crisis and exceptional (and erratic) performance of the biomedical sector – a ‘rush’ in value-added accompanied by a sluggish and constrained increase in labour employment. Overall, wage adjustment predominates over productivity adjustment in maintaining small increases in ULC.
Table 3: Relative Change in ULC, Nominal Wage and Labour Productivity Growth in ULC
%Growth in W
% Growth in (Y/L)
% TOTAL
EconomyManufacturing
SectorTOTAL
EconomyManufacturing
SectorTOTAL
EconomyManufacturing
Sector2006 1.5 -2.8 3.5 0.3 2.0 3.1
2007 5.8 3.7 5.9 0.6 0.1 -3.1
2008 4.7 13.1 -2.8 1.0 -7.5 -12.1
2009 0.6 -3.9 -2.8 -6.3 -3.4 -2.4
2010 -2.7 -15.8 8.0 8.7 10.7 24.5
Average(2006-10)=
2.0 -1.1 2.4 0.9 0.4 2.0
Note: , ULC =
WY/L
è Growth in ULC = growth in W – growth in Y/LSource: Authors’ calculations.
3.3 Declining Labour Productivity
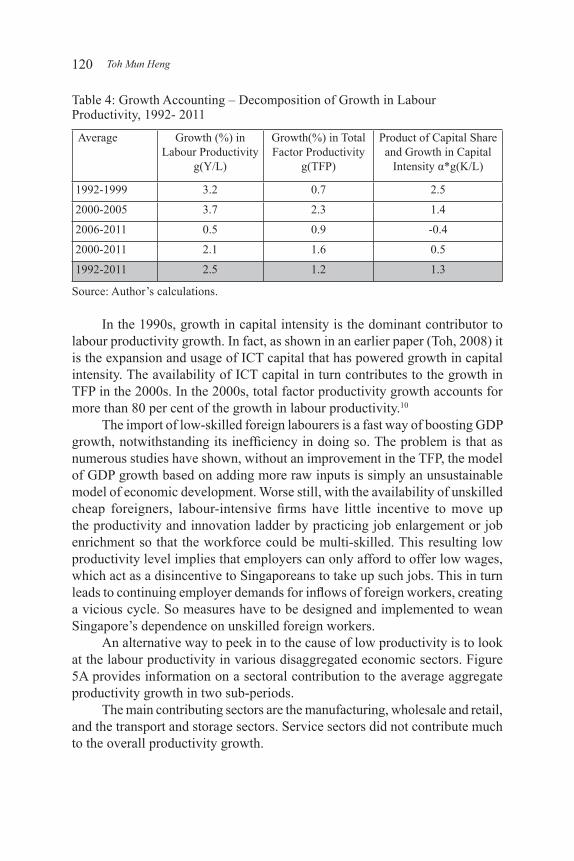
A standard growth accounting exercise usually decomposes the growth of the GDP of an economy into two main components: one that is attributed to growth factor inputs such as labour and capital; the other attributed to total factor productivity (TFP) improvement. Alternatively, the decomposition formula can be written as one that partitions the growth in labour productivity into 2 components: growth in TFP and growth in capital-labour ratio K/L multiplied by the capital share of the economy.9 This is the information presented in Table 4 using data regarding the Singapore economy for the period 1992 to 2011.
Toh Mun Heng120
Table 4: Growth Accounting – Decomposition of Growth in Labour Productivity, 1992- 2011
Average Growth (%) in Labour Productivity
g(Y/L)
Growth(%) in Total Factor Productivity
g(TFP)
Product of Capital Share and Growth in Capital
Intensity α*g(K/L)
1992-1999 3.2 0.7 2.5
2000-2005 3.7 2.3 1.4
2006-2011 0.5 0.9 -0.4
2000-2011 2.1 1.6 0.5
1992-2011 2.5 1.2 1.3
Source: Author’s calculations.
In the 1990s, growth in capital intensity is the dominant contributor to labour productivity growth. In fact, as shown in an earlier paper (Toh, 2008) it is the expansion and usage of ICT capital that has powered growth in capital intensity. The availability of ICT capital in turn contributes to the growth in TFP in the 2000s. In the 2000s, total factor productivity growth accounts for more than 80 per cent of the growth in labour productivity.10
The import of low-skilled foreign labourers is a fast way of boosting GDP growth, notwithstanding its inefficiency in doing so. The problem is that as numerous studies have shown, without an improvement in the TFP, the model of GDP growth based on adding more raw inputs is simply an unsustainable model of economic development. Worse still, with the availability of unskilled cheap foreigners, labour-intensive firms have little incentive to move up the productivity and innovation ladder by practicing job enlargement or job enrichment so that the workforce could be multi-skilled. This resulting low productivity level implies that employers can only afford to offer low wages, which act as a disincentive to Singaporeans to take up such jobs. This in turn leads to continuing employer demands for inflows of foreign workers, creating a vicious cycle. So measures have to be designed and implemented to wean Singapore’s dependence on unskilled foreign workers.
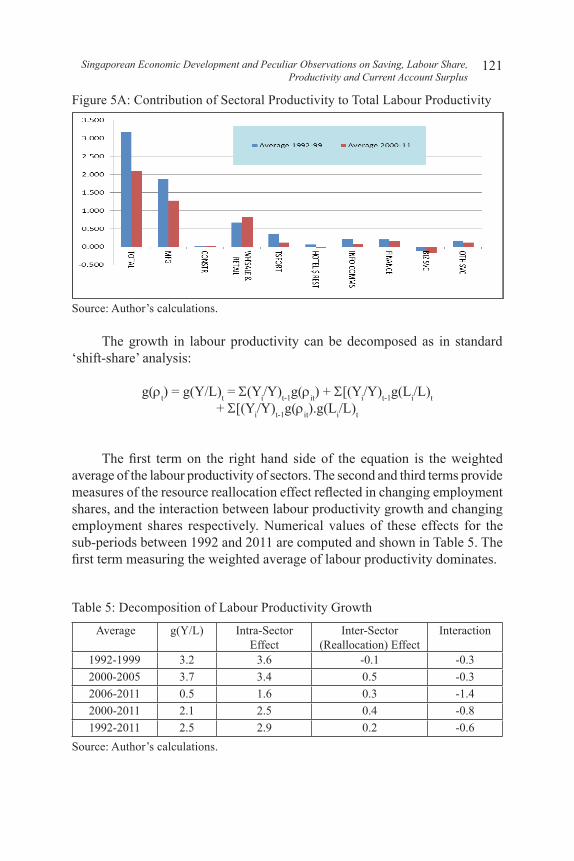
An alternative way to peek in to the cause of low productivity is to look at the labour productivity in various disaggregated economic sectors. Figure 5A provides information on a sectoral contribution to the average aggregate productivity growth in two sub-periods.
The main contributing sectors are the manufacturing, wholesale and retail, and the transport and storage sectors. Service sectors did not contribute much to the overall productivity growth.
121Singaporean Economic Development and Peculiar Observations on Saving, Labour Share, Productivity and Current Account Surplus
Figure 5A: Contribution of Sectoral Productivity to Total Labour Productivity
Source: Author’s calculations.
The growth in labour productivity can be decomposed as in standard ‘shift-share’ analysis:
g(rt) = g(Y/L)t = S(Yi/Y)t-1g(rit) + S[(Yi/Y)t-1g(Li/L)t + S[(Yi/Y)t-1g(rit).g(Li/L)t
The first term on the right hand side of the equation is the weighted average of the labour productivity of sectors. The second and third terms provide measures of the resource reallocation effect reflected in changing employment shares, and the interaction between labour productivity growth and changing employment shares respectively. Numerical values of these effects for the sub-periods between 1992 and 2011 are computed and shown in Table 5. The first term measuring the weighted average of labour productivity dominates.
Table 5: Decomposition of Labour Productivity Growth
Average g(Y/L) Intra-Sector Effect
Inter-Sector(Reallocation) Effect
Interaction
1992-1999 3.2 3.6 -0.1 -0.32000-2005 3.7 3.4 0.5 -0.32006-2011 0.5 1.6 0.3 -1.42000-2011 2.1 2.5 0.4 -0.81992-2011 2.5 2.9 0.2 -0.6
Source: Author’s calculations.
Toh Mun Heng122
Reallocation of resources among sectors for improvement in productivity is still very much lacking. In particular, it points to very limited labour mobility across sectors. The inability to move from one sector into another is also an indication of an inadequate nimbleness and a skill deficiency among workers. In recent years, there is ample evidence that the Info- communication Sector is expanding and yet there is a shortage of workers and hence its expansion is limited or has to be dependent on skilled workers from India and China.
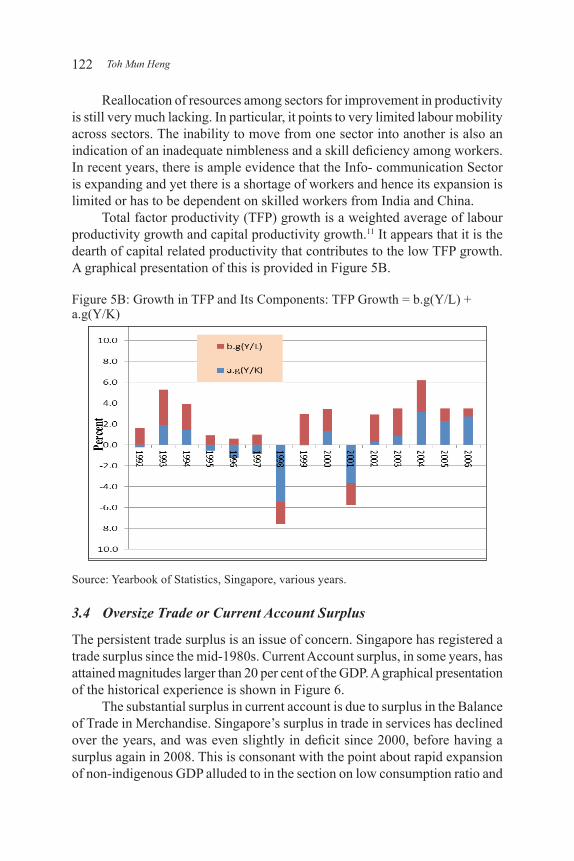
Total factor productivity (TFP) growth is a weighted average of labour productivity growth and capital productivity growth.11 It appears that it is the dearth of capital related productivity that contributes to the low TFP growth. A graphical presentation of this is provided in Figure 5B.
Figure 5B: Growth in TFP and Its Components: TFP Growth = b.g(Y/L) + a.g(Y/K)
Source: Yearbook of Statistics, Singapore, various years.
3.4 Oversize Trade or Current Account Surplus
The persistent trade surplus is an issue of concern. Singapore has registered a trade surplus since the mid-1980s. Current Account surplus, in some years, has attained magnitudes larger than 20 per cent of the GDP. A graphical presentation of the historical experience is shown in Figure 6.
The substantial surplus in current account is due to surplus in the Balance of Trade in Merchandise. Singapore’s surplus in trade in services has declined over the years, and was even slightly in deficit since 2000, before having a surplus again in 2008. This is consonant with the point about rapid expansion of non-indigenous GDP alluded to in the section on low consumption ratio and
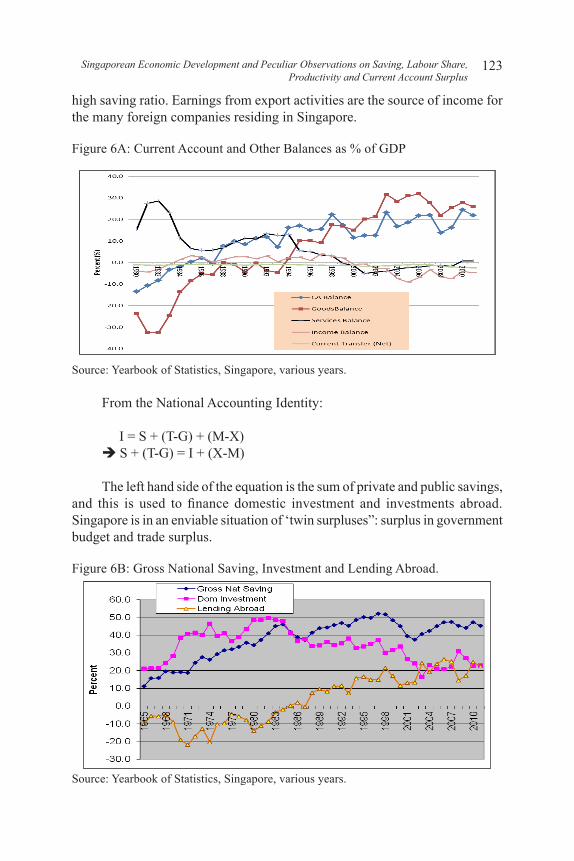
123Singaporean Economic Development and Peculiar Observations on Saving, Labour Share, Productivity and Current Account Surplus
high saving ratio. Earnings from export activities are the source of income for the many foreign companies residing in Singapore.
Figure 6A: Current Account and Other Balances as % of GDP
Source: Yearbook of Statistics, Singapore, various years.
From the National Accounting Identity:
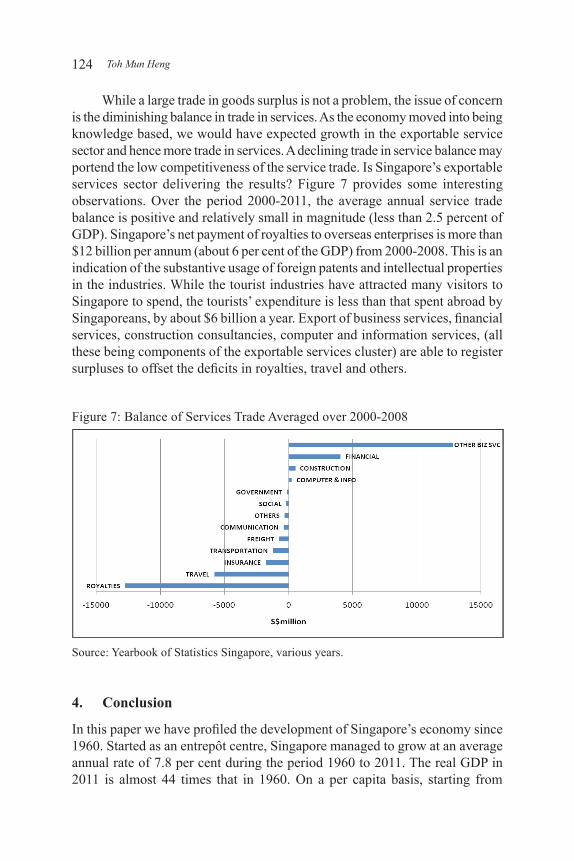
I = S + (T-G) + (M-X)è S + (T-G) = I + (X-M)
The left hand side of the equation is the sum of private and public savings, and this is used to finance domestic investment and investments abroad. Singapore is in an enviable situation of ‘twin surpluses”: surplus in government budget and trade surplus.
Figure 6B: Gross National Saving, Investment and Lending Abroad.
Source: Yearbook of Statistics, Singapore, various years.
Toh Mun Heng124
While a large trade in goods surplus is not a problem, the issue of concern is the diminishing balance in trade in services. As the economy moved into being knowledge based, we would have expected growth in the exportable service sector and hence more trade in services. A declining trade in service balance may portend the low competitiveness of the service trade. Is Singapore’s exportable services sector delivering the results? Figure 7 provides some interesting observations. Over the period 2000-2011, the average annual service trade balance is positive and relatively small in magnitude (less than 2.5 percent of GDP). Singapore’s net payment of royalties to overseas enterprises is more than $12 billion per annum (about 6 per cent of the GDP) from 2000-2008. This is an indication of the substantive usage of foreign patents and intellectual properties in the industries. While the tourist industries have attracted many visitors to Singapore to spend, the tourists’ expenditure is less than that spent abroad by Singaporeans, by about $6 billion a year. Export of business services, financial services, construction consultancies, computer and information services, (all these being components of the exportable services cluster) are able to register surpluses to offset the deficits in royalties, travel and others.
Figure 7: Balance of Services Trade Averaged over 2000-2008
Source: Yearbook of Statistics Singapore, various years.
4. Conclusion
In this paper we have profiled the development of Singapore’s economy since 1960. Started as an entrepôt centre, Singapore managed to grow at an average annual rate of 7.8 per cent during the period 1960 to 2011. The real GDP in 2011 is almost 44 times that in 1960. On a per capita basis, starting from
125Singaporean Economic Development and Peculiar Observations on Saving, Labour Share, Productivity and Current Account Surplus
S$4076 (US$1333) at 2005 constant prices in 1960, it increased steadily to reach S$79,701 (US$60791) in 2011.
Over this period of almost 5 decades, the Singaporean economy has undergone several phases of change to accommodate new demands and challenges posed by international and regional businesses and economic environments. It has shown remarkable adaptability and nimbleness to restructure and re-strategise to ensure economic viability and sustainability.
However, the basic structure and strategies for economic growth are still very much the same – high dependence on trade and foreign capital. In the process, inadvertently it may have placed Singapore into a low wage share trap and stifled the development of the exportable service sectors. The development of a knowledge-based economy, dependent on talent, technology and creativity, continued to be the crucial strategy for continued economic viability.
To face the challenges of the new decade, the government has formed the Economic Strategy Committee (ESC) to chart out a new roadmap for Singapore. On 7 July 2009, the 25-member ESC had its first meeting to consider the key issues it will study, and to set up sub-committees to pursue specific areas of work. The ESC announced its key recommendations on 1 Feb 2010. The Economic Strategies Committee recommended seven broad strategies to help Singapore sustain long-term growth of 3 per cent to 5 per cent over the next decade.
• The seven key strategies are:• growing through skills and innovation • anchoring Singapore as a Global-Asia hub • building a vibrant and diverse corporate ecosystem • making innovation pervasive, and strengthening commercialisation of
R&D • becoming a smart energy economy • enhancing land productivity to secure future growth • building a distinctive global city and an endearing home.
Basically, the intention is to make skill, innovation and productivity the
drivers of economic growth. It recognises that Singapore needs to readjust its economic policies and model to address its over-reliance on the developed markets, the importation of foreign workers and declining productivity.
The ESC reckons that economic growth powered by skills and innovation will need continuous upgrading of skills through retraining, encouraging R&D and investment in technology. The quantity and quality of foreign workers will be managed through phased increases in foreign worker levies. Developing Singapore as a key Global-Asia hub in manufacturing, finance and logistics
Toh Mun Heng126
will facilitate enterprises based in Singapore to tap into opportunities offered by a rising Asia. It will help to develop a deeper base of globally competitive Singaporean enterprises. One encouraging recommendation was the growing of up to 1,000 Singaporean companies with revenues over S$100m by 2020. As part of the effort to establish a robust national innovation infrastructure, the ESC recommends that Singapore’s total expenditure on R&D be raised to 3.5 per cent of GDP by 2015 (compared to 3 per cent currently) by growing private sector R&D. At the same time the emphasis on commercialisation of R&D will be strengthened. To enhance energy security, the ESC recommended looking at the feasibility of nuclear energy, of importing electricity and how to price energy to reflect the real costs in a carbon-constrained world. On the use of land, ESC recommends intensifying land use, particularly for industrial property, and creating underground spaces as possibilities to overcome limits to land scarcity in Singapore.
The ESC recommendations represent a bold strategic shift toward a focus on productivity. It is recommending a paradigm shift away from population-driven or immigration-driven toward productivity-driven economic growth. This shift in paradigm will reduce the potential for economic growth. If the pool of foreign workers were to be capped at one third of the labour force, then job growth may have to slow to a magnitude of probably about 60 to 80 thousand per annum which is quite a drastic decline compared to 150,000 registered for 2009. High GDP growth can still be attained if substantive productivity improvement is realised. On the other hand, if productivity stagnates, labour shortages will push up wages leading to a loss of competitiveness and companies leaving Singapore for cheaper destinations.
On the whole the recommendations by the ESC are pertinent to the objectives. However constant monitoring of the impacts is required to ensure that unintended negative consequences do not evolve to be dominant and thus scuttle the new growth plan.
Notes:* Paper presented at the Conference on New Growth Strategies for Asian
Economies on 24 November 2009. The author thanks participants for their valuable comments and suggestions in revising the paper.
1 The NWC, a tripartite agency comprising representatives from the trade unions, employers and the government, was formed in 1972 to provide annual recommendations and guidelines on wage adjustment that are commensurate with economic productivity, performance and long term growth. The recommendations, which have become more qualitative in recent years, are widely adopted with the government providing the leading role.
127Singaporean Economic Development and Peculiar Observations on Saving, Labour Share, Productivity and Current Account Surplus
2 For a discussion on regional integration including ASEAN Free Trade Area and Growth Triangles, see Low and Toh (1993).
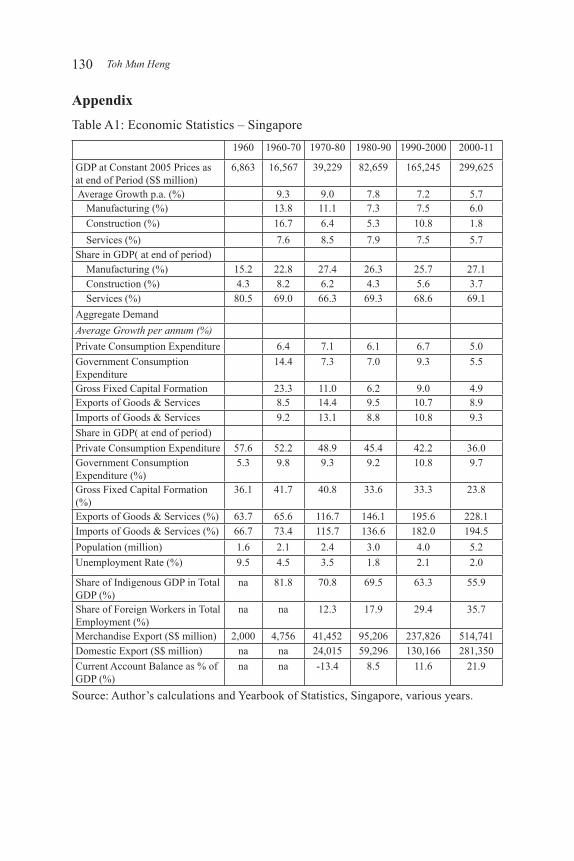
3 Further information on the R&D expenditure and manpower is tabulated in Table A1 in the Appendix.
4 Skill upgrading and retraining of domestic workforce to adapt to changing demand was to become more cogent. An agency known as the Workforce Development Agency (WDA) was established for that purpose.
5 NEWater can provide up to one-third of Singapore’s consumption needs. While the Malaysian government is treaty-bound to sell Singapore water until 2011, it is under no obligation to do so after this. It can still sell water until 2061.
6 In 2011, up to 36% of the wage of the worker is contributed to the mandatory individualized CPF account. An employee contributes 20% of his/her basic wage to the CPF account. The remaining 16% is contributed by the employers subject to a wage ceiling of $5,000 per month.
7 In the recent financial crisis, export-led economies are particularly adversely affected and there is a call for moving away from export-led strategy of growth and rely more on domestic market. There is very scope for Singapore to rely on domestic market expansion to get out of the recession.
8 The ratio of PCE to Indigenous GDP could be biased upward as some of the non-indigenous GDP is spent in Singapore. However, this upward bias is likely to be small as a large portion of the non-indigenous GDP is repatriated.
9 Denote the growth of variable X by g(X). Then the growth accounting equation is:
g(Y) = g(TFP)+a.g(K)+(1-a)g(L). Subtracting g(L) from each side of the equation and rearranging, yield: g(Y/L) = g(TFP) + a.g(K/L); where ‘a’ is the capital share.
10 A discussion of the TFP experience in the period before the 1990s can be found in Toh and Ng (2002).
11 From the decomposition equation: g(Y) = a.g(K)+(1-a)g(L) + TFP growth, we can rewrite it as:
TFP growth = g(Y) - a.g(K)-(1-a)g(L) = a.g(Y/K) + (1-a)g(Y/L) = a.g(Y/K) + b.g(Y/L).
References
A*STAR (2010) Our Research Community, downloaded from http://www.a-star.edu.sg/People/OurResearchCommunity/tabid/86/Default.aspx on 29 July 2010.
Department of Statistics, Yearbook of Statistics Singapore, Ministry of Trade and Industry. Annual publication, various years.
Toh Mun Heng128
IDA (2010) iN2015 Master Plan, Infocomm Development Authority of Singapore, downloaded from http://www.ida.gov.sg/Infocomm-Landscape/iN2015-Masterplan on 20 August 2010.
IES (2006) Singapore’s FTA network, International Enterprise Singapore, downloaded from http://www.fta.gov.sg/index.asp on 20 August 2010.
Koh W. & Mariano, R. (2006)(eds.) The economic prospects of Singapore; Pearson Addison Wesley (Singapore, New York)
Low L., Toh M. H. and Soon T. W. (1991) Economics of Education and Manpower Development Issues & Policies in Singapore, McGraw Hill, Singapore.
Low L., Toh M. H., Soon T.W., Tan K. Y. and H. Hughes (1993) Challenge and Response: Thirty Years of the Economic Development Board, (, Singapore: Times Academic Press.
Linda L. and Toh M.H. (1993) (eds) Public Policies in Singapore: A Decade of Changes,, Singapore: Times Academic Press.
Linda Low and Toh M.H. (1993) (eds) Regional Cooperation and Growth Triangles in ASEAN, Singapore: Times Academic Press.
Ministry of Information, Communications and the Arts (2009) Dsg-II, Strategic Blueprint of the Design Singapore Initiative, 2009 – 2015, Design Council, Singapore.
Ministry of Trade and Industry (1991) The Strategic Economic Plan: Towards a Developed Nation, Economic Planning Committee, Singapore Ministry of Trade and Industry.
Ministry of Trade and Industry (2003) Report of Economic Review Committee: New Challenges and Fresh Goals – Towards a Dynamic Global City; Singapore Ministry of Trade and Industry, downloaded from http://www.mti.gov.sg/ResearchRoom/Documents/app.mti.gov.sg/data/pages /507/doc/1%20ERC_Main_Committee.pdf on 20 August 2010.
OECD (2011) National Accounts at a Glance, http://www.oecd-ilibrary.org/sites/na_glance-2011-en/04/02/index.html downloaded on 6 September 2011.
Tan Peng Boo (1997) Human Resource Development For Continued Economic Growth - The Singapore Experience, ILO Workshop on Employers’ Organizations in Asia-Pacific in the Twenty-First Century Turin, Italy, 5-13 May 1997.
Tan K.E. and Thia J.P. (2004) “Private Consumption in Singapore: Trend and Development”, Quarterly Economic Survey, 2000 Quarter 1. Ministry of Trade and Industry, Singapore.
Toh M.H. and Tan K.Y.(1998) (eds) Competitiveness of the Singapore Economy: A Strategic Perspective, (ed. with Tan Kong Yam), Singapore University Press.
129Singaporean Economic Development and Peculiar Observations on Saving, Labour Share, Productivity and Current Account Surplus
Toh M.H. and Ng W.C. (2002) “Efficiency of investments in Asian Economies: has Singapore over invested?” Journal of Asian Economics, vol. 13:52-71.
Toh M.H. (2006) “Singapore’s Perspectives on the Proliferation of RTAs in East Asia and Beyond”, Global Economic Review, 35(3), 259-284.
Toh M.H. (2008) “Estimating Economic Impact of ICT on the Aggregate Economy”, Department of Strategy and Policy Research Paper, NUS Business School.
WDA (2010) Singapore Workforce Skill Qualification, downloaded from http://www.wda.gov.sg/content/wdawebsite/L207-AboutWSQ/L301-WSQIndustryFramework-TrainingandAdultEducation.html on 20 August 2010.
World Bank (1993) The East Asian Miracle: Economic Growth and Public Policy, New York: Oxford University Press.
World Bank (2011) World Development Indicators, downloaded from http://data.worldbank.org/data-catalog/world-development-indicators on 6 September 2011
Toh Mun Heng130
AppendixTable A1: Economic Statistics – Singapore
1960 1960-70 1970-80 1980-90 1990-2000 2000-11
GDP at Constant 2005 Prices as at end of Period (S$ million)
6,863 16,567 39,229 82,659 165,245 299,625
Average Growth p.a. (%) 9.3 9.0 7.8 7.2 5.7 Manufacturing (%) 13.8 11.1 7.3 7.5 6.0 Construction (%) 16.7 6.4 5.3 10.8 1.8 Services (%) 7.6 8.5 7.9 7.5 5.7Share in GDP( at end of period) Manufacturing (%) 15.2 22.8 27.4 26.3 25.7 27.1 Construction (%) 4.3 8.2 6.2 4.3 5.6 3.7 Services (%) 80.5 69.0 66.3 69.3 68.6 69.1Aggregate Demand Average Growth per annum (%) Private Consumption Expenditure 6.4 7.1 6.1 6.7 5.0Government Consumption Expenditure
14.4 7.3 7.0 9.3 5.5
Gross Fixed Capital Formation 23.3 11.0 6.2 9.0 4.9Exports of Goods & Services 8.5 14.4 9.5 10.7 8.9Imports of Goods & Services 9.2 13.1 8.8 10.8 9.3Share in GDP( at end of period) Private Consumption Expenditure 57.6 52.2 48.9 45.4 42.2 36.0Government Consumption Expenditure (%)
5.3 9.8 9.3 9.2 10.8 9.7
Gross Fixed Capital Formation (%)
36.1 41.7 40.8 33.6 33.3 23.8
Exports of Goods & Services (%) 63.7 65.6 116.7 146.1 195.6 228.1Imports of Goods & Services (%) 66.7 73.4 115.7 136.6 182.0 194.5Population (million) 1.6 2.1 2.4 3.0 4.0 5.2Unemployment Rate (%) 9.5 4.5 3.5 1.8 2.1 2.0
Share of Indigenous GDP in Total GDP (%)
na 81.8 70.8 69.5 63.3 55.9
Share of Foreign Workers in Total Employment (%)
na na 12.3 17.9 29.4 35.7
Merchandise Export (S$ million) 2,000 4,756 41,452 95,206 237,826 514,741Domestic Export (S$ million) na na 24,015 59,296 130,166 281,350Current Account Balance as % of GDP (%)
na na -13.4 8.5 11.6 21.9
Source: Author’s calculations and Yearbook of Statistics, Singapore, various years.