Embed Size (px)
Citation preview
PNG Environmental, Inc. i May 22, 2012 Progress Report – April 2012
Site Assessment Report Dills Property – 701 Buena Loop Road, Buena, WA AEC Project Number 12-061
Prepared for:
Washington State Department of Ecology 15 West Yakima Avenue, #200
Yakima, Washington 98901
October 23, 2012
Prepared by:
Anderson Environmental Contracting, LLC 705 Colorado Street Kelso, Washington 98626
p: (360) 577-9194 f: (360) 577-9198 www.aecllc.net
Anderson Environmental Contracting, LLC October 23, 2012 Site Assessment Report
2
TABLE OF CONTENTS
Section Page I. Introduction 3 II. Description of Property 3 III. Regional Geology and Hydrogeology 3 IV. Fieldwork 3
A. UST Decommissioning Activities 3 B. Subsurface Conditions 4 C. Field Screening and Sample Collection 4
V. Analytical Results 5 A. Confirmation Soil Samples 5 B. Discussion 6
VI. Recommendations 6
FIGURES
Figure 1 – Site Location Map Figure 2 – Soil Sample Locations
TABLES
Table 1 – Summary of Soil Analytical Results
APPENDICES
Appendix A – UST Recycling Documentation Appendix B – Laboratory Reports and Chain-of-Custody Documentation
Anderson Environmental Contracting, LLC October 23, 2012 Site Assessment Report
3
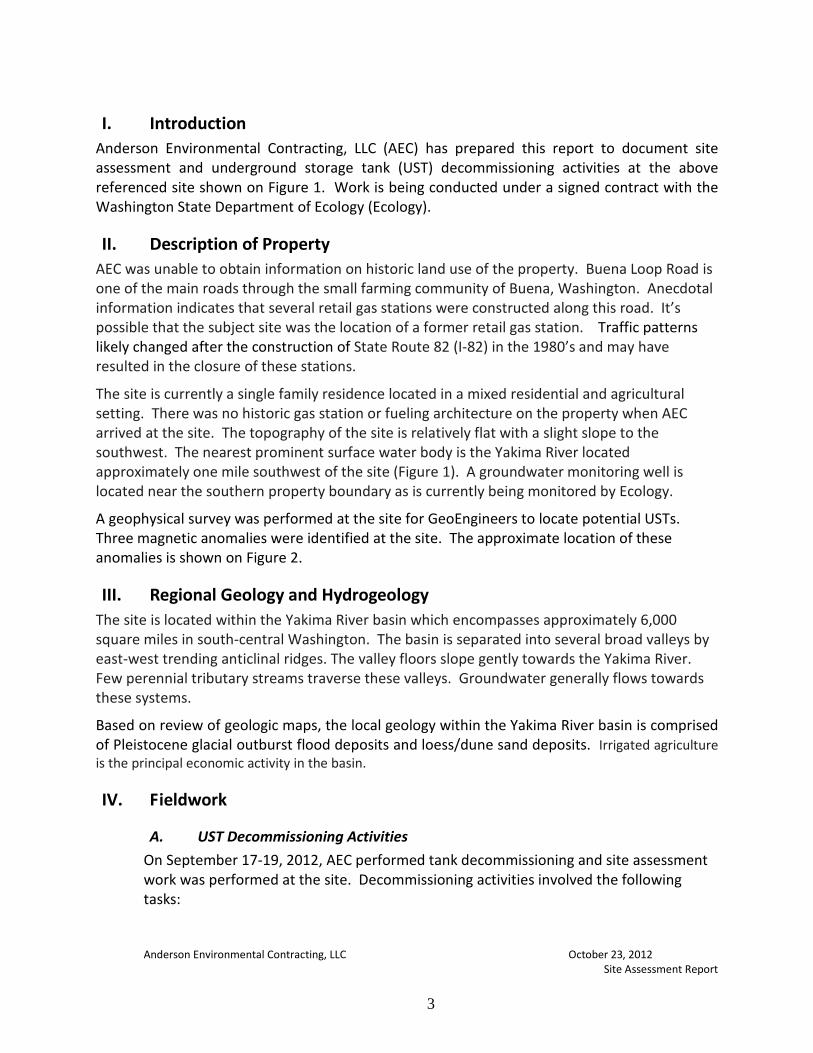
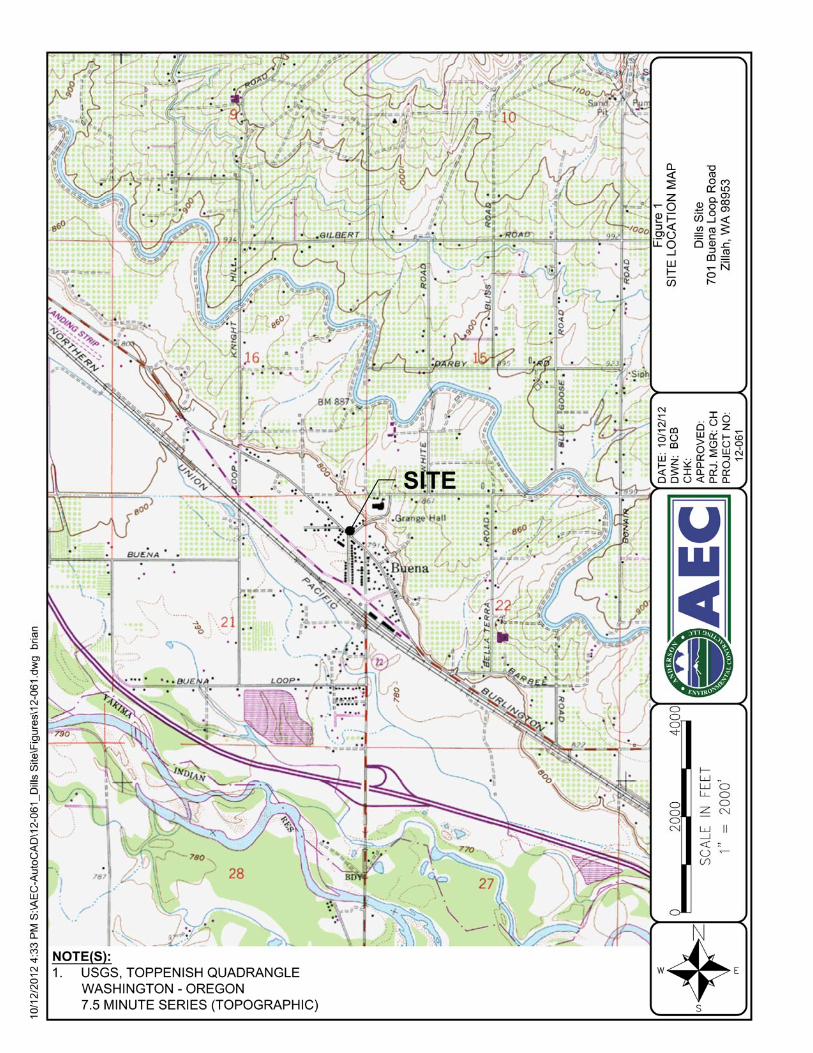
I. Introduction Anderson Environmental Contracting, LLC (AEC) has prepared this report to document site assessment and underground storage tank (UST) decommissioning activities at the above referenced site shown on Figure 1. Work is being conducted under a signed contract with the Washington State Department of Ecology (Ecology).
II. Description of Property AEC was unable to obtain information on historic land use of the property. Buena Loop Road is one of the main roads through the small farming community of Buena, Washington. Anecdotal information indicates that several retail gas stations were constructed along this road. It’s possible that the subject site was the location of a former retail gas station. Traffic patterns likely changed after the construction of State Route 82 (I-82) in the 1980’s and may have resulted in the closure of these stations.
The site is currently a single family residence located in a mixed residential and agricultural setting. There was no historic gas station or fueling architecture on the property when AEC arrived at the site. The topography of the site is relatively flat with a slight slope to the southwest. The nearest prominent surface water body is the Yakima River located approximately one mile southwest of the site (Figure 1). A groundwater monitoring well is located near the southern property boundary as is currently being monitored by Ecology.
A geophysical survey was performed at the site for GeoEngineers to locate potential USTs. Three magnetic anomalies were identified at the site. The approximate location of these anomalies is shown on Figure 2.
III. Regional Geology and Hydrogeology The site is located within the Yakima River basin which encompasses approximately 6,000 square miles in south-central Washington. The basin is separated into several broad valleys by east-west trending anticlinal ridges. The valley floors slope gently towards the Yakima River. Few perennial tributary streams traverse these valleys. Groundwater generally flows towards these systems.
Based on review of geologic maps, the local geology within the Yakima River basin is comprised of Pleistocene glacial outburst flood deposits and loess/dune sand deposits. Irrigated agriculture is the principal economic activity in the basin.
IV. Fieldwork
A. UST Decommissioning Activities On September 17-19, 2012, AEC performed tank decommissioning and site assessment work was performed at the site. Decommissioning activities involved the following tasks:
Anderson Environmental Contracting, LLC October 23, 2012 Site Assessment Report
4
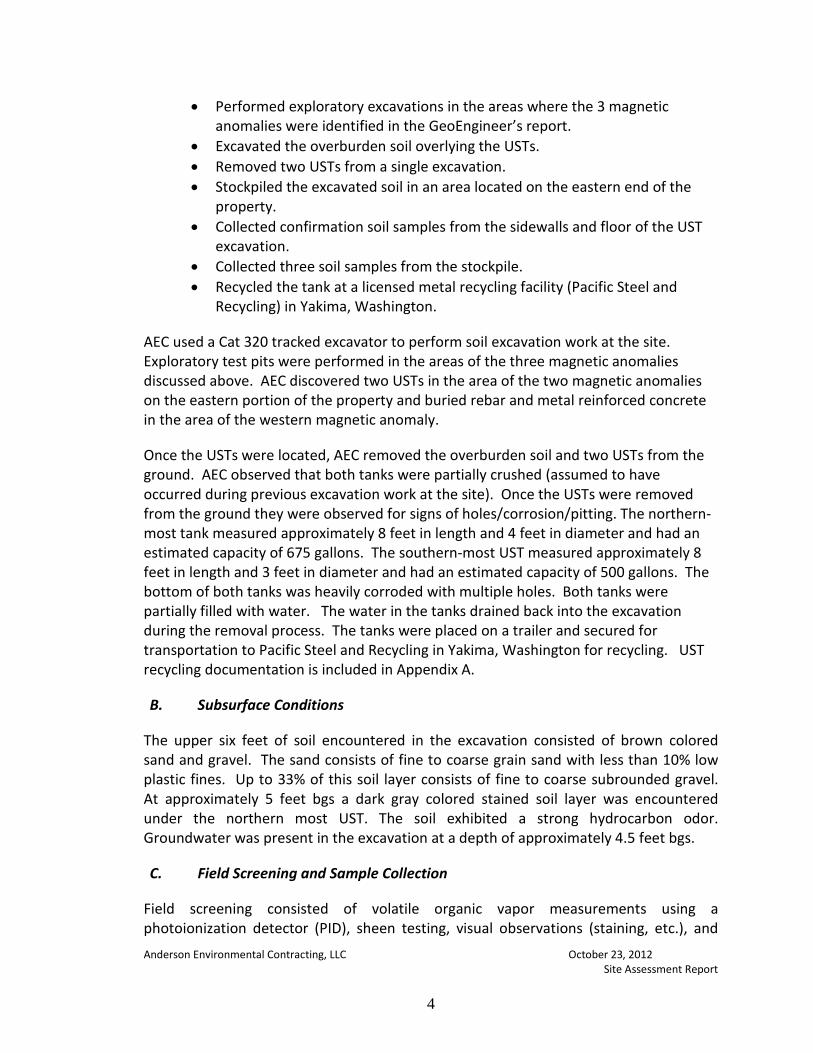
• Performed exploratory excavations in the areas where the 3 magnetic anomalies were identified in the GeoEngineer’s report.
• Excavated the overburden soil overlying the USTs. • Removed two USTs from a single excavation. • Stockpiled the excavated soil in an area located on the eastern end of the
property. • Collected confirmation soil samples from the sidewalls and floor of the UST
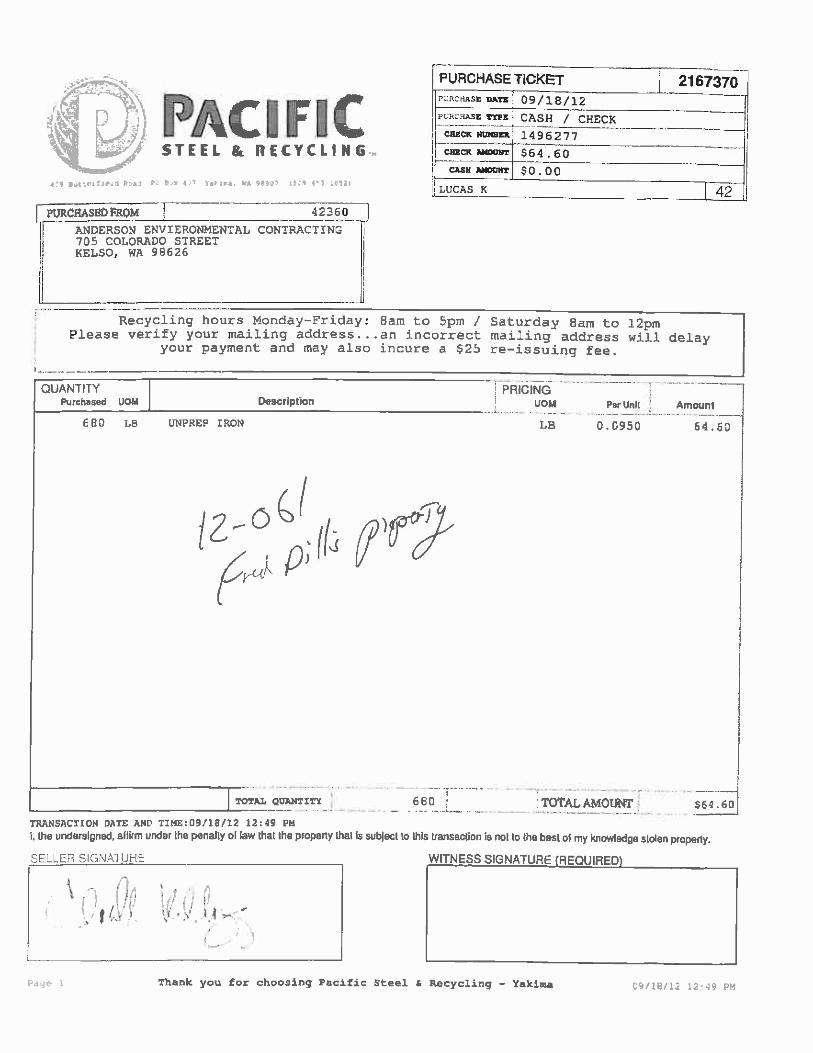
excavation. • Collected three soil samples from the stockpile. • Recycled the tank at a licensed metal recycling facility (Pacific Steel and
Recycling) in Yakima, Washington.
AEC used a Cat 320 tracked excavator to perform soil excavation work at the site. Exploratory test pits were performed in the areas of the three magnetic anomalies discussed above. AEC discovered two USTs in the area of the two magnetic anomalies on the eastern portion of the property and buried rebar and metal reinforced concrete in the area of the western magnetic anomaly.
Once the USTs were located, AEC removed the overburden soil and two USTs from the ground. AEC observed that both tanks were partially crushed (assumed to have occurred during previous excavation work at the site). Once the USTs were removed from the ground they were observed for signs of holes/corrosion/pitting. The northern-most tank measured approximately 8 feet in length and 4 feet in diameter and had an estimated capacity of 675 gallons. The southern-most UST measured approximately 8 feet in length and 3 feet in diameter and had an estimated capacity of 500 gallons. The bottom of both tanks was heavily corroded with multiple holes. Both tanks were partially filled with water. The water in the tanks drained back into the excavation during the removal process. The tanks were placed on a trailer and secured for transportation to Pacific Steel and Recycling in Yakima, Washington for recycling. UST recycling documentation is included in Appendix A.
B. Subsurface Conditions
The upper six feet of soil encountered in the excavation consisted of brown colored sand and gravel. The sand consists of fine to coarse grain sand with less than 10% low plastic fines. Up to 33% of this soil layer consists of fine to coarse subrounded gravel. At approximately 5 feet bgs a dark gray colored stained soil layer was encountered under the northern most UST. The soil exhibited a strong hydrocarbon odor. Groundwater was present in the excavation at a depth of approximately 4.5 feet bgs.
C. Field Screening and Sample Collection
Field screening consisted of volatile organic vapor measurements using a photoionization detector (PID), sheen testing, visual observations (staining, etc.), and
Anderson Environmental Contracting, LLC October 23, 2012 Site Assessment Report
5
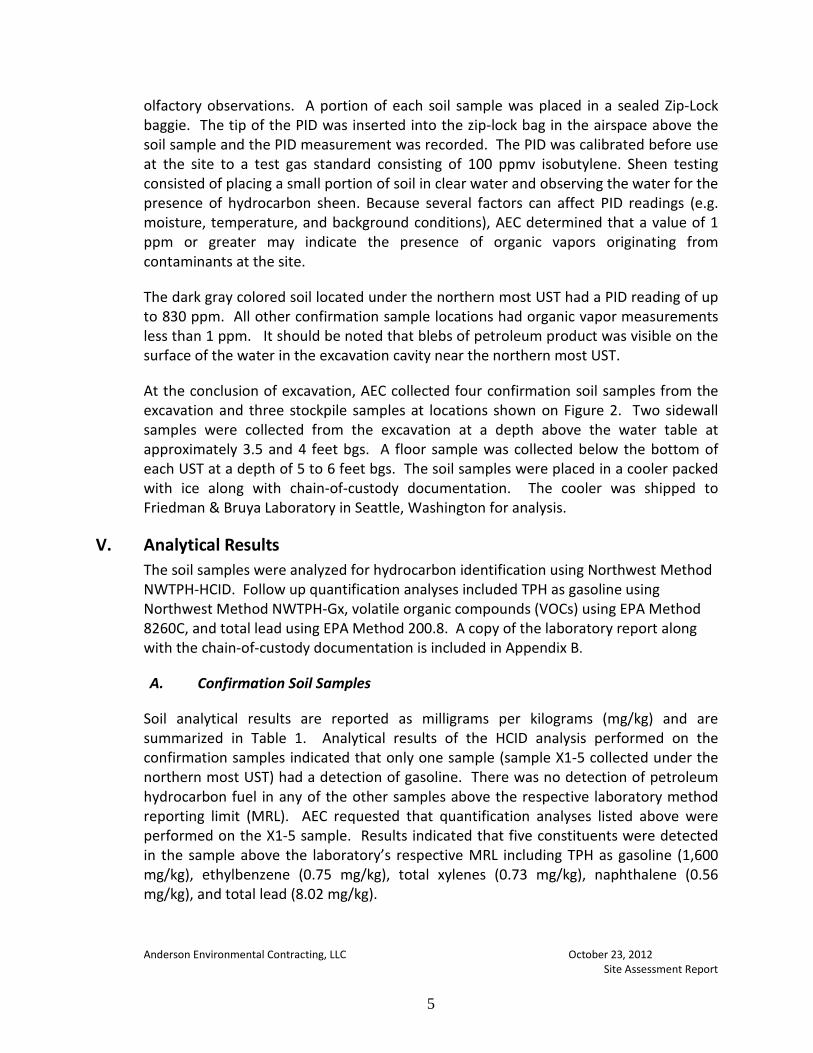
olfactory observations. A portion of each soil sample was placed in a sealed Zip-Lock baggie. The tip of the PID was inserted into the zip-lock bag in the airspace above the soil sample and the PID measurement was recorded. The PID was calibrated before use at the site to a test gas standard consisting of 100 ppmv isobutylene. Sheen testing consisted of placing a small portion of soil in clear water and observing the water for the presence of hydrocarbon sheen. Because several factors can affect PID readings (e.g. moisture, temperature, and background conditions), AEC determined that a value of 1 ppm or greater may indicate the presence of organic vapors originating from contaminants at the site.
The dark gray colored soil located under the northern most UST had a PID reading of up to 830 ppm. All other confirmation sample locations had organic vapor measurements less than 1 ppm. It should be noted that blebs of petroleum product was visible on the surface of the water in the excavation cavity near the northern most UST.
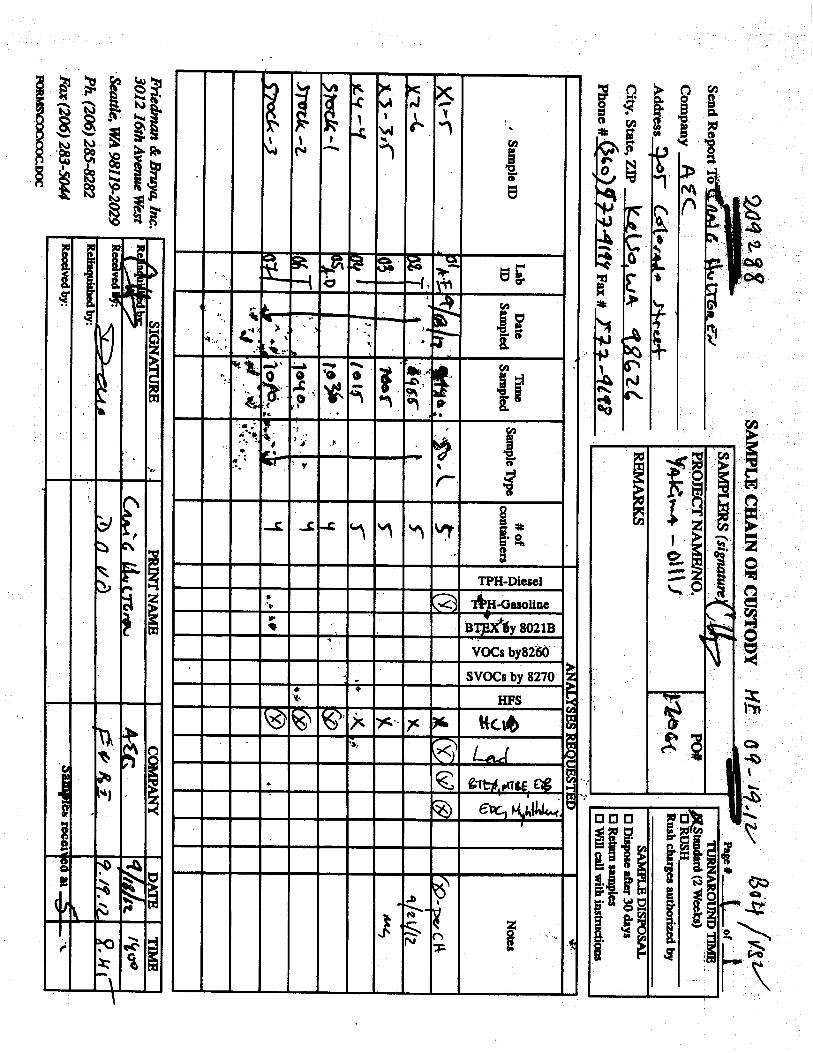
At the conclusion of excavation, AEC collected four confirmation soil samples from the excavation and three stockpile samples at locations shown on Figure 2. Two sidewall samples were collected from the excavation at a depth above the water table at approximately 3.5 and 4 feet bgs. A floor sample was collected below the bottom of each UST at a depth of 5 to 6 feet bgs. The soil samples were placed in a cooler packed with ice along with chain-of-custody documentation. The cooler was shipped to Friedman & Bruya Laboratory in Seattle, Washington for analysis.
V. Analytical Results The soil samples were analyzed for hydrocarbon identification using Northwest Method NWTPH-HCID. Follow up quantification analyses included TPH as gasoline using Northwest Method NWTPH-Gx, volatile organic compounds (VOCs) using EPA Method 8260C, and total lead using EPA Method 200.8. A copy of the laboratory report along with the chain-of-custody documentation is included in Appendix B.
A. Confirmation Soil Samples
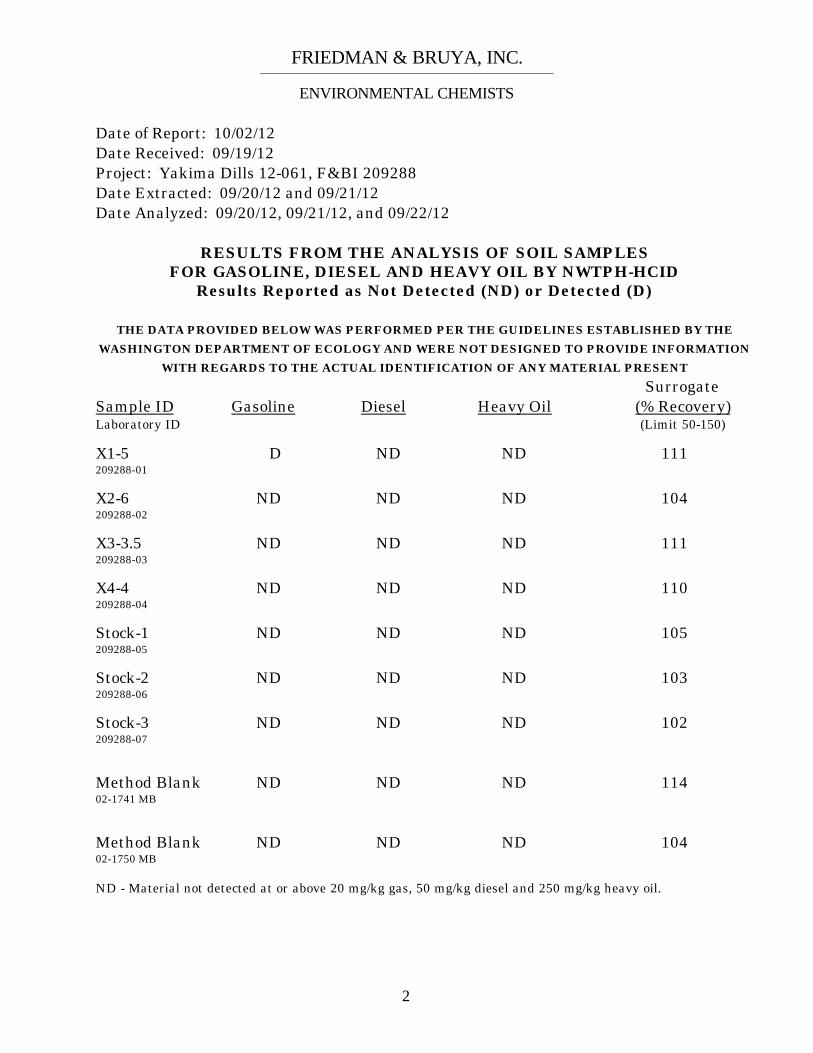
Soil analytical results are reported as milligrams per kilograms (mg/kg) and are summarized in Table 1. Analytical results of the HCID analysis performed on the confirmation samples indicated that only one sample (sample X1-5 collected under the northern most UST) had a detection of gasoline. There was no detection of petroleum hydrocarbon fuel in any of the other samples above the respective laboratory method reporting limit (MRL). AEC requested that quantification analyses listed above were performed on the X1-5 sample. Results indicated that five constituents were detected in the sample above the laboratory’s respective MRL including TPH as gasoline (1,600 mg/kg), ethylbenzene (0.75 mg/kg), total xylenes (0.73 mg/kg), naphthalene (0.56 mg/kg), and total lead (8.02 mg/kg).
Anderson Environmental Contracting, LLC October 23, 2012 Site Assessment Report
6
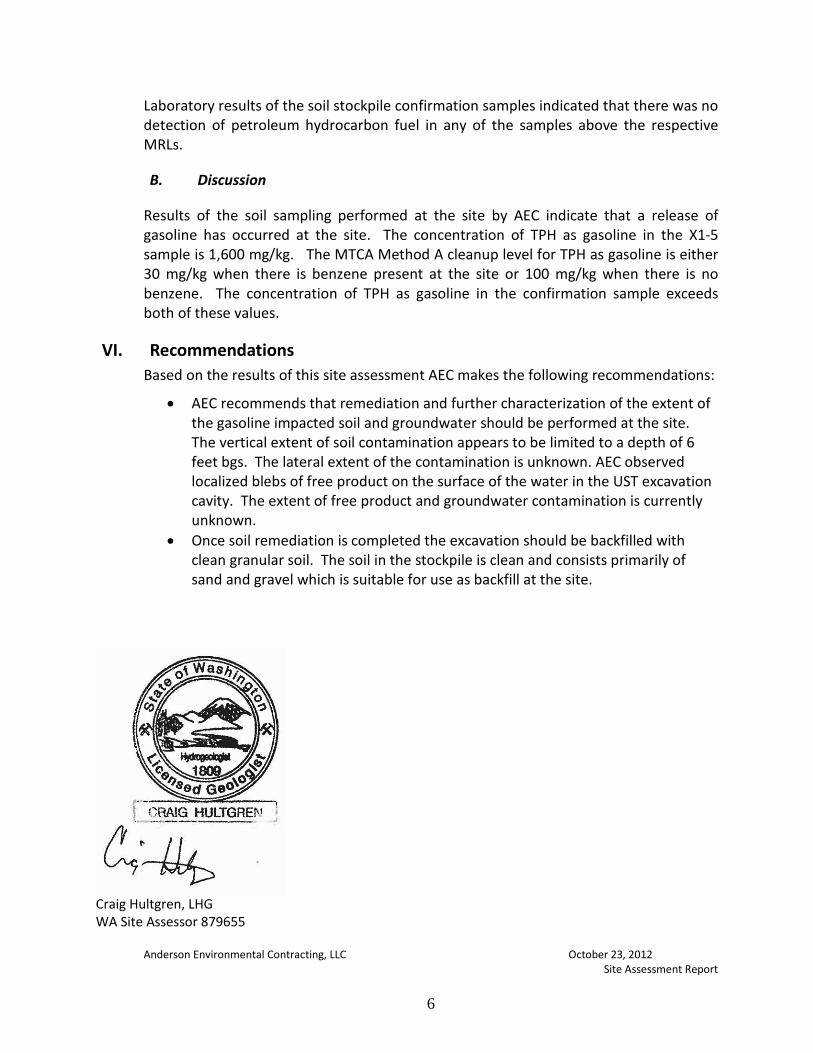
Laboratory results of the soil stockpile confirmation samples indicated that there was no detection of petroleum hydrocarbon fuel in any of the samples above the respective MRLs.
B. Discussion
Results of the soil sampling performed at the site by AEC indicate that a release of gasoline has occurred at the site. The concentration of TPH as gasoline in the X1-5 sample is 1,600 mg/kg. The MTCA Method A cleanup level for TPH as gasoline is either 30 mg/kg when there is benzene present at the site or 100 mg/kg when there is no benzene. The concentration of TPH as gasoline in the confirmation sample exceeds both of these values.
VI. Recommendations Based on the results of this site assessment AEC makes the following recommendations:
• AEC recommends that remediation and further characterization of the extent of the gasoline impacted soil and groundwater should be performed at the site. The vertical extent of soil contamination appears to be limited to a depth of 6 feet bgs. The lateral extent of the contamination is unknown. AEC observed localized blebs of free product on the surface of the water in the UST excavation cavity. The extent of free product and groundwater contamination is currently unknown.
• Once soil remediation is completed the excavation should be backfilled with clean granular soil. The soil in the stockpile is clean and consists primarily of sand and gravel which is suitable for use as backfill at the site.
Craig Hultgren, LHG WA Site Assessor 879655
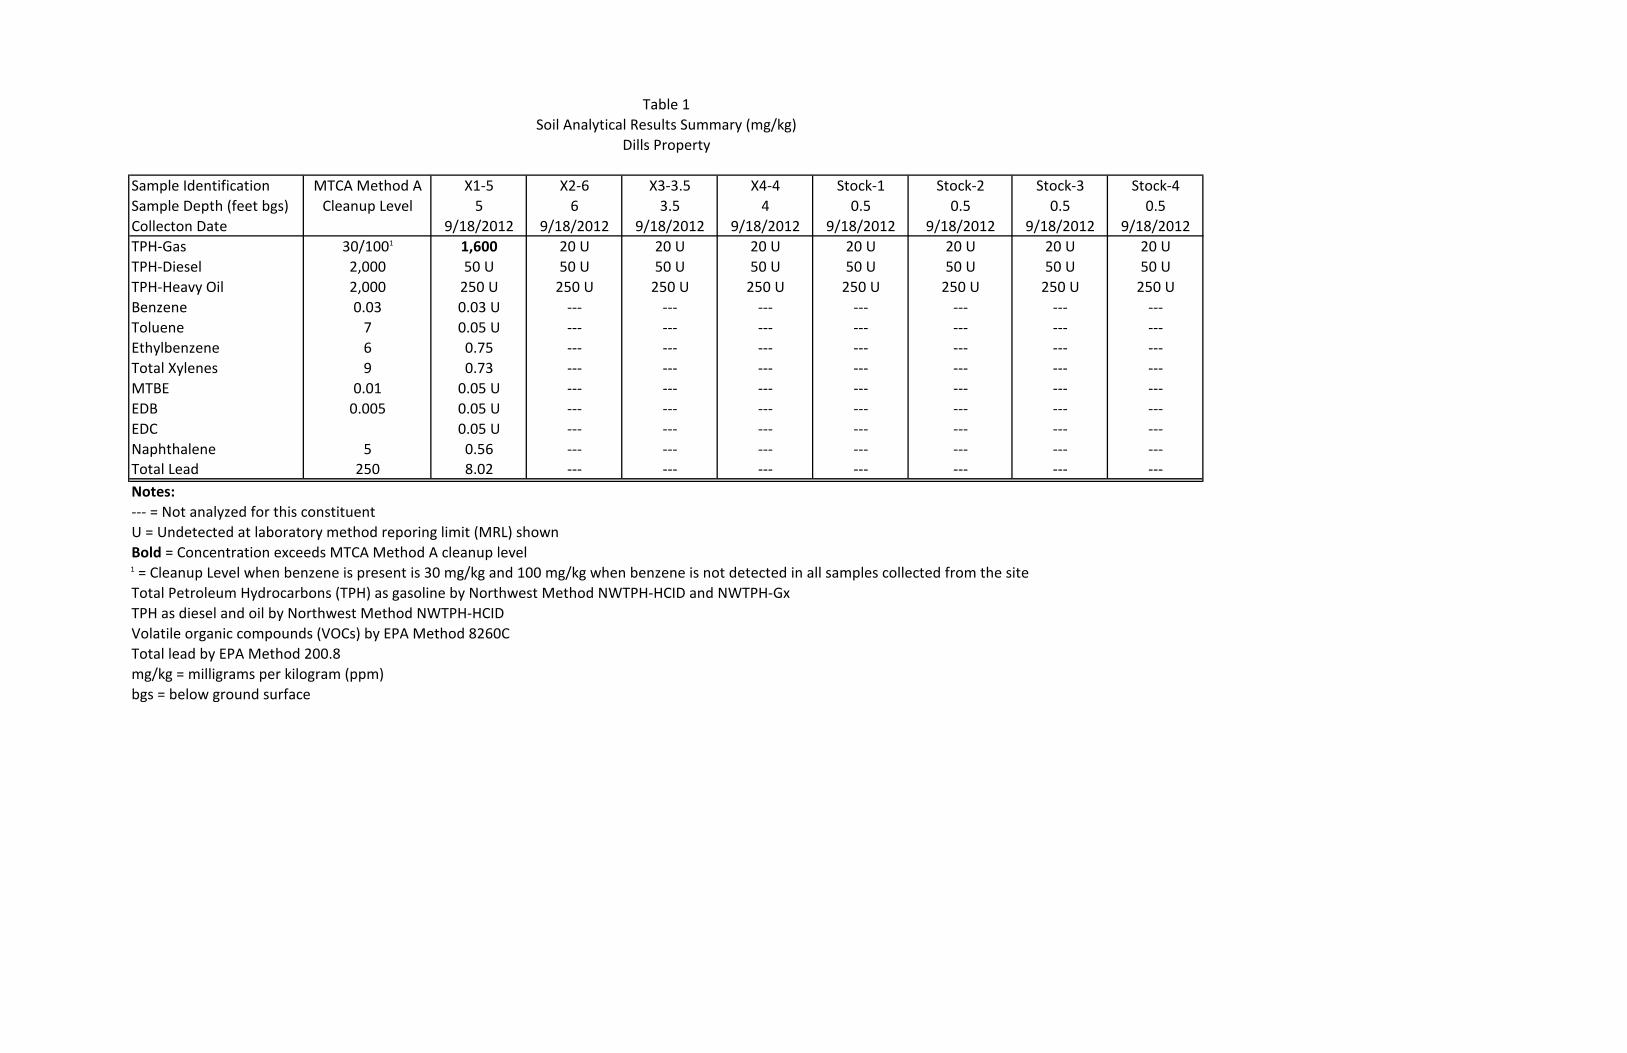
Sample Identification MTCA Method A X1-5 X2-6 X3-3.5 X4-4 Stock-1 Stock-2 Stock-3 Stock-4Sample Depth (feet bgs) Cleanup Level 5 6 3.5 4 0.5 0.5 0.5 0.5Collecton Date 9/18/2012 9/18/2012 9/18/2012 9/18/2012 9/18/2012 9/18/2012 9/18/2012 9/18/2012TPH-Gas 30/1001 1,600 20 U 20 U 20 U 20 U 20 U 20 U 20 UTPH-Diesel 2,000 50 U 50 U 50 U 50 U 50 U 50 U 50 U 50 UTPH-Heavy Oil 2,000 250 U 250 U 250 U 250 U 250 U 250 U 250 U 250 UBenzene 0.03 0.03 U --- --- --- --- --- --- ---Toluene 7 0.05 U --- --- --- --- --- --- ---Ethylbenzene 6 0.75 --- --- --- --- --- --- ---Total Xylenes 9 0.73 --- --- --- --- --- --- ---MTBE 0.01 0.05 U --- --- --- --- --- --- ---EDB 0.005 0.05 U --- --- --- --- --- --- ---EDC 0.05 U --- --- --- --- --- --- ---Naphthalene 5 0.56 --- --- --- --- --- --- ---Total Lead 250 8.02 --- --- --- --- --- --- ---Notes:--- = Not analyzed for this constituentU = Undetected at laboratory method reporing limit (MRL) shownBold = Concentration exceeds MTCA Method A cleanup level1 = Cleanup Level when benzene is present is 30 mg/kg and 100 mg/kg when benzene is not detected in all samples collected from the siteTotal Petroleum Hydrocarbons (TPH) as gasoline by Northwest Method NWTPH-HCID and NWTPH-GxTPH as diesel and oil by Northwest Method NWTPH-HCID Volatile organic compounds (VOCs) by EPA Method 8260CTotal lead by EPA Method 200.8mg/kg = milligrams per kilogram (ppm)bgs = below ground surface
Table 1Soil Analytical Results Summary (mg/kg)
Dills Property


APPENDIX A
UST RECYCLING DOCUMENTATION

APPENDIX B
LABORATORY REPORTS AND CHAIN-OF-CUSTODY DOCUMENTATION

FRIEDMAN & BRUYA, INC. _________________________________________________
ENVIRONMENTAL CHEMISTS
James E. Bruya, Ph.D. 3012 16th Avenue West Yelena Aravkina, M.S. Seattle, WA 98119-2029 Bradley T. Benson, B.S. TEL: (206) 285-8282 Kurt Johnson, B.S. e-mail: [email protected]
October 2, 2012 Craig Hultgren, Project Manager Anderson Environmental 705 Colorado Street Kelso, WA 98626 Dear Mr. Hultgren: Included are the results from the testing of material submitted on September 19, 2012 from the Yakima Dills 12-061, F&BI 209288 project. There are 11 pages included in this report. Any samples that may remain are currently scheduled for disposal in 30 days. If you would like us to return your samples or arrange for long term storage at our offices, please contact us as soon as possible. We appreciate this opportunity to be of service to you and hope you will call if you should have any questions. Sincerely, FRIEDMAN & BRUYA, INC.
Eric Young Chemist Enclosures AEN1002R.DOC

FRIEDMAN & BRUYA, INC. _________________________________________________
ENVIRONMENTAL CHEMISTS
1
CASE NARRATIVE This case narrative encompasses samples received on September 19, 2012 by Friedman & Bruya, Inc. from the Anderson Environmental Yakima Dills 12-061, F&BI 209288 project. Samples were logged in under the laboratory ID’s listed below. Laboratory ID Anderson Environmental 209288-01 X1-5 209288-02 X2-6 209288-03 X3-3.5 209288-04 X4-4 209288-05 Stock-1 209288-06 Stock-2 209288-07 Stock-3 All quality control requirements were acceptable.
FRIEDMAN & BRUYA, INC. _________________________________________________
ENVIRONMENTAL CHEMISTS
2
Date of Report: 10/02/12 Date Received: 09/19/12 Project: Yakima Dills 12-061, F&BI 209288 Date Extracted: 09/20/12 and 09/21/12 Date Analyzed: 09/20/12, 09/21/12, and 09/22/12
RESULTS FROM THE ANALYSIS OF SOIL SAMPLES FOR GASOLINE, DIESEL AND HEAVY OIL BY NWTPH-HCID
Results Reported as Not Detected (ND) or Detected (D)
THE DATA PROVIDED BELOW WAS PERFORMED PER THE GUIDELINES ESTABLISHED BY THE
WASHINGTON DEPARTMENT OF ECOLOGY AND WERE NOT DESIGNED TO PROVIDE INFORMATION
WITH REGARDS TO THE ACTUAL IDENTIFICATION OF ANY MATERIAL PRESENT Surrogate Sample ID Gasoline Diesel Heavy Oil (% Recovery) Laboratory ID (Limit 50-150) X1-5 D ND ND 111 209288-01 X2-6 ND ND ND 104 209288-02 X3-3.5 ND ND ND 111 209288-03 X4-4 ND ND ND 110 209288-04 Stock-1 ND ND ND 105 209288-05 Stock-2 ND ND ND 103 209288-06 Stock-3 ND ND ND 102 209288-07 Method Blank ND ND ND 114 02-1741 MB Method Blank ND ND ND 104 02-1750 MB ND - Material not detected at or above 20 mg/kg gas, 50 mg/kg diesel and 250 mg/kg heavy oil.
FRIEDMAN & BRUYA, INC. _________________________________________________
ENVIRONMENTAL CHEMISTS
3
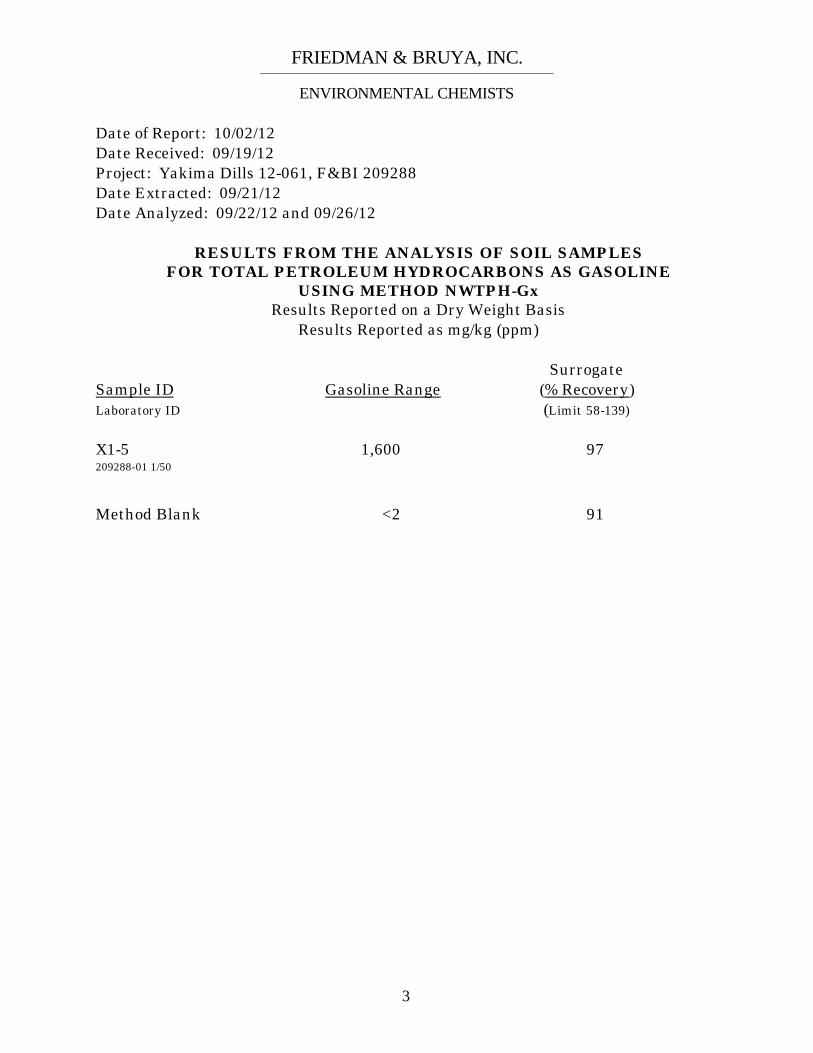
Date of Report: 10/02/12 Date Received: 09/19/12 Project: Yakima Dills 12-061, F&BI 209288 Date Extracted: 09/21/12 Date Analyzed: 09/22/12 and 09/26/12
RESULTS FROM THE ANALYSIS OF SOIL SAMPLES FOR TOTAL PETROLEUM HYDROCARBONS AS GASOLINE
USING METHOD NWTPH-Gx Results Reported on a Dry Weight Basis
Results Reported as mg/kg (ppm)
Surrogate Sample ID Gasoline Range (% Recovery) Laboratory ID (Limit 58-139) X1-5 1,600 97 209288-01 1/50
Method Blank <2 91
FRIEDMAN & BRUYA, INC. _________________________________________________
ENVIRONMENTAL CHEMISTS
4
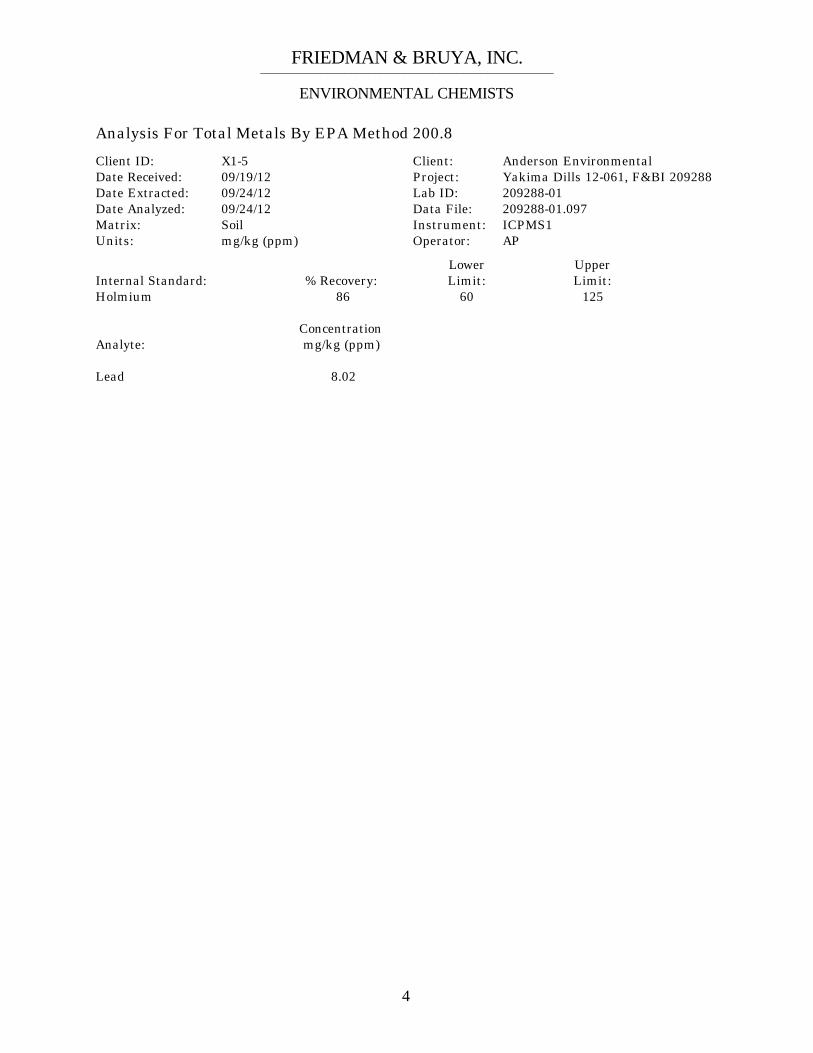
Analysis For Total Metals By EPA Method 200.8 Client ID: X1-5 Client: Anderson Environmental Date Received: 09/19/12 Project: Yakima Dills 12-061, F&BI 209288 Date Extracted: 09/24/12 Lab ID: 209288-01 Date Analyzed: 09/24/12 Data File: 209288-01.097 Matrix: Soil Instrument: ICPMS1 Units: mg/kg (ppm) Operator: AP Lower Upper Internal Standard: % Recovery: Limit: Limit: Holmium 86 60 125 Concentration Analyte: mg/kg (ppm) Lead 8.02

FRIEDMAN & BRUYA, INC. _________________________________________________
ENVIRONMENTAL CHEMISTS
5
Analysis For Total Metals By EPA Method 200.8 Client ID: Method Blank Client: Anderson Environmental Date Received: NA Project: Yakima Dills 12-061, F&BI 209288 Date Extracted: 09/24/12 Lab ID: I2-646 mb Date Analyzed: 09/24/12 Data File: I2-646 mb.081 Matrix: Soil Instrument: ICPMS1 Units: mg/kg (ppm) Operator: AP Lower Upper Internal Standard: % Recovery: Limit: Limit: Holmium 82 60 125 Concentration Analyte: mg/kg (ppm) Lead <1
FRIEDMAN & BRUYA, INC. _________________________________________________
ENVIRONMENTAL CHEMISTS
6
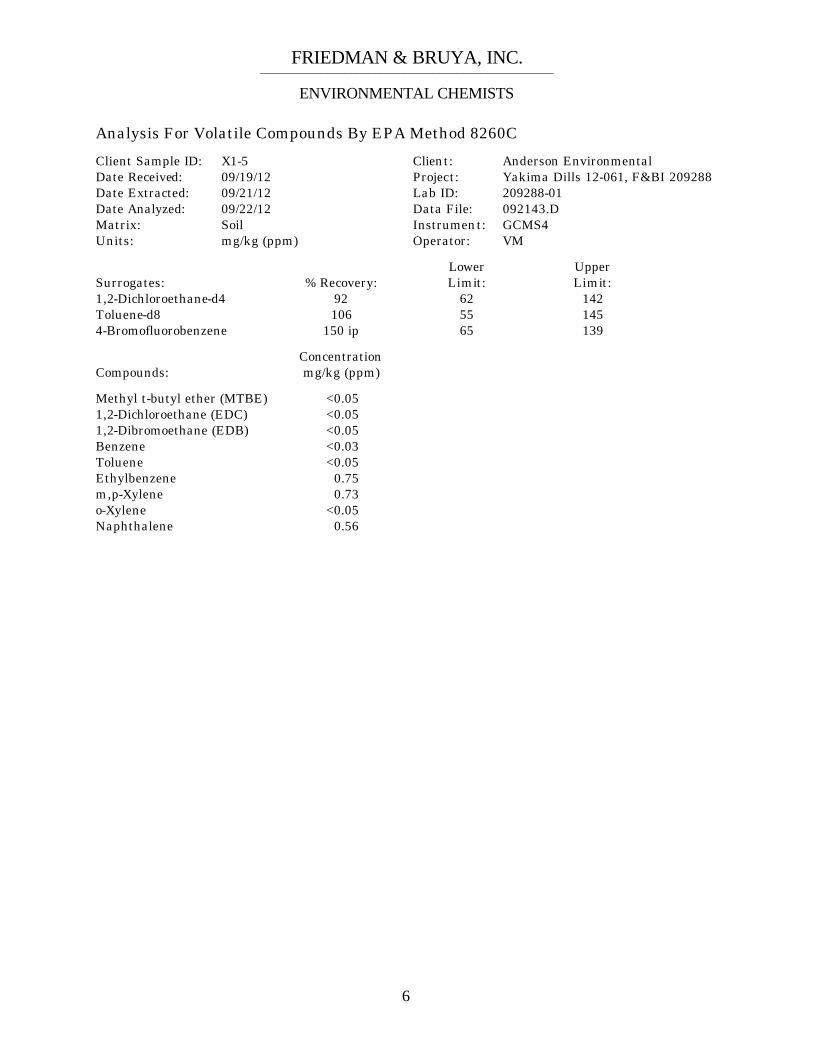
Analysis For Volatile Compounds By EPA Method 8260C Client Sample ID: X1-5 Client: Anderson Environmental Date Received: 09/19/12 Project: Yakima Dills 12-061, F&BI 209288 Date Extracted: 09/21/12 Lab ID: 209288-01 Date Analyzed: 09/22/12 Data File: 092143.D Matrix: Soil Instrument: GCMS4 Units: mg/kg (ppm) Operator: VM Lower Upper Surrogates: % Recovery: Limit: Limit: 1,2-Dichloroethane-d4 92 62 142 Toluene-d8 106 55 145 4-Bromofluorobenzene 150 ip 65 139 Concentration Compounds: mg/kg (ppm) Methyl t-butyl ether (MTBE) <0.05 1,2-Dichloroethane (EDC) <0.05 1,2-Dibromoethane (EDB) <0.05 Benzene <0.03 Toluene <0.05 Ethylbenzene 0.75 m,p-Xylene 0.73 o-Xylene <0.05 Naphthalene 0.56

FRIEDMAN & BRUYA, INC. _________________________________________________
ENVIRONMENTAL CHEMISTS
7
Analysis For Volatile Compounds By EPA Method 8260C Client Sample ID: Method Blank Client: Anderson Environmental Date Received: NA Project: Yakima Dills 12-061, F&BI 209288 Date Extracted: 09/21/12 Lab ID: 02-1700 mb Date Analyzed: 09/21/12 Data File: 092110.D Matrix: Soil Instrument: GCMS4 Units: mg/kg (ppm) Operator: VM Lower Upper Surrogates: % Recovery: Limit: Limit: 1,2-Dichloroethane-d4 98 62 142 Toluene-d8 100 55 145 4-Bromofluorobenzene 101 65 139 Concentration Compounds: mg/kg (ppm) Methyl t-butyl ether (MTBE) <0.05 1,2-Dichloroethane (EDC) <0.05 1,2-Dibromoethane (EDB) <0.05 Benzene <0.03 Toluene <0.05 Ethylbenzene <0.05 m,p-Xylene <0.1 o-Xylene <0.05 Naphthalene <0.05

FRIEDMAN & BRUYA, INC. _________________________________________________
ENVIRONMENTAL CHEMISTS
8
Date of Report: 10/02/12 Date Received: 09/19/12 Project: Yakima Dills 12-061, F&BI 209288 QUALITY ASSURANCE RESULTS FOR THE ANALYSIS OF SOIL SAMPLES
FOR TPH AS GASOLINE USING METHOD NWTPH-Gx
Laboratory Code: 209319-09 (Duplicate) Analyte
Reporting Units
(Wet Wt) Sample Result
(Wet Wt) Duplicate
Result
Relative Percent Difference (Limit 20)
Gasoline mg/kg (ppm) <2 <2 nm Laboratory Code: Laboratory Control Sample Analyte
Reporting Units
Spike Level
Percent Recovery
LCS
Acceptance
Criteria Gasoline mg/kg (ppm) 20 95 61-153

FRIEDMAN & BRUYA, INC. _________________________________________________
ENVIRONMENTAL CHEMISTS
9
Date of Report: 10/02/12 Date Received: 09/19/12 Project: Yakima Dills 12-061, F&BI 209288
QUALITY ASSURANCE RESULTS FOR THE ANALYSIS OF SOIL SAMPLES
FOR TOTAL METALS USING EPA METHOD 200.8 Laboratory Code: 209236-14 (Matrix Spike) Analyte
Reporting
Units
Spike Level
Sample Result
Percent Recovery
MS
Percent Recovery
MSD
Acceptance
Criteria
RPD
(Limit 20) Lead mg/kg (ppm) 50 1.08 106 106 64-139 0 Laboratory Code: Laboratory Control Sample Analyte
Reporting Units
Spike Level
Percent Recovery
LCS
Acceptance
Criteria Lead mg/kg (ppm) 50 104 83-118
FRIEDMAN & BRUYA, INC. _________________________________________________
ENVIRONMENTAL CHEMISTS
10
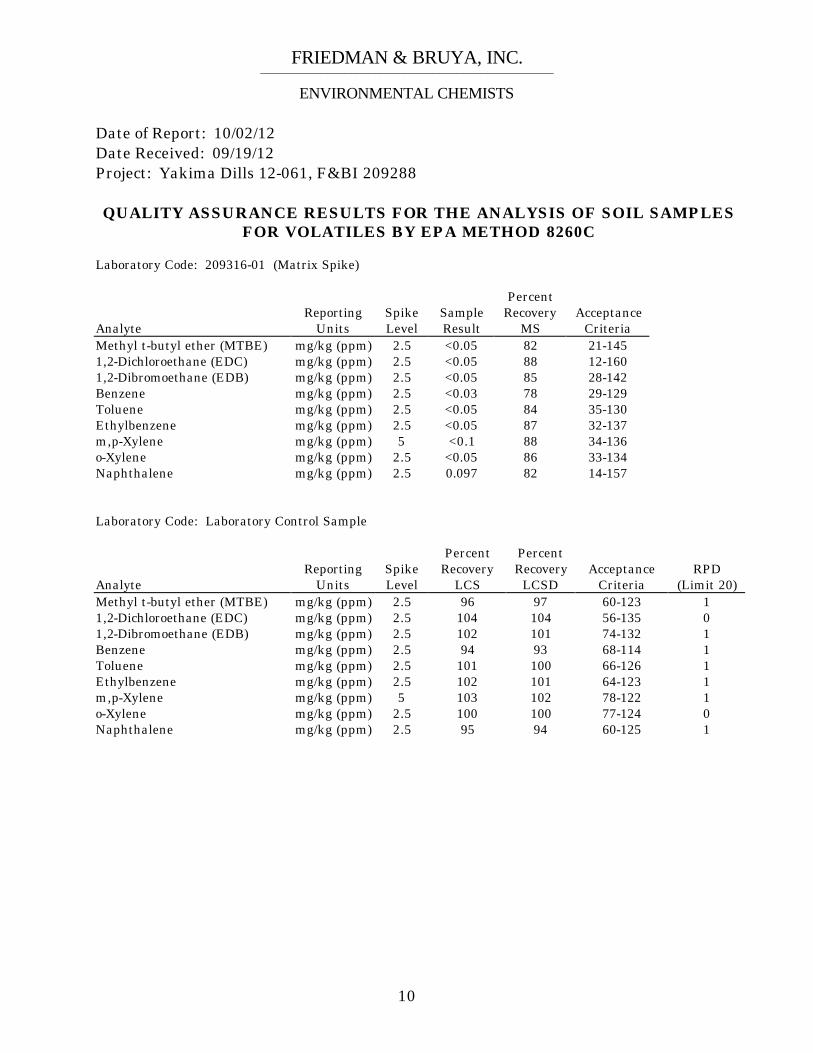
Date of Report: 10/02/12 Date Received: 09/19/12 Project: Yakima Dills 12-061, F&BI 209288 QUALITY ASSURANCE RESULTS FOR THE ANALYSIS OF SOIL SAMPLES
FOR VOLATILES BY EPA METHOD 8260C Laboratory Code: 209316-01 (Matrix Spike) Analyte
Reporting
Units
Spike Level
Sample Result
Percent Recovery
MS
Acceptance
Criteria Methyl t-butyl ether (MTBE) mg/kg (ppm) 2.5 <0.05 82 21-145 1,2-Dichloroethane (EDC) mg/kg (ppm) 2.5 <0.05 88 12-160 1,2-Dibromoethane (EDB) mg/kg (ppm) 2.5 <0.05 85 28-142 Benzene mg/kg (ppm) 2.5 <0.03 78 29-129 Toluene mg/kg (ppm) 2.5 <0.05 84 35-130 Ethylbenzene mg/kg (ppm) 2.5 <0.05 87 32-137 m,p-Xylene mg/kg (ppm) 5 <0.1 88 34-136 o-Xylene mg/kg (ppm) 2.5 <0.05 86 33-134 Naphthalene mg/kg (ppm) 2.5 0.097 82 14-157 Laboratory Code: Laboratory Control Sample Analyte
Reporting
Units
Spike Level
Percent Recovery
LCS
Percent Recovery
LCSD
Acceptance
Criteria
RPD
(Limit 20) Methyl t-butyl ether (MTBE) mg/kg (ppm) 2.5 96 97 60-123 1 1,2-Dichloroethane (EDC) mg/kg (ppm) 2.5 104 104 56-135 0 1,2-Dibromoethane (EDB) mg/kg (ppm) 2.5 102 101 74-132 1 Benzene mg/kg (ppm) 2.5 94 93 68-114 1 Toluene mg/kg (ppm) 2.5 101 100 66-126 1 Ethylbenzene mg/kg (ppm) 2.5 102 101 64-123 1 m,p-Xylene mg/kg (ppm) 5 103 102 78-122 1 o-Xylene mg/kg (ppm) 2.5 100 100 77-124 0 Naphthalene mg/kg (ppm) 2.5 95 94 60-125 1

FRIEDMAN & BRUYA, INC. _________________________________________________
ENVIRONMENTAL CHEMISTS
11
Data Qualifiers & Definitions a - The analyte was detected at a level less than five times the reporting limit. The RPD results may not provide reliable information on the variability of the analysis.
A1 – More than one compound of similar molecule structure was identified with equal probability.
b - The analyte was spiked at a level that was less than five times that present in the sample. Matrix spike recoveries may not be meaningful.
ca - The calibration results for this range fell outside of acceptance criteria. The value reported is an estimate.
c - The presence of the analyte indicated may be due to carryover from previous sample injections.
d - The sample was diluted. Detection limits may be raised due to dilution.
ds - The sample was diluted. Detection limits are raised due to dilution and surrogate recoveries may not be meaningful.
dv - Insufficient sample was available to achieve normal reporting limits and limits are raised accordingly.
fb - Analyte present in the blank and the sample.
fc – The compound is a common laboratory and field contaminant.
hr - The sample and duplicate were reextracted and reanalyzed. RPD results were still outside of control limits. The variability is attributed to sample inhomogeneity.
ht - Analysis performed outside the method or client-specified holding time requirement.
ip - Recovery fell outside of normal control limits. Compounds in the sample matrix interfered with the quantitation of the analyte.
j – The result is below normal reporting limits. The value reported is an estimate.
J - The internal standard associated with the analyte is out of control limits. The reported concentration is an estimate.
jl - The analyte result in the laboratory control sample is out of control limits. The reported concentration should be considered an estimate.
jr - The rpd result in laboratory control sample associated with the analyte is out of control limits. The reported concentration should be considered an estimate.
js - The surrogate associated with the analyte is out of control limits. The reported concentration should be considered an estimate.
lc - The presence of the compound indicated is likely due to laboratory contamination.
L - The reported concentration was generated from a library search.
nm - The analyte was not detected in one or more of the duplicate analyses. Therefore, calculation of the RPD is not applicable.
pc – The sample was received in a container not approved by the method. The value reported should be considered an estimate.
pr – The sample was received with incorrect preservation. The value reported should be considered an estimate.
ve - Estimated concentration calculated for an analyte response above the valid instrument calibration range. A dilution is required to obtain an accurate quantification of the analyte.
vo - The value reported fell outside the control limits established for this analyte.
x - The sample chromatographic pattern does not resemble the fuel standard used for quantitation.
CAoFg
Fo€oa
oFutDo
Nrc
pF.t
\.t
FI
(r
\,|ds, {
F{I
\AI
\r{
1
)<JI
J\
XI-\
(nDEp.o
U
ia
T R{
g,I
.as 5J9 ,
{ ,
(a
rnx Fu a
{ : . r
ttJ'
-ss--r
CN
€ s[ "
l ,t 't - ,
tj
e-t
e
-l'0
F,5oJ ., p
-to
$o\
il"1
h6tr"1
,^
F'*,
QgFri"l F+;
? r "' 8I
v,DEp-oa?T
tf
c -.s .C 1 "1 n vr8:i :*
E ' *oa
TPH-Dicscl
Dz
,, t ttn-c.*uot2a nuit'6v Eo2rB
VOCs byE260
SVOCg bv t2?0
t HFS
\9 5\ 6' t<' 7< r r+cto Yl-!
5) l*I F
Q LtH nrc €E vs 6r, 4hll{-f
E
I.DsSN
p$F
zBo .s:
ooB
EDF(<
FoE:*
kht Ft%Fl"tJt\t -l.l|\ttDx:*
l 4tfrtplrIt\
tsI
s$$$i$
u)gEFt{t
I
l G )t e
f-si>f,\
nHnx(n rH) i
iE
CA
EFvtaEFA
F
oFIH
H
2ortdo6v2rdoIt
ta.$I
-$I
Fo8 H
trtr tr
FgErttrx6 *tlu
gr$Esl iH