Embed Size (px)
Citation preview
TALACHE MILL SITE PRELIMINARY ASSESSMENT AND SITE INSPECTION REPORT
Boise National Forest, Idaho
March 28, 2005
Submitted to:
USDA Forest Service Intermountain Region 324—25th Street Ogden, Utah 84401-2310
Prepared by:
Millennium Science & Engineering, Inc. 1605 North 13th Street
Boise, Idaho 83702 Tel. (208) 345-8292 Fax (208) 344-8007
Talache PA/SI Page i
TABLE OF CONTENTS
Introduction .................................................................................................................................................1 Scope of Study ...............................................................................................................................1
SITE DESCRIPTION AND HISTORY..................................................................................................1 Site Location and Description......................................................................................................1 Local Land Use ..............................................................................................................................2 Geologic Setting.............................................................................................................................2 Hydrogeology.................................................................................................................................3 Flora and Fauna..............................................................................................................................3 Surface Water, Wetlands and Sensitive Environments ............................................................4 Site History and Operations .........................................................................................................4
SOURCE IDENTIFICATION..................................................................................................................7 Data Research.................................................................................................................................7 Field Data Collection ....................................................................................................................8
Mill Area .............................................................................................................................8 Dump Area ........................................................................................................................10 Tailings Area .....................................................................................................................10
PATHWAYS AND ENVIRONMENTAL HAZARD ASSESSMENT ...........................................12 Soil Exposure Pathway ...............................................................................................................12 Groundwater Pathway.................................................................................................................14 Surface Water Pathway...............................................................................................................15
SUMMARY AND CONCLUSIONS ....................................................................................................17
RECOMMENDATIONS FOR FURTHER ACTION.........................................................................17
REFERENCES..........................................................................................................................................18
TABLES
Table 1. Sample Details Table 2. Soil Laboratory Analytical Results and Summary of Risk Table 3. Analytical Results Summary for Unknown White Material (Sample: TDC) Table 4. Tailings Volume Estimates Table 5. SPLP Results Table 6. Groundwater Quality Data from Wells Downgradient of the Site Table 7. Domestic Water Supply Wells within 4 miles of the Talache Site Table 8. Summary of Surface Water Samples Collected at Various Points Along
Montezuma Creek Table 9. Threshold Effect Concentrations for Freshwater Sediment
Talache PA/SI Page ii
TABLE OF CONTENTS (CONTINUED)
FIGURES Figure 1. Vicinity Map Figure 2. Site Map and Sampling Locations
Figure 3. Tailings Area Detail Figure 4. Flowsheet for Talache Mines 300 Ton/day Mill
Figure 5. Location of Wells Within A 4-Mile Radius
APPENDICES Appendix 1 - Sampling and Analysis Plan
Appendix 2 - Results from Database Queries Appendix 3 - Site Photographs Appendix 4 - Laboratory Analytical Reports Appendix 5 - Well Drillers Logs
R1562.doc
Talache PA/SI Page 1
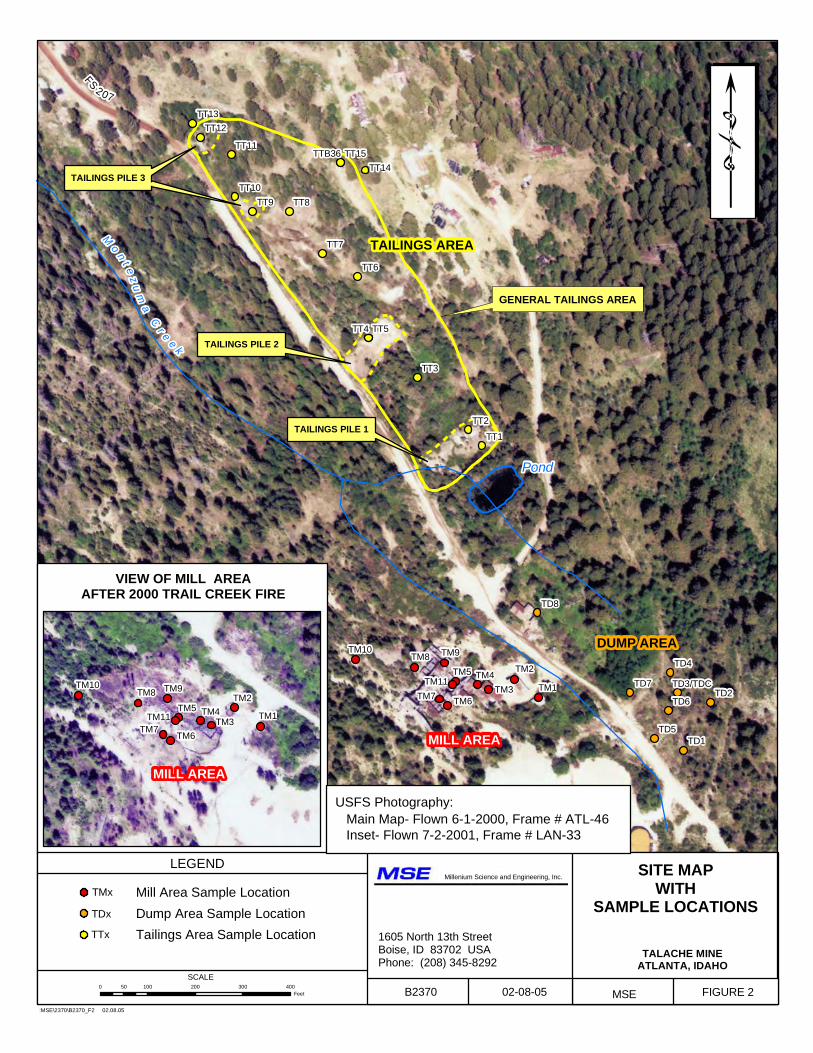
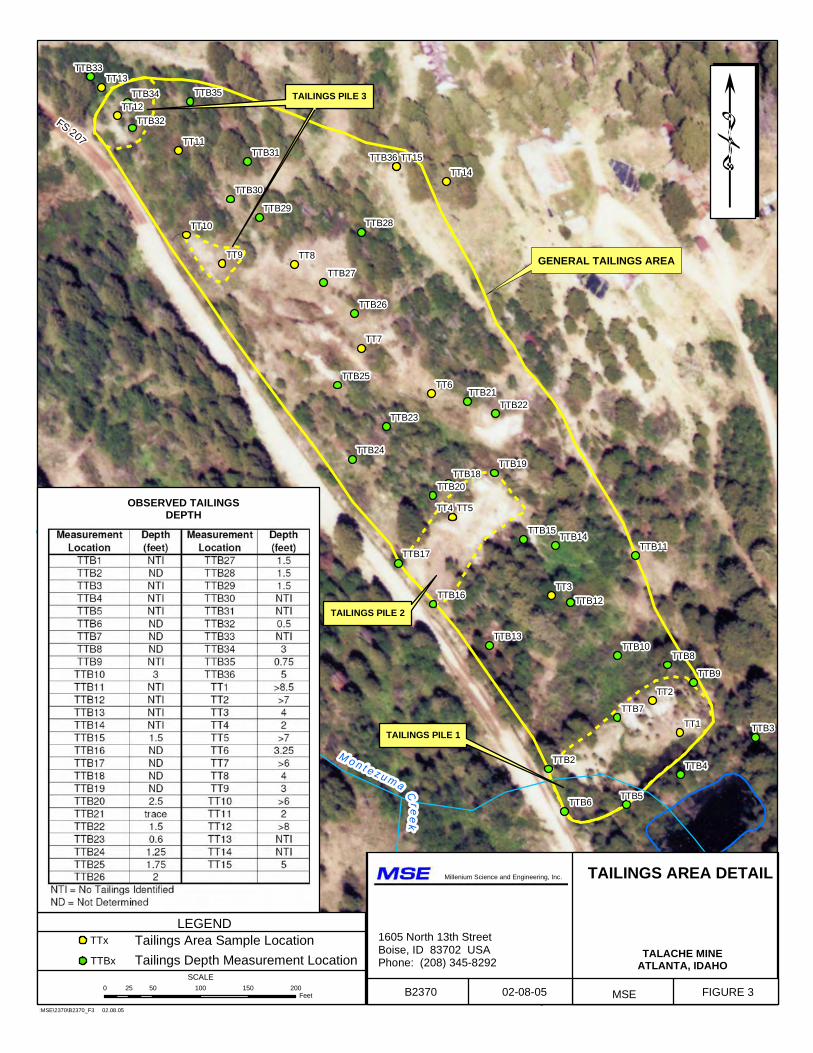
INTRODUCTION Millennium Science and Engineering, Inc. (MSE) was contracted by the USDA Forest Service to conduct a combined Preliminary Assessment and Site Inspection (PA/SI) for the Talache Mill site (herein referred to as the “Site” or “Talache Mill”) within the Boise National Forest near Atlanta, Idaho. The purpose of this study is to support a decision whether or not to pursue a removal action under the Comprehensive Environmental Response, Compensation and Liability Act (CERCLA). The investigation was performed under Hazardous Waste Remediation Services Contract 53-84N8-1-009, Activity III. This report presents the results of that PA/SI. The report is organized into the following sections: Introduction, Site Description and History, Source Identification, Pathways and Environmental Hazard Assessment, Summary and Conclusions, and Recommendations for Further Action. Scope of Study The work performed for this study involved conducting a combined PA/SI at the Site. The combined PA/SI integrates activities typically performed during the PA (information gathering, site reconnaissance) with activities typically performed during the SI (review of data, development of field work plans, field sampling) to achieve one continuous site investigation. This PA/SI was performed in accordance with our August 28, 2003 proposal to the Forest Service and our November 6, 2003 Sampling and Analysis Plan (attached as Appendix 1). MSE conducted the PA/SI for the Site in conformance with EPA guidance (EPA, 1991, 1992, and 1999a), and consistent with National Oil and Hazardous Substances Pollution Contingency Plan (NCP, 40 CFR 300), but without providing Hazard Ranking System (HRS) scoring. This PA/SI provides information for use by the Forest Service to score the Site according to the HRS and determine whether further action is warranted under CERCLA. SITE DESCRIPTION AND HISTORY The following sections describe the Site and available information regarding the history of the Talache mine and mill. Site Location and Description The project site is located within the Boise National Forest, in Elmore County, Idaho (T.5N, R.11E, Sec 2), approximately 1 air mile southeast of Atlanta, Idaho (See Figure 1 for vicinity map). The Site was accessed by traveling approximately 1 mile south from the town of Atlanta on FS 207. For purposes of this report, the Site (see Figure 2) includes the historic location of the Talache mill (Mill Area), drum and equipment dump (Dump Area), and location of former tailings ponds (Tailings Area). Within the Tailings Area (see Figure 3) there are three distinct tailing piles (Tailings Pile 1, Tailings Pile 2, and Tailings Pile 3). These areas are identified on Figure 2. The main Talache mining camp was located to the north of the Tailings Area. The Talache Mine “900 level” mine adit is located approximately 500 feet southeast of the Mill Area (not shown on Site figures). Two large tailings repositories are located to the north of the Site (not identified on Site figures), these tailings are associated with former beneficiation operations of the Talache mine but were not a part of this investigation. These tailings repositories were subject of investigation by
Talache PA/SI Page 2
MFG/Terracon (Final Site Characterization Report, Talache Mine Tailings Site, Atlanta, Idaho, May 2000). Local Land Use The Site is located on and surrounded by Forest Service land. The town of Atlanta is within a mile of the site. According to Draft Elmore County 2004 Comprehensive Growth and Development Plan, the population of Atlanta is 70. The only developments in the area, with the exception of the town of Atlanta, are other mines. Reportedly, the Talache Mill has not operated since 1982 and the Talache mine operations were discontinued in 1991. The majority of wooden structures associated with mining activities at the site burned during the 2000 Trail Creek fire. Geologic Setting The geological conditions in the vicinity of the Site consist of a thin veneer of alluvial and/or colluvial sediments underlain by plutonic bedrock. Glacial deposits exposed near the town of Atlanta form low rolling hills and elongate ridges on both sides of the Middle Fork of the Boise River and appear to cover the majority of the valley floor. They were likely deposited by glacial activity during the most recent glacial period approximately 20,000 years ago (Bond, 1978). The glacial till consists of unsorted boulders and gravels in a silty sand matrix. Boulders are up to 6 feet in diameter (MFG et al., 2000). Alluvial deposits are present at the floor and lower walls of the Middle Fork of the Boise River canyon and its tributary drainages. Granitic sands, gravels and cobbles of mineralized quartz and andesitic volcanic rock dominate these sediments. A large portion of the gravel deposits contained within the Middle Fork of the Boise River canyon and its tributary drainages have been removed, processed and returned to the stream channel during historic placer mining activities. These processed gravels and tailings were returned to the river and stream channels in large piles and today appear as resistant knobs of rounded cobble to boulder-sized rock (Taylor, 1986). Granitic plutonic rocks of the Cretaceous-aged Atlanta Lobe of the Idaho Batholith and associated intrusive rocks dominate the bedrock beneath the unconsolidated sediments present at the Site. The composition of the batholith beneath the Site is biotite granodiorite, which is a porphyritic, gray to light gray, medium- to coarse-grained rock. These rocks have been shattered and sheared during several periods of uplift and faulting associated with the Montezuma Fault Zone. The Montezuma Fault is a north-northwest structure and forms a prominent scarp east of Atlanta on the east side of Montezuma Creek. The fault extends southeast along Decker Creek and northwest across the Middle Fork of the Boise River. The main shear in the area is known as the Atlanta Lode and extends nearly two miles along strike of N60E and generally exhibits a 50 to 300 foot width. There is extensive deep-seated mineralization in the Atlanta Lode, which is not typical of epithermal deposits (Taylor, 1986).
Talache PA/SI Page 3
Hydrogeology A groundwater evaluation in the area of the Talache Mill was not conducted by MSE during this investigation. However, according to a report by MFG et al. (2000) prepared for work performed near Atlanta at the Talache Mine Tailings site (to the north of the Tailings Area investigated for this report), groundwater in the area is found in two aquifer systems: a shallow water bearing unit in alluvial deposits and in a deeper bedrock aquifer. The water table in the alluvial aquifer is commonly less than 10 feet below ground surface. The alluvial aquifer is most likely recharged by the annual snow pack and runoff from the adjacent crystalline bedrock, which make up the majority of the upper slopes around Atlanta, Idaho. Groundwater flow direction is from the southeast to the northwest, towards the Middle Fork of the Boise River (MFG et al., 2000). The depth to groundwater beneath the Tailings Area appears to be relatively shallow with ponding and seeps present. During tailings sampling performed by MSE, water was encountered at depths ranging from ground surface to approximately 7 feet below ground surface. The deeper groundwater in bedrock beneath the Site is present in fractures and joints. The frequency, orientation and size of fractures and joints will tend to control groundwater movement through the subsurface. Well logs from the Idaho Department of Water Resources depict static groundwater levels in wells completed in the granitic bedrock at depths between 35 and 175 feet below ground surface. Groundwater flow in the fractured bedrock is reportedly to the northwest towards the Middle Fork of the Boise River (MFG et al., 2000). Flora and Fauna The area consists of upland vegetative communities, riparian communities along river and stream corridors, and wetland communities. Upland vegetation in this management area includes grasslands, shrublands and forests (USFS, 2003). Vegetative communities in the lower elevations of the management areas include grasses, shrubs (Mountain Big Sage and Montane Shrub), ponderosa pine and Douglas fir. Shrubs and forest communities of Douglas-fir and subalpine fir with some lodgepole pine and aspen occupy mid-elevation regions. Upper elevation vegetative communities are dominated by subalpine fir and whitebark pine (USFS, 2003). Riparian and wetland vegetation in the area include rushes, sedges, horsetail, willows, and aspen (MFG et al., 2000). There is no known occurrence of federally listed or proposed plant species in this area; however, there may be potential habitat for Ute ladies’-tresses and slender moonwort. Ute ladies’-tresses (threatened species) may have potential habitat in riparian/wetland habitats from 1,000 to 7,000 feet in elevation. Slender moonwort (candidate species) may have potential habitat in mid-to-high elevation grasslands and meadows (USFS, 2003). Three USFS Region 4 sensitive species are known to occur in this management area including Idaho douglasia, giant helleborine orchid, and Bryum moss. A proposed sensitive species (Kellogg’s bitterroot) and a watch list species (Swamp onion) are also known to occur in this management area (USFS, 2003). A wide variety of wildlife is known to occur in the vicinity of the Site. Five federally listed species potentially occupy areas near the Site including the gray wolf, Canada lynx, bald
Talache PA/SI Page 4
eagle, yellow-billed cuckoo, and bull trout. In addition, the area may provide habitat for thirteen Forest Service designated sensitive species including the wolverine, fisher, Townsend’s big-eared bat, spotted bat, northern goshawk, white-headed woodpecker, northern three-toed woodpecker, flammulated owl, boreal owl, great gray owl, mountain quail, westslope cutthroat trout, and spotted frog (USFS, 2003). Surface Water, Wetlands and Sensitive Environments The Site is in the Upper Middle Fork of the Boise River (HUC 1705011108) basin. Montezuma Creek, a tributary to the Middle Fork Boise River, flows through the Site. Flow from the 900 level Talache adit discharges to Montezuma Creek, the creek flows along the western side of the FS207 past the Mill Area and then flows towards the Middle Fork of the Boise River. Water from the pond located south of the Tailings Area flows across the road into the Montezuma Creek. The East Fork of Montezuma Creek joins the Montezuma Creek approximately 300 feet northwest of the Tailings Area. Although snowmelt runoff is the primary contributor to surface water flows in the area, spring and summer rains provide some contribution to stream flows. The base flow in the streams is likely provided by groundwater recharge (including: springs, seeps, and mine discharges). The Site is not within the 500-year storm flood plain denoted on the Flood Insurance Map (FIRM) for Elmore County, Idaho (Panel 150 of 850 – June 19, 1989). The town of Atlanta obtains drinking water (Supply No. 4200005) from a diversion from the East Fork of Montezuma Creek. This is the primary water supply for Atlanta. There are two intakes for the water supply on the East Fork of Montezuma Creek, one is located about ¾ of a mile upstream from the confluence with Montezuma Creek and the other is approximately 450 feet east of FS207. According to the 2003 Initial Plan of Operations prepared for the Atlanta Gold Project by EarthWorks Technology, the Middle Fork of the Boise River has a drainage area of 92 square miles, and drainage area of Montezuma Creek is 2.6 square miles. (EarthWorks, 2003). Flow measurements at Montezuma Creek downstream of the East Fork of Montezuma Creek from 1997 through 1999 were a minimum of 0.34 cubic feet per second (cfs) in December 1998 and a maximum of 15.8 cfs in May 1998 (MFG et al., 2000). Site History and Operations The following is a discussion of the history of mining operations at the Talache Mine, primarily extracted from the Idaho Geological Survey, June 200 report, History of the Atlanta Mining Area, Elmore County, Idaho. The focus in this summary is the physical location of operations, owners/operators of facilities, mining practices, and chemicals that were used. The Talache Mine (referenced as “Tolache Mine” on USGS 24 minute topographic map) also known as the Boise-Rochester Mine, the Bagdad-Chase, and the Saint Joe covers the northeast end of the Atlanta lode from the east crest of the Atlanta Hill to the bottom of Montezuma gulch. This part of the lode was at one time divided into the Old Chunk, Stedtman, and Lombard properties. These properties were later combined as the Pettit Mine.
Talache PA/SI Page 5
1869 Work appears to have started at the mine. Ore was mined from the Pettit ore body in the 1870’s through a 100-foot vertical shaft, and later a tunnel from the lower slope facing Montezuma Gulch. A 20 stamp mill was operated near the bottom of Montezuma Gulch but apparently the mill recovery was unsatisfactory.
1906 The Petit mine was sold to the Bagdad-Chase Gold Mining Company.
1907 A mill was built that included 20 stamps, vanners, and Callow screens. Gold and silver concentrates were recovered after being roasted and treated with cyanide.
1908 Equipment added to the mill included 16 Frue vanners, eight slime tables, an additional Callow screen, dewaters, Dimmick sizers, a 16-foot tube mill, a Pierce amalgamator with 12-foot copper plates, and 150 ton per day cyanide plant.
1910 Mine closed due to difficulties in beneficiating the ore.
1914 Mine reopened by Boise-Rochester Mining Company (which was apparently reorganized from the Bagdad-Chase Gold Mining Company).
1916 The company worked the Old Chunk orebody from the 600 level. A 100-ton flotation plant was added to the mill.
1917 The Boise-Rochester mine was optioned to the St. Joseph Lead Company.
1919 Operations at the mine were discontinued.
1931 The mill was torn down and a new amalgamation and flotation mill with 200 ton capacity was constructed near the portal of the 900 level tunnel (the mill area investigated in this site investigation). A flow sheet describing the beneficiation of ore at the mill is shown in [Figure 4]. A 360-horsepower diesel engine, driving an electric generator, synchronized with an old 125-horsepower hydroelectric plant, was installed for power purposes. Fuel for the generator was stored in two 50,000 gallon above ground storage tanks. A new 1,000-cubic foot electrically driven Ingersoll-Rand compressor, a Mancha storage-battery locomotive, and all necessary mining machinery and equipment were installed to support mining activities at the mill
Description of Tailings Handling
The following is an excerpt from the IGS, 2000 report regarding tailings handling at the mill: A flow sheet describing the beneficiation of ore at the mill is shown in [Figure 4]. The tailing from the ore beneficiation was conveyed in a launder (an elevated wooden flume) for a distance of 500 feet from the mill where it dumped into a ditch 1,000 feet in length, which led to three impounding ponds built in tandem in Montezuma Gulch. The impounding dams were constructed by laying three or four rows of logs, tied together by cross logs, across the bottom of the gulch; when these filled, the sand was then shoveled against the top log and carried upward in alternate steps with a stope or batter of 45 degrees on the down hill slope. Each dam was provided with a
Talache PA/SI Page 6
decanting launder at the top. The ditch and ponds were so arranged that only one pond at a time was in use. The overflow from the ponds went through a 2,000 foot ditch which emptied into a settling pond with an area of 300 square yards. The effluent from the settling pond flowed into the Montezuma Creek which ultimately discharges into the Middle Fork of the Boise River.
Amalgamation Process
The following is an excerpt from the IGS, 2000 report regarding amalgamation at the mill and the reagents that were used: The amalgamation plates are dressed one at a time every 2 hours. After the feed is diverted, a plate is washed with clear water from a hose. Mercury is applied to spots were the amalgam is hard. The plate is then brushed lightly with a dilute solution of ammonium chloride…Mercury used for dressing the plates is cleaned with sulphuric acid to remove oil. An average of 40 ounces is used for each dressing of the plates…The amalgam is removed from the plates once each 24 hours. After the feed is shut off a plate is washed clean with water from a hose. Soft amalgam is scraped to the top of the plate with a section of rubber belting and taken off with putty knives. Then the plate is washed with caustic soda solution and hosed off. Enough mercury is sprinkled on the plate to bring the amalgam remaining on it to proper hardness…The amalgam, cleaned daily from the plates, together with amalgam from traps and riffles, is ground 3 hours in a ball mill with hot water and enough mercury to make the amalgam soft. The ground amalgam is then washed with hot water and cleaned with a magnet until all the metallic iron and sulphides have been removed. The amalgam is then wiped dry with cloths. Two hundred ounces is set aside for plate dressing the following day the remaining amalgam is squeezed in an amalgam press. This squeezed amalgam is very hard and contains from 58 to 65 percent mercury…2.0 pounds of soda ash, 0.6 pound of copper sulphate, and 0.01 pounds of potassium-xanthate [per ton of ore milled] are added to the Marcy-mill discharge. Eighty-four thousandths (0.084) pound of cresylic acid, 0.017 pound of pine oil, 0.13 pound of Barrett no. 4 creosote, 0.064 pound of potassium xanthate, and 0.067 pound of aerofloat no. 25 are added to the flotation circuit ahead of the 3-inch Wifley pump.
1935 The company began milling old tailings in combination with ore. Mining operations
were discontinued. 1936 The mine was acquired by the Sawtooth Company. 1937 The mine was acquired by Talache Mines. The milling capacity was increased to 200
tons daily. 1941 The milling capacity was increased to 350 tons per day with the installation of six
Denver flotation machines. 1944 The mine was forced to stop major operations due to a shortage of labor and
Government restrictions associated with the war.
Talache PA/SI Page 7
1946 The mine was operated by an average of 25 lessees. 1953 Talache Mines discontinued operations at the property. Former employees and lessees
continued limited operations. Production from 1902 to 1963 was an estimated 856,876 tons of ore and 55,978 tons of reprocessed tailings.
1966 Talache Mines forfeited its charter. 1981 The property was leased by Yankee Machine Shop, it appears that primarily
exploration work was conducted. 1983 The property was subleased to Atlanta Gold Corporation, approximately 123 tons of
ore were processed. 1997 One of two historic tailings impoundments that stored tailings from Talache mine
operations failed, releasing 16,000 cubic yards of tailings into the valley below (referred to as Depositional Area). These tailings impoundments are located to the north of the Site. A time critical removal action was completed to contain the release and additional non-critical removal actions were conducted to further stabilize the site.
2000 The Trail Creek Fire burned much of the Mill Area. Existing buildings were
destroyed. A 1,000 pound liquid petroleum gas tank “cooked off” during the fire. Unknown chemicals stored at the Mill Area may have been combusted by the fire.
Due to the cyaniding and amalgamation process described during past milling activities, historical wastes generated most likely included cyanide and mercury; however, there was no available documentation on the quantity of waste, the disposal practices or the exact source areas. SOURCE IDENTIFICATION Source identification was based on available data research and field data collection efforts, which consisted of visual observations and collection and analysis of samples from the Mill Area, the Dump Area, and the Tailings Area. Data Research MSE personnel reviewed available databases and public records for information on the Site. No operational permits issued by the Idaho Departments of Lands, the Idaho Department of Environmental Quality (IDEQ), or the Forest Service were found for the Site. The Site was not found in the RCRAInfo or IDEQ LUST databases. The Site is not listed in the CERCLIS database but tailings repositories associated with the site are listed (EPA ID: ID0002007250). The facility name listed in the CERCLIS database is “Talache Mine”, entries are provided for the tailings repository failure that occurred in 1997 and the subsequent removal activities. Multiple Environmental Protection Agency (EPA)
Talache PA/SI Page 8
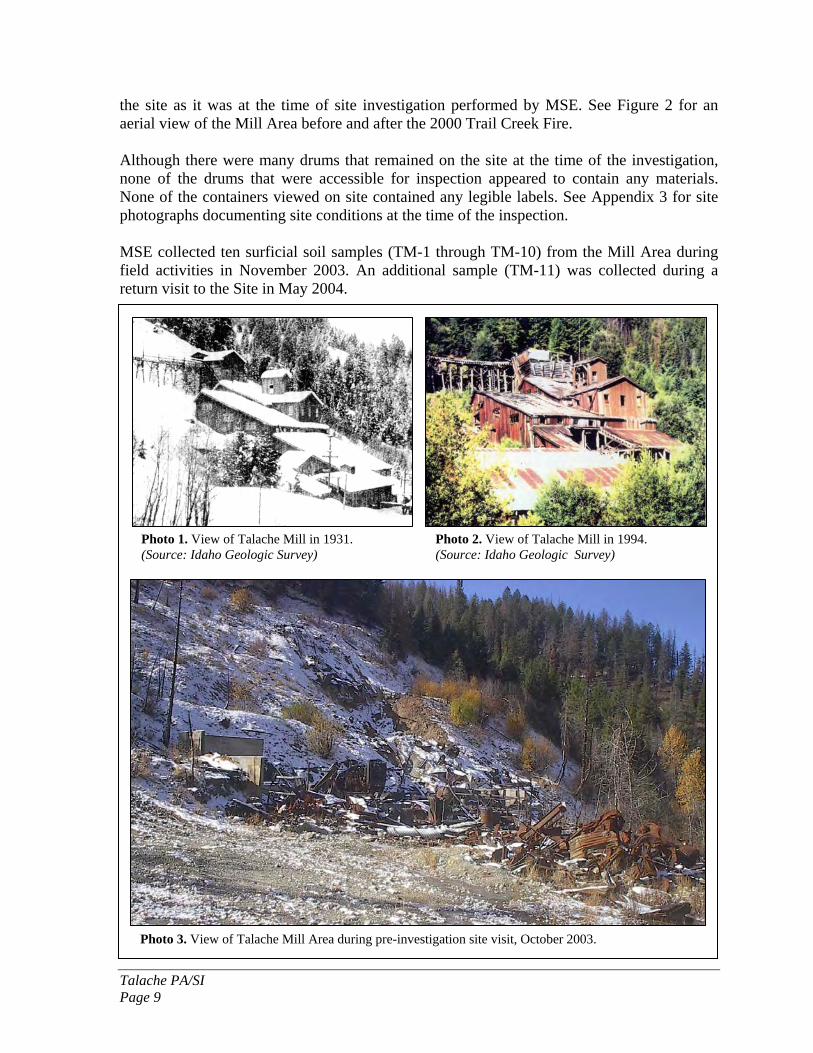
enforcement actions are listed for the tailings repository site. The tailings repository site also appears in the Facility Registry System (FRS) database as “Talache Mine Tailings Superfund Site” (Registry ID: 11001680600). Multiple formal enforcement actions are listed for years 1999 and 2002. See Appendix 2 for results of database queries. A summary document included in the Request for Proposal for the work completed for this report indicated that “some chemicals were removed from the premises by a Professional Hazardous Materials remediation contractor in 1995”. No manifests were readily available for this reported activity. An NPDES Permit (IDU00055) for Talache Mine 900 Level Adit discharge to Montezuma Creek is identified in the Water Discharge Permits (PCS) database. This permitted discharge is to the southeast of the Mill Area. An enforcement action (Docket Number CWA10980041) is listed for this permitted discharge in January 1998. This enforcement action was later withdrawn. Field Data Collection Site work included visual inspection and collection of samples. Prior to performing sampling, a scoping site visit was conducted on October 31, 2003. Troy Riecke of MSE and Jim Curtis of the Boise National Forest were present. During the week of November 10, 2003, Troy Riecke and Johnna Evans of MSE conducted the main field effort. Troy Riecke performed an additional site visit on May 3, 2004. For purposes of the investigation the site was split into three functional areas: Mill Area, Dump Area, and Tailings Area. The following sections describe these functional areas and the work performed at each of these areas. Samples were collected at varying depths below ground surface using a hand auger (where needed) and single-use disposable wooden spoons. Table 1 summarizes sampling details, including: date sampled, sample collection depth, and the requested analyte list. Photographs of sample locations are included in Appendix 3. Collected soil and tailings samples were submitted to SVL Analytical of Kellogg, Idaho for analysis. See Appendix 4 for laboratory reports and chain of custody documents. Soil sample locations are depicted on Figure 2 and the laboratory analytical results are presented in Table 2. Mill Area The Mill Area is the location of the historical Talache mill (See Figure 2 for location). The mill reportedly operated at the location from 1931 to 1964 and then intermittently until 1982. The Trail Creek Fire of 2000 destroyed all buildings that may have remained on the mill property (the destruction from the fire may have been enhanced as a result of combustion of liquid petroleum gas contained in a 1,000 pound tank at the mill). At the time of the investigation by MSE only concrete footings/foundations from the mill structures and metal refuse (including drums, roofing materials, equipment, and abandoned vehicles) were present on the site. See Photo 1 for a view of the Talache Mill building soon after construction in 1931, see Photo 2 for a view of the mill photographed in 1994, and see Photo 3 for a view of
Talache PA/SI Page 9
the site as it was at the time of site investigation performed by MSE. See Figure 2 for an aerial view of the Mill Area before and after the 2000 Trail Creek Fire. Although there were many drums that remained on the site at the time of the investigation, none of the drums that were accessible for inspection appeared to contain any materials. None of the containers viewed on site contained any legible labels. See Appendix 3 for site photographs documenting site conditions at the time of the inspection. MSE collected ten surficial soil samples (TM-1 through TM-10) from the Mill Area during field activities in November 2003. An additional sample (TM-11) was collected during a return visit to the Site in May 2004.
Photo 1. View of Talache Mill in 1931. (Source: Idaho Geologic Survey)
Photo 2. View of Talache Mill in 1994. (Source: Idaho Geologic Survey)
Photo 3. View of Talache Mill Area during pre-investigation site visit, October 2003.
Talache PA/SI Page 10
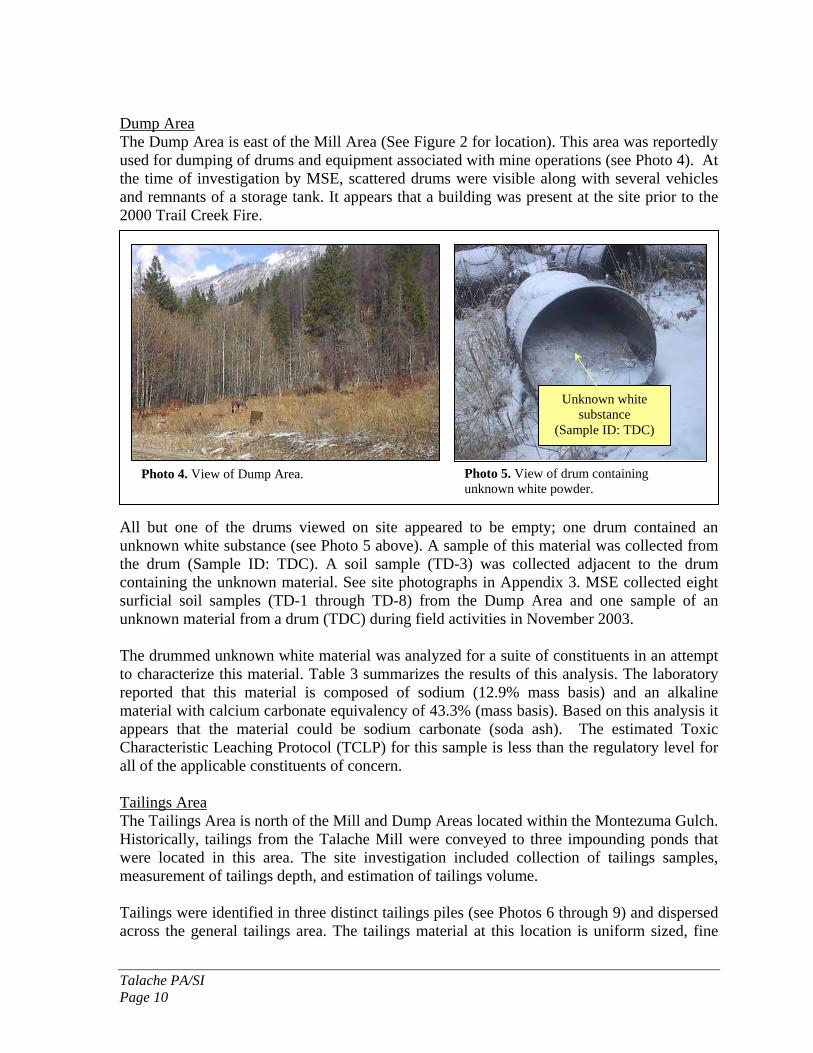
Dump Area The Dump Area is east of the Mill Area (See Figure 2 for location). This area was reportedly used for dumping of drums and equipment associated with mine operations (see Photo 4). At the time of investigation by MSE, scattered drums were visible along with several vehicles and remnants of a storage tank. It appears that a building was present at the site prior to the 2000 Trail Creek Fire. All but one of the drums viewed on site appeared to be empty; one drum contained an unknown white substance (see Photo 5 above). A sample of this material was collected from the drum (Sample ID: TDC). A soil sample (TD-3) was collected adjacent to the drum containing the unknown material. See site photographs in Appendix 3. MSE collected eight surficial soil samples (TD-1 through TD-8) from the Dump Area and one sample of an unknown material from a drum (TDC) during field activities in November 2003. The drummed unknown white material was analyzed for a suite of constituents in an attempt to characterize this material. Table 3 summarizes the results of this analysis. The laboratory reported that this material is composed of sodium (12.9% mass basis) and an alkaline material with calcium carbonate equivalency of 43.3% (mass basis). Based on this analysis it appears that the material could be sodium carbonate (soda ash). The estimated Toxic Characteristic Leaching Protocol (TCLP) for this sample is less than the regulatory level for all of the applicable constituents of concern. Tailings Area The Tailings Area is north of the Mill and Dump Areas located within the Montezuma Gulch. Historically, tailings from the Talache Mill were conveyed to three impounding ponds that were located in this area. The site investigation included collection of tailings samples, measurement of tailings depth, and estimation of tailings volume. Tailings were identified in three distinct tailings piles (see Photos 6 through 9) and dispersed across the general tailings area. The tailings material at this location is uniform sized, fine
Photo 4. View of Dump Area.
Unknown white substance
(Sample ID: TDC)
Photo 5. View of drum containing unknown white powder.
Talache PA/SI Page 11
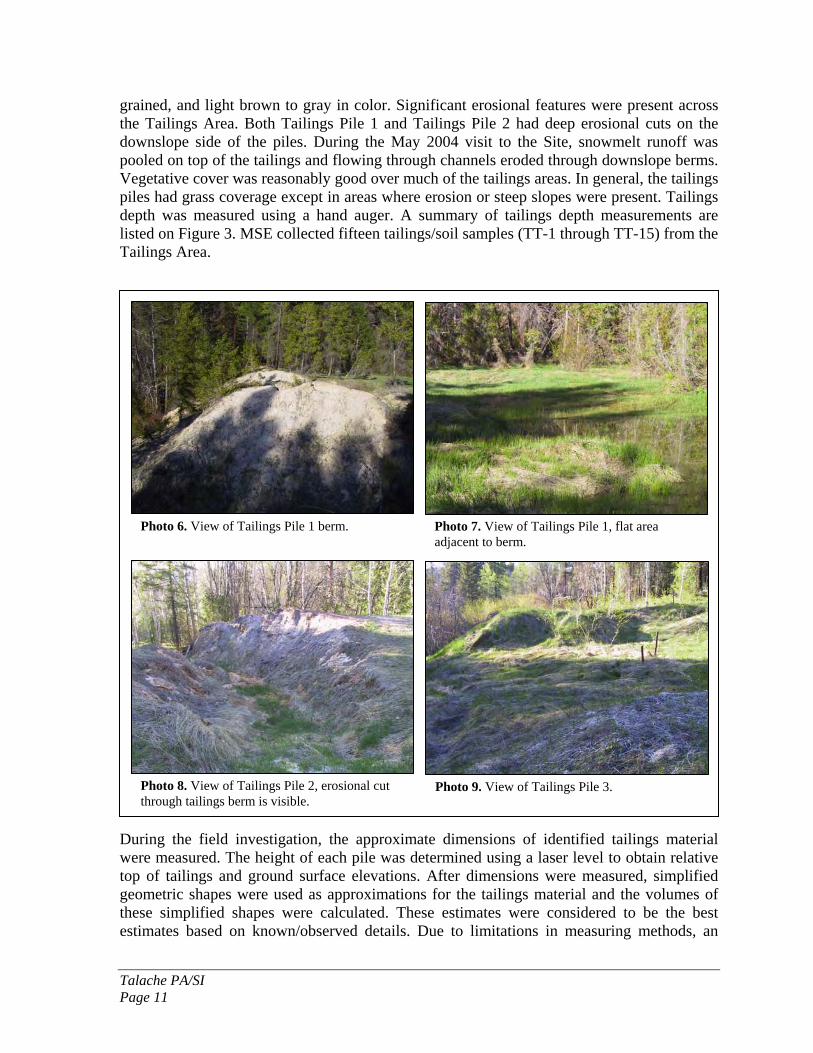
grained, and light brown to gray in color. Significant erosional features were present across the Tailings Area. Both Tailings Pile 1 and Tailings Pile 2 had deep erosional cuts on the downslope side of the piles. During the May 2004 visit to the Site, snowmelt runoff was pooled on top of the tailings and flowing through channels eroded through downslope berms. Vegetative cover was reasonably good over much of the tailings areas. In general, the tailings piles had grass coverage except in areas where erosion or steep slopes were present. Tailings depth was measured using a hand auger. A summary of tailings depth measurements are listed on Figure 3. MSE collected fifteen tailings/soil samples (TT-1 through TT-15) from the Tailings Area. During the field investigation, the approximate dimensions of identified tailings material were measured. The height of each pile was determined using a laser level to obtain relative top of tailings and ground surface elevations. After dimensions were measured, simplified geometric shapes were used as approximations for the tailings material and the volumes of these simplified shapes were calculated. These estimates were considered to be the best estimates based on known/observed details. Due to limitations in measuring methods, an
Photo 6. View of Tailings Pile 1 berm. Photo 7. View of Tailings Pile 1, flat area adjacent to berm.
Photo 8. View of Tailings Pile 2, erosional cut through tailings berm is visible.
Photo 9. View of Tailings Pile 3.
Talache PA/SI Page 12
uncertainty factor was associated with each estimate and a high and low estimate was determined. Table 4 summarizes the estimated tailings volumes. PATHWAYS AND ENVIRONMENTAL HAZARD ASSESSMENT Human and ecological receptors in the vicinity of the Site may be exposed to metal contamination via several contaminant migration pathways including soil, groundwater, and surface water. Potential exposure routes include inhalation of airborne dust and ingestion of groundwater, surface water, soil, sediment, and fish. For this PA/SI, risk management criteria (RMC) developed by Karl Ford (1996) were used for human and wildlife exposures to contaminated media. Ford (1996) developed a method by which to categorize the level of risk to both human and ecological receptors when there are exceedances of the criteria. He proposed the following:
• Less than criteria = low risk; • 1-10 times the criteria = moderate risk; • 10-100 times the criteria = high risk; • Greater than 100 times the criteria = extremely high risk.
The following sections describe each of the contaminant migration pathways in detail. Each section discusses the potential sources of contamination, potential receptors and exposure routes, and risk estimates (where information is available). Soil Exposure Pathway Soil, for the purpose of this investigation, includes native disturbed and undisturbed soils and mine tailings. The primary sources of soil contamination in the vicinity of the Site include process chemicals from the milling process, tailings, waste rock material, and natural background sources of metals from local geology. Potential human receptors for soil contamination near the Site include residents of Atlanta and seasonal visitors (campers, workers, surveyors) that come into contact with the ground surface. Since there are no residences within 200 feet of the Site, we did not assess the risk to human residents because it is unlikely that anyone would be in contact with the ground surface material on the Site for substantial lengths of time. Terrestrial and avian wildlife may also be exposed to contaminated soils. The exposure routes posed to both human and wildlife receptors include ingestion of the soils and inhalation of airborne dust. There are no available historic soil analytical results for the Site; therefore we have relied upon the data collected in 2003 for this assessment. Ford developed RMC for human and ecological receptors that have the potential to ingest soils contaminated with metal. The risk posed to both human and ecological receptors from soil contamination at the Site is discussed in the following paragraphs. Human Receptors Ford (1996) developed risk management criteria for human exposure to eleven contaminants of concern, which include antimony, arsenic, cadmium, copper, lead, mercury, manganese,
Talache PA/SI Page 13
nickel, selenium, silver, and zinc. The RMC for workers, campers, and ATV drivers are presented in Table 3. In order to assess the human risk for exposure to contaminated soils, we applied the most conservative RMC. For example, antimony RMC criteria for workers, campers, and ATV drivers are 100 mg/kg, 50 mg/kg, and 750 mg/kg, respectively. We applied the camper RMC when evaluating the degree of risk posed to human receptors from antimony at the Site. Results of the human risk screening analysis for each functional area (Mill Area, Dump Area, and Tailings Area) summarized in Table 2 and discussed below. Mill Area Measured concentrations of antimony, arsenic, lead, and mercury all had moderate or higher risk to human receptors for one or more samples. All of the soil samples exhibited arsenic concentrations that posed at least a moderate risk to human receptors. Three of the soil samples exhibited arsenic concentrations in quantities that posed an extremely high risk to human receptors. The concentrations (and associated risk) of arsenic measured in sample TM-5 and lead measured in sample TM-2 are approximately ten times higher than any other samples collected at the site. Dump Area Only arsenic had moderate or higher risk to human receptors for one more samples. None of the samples exhibited concentrations that were considered extremely high risk to human receptors. Except for sample TD-8 (collected directly across FS207 from the Mill Area) none of the samples had concentrations of constituents of concern that were elevated above background. Based on this analysis, the surficial soils in this area do not appear to be significantly impacted by metals from nearby mining operations. Tailings Area All of the soil samples exhibited arsenic concentrations that posed at least a moderate risk to human receptors. None of the other constituents of concern were measured at concentrations that ranked moderate or higher or for human risk. Seven of the samples exhibited arsenic concentrations that posed extremely high risk to Human Receptors. Ecological Receptors RMC have been developed for wildlife exposure to six constituents of concern including arsenic, cadmium, copper, lead, mercury and zinc. The selected wildlife receptors at the Site are the robin, deer mouse, and mule deer. Similar to the human risk assessment, we compared the most conservative RMC with observed concentrations to establish the degree of risk posed to ecological receptors on the Site. Results for our analysis are summarized in Table 2 and discussed for each functional area below. Mill Area Measured concentrations of arsenic, cadmium, copper, lead, mercury, and zinc all had moderate or higher risk to ecological receptors for one or more samples. All of the soil samples exhibited arsenic, copper, lead, and zinc concentrations that posed at least a moderate risk to ecological receptors. Constituent concentrations in quantities that posed an extremely high risk to ecological receptors were measured in seven of the soil samples for arsenic, two samples for lead, and one sample for mercury. The concentrations (and
Talache PA/SI Page 14
associated risk) of arsenic measured in sample TM-5 and lead measured in sample TM-2 are approximately ten times higher than any other samples collected at the site. Dump Area Measured concentrations of arsenic, cadmium, copper, lead, and zinc had moderate or higher risk to ecological receptors for one more samples. None of the samples exhibited concentrations that were considered extremely high risk to ecological receptors. Except for sample TD-8 (collected directly across FS207 from the Mill Area) none of the samples had concentrations of constituents of concern that were elevated above background. Based on this analysis, the surficial soils in this area do not appear to be significantly impacted metals from nearby mining operations. Tailings Area Measured concentrations of arsenic, copper, lead, mercury, and zinc had moderate or higher risk to ecological receptors. All of the soil samples exhibited arsenic and lead concentrations that posed at least a moderate risk to ecological receptors. Twelve of the samples exhibited arsenic concentrations that posed extremely high risk to ecological receptors.
Groundwater Pathway Shallow groundwater was observed at the Tailings Area during measurement of tailings depth. At some sampling and depth measurement locations it appeared that groundwater might have been in direct contact with tailings material. This groundwater could become contaminated by the dissolution of metals. Besides the potential for direct groundwater/tailings contact, it is also possible that infiltration of excess precipitation could transport contaminants to groundwater. Precipitation at the Site is anticipated to be high, approximately 40 inches per year (Idaho State Climate Services) and shallow subsurface materials are relatively coarse. These factors indicate that the potential exists for infiltration to transport soil contaminants to shallow groundwater. Assessment of groundwater quality was not part of the scope of this project. No groundwater samples were collected during the field investigation. To further evaluate the potential for leaching of metals from soils, a Synthetic Precipitation Leaching Procedure (SPLP) extraction was performed on three samples collected at the Site. This test simulates leaching by a solution of a hydrochloric and nitric acids at a pH value of 5 and is intended to be representative of precipitation/rainfall in western states. The results from this analysis are summarized in Table 5 and laboratory reports are contained in Appendix 4. The groundwater maximum contaminant level (MCL) for arsenic and antimony and the Toxic Characteristic Leaching Procedure (TCLP) for arsenic are listed for comparison purposes. All of the SPLP measurements exceeded the groundwater MCL for both arsenic and antimony. Several monitoring wells are present downdgradient of the site (MW-10, MW-11, and 604A through 604F). These wells serve as upgradient wells for monitoring conducted at the tailings repository by Terracon. Table 6 summarizes the measured arsenic concentration in monitoring wells that are downgradient of the Site. It appears the measured concentrations of arsenic in samples collected from wells completed in the shallow aquifer (601F, MW-10, and
Talache PA/SI Page 15
MW-11) are low and below the MCL for arsenic while the measured concentration of arsenic in samples collected from wells completed in the deeper bedrock aquifer (604A through 604F) are above the MCL for arsenic. Based on these results it does not appear that the Site is significantly impacting the shallow groundwater downgradient of the Site. It is not known if the deeper groundwater is impacted by leaching of contaminants from the Site but it appears unlikely based on the observed shallow groundwater monitoring results. A well log search for domestic water supply wells within a 4-mile radius of the Site was conducted by reviewing available driller’s well logs both on the Idaho Department of Water Resources internet page and at their state office in Boise, Idaho. The search revealed nine domestic wells were present within a 4-mile radius of the Site (see Table 7). The total depth of the wells ranged from 60 to 326 feet below ground surface. Three wells were drilled into granite, while the other six wells were completed in alluvium (sand and gravel). While generally details provided on the wells logs do not allow exact location of the wells, it appears that most of the identified wells are downgradient of the site. Well locations are depicted on Figure 5 and copies of available well driller logs are included in Appendix 5. Surface Water Pathway Specific surface water contaminant sources from the Site may include overland runoff of dissolved metals and metal-laden sediment from mine waste material and tailings, discharge from natural (background) sources of contamination, and the discharge of contaminated groundwater to surface water (gaining stream, wetland, or spring). Potential human receptors for surface water contamination on the Site include seasonal visitors (campers, workers, surveyors) that inadvertently ingest surface water during recreational activities on Decker Creek and consume fish caught from the creek or nearby river. Terrestrial wildlife are also potential receptors that may ingest surface water from the Site. Aquatic organisms residing within the Site and in downstream habitats are also susceptible to surface water and sediment contamination. Additional targets for the surface water pathway include wetlands and sensitive environments such as bull trout critical habitat and wild and scenic waterways on the Middle Fork of the Boise River. MSE did not collect surface water samples as part of this PA/SI. There is some limited historical analytical data for surface water samples within or near the Site; much of this data is summarized in the MFG et al., 2000 report. Most of the historical data is from sampling points downstream of the Site. One historical set of data of interest is a sequence of surface water samples collected from Montezuma Creek and its tributaries. The following sequence of surface water samples were collected by the United States Environmental Protection Agency (USEPA) in September 1997:
• Montezuma Creek before 900 Level Adit discharge • 900 Level Adit prior to discharge to Montezuma Creek • East Fork of Montezuma Creek • Montezuma Creek downstream confluence of East Fork (MC-1)
Analytical results for collected samples are summarized in Table 8. By comparing the relative concentrations at each sample point it can be seen that there is an increase in the
Talache PA/SI Page 16
arsenic concentration (both total and dissolved) between the 900 Level Adit Discharge and the sampling point downstream of the East Fork of Montezuma Creek. Arsenic contributions from the 900 Level Adit discharge and East Fork discharge do not account for this increase since the relative concentrations of each sample is lower than the observed downstream concentration. Because the Site is situated between these two reference points it is possible that contaminants at the Site are contributing to the increased surface water arsenic concentration. There are certainly other explanations for this increase in concentration. Further site evaluation is needed to accurately assess the risk to surface water receptors from exposure to contaminants from this site. Sediment samples have not been collected from the segment on Montezuma Creek within the bounds of the Site. Terracon (MFG et al., 2000) collected sediment samples from numerous locations in Montezuma Creek downstream from its confluence with East Fork Montezuma Creek. Due to the historic breach of the Talache Mine tailings impoundment, analytical results for the majority of the sample locations could not be used since they have been impacted by sources other than those occurring within the Site. Analytical results from background sample MC-1 are useful for this assessment because there is no mining activity on the East Fork of Montezuma Creek. As a result, sediment concentrations at MC-1 may reflect conditions of Montezuma Creek sediment within the Site. Laboratory analytical results indicate the arsenic concentrations in this sample to be 279 mg/kg (MFG et al., 2000). Risk management criteria have not been developed for sediment in aquatic ecosystems; therefore, we employed a combination approach to assess risk to aquatic organisms. This approach involved the use of criteria developed from a variety of sources and Ford’s method of interpreting analytical results. Such an approach enabled us to develop low, moderate, high, and extremely high-risk categories. We did not perform site-specific toxicity tests to assess the impact of metal concentrations in the sediment to aquatic life. Instead, we calculated an average applicable threshold effect concentration for arsenic from available literature. Table 9 shows the lowest applicable standards that were developed for the protection of aquatic life. Based on the average TEC (12.2 mg/kg), the arsenic concentration of 279 mg/kg measured in the sediment sample from MC-1 poses an extremely high risk to aquatic organisms. It is important to note that this sample may not accurately reflect conditions within the Site. Furthermore, a single sample is not adequate for accurately determining site conditions. As a result, sediment samples should be collected from Montezuma Creek and wetlands that occur within the Site to accurately assess the risk posed to aquatic receptors. Rainbow trout and other fish species were collected for tissue analysis in 1999 (MFG et al., 2000). Three trout were collected from Montezuma Creek and the average tissue concentration of arsenic was 10.97 mg/kg. The BLM human resident and camper RMC for fish ingestion are 24 mg/kg and 48 mg/kg, respectively. Although it is unlikely that fish captured in Montezuma Creek would be of sufficient size for consumption, results from the fish tissue analysis indicate there is a low health risk from arsenic ingestion as a result of human ingestion of fish.
Talache PA/SI Page 17
SUMMARY AND CONCLUSIONS MSE was contracted by USDA Forest Service to conduct a combined PA/SI for the Talache site within the Boise National Forest near Atlanta, Idaho. The site is composed of the Mill Area, Dump Area, and Tailings Area. Mine operations are reported to have occurred from 1869 to 1991. Preliminary investigation work included a scoping site visit on October 31, 2003 and review of available data. Site investigation work that included collection of soil and tailings samples and estimation of tailings volumes was performed during the week of November 10, 2003. Thirty-four samples were collected and analyzed for TAL metals and cyanide. Four of the thirty-four collected samples were analyzed for SPLP antimony and arsenic. Risk management criteria developed by Karl Ford (1996) were utilized to evaluate risk to human and ecological receptors. Soil, groundwater, and surface water exposure pathways were evaluated. Only arsenic and antimony were detected in soil at concentrations that ranked high or extremely high for risk to human health. Of the thirty-four samples analyzed for arsenic, ten ranked extremely high for human risk and nineteen ranked extremely high for ecological risk. Moderate to extremely high ecological risk was identified for cadmium, copper, lead, mercury, and zinc in several of the soil samples collected at the site. Sample TM-5 collected from the Mill Area had particularly high concentrations of arsenic and mercury. A drum containing an unknown white material was sampled in the Dump Area. Based on laboratory results it appears that this material may be sodium carbonate (soda ash) RECOMMENDATIONS FOR FURTHER ACTION Due to the elevated risk to human and ecological receptors associated with arsenic concentrations detected in samples from the Mill and Tailings Area and the proximity of the Site to both the Montezuma Creek and the town of Atlanta, it may be appropriate to complete an Engineering Evaluation/Cost Analysis (EE/CA) for this Site. Some issues that may be relevant when considering options in the EE/CA process include:
1.) A relatively thin layer of tailings appears to be dispersed over much of the Tailings Area. Small isolated tailings piles are also present. The relative volume of the dispersed tailings is small in comparison to the volume of the large tailings piles (Tailings Piles 1 and 2).
2.) Shallow groundwater appears to saturate some of the tailings.
3.) Much of the Tailings Area has relatively good vegetative cover. Implementing corrective actions that enhance existing vegetative cover may be appropriate.
4.) Remaining structures and scattered refuse at the Mill Area may provide physical hazards to site visitors.
5.) There is evidence to suggest that arsenic might be migrating from the site and impacting nearby Montezuma Creek water quality. Further analysis may be appropriate.
Talache PA/SI Page 18
REFERENCES Alt, D.D., 1989, Roadside Geology of Idaho, Montana Press Publishing Company
Bond, John G., 1978. Geologic Map of Idaho, Idaho Department of Land, Bureau of Mines and Geology With Contributions from United States Geological Survey.
Earthworks Technology, Inc., 2003, Plan of Operations, Atlanta Gold Project, Atlanta, Idaho, April 2003.
EPA, 1991. Guidance for Performing Preliminary Assessments Under CERCLA. Washington, DC: U.S. Environmental Protection Agency Office of Emergency and Remedial Response, EPA/540/G-91/013, September 1991.
EPA, 1992. Guidance for Performing Site Inspections Under CERCLA, Interim Final. Washington, DC: U.S. Environmental Protection Agency Office of Emergency and Remedial Response, EPA/540-R-92-021, September 1992.
EPA, 1999a. Improving Site Assessments: Combined PA/SI Assessments, Washington, DC: U.S. Environmental Protection Agency Office of Solid Waste and Emergency and Response, EPA-540-F-98-038, October 1999.
EPA, 1999b, Presumptive Remedy for Metals-in-Soil Sites, Washington, DC: U.S. Environmental Protection Agency Office of Solid Waste and Emergency Response, EPA 540-F-98-054, September, 1999.
Ford, K.L., 1996, Risk management criteria for metals at BLM mining sites: Bureau of Land Management Technical Note 390 (revised 1998), 24 p.
MFG, Inc./Terracon/Pentec Environmental, Inc., 2000, Final Site Characterization Report, Talache Mine Tailings Site, Atlanta, Idaho, May 2000
Mitchell, V.E., 2000, History of the Atlanta Mining Area, Elmore County, Idaho, Idaho Geologic Survey
Taylor, D.T., 1986, Geology and Mineralization of the Atlantic Mining District and Adjacent Areas, Elmore County, Idaho, Graduate School of the University of Idaho
United States Department of Agriculture Forest Service (USFS), 2003, Final Forest Plan Revision, Boise National Forest, July 2003.

Tables
Talache Site PA/SI Atlanta, Idaho
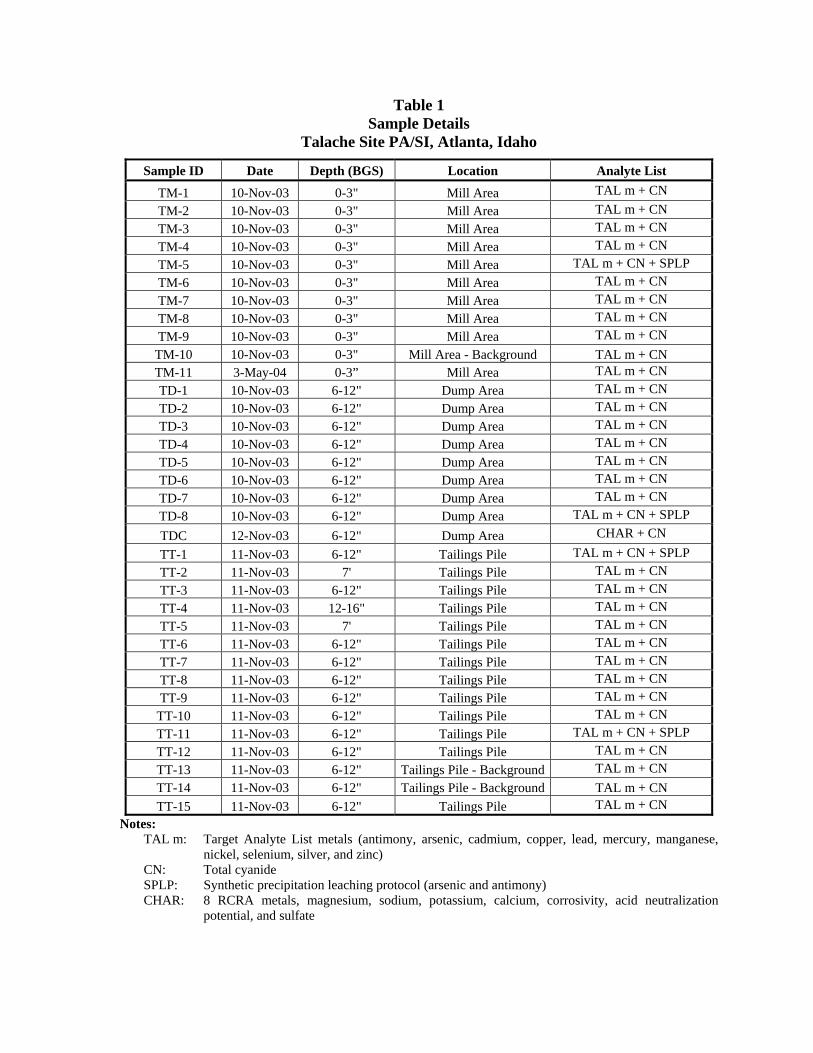
Table 1 Sample Details
Talache Site PA/SI, Atlanta, Idaho
Sample ID Date Depth (BGS) Location Analyte List
TM-1 10-Nov-03 0-3" Mill Area TAL m + CN TM-2 10-Nov-03 0-3" Mill Area TAL m + CN TM-3 10-Nov-03 0-3" Mill Area TAL m + CN TM-4 10-Nov-03 0-3" Mill Area TAL m + CN TM-5 10-Nov-03 0-3" Mill Area TAL m + CN + SPLP TM-6 10-Nov-03 0-3" Mill Area TAL m + CN TM-7 10-Nov-03 0-3" Mill Area TAL m + CN TM-8 10-Nov-03 0-3" Mill Area TAL m + CN TM-9 10-Nov-03 0-3" Mill Area TAL m + CN TM-10 10-Nov-03 0-3" Mill Area - Background TAL m + CN TM-11 3-May-04 0-3” Mill Area TAL m + CN TD-1 10-Nov-03 6-12" Dump Area TAL m + CN TD-2 10-Nov-03 6-12" Dump Area TAL m + CN TD-3 10-Nov-03 6-12" Dump Area TAL m + CN TD-4 10-Nov-03 6-12" Dump Area TAL m + CN TD-5 10-Nov-03 6-12" Dump Area TAL m + CN TD-6 10-Nov-03 6-12" Dump Area TAL m + CN TD-7 10-Nov-03 6-12" Dump Area TAL m + CN TD-8 10-Nov-03 6-12" Dump Area TAL m + CN + SPLP TDC 12-Nov-03 6-12" Dump Area CHAR + CN TT-1 11-Nov-03 6-12" Tailings Pile TAL m + CN + SPLP TT-2 11-Nov-03 7' Tailings Pile TAL m + CN TT-3 11-Nov-03 6-12" Tailings Pile TAL m + CN TT-4 11-Nov-03 12-16" Tailings Pile TAL m + CN TT-5 11-Nov-03 7' Tailings Pile TAL m + CN TT-6 11-Nov-03 6-12" Tailings Pile TAL m + CN TT-7 11-Nov-03 6-12" Tailings Pile TAL m + CN TT-8 11-Nov-03 6-12" Tailings Pile TAL m + CN TT-9 11-Nov-03 6-12" Tailings Pile TAL m + CN
TT-10 11-Nov-03 6-12" Tailings Pile TAL m + CN TT-11 11-Nov-03 6-12" Tailings Pile TAL m + CN + SPLP TT-12 11-Nov-03 6-12" Tailings Pile TAL m + CN TT-13 11-Nov-03 6-12" Tailings Pile - Background TAL m + CN TT-14 11-Nov-03 6-12" Tailings Pile - Background TAL m + CN TT-15 11-Nov-03 6-12" Tailings Pile TAL m + CN
Notes: TAL m: Target Analyte List metals (antimony, arsenic, cadmium, copper, lead, mercury, manganese,
nickel, selenium, silver, and zinc) CN: Total cyanide SPLP: Synthetic precipitation leaching protocol (arsenic and antimony) CHAR: 8 RCRA metals, magnesium, sodium, potassium, calcium, corrosivity, acid neutralization
potential, and sulfate
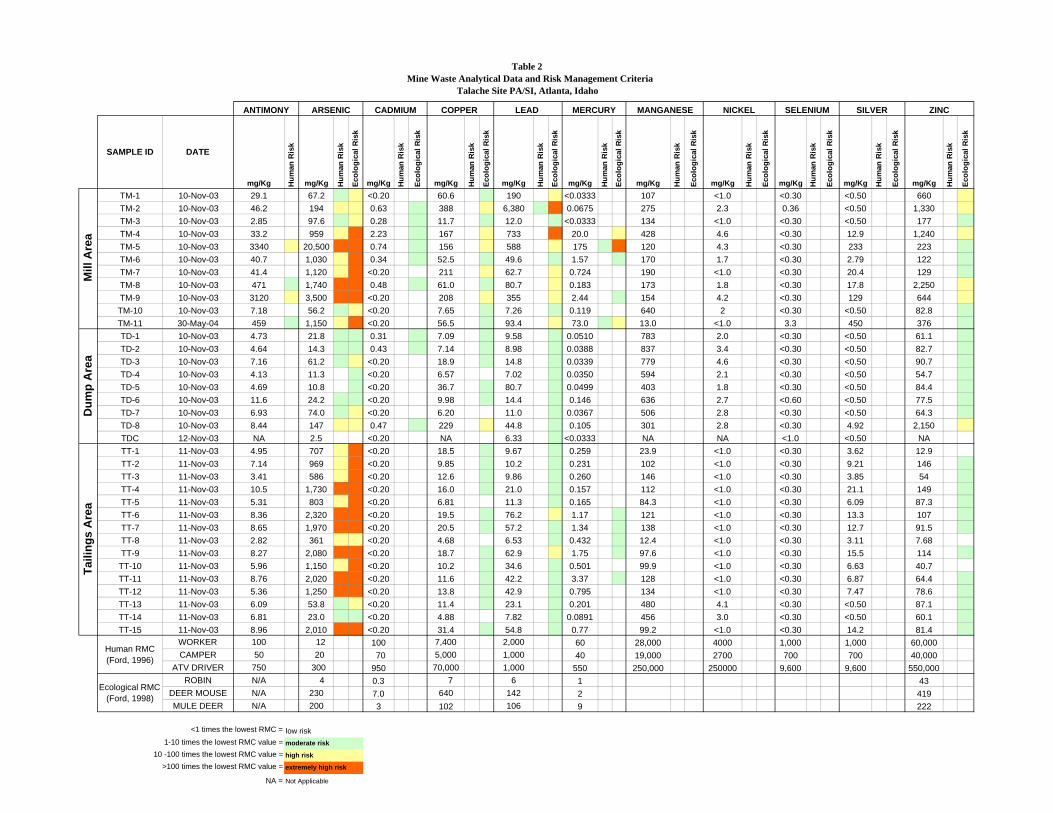
Table 2Mine Waste Analytical Data and Risk Management Criteria
Talache Site PA/SI, Atlanta, Idaho
SAMPLE ID DATE
mg/Kg Hum
an R
isk
mg/Kg Hum
an R
isk
Ecol
ogic
al R
isk
mg/Kg Hum
an R
isk
Ecol
ogic
al R
isk
mg/Kg Hum
an R
isk
Ecol
ogic
al R
isk
mg/Kg Hum
an R
isk
Ecol
ogic
al R
isk
mg/Kg Hum
an R
isk
Ecol
ogic
al R
isk
mg/Kg Hum
an R
isk
Ecol
ogic
al R
isk
mg/Kg Hum
an R
isk
Ecol
ogic
al R
isk
mg/Kg Hum
an R
isk
Ecol
ogic
al R
isk
mg/Kg Hum
an R
isk
Ecol
ogic
al R
isk
mg/Kg Hum
an R
isk
Ecol
ogic
al R
isk
TM-1 10-Nov-03 29.1 67.2 <0.20 60.6 190 <0.0333 107 <1.0 <0.30 <0.50 660TM-2 10-Nov-03 46.2 194 0.63 388 6,380 0.0675 275 2.3 0.36 <0.50 1,330TM-3 10-Nov-03 2.85 97.6 0.28 11.7 12.0 <0.0333 134 <1.0 <0.30 <0.50 177TM-4 10-Nov-03 33.2 959 2.23 167 733 20.0 428 4.6 <0.30 12.9 1,240TM-5 10-Nov-03 3340 20,500 0.74 156 588 175 120 4.3 <0.30 233 223TM-6 10-Nov-03 40.7 1,030 0.34 52.5 49.6 1.57 170 1.7 <0.30 2.79 122TM-7 10-Nov-03 41.4 1,120 <0.20 211 62.7 0.724 190 <1.0 <0.30 20.4 129TM-8 10-Nov-03 471 1,740 0.48 61.0 80.7 0.183 173 1.8 <0.30 17.8 2,250TM-9 10-Nov-03 3120 3,500 <0.20 208 355 2.44 154 4.2 <0.30 129 644TM-10 10-Nov-03 7.18 56.2 <0.20 7.65 7.26 0.119 640 2 <0.30 <0.50 82.8TM-11 30-May-04 459 1,150 <0.20 56.5 93.4 73.0 13.0 <1.0 3.3 450 376TD-1 10-Nov-03 4.73 21.8 0.31 7.09 9.58 0.0510 783 2.0 <0.30 <0.50 61.1TD-2 10-Nov-03 4.64 14.3 0.43 7.14 8.98 0.0388 837 3.4 <0.30 <0.50 82.7TD-3 10-Nov-03 7.16 61.2 <0.20 18.9 14.8 0.0339 779 4.6 <0.30 <0.50 90.7TD-4 10-Nov-03 4.13 11.3 <0.20 6.57 7.02 0.0350 594 2.1 <0.30 <0.50 54.7TD-5 10-Nov-03 4.69 10.8 <0.20 36.7 80.7 0.0499 403 1.8 <0.30 <0.50 84.4TD-6 10-Nov-03 11.6 24.2 <0.20 9.98 14.4 0.146 636 2.7 <0.60 <0.50 77.5TD-7 10-Nov-03 6.93 74.0 <0.20 6.20 11.0 0.0367 506 2.8 <0.30 <0.50 64.3TD-8 10-Nov-03 8.44 147 0.47 229 44.8 0.105 301 2.8 <0.30 4.92 2,150TDC 12-Nov-03 NA 2.5 <0.20 NA 6.33 <0.0333 NA NA <1.0 <0.50 NATT-1 11-Nov-03 4.95 707 <0.20 18.5 9.67 0.259 23.9 <1.0 <0.30 3.62 12.9TT-2 11-Nov-03 7.14 969 <0.20 9.85 10.2 0.231 102 <1.0 <0.30 9.21 146TT-3 11-Nov-03 3.41 586 <0.20 12.6 9.86 0.260 146 <1.0 <0.30 3.85 54TT-4 11-Nov-03 10.5 1,730 <0.20 16.0 21.0 0.157 112 <1.0 <0.30 21.1 149TT-5 11-Nov-03 5.31 803 <0.20 6.81 11.3 0.165 84.3 <1.0 <0.30 6.09 87.3TT-6 11-Nov-03 8.36 2,320 <0.20 19.5 76.2 1.17 121 <1.0 <0.30 13.3 107TT-7 11-Nov-03 8.65 1,970 <0.20 20.5 57.2 1.34 138 <1.0 <0.30 12.7 91.5TT-8 11-Nov-03 2.82 361 <0.20 4.68 6.53 0.432 12.4 <1.0 <0.30 3.11 7.68TT-9 11-Nov-03 8.27 2,080 <0.20 18.7 62.9 1.75 97.6 <1.0 <0.30 15.5 114
TT-10 11-Nov-03 5.96 1,150 <0.20 10.2 34.6 0.501 99.9 <1.0 <0.30 6.63 40.7TT-11 11-Nov-03 8.76 2,020 <0.20 11.6 42.2 3.37 128 <1.0 <0.30 6.87 64.4TT-12 11-Nov-03 5.36 1,250 <0.20 13.8 42.9 0.795 134 <1.0 <0.30 7.47 78.6TT-13 11-Nov-03 6.09 53.8 <0.20 11.4 23.1 0.201 480 4.1 <0.30 <0.50 87.1TT-14 11-Nov-03 6.81 23.0 <0.20 4.88 7.82 0.0891 456 3.0 <0.30 <0.50 60.1TT-15 11-Nov-03 8.96 2,010 <0.20 31.4 54.8 0.77 99.2 <1.0 <0.30 14.2 81.4
WORKER 100 12 100 7,400 2,000 60 28,000 4000 1,000 1,000 60,000CAMPER 50 20 70 5,000 1,000 40 19,000 2700 700 700 40,000
ATV DRIVER 750 300 950 70,000 1,000 550 250,000 250000 9,600 9,600 550,000ROBIN N/A 4 0.3 7 6 1 43
DEER MOUSE N/A 230 7.0 640 142 2 419MULE DEER N/A 200 3 102 106 9 222
low risk
Not Applicable
Mill
Are
aTa
iling
s A
rea
Dum
p A
rea
ZINCSELENIUM SILVERNICKELMERCURYARSENIC LEAD CADMIUM COPPER
Human RMC (Ford, 1996)
Ecological RMC (Ford, 1998)
NA =
ANTIMONY MANGANESE
1-10 times the lowest RMC value =10 -100 times the lowest RMC value =
moderate risk
high risk
<1 times the lowest RMC =
>100 times the lowest RMC value = extremely high risk
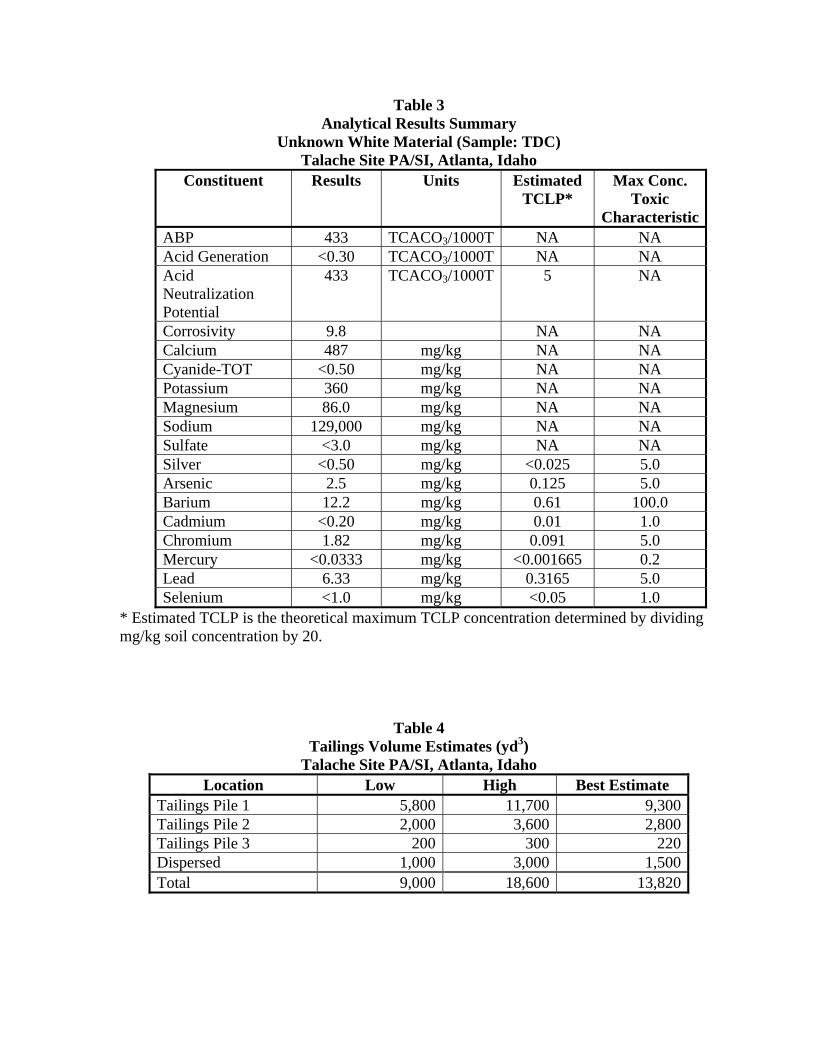
Table 3 Analytical Results Summary
Unknown White Material (Sample: TDC) Talache Site PA/SI, Atlanta, Idaho
Constituent Results Units Estimated TCLP*
Max Conc. Toxic
CharacteristicABP 433 TCACO3/1000T NA NA Acid Generation <0.30 TCACO3/1000T NA NA Acid Neutralization Potential
433 TCACO3/1000T 5 NA
Corrosivity 9.8 NA NA Calcium 487 mg/kg NA NA Cyanide-TOT <0.50 mg/kg NA NA Potassium 360 mg/kg NA NA Magnesium 86.0 mg/kg NA NA Sodium 129,000 mg/kg NA NA Sulfate <3.0 mg/kg NA NA Silver <0.50 mg/kg <0.025 5.0 Arsenic 2.5 mg/kg 0.125 5.0 Barium 12.2 mg/kg 0.61 100.0 Cadmium <0.20 mg/kg 0.01 1.0 Chromium 1.82 mg/kg 0.091 5.0 Mercury <0.0333 mg/kg <0.001665 0.2 Lead 6.33 mg/kg 0.3165 5.0 Selenium <1.0 mg/kg <0.05 1.0
* Estimated TCLP is the theoretical maximum TCLP concentration determined by dividing mg/kg soil concentration by 20.
Table 4 Tailings Volume Estimates (yd3)
Talache Site PA/SI, Atlanta, Idaho Location Low High Best Estimate
Tailings Pile 1 5,800 11,700 9,300Tailings Pile 2 2,000 3,600 2,800Tailings Pile 3 200 300 220Dispersed 1,000 3,000 1,500Total 9,000 18,600 13,820
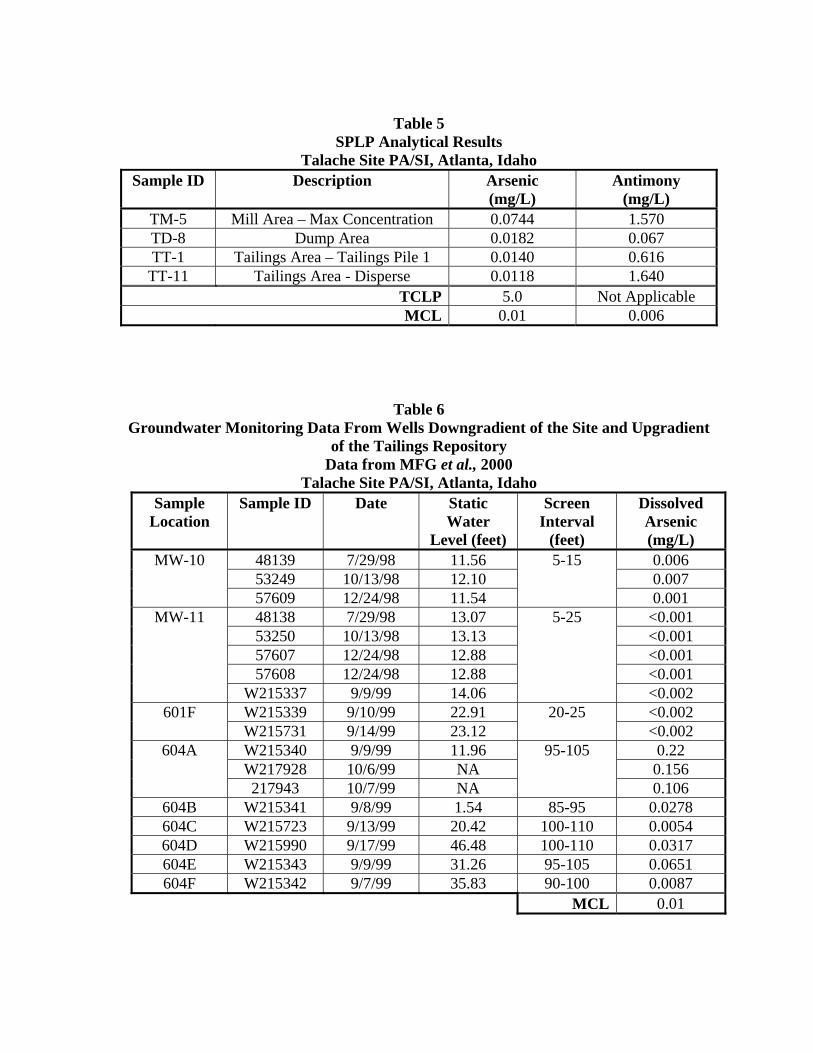
Table 5
SPLP Analytical Results Talache Site PA/SI, Atlanta, Idaho
Sample ID Description Arsenic (mg/L)
Antimony (mg/L)
TM-5 Mill Area – Max Concentration 0.0744 1.570 TD-8 Dump Area 0.0182 0.067 TT-1 Tailings Area – Tailings Pile 1 0.0140 0.616 TT-11 Tailings Area - Disperse 0.0118 1.640
TCLP 5.0 Not Applicable MCL 0.01 0.006
Table 6 Groundwater Monitoring Data From Wells Downgradient of the Site and Upgradient
of the Tailings Repository Data from MFG et al., 2000
Talache Site PA/SI, Atlanta, Idaho Sample
Location Sample ID Date Static
Water Level (feet)
Screen Interval
(feet)
Dissolved Arsenic (mg/L)
MW-10 48139 7/29/98 11.56 5-15 0.006 53249 10/13/98 12.10 0.007 57609 12/24/98 11.54 0.001
MW-11 48138 7/29/98 13.07 5-25 <0.001 53250 10/13/98 13.13 <0.001 57607 12/24/98 12.88 <0.001 57608 12/24/98 12.88 <0.001 W215337 9/9/99 14.06 <0.002
601F W215339 9/10/99 22.91 20-25 <0.002 W215731 9/14/99 23.12 <0.002
604A W215340 9/9/99 11.96 95-105 0.22 W217928 10/6/99 NA 0.156 217943 10/7/99 NA 0.106
604B W215341 9/8/99 1.54 85-95 0.0278 604C W215723 9/13/99 20.42 100-110 0.0054 604D W215990 9/17/99 46.48 100-110 0.0317 604E W215343 9/9/99 31.26 95-105 0.0651 604F W215342 9/7/99 35.83 90-100 0.0087
MCL 0.01
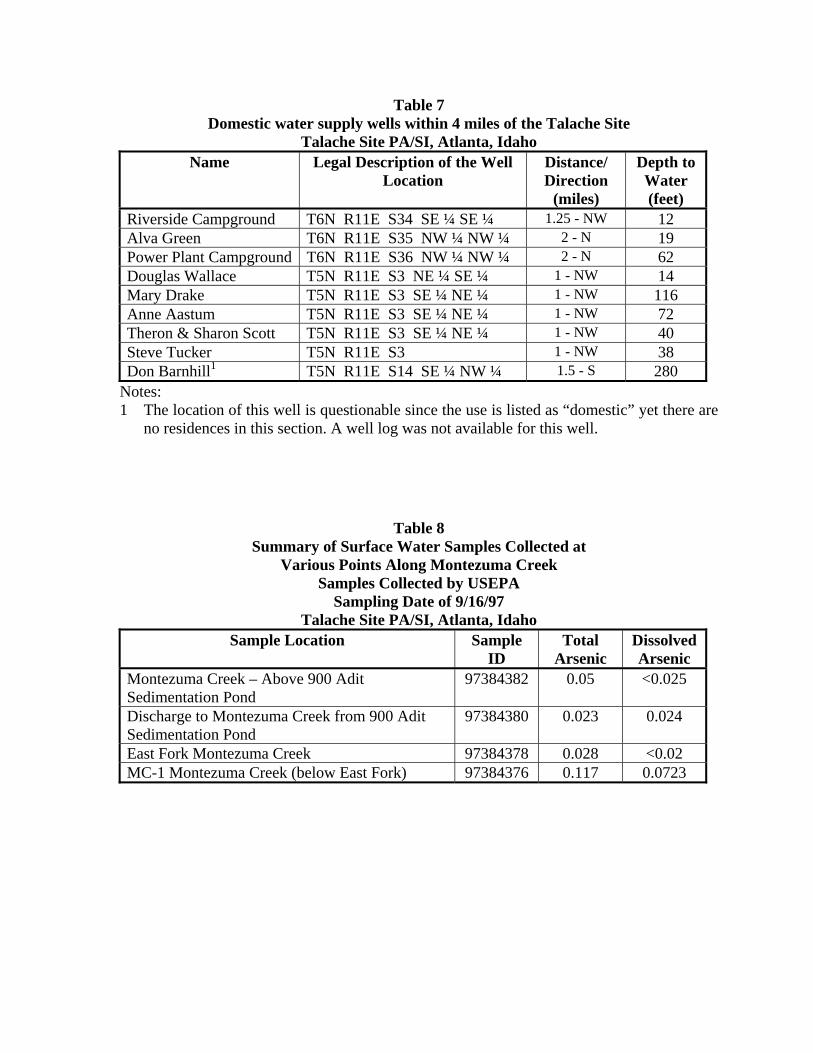
Table 7 Domestic water supply wells within 4 miles of the Talache Site
Talache Site PA/SI, Atlanta, Idaho Name Legal Description of the Well
Location Distance/ Direction
(miles)
Depth to Water (feet)
Riverside Campground T6N R11E S34 SE ¼ SE ¼ 1.25 - NW 12 Alva Green T6N R11E S35 NW ¼ NW ¼ 2 - N 19 Power Plant Campground T6N R11E S36 NW ¼ NW ¼ 2 - N 62 Douglas Wallace T5N R11E S3 NE ¼ SE ¼ 1 - NW 14 Mary Drake T5N R11E S3 SE ¼ NE ¼ 1 - NW 116 Anne Aastum T5N R11E S3 SE ¼ NE ¼ 1 - NW 72 Theron & Sharon Scott T5N R11E S3 SE ¼ NE ¼ 1 - NW 40 Steve Tucker T5N R11E S3 1 - NW 38 Don Barnhill1 T5N R11E S14 SE ¼ NW ¼ 1.5 - S 280
Notes: 1 The location of this well is questionable since the use is listed as “domestic” yet there are
no residences in this section. A well log was not available for this well.
Table 8 Summary of Surface Water Samples Collected at
Various Points Along Montezuma Creek Samples Collected by USEPA
Sampling Date of 9/16/97 Talache Site PA/SI, Atlanta, Idaho
Sample Location Sample ID
Total Arsenic
Dissolved Arsenic
Montezuma Creek – Above 900 Adit Sedimentation Pond
97384382 0.05 <0.025
Discharge to Montezuma Creek from 900 Adit Sedimentation Pond
97384380 0.023 0.024
East Fork Montezuma Creek 97384378 0.028 <0.02 MC-1 Montezuma Creek (below East Fork) 97384376 0.117 0.0723
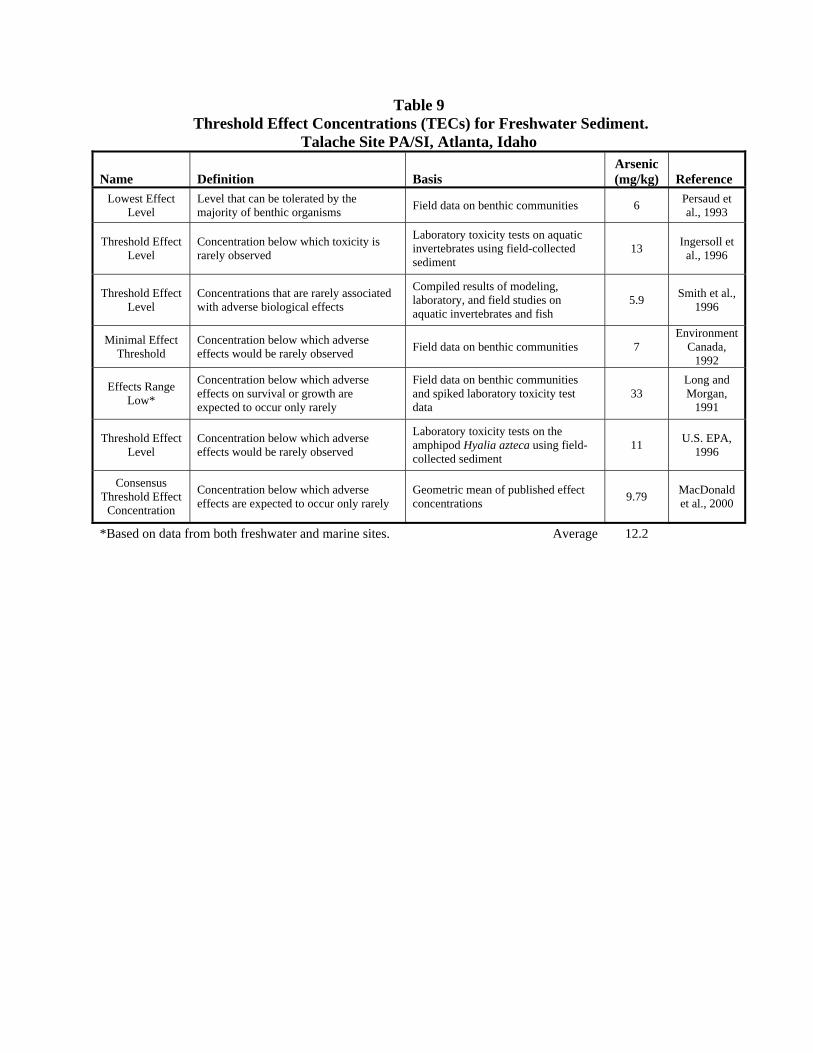
Table 9 Threshold Effect Concentrations (TECs) for Freshwater Sediment.
Talache Site PA/SI, Atlanta, Idaho
Name Definition Basis Arsenic (mg/kg) Reference
Lowest Effect Level
Level that can be tolerated by the majority of benthic organisms Field data on benthic communities 6 Persaud et
al., 1993
Threshold Effect Level
Concentration below which toxicity is rarely observed
Laboratory toxicity tests on aquatic invertebrates using field-collected sediment
13 Ingersoll et al., 1996
Threshold Effect Level
Concentrations that are rarely associated with adverse biological effects
Compiled results of modeling, laboratory, and field studies on aquatic invertebrates and fish
5.9 Smith et al., 1996
Minimal Effect Threshold
Concentration below which adverse effects would be rarely observed Field data on benthic communities 7
Environment Canada,
1992
Effects Range Low*
Concentration below which adverse effects on survival or growth are expected to occur only rarely
Field data on benthic communities and spiked laboratory toxicity test data
33 Long and Morgan,
1991
Threshold Effect Level
Concentration below which adverse effects would be rarely observed
Laboratory toxicity tests on the amphipod Hyalia azteca using field-collected sediment
11 U.S. EPA, 1996
Consensus Threshold Effect
Concentration
Concentration below which adverse effects are expected to occur only rarely
Geometric mean of published effect concentrations 9.79 MacDonald
et al., 2000
*Based on data from both freshwater and marine sites. Average 12.2

Figures
Talache Site PA/SI Atlanta, Idaho
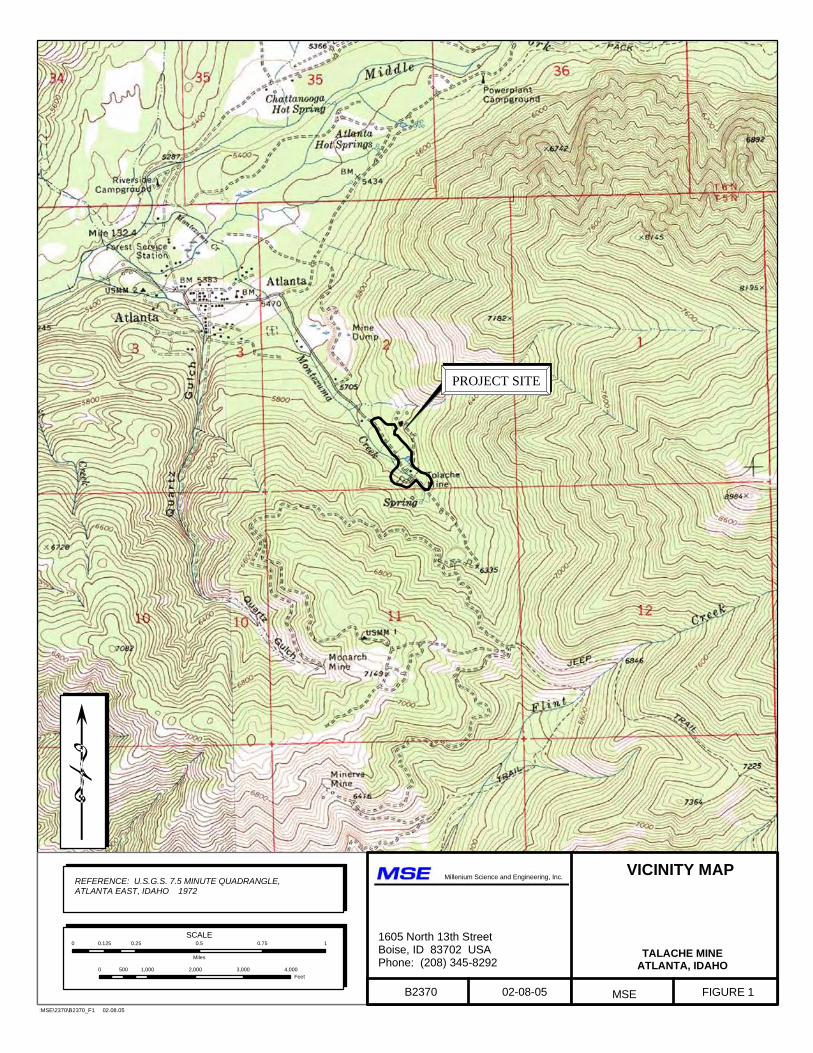
PROJECT SITEPROJECT SITE
REFERENCE: U.S.G.S. 7.5 MINUTE QUADRANGLE,ATLANTA EAST, IDAHO 1972
SCALE
:MSE\2370\B2370_F1 02.08.05
02-08-05B2370
1605 North 13th StreetBoise, ID 83702 USAPhone: (208) 345-8292
FIGURE 1
VICINITY MAP
TALACHE MINEATLANTA, IDAHO
MSE
Millenium Science and Engineering, Inc.
0 0.25 0.5 0.75 10.125
Miles
0 1,000 2,000 3,000 4,000500Feet
TT9 TT8
TT7
TT6
TT5TT4
TT3
TT2TT1
TD8
TD7
TD6
TD5
TD4
TD2
TD1
TT15TT14
TT13TT12
TT11
TT10
TTB36
TD3/TDC
:MSE\2370\B2370_F2 02.08.05
VIEW OF MILL AREAAFTER 2000 TRAIL CREEK FIRE
MILL AREA
DUMP AREA
MILL AREA
SCALE0 100 200 300 40050
Feet 02-08-05B2370
1605 North 13th StreetBoise, ID 83702 USAPhone: (208) 345-8292
FIGURE 2
SITE MAPWITH
SAMPLE LOCATIONS
TALACHE MINEATLANTA, IDAHO
MSE
Millenium Science and Engineering, Inc.
TM10TM8 TM9
TM5 TM2
TM1TM3TM4
TM11TM7 TM6
TM10TM8 TM9
TM5TM2
TM1TM3TM4TM11
TM7TM6
TAILINGS AREA
Mo
nt e
zu
ma
Cr e
e k
FS 207
USFS Photography:Main Map- Flown 6-1-2000, Frame # ATL-46Inset- Flown 7-2-2001, Frame # LAN-33
TEST
LEGEND
GENERAL TAILINGS AREA
TAILINGS PILE 3
TAILINGS PILE 2
TAILINGS PILE 1
Mill Area Sample LocationDump Area Sample LocationTailings Area Sample Location
!(
!(
!(
TMx
TDx
TTx
Pond
TT9 TT8
TT7
TT6
TT5TT4
TT3
TT2
TT1
TTB9
TTB8
TTB7
TTB6 TTB5
TTB4
TTB3
TTB2
TT15TT14
TT13
TT12
TT11
TT10
TTB36
TTB35
TTB33
TTB32
TTB31
TTB30
TTB29TTB28
TTB27
TTB26
TTB25
TTB24
TTB23TTB22
TTB21
TTB20
TTB19
TTB17
TTB16
TTB15 TTB14
TTB13
TTB12
TTB11
TTB10
TTB34
TTB18
:MSE\2370\B2370_F3 02.08.05
SCALE
02-08-05B2370
1605 North 13th StreetBoise, ID 83702 USAPhone: (208) 345-8292
FIGURE 3
TAILINGS AREA DETAIL
TALACHE MINEATLANTA, IDAHO
MSE
Millenium Science and Engineering, Inc.
TEST
LEGEND
GENERAL TAILINGS AREA
TAILINGS PILE 3
TAILINGS PILE 2
TAILINGS PILE 1
Tailings Depth Measurement LocationTailings Area Sample Location
!(
!(
TTBx
TTx
0 50 100 150 20025Feet
FS 207
OBSERVED TAILINGSDEPTH
M o n t e zu m a Cre
ek
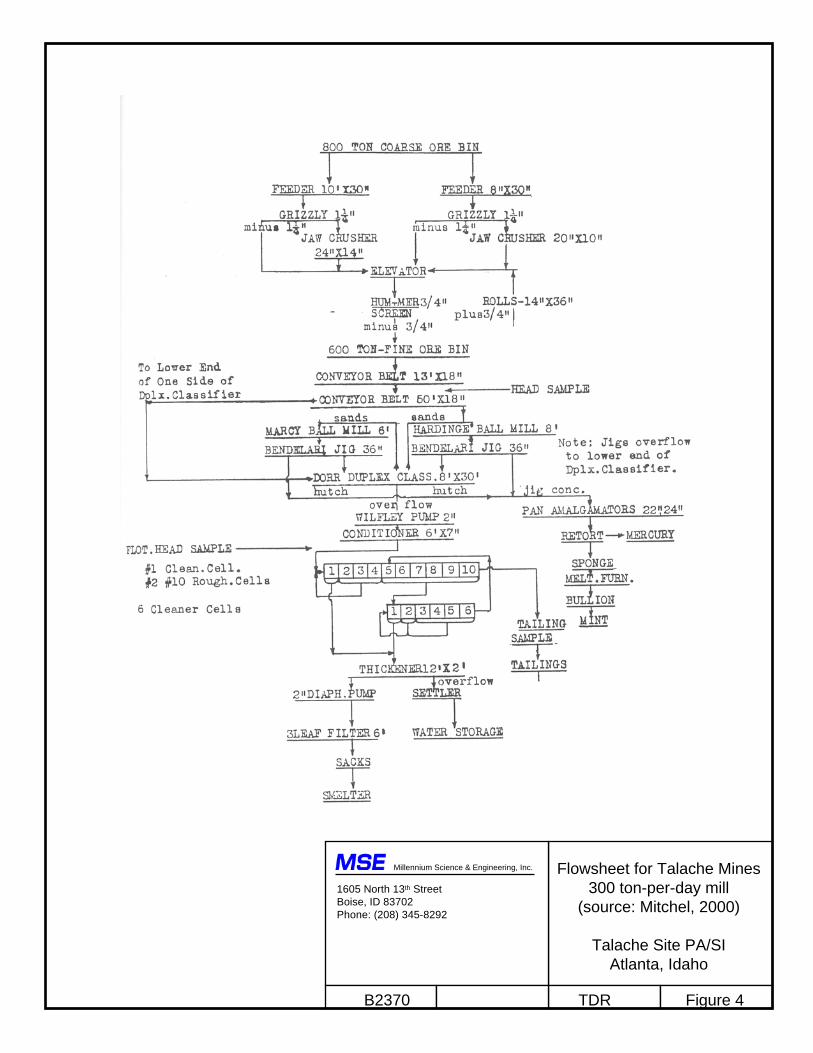
Flowsheet for Talache Mines 300 ton-per-day mill
(source: Mitchel, 2000)
Talache Site PA/SIAtlanta, Idaho
B2370 Figure 4TDR
Project Site
Millennium Science & Engineering, Inc.
1605 North 13th StreetBoise, ID 83702Phone: (208) 345-8292
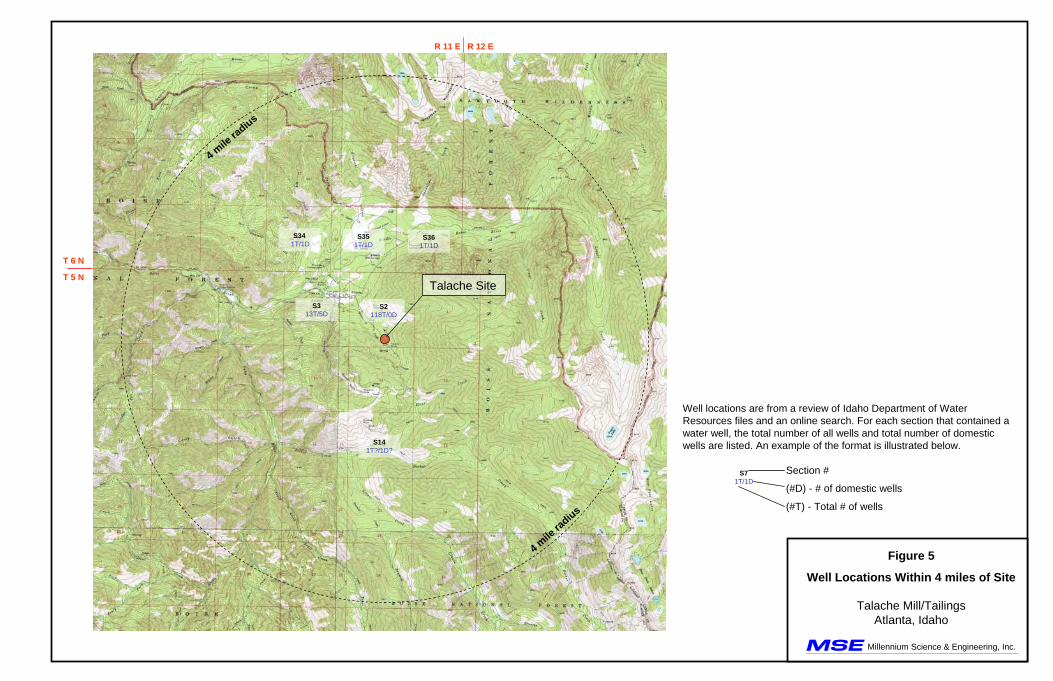
Well locations are from a review of Idaho Department of Water Resources files and an online search. For each section that contained a water well, the total number of all wells and total number of domestic wells are listed. An example of the format is illustrated below.
S7 1T/1D
Section #
(#T) - Total # of wells
(#D) - # of domestic wells
T 6 N
T 5 N
S34 1T/1D
S35 1T/1D
S36 1T/1D
R 11 E R 12 E
S2 118T/0D
S3 13T/5D
S14 1T?/1D?
Talache Site
4 mile
radius
4 mile
radius
Millennium Science & Engineering, Inc.
Figure 5
Well Locations Within 4 miles of Site
Talache Mill/TailingsAtlanta, Idaho

Appendix 1
Sampling and Analysis Plan

Appendix 2
Results from Database Queries

Appendix 3
Site Photographs
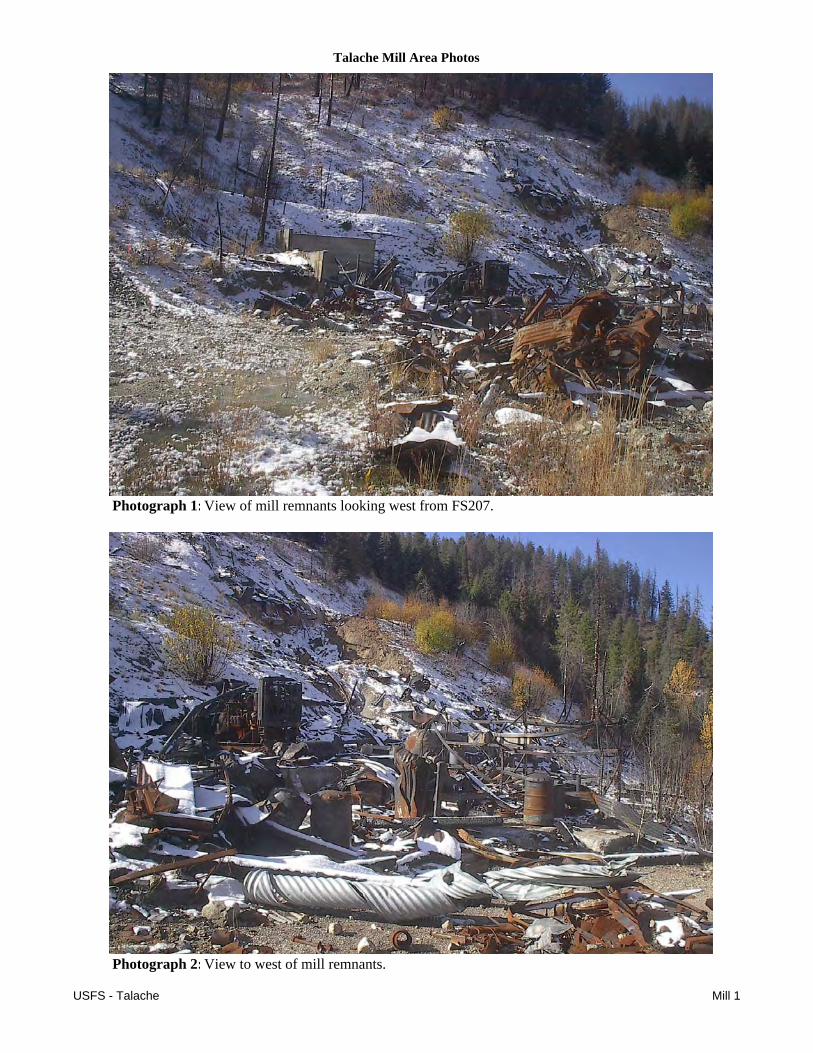
Talache Mill Area Photos
Photograph 1: View of mill remnants looking west from FS207.
Photograph 2: View to west of mill remnants.
USFS - Talache Mill 1
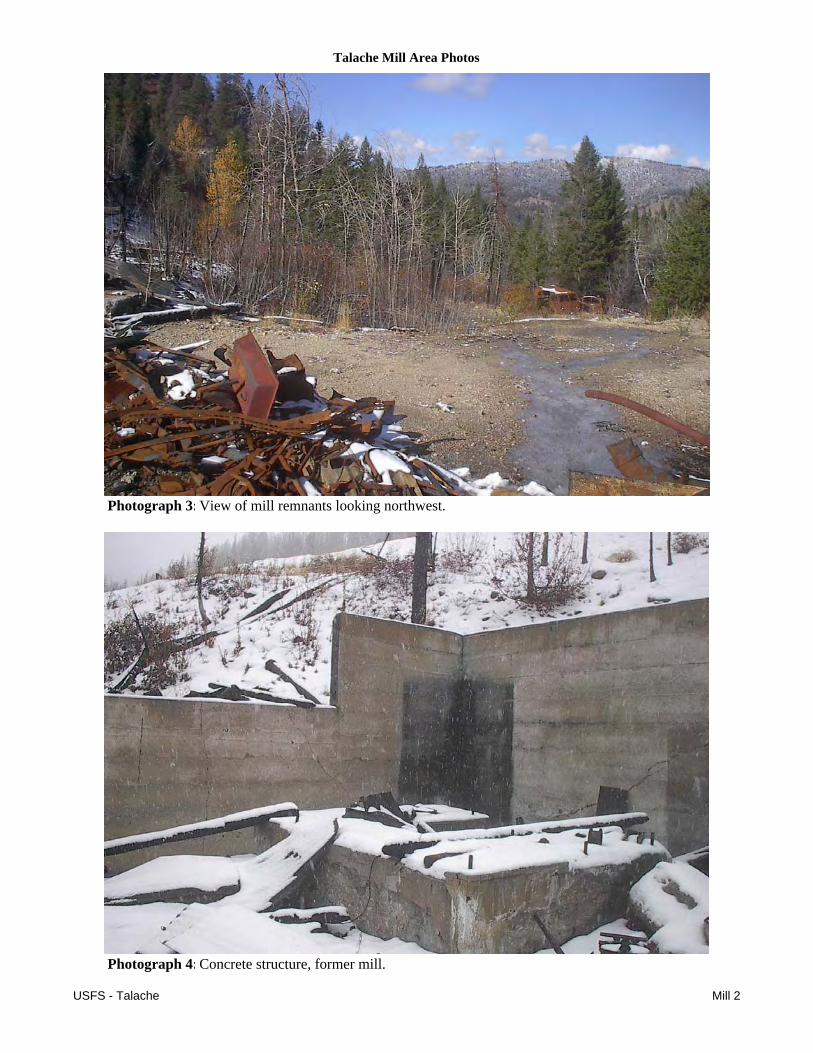
Talache Mill Area Photos
Photograph 3: View of mill remnants looking northwest.
Photograph 4: Concrete structure, former mill.
USFS - Talache Mill 2
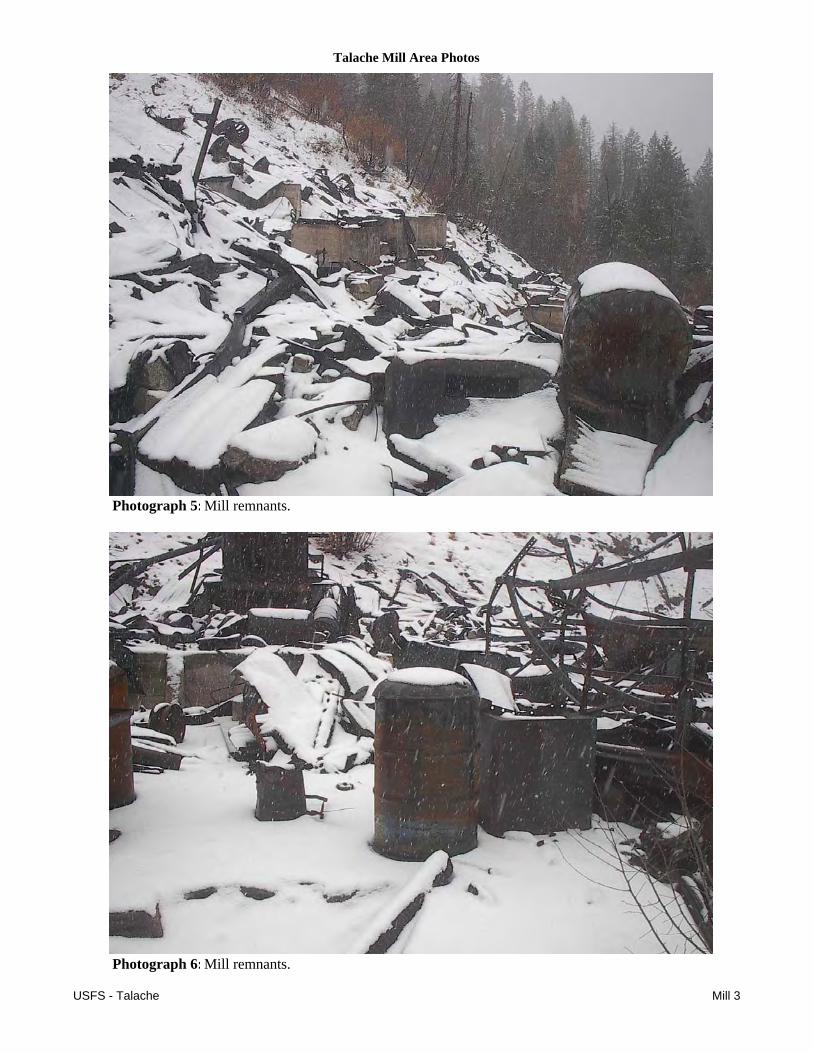
Talache Mill Area Photos
Photograph 5: Mill remnants.
Photograph 6: Mill remnants.
USFS - Talache Mill 3
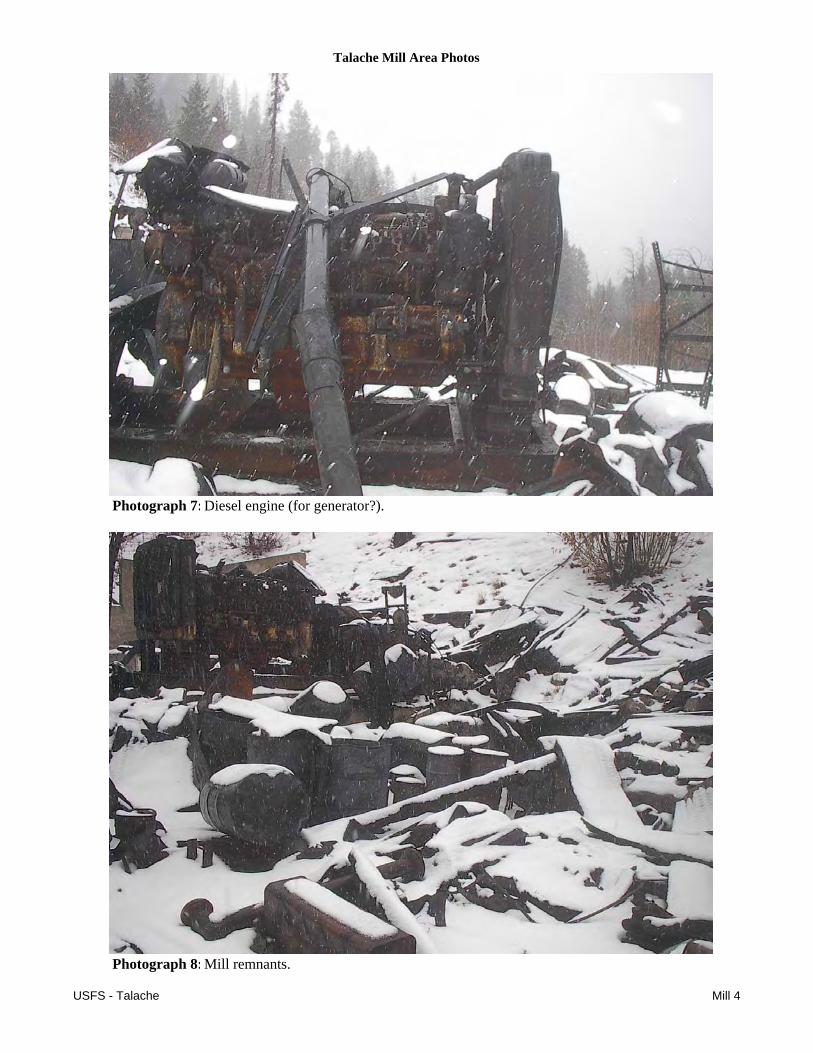
Talache Mill Area Photos
Photograph 7: Diesel engine (for generator?).
Photograph 8: Mill remnants.
USFS - Talache Mill 4
Talache Mill Area Photos
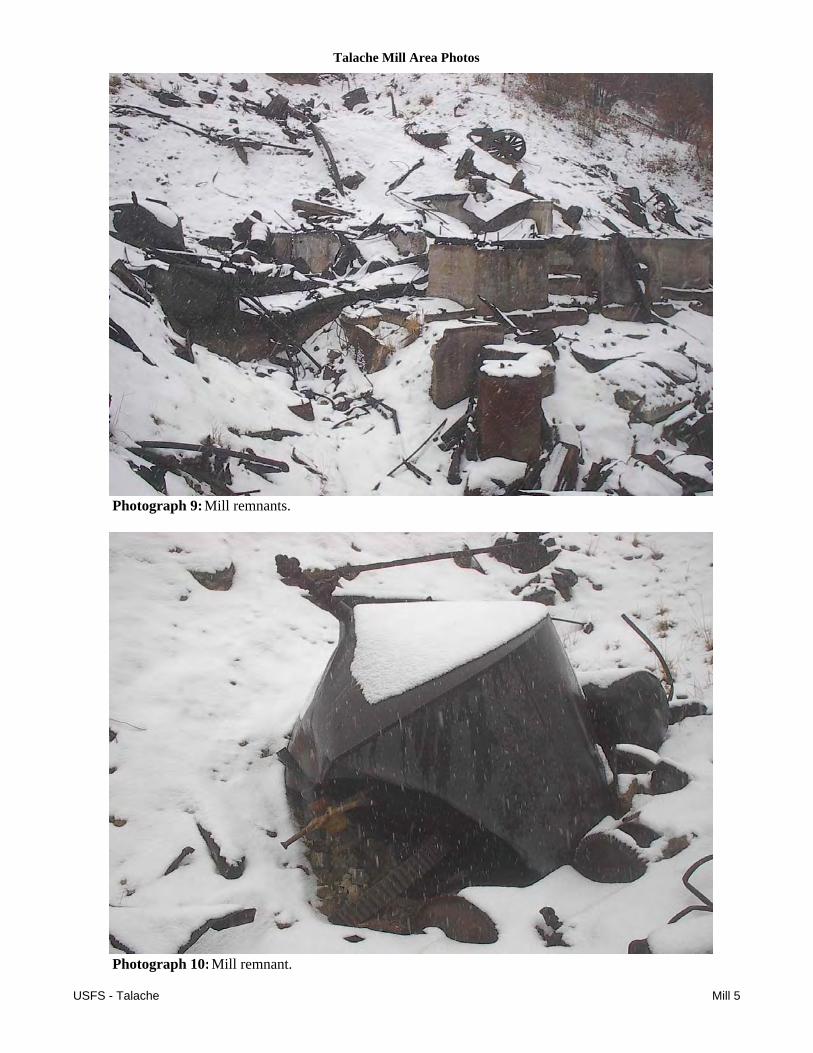
Photograph 9: Mill remnants.
Photograph 10: Mill remnant.
USFS - Talache Mill 5
Talache Mill Area Photos
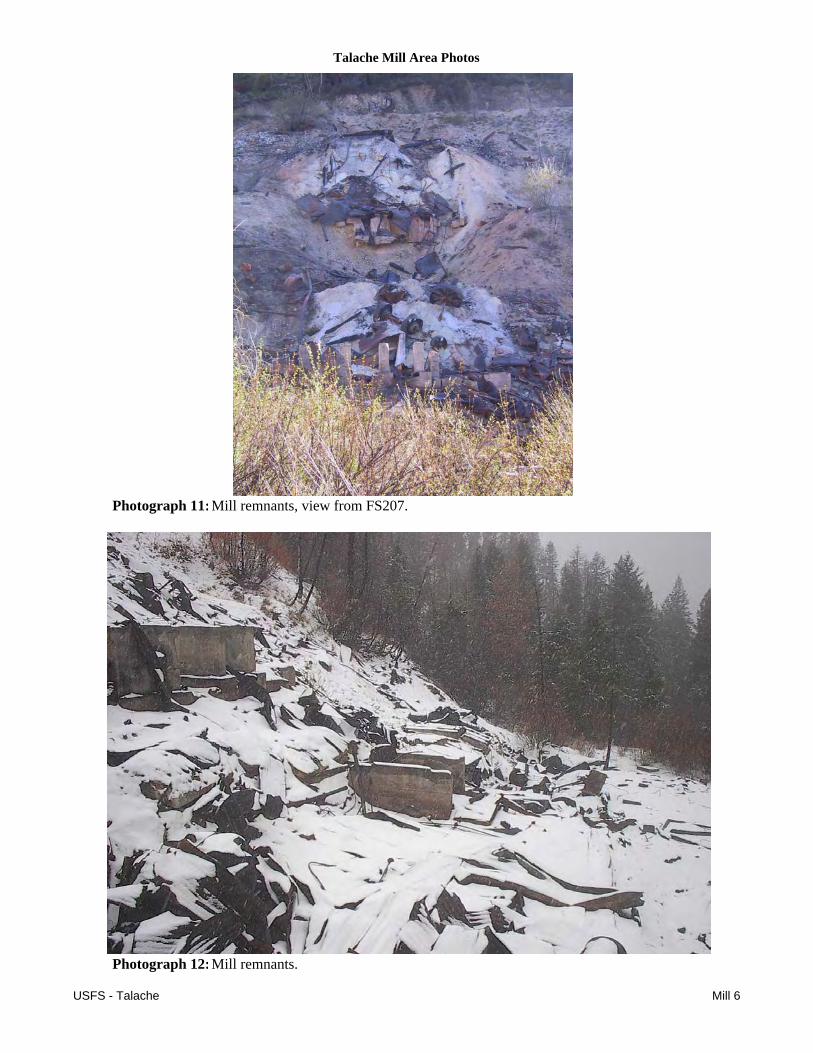
Photograph 11: Mill remnants, view from FS207.
Photograph 12: Mill remnants.
USFS - Talache Mill 6
Talache Mill Area Photos
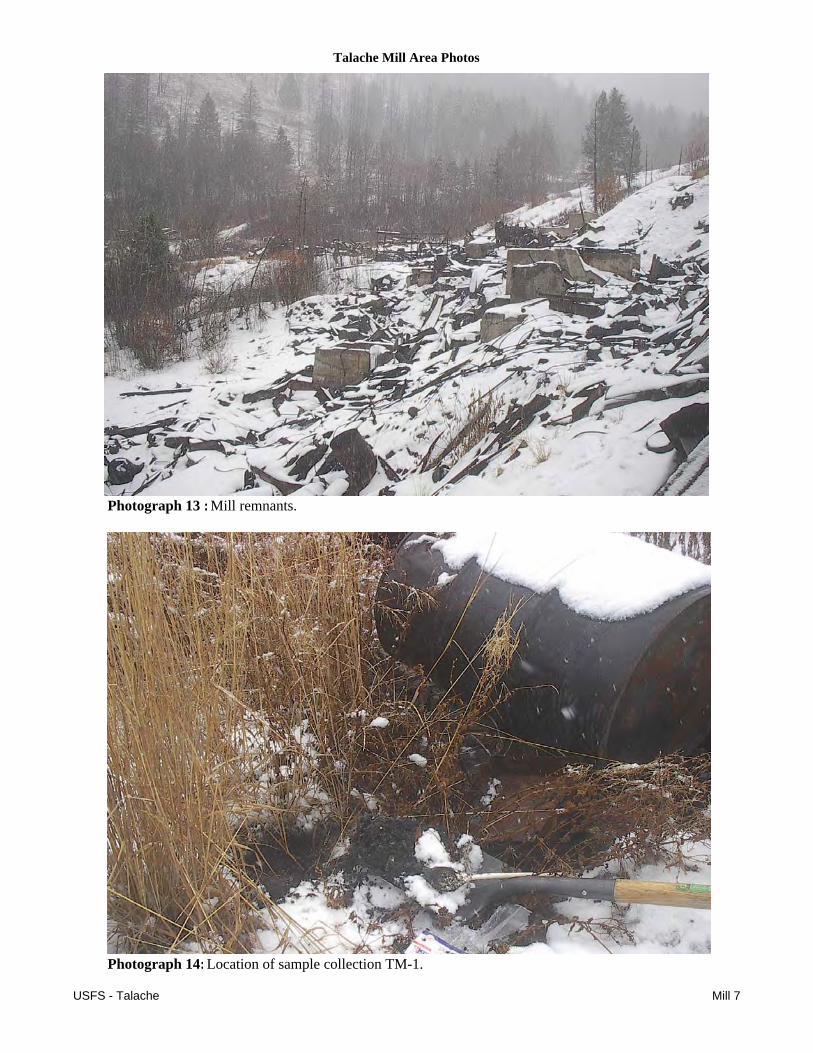
Photograph 13 : Mill remnants.
Photograph 14: Location of sample collection TM-1.
USFS - Talache Mill 7
Talache Mill Area Photos
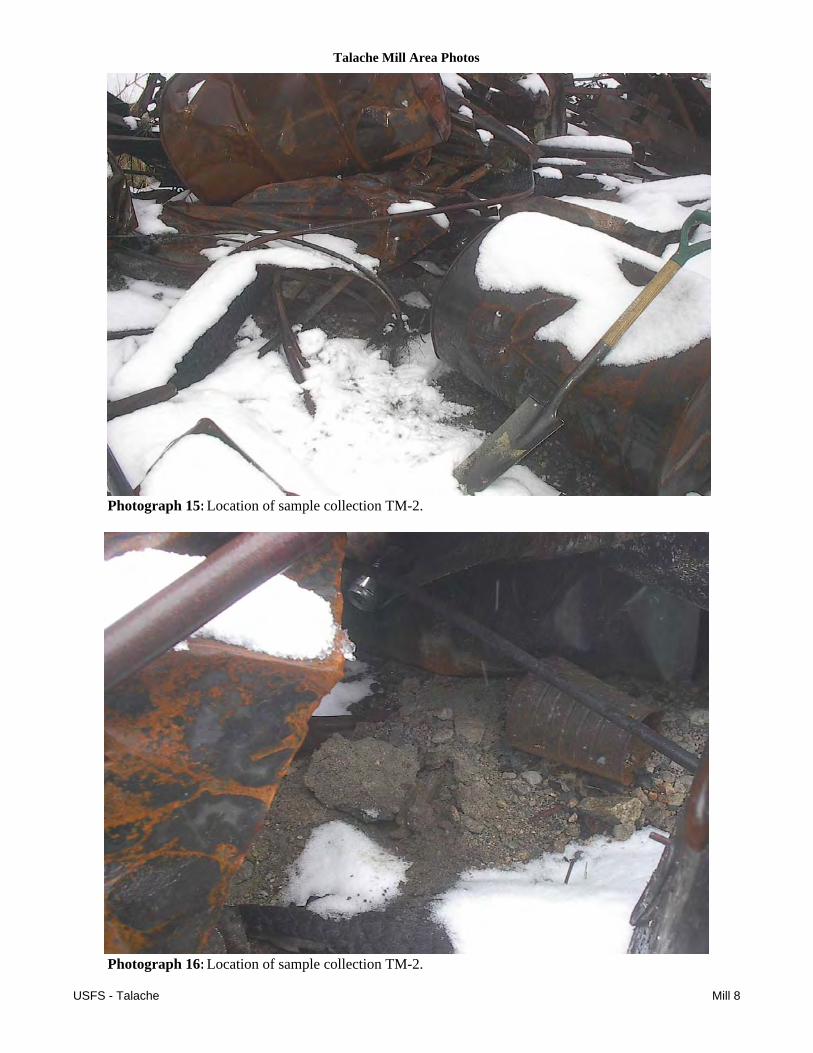
Photograph 15: Location of sample collection TM-2.
Photograph 16: Location of sample collection TM-2.
USFS - Talache Mill 8
Talache Mill Area Photos
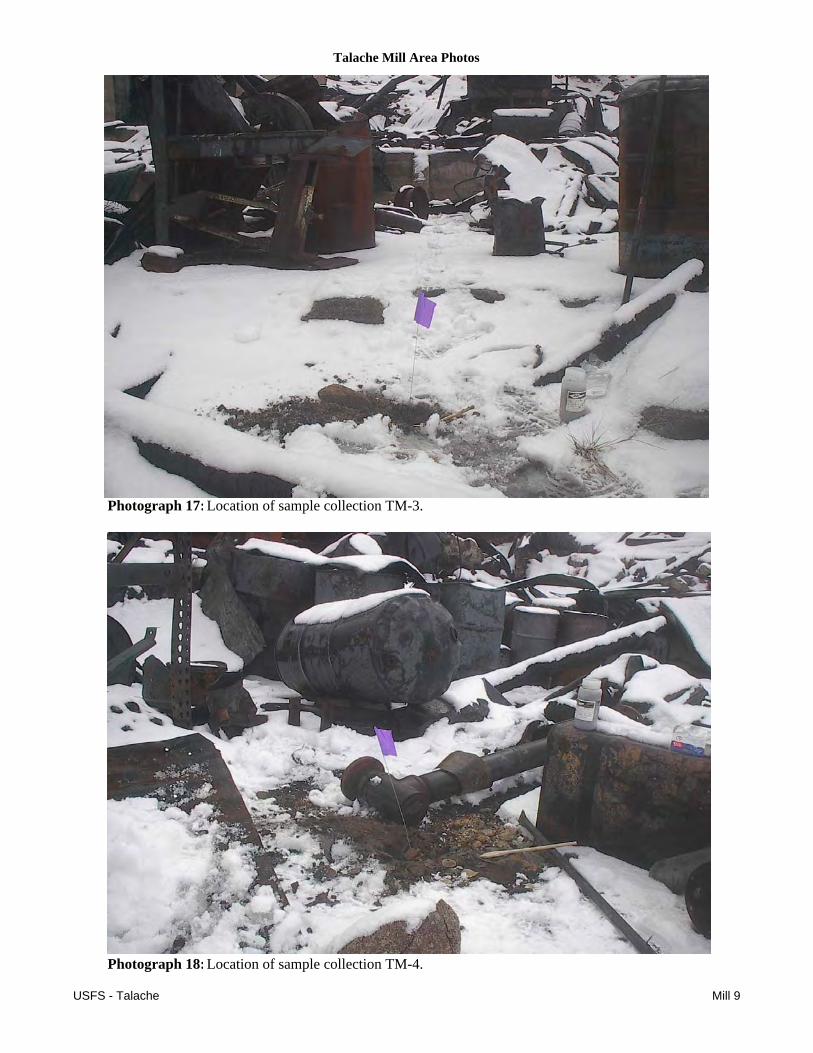
Photograph 17: Location of sample collection TM-3.
Photograph 18: Location of sample collection TM-4.
USFS - Talache Mill 9
Talache Mill Area Photos
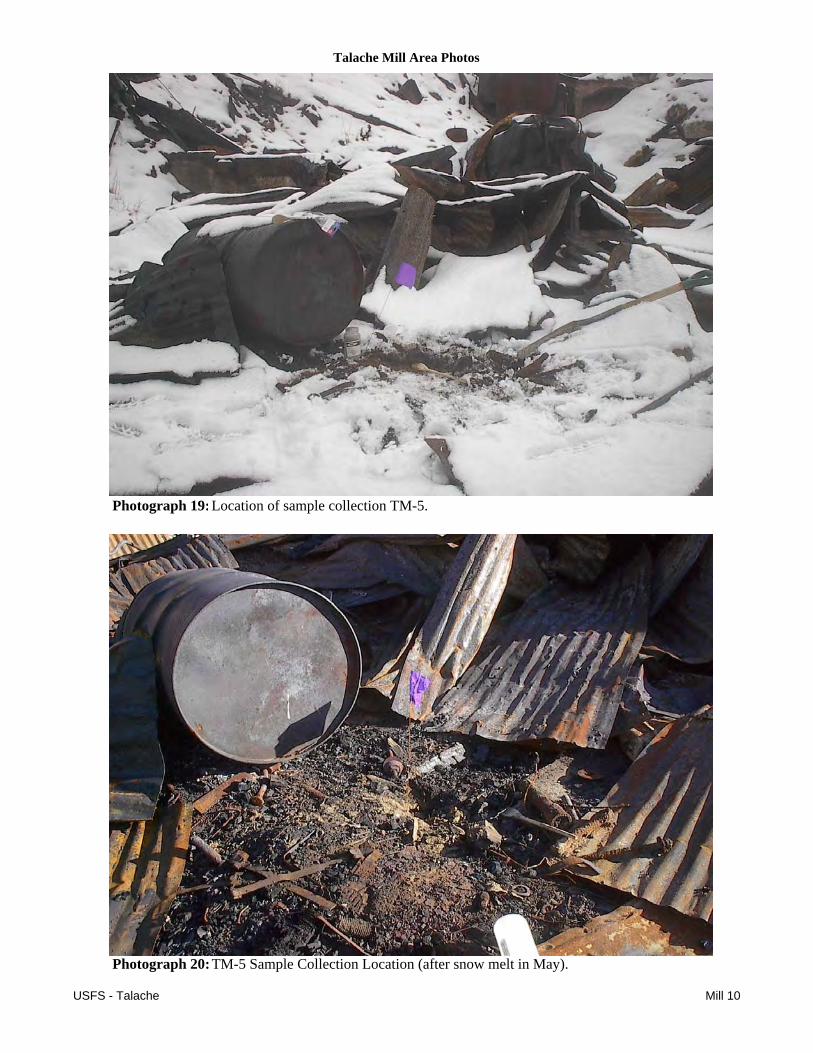
Photograph 19: Location of sample collection TM-5.
Photograph 20: TM-5 Sample Collection Location (after snow melt in May).
USFS - Talache Mill 10
Talache Mill Area Photos
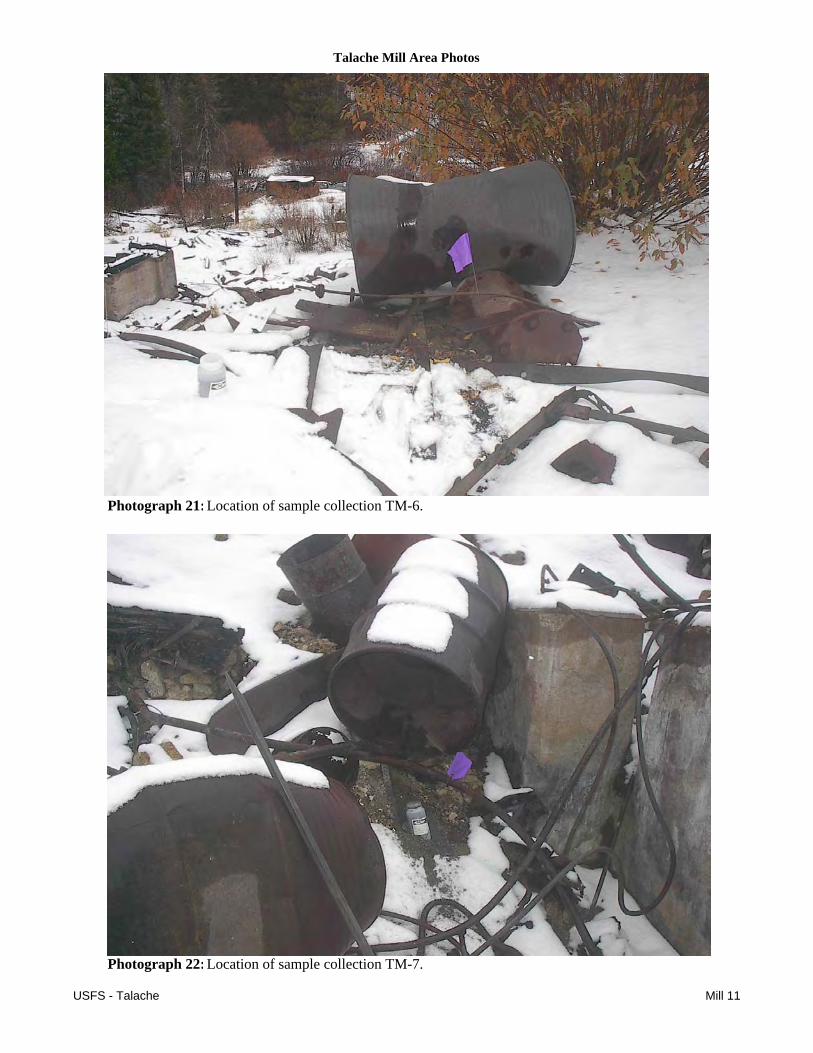
Photograph 21: Location of sample collection TM-6.
Photograph 22: Location of sample collection TM-7.
USFS - Talache Mill 11
Talache Mill Area Photos
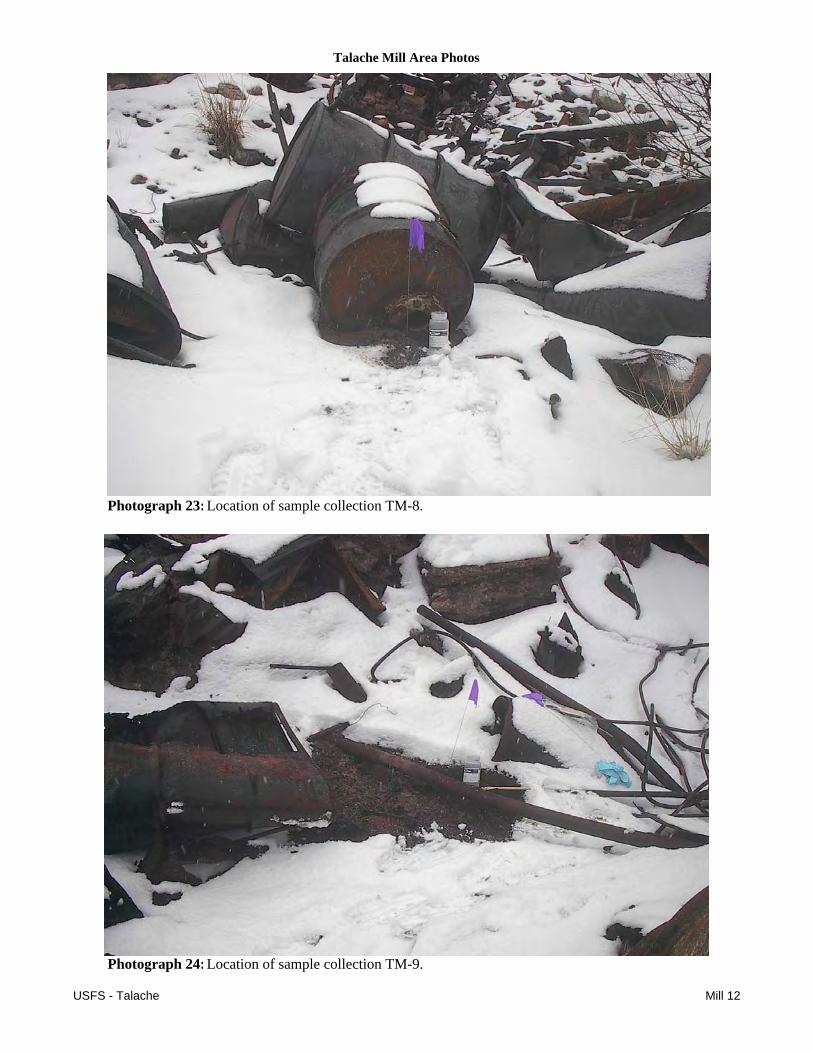
Photograph 23: Location of sample collection TM-8.
Photograph 24: Location of sample collection TM-9.
USFS - Talache Mill 12
Talache Mill Area Photos
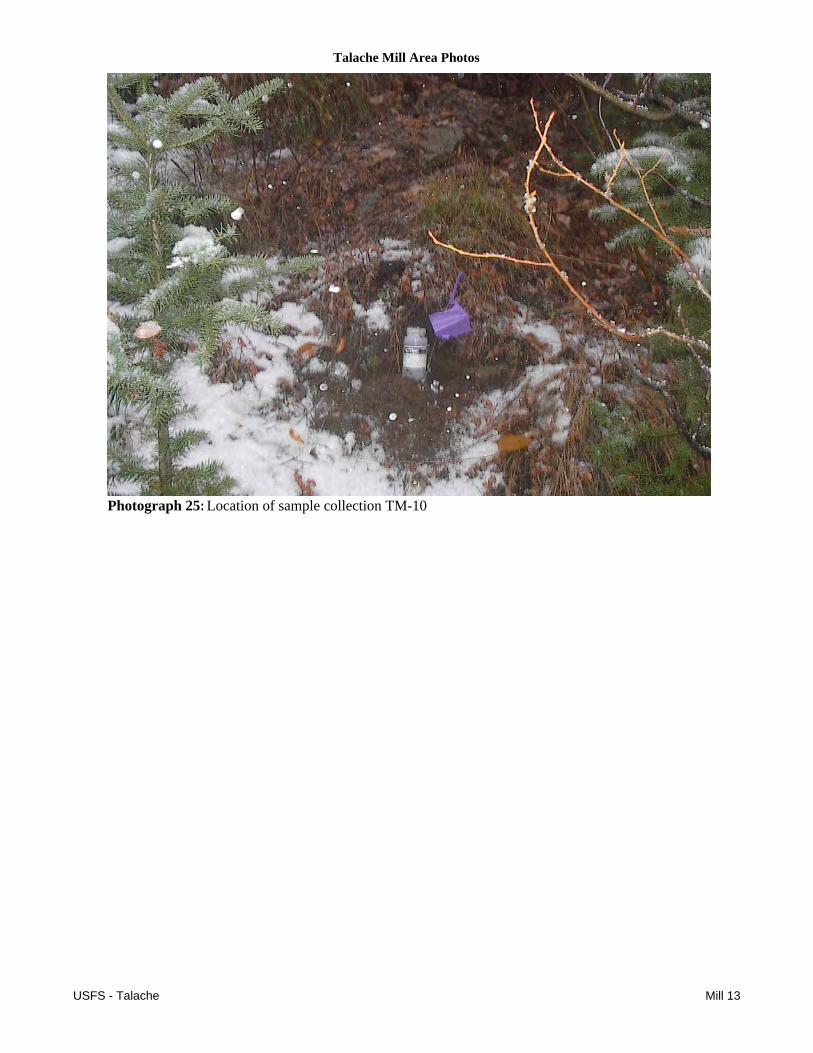
Photograph 25: Location of sample collection TM-10
USFS - Talache Mill 13
Talache Mill Area Photos
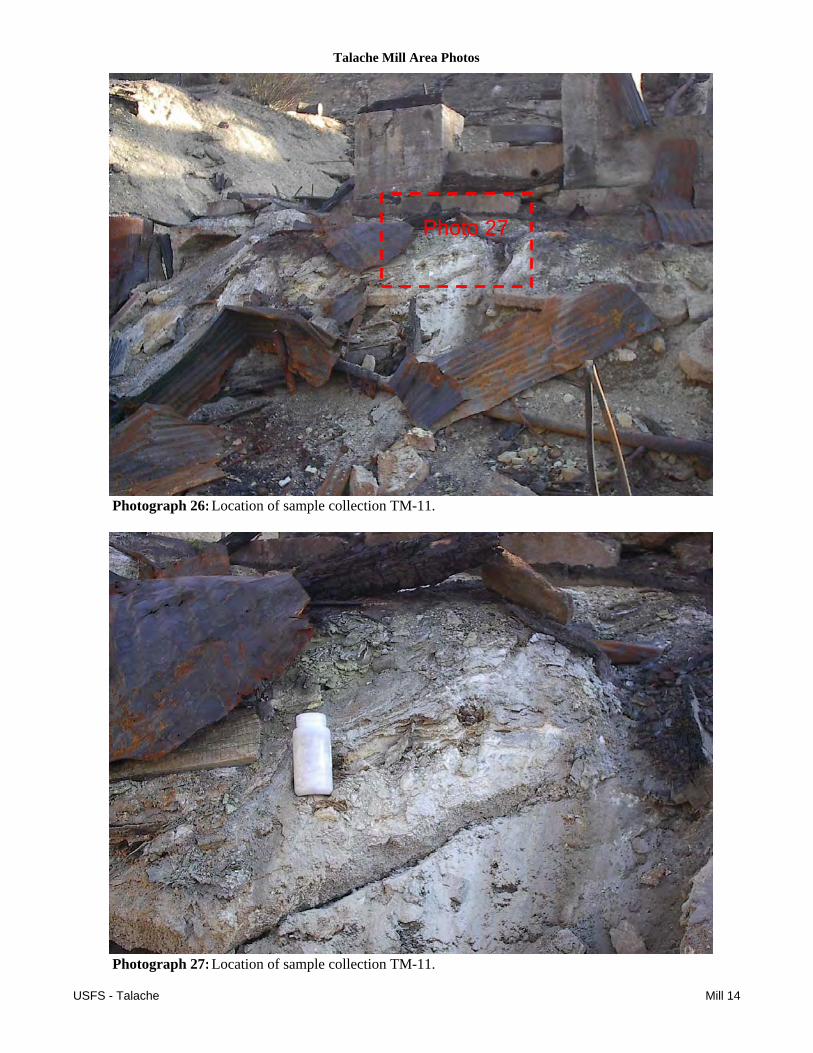
Photograph 26: Location of sample collection TM-11.
Photograph 27: Location of sample collection TM-11.
Photo 27
USFS - Talache Mill 14
Talache Tailings Area Photos
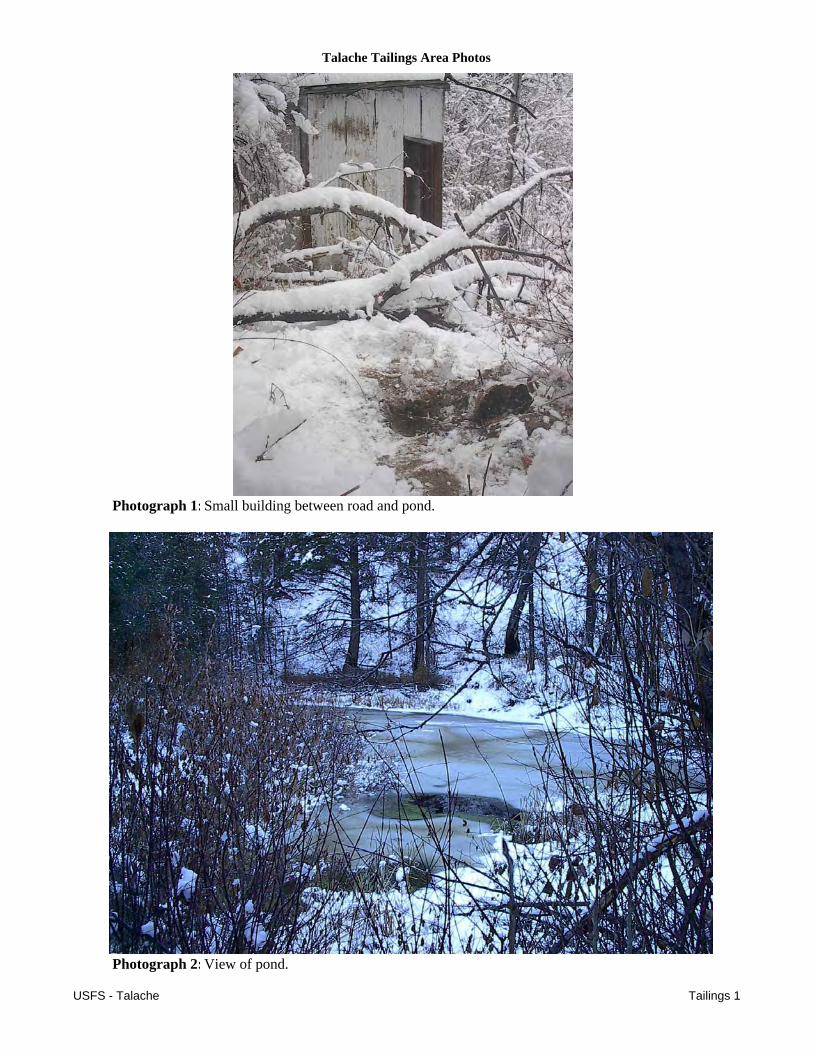
Photograph 1: Small building between road and pond.
Photograph 2: View of pond.
USFS - Talache Tailings 1
Talache Tailings Area Photos
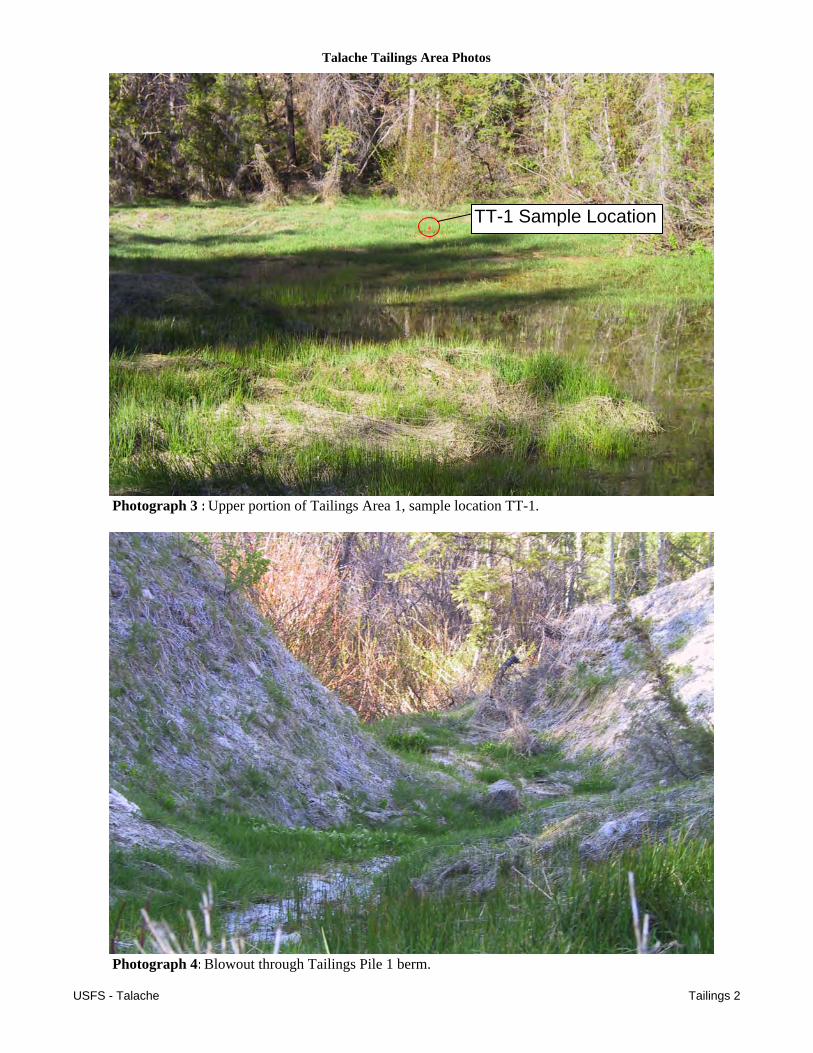
Photograph 3 : Upper portion of Tailings Area 1, sample location TT-1.
Photograph 4: Blowout through Tailings Pile 1 berm.
TT-1 Sample Location
USFS - Talache Tailings 2

Talache Tailings Area Photos
Photograph 5: Location of sample collection TT-1.
Photograph 6: Location of sample collection TT-1.
USFS - Talache Tailings 3
Talache Tailings Area Photos
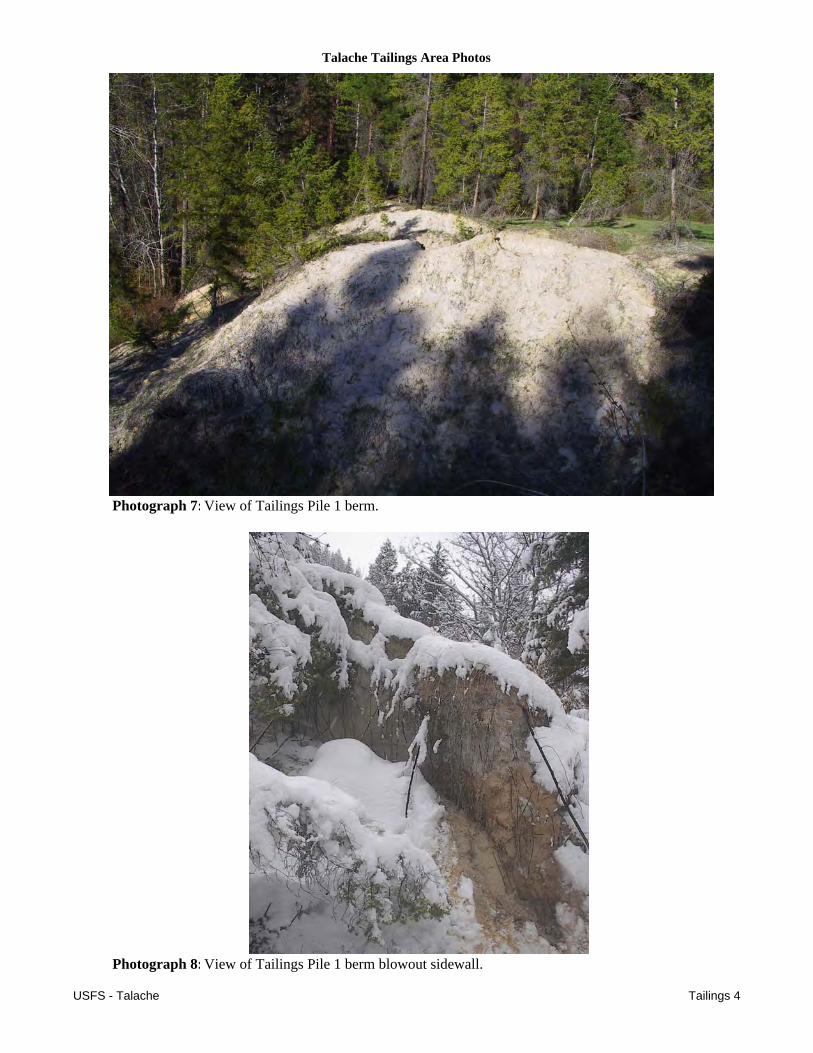
Photograph 7: View of Tailings Pile 1 berm.
Photograph 8: View of Tailings Pile 1 berm blowout sidewall.
USFS - Talache Tailings 4
Talache Tailings Area Photos
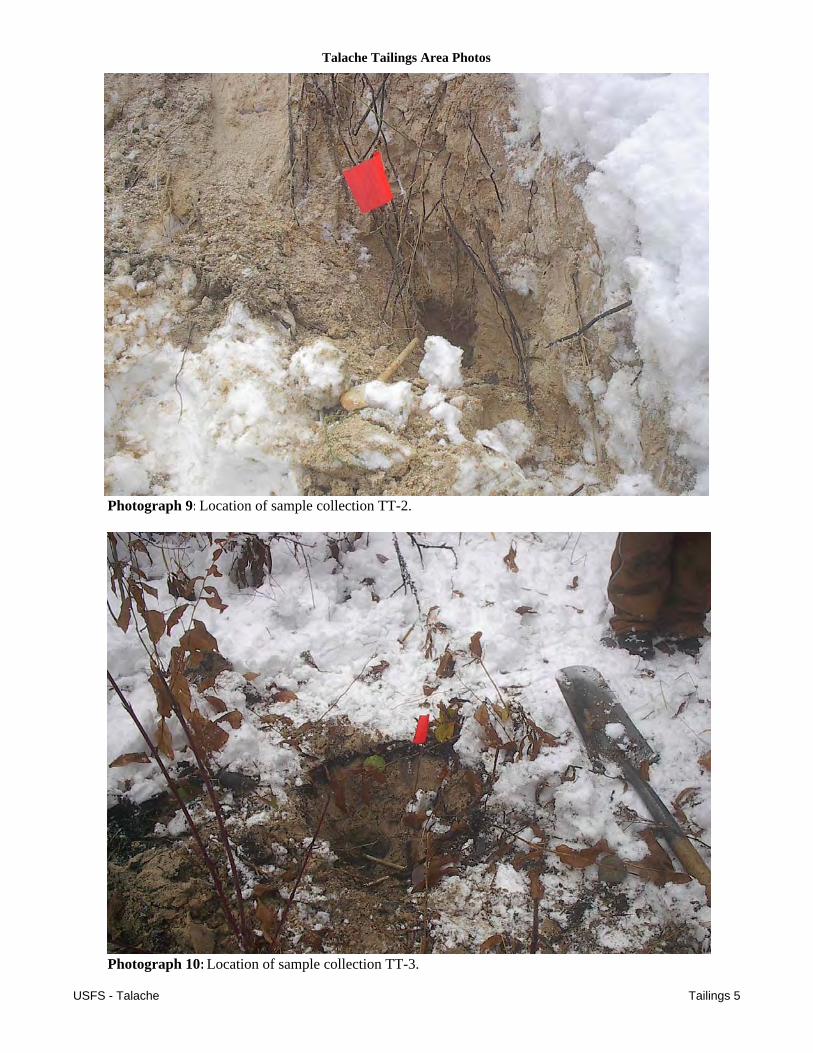
Photograph 9: Location of sample collection TT-2.
Photograph 10: Location of sample collection TT-3.
USFS - Talache Tailings 5
Talache Tailings Area Photos
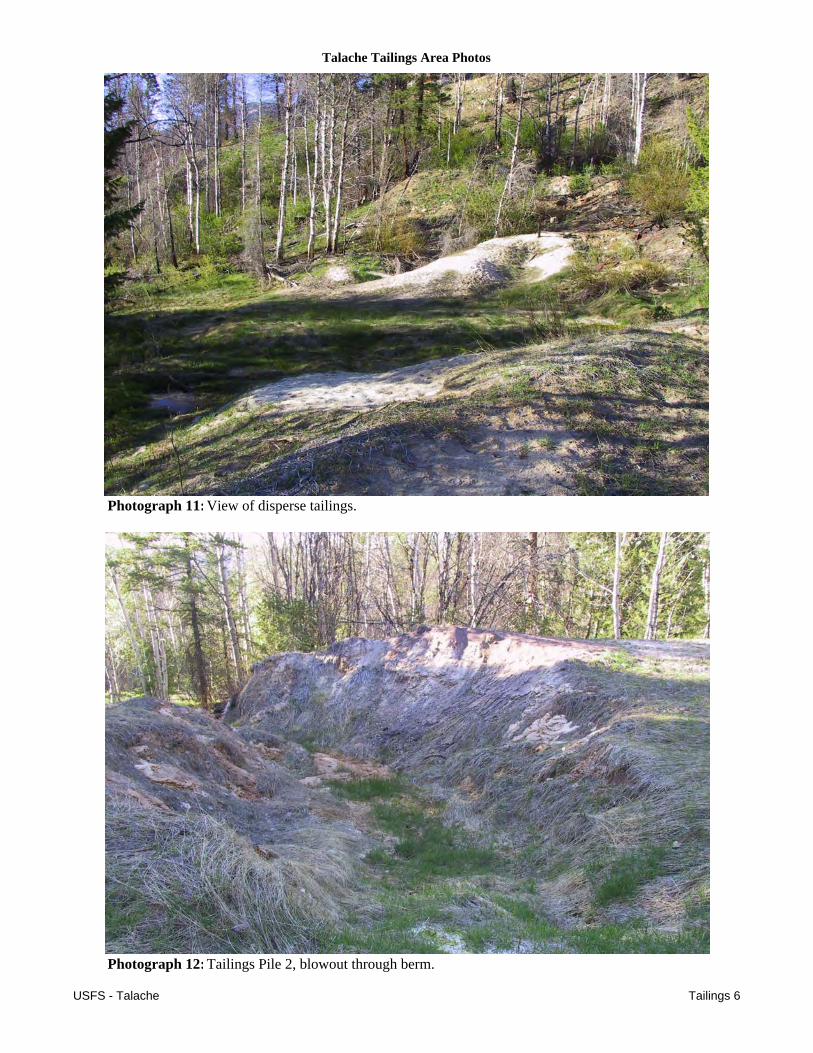
Photograph 11: View of disperse tailings.
Photograph 12: Tailings Pile 2, blowout through berm.
USFS - Talache Tailings 6
Talache Tailings Area Photos
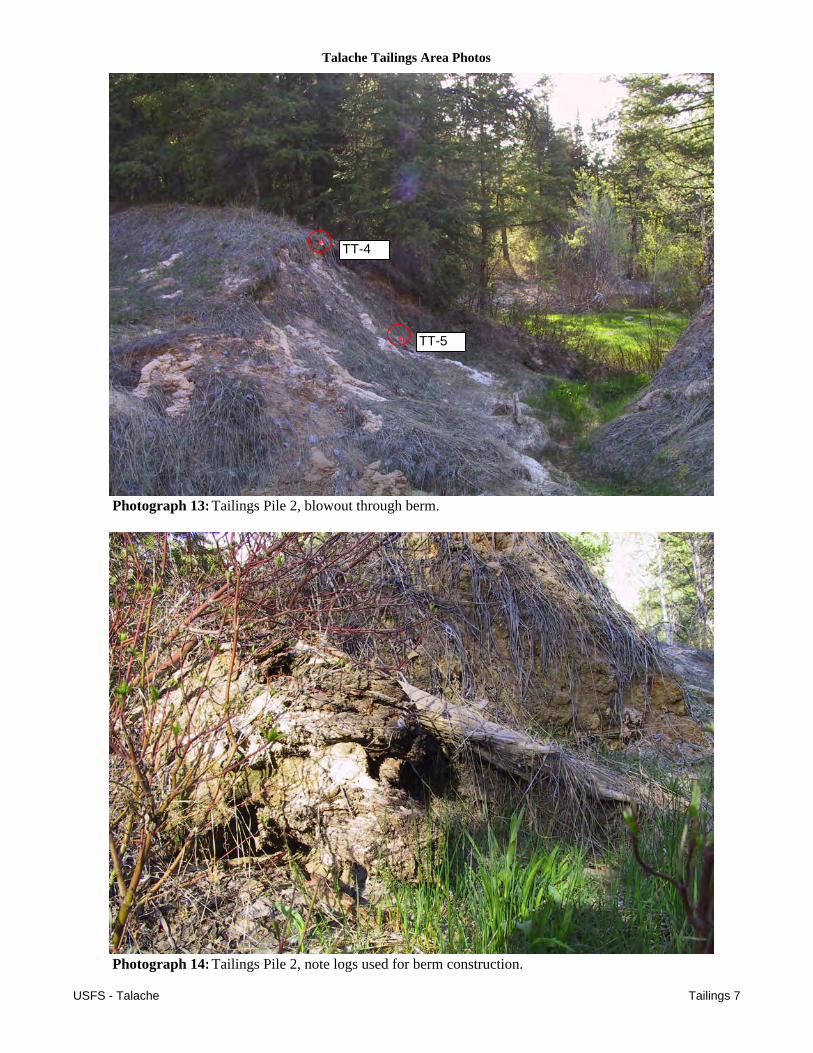
Photograph 13: Tailings Pile 2, blowout through berm.
Photograph 14: Tailings Pile 2, note logs used for berm construction.
TT-4
TT-5
USFS - Talache Tailings 7
Talache Tailings Area Photos
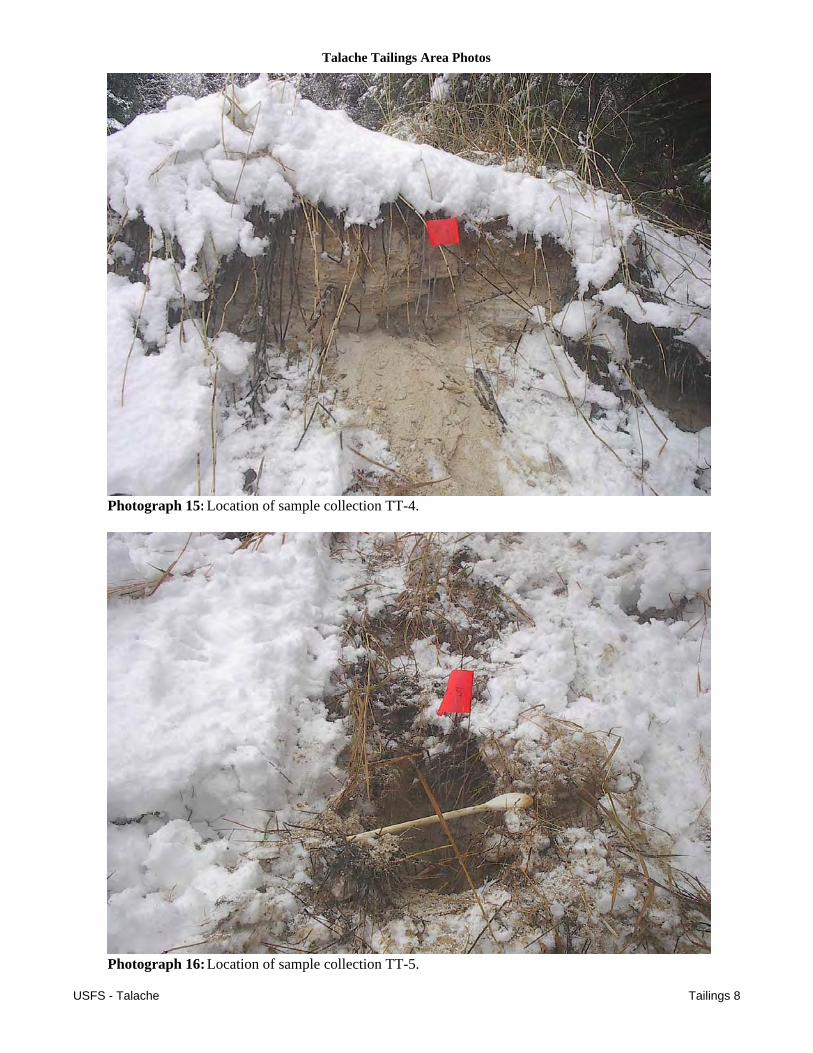
Photograph 15: Location of sample collection TT-4.
Photograph 16: Location of sample collection TT-5.
USFS - Talache Tailings 8
Talache Tailings Area Photos
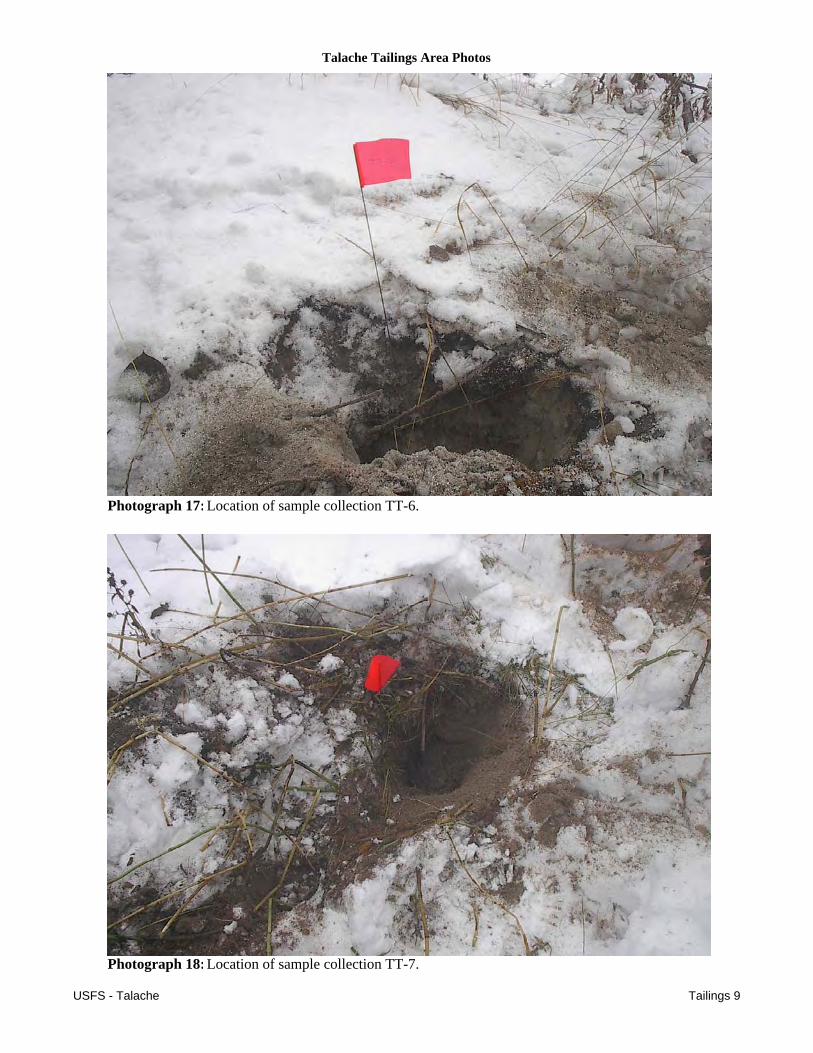
Photograph 17: Location of sample collection TT-6.
Photograph 18: Location of sample collection TT-7.
USFS - Talache Tailings 9
Talache Tailings Area Photos
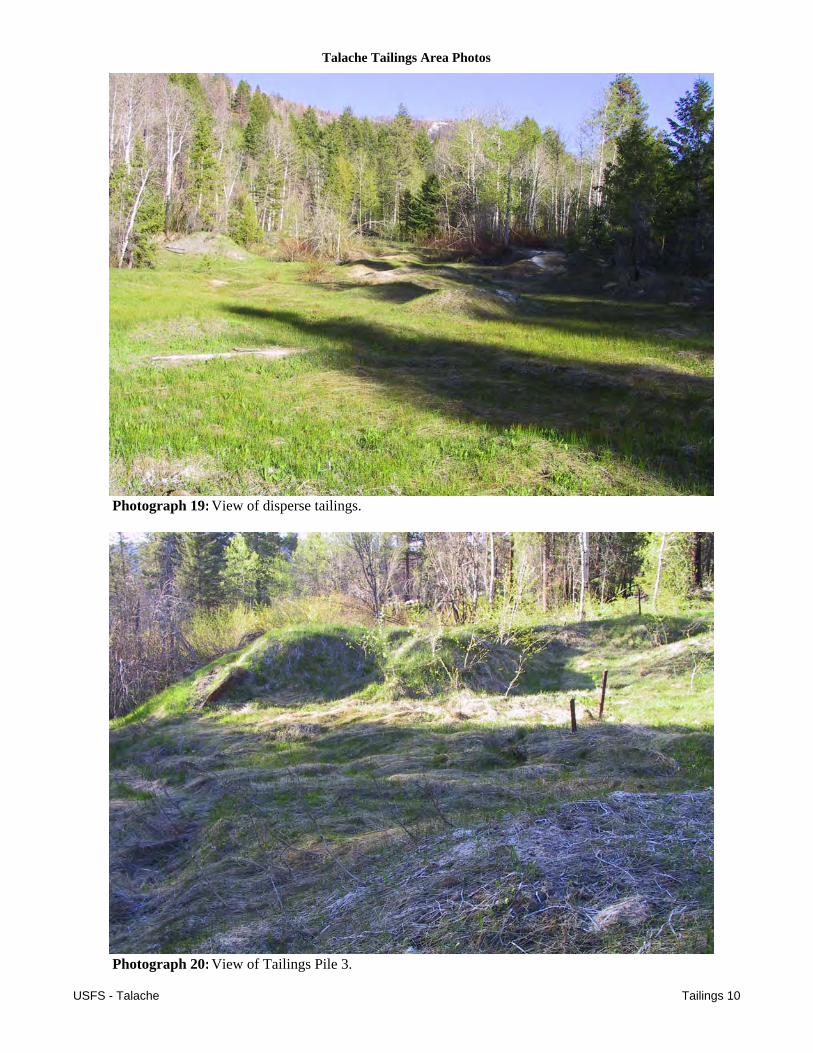
Photograph 19: View of disperse tailings.
Photograph 20: View of Tailings Pile 3.
USFS - Talache Tailings 10
Talache Tailings Area Photos
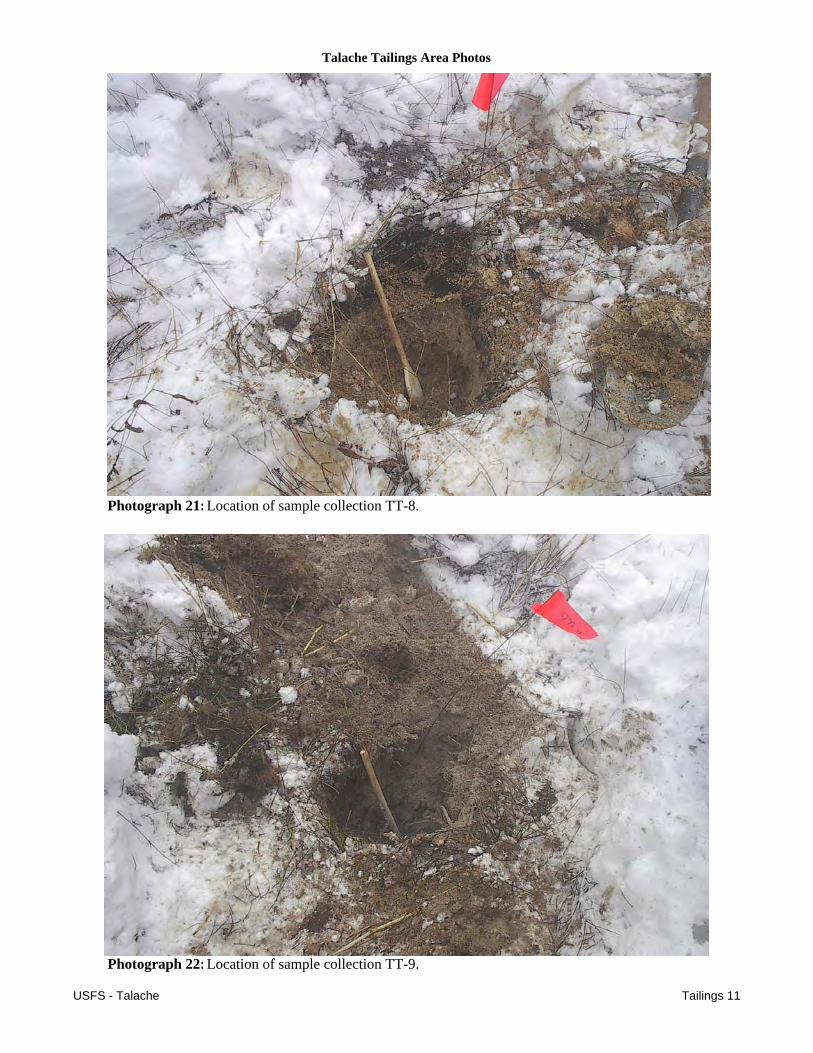
Photograph 21: Location of sample collection TT-8.
Photograph 22: Location of sample collection TT-9.
USFS - Talache Tailings 11
Talache Tailings Area Photos
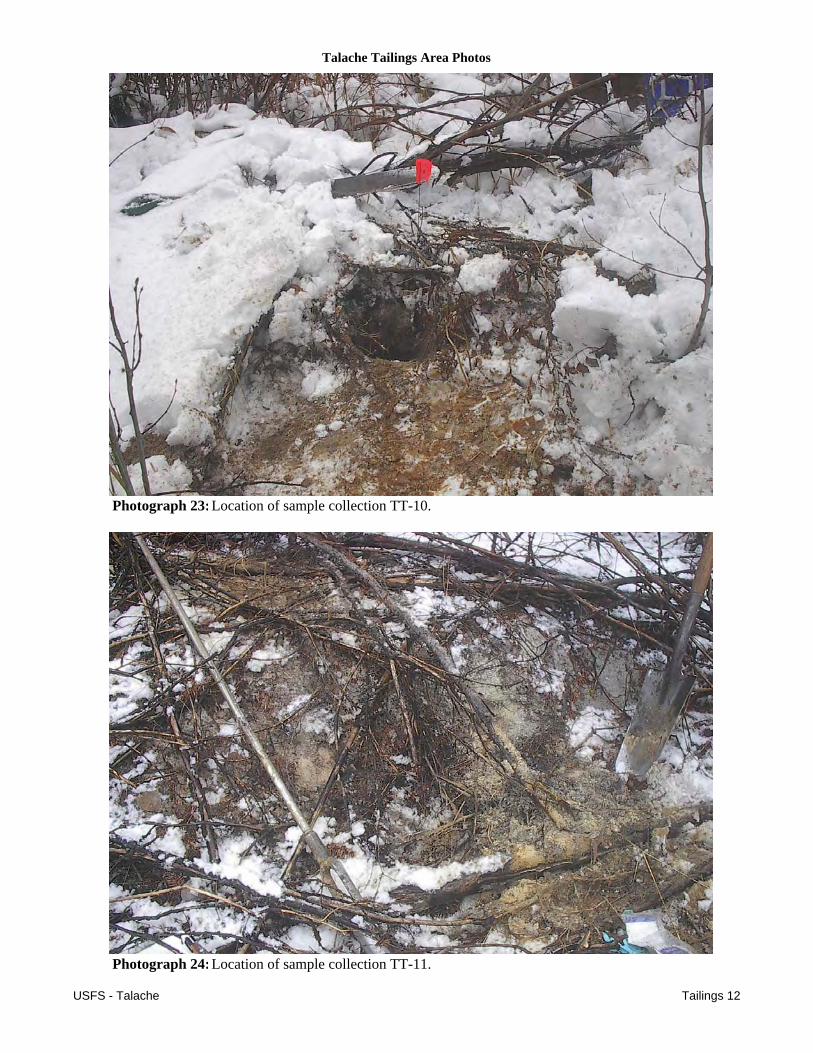
Photograph 23: Location of sample collection TT-10.
Photograph 24: Location of sample collection TT-11.
USFS - Talache Tailings 12
Talache Tailings Area Photos
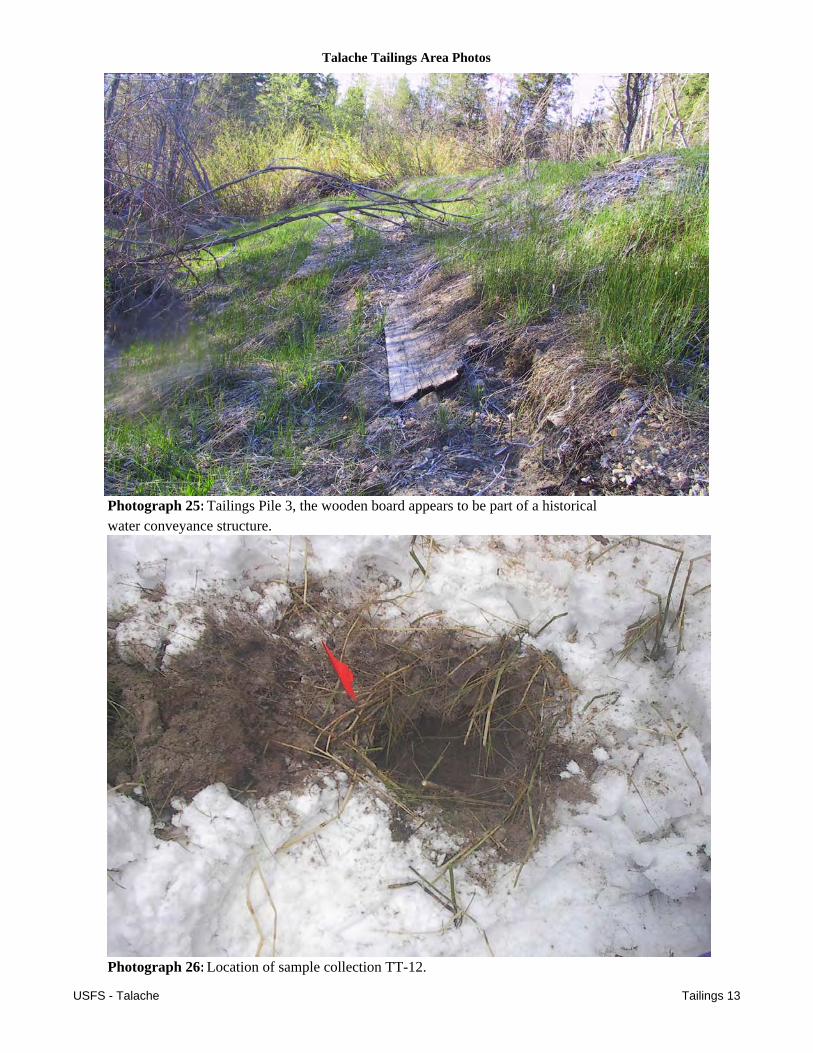
Photograph 25: Tailings Pile 3, the wooden board appears to be part of a historical water conveyance structure.
Photograph 26: Location of sample collection TT-12.
USFS - Talache Tailings 13
Talache Tailings Area Photos
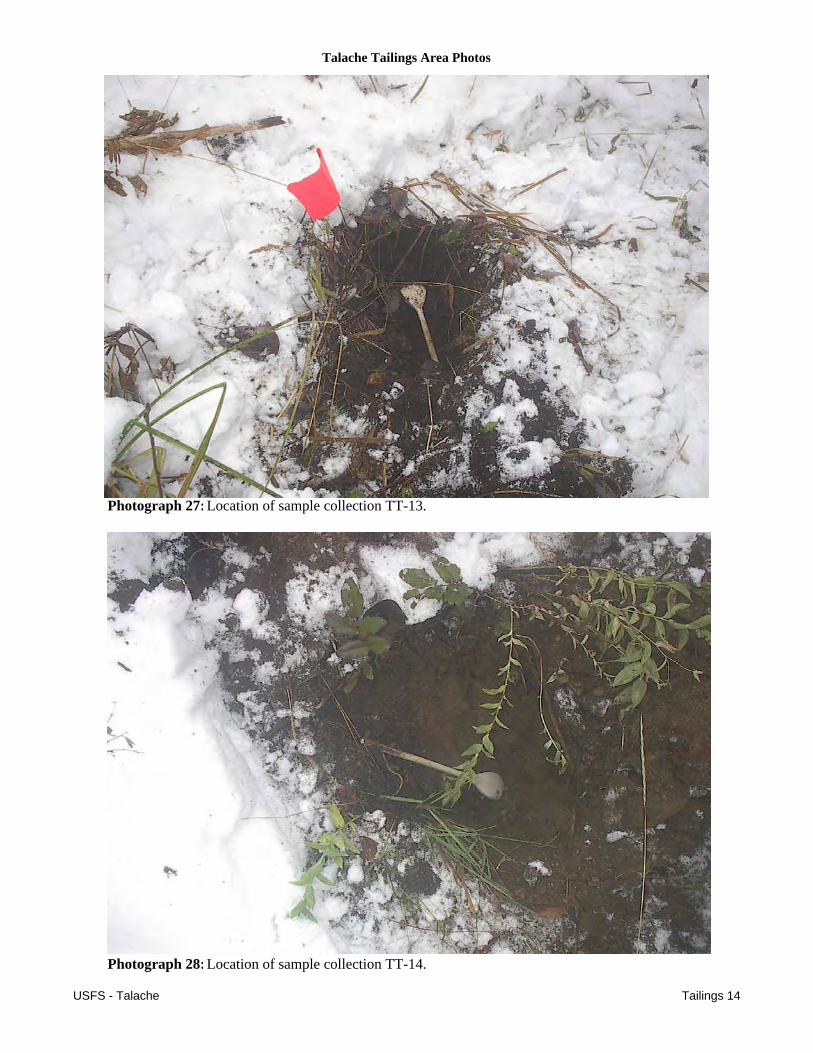
Photograph 27: Location of sample collection TT-13.
Photograph 28: Location of sample collection TT-14.
USFS - Talache Tailings 14
Talache Tailings Area Photos
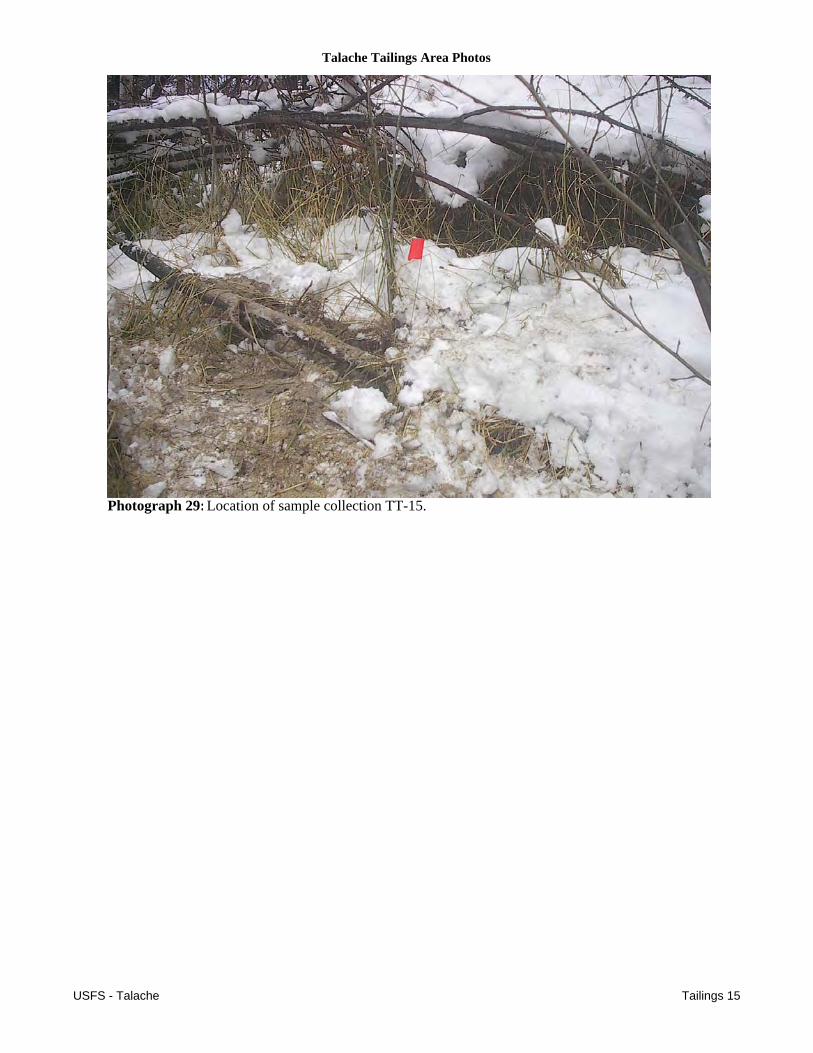
Photograph 29: Location of sample collection TT-15.
USFS - Talache Tailings 15
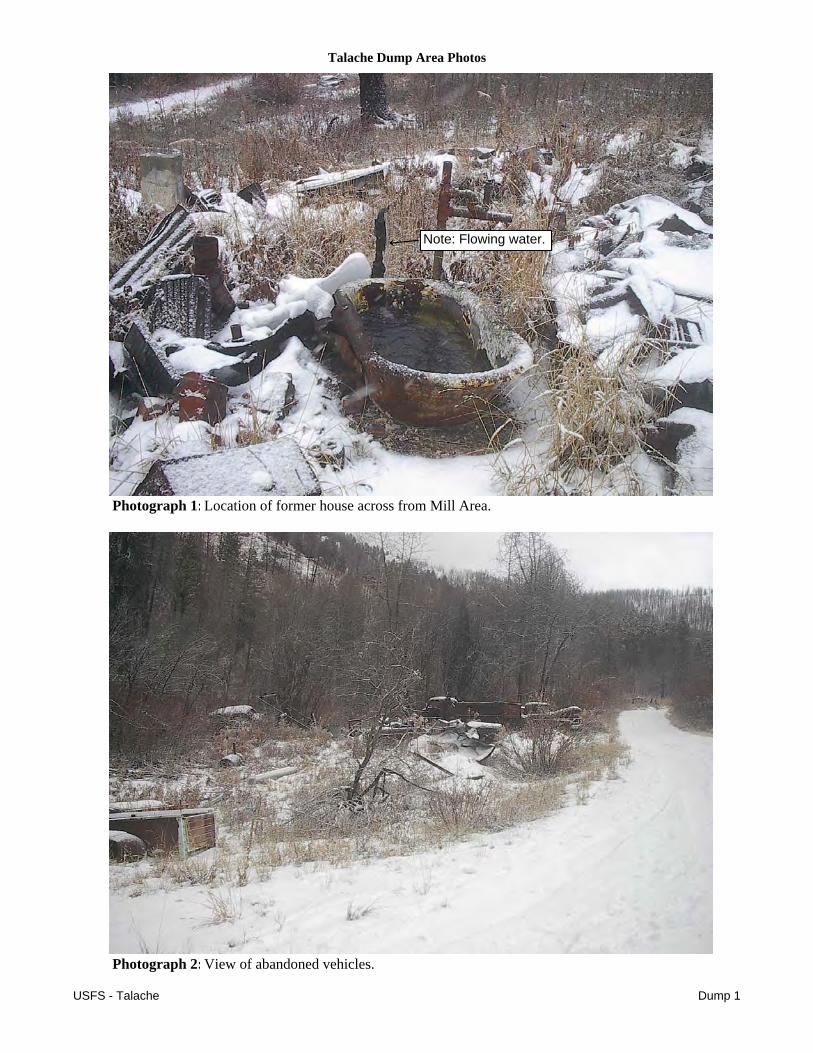
Talache Dump Area Photos
Photograph 1: Location of former house across from Mill Area.
Photograph 2: View of abandoned vehicles.
Note: Flowing water.
USFS - Talache Dump 1
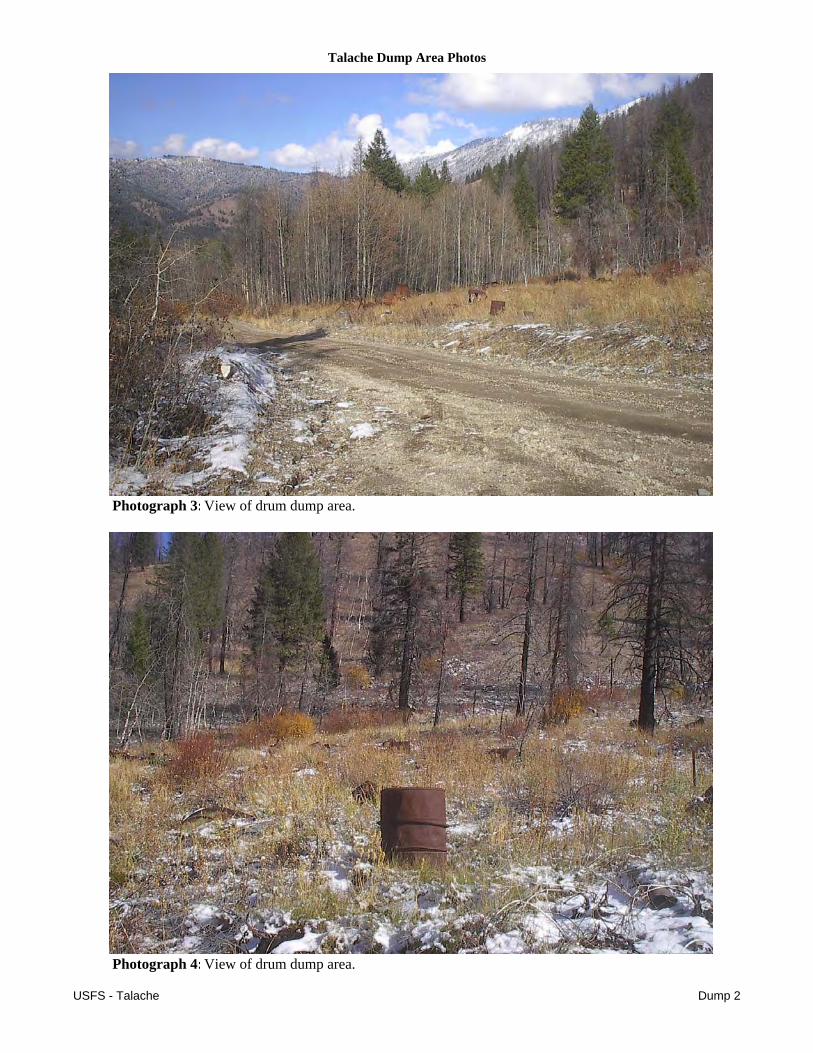
Talache Dump Area Photos
Photograph 3: View of drum dump area.
Photograph 4: View of drum dump area.
USFS - Talache Dump 2
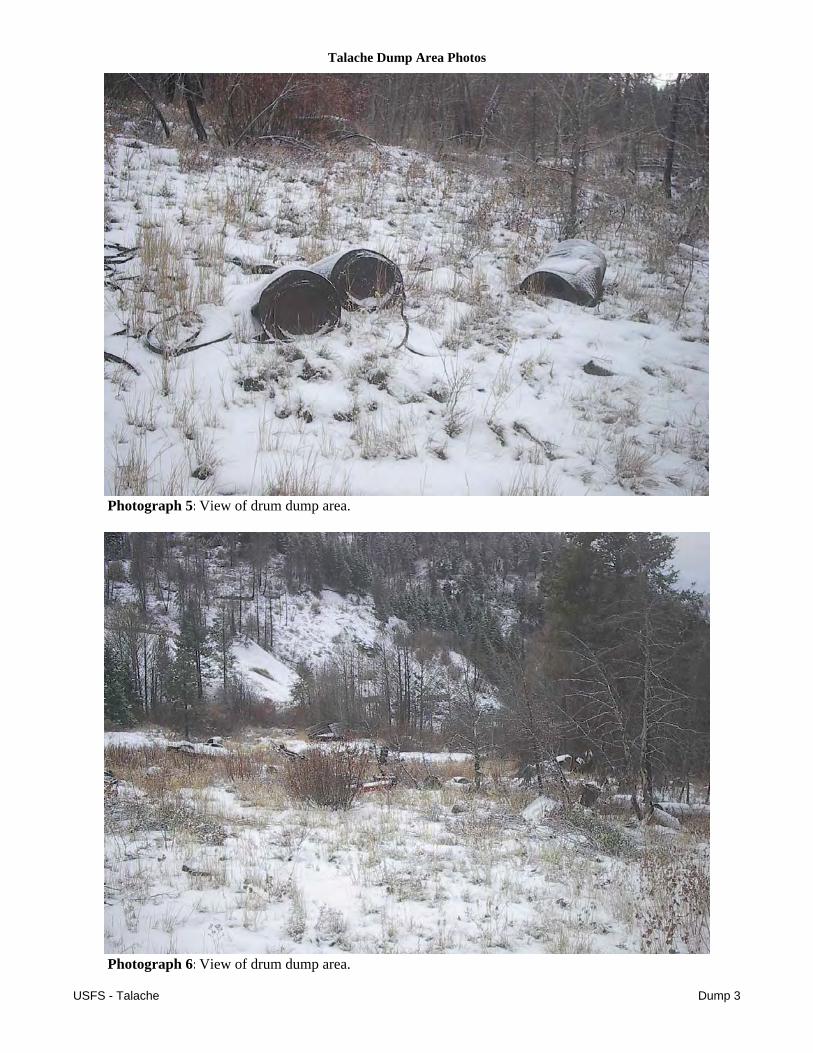
Talache Dump Area Photos
Photograph 5: View of drum dump area.
Photograph 6: View of drum dump area.
USFS - Talache Dump 3
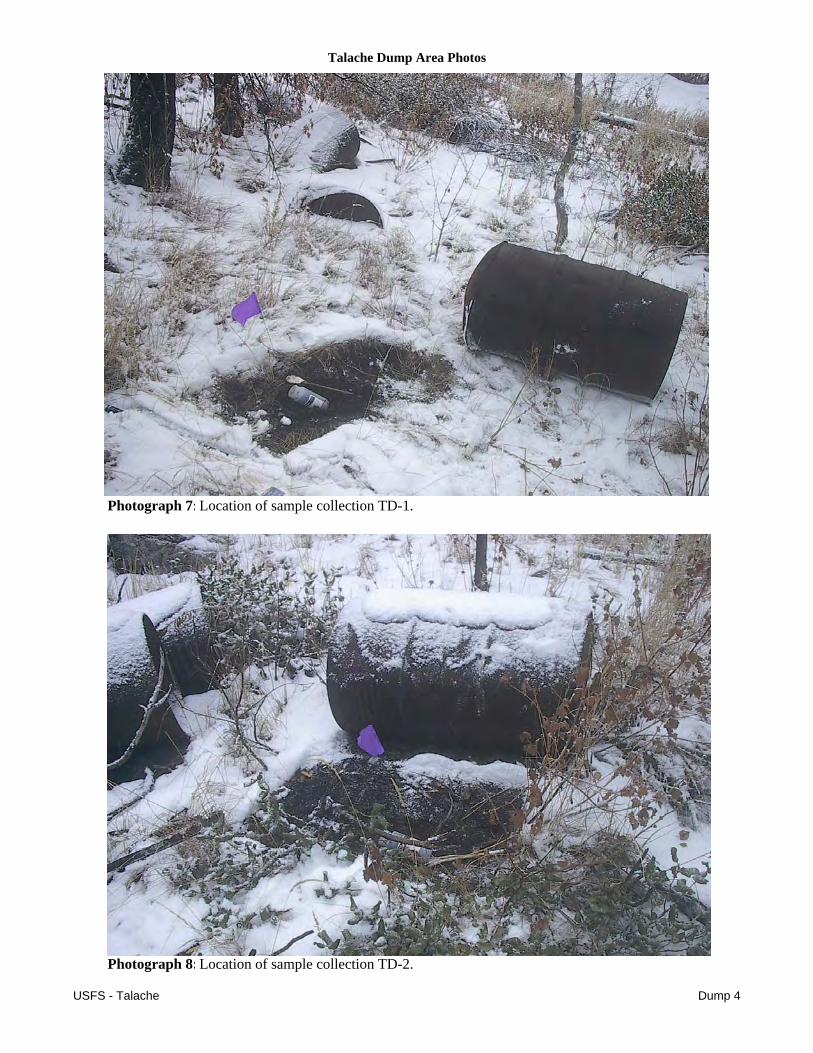
Talache Dump Area Photos
Photograph 7: Location of sample collection TD-1.
Photograph 8: Location of sample collection TD-2.
USFS - Talache Dump 4
Talache Dump Area Photos
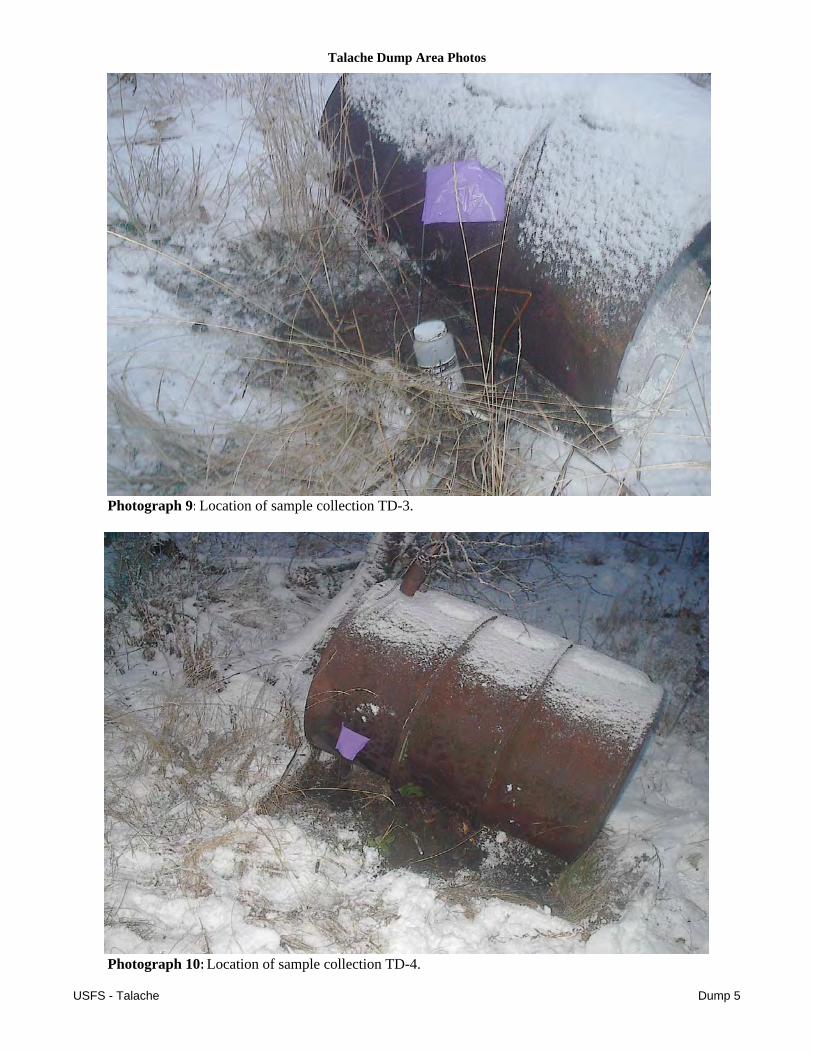
Photograph 9: Location of sample collection TD-3.
Photograph 10: Location of sample collection TD-4.
USFS - Talache Dump 5
Talache Dump Area Photos
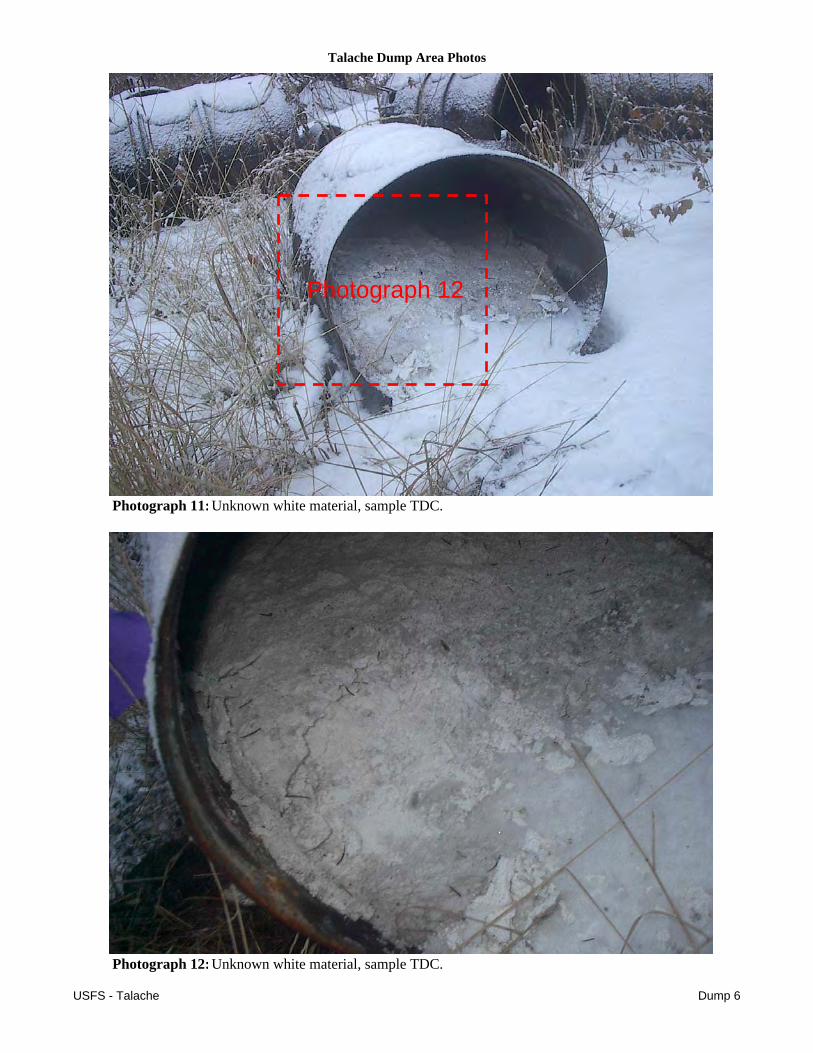
Photograph 11: Unknown white material, sample TDC.
Photograph 12: Unknown white material, sample TDC.
Photograph 12
USFS - Talache Dump 6
Talache Dump Area Photos
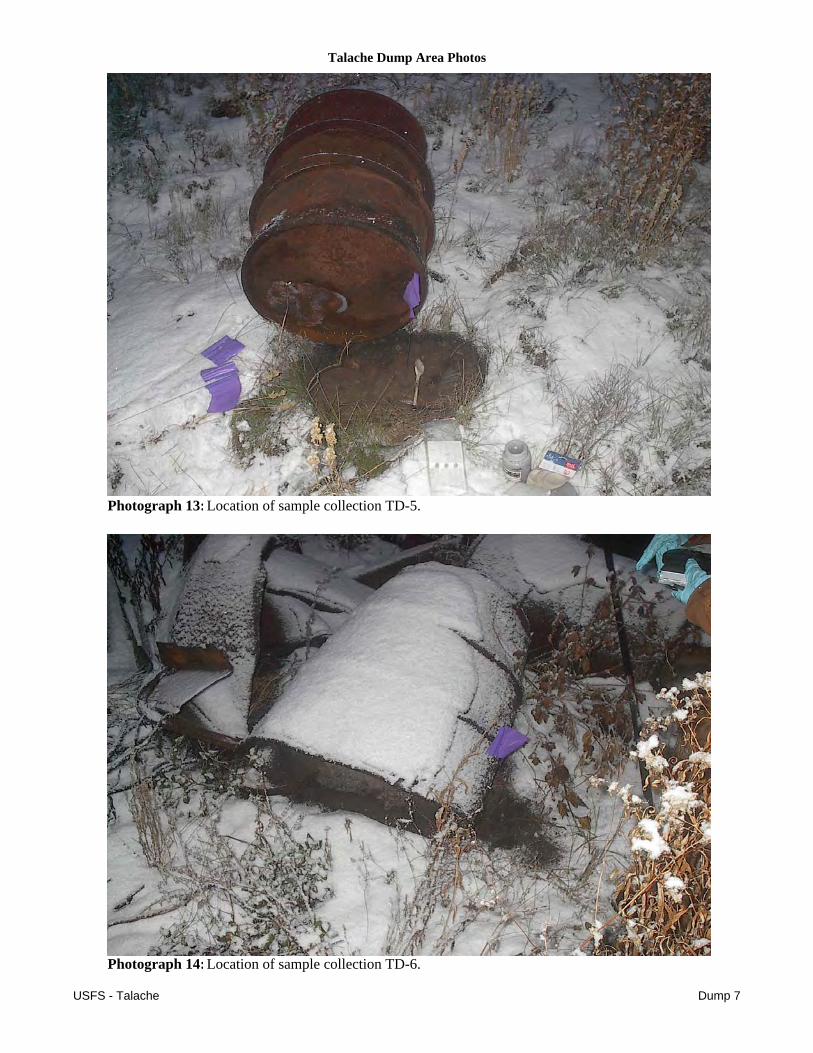
Photograph 13: Location of sample collection TD-5.
Photograph 14: Location of sample collection TD-6.
USFS - Talache Dump 7
Talache Dump Area Photos
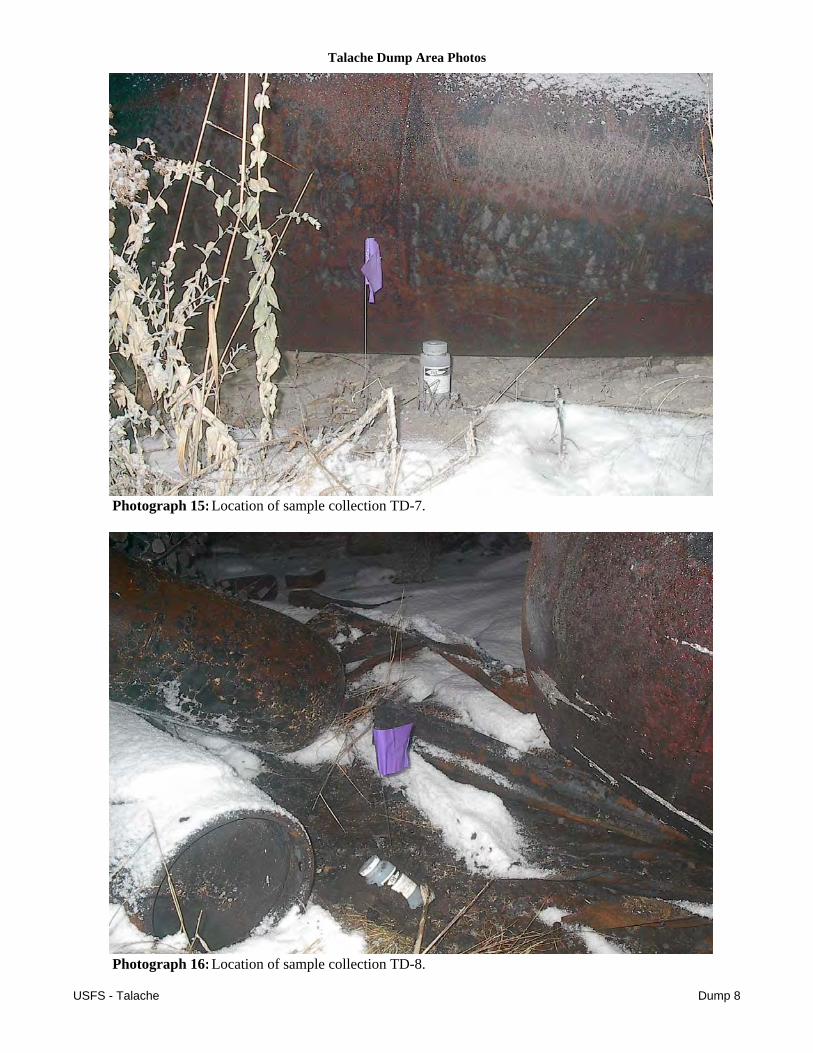
Photograph 15: Location of sample collection TD-7.
Photograph 16: Location of sample collection TD-8.
USFS - Talache Dump 8

Appendix 4
Laboratory Analytical Reports

Appendix 5
Well Drillers Logs