Embed Size (px)
Citation preview


Contents
Site Sustainability PlanTaking Steps Toward the Future
Contents
Acronyms and Abbreviations iv
Executive Summary v
Greenhouse Gas 1
Facilities Performance 5
Fleet 8
Water 10
Pollution Prevention 12
Sustainable Acquisition 15
Electronic Stewardship and Data Centers 16
Renewable Energy 19
Climate Change Adaptation 20
Sustainable Leadership 23
High Energy Mission Specific Facilities 24
Budget and Funding 26
Utility Usage, Costs and Projections 27
Appendix A — Self Certification 28
Appendix B — Social and Economic Performance 30
iii
On The Cover: Mentoring the next generation of scientists, engineers, and technologists through real-life experiences At PNNL, we believe collaboration fuels innovation
Site
Sus
tain
abili
ty P
lan:
Tak
ing
Ste
ps
Tow
ard
the
Fut
ure
| FY
14

Acronyms and AbbreviationsAFV alternative fuel vehicles ARM Atmospheric Radiation Measurement (Climate Research Facility)ASHRAE American Society of Heating, Refrigerating, and Air-Conditioning Engineers
BOCC Building Operations Control Center BTU British Thermal Unit(s)
CBCP Certified Building Commissioning Professional C&D construction and demolitionCD-2 Critical Decision 2 CEDR Consolidated Energy Data ReportCEM Certified Energy Manager CEQ Council on Environmental and QualityCO2e carbon dioxide equivalentCRAC computer room air conditioningCSF Computational Sciences Facility
DC Pro Data Center Profiler Software Tool SuiteDHS U S Department of Homeland SecurityDLA Defense Logistics Agency DOE U S Department of Energy DOEGRIT DOE Green ITDSOM™ Decision Support for Operations and Maintenance Software
EB existing buildingECM energy conservation measureEDL Engineering Development Laboratory EISA Energy Independence and Security Act of 2007EMSL Environmental Molecular Sciences LaboratoryEPA U S Environmental Protection AgencyEPAct Energy Policy Act of 2005EPEAT Electronic Product Environmental Assessment ToolESPC Energy Savings Performance Contract
FIMS Facilities Information Management SystemFY fiscal year
gal gallon(s) GGE gallons of gasoline equivalent GHG greenhouse gas GP Guiding PrinciplesGRI Global Reporting Initiative GSA General Services AdministrationGSF gross square foot/feet
HD high definition HDI How Do I?, PNNL’s standards-based management system
HEMSF High Energy Mission Specific Facility HPSB high performance sustainable buildingHVAC heating, ventilation, and air conditioning
IG (DOE) Inspector General ILA industrial, landscaping, and agricultural (water)IM Information Management IPM integrated pest managementISB2 Information Sciences Building 2 IT information technology
JGCRI Joint Global Change Research Institute
kW kilowatt(s)
LDRD Laboratory Directed Research and DevelopmentLDV Light Duty Vehicle LEED® Leadership in Energy and Environmental Design
MHP Managed Hardware ProgramMT metric ton(s)
NASA National Aeronautics and Space AdministrationNEV neighborhood electric vehiclesN2O nitrous oxide
OMB Office of Management and Budget
PC personal computer P2 Pollution PreventionPNNL Pacific Northwest National LaboratoryPRIMA Platform for Regional Integrated Modeling and Analysis PUE power usage effectivenessPV photovoltaic
R&D research and developmentRDHx rear door heat exchanger REC Renewable Energy CertificateRPL Radiochemical Processing Laboratory
SEL Systems Engineering LaboratorySF6 sulfur hexafluoridesq ft square foot/feet SSP Site Sustainability Plan SSPP Strategic Sustainability Performance Plan S&T science and technology
T&D transmission and distributionTRIM Total Records Information Management
iv
Site
Sus
tain
abili
ty P
lan:
Tak
ing
Ste
ps
Tow
ard
the
Fut
ure
| FY
14
Acronyms and Abbreviations

PNNL’s sustainability vision is to continue being recognized as thought leaders by our customers, our staff members, and the community. We develop and use solutions to make the world a more sustainable place. We set and achieve aggressive goals by empowering employees to be part of the solution.
Executive Summary
Much like a honeycomb with its interlocking pieces that gain strength through mutual support and integration, our three pillars and twelve focus areas create a Sustainability Program that is greater than the sum of its parts
Executive Summary At Pacific Northwest National Laboratory (PNNL), we achieve excellence in sustainability through our science and technology (S&T), management and operations, and through our role in the community We continually increase our commitment to environmental stewardship through the S&T we deliver to solve global energy and environmental challenges and by managing the impact of our operations on the environment We have a long history of protecting and using natural resources wisely We strive to reduce energy use and greenhouse gas (GHG) emissions associated with our buildings and employee transportation
With a comprehensive approach to fulfilling the Strategic Sustainability Performance Plan (SSPP), PNNL advances the U S Department of Energy (DOE) sustainability mission with a diverse, focused effort toward goals for the fiscal year (FY) 2020 and beyond Our scientists and facilities staff partner to find and implement innovative solutions while educating staff members about ways they can minimize environment impacts as well as help us meet aggressive goals in these areas PNNL achieved all FY13 Site Sustainability Plan (SSP) goals Notable achievements from FY13 are listed below
• High Performance Sustainable Buildings (HPSBs): PNNL certified two additional buildings and has achieved 31% of our portfolio as meeting the HPSB criteria, which exceeds the DOE goal of 15% by FY15 The Radiochemical Processing Laboratory (RPL) is the first DOE Office of Science nuclear laboratory to achieve HPSB status using the five Guiding Principles criteria for existing buildings
• Scope 3 GHG: PNNL initiated a Telework Program, with staff members logging over 20,000 days collectively Beyond helping achieve GHG goals by eliminating commuting miles, flexible work arrangements save our staff money and time, reduce stress, increase productivity, and help staff to meet a better work/life balance In addition, 34 collaboration-ready conference rooms were established throughout PNNL and satellite locations These collaboration tools contributed to a reduction in our Scope 3 GHG from employee commuting and will lead to reductions in business travel
• Sustainability Pays: PNNL’s Sustainability Pays Program encourages staff to submit innovative ideas that would contribute to the achievement of SSP goals Of the project proposals funded, three noteworthy successes were:
n developing pump controllers for research vacuum equipment n replacing sulfur hexafluoride (SF6) with nitrous oxide (N2O) as a tracer gas n removing bicycle roadblocks through installation of communal bike pump/fixing stations
For additional information about these projects, please refer to the success story sections of this SSP
v
Site
Sus
tain
abili
ty P
lan:
Tak
ing
Ste
ps
Tow
ard
the
Fut
ure
| FY
14

Summary Table of Goals and Targets
SSPP Goal DOE Goal
Performance Status Through FY13
Planned Actions and Contribution
Risk of Non-
attainment
Goal #1: Greenhouse Gas Reduction and Comprehensive Greenhouse Gas Inventory
1.1 28% Scope 1 & 2 GHG reduction by FY20 from a FY08 baseline (FY13 target: 17%)
FY08 Baseline: 36,076 metric tons (MT) of carbon dioxide equivalent (CO2e)FY13 Actual: 41,706 MTCO2e (367 MTCO2e adjusted for renewable energy certificates [RECs])FY20 Goal: 25,975 MTCO2e Status: Including REC’s goal achieved
Continue REC purchases for near-term GHG reduction goal and implement energy conservation measures, where cost effective.
Low
1.2 13% Scope 3 GHG reduction by FY20 from a FY08 baseline (FY13 target: 4%)
FY08 Baseline: 23,775 MTCO2eFY13 Actual: 21,526 MTCO2eFY20 Goal: 20,684 MTCO2e Status: 9.5% Reduction
Continue promoting telework and high-end video usage to reduce travel; encourage staff through bus and carpool promotions and incentives.
Low
Goal #2: Buildings, Energy Savings Performance Contract (ESPC) Initiative Schedule, Regional and Local Planning
2.1 30% energy intensity (British thermal units [Btu] per gross square foot [GSF]) reduction by FY15 from a FY03 baseline (FY13 target: 24%)
FY03 Baseline: 197,817 Btu/GSF FY13 Actual: 151,021 Btu/GSFFY15 Goal: 138,472 Btu/GSF Status: 23.7% reduction
Continue implementing Consolidated Energy Data Report (CEDR) projects and operational improvements
Medium
2.2 Energy Independence and Security Act of 2007 (EISA) Section 432 energy and water evaluations
Completed first year of the 4-year EISA cycle of eight Buildings
Continue executing EISA evaluations
Low
2.3 Individual buildings metering for 90% of electricity (by October 1, 2012); for 90% of steam, natural gas, and chilled water (by October 1, 2015)(1) (FY13 target: 90% and 50%, respectively)
FY13: 100% metering of electricity, 100% metering of natural gas, 95.7% metering of water
Improve building performance through data analysis from the meters
Low
2.4 Unless uneconomical, install cool roof for replacements unless project already has Critical Decision-2 (CD-2) approval. New roofs must have thermal resistance of at least R-30.(2)
FY13: 61% of PNNL roof area per Facilities Information Management System (FIMS) are cool roofs
Unless uneconomical, all new roofs will have a thermal resistance of at least R-30 and be solar reflective, consistent with former DOE Secretary Chu requirements
Low
The following table summarizes each of DOE’s Office of Science goals, along with PNNL’s performance status, planned actions, and an assessment of the risk of non-attainment as noted below:
Technical Risks: Technology is/is not available in current facilities and systems to attain goal
Management Risks: Management systems and/or policies may require changes for which approval authority is outside DOE or requires an internal policy or procedural change
Financial Risks: Funds are/are not identified in current or out-year targets to achieve goal
Each risk is assigned a rating of high, medium, or low, defined as follows
High Risk: Risk in one of the three categories is so significant that goal non-attainment is likely or expected
Medium Risk: Risk in one of the three categories is significant enough that goal non-attainment is moderate
Low Risk: Any risks are satisfactorily mitigated such that goal attainment is likely
(1) Per National Energy Conservation Policy Act (U.S. Code Section 8253), the term “buildings” includes industrial, process, or laboratory facilities.(2) Former Secretary of Energy Chu, Installation of Cool Roofs on Department of Energy Buildings, Memorandum for Heads of Departmental Elements, June 1, 2010.
vi
Site
Sus
tain
abili
ty P
lan:
Tak
ing
Ste
ps
Tow
ard
the
Fut
ure
| FY
14
Executive Summary

2.5 15% of existing buildings greater than 5,000 GSF are compliant with the HPSB Guiding Principles by FY15 (FY13 target:11%)
31% of PNNL buildings > 5,000 GSF per FIMS are HPSB compliant
Continue trending toward 100% of facilities meeting HPSB
Low
2.6 All new construction, major renovations, and building alterations greater than 5,000 GSF must comply with the Guilding Principles(3)
Institutionalized the Guiding Principles commitment in PNNL Engineering Standards
Achieve Guiding Principles for all new construction greater than 5,000 GSF
Low
Goal #3: Fleet Management
3.1 10% annual increase in fleet alternative fuel consumption by FY15 relative to FY05 baseline (FY13 target:114% cumulative since FY05)
FY06 Baseline: 456 gallons (gal) of gasoline equivalent (GGE) (note: FY05 usage not measured)FY13 Actual: 10,590 (GGE)FY20 Goal: 1,183 gal Status: Exceeded Goal
Actively manage alternate fuel use through fleet oversight and staff training; increase percentage of alternative fuel vehicles (AFVs) when available
Low
3.2 2% annual reduction in fleet petroleum consumption by FY20 relative to FY05 baseline (FY13 target: 16% cumulative since FY15)
FY05 Baseline: 38,824 gal (GGE)FY13 Actual: 31,244 gal (GGE)FY20 Goal: 28,674 gal Status: 19.5% Reduction
Continue assessing the transition to AFVs
Low
3.3 100% of light duty vehicle (LDV) purchases must consist of AFV by FY15 and thereafter (75% FY00–FY15)(4)
Of total 46 LDVs in PNNL fleet, 37 (80%) are AFVs; added 4 E85 AFVs and 1 hybrid in FY13
Continue working with fleet vendors to replace vehicles with AFV types where available
Low
3.4 Reduce fleet inventory of non-mission critical vehicles by 35% by FY13 relative to a FY05 baseline
Removed all 19 non-mission critical vehicles
Continue assessing fleet utilization and right-sizing, if appropriate
Low
Goal #4: Water Use Efficiency and Management
4.1 26% potable water intensity ([gal/GSF) reduction by FY20 from a FY07 baseline (FY13 target: 12%)
FY07 Baseline: 66.85 gal/GSFFY13 Actual: 27.28 gal/GSFFY20 Goal: 49.47 gal/GSF Status: Exceeded Goal
As feasible, continue implementing potable water projects to reduce overall use
Low
4.2 20% water consumption (gal) reduction of industrial, landscaping, and agricultural (ILA) water by FY20 from a FY10 baseline (FY13 target: 6%)
FY10 Baseline: 97,522,000 galFY13 Actual: 124,857,000 galFY20 Goal: 78,017,600 gal Status: 28.0% Increase
Continue implementing Landscaping Plan with focus on reducing ILA where possible
Medium
Goal #5: Pollution Prevention (P2) and Waste Reduction
5.1 Divert at least 50% of non-hazardous solid waste, excluding construction and demolition (C&D) debris, by FY15
FY13: Diverted 57% of non-hazardous solid waste
Continue conducting assessments for waste reducing opportunities
Low
5.2 Divert at least 50% of C&D materials and debris by FY15
FY13: Diverted nearly 100% of C&D waste
Continue monitoring C&D recycling performance and raising awareness on waste diversion requirements
Low
(3) DOE considers buildings meeting the following criteria as complying with Guilding Principles (GPs): Any building that achieves LEED-EB Silver or higher or LEED-NC Gold or higher; Any building that achieves a Green Globes-NC rating of four or a Green Globes CIEB rating of three; Any building that has been occupied for more than one year that achieves Living Status designation by the Living Building Challenge (although included as policy in the 2012 SSPP, these equivalencies are contingent upon Office of Management and Budget (OMB) and Council on Environmental and Quality (CEQ) approval).(4) EPAct 1992 goal updated per Presidential Memorandum on Federal Fleet Performance on May 24, 2011. http://www.whitehouse.gov/the-press-office/2011/05/24/presidential-memorandum-federal-fleet-performance
vii
Site
Sus
tain
abili
ty P
lan:
Tak
ing
Ste
ps
Tow
ard
the
Fut
ure
| FY
14
Executive Summary

Goal #6: Sustainable Acquisition
6.1 Procurements meet requirements by including necessary provisions and clauses (Sustainable Procurements/Biobased Procurements)
100% of acquisitions have sustainability requirements and clauses
Continue being proactive with sustainable item procurement
Low
Goal #7: Electronic Stewardship and Data Centers
7.1 All data centers are metered to measure a monthly power utilization effectiveness (PUE) of 100% by FY15 (FY13 target: 80%)
Two of PNNL’s three data centers (67%) are fully metered
Complete data center metering before FY15
Low
7.2 Maximum annual weighted average PUE of 1.4 by FY15 (FY13 target: 1.60)
FY13: Annual weighted average PUE is 2.1. One of PNNL’s three data centers is below 1.4 PUE.
Implement projects to trend toward goal
Medium
7.3 Electronic Stewardship: 100% of eligible personal computers (PCs), laptops, and monitors with power management actively implemented and in use by FY12
100% of eligible equipment is compliant
Assure new equipment has power management features
Low
Goal #8: Renewable Energy
8.1 20% of annual electricity consumption from renewable sources by FY20 (FY13 target: 7.5%)
FY13: 70.7% of annual electric consumption from on-site generation and REC purchases
Continue operating our 125 kilowatt (kW) on-site photovoltaic (PV) array and purchasing RECs
Low
Goal #9: Climate Change Adaptation
9.1 Climate Change Adaptation - Address DOE Climate Adaptation Plan goals
Completed all actions planned for FY 2013
Continue to seek opportunities to participate in existing partnership with agencies in the Pacific Northwest region
Low
viii
Site
Sus
tain
abili
ty P
lan:
Tak
ing
Ste
ps
Tow
ard
the
Fut
ure
| FY
14
Executive Summary

Goals1.1 – 28% Scope 1 & 2 GHG reduction by FY20 from a FY08 baseline
1.2 – 13% Scope 3 GHG reduction by FY20 from a FY08 baseline
Greenhouse GasPNNL will continue targeting opportunities that have a net positive effect on Scope 1, 2, and 3 GHG emissions.
FY13 Performance Status
Scope 1 & 2PNNL continues to work toward the goal of reducing GHG Scope 1 & 2 emissions by 28% by FY20 compared with our FY08 baseline In FY13, PNNL targeted several activities to reduce Scope 1 & 2 GHG further Items include installation of a higher efficiency supercomputer, further consolidation of servers, expansion of core business hours, updating our Engineering Standards and Specifications, and initiating monthly Building Operations Control Center (BOCC) meetings with building core teams
The PNNL FY08 Scope 1 & 2 baseline is 36,076 MTCO2e Between FYs 08 and 13, growth (especially in computational sciences) increased our overall energy usage, resulting in a FY13 Scope 1 & 2 of 41,706 MTCO2e PNNL performance between FYs 12 and 13 shows a 4 5% increase of Scope 1 & 2, primarily driven by additional supercomputer loads PNNL continues to implement its strategy of procuring RECs in FY13, resulting in an offset of 41,339 MTCO2e
SF6 Reduction
PNNL inventoried all of its existing sources of SF6 and has a good understanding of its uses, which have historically been as an insulator in electron microscopes and as tracer gas in research In 2011, PNNL worked with researchers who used SF6 as a tracer to adopt a substitute gas, N2O, which has a lower global warming potential This replacement has continued, and no new project work has included SF6
Scope 1&2 GHG emissions for DOE reported buildings MTCO2e
Telework Program provides flexibility enabling staff to work productively
1
Site
Sus
tain
abili
ty P
lan:
Tak
ing
Ste
ps
Tow
ard
the
Fut
ure
| FY
14
Greenhouse Gas

Compared with FY12, the decrease in business travel emissions is primarily attributable to decreases in project work requiring travel and reduced staffing numbers In addition, in FY13 PNNL took major steps to enhance remote collaboration capabilities and encourage staff to explore alternatives to business travel where possible Key accomplishments include:
• Rollout of Lync 2013 to all staff, which allows users to connect with both internal and external collaborators through instant message, video calls, online meetings, chat and desktop sharing
• Rollout of a suite of mobile platform tools which allow employees to access work documents and applications remotely
• Added high-end, easy-to-use Tandem video systems to 14 conference rooms throughout PNNL and satellite locations to facilitate Lync video meetings Another 20 conference rooms will have a overhead projector and a Polycom Roundtable camera, which enables remote meeting participants to see 360° views of the meeting space and individual views that track according to the current speaker
• Hands-on training to overcome barriers to using the new equipment, mobile tools and Lync software so all staff are comfortable with the modern collaboration tools
For electron microscopes, SF6 is relatively stable, and any year-to-year fluctuations are primarily due to use of a mass balance inventory method In 2013, a large container of SF6, which had been in inventory since 2003, was removed, causing the appearance of a spike in SF6 use
Scope 3All Scope 3 Emissions
Before adjusting for transmission and distribution loss-related emissions avoided through REC purchases, Scope 3 emissions totaled 21,526 MTCO2e, representing a 9 5% reduction from the FY08 baseline (1)
Business travel was the largest contributor to these emissions (54 1%), followed by employee commuting (35 5%) and transmission and distribution (T&D) losses (8 6%) Emissions from contracted solid waste disposal and wastewater treatment made up just 1 8% Reducing Scope 3 emissions continued to be a strategic priority at PNNL in FY13 Specific activities are discussed in more detail below
Scope 3 GHG emissions for DOE reported buildings MTCO2e
Business Air and Ground Travel
In FY13, total emissions from business travel were 13,107 MTCO2e, a decrease of 12 9% compared with FY12 Air travel totaled 12,318 MTCO2e and decreased 13% compared with FY12 Business ground travel decreased 11% over the previous year
While PNNL has had three years of business travel volume decreases, emissions remain 1% above FY08 baseline levels As noted in previous SSPs, PNNL experienced a dramatic increase during FY09 and FY10 in business volume and business travel to support project-specific requirements (e g , the Department of Homeland Security’s (DHS) Radiation Portal Monitoring Program)
(1) FY12 and FY13 Scope 3 emissions are below FY11 levels largely due to a change in accounting practices. For the first time in FY13, transmission and distribution loss-related emissions avoided through REC purchases were deducted from the Scope 3 emissions total.(2) Commute emission estimates were calculated using the General Services Administration’s (GSA’s) Carbon Footprint Tool employee commute survey administered bi-annually. Note that because no survey was conducted in FY13, employee commute emissions were extrapolated proportionally based on the change in staffing levels from FY12.
Scope 3 Business Travel
Employee Commuting
PNNL’s employee commute emissions in FY13 totaled 8,611 MTCO2e, a decrease of 3 4% from FY12 (2) As noted in previous SSPs, emissions climbed sharply after FY08 as employment levels increased by 17% from the baseline year The decrease in FY13 emissions is attributed to a decrease in permanent staff of 2 9% from FY12 levels, an increased use of alternative commute methods and the expansion of the telework program to all of PNNL at the end of FY12 Employee commute emissions in FY 2013 were 2% above the FY08 baseline
2
Site
Sus
tain
abili
ty P
lan:
Tak
ing
Ste
ps
Tow
ard
the
Fut
ure
| FY
14
Greenhouse Gas

Other Scope 3 Emissions Sources
All other emission sources comprise 10% of PNNL’s Scope 3 emissions Specifically, T&D losses attributable to DOE-owned and leased facilities at PNNL totaled 2,090 MTCO2e using the national loss factor of 6 18%, a 1 8% increase from FY12 Contracted wastewater treatment and waste disposal totaled 440 MTCO2e, a 14% decrease from FY12
PNNL does not plan to actively manage wastewater emissions, as it can be controlled only by reducing staff numbers under the current accounting methodology T&D losses will be managed as a result of our Scope 2 electricity reduction efforts Waste management emissions will be actively managed as described in the P2 section
Plans, Actions, and Projected Performance
Scope 1 & 2For FY14, PNNL will implement continuous commissioning, perform three EISA energy and water audits, and install variable air volume systems for enhanced heating, ventilation, and air conditioning (HVAC) savings We will also continue procuring RECs at competitive rates to offset the remainder of our GHG emissions
SF6 Reduction
We will continue tracking SF6 at PNNL in the future and will look for further opportunities to manage its use by creating an informal network of SF6 users to raise awareness around risks and best practices
Scope 3To achieve the 13% reduction in Scope 3, PNNL will need to reduce annual emissions by another 840 MTCO2e over the next six years Most of this decrease will be achieved through a combination of activities aimed at reducing business travel, employee commuting, and T&D losses associated with electricity use PNNL will continue advancing the programs conducted in FY13 and will pursue additional activities to decrease Scope 3 emissions further
Scope 3 Employee Commuting
More and more staff were able to take advantage of the telework option in FY13 as the culture shifted to greater acceptance of the new way of working By the end of FY13, approximately 16% of employees had signed telework agreements, with 4 4% of staff reporting teleworking at least once per week on average Staff recorded 20,928 telework days through the PNNL electronic time-keeping tool and avoided an estimated 196 MTCO2e
A Telework Advocate raised staff awareness of commute alternatives through all-staff communica- tions, including a website and quarterly sustainability newsletter, which featured an “alternative commuter of the month” competition for prizes PNNL hosted several events in FY13 to bring alternative commuters together to share best practices, including a wellness challenge, two bike-to-work days, booths at the Sustainability Fair, the Diversity Fair and the annual employee safety picnic, and three bicycling workshops
PNNL continued its partnership with a regional alternative commute support service, RideShare Online, to provide custom tailored ride matching and alternative commute tracking support
The newly formed PNNL Cycling Club remained active, and although the number of employees in it is small, it demonstrates strong enthusiasm for this commute method and continues to attract the attention of most staff The club recently competed in a national competition to log their commute miles
Bus passes continue to be purchased by 30-50 staff each month PNNL bus commuters avoided even more emissions this year after the local transit authority deployed one of the first all-electric buses in the country
Interest in and ownership of personal electric vehicles grew stronger this year, and several employees are taking a leadership role in the community to promote this mode of transportation Employees may purchase pre-paid cards which enable them to use the car-charging stations located on-site
3
Site
Sus
tain
abili
ty P
lan:
Tak
ing
Ste
ps
Tow
ard
the
Fut
ure
| FY
14
Greenhouse Gas

Success StoryWorking together, the Sustainability Program and Information Management (IM) Services put mobile tools and audio/visual equipment in the hands of PNNL staff and in our conference rooms, enabling them to do their jobs exception- ally well—regardless of physical location.
2013 Lync software is more capable than ever, meaning PNNL staff members are as well! Wherever they go, staff can stay connected—to work, customers, and each other—via chat, audio, or video from their desktop or laptop, iPad, or cell phone device.
Collaboration-ready conference rooms have been outfitted throughout PNNL, including satellite locations. Nearly half of these have high-end Tandem video conferencing systems ideally suited for meetings that require a large high definition (HD) video display. Other rooms include a Polycom Roundtable, a 360 degree web cam with “smart” audio, so that participants in multiple locations have full visual and audio views of a meeting.
IM Services has extensive hands-on training for the Lync software and new equipment so that staff can transition smoothly to the mobile and modern tools. Collectively, these innovative and mobile collaborative options give staff members the chance to remain connected with clients and colleagues—all while helping PNNL reduce Scope 3 emissions.
New collaboration tools: the engine behind innovation
Business Travel Emissions
During FY14, PNNL will complete the deployment of remote collaboration tools in conference rooms including satellite locations PNNL will hold a series of technical training sessions to help staff feel comfortable using the new tools As part of this training, IT staff will work with employees to overcome technical barriers to collaboration with external customers across DOE and other federal agencies
Employee Commute Emissions
PNNL’s commute emissions reduction strategy will continue to emphasize telework in FY13 and beyond PNNL established a goal of 40% of all employees teleworking one day per week on average by FY20, which corresponds with meeting the goal of a 13% reduction in commute emissions
Additional activities in FY14 to help accomplish PNNL’s Scope 3 emission reduction goals include engaging staff through communications, special events, seminars, challenges and staff recognition
4
Site
Sus
tain
abili
ty P
lan:
Tak
ing
Ste
ps
Tow
ard
the
Fut
ure
| FY
14
Greenhouse Gas
Facilities PerformanceAdvanced metering, HPSB, EISA evaluations, and energy efficiency project implementation continues positive progress toward PNNL’s energy goals.
FY13 Performance Status
Energy IntensityPNNL remains aggressive about reducing its energy intensity by 30% before FY15 We are accomplishing this goal through a combination of energy-saving projects, operational efficiencies, and improvements to our Engineering Standards and Specifications
The PNNL FY03 energy intensity baseline was 198 thousand British thermal units (kBtu) per GSF Between FYs 03 and 13, energy efficiency projects, operational improvements, and vacating several less efficient facilities offset PNNL’s energy use, resulting in a FY13 energy intensity of 151 kBtu per GSF for a net 23 7% energy-intensity reduction
Staffed by our sustainability engineer and three interns, PNNL’s BOCC analyzed data from our advanced meters and building control system graphics Developed at PNNL as an advanced supervision and diagnostic tool, Decision Support for Operations and Maintenance (DSOM™) software helped us reduce energy use, lower operations and maintenance costs, and extend equipment life in facilities DSOM has been deployed into select PNNL facilities, which has resulted in many informed decisions about reducing energy use
For reference, the final FIMS list of buildings dated November 22, 2013 (excluded from the energy intensity goal), and a copy of the exclusion self-certification letter can be found in Appendix A
PNNL’s Building Operations Control Center
Energy Intensity (Kbtu/ft2)
5
Site
Sus
tain
abili
ty P
lan:
Tak
ing
Ste
ps
Tow
ard
the
Fut
ure
| FY
14
Goals2.1 – 30% energy intensity reduction by FY15 from a FY03 baseline
2.2 – EISA Section 432 energy and water evaluations
2.3 – Individual buildings metering for 90% of electricity (by October 1, 2012); for 90% of steam, natural gas, and chilled water (by October 1, 2015)
2.4 – Unless uneconomical, install cool roofs for replacements unless project already has CD-2 approval. New roofs must have thermal resistance of at least R-30
2.5 – 15% of existing buildings greater than 5,000 GSF are compliant with HPSB Guiding Principles by FY15
2.6 – All new construction, major renovations, and building alterations greater than 5,000 GSF must comply with the Guiding Principles
Facilities Performance

Engaged staff members who have optimal tools, equipment, and training are one of the most important contributors to our success as leaders in sustainability We believe that staff certification through a qualified training program is vital to refreshing and sharpening staff skills about the latest energy and water saving techniques In FY13, notable accomplishment for two of our staff members is their attending the Certified Energy Manager (CEM) and Certified Building Commissioning Professional (CBCP) courses with both successfully passing the exams This brings our total CEM staff to six and CBCP to one, which enhances PNNL’s knowledge base and organization depth
EISA EvaluationsPNNL successfully completed the first of a four-year cycle for our eight buildings that are subject to EISA Section 432 energy and water evaluation requirements In FY13, we finalized one facility, the information from which was used immediately to improve plant performance and plan for future energy conservation measures (ECMs) whenever cost effective As it is difficult to project the exact energy and water reductions specific to retroactive commissioning efforts, the completed buildings showed overall energy and water use improvement
MeteringWhole building metering as required by EISA for electricity, natural gas, and water has been completed for all buildings where economic calculations showed that it was viable to install With real-time meter data, our BOCC has all the necessary information to perform system analyses on facilities The PNNL Metering Plan details our successful completion of this goal and outlines future strategies of how we intend to use the data
Cool RoofsPNNL’s Engineering Standards and Specifications meet the DOE-established cool roof requirements In FY13, the PNNL cool roof inventory was 664,126 square feet or approximately 61% of FIMS facilities We will continue to add cool roofs in both new construction and when replacing existing building roofs
Existing BuildingsCurrently, 31% of PNNL buildings meet HPSB requirements All existing buildings have been assessed against the HPSB Guiding Principles using the checklist provided in the U S Environmental Protection Agency’s (EPA’s) ENERGY STAR Portfolio Manager
Number of Buildings that are HPSB
A gap analysis in FY11 determined that pursuing either Leadership in Energy and Environmental Design (LEED®) for existing buildings (EB) Silver or Guiding Principles certification were both viable strategies to progress toward 100% of all buildings meeting the HPSB criteria In FY13, two buildings were selected for this endeavor, and PNNL began documenting the LEED EB and Guiding Principles requirements The results of our efforts led to the Sigma 4 building achieving LEED EB Silver certification, and the RPL building attaining HPSB status through the Guiding Principles
New ConstructionPNNL did not have any new construction activities in FY13 Potential strategies to achieve the FY30 goal of net zero buildings were discussed and incorporated into our Engineering Standards, along with adoption of the new American Society of Heating, Refrigerating & Air Conditioning Engineers (ASHRAE) 90 1 2010 energy code While several ideas and methods were evaluated, it was determined that at this time, it is not economically practicable to construct a net zero building
Plans, Actions, and Projected PerformanceEnergy IntensityThrough the BOCC, PNNL will continue initiating real-time commissioning of facility systems to increase attention on daily building system operations and reduce dependency on periodic retro commissioning Energy conservation measures will be evaluated for life-cycle cost effectiveness and return on investment calculations The ability to monitor, perform diagnostics, and make informed decisions will enhance the overall performance of PNNL facilities, leading to increased energy savings and greater operational performance
Maintaining a highly qualified organization is vital to the long-term success of the Sustainability Program and ultimately the completion of the goals outlined in this SSP We will continue to train our staff about the latest building efficiency technologies and maintain or increase the amount of qualified CEM and CBCP staff
PNNL believes that meeting the 30% energy intensity reduction goal by FY15 will be difficult Business growth
6
Site
Sus
tain
abili
ty P
lan:
Tak
ing
Ste
ps
Tow
ard
the
Fut
ure
| FY
14
Facilities Performance

Success StoryConstructed in 1953, the RPL is a 145,000 square foot fully functional laboratory for research related to national missions in nuclear energy, nuclear non-proliferation, environmental management, homeland security, and fundamental science.
To meet one of the most difficult HPSB requirements (i.e., 20% reduction in energy use compared to the 2003 baseline year), significant building improvements were necessary. These included revamping the heat recovery system, installing high efficiency chillers, adding cooling coils dedicated to the chilled water system, and installing Light Emitting Diode lighting. Together, these improvements reduced the energy consumption in the RPL by an impressive 25% compared to the baseline year.
Additional efforts to upgrade the RPL included the installation of meters (to measure electricity, natural gas, and water usage), occupancy-based lighting controls, and high-efficiency plumbing fixtures. The RPL is the first Office of Science nuclear research laboratory to achieve HPSB status using the Guiding Principles for existing buildings.
in key areas of PNNL’s portfolio has led to energy intensity increases, most of which have been offset by aggressive management of energy usage in other areas We will look for additional ways to reduce energy while continuing our world-class research
EISA EvaluationsPNNL will continue to conduct energy and water evaluations in our eight covered facilities In FY14, our plan is to complete three buildings as outlined in the CEDR This will keep us on track to complete approximately 25% of our facilities every year, allowing us to distribute workload and funding Identified ECMs will be tracked in the CEDR, with funding requests initiated into our planning process
MeteringWith advanced metering installations complete, PNNL will gather data for BOCC use and analyze it with our award-winning DSOM software Any operational improvements or maintenance corrections can be easily identified and corrected in real time Future strategies for data use will be outlined in the PNNL Metering Plan
Cool RoofsBy institutionalizing the values and systems in our Engineering Standards and Specifications, PNNL is committed to continue installing cool roofs
Existing BuildingsIn FY14, PNNL is planning to obtain two additional facility certifications using the HPSB Guiding Principles These certifications will continue to increase the number of HPSB certified facilities
PNNL sees challenges in achieving 100% of all buildings reaching HPSB classification Investments needed to achieve HPSB status may not be cost effective based on facility ages, mechanical equipment designs, or specific and specialized research activities
New ConstructionPNNL intends to begin building several new facilities over the next several years We have committed that all new construction, major renovations, and alterations of buildings greater than 5,000 GSF will comply with the Guiding Principles or equivalent certification methods Planning for future facilities, including line item, general plant project, or leases, will include these requirements
The availability of high efficiency facility equipment and the incorporation of advancements in engineering methods will allow PNNL to work toward net zero buildings PNNL will strive to meet this goal and will use life-cycle cost analysis methods to implement viable technologies and strategies
PNNL’s Radiochemical Processing Laboratory was added to our growing number of HPSB facilities
7
Site
Sus
tain
abili
ty P
lan:
Tak
ing
Ste
ps
Tow
ard
the
Fut
ure
| FY
14
Facilities Performance

Goals3.1 – 10% annual increase in fleet alternative fuel consumption by FY15 relative to a FY05 baseline
3.2 – 2% annual reduction in fleet petroleum consumption by FY20 relative to a FY05 baseline
3.3 – 100% of light duty vehicle purchases must consist of AFVs by FY15
3.4 – Reduce fleet inventory of non- mission critical vehicles by 35% by FY13 relative to a FY05 baseline
FleetPNNL will continue working diligently to meet all fleet goals and balance program requirements by increasing our alternative fuel fleet and integrating additional electric vehicles into service.
FY13 Performance Status
Alternative FuelThrough continued training and proactive management, PNNL has far exceeded the goal of increasing alternative fuel use to the original baseline of 456 GGE PNNL continues to work with local fuel stations to secure a continued supply of E85 fuel
Reduced PetroleumPNNL is trending in the right direction through expanded use of AFVs, including electric vehicles, and expects to achieve the goal by the end of FY20
PNNL EV fleet
Alternative Fuel VehiclesPNNL strives to meet the goal of 75% AFV purchases annually by working with vehicle suppliers to acquire AFV vehicles whenever possible During FY13, 100% of the new fleet acquisitions consisted of AFV vehicles Currently, PNNL has a total of 46 LDVs, of which 80% are AFVs
Alternative Fuel (GGE)
Petroleum Reduction (GGE)
8
Site
Sus
tain
abili
ty P
lan:
Tak
ing
Ste
ps
Tow
ard
the
Fut
ure
| FY
14
Fleet

Success StoryPNNL now has more neighborhood electric vehicles (NEV) in its fleet than ever before. With the acquisition of additional NEVs in FY13, PNNL reduced 10 more traditional gas-powered vehicles from the fleet, reducing petroleum use and emissions.
PNNL staff worked with local government to reduce the speed limit from 55 to 35 mph on a stretch of roadway to the Hanford 300 Area. This change enabled the electric vehicles to travel between the nearby Hanford 300 Area and the PNNL campus. PNNL has staff and facilities in this area, including the newly HPSB certified RPL facility, so enabling NEV access to the area makes work easier—and greener without the use of a gas-powered vehicles.
Every staff member receives standardized training before driving the NEVs, ensuring that the new vehicles are used safely.
Right-Sizing the FleetCompletion of the right-sizing the fleet plan and identifying the critical business needs, PNNL has removed all 19 of its non-mission critical vehicles
Plans, Actions, and Projected PerformanceAlternative FuelPNNL will continue to research the availability of bio-diesel fuel in place of standard diesel PNNL is also researching full-time electric vehicles and their capabilities for space and payload, with the idea of replacing some of the current larger gas and diesel engine vehicles
Reduced PetroleumRight now, PNNL is undergoing a transportation optimization review to assess the logistical routes presently used This optimization team is looking to reduce both the total miles traveled and number of trips between buildings to gain efficiency and reduce petroleum consumption The overall objective is to combine vehicle responsibilities and remove under-utilized vehicles from the fleet
Alternative Fuel VehiclesPNNL will continue working with the GSA or other vehicle suppliers to replace vehicles with AFV types whenever available
Right-Sizing the FleetPNNL will continue to evaluate the utilization of fleet vehicles to identify and reduce non-mission critical vehicles as business needs change
A reduced speed limit between the PNNL campus to the Hanford 300 Area helped facilitate the use of NEVs between those locations
9
Site
Sus
tain
abili
ty P
lan:
Tak
ing
Ste
ps
Tow
ard
the
Fut
ure
| FY
14
Fleet

Goals4.1 – 26% potable water intensity reduction by FY20 from a FY07 baseline
4.2 – 20% water consumption reduction of ILA water by FY20 from a FY10 baseline
WaterPNNL will continue balancing water use with enhanced energy efficiency and sustainable landscaping for overall water reduction.
FY13 Performance StatusWater IntensityPNNL has met the FY20 water reduction goal and, as of FY13, has reduced its intensity by 59 2% Discharge permit regulatory reviews uncovered several opportunities for non-contact cooling water reductions and, utilizing Sustainability Pays funding, further reducing water intensity in FY13
Efficient use of water at PNNL contributes to conservation of local nature resources
Potable Water Intensity (gals/ft2)
ILA WaterPNNL continued to leverage its Landscape Master Plan and implemented opportunities for ILA water savings In FY13, three targeted actions were taken to reduce ILA:
• A recently completed repaving project will result in better ILA effectiveness because sprinklers were relocated to avoid spraying the roadway, with drainage swales capturing any excess for on-site (re)usage
• The grounds maintenance department continued managing several large landscaped areas by daily resetting or even turning off irrigation when possible Throughout FY13, maintenance succeeded in deactivating the water 28 times, which resulted in 20,000 gal of water each time the system remained off This active management of our grounds maintenance team shows how engaged staff can make a difference
• Irrigation meters were installed in several grass areas on our grounds to monitor, analyze, and control our ILA water usage even more effectively
10
Site
Sus
tain
abili
ty P
lan:
Tak
ing
Ste
ps
Tow
ard
the
Fut
ure
| FY
14
Water

Success StoryInnovation Boulevard, which runs down the center of the PNNL campus, was re-built in FY 2013 to improve safety, encourage walking to meetings through enhanced sidewalks and crossings, improve drainage and reduce irrigation water use.
Sustainable design criteria from the new Eastern Washington Low Impact Development Guidance Manual were used in lieu of using traditional storm water collection and conveyance features with point discharges. Flat concrete curbs and crowning of the road corrected drainage and water ponding issues which used to create slippery situations in winter. Sheet flow drainage off the road and “bio-swales” along the road now capture the storm water for percolation into the adjacent turf and root zone of the prominent sycamore trees lining the road. Extensive pavement discovered under the grass was causing shallow, dry root zones and lack of surface infiltration, so it was removed. The project team also collaborated with the grounds crew to modify sprinkler patterns along the pavement edges so that impervious surfaces aren’t watered needlessly.
Bio-swales are incorporated into PNNL’s engineering design standards for storm-water management
Plans, Actions, and Projected Performance
Water IntensityPNNL plans to continue performing facility water audits specifically on the EISA-covered facilities We believe that the trending of water usage through our BOCC will help identify additional savings Projects that are determined to be cost effective will be completed
ILA Water
As PNNL modernizes through new construction or major facility renovation, landscaping remains necessary for fire offsets, dust control, and heat island reduction PNNL will continue using the Landscape Master Plan, installing metering and moisture monitoring, and using our Engineering Standards and Specifications to pursue opportunities for additional ILA reductions Even with integrated ILA water reduction in our Engineering Standards, meeting this goal will be a challenge
ILA Water (Mgals/yr)
11
Site
Sus
tain
abili
ty P
lan:
Tak
ing
Ste
ps
Tow
ard
the
Fut
ure
| FY
14
Water

Goals5.1 – Divert at least 50% of non-hazardous solid waste, excluding C&D debris, by FY15
5.2 – Divert at least 50% of C&D materials and debris by FY15
Pollution PreventionPNNL will continue to increase waste diversion, reduce its chemical inventory, and improve bio-based product purchases.
FY13 Performance Status
Waste DiversionSolid Waste
PNNL has integrated recycling and excessing programs for multiple waste streams, including electronics, batteries, research equipment, furniture, office products, scrap metal, wood, paper, plastic, glass, aluminum, tin, and cardboard In FY12, PNNL expanded recycling to accept all plastics coded 1 through 7 A slight increase in plastic recyclables occurred in FY13, partially due to the prior year’s efforts to increase awareness of the changes PNNL’s excessing process includes verifying that items are free of beryllium or radiological and biological contamination A procedure How Do I? (HDI), PNNL’s standards-based management tool, provides instructions and requirements to all staff prior to releasing any materials or equipment from PNNL
As the strategy to move toward a fully integrated campus continues, several major relocation projects were conducted in FY13 As relocations occur, PNNL recycles as much as possible, including chemicals, furniture, books, journals, and electronic media For example, our Technical Library relocation project donated 14,000 volumes of books Recycling and reuse efforts will continue as additional moves are conducted in FY14
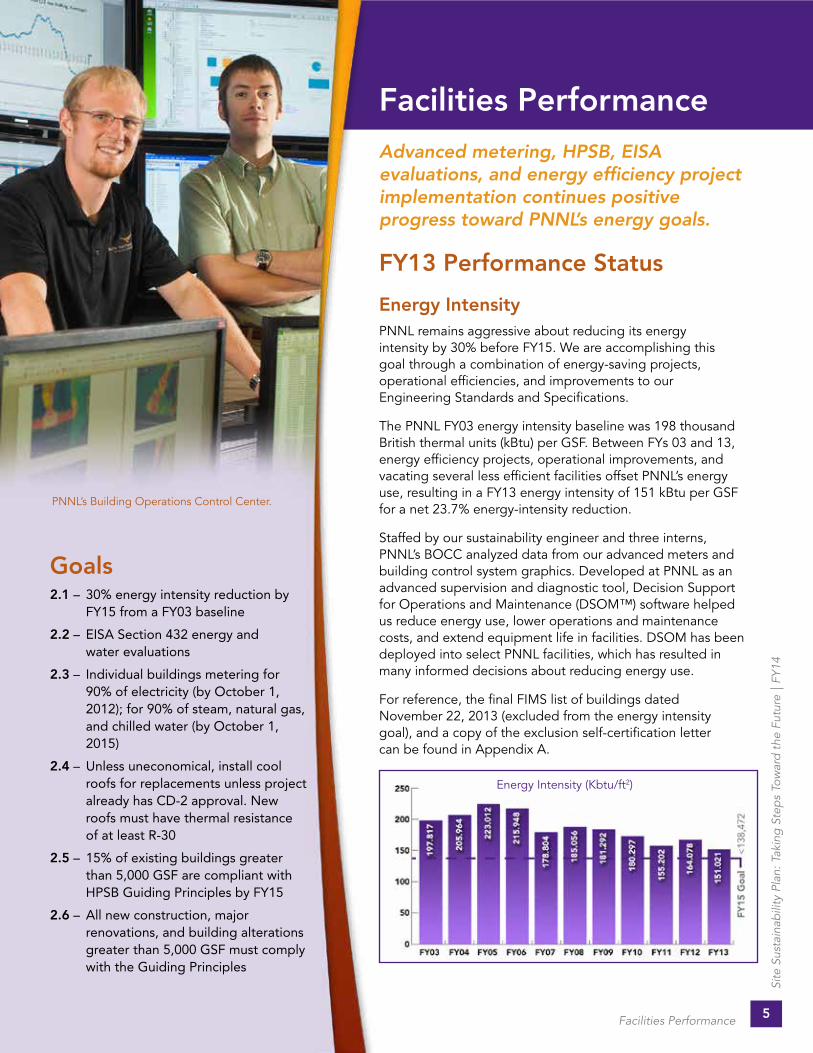
PNNL also continues to host “zero waste” picnic events through mixed recycling and teaming with a local pig farmer In FY13, PNNL diverted approximately 57% of non-hazardous sanitary waste
Construction and Demolition Waste
PNNL has a wide variety of C&D work activities from large construction projects to small scopes of work In FY13, PNNL renovated one of the major campus roadways, which yielded the recycling of approximately 1,870 tons of asphalt Based on available data, PNNL diverted nearly 100% of C&D waste in FY13
Composting
PNNL’s composting program consists of two industrial-sized hot composters and a yard waste collection lugger In FY13, PNNL composted approximately 1 ton of food waste Additionally, the installation of a lugger cover
PNNL achieved “zero waste” events by sending food scraps to a local pig farmer
12
Site
Sus
tain
abili
ty P
lan:
Tak
ing
Ste
ps
Tow
ard
the
Fut
ure
| FY
14
Pollution Prevention
has prevented non-yard waste material from contaminating the off-site yard waste compost, allowing PNNL to divert another waste stream Further, approximately 66 MT of yard waste and tree trimmings was sent off site for composting in FY13
are required to complete continuing education annually to learn about the latest trends in pest control, current chemical and biological control agents, and updated legislative changes All applicators are committed to integrated pest management (IPM) principles, where applicable
The grounds staff recognizes the responsibility to provide a clean, low-pest environment at PNNL and strives to limit control efforts to those absolutely required for optimal results Pest control methods begin with the lowest impact, escalating when required, and only to the level necessary for acceptable control
IPM best practices are summarized below:
• using wasp traps in lieu of spraying
• removing unwanted cardboard and wood pallets in yards and storage areas to prevent nesting
• using sticky and metal traps for mouse control
• using netting and spikes to reduce bird droppings
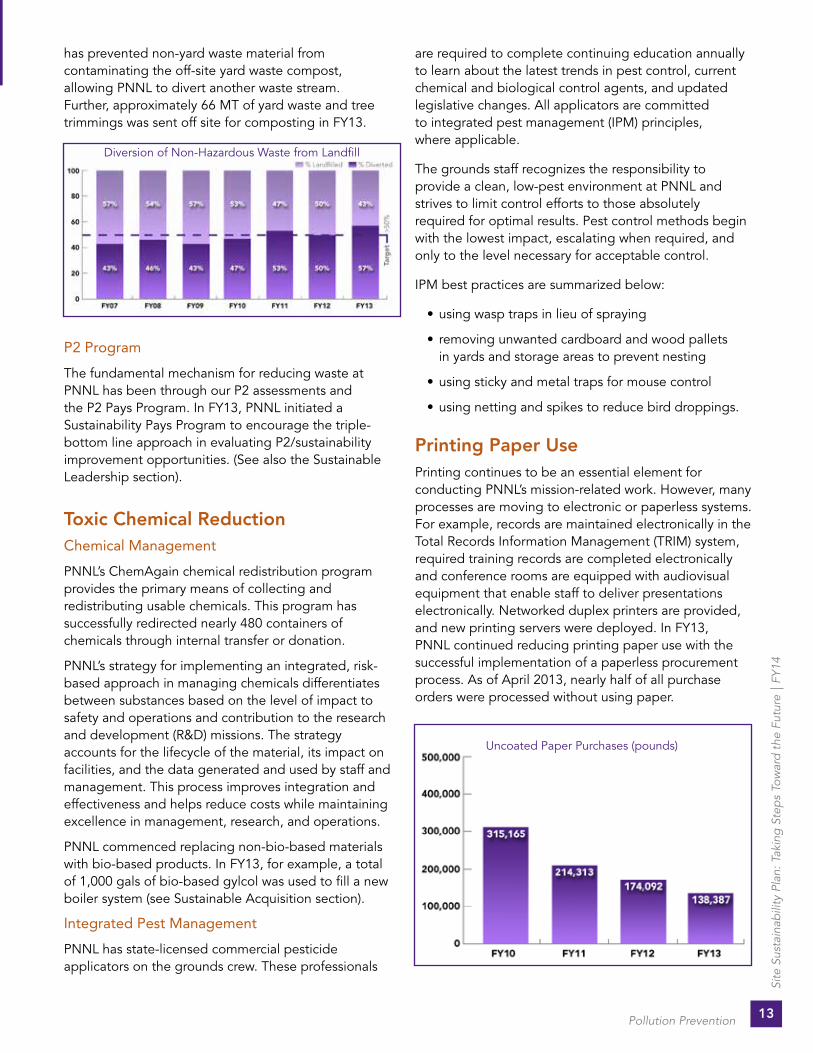
Printing Paper UsePrinting continues to be an essential element for conducting PNNL’s mission-related work However, many processes are moving to electronic or paperless systems For example, records are maintained electronically in the Total Records Information Management (TRIM) system, required training records are completed electronically and conference rooms are equipped with audiovisual equipment that enable staff to deliver presentations electronically Networked duplex printers are provided, and new printing servers were deployed In FY13, PNNL continued reducing printing paper use with the successful implementation of a paperless procurement process As of April 2013, nearly half of all purchase orders were processed without using paper
Uncoated Paper Purchases (pounds)
Diversion of Non-Hazardous Waste from Landfill
P2 Program
The fundamental mechanism for reducing waste at PNNL has been through our P2 assessments and the P2 Pays Program In FY13, PNNL initiated a Sustainability Pays Program to encourage the triple-bottom line approach in evaluating P2/sustainability improvement opportunities (See also the Sustainable Leadership section)
Toxic Chemical ReductionChemical Management
PNNL’s ChemAgain chemical redistribution program provides the primary means of collecting and redistributing usable chemicals This program has successfully redirected nearly 480 containers of chemicals through internal transfer or donation
PNNL’s strategy for implementing an integrated, risk-based approach in managing chemicals differentiates between substances based on the level of impact to safety and operations and contribution to the research and development (R&D) missions The strategy accounts for the lifecycle of the material, its impact on facilities, and the data generated and used by staff and management This process improves integration and effectiveness and helps reduce costs while maintaining excellence in management, research, and operations
PNNL commenced replacing non-bio-based materials with bio-based products In FY13, for example, a total of 1,000 gals of bio-based gylcol was used to fill a new boiler system (see Sustainable Acquisition section)
Integrated Pest Management
PNNL has state-licensed commercial pesticide applicators on the grounds crew These professionals
13
Site
Sus
tain
abili
ty P
lan:
Tak
ing
Ste
ps
Tow
ard
the
Fut
ure
| FY
14
Pollution Prevention
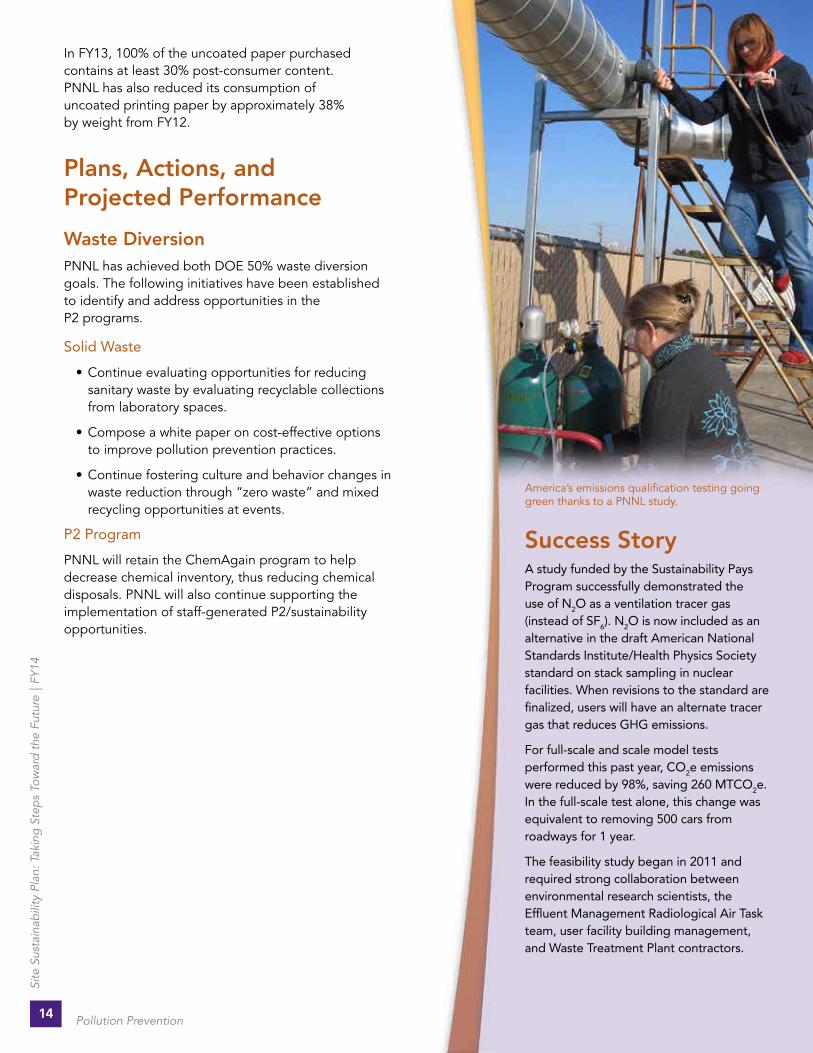
Success StoryA study funded by the Sustainability Pays Program successfully demonstrated the use of N2O as a ventilation tracer gas (instead of SF6). N2O is now included as an alternative in the draft American National Standards Institute/Health Physics Society standard on stack sampling in nuclear facilities. When revisions to the standard are finalized, users will have an alternate tracer gas that reduces GHG emissions.
For full-scale and scale model tests performed this past year, CO2e emissions were reduced by 98%, saving 260 MTCO2e. In the full-scale test alone, this change was equivalent to removing 500 cars from roadways for 1 year.
The feasibility study began in 2011 and required strong collaboration between environmental research scientists, the Effluent Management Radiological Air Task team, user facility building management, and Waste Treatment Plant contractors.
In FY13, 100% of the uncoated paper purchased contains at least 30% post-consumer content PNNL has also reduced its consumption of uncoated printing paper by approximately 38% by weight from FY12
Plans, Actions, and Projected Performance
Waste DiversionPNNL has achieved both DOE 50% waste diversion goals The following initiatives have been established to identify and address opportunities in the P2 programs
Solid Waste
• Continue evaluating opportunities for reducing sanitary waste by evaluating recyclable collections from laboratory spaces
• Compose a white paper on cost-effective options to improve pollution prevention practices
• Continue fostering culture and behavior changes in waste reduction through “zero waste” and mixed recycling opportunities at events
P2 Program
PNNL will retain the ChemAgain program to help decrease chemical inventory, thus reducing chemical disposals PNNL will also continue supporting the implementation of staff-generated P2/sustainability opportunities
America’s emissions qualification testing going green thanks to a PNNL study
14
Site
Sus
tain
abili
ty P
lan:
Tak
ing
Ste
ps
Tow
ard
the
Fut
ure
| FY
14
Pollution Prevention

Sustainable AcquisitionPNNL includes sustainable acquisition provisions in 100% of applicable solicitations and contracts.
FY13 Performance StatusDuring FY13, PNNL implemented several improvements to its acquisition system for sustainability compliance Below are highlights:
• Implemented a policy of no incandescent lighting (research equipment exceptions permitted)
• Implemented a policy to increase the use of rechargeable batteries
• Performed a targeted self-assessment of compliance with sustainable acquisition
In addition, the Contracts Department advertised sustainable ideas to employees via an information booth at several events and remained actively involved with various ongoing internal issues to enhance PNNL staff’s awareness of and commitment to sustainable purchasing
Plans, Actions, and Projected PerformancePNNL will continue increasing staff awareness on available sustainable products, participate again in Earth Day and other events, and educate staff about sustainable acquisitions Benchmarking with other federal agencies on best practices will also proceed Planned activities for FY14 include the following:
• Provide continuing education to contracts specialists and technical oversight representatives about sustainable requirements and their roles/responsibilities to comply
• Provide education to end users via vendor product demonstrations and training
• Conduct a sustainability compliance self-assessment
Goal6.1 – Procurements meet requirements by including necessary provisions and clauses (Sustainable Procurements/Biobased Procurements)
Success StoryIn summer 2013, the aging steam heating system in the Engineering Development Laboratory (EDL) was replaced with high efficiency gas-fired boilers and hydronic heating coils in air handling units. Propylene glycol was selected as the heat transfer fluid to provide coil freeze protection. Traditionally, propylene glycol, which is manufactured from petroleum is used; however, a new, plant-based glycol was selected for this project.
First developed by PNNL researchers, the plant-based glycol is more environment friendly, reducing GHG by 61%. Economically, it also makes sense—the cost is no more than traditional petroleum-based glycol. This fluid is functionally equivalent to standard glycol, requires no special design considerations, and has no adverse effects on system components or performance.
If successful in EDL, it will be used in more PNNL facilities and ultimately included in the Projects & Engineering Standard Design Guidelines.
Bio-based products are incorporated into PNNL’s procurement process
15
Site
Sus
tain
abili
ty P
lan:
Tak
ing
Ste
ps
Tow
ard
the
Fut
ure
| FY
14
Sustainable Acquisition

Electronic Stewardship and Data Centers
Goals7.1 – All data centers are metered to measure a monthly PUE of 100% by FY15
7.2 – Maximum annual weighted average PUE of 1.4 by FY15
7.3 – Electronic stewardship: 100% of eligible PCs, laptops, and monitors with power management actively implemented and in use by FY12
PNNL balances high performance computing and electronic stewardship while maximizing energy efficiency and operational effectiveness.
FY13 Performance Status
Data Center MeteringPNNL performed energy assessments and profiling of its data centers during FY13 using DOE Green IT (DOEGRIT), part of the Data Center Profiler (DC Pro) software tool suite Assessment results help outline projects that will guide us to better data center efficiencies Metering of data centers continues and is expanding with the addition of our third, and final data center in the Environmental Molecular Sciences Laboratory (EMSL)
Power Usage EffectivenessPNNL continued to leverage a previous campus-wide data center consolidation assessment that resulted in a prioritized list of equipment to move and computer rooms from which to migrate PNNL is still aggressively eliminating small computer rooms by moving users onto the campus institutional computer Olympus, where possible, and relocating user servers when necessary In FY13, approximately 61% (as measured by square footage) of the less efficient computer rooms were emptied and re-purposed for other uses
Since FY06, PNNL has aggressively pursued virtualization as the tool to minimize server sprawl, conserve energy, and reduce equipment footprint of the Information Sciences Building 2 (ISB2) data center As of fourth quarter (Q4) FY13, PNNL business virtualization is over 85%, up from last year’s 80% With our virtual desktop early adopters, PNNL is strategically positioned to continue being a leader in data center energy efficiency Additionally, we report several data center-related highlights:
• Installed environmental instrumentation in data centers, allowing higher operating temperature
• Newer, more energy efficient uninterruptible power supplies and transformers
• Moved cooling closer to the IT load, reducing cost and improving efficiency
Cold aisle containment has improved datacenter PUE
16
Site
Sus
tain
abili
ty P
lan:
Tak
ing
Ste
ps
Tow
ard
the
Fut
ure
| FY
14
Electronic Stewardship and Data Centers

• Specified more energy efficient computer clusters by including Total Cost of Ownership as a purchasing factor
• Eliminated the humidification cycle in two of the three data centers while maintaining ASHRAE recommended parameters
• Continued to virtualize applications as needed, especially older systems moving to the more energy efficient data centers
• Closed five small data centers, which allowed us to shut down six computer room air conditioners (CRACs) that varied in size from 5 to 20 tons each This action will save nearly 500 megawatt hrs/year in cooling at those discrete sites On average, one-third of the servers were physically moved to more energy efficient data centers, with the other two thirds converted to virtual machines or completely eliminated, saving even more energy
Achieving an annual PUE-weighted average of 1 4 across all three PNNL data centers will require different solutions at each building to maximize the unique existing configurations Our PUE metering will allow us to determine the success and degree of impact of various energy efficient projects Some energy saving projects have included removal of under-floor cable, replacement of outdated equipment and supplies, and use of rear door heat exchangers (RDHx) to cool the Cascade and Olympus high density high performance computers
All three data centers have been profiled using DC Pro by our Certified Data Center Energy Practitioner Results are as follows:
• CSF: PUE 1 325 annualized (slight increase due to construction)
• EMSL: PUE 2 36 annualized
• ISB2: PUE 1 55 annualized
Electronic StewardshipWith the deployment of Windows 7, PNNL minimized power consumption with user pre-configurations on new Windows-based systems and displays PNNL continued to promote upgrading desktop operating systems, resulting in a 9% improvement in Windows 7 adoption An aggressive campaign is underway to upgrade or retire the remaining Windows XP systems
A pilot program in FY12, teleworking was formally rolled out in FY13 and specifically targets Scope 3 commuting emissions A side benefit of teleworking is a migration
to energy efficient laptop devices (for ease of mobility and taking home) in the office environment, which will further decrease PNNL’s overall energy use The acquisition of electronic office products is through our Managed Hardware Program (MHP), where 100% of the PC offerings are Electronic Product Environmental Assessment Tool (EPEAT) and ENERGY STAR registered Any deviation from the pre-approved MHP purchase list is discouraged and requires management approval
Disposition of 100% of PNNL’s electronic assets is through the Excess Materials and Redeployment Service group, where equipment can follow one of four paths: Computers for Learning, redeploy within PNNL, Tri-City Asset Recovery, or DOE-approved vendor recycling
Plans, Actions, and Projected Performance
Data Center MeteringPNNL will continue performing energy assessments and profiling of its data centers using DOEGRIT Assessment results will be analyzed using the Decision Tool and implemented if cost effective Installation of data center metering will also continue, and PNNL intends to meet the FY15 goal of having all data centers metered The EMSL data center will join the Computational Sciences Facility (CSF) and ISB2 data centers with sufficient metering in place to report PUE information
Power Usage EffectivenessAs PNNL continues to move toward the 1 4 PUE goal, various methods will be considered and employed to improve energy efficiency in the data centers, to include minimizing the number of systems that exist in general laboratory space
Some of the major focuses to achieve the PUE goal are listed below:
• Migrate data center lighting onto motion-sensing circuits to minimize energy wasted by leaving lights on throughout nights and weekends
• Revamp 240 Volt power distribution to sensored higher voltage units, where appropriate
• Continue virtualizing systems to reduce both the physical footprint and energy use
• Use ceiling plenums as hot air returns to avoid hot and cold aisle mixing
• Reduce operating CRACs to a minimum and place
17
Site
Sus
tain
abili
ty P
lan:
Tak
ing
Ste
ps
Tow
ard
the
Fut
ure
| FY
14
Electronic Stewardship and Data Centers

EMSL’s “Cascade” supercomputer
Success StoryPNNL’s new supercomputer Cascade can do in 1 hour what would take a typical laptop over 20 years. With a DOE-required PUE of 1.4, Cascade needs just 0.59 kW per teraflop of computing capability, far below its Chinook predecessor with over 8 kW.
Facility modifications further improved Cascade’s energy efficiency. Subfloor cooling gave way to piping that distributes chilled water to all of the computer racks. Saving the energy and the expense of air handling units like Chinook, Cascade is water-cooled via RDHxs. This feature enabled PNNL to remove four CRACs, saving even more energy as well as space. Additionally, a new transformer yard was located near the data center, reducing transmission loss and further aiding in fulfillment of PUE requirements.
spare cooling capacity into an emergency start pool controlled by an auto-start circuit to save cost of running idle AC units
• Replace CRAC air circulation motors with high efficient motors to reduce energy consumption
• Install aerodynamic fans and more efficient motors on outdoor chillers
Electronic StewardshipPNNL will continue to accomplish electronic stewardship goals through a variety of mechanisms, including the use of power management capabilities (part of our current management suite), accelerating the pace of upgrading remaining workstations to Windows 7, and upgrading to the latest version of the Mac operating system We continuously look for more energy efficient end user devices as they appear on market and work hard to educate users about how they can be more efficient consumers of computational resources PNNL is proactive with our existing MHP for the acquisition and proper disposal and disposition of excess computers and electronic equipment
PNNL will continue to establish and implement policy and guidance to encourage the use of appropriate power management, duplex printing, and other energy efficient or environmentally preferred options and features on capable electronic products Low energy intensive laptop computers will become the norm as PNNL works towards its goal of 40% of employees teleworking at least one day per week by FY20
Potential energy conservation initiatives in the desktop/end user computing space that are under consideration include; increasing utilization of virtual desktops and more energy efficient end user devices, and increasing the use of mobile and collaboration technologies The use of virtual desktops also reduces the need for multiple user systems Other potential conservation initiatives include implementing a power management strategy for desktops and conducting an evaluation and pilot for the use of public cloud for targeted services Currently, self-service provisioning is available and functional campus-wide via PNNL’s private cloud
18
Site
Sus
tain
abili
ty P
lan:
Tak
ing
Ste
ps
Tow
ard
the
Fut
ure
| FY
14
Electronic Stewardship and Data Centers

Renewable EnergyLeveraging large-scale, interagency REC procurements will continue to enable purchasing at the lowest cost possible.
FY13 Performance StatusIn FY13, PNNL procured enough RECs to offset 70 7% of its electrical use and is already meeting the FY20 goal of 20% annual electrical consumption As noted in this section’s Success Story, we standardized the process for evaluating and procuring RECs through a third-party supplier, leveraging multi-agency REC procurements This competitive bidding process enables us to achieve the best price as recognized during a recent DOE IG audit
Aside from RECs, PNNL has several on-site solar arrays The solar hot water heater installed at EMSL produces approximately 160,000 Btu/hr of hot water and is dedicated to the lunchroom and associated restrooms, fulfilling the majority of that area’s hot water needs Several solar PV arrays also power various air and water monitoring stations throughout the campus In addition, PNNL operates a 125 kW PV array, which includes charging stations for electric fleet vehicles and is used for several R&D projects
Plans, Actions, and Projected PerformanceAs previously noted, PNNL annually assesses the necessary number of RECs based on growth, LEED commitments, and desired GHG Scope 1 and 2 offsets The strategy of competitively bidding for REC procurement will continue to meet (and likely exceed) the renewable energy goal of 20% of annual electrical consumption
PNNL is committed to finding ways to increase the amount of renewable power generated on site We will periodically review the addition of new projects where economically feasible All new building construction will evaluate the cost effectiveness of the use of solar hot water heaters (EISA section 523), in accordance with our Engineering Standards and Specifications
Goal8.1 – 20% of annual electricity consumption from renewable sources by FY20
Success StoryIn FY13, PNNL standardized the process for evaluating and procuring RECs annually to the desired number of certificates. Adjustments are made based on growth, LEED commitments, and desired GHG Scope 1 and 2 offsets. RECs are solicited every two years to minimize the internal cost and manpower needed for the procurement. Utilizing the Defense Logistics Agency (DLA) multi-agency REC solicitations, PNNL has successfully leveraged its procurement through an established competitive bidding process in order to attract the attention of enough REC brokers to achieve the best overall price. This best practice was recognized during a recent DOE Inspector General (IG) audit.
Competitive bidding process saves money on RECs
19
Site
Sus
tain
abili
ty P
lan:
Tak
ing
Ste
ps
Tow
ard
the
Fut
ure
| FY
14
Renewable Energy

Goal9.1 – Climate Change Adaptation — Address DOE Climate Adaptation Plan goals
Climate Change Adaptation
During FY14, we will continue seeking opportunities to participate in existing partnerships with agencies in the Pacific Northwest region that focus on adaptation strategies.
PNNL continues to examine the impacts of climate variability and change on our site’s operations and is integrating approaches to managing these impacts into strategic planning efforts for our campus
Goal 1: Improve Understanding of Climate Change Effects and Impacts
Objective 1.1: Work with other agencies to improve our understanding of climate change
PNNL has a number of collaborative research efforts underway that seek to improve our understanding of climate change effects and impacts Our Climate and Earth Systems Science research tackles key questions related to atmospheric aerosols, clouds, and precipitation; human systems such as agriculture and energy; the cycling of water, carbon, and other important constituents; and the impacts of and potential responses to climate change To help better understand these systems and their interactions, PNNL draws from core research capabilities in:
• climate, aerosol, and cloud physics
• regional and global scale modeling
• integrated assessment of energy and the environment
• complex regional meteorology and chemistry
• computational science and mathematics
Much of this work involves collaboration with other federal entities, including DOE, DHS, EPA, National Aeronautics and Space Administration (NASA), universities, and industry A few examples of the programs and facilities we bring to climate research include the following:
• Joint Global Change Research Institute (JGCRI) – With the University of Maryland, PNNL has domestic and international collaborators to deepen our understanding of the interactions between climate, energy production and use, economic activity, and the environment
Researchers at PNNL taking steps to advance understanding of global climate change
20
Site
Sus
tain
abili
ty P
lan:
Tak
ing
Ste
ps
Tow
ard
the
Fut
ure
| FY
14
Climate Change Adaptation
• The Platform for Regional Integrated Modeling and Analysis (PRIMA) initiative – A Laboratory Directed Research and Development (LDRD) initiative, PRIMA evaluates interactions among climate, energy, land, and water systems at a regional scale in an integrated manner
• Atmospheric Radiation Measurement (ARM) Climate Research Facility – PNNL plays a leadership role in the multi-laboratory ARM program A scientific user facility aimed at improving climate models, ARM provides in situ and remote sensing climate measurements from strategically located sites around the world
Objective 1.2: Work with other Federal agencies and local jurisdictions (as appropriate) to develop regional partnerships for climate change information sharing and collaboration
and
Objective 4.2: Identify or establish and partici- pate in regional climate change adaptation partnerships, as appropriate, for all DOE facilities
In FY13, PNNL staff reached out to the DOE-Hanford Site Sustainability Program lead to discuss opportunities for information sharing and coordination on climate change adaptation plans PNNL staff met with the Hanford Site Sustainability Working Group and presented our climate change vulnerability and risk assessment, along with the emerging adaptation plans and actions PNNL will continue to seek opportunities to collaborate with Hanford Site subcontractors on climate adaptation measures In FY14, PNNL also plans to perform outreach to local government authorities (i e , City of Richland Public Utilities) to understand how local agencies view the potential impacts of climate change – particularly about local hydro and nuclear power supply – and to collaborate on climate change adaptation planning
Goal 2: Improve Understanding of Climate Change Vulnerabilities and Risk
Objective 2.2: Conduct detailed risk or vulnerabi- lity assessments, as appropriate, for specific DOE programs or facilities
The DOE High Level Analysis of Vulnerability to Climate Change and the Washington State Integrated Climate Response Strategy (both April 2012) were used to establish potential climate change vulnerabilities at PNNL’s major sites east and west of the Cascade Mountains There have been no documented changes to these assessments in the past year
The greatest vulnerabilities and risks to PNNL’s operations in the Pacific Northwest region are described below
• Facility energy shortages – Projected declines in springtime snowpack will lead to reduced stream flows during the summer months and potentially reduced hydro-electric power generation Considering that over 75% of Richland’s fuel mix currently comes from regional hydropower sources, changes in water supply could affect the seasonal availability of and reliability of power to PNNL
• Reduced water supply – Projected reductions in seasonal water supply may lead to policy changes regarding Columbia River water use As the Columbia River Treaty between the United States and Canada is renegotiated in the year ahead, anticipated climate impacts will likely inform this process (e g , Canada may not offer as much flood protection, which has implications for domestic hydropower production) PNNL currently withdraws the full amount of its water permit – 330 mil gals of water each year, half of the total annual water usage – for use in our cooling ponds and facility landscaping and to irrigate Battelle-owned land adjacent to PNNL facilities Changes to PNNL’s water permit could necessitate increased withdraws from municipal sewer/water and groundwater sources and would impair our ability to perform aquaculture research in support of our DOE mission
• Physical damage from wildfires – Higher summer temperatures and earlier spring snowmelt are projected to increase the risk of later dry season wildfires
• Physical damage from sea level rise and storm surge – Increases in sea level and/or in the frequency or intensity of coastal storms could pose a physical threat to PNNL coastal research facilities in Sequim, Washington
• Loss of fish and natural systems – Higher summer stream temperatures and reduced flow are projected to increase lethal stream conditions for salmon and other coldwater species Sea level rise is also projected to eliminate valuable coastal habitats, and increased acidity in marine waters from CO2 emissions and upland runoff threatens the aquaculture and shellfish industry
• Increase in extreme precipitation events – In addition to long-term changes in the overall and seasonal distribution of rainfall, it is expected that a higher fraction of precipitation will fall in extreme events (i e , when it does rain, it will rain harder)
21
Site
Sus
tain
abili
ty P
lan:
Tak
ing
Ste
ps
Tow
ard
the
Fut
ure
| FY
14
Climate Change Adaptation
These occurrences can impact various aspects of campus operations, some of which have already occurred For example, a flood from a heavy rainfall event caused a significant computer outage at PNNL this past year
Goal 4: Improve the Climate Resiliency of all DOE Sites
Objective 4.1: Update all appropriate DOE site plans to address climate change resiliency
During FY13, PNNL Sustainability Program members met with several individuals responsible for near- and long-term planning to discuss the climate change vulnerabilities and risks posed to our operations, as outlined above The team identified and reviewed three plans that either currently addressed or presented an opportunity to address climate change adaption: the Building Emergency Plan, Business Continuity Plan, and Campus Master Plan
The current Building Emergency Plan was determined to address adequately the vulnerabilities in the areas of physical damage from wildfires, sea level rise, and
flooding/storm surge Currently in progress, the Business Continuity Plan is examining a response to the resulting impacts of some of these vulnerabilities (e g , loss of power), with processes for keeping buildings operating and people safe immediately after an event While these short-term solutions would help PNNL in the event of a rolling blackout due to power supply shortages, it was determined that the Business Continuity Plan is less relevant to long-term adaptation planning
The Campus Master Plan was determined to present the most important opportunity to address climate adaptation planning The current 2012 Plan does not specifically address climate change adaptation but does include commitments to climate change mitigation through sustainable campus design The Plan is scheduled to be revised during FY14, and the campus planning team is now committed to working with the Sustainability Program to understand and address the greatest vulnerabilities to PNNL in the Plan, particularly facility energy shortages and reduced water supply
22
Site
Sus
tain
abili
ty P
lan:
Tak
ing
Ste
ps
Tow
ard
the
Fut
ure
| FY
14
Climate Change Adaptation
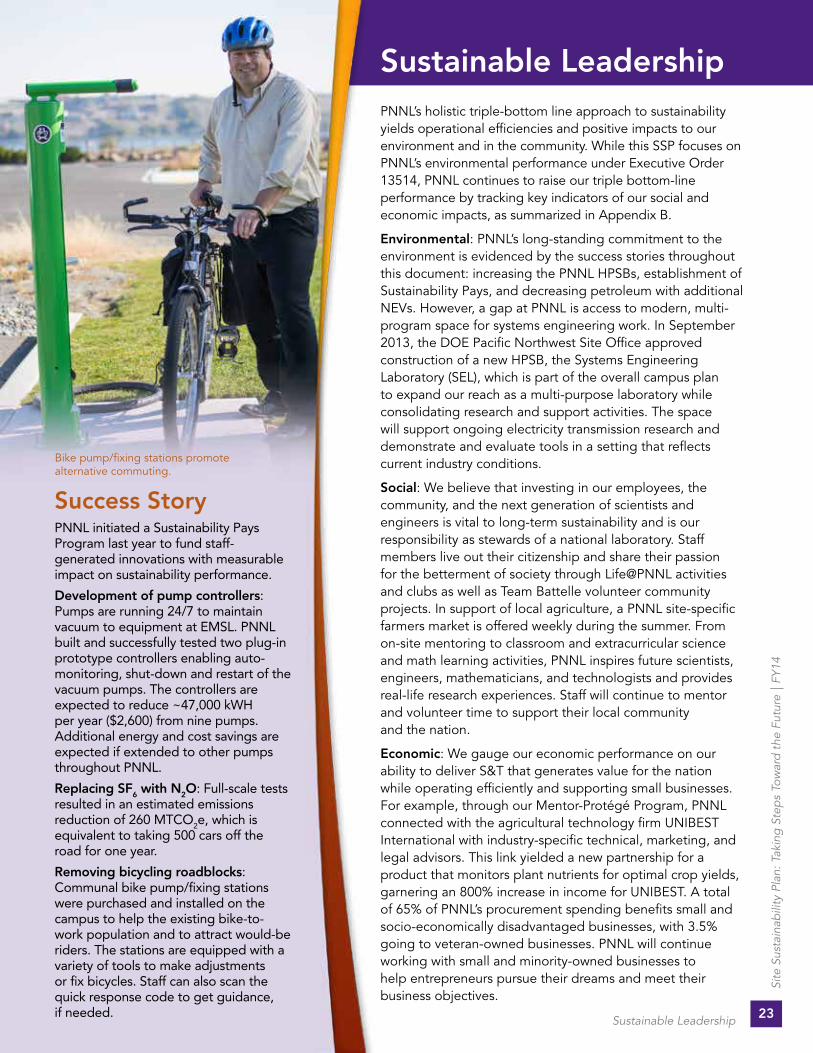
Bike pump/fixing stations promote alternative commuting
23
Site
Sus
tain
abili
ty P
lan:
Tak
ing
Ste
ps
Tow
ard
the
Fut
ure
| FY
14
Sustainable Leadership
Sustainable LeadershipPNNL’s holistic triple-bottom line approach to sustainability yields operational efficiencies and positive impacts to our environment and in the community While this SSP focuses on PNNL’s environmental performance under Executive Order 13514, PNNL continues to raise our triple bottom-line performance by tracking key indicators of our social and economic impacts, as summarized in Appendix B
Environmental: PNNL’s long-standing commitment to the environment is evidenced by the success stories throughout this document: increasing the PNNL HPSBs, establishment of Sustainability Pays, and decreasing petroleum with additional NEVs However, a gap at PNNL is access to modern, multi-program space for systems engineering work In September 2013, the DOE Pacific Northwest Site Office approved construction of a new HPSB, the Systems Engineering Laboratory (SEL), which is part of the overall campus plan to expand our reach as a multi-purpose laboratory while consolidating research and support activities The space will support ongoing electricity transmission research and demonstrate and evaluate tools in a setting that reflects current industry conditions
Social: We believe that investing in our employees, the community, and the next generation of scientists and engineers is vital to long-term sustainability and is our responsibility as stewards of a national laboratory Staff members live out their citizenship and share their passion for the betterment of society through Life@PNNL activities and clubs as well as Team Battelle volunteer community projects In support of local agriculture, a PNNL site-specific farmers market is offered weekly during the summer From on-site mentoring to classroom and extracurricular science and math learning activities, PNNL inspires future scientists, engineers, mathematicians, and technologists and provides real-life research experiences Staff will continue to mentor and volunteer time to support their local community and the nation
Economic: We gauge our economic performance on our ability to deliver S&T that generates value for the nation while operating efficiently and supporting small businesses For example, through our Mentor-Protégé Program, PNNL connected with the agricultural technology firm UNIBEST International with industry-specific technical, marketing, and legal advisors This link yielded a new partnership for a product that monitors plant nutrients for optimal crop yields, garnering an 800% increase in income for UNIBEST A total of 65% of PNNL’s procurement spending benefits small and socio-economically disadvantaged businesses, with 3 5% going to veteran-owned businesses PNNL will continue working with small and minority-owned businesses to help entrepreneurs pursue their dreams and meet their business objectives
Success StoryPNNL initiated a Sustainability Pays Program last year to fund staff-generated innovations with measurable impact on sustainability performance.
Development of pump controllers: Pumps are running 24/7 to maintain vacuum to equipment at EMSL. PNNL built and successfully tested two plug-in prototype controllers enabling auto-monitoring, shut-down and restart of the vacuum pumps. The controllers are expected to reduce ~47,000 kWH per year ($2,600) from nine pumps. Additional energy and cost savings are expected if extended to other pumps throughout PNNL.
Replacing SF6 with N2O: Full-scale tests resulted in an estimated emissions reduction of 260 MTCO2e, which is equivalent to taking 500 cars off the road for one year.
Removing bicycling roadblocks: Communal bike pump/fixing stations were purchased and installed on the campus to help the existing bike-to-work population and to attract would-be riders. The stations are equipped with a variety of tools to make adjustments or fix bicycles. Staff can also scan the quick response code to get guidance, if needed.

High Energy Mission Specific Facilities High performance computing is integral to the mission, and PNNL has two FIMs-excluded facilities that meet the definition of high energy mission specific facilities (HEMSF)
EMSL provides integrated experimental and computational resources for discovery and technological innovation in the environmental molecular sciences to support the needs of DOE and the nation It boasts an unparalleled state-of-the-art collection of computational and experimental capabilities focused on three science themes – biological interactions and dynamics; subsurface science, geochemistry, and biogeochemistry; and the science of interfacial phenomena – to address critical challenges in DOE’s environmental and energy mission areas Expert collaborators solve complex problems through multiple, high-performance and resolution sciences via data centers that use advanced instrumentation (e g , 163 teraflops and an 18,000+ core super-cluster with a 4 5 petabyte data archive Chinook computer) In FY13, PNNL installed the new 2 35 petaflop Cascade supercomputer Testing has shown that it is 14 times more energy efficient per teraflop than its predecessor Chinook and avoids using a traditional air handling unit
The CSF is focused on the design and efficient implementation of computational capabilities for the analysis of data from high-throughput experimental technologies, the abstraction of models from this data, and the predictive simulation of these models High-performance computing merges science and technology by:
• employing hardware that maximizes processor speed, memory and interconnect bandwidth, efficient use of secondary storage, and reliability;
• developing algorithms that are scalable, resource-efficient, and load-balanced and that manage computational complexity and exploit space-time locality; and
• creating programming models, numerical libraries, communication libraries, compilers, and debuggers that support data decomposition, low communication overhead, and portability
EMSL boasts an unparalleled state-of-the-art collection of computational and experimental capabilities to address critical challenges in DOE’s environmental and energy mission areas.
High Energy Mission Specific Facilities24
Site
Sus
tain
abili
ty P
lan:
Tak
ing
Ste
ps
Tow
ard
the
Fut
ure
| FY
14

Figure here . . .
HEMSF Electricity Projections for PNNL
25
Site
Sus
tain
abili
ty P
lan:
Tak
ing
Ste
ps
Tow
ard
the
Fut
ure
| FY
14
High Energy Mission Specific Facilities

Budget and FundingThe successful implementation of long-term sustainability goals requires a sound budgeting strategy and adequate funding PNNL uses several methods, as outlined below, to secure the appropriate funding for energy and water efficiencies
• The most efficient and preferred method is budgeting sustainable components into projects through our Engineering Standards and Specifications We recognize that key project energy and water efficiency components (e g , advanced building electrical meters) are mandatory, and we plan accordingly within project funding requests
• Projects that result from energy and water evaluations are identified in ECMs They are submitted in our annual budgeting process and prioritized along with all other requests using a weighted analysis to incorporate life-cycle cost, deferred maintenance, return on investment, and direct ties to the PNNL mission
• Direct utility savings identified from implemented energy or water projects are used to fund additional ECMs as encouraged by the Energy Policy Act (EPAct) of 2005, Section 102(e)
• Where available, Utility Incentive Programs will be leveraged to the maximum extent practicable to enhance energy and water reductions as encouraged by EPAct 1992, Section 152 and EISA 2007 Section 516
• If internal funding is not feasible, PNNL is willing to leverage the use of alternate financing through ESPCs or Utility Energy Services Contracts
PNNL recognizes that energy and water savings program success requires appropriate funding Using our Engineering Standards along with our annual prioritized budgeting process will contribute to the completion of all viable energy and water measures
Using our Engineering Standards and Specifications along with our annual prioritized budgeting process will contribute to PNNL’s completion of all viable energy and water measures.
Summary of Overhead Funded Projects ($K)
CategoryFY13 Actual
FY14 Planned
FY15 Planned
Energy Efficiency 725 650 650
EISA 50 50 50
HPSB 75 100 100
Water Reduction 100 50 50
Meters 45 25 25
IT 350 125 125
All Other 650 600 600
Total 1,995 1,600 1,600
26
Site
Sus
tain
abili
ty P
lan:
Tak
ing
Ste
ps
Tow
ard
the
Fut
ure
| FY
14
Budget and Funding
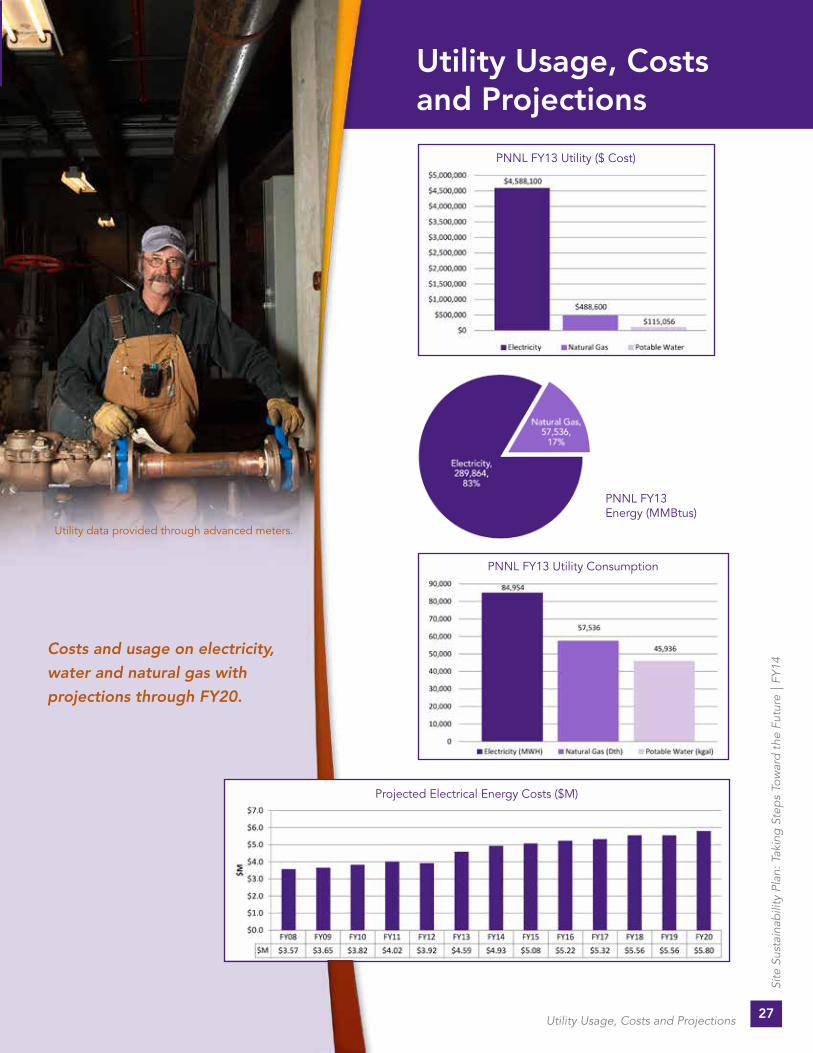
Utility Usage, Costs and Projections
Utility data provided through advanced meters
Costs and usage on electricity, water and natural gas with projections through FY20.
PNNL FY13 Utility ($ Cost)
PNNL FY13 Energy (MMBtus)
PNNL FY13 Utility Consumption
Projected Electrical Energy Costs ($M)
27
Site
Sus
tain
abili
ty P
lan:
Tak
ing
Ste
ps
Tow
ard
the
Fut
ure
| FY
14
Utility Usage, Costs and Projections

Appendix A — Self Certification
28
Site
Sus
tain
abili
ty P
lan:
Tak
ing
Ste
ps
Tow
ard
the
Fut
ure
| FY
14
Appendix A — Self Certification

(FIM
S 0
63)
11/2
2/20
13 1P
age
1 of
U.S
. Dep
artm
ent o
f Ene
rgy
Faci
litie
s In
form
atio
n M
anag
emen
t Sys
tem
Ene
rgy
Con
sum
ing
Exc
lude
d B
uild
ings
and
Tra
ilers
Lis
t
Site
Pro
gram
Offi
ceS
C
Pac
ific
Nor
thw
est N
atio
nal L
ab10
014
Pro
perty
IDJu
stifi
catio
n C
omm
ents
:R
eal P
rope
rtyU
niqu
e ID
Pro
perty
Nam
eE
xclu
sion
Par
tP
rope
rty T
ype
Gro
ss S
QFT
Exc
lude
d S
QFT
excl
uded
sta
rted
in F
Y12
bec
ause
the
data
cen
ters
and
sup
erco
mpu
ters
dom
inat
e th
e en
ergy
use
age
in th
e bu
ildin
g.9/
18/1
3 bu
ildin
g is
sep
arat
ely
met
ered
and
was
rece
ntly
con
stru
cted
as
a LE
ED
Gol
d Fa
cilit
y
74,0
00C
SF
G -
Met
ered
inte
nsiv
e lo
ads
2071
61C
ompu
tatio
nal S
cien
ces
Faci
lity
Bui
ldin
g74
,000
Exc
ludi
ng th
e da
ta c
ente
r loc
ated
in th
is b
uild
ing.
9/18
/13
build
ing
is s
epar
atel
y m
eter
ed a
nd d
ata
cent
er is
the
pred
omin
ant l
oad
in th
e bu
ildin
g an
d al
l LC
C E
CM
s ha
ve b
een
impl
emen
ted.
3,85
4IS
B2
G -
Met
ered
inte
nsiv
e lo
ads
1398
11In
form
atio
n S
cien
ces
Bui
ldin
g - 2
Bui
ldin
g60
,080
Exc
lude
d st
artin
g in
FY
07 b
ecau
se th
e su
perc
ompu
ter d
omin
ates
usa
ge in
the
build
ing.
GS
F in
crea
sed
from
224
,463
due
to 5
/12
with
Qw
ing.
9/18
/13
build
ing
is s
epar
atel
y m
eter
ed a
nd L
CC
EC
Ms
have
eith
er b
een
impl
emen
ted
or a
re in
pro
gres
s fo
r im
plem
enta
tion.
234,
566
3020
G -
Met
ered
inte
nsiv
e lo
ads
1312
74W
illia
m R
. Wile
y - E
MS
LB
uild
ing
234,
566
This
repo
rt qu
alifi
es D
OE
Ow
ned,
DO
E L
ease
d, a
nd C
ontra
ctor
Lea
sed
build
ings
and
trai
lers
whe
re th
e E
nerg
y C
onsu
min
g M
eter
ed P
roce
ss (E
xclu
ded)
Fac
ilitie
s gs
ft is
gre
ater
than
zer
o.
29
Site
Sus
tain
abili
ty P
lan:
Tak
ing
Ste
ps
Tow
ard
the
Fut
ure
| FY
14
Appendix A — Self Certification

Since 2009, PNNL has used the Global Reporting Initiative (GRI) Sustainability Reporting Guidelines as a basis for disclosing our governance approach and the environmental, social, and economic performance and impacts of our operations The GRI provides reporting principles, standard disclosures, and criteria to ensure consistency in reporting, and is used by thousands of organizations worldwide
PNNL defines the content of our GRI report considering the interests of our stakeholders, the sustainability context within which we operate, how material the sustainability aspect is, and whether it provides a complete view of our significant impacts Our material issues are conveyed through the honeycomb diagram and scorecard below These are the issues that most influence our stakeholders (our employees, customers, and community) and that represent our significant sustainability impacts To ensure a comprehensive view of our performance the boundaries of our annual GRI report extend beyond our DOE facilities to include all facilities that PNNL operates as part of the integrated campus
Now in our fifth year of sustainability reporting, PNNL is transitioning to an online-only GRI report to save resources and streamline results PNNL’s FY 2013 Annual Sustainability Report will be completed in early 2014 and available at http://sustainable pnnl gov The content on the next few pages provide a glimpse of our social and economic performance
4
SUSTAINABILITY PERFORMANCE SCORECARD
1. Reported per 200,000 employee hours worked.
2. Economic contribution is an estimate of the value to the economy of goods and services embodying licensed PNNL technologies. The measure is consistently calculated across all DOE labs and is reported to DOE headquarters on an annual basis, but not submitted against a related target. The number fl uctuates from year to year, and a fi ve-year simple moving average was used to smooth the data for this report. For this report, a target was developed for the measure. While a continual upward trend in results is the goal, performance is most directly controlled by licensees of Lab technology and their efforts to commercialize it.
3. Community investments include those made by PNNL and Battelle’s Pacifi c Northwest Division because of Battelle’s management role of the Laboratory.
EN
VIR
ON
ME
NT
SOC
IAL
EC
ON
OM
IC
Reducing building energy use and greenhouse GHG emissions
Traveling smarter
Minimizing water use
Reducing material purchases and waste
Keeping employees healthy and safe
Investing in our employees’ professional development
Creating an inclusive work environment
Fostering the next generation of scientists and engineers
Transfering technology that makes a difference
Maintaining financial viability though research and operational excellence
Supporting small businesses
Giving back to our communities
did not meet target
risk of not meeting target
met or on track to meet target
21
External Assurance Letter
Sustainable Business Consulting evaluated Paci c Northwest National Laboratory’s (PNNL) sustainability report to establish that the information in the report was an authentic representation of the company’s social, environmental, and economic performance in relation to the Global Reporting Initiative (GRI) reporting framework as speci ed in the GRI G3.1 Guidelines. Our responsibility was to carry out an assurance engagement, verify data and provide speci c suggestions for improvement.
We found that PNNL meets the guidelines and reported the information in the spirit of GRI disclosure. The 2012 Sustainability Report provides a balanced and reasonable representation of information concerning boundary setting, quality, report content, and material indicators. PNNL reported on all the core performance indicators, pro le disclosures and management approaches. While these are not all incorporated in the print version, we have reviewed all the data and content that will be posted on the organization’s Sustainability at PNNL Web pages for complete disclosure. We are not aware of the exclusion of any material issues or misstatements of information and are con dent in PNNL’s disclosure.
After we reviewed the initial draft of the report and highlighted concerns or made suggestions for improvement, PNNL responded to each concern with a thorough explanation and addressed each one. These changes were included for the nal version of the report.
Assurance approach:
Our activities included a review of the report content, reporting metrics and a selection of source data. We conducted several meetings with PNNL employees to discuss the accuracy and authenticity of report content, data points, methodologies and policies around the organization’s social, environmental, and economic data and activities.
Our assurance team was made up of sustainability experts, one of which is certi ed in GRI reporting. As part of this process, we:
• reviewed all the core performance indicators, pro le disclosures, management approaches and assessed the information based on the GRI Guidelines
• took a random sample of data points and interviewed employees who provided that data to verify accuracy and understand the procedures for data collection, tracking and analysis
• analyzed stakeholder engagement activities and materiality determination process
• provided suggestions after initial readings and two reviews
• assessed the nal version of the report content to ensure it met the principles for ensuring report content and quality, as de ned by the GRI
Recommendations for improvement
PNNL is doing more for sustainability than they have time to describe in their reporting procedures. Many of the efforts are simply from the employees’ regular day to day and PNNL has the opportunity to put policy in place to support those efforts and have an even stronger sustainability performance and reporting. Community impact could be tracked with more metrics than just how many dollars are spent in the community. Social and environmental impacts come from each philanthropic effort at PNNL and the recipients could be asked to deliver the results of these impacts after project completion. This will assist future decisions when assessing the PNNL mission and its relation to incoming grant proposals. Risks associated with PNNL’s sustainability efforts could be discussed as part of the overall bene t of sustainability and why PNNL chose the areas for its honeycomb.
Opinion: This was PNNL’s fourth GRI-based sustainability report. The organization has once again demonstrated rigorous procedures for data gathering and reporting, and has improved its reporting efforts by committing to a stronger stakeholder engagement process. We fully support the company’s self-assessment that its 2012 report meets the GRI application level of A+.
Kevin Wilhelm, CEO Seattle, Washington.Sustainable Business Consulting April 5, 2013
SOCIA
LECONOMIC
• Total recordable case rate ≤ .651
• Days away, restricted, or transferred rate ≤ .251
• Average participant satisfaction rating from professional development programs ≥ 4.5/5
• No goal established
• Average participant rating of work-based learning programs ≥ 4.0/5
• Economic contribution to global economy from licensed technologies (Target: Minimum=$50M, Stretch=$100M)
• Sales (Target: >$857M)
• Business volume/operating budget (Target: >$991M)
• Award at least 52% procurement dollars to small businesses
• Philanthropic investments (No target)2
Keeping employees healthy and safe
Investing in our employees’ professional development
Creating an inclusive work environment
Fostering the next generation of scientists and engineers
Transfering technology that makes a difference
Maintaining financial viability though research and operational excellence
Supporting small businesses
Giving back to our communities
2012 2013
0.65 0.60
0.20 0.24
4.6 4.6
4.8 4.7
$88.5M $107.7M
$1,049.1M $1,064.0M
$1,1031.7M $936.0M
50.1% 65.8%
$616,925 $732,500 N/A
N/A
Appendix B — Social and Economic Performance
30
Site
Sus
tain
abili
ty P
lan:
Tak
ing
Ste
ps
Tow
ard
the
Fut
ure
| FY
14
Appendix B — Social and Economic Performance
SUSTAINABILITY PERFORMANCE SCORECARD
1. Reported per 200,000 employee hours worked.2. Philanthropic investments are distributed by a committee of employees from Battelle’s Pacific Northwest Division. At least 50 percent of giving is directed to STEM education.

Appendix B — Social and Economic Performance
31
Site
Sus
tain
abili
ty P
lan:
Tak
ing
Ste
ps
Tow
ard
the
Fut
ure
| FY
14
Appendix B — Social and Economic Performance
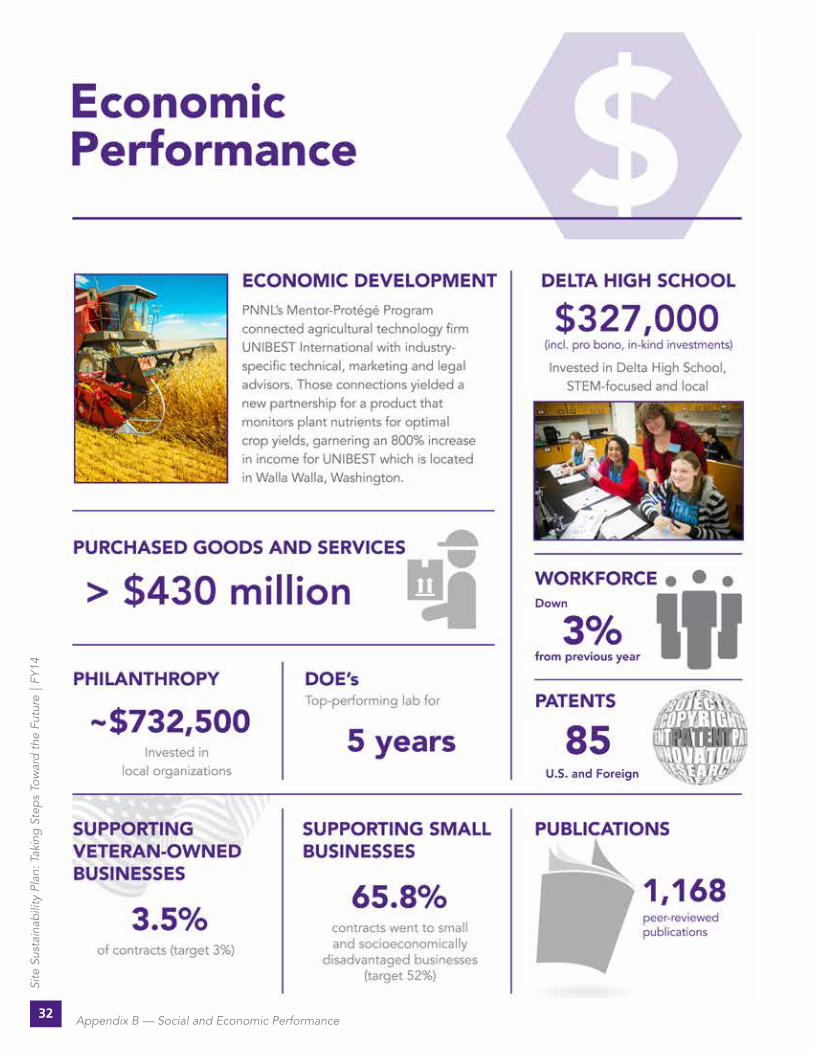
32
Site
Sus
tain
abili
ty P
lan:
Tak
ing
Ste
ps
Tow
ard
the
Fut
ure
| FY
14
Appendix B — Social and Economic Performance