Embed Size (px)
Citation preview
Sixt Aktiengesellschaft Interim Report as at 30 June 2009
Contents 1. Summary ........................................................................................................................... 2 2. Interim Group Management Report ................................................................................ 3 2.1 General Developments in the Group................................................................................... 3 2.2 Vehicle Rental Business Unit.............................................................................................. 4
788999
99
1111121313
1414151617
181818192124252525
26
2.3 Leasing Business Unit ........................................................................................................ 2.4 Sixt Shares ........................................................................................................................ 2.5 Opportunities and Risks ..................................................................................................... 2.6 Key Events in the Period Under Review.............................................................................. 2.7 Report on Post-Balance Sheet Date Events........................................................................ 2.8 Outlook .............................................................................................................................. 3. Results of Operations, Net Assets and Financial Position .......................................... 3.1 Results of Operations......................................................................................................... 3.2 Net Assets ....................................................................................................................... 3.3 Financial Position ............................................................................................................. 3.4 Liquidity Position .............................................................................................................. 3.5 Investments ..................................................................................................................... 3.6 Employees ....................................................................................................................... 4. Interim Consolidated Financial Statements as at 30 June 2009..................................... 4.1 Consolidated Income Statement ....................................................................................... 4.2 Consolidated Balance Sheet ............................................................................................ 4.3 Consolidated Statement of Changes in Equity .................................................................. 4.4 Consolidated Cash Flow Statement.................................................................................. 5. Other Information about the Group (Notes) .................................................................... 5.1 Basis of Accounting.......................................................................................................... 5.2 Basis of Consolidation...................................................................................................... 5.3 Explanations of Selected Items of the Consolidated Income Statement............................. 5.4 Explanations of Selected Items of the Consolidated Balance Sheet .................................. 5.5 Group Segment Reporting................................................................................................ 5.6 Explanations on the Consolidated Cash Flow Statement................................................... 5.7 Contingent Liabilities ........................................................................................................ 5.8 Related Party Disclosures ................................................................................................ 6. Responsibility Statement.................................................................................................
Sixt Aktiengesellschaft
1
1. Summary
Sixt Group records a high level of stable demand in H1 2009 despite
global recession
Rental revenue down 2.7% in the first six months
H1 leasing revenue similar to the previous year (-0.5%)
Clearly positive earnings again generated in Q2 2009: EBIT of
EUR 22.4 million, EBT of EUR 9.1 million
Effects of improved cost structure, due primarily to the smaller rental
fleet, begin to bear fruit
Adjusted EBT in first six months: EUR 9.8 million; reported EBT in
accordance with IFRSs: EUR -25.5 million
Unchanged outlook for full-year 2009: clearly positive EBT expected
Sixt Aktiengesellschaft, Germany’s largest car rental company and one of Europe’s
leading mobility services providers, recorded stable demand in both its Vehicle
Rental and Leasing Business Units in the first half of 2009 despite the global
recession.
Following the impact that the effects of adjusting the rental fleet to reflect the change
in overall conditions had on earnings in the first quarter, the cost-cutting measures
initiated at the end of 2008, and in particular the reduction in the Group’s rental fleet,
had a positive effect on its results in the second quarter. Consequently – as
expected and announced – the Group significantly improved its earnings in the
second quarter compared with the first three months, despite the ongoing difficult
economic environment. Consolidated earnings before net finance costs and taxes
(EBIT) amounted to EUR 22.4 million in the period from April to June, and earnings
before taxes were EUR 9.1 million. Consolidated revenue in the second quarter was
down 9.5% year-on-year, but up 7.8% on Q1 2009. In the first six months of the
year, consolidated revenue fell by 8.4% year-on-year to EUR 782.8 million.
The Managing Board continues to forecast a clearly positive EBT for full-year 2009.
Sixt Aktiengesellschaft
2
2. Interim Group Management Report
2.1 General Developments in the Group
Total consolidated revenue for the Sixt Group was EUR 406.1 million in the second
quarter of 2009. This represents a decline of 9.5% over the prior-year figure
(EUR 448.7 million).
Sixt’s rental revenue (excluding other revenue from rental business) of EUR 188.1
million was down 5.0% on the high prior-year figure (EUR 198.1 million).
Although other revenue from rental business at EUR 61.6 million was down 23.8% as
against the same quarter of the previous year (EUR 80.8 million), it was much higher
than in the first three months of 2009 (EUR 38.4 million). As explained in the Interim
Report as at 31 March 2009, the decrease is due mainly to the reduction in the rental
fleet caused by the economic situation. In addition, the financing of part of the fleet was
switched from purchases to leasing. Both factors mean that the volume discounts
granted by automobile manufacturers that are common to the industry will not be
received until later in the financial year.
The Leasing Business Unit recorded a slight revenue decrease of 3.7% to EUR 103.5
million in the second quarter of 2009 (Q2 2008: EUR 107.5 million).
Consolidated operating revenue from rental and leasing activities (excluding revenue
from the sale of used leasing vehicles) fell by 8.6% in the second quarter to EUR 353.2
million (Q2 2008: EUR 386.4 million). However, it increased significantly as against the
first three months of the year (EUR 317.0 million).
The sale of used leasing vehicles, which can generally be subject to significant revenue
fluctuations, generated revenue of EUR 51.7 million from April to June, 15.4% less than
in Q2 2008 (EUR 61.1 million).
The Group again generated positive earnings before net finance costs and taxes (EBIT)
of EUR 22.4 million (prior-year quarter: EUR 40.7 million; -45.0%). EBT amounted to
EUR 9.1 million (Q2 2008: EUR 30.4 million; -69.9%). Sixt reported a quarterly profit of
EUR 4.1 million (prior-year quarter: EUR 20.1 million; -79.6%). The significant earnings
improvement as against the first quarter is the result of continued stable demand, cost
Sixt Aktiengesellschaft
3
cutting and efficiency improvements, particularly in the case of the rental fleet.
In the first half of 2009, the Sixt Group achieved revenue of EUR 782.8 million, a
decline of 8.4% year-on-year (EUR 854.6 million). Six-month revenue generated abroad
reached EUR 158.1 million, 3.4% below the prior-year period (EUR 163.7 million).
Rental revenue from January to June virtually matched the high H1 2008 level (-2.7%),
at EUR 364.9 million. Other revenue from rental business fell by 35.9% year-on-year to
EUR 100.0 million, mainly due to the effects of the reduction in the rental fleet and the
change in financing for some of the vehicles.
At EUR 205.3 million, leasing revenue remained at the strong prior-year level (H1
2008: EUR 206.3 million; -0.5%).
Operating revenue from rental and leasing activities (excluding revenue from the sale of
used leasing vehicles) reached EUR 670.2 million in the first half of this year following
EUR 737.3 million in the prior-year period (-9.1%). EUR 153.9 million of this was
attributable to international business (prior-year period: EUR 159.4 million; -3.4%). This
lifted the international share of operating revenue in the first half of the year from 21.6%
to 23.0%.
Revenue from the sale of used leasing vehicles declined slightly as against the first half
of 2008 to EUR 110.1 million (EUR 114.8 million; -4.1%).
In accordance with IFRSs, the Group reported EBT of EUR -25.5 million in the first six
months (H1 2008: EUR 65.8 million). Adjusted EBT, in which the effects of the reduction
in the fleet size and the switch in financing were eliminated, totalled EUR 9.8 million
(H1 2008: EUR 33.1 million). The loss for the first six months of the year (in accordance
with IFRSs) amounted to EUR 22.4 million (H1 2008: profit of EUR 44.9 million).
2.2 Vehicle Rental Business Unit
With its presence in the core countries, Germany, France, Spain, the UK, Benelux,
Austria and Switzerland, Sixt covers well over 70% of the European market through
subsidiaries. In the other European countries and in other global regions, the Sixt brand
is represented by a close-knit network of franchisees. Overall, Sixt is now represented in
more than 90 countries for vehicle rental.
Sixt Aktiengesellschaft
4
Sixt considers the European vehicle rental market to offer long-term growth, with
estimated sustainable growth rates of 3% to 5% per year in spite of the current
slowdown resulting from the global recession.
In view of sharply increased operating costs, Sixt decided to raise prices for business
and corporate customers in the second quarter and to hold relevant negotiations with
customers. Sixt had already implemented price increases for private customers at the
end of last year. The price increases – following years of stagnating or falling prices in
the vehicle rental industry – will only be fully reflected in the following quarters.
In the second quarter of 2009, the Vehicle Rental Business Unit focused operationally on
the following issues in particular:
New franchise partner in Ireland: Sixt has gained a strong, owner-managed
franchise partner in Ireland in the shape of Murrays Rent a Car, which has
allowed Sixt to extend its fleet and office network on the island. This increased
the offering for business travellers in particular: customers can now collect Sixt
vehicles at all of Ireland’s major airport terminals.
Expansion of online mobility: In the second quarter, Sixt implemented a number
of measures designed to expand the range of online mobility offerings and
reinforce its innovation leadership in the vehicle rental industry. For example, Sixt
is the first car rental company to offer mobile vehicle bookings via Blackberry, as
an extension of mobile bookings already available via mobile phone and iPhone.
In the second quarter of 2009, Sixt signed an exclusive cooperation agreement
with BMW for BMW ConnectedDrive technology. This technical innovation works
like an electronic travel guide. Drivers are provided with tailored information such
as news or weather reports that are transmitted directly to the navigation system.
Sixt customers can rent vehicles equipped with this technology at no extra
charge.
Furthermore, Sixt extended user-friendly vehicle reservations via online check-in
to additional countries such as Portugal and Croatia in the second quarter. For
online check-in, the customer enters all reservation information at home before
the journey, significantly shortening the process at pick-up.
Start of “autohaus24.de”: Sixt opened a multibrand car dealership on the Internet
in June 2009 in the shape of “autohaus24.de”. Customers can individually
configure the car they want and receive very favourable purchase, financing, or
leasing terms. “autohaus24.de” obtains quotations from a network of distributers
Sixt Aktiengesellschaft
5
As at 30 June 2009, the Vehicle Rental Business Unit had 1,905 rental offices
worldwide, a net increase of 26 compared with 1,879 offices at the end of 2008. Most of
the new offices were opened in the Sixt corporate countries. In Germany, the number of
rental offices rose to 539 compared with 526 at the end of 2008.
Reflecting the deterioration of economic conditions, Sixt pursued a cautious fleet policy
and reduced its rental fleet as announced in the first half of the year. The average size of
the European rental fleet was 67,900 in the first six months, compared with 72,300 in
full-year 2008 (-6.1%). Of this figure, approximately 46,700 vehicles were attributable to
the German market (full-year 2008: 48,600; -3.9%). In other European countries, the
number of vehicles declined by 10.5% from 23,700 to 21,200.
The Vehicle Rental Business Unit’s rental revenue (excluding other revenue from rental
business) of EUR 188.1 million in the second quarter of 2009 was down 5.0% on the
high level in the same period of the previous year. Although other revenue from rental
business was down 23.8% at EUR 61.6 million as against the same period of the
previous year (EUR 80.8 million) on account of adjustment effects from the reduction in
fleet size and the partial switch in financing for the rental fleet, it was much higher than in
the first three months of 2009 (EUR 38.4 million). Overall, the Vehicle Rental Business
Unit’s quarterly revenue was EUR 249.7 million, down 10.5% year-on-year (EUR 278.9
million).
In the first half of 2009, rental revenues amounted to EUR 364.9 million, down 2.7% on
the first half of 2008. Rental revenue in Germany declined by 2.1% to EUR 266.5 million.
Other revenue from rental business fell by 35.9% to EUR 100.0 million. All in all, the
Business Unit’s six-month revenue was EUR 464.9 million, down 12.4% on the first half
of 2008 (EUR 531.0 million).
In accordance with IFRSs, the Business Unit recorded EBT for the first six months of
EUR -36.3 million, although it returned to a positive figure of EUR 2.2 million in the
second quarter.
Sixt Aktiengesellschaft
6
2.3 Leasing Business Unit
Sixt is one of the largest German vendor-neutral, non-bank full-service leasing
companies, offering corporate and private customers a wide range of supplemental
services in addition to pure finance leasing in order to reduce their mobility costs.
The worsening economic environment affected the leasing market in the first half of
2009. The global recession and the unclear prospects for economic recovery led to very
cautious investment by companies and private individuals.
Although the business climate in equipment leasing improved somewhat in the second
quarter on the back of corporate news about the business situation at present and
expected developments over the next six months, this improvement was due solely to
better future expectations. By contrast, the current business situation is viewed as
poorer (Source: Bundesverband Deutscher Leasing-Unternehmen – BDL / Ifo Institute).
As a result of the crisis on the financial markets, the leasing sector continues to face
financing costs that are much higher than they were in the previous year.
The number of Sixt’s leases in the first six months of the year under review fell slightly.
The total number of leases (corporate countries) in Germany and abroad as at 30 June
2009 amounted to 64,000, down 1.7% compared with the end of 2008 (65,100 leases). It
should be noted here that Sixt is strategically shifting its portfolio of leases away from
low-revenue agreements towards higher-revenue full service leasing in order to improve
the quality of its contracts.
The Leasing Business Unit recorded revenue from leasing activities of EUR 103.5 million
in the second quarter of 2009, a slight decline of 3.7% over the prior-year figure.
Quarterly revenue from the sale of used leasing vehicles was EUR 51.7 million (Q2
2008: EUR 61.1 million; -15.4%). As a result, total consolidated revenue for the Business
Unit was EUR 155.2 million in the period from April to June, as against EUR 168.6
million in the same period of the previous year (-7.9%).
In the first half of the year, the Business Unit recorded revenue from leasing activities of
EUR 205.3 million, thus maintaining the strong prior-year level (EUR 206.3 million)
(-0.5%). The development of international business, which grew by 19.9% to EUR 25.0
million, was also encouraging. Leasing revenue in Germany declined by 2.8% as against
the prior-year period to EUR 180.3 million.
Sixt Aktiengesellschaft
7
Revenue from the sale of used leasing vehicles in the first half of the year totalled
EUR 110.1 million (H1 2008: EUR 114.8 million; -4.1%). The Business Unit’s total
revenue amounted to EUR 315.4 million, a slight decline of 1.8% as against the previous
year’s figure (EUR 321.1 million).
At EUR 2.1 million, EBT in the first six months of 2009 was positive despite the
substantial increase in financing costs and a weak used car market (H1 2008: EUR 2.8
million). EUR 1.9 million of this was attributable to the second quarter (prior-year
period: EUR -0.5 million).
2.4 Sixt Shares
After the global economic downturn and the related weak investor confidence had
significantly impacted the stock markets in the first quarter of 2009, the pictured
brightened in the second quarter. From April to June, the Deutscher Aktienindex (DAX)
recorded an upward trend and closed the second quarter at 4,808 points, up 17.7% on
the end of the first quarter. Other key indices in Germany and abroad also recorded
significant increases in the second quarter. The SDAX, in which Sixt AG’s ordinary
shares are listed, rose by 22.3% by the end of the second quarter.
Sixt’s shares also recorded a significant upward trend in the period between April and
June. The price of ordinary shares closed at EUR 17.25 at the end of the second
quarter, an increase of 69.8% on the price as at 31 March 2009 (EUR 10.16). The
shares thus outperformed the benchmark index, the SDAX. The high for the quarter was
reached on 12 June at EUR 17.94.
The movements in the price of preference shares in the second quarter of 2009 were
similarly positive to those of ordinary shares. The quarter-end closing price was
EUR 13.12, a 48.2% increase on the price as at 31 March 2009 (EUR 8.85). The high for
preference shares in the second quarter was reached on 12 June 2009 (all quotations
refer to Xetra closing prices).
2.5 Opportunities and Risks
The opportunity and risk profile of the Sixt Group in the first six months of 2009 has not
changed significantly as against the information provided in the Group Management
Report in the 2008 Annual Report and as against the additional information provided in
Sixt Aktiengesellschaft
8
the Interim Management Report as at 31 March 2009. The 2008 Annual Report contains
extensive details of the risks facing the Company and its risk management system.
2.6 Key Events in the Period Under Review
Hans-Norbert Topp, who has been Sixt AG’s Chief Sales & Distribution Officer since
2004, has informed the Supervisory Board and Managing Board that he will leave the
Company due to differences of opinion about the future sales strategy. Frank Feist
assumed overall management of European sales in the Vehicle Rental Business Unit at
the beginning of June 2009. As Sales Director, Feist was already responsible for Sixt’s
sales activities in Germany; he assumed responsibility for sales in Sixt’s other European
corporate countries.
2.7 Report on Post-Balance Sheet Date Events
No events of special significance for the net assets, financial position and results of
operations of the Sixt Group occurred after the reporting date of 30 June 2009.
2.8 Outlook
Sixt continues to expect demand for mobility services to be roughly stable in the core
European countries in full-year 2009. In light of the current trend in operating demand –
which can still be described as satisfactory given the economic environment – and the
expected further reduction in operating costs, the Managing Board continues to forecast a
clearly positive EBT for full-year 2009. The price increases resolved by both business units
and partially implemented in the first half of the year will also contribute to this.
This forecast assumes that there are no negative events with a major impact on the
Group.
3. Results of Operations, Net Assets and Financial Position
3.1 Results of Operations
Other operating income of the Group amounted to EUR 7.5 million in the first half of the
year, 7.3% less than in the prior-year period (EUR 8.1 million).
Sixt Aktiengesellschaft
9
Fleet expenses and cost of lease assets fell by 3.8% to EUR 339.6 million because of
the fleet reduction carried out in the first half of the year (H1 2008: EUR 353.0 million).
While fuel costs fell significantly, other costs, such as for repairs, rose on account of the
general increase in prices.
Personnel expenses for the period January to June 2009 grew in total by 8.2% to
EUR 69.6 million (H1 2008: EUR 64.4 million). The additional expenses reflect the
growth of the workforce in the operational areas in the previous year.
At EUR 223.8 million, depreciation and amortisation for the first half of the year was
18.7% higher than the figure for the same period of the previous year (EUR 188.5
million). The increase is due to a larger fleet being capitalised in the first months of the
year under review than in the previous year, which was reduced in the course of the first
half of the year.
Other operating expenses declined by 5.6% to EUR 155.8 million (H1 2008: EUR 165.1
million). This was attributable primarily to lower leasing expenses in connection with the
fleet refinancing measures (operating leases). However, risk provisions increased
substantially as against the previous year.
In spite of additional fleet costs, the Group achieved positive earnings before net finance
costs and taxes (EBIT) of EUR 1.4 million in the first six months (H1 2008: EUR 91.7
million). In Q2 2009, EBIT amounted to EUR 22.4 million (Q2 2008: EUR 40.7 million;
-45.0%).
Net finance costs amounted to EUR 26.9 million in the first six months, a slight year-on-
year increase (H1 2008: EUR 25.9 million). This was due to higher interest payments on
financial liabilities to refinance the rental and leasing fleet and lower gains of EUR 2.1
million on interest rate hedging transactions than in the previous year (H1 2008: EUR 3.9
million).
As a result, the Group reported EBT of EUR -25.5 million in the first half of the year. The
previous year’s figure was EUR 65.8 million. Positive EBT of EUR 9.1 million was
generated again in the second quarter, 69.9% less than in the second quarter of 2008
(EUR 30.4 million).
Consolidated loss after taxes and before minority interests amounted to EUR 22.4
million (H1 2008: profit of EUR 44.9 million). As in the prior-year period, the portion of
Sixt Aktiengesellschaft
10

consolidated profit or loss attributable to minority interests was not material. For Q2 on a
stand-alone basis, the Group reported profit of EUR 4.1 million (Q2 2008: EUR 20.1
million).
On the basis of 25.22 million outstanding shares (weighted average for the first six
months for ordinary and preference shares; previous year: 25.22 million outstanding
shares), earnings per share (basic) for the first half of the year amounted to EUR -0.89,
after EUR 1.79 in the prior-year period. The figure in the second quarter was EUR 0.16
(Q2 2008: EUR 0.80). Diluted earnings per share for the first half of the year amounted
to EUR -0.88 (previous year: EUR 1.78), reflecting the dilutive effect of convertible bonds
issued to employees. The figure achieved in the second quarter was also EUR 0.16 (Q2
2008: EUR 0.80).
3.2 Net Assets
The Group’s total assets amounted to EUR 2.23 billion as at 30 June 2009. This
represents a decline of just under EUR 240 million or 9.6% compared with the end of the
past financial year (EUR 2.47 billion).
The decrease in total assets is due mainly to the reduction in the rental fleet.
Within non-current assets, lease assets, which amounted to EUR 902.8 million, continue
to be the most significant item. This figure has not changed as against the end of the
previous financial year. There were also no significant changes in the other items under
non-current assets compared with year-end 2008.
Rental vehicles remained the largest item under current assets; however, they fell by
EUR 171.5 million or 16.2%, from EUR 1,057.6 million at the end of the past financial
year to EUR 886.1 million due to the reduction in the fleet size. In addition, a larger
proportion of rental vehicles again were refinanced using operating leases.
Total current assets declined by EUR 242.0 million, from EUR 1.47 billion as at
31 December 2008 to EUR 1.23 billion as at 30 June 2009.
3.3 Financial Position
Equity
As a result of the decline in earnings, the Sixt Group’s equity totalled EUR 474.1 million
following the first six months of 2009. This represents a decrease of EUR 18.7 million
compared with the end of the previous financial year (EUR 492.8 million).
Sixt Aktiengesellschaft
11
Nevertheless, the equity ratio amounted to 21.2% as at 30 June 2009 (31 December
2008: 20.0%) and therefore remained both at a solid level in line with the Group’s target
and well above the average for the rental and leasing sector.
Liabilities
Non-current liabilities and provisions amounted to EUR 628.2 million as at 30 June 2009,
significantly less than the EUR 830.6 million reported at the end of 2008. This is
attributable to a shift within financial liabilities as the bond previously reported under non-
current financial liabilities (nominal value EUR 225 million) has a remaining maturity of
less than one year (due for repayment in May 2010). Nevertheless non-current financial
liabilities continue to be the key item; they amounted to EUR 509.8 million (31 December
2008: EUR 734.8 million). They include half of the profit participation capital issued in
2004 (nominal value EUR 50 million).
Current liabilities and provisions fell slightly by a total of EUR 15.6 million to EUR 1.13
billion. The increase in current financial liabilities by EUR 41.1 million from EUR 651.1
million at year-end 2008 to EUR 692.2 million, which was due to the reclassification of
the bond from non-current financial liabilities, contrasted with lower trade payables of
EUR 259.4 million (31 December 2008: EUR 331.0 million).
3.4 Liquidity Position
As at the end of the first half of 2009, the Sixt Group reported cash flows before changes
in working capital of EUR 201.2 million, (H1 2008: EUR 232.9 million). Including working
capital, net cash flows from operating activities amounted to EUR 255.9 million in the
first six months. The improvement as against the previous year (net cash flows used in
operating activities of EUR 95.8 million) is primarily due to the reduction in the rental
fleet and the decrease in trade receivables and inventories.
Net cash flows used in investing activities amounted to EUR 84.1 million (H1 2008: net
cash flows used in investing activities of EUR 172.0 million). As in the previous year, the
cash outflow relates mainly to investments in lease assets that exceeded the inflows
from terminated leases.
Net cash flows used in financing activities totalling EUR 180.1 million resulted from the
repayment of short-term loans that served to finance the Group’s fleet. The prior-year
period saw a cash inflow of EUR 259.9 million, which was used to finance the fleet
expansion.
Sixt Aktiengesellschaft
12
After minor changes relating to exchange rates, total cash flows resulted in a year-on-
year decline in cash and cash equivalents by EUR 8.0 million as at 30 June 2009 (H1
2008: decrease of EUR 7.6 million).
3.5 Investments
In the first six months of 2009, Sixt added around 66,300 vehicles (H1 2008: 84,700)
with a total value of EUR 1.51 billion (H1 2008: EUR 1.90 billion) to its rental and leasing
fleets due to its cautious fleet planning as a consequence of the economic environment.
This represents a 22% decline in the number of vehicles. The value of the vehicles fell
by a good 21%. Sixt continues to expect investments for full-year 2009 to be lower than
the previous year (EUR 3.6 billion).
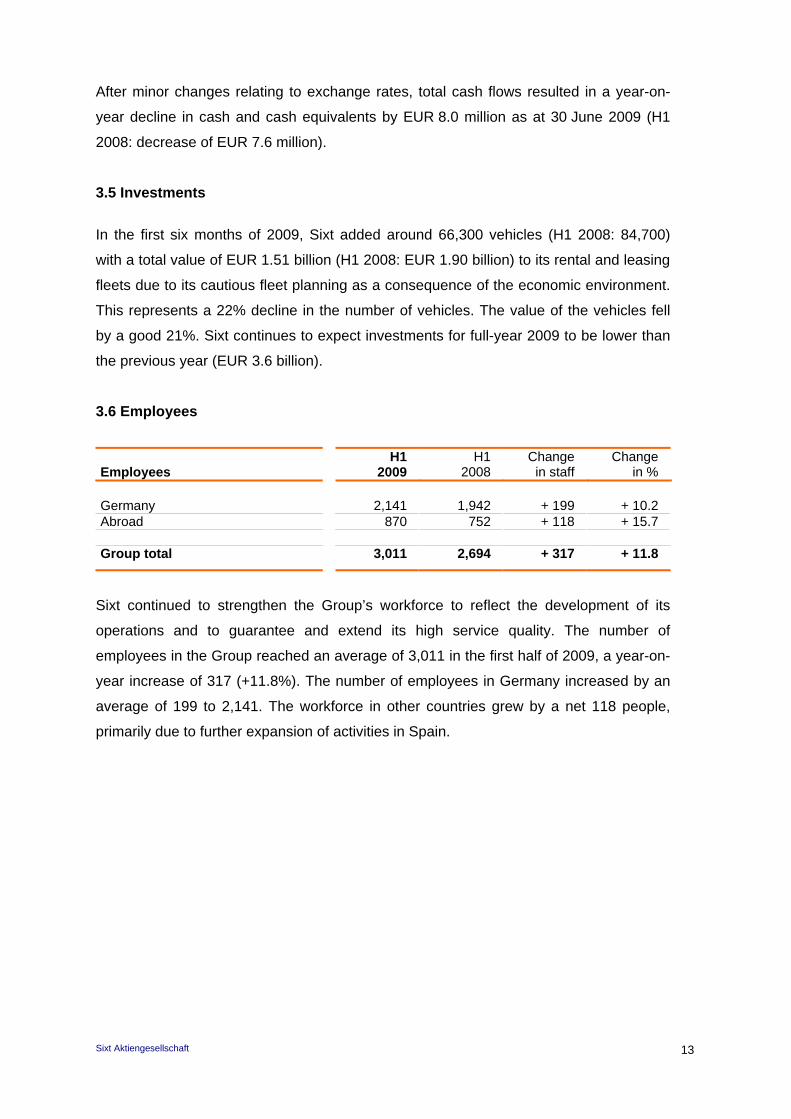
3.6 Employees
Employees
H1 2009
H1 2008
Change in staff
Change in %
Germany 2,141 1,942 + 199 + 10.2 Abroad 870 752 + 118 + 15.7 Group total 3,011 2,694 + 317 + 11.8
Sixt continued to strengthen the Group’s workforce to reflect the development of its
operations and to guarantee and extend its high service quality. The number of
employees in the Group reached an average of 3,011 in the first half of 2009, a year-on-
year increase of 317 (+11.8%). The number of employees in Germany increased by an
average of 199 to 2,141. The workforce in other countries grew by a net 118 people,
primarily due to further expansion of activities in Spain.
Sixt Aktiengesellschaft
13
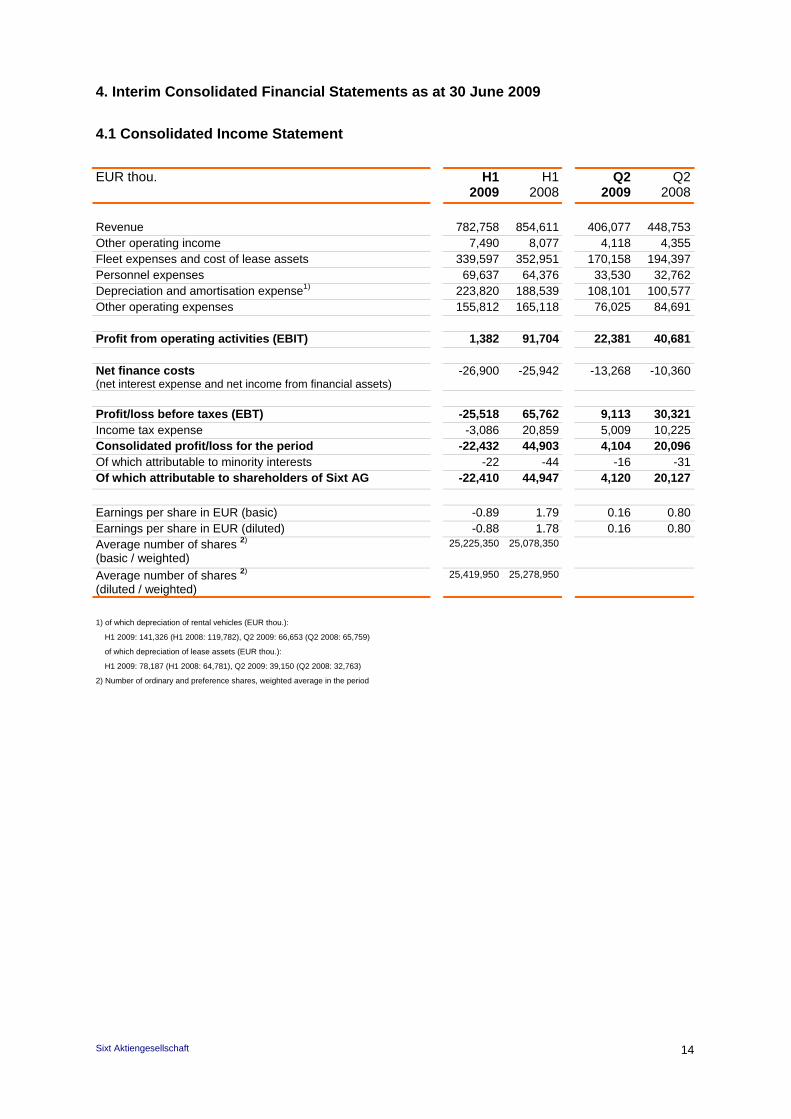
4. Interim Consolidated Financial Statements as at 30 June 2009
4.1 Consolidated Income Statement
EUR thou.
H12009
H12008
Q2 2009
Q2 2008
Revenue 782,758 854,611 406,077 448,753Other operating income 7,490 8,077 4,118 4,355Fleet expenses and cost of lease assets 339,597 352,951 170,158 194,397Personnel expenses 69,637 64,376 33,530 32,762Depreciation and amortisation expense1) 223,820 188,539 108,101 100,577Other operating expenses 155,812 165,118 76,025 84,691 Profit from operating activities (EBIT) 1,382 91,704 22,381 40,681 Net finance costs (net interest expense and net income from financial assets)
-26,900 -25,942 -13,268 -10,360
Profit/loss before taxes (EBT) -25,518 65,762 9,113 30,321Income tax expense -3,086 20,859 5,009 10,225Consolidated profit/loss for the period -22,432 44,903 4,104 20,096Of which attributable to minority interests -22 -44 -16 -31Of which attributable to shareholders of Sixt AG -22,410 44,947 4,120 20,127
Earnings per share in EUR (basic) -0.89 1.79 0.16 0.80Earnings per share in EUR (diluted) -0.88 1.78 0.16 0.80Average number of shares 2)
(basic / weighted) 25,225,350 25,078,350
Average number of shares 2)
(diluted / weighted) 25,419,950 25,278,950
1) of which depreciation of rental vehicles (EUR thou.):
H1 2009: 141,326 (H1 2008: 119,782), Q2 2009: 66,653 (Q2 2008: 65,759)
of which depreciation of lease assets (EUR thou.):
H1 2009: 78,187 (H1 2008: 64,781), Q2 2009: 39,150 (Q2 2008: 32,763)
2) Number of ordinary and preference shares, weighted average in the period
Sixt Aktiengesellschaft
14
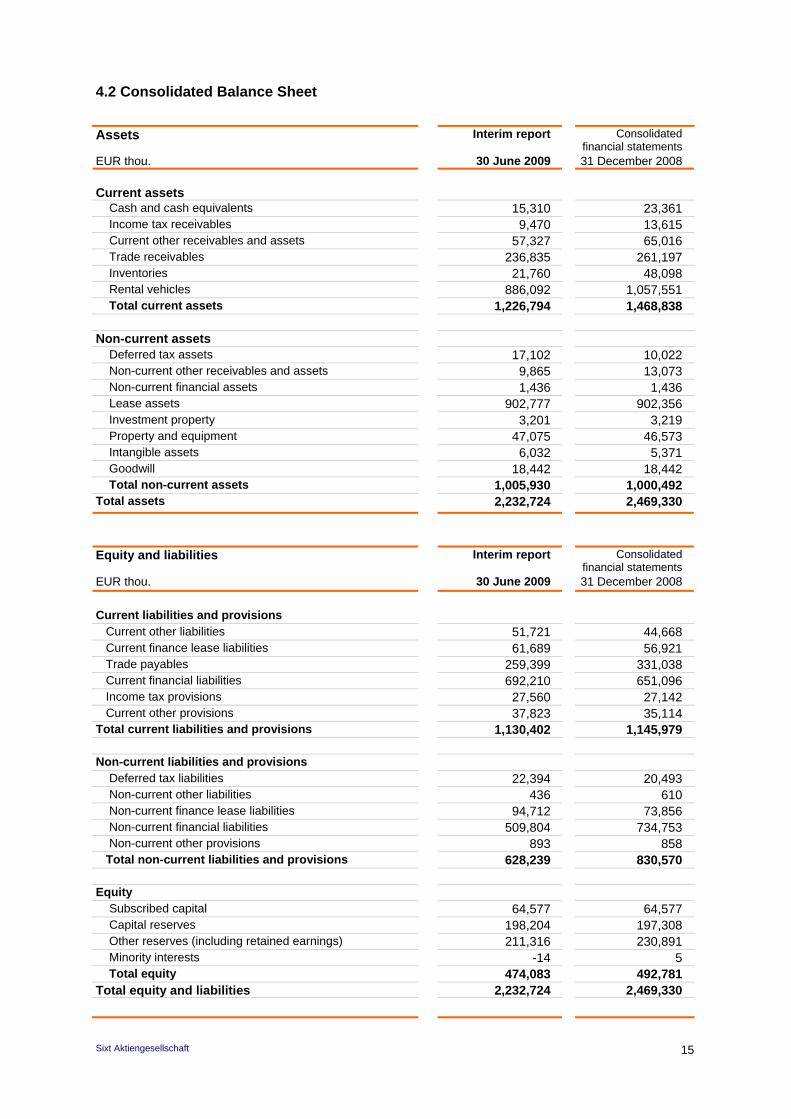
4.2 Consolidated Balance Sheet
Assets Interim report Consolidated financial statements
EUR thou. 30 June 2009 31 December 2008
Current assets Cash and cash equivalents 15,310 23,361 Income tax receivables 9,470 13,615 Current other receivables and assets 57,327 65,016 Trade receivables 236,835 261,197 Inventories 21,760 48,098 Rental vehicles 886,092 1,057,551 Total current assets 1,226,794 1,468,838 Non-current assets Deferred tax assets 17,102 10,022 Non-current other receivables and assets 9,865 13,073 Non-current financial assets 1,436 1,436 Lease assets 902,777 902,356 Investment property 3,201 3,219 Property and equipment 47,075 46,573 Intangible assets 6,032 5,371 Goodwill 18,442 18,442 Total non-current assets 1,005,930 1,000,492 Total assets 2,232,724 2,469,330
Equity and liabilities Interim report Consolidated
financial statements EUR thou. 30 June 2009 31 December 2008
Current liabilities and provisions Current other liabilities 51,721 44,668 Current finance lease liabilities 61,689 56,921 Trade payables 259,399 331,038 Current financial liabilities 692,210 651,096 Income tax provisions 27,560 27,142 Current other provisions 37,823 35,114 Total current liabilities and provisions 1,130,402 1,145,979 Non-current liabilities and provisions Deferred tax liabilities 22,394 20,493 Non-current other liabilities 436 610 Non-current finance lease liabilities 94,712 73,856 Non-current financial liabilities 509,804 734,753 Non-current other provisions 893 858 Total non-current liabilities and provisions 628,239 830,570 Equity Subscribed capital 64,577 64,577 Capital reserves 198,204 197,308 Other reserves (including retained earnings) 211,316 230,891 Minority interests -14 5 Total equity 474,083 492,781 Total equity and liabilities 2,232,724 2,469,330
Sixt Aktiengesellschaft
15
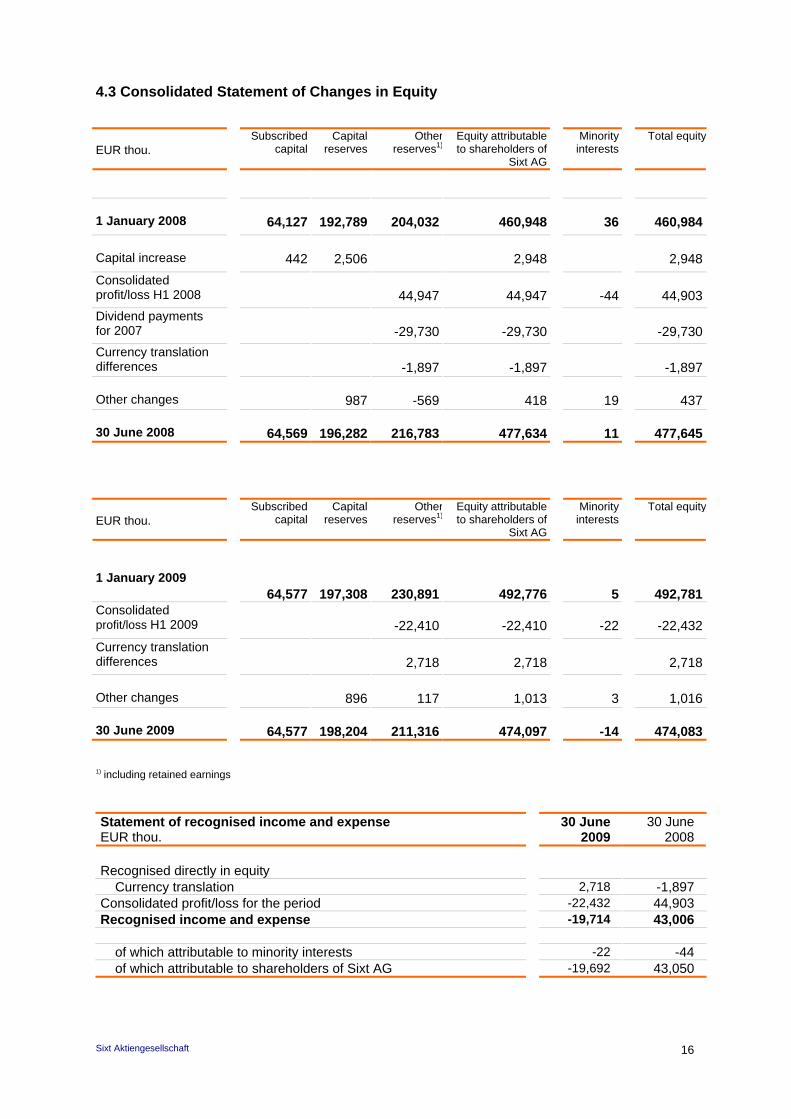
4.3 Consolidated Statement of Changes in Equity
EUR thou.
Subscribed capital
Capital reserves
Otherreserves1)
Equity attributable to shareholders of
Sixt AG
Minority interests
Total equity
1 January 2008
64,127 192,789 204,032
460,948
36
460,984
Capital increase
442 2,506 2,948
2,948
Consolidated profit/loss H1 2008
44,947 44,947
-44
44,903
Dividend payments for 2007
-29,730 -29,730
-29,730
Currency translation differences
-1,897 -1,897
-1,897
Other changes
987 -569 418
19
437
30 June 2008
64,569 196,282 216,783 477,634
11
477,645
EUR thou.
Subscribed capital
Capital reserves
Otherreserves1)
Equity attributable to shareholders of
Sixt AG
Minority interests
Total equity
1 January 2009
64,577 197,308 230,891
492,776
5
492,781Consolidated profit/loss H1 2009
-22,410 -22,410
-22
-22,432
Currency translation differences
2,718 2,718
2,718
Other changes
896 117 1,013
3
1,016
30 June 2009
64,577 198,204 211,316 474,097
-14
474,083
1) including retained earnings
Statement of recognised income and expense EUR thou.
30 June 2009
30 June 2008
Recognised directly in equity Currency translation 2,718 -1,897 Consolidated profit/loss for the period -22,432 44,903 Recognised income and expense -19,714 43,006 of which attributable to minority interests -22 -44 of which attributable to shareholders of Sixt AG -19,692 43,050
Sixt Aktiengesellschaft
16
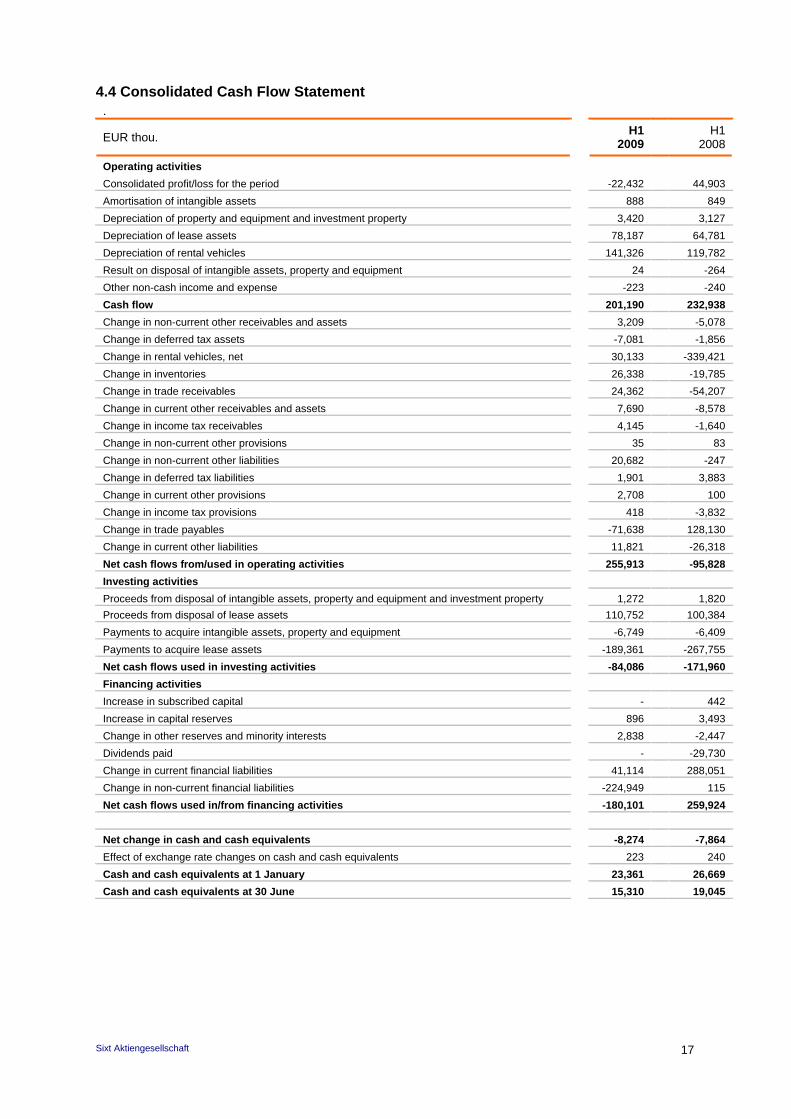
4.4 Consolidated Cash Flow Statement .
EUR thou. H1
2009
H1 2008
Operating activities
Consolidated profit/loss for the period -22,432 44,903
Amortisation of intangible assets 888 849
Depreciation of property and equipment and investment property 3,420 3,127
Depreciation of lease assets 78,187 64,781
Depreciation of rental vehicles 141,326 119,782
Result on disposal of intangible assets, property and equipment 24 -264
Other non-cash income and expense -223 -240
Cash flow 201,190 232,938
Change in non-current other receivables and assets 3,209 -5,078
Change in deferred tax assets -7,081 -1,856
Change in rental vehicles, net 30,133 -339,421
Change in inventories 26,338 -19,785
Change in trade receivables 24,362 -54,207
Change in current other receivables and assets 7,690 -8,578
Change in income tax receivables 4,145 -1,640
Change in non-current other provisions 35 83
Change in non-current other liabilities 20,682 -247
Change in deferred tax liabilities 1,901 3,883
Change in current other provisions 2,708 100
Change in income tax provisions 418 -3,832
Change in trade payables -71,638 128,130
Change in current other liabilities 11,821 -26,318
Net cash flows from/used in operating activities 255,913 -95,828
Investing activities
Proceeds from disposal of intangible assets, property and equipment and investment property 1,272 1,820
Proceeds from disposal of lease assets 110,752 100,384
Payments to acquire intangible assets, property and equipment -6,749 -6,409
Payments to acquire lease assets -189,361 -267,755
Net cash flows used in investing activities -84,086 -171,960
Financing activities
Increase in subscribed capital - 442
Increase in capital reserves 896 3,493
Change in other reserves and minority interests 2,838 -2,447
Dividends paid - -29,730
Change in current financial liabilities 41,114 288,051
Change in non-current financial liabilities -224,949 115
Net cash flows used in/from financing activities -180,101 259,924
Net change in cash and cash equivalents -8,274 -7,864
Effect of exchange rate changes on cash and cash equivalents 223 240
Cash and cash equivalents at 1 January 23,361 26,669
Cash and cash equivalents at 30 June 15,310 19,045
Sixt Aktiengesellschaft
17

5. Other Information about the Group (Notes)
5.1 Basis of Accounting
The consolidated financial statements of Sixt Aktiengesellschaft as at 31 December
2008 were prepared in accordance with International Financial Reporting Standards
(IFRSs), as adopted by the EU and effective at the closing date.
The same accounting policies are applied in the interim consolidated financial
statements as at 30 June 2009, which were prepared on the basis of International
Accounting Standard (IAS) 34 (Interim Financial Reporting), as in the 2008 consolidated
financial statements. Preparation of the interim consolidated financial statements
requires management to make assumptions and estimates that affect the reported
amounts of assets, liabilities and provisions, as well as of income and expenses. Actual
amounts may differ from these estimates. A detailed description of the accounting
principles, consolidation methods and accounting policies used is published in the notes
to the consolidated financial statements in the 2008 Annual Report. The results
presented in the interim financial reports are not necessarily indicative of the results of
future reporting periods or of the full financial year. The interim consolidated financial
statements were prepared in euros.
The accompanying interim consolidated financial statements have not been audited or
reviewed by the Company’s auditors, Deloitte & Touche GmbH,
Wirtschaftsprüfungsgesellschaft.
5.2 Basis of Consolidation
Sixt Aktiengesellschaft, domiciled in Zugspitzstrasse 1, 82049 Pullach, Germany, is
entered in section B of the commercial register at the Munich Local Court, under the
number 79160.
There were no changes in the basis of consolidation as against the end of financial year
2008 or 30 June 2008.
Sixt Aktiengesellschaft
18
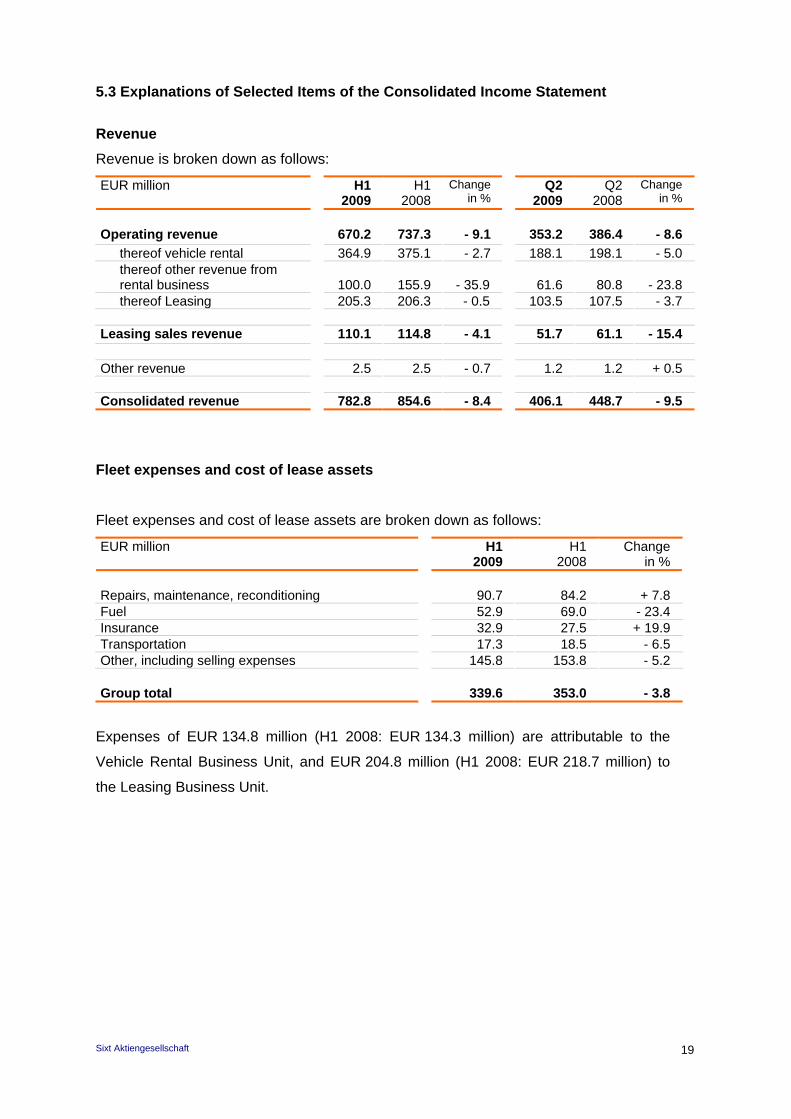
5.3 Explanations of Selected Items of the Consolidated Income Statement
Revenue
Revenue is broken down as follows:
EUR million H1 2009
H1 2008
Change in %
Q2 2009
Q2 2008
Change in %
Operating revenue 670.2 737.3 - 9.1 353.2 386.4 - 8.6
thereof vehicle rental 364.9 375.1 - 2.7 188.1 198.1 - 5.0 thereof other revenue from rental business
100.0
155.9
- 35.9
61.6
80.8
- 23.8
thereof Leasing 205.3 206.3 - 0.5 103.5 107.5 - 3.7 Leasing sales revenue 110.1 114.8 - 4.1 51.7 61.1 - 15.4
Other revenue 2.5 2.5 - 0.7 1.2 1.2 + 0.5 Consolidated revenue 782.8 854.6 - 8.4 406.1 448.7 - 9.5
Fleet expenses and cost of lease assets
Fleet expenses and cost of lease assets are broken down as follows:
EUR million H1 2009
H1 2008
Change in %
Repairs, maintenance, reconditioning 90.7 84.2 + 7.8 Fuel 52.9 69.0 - 23.4 Insurance 32.9 27.5 + 19.9 Transportation 17.3 18.5 - 6.5 Other, including selling expenses 145.8 153.8 - 5.2 Group total 339.6 353.0 - 3.8
Expenses of EUR 134.8 million (H1 2008: EUR 134.3 million) are attributable to the
Vehicle Rental Business Unit, and EUR 204.8 million (H1 2008: EUR 218.7 million) to
the Leasing Business Unit.
Sixt Aktiengesellschaft
19
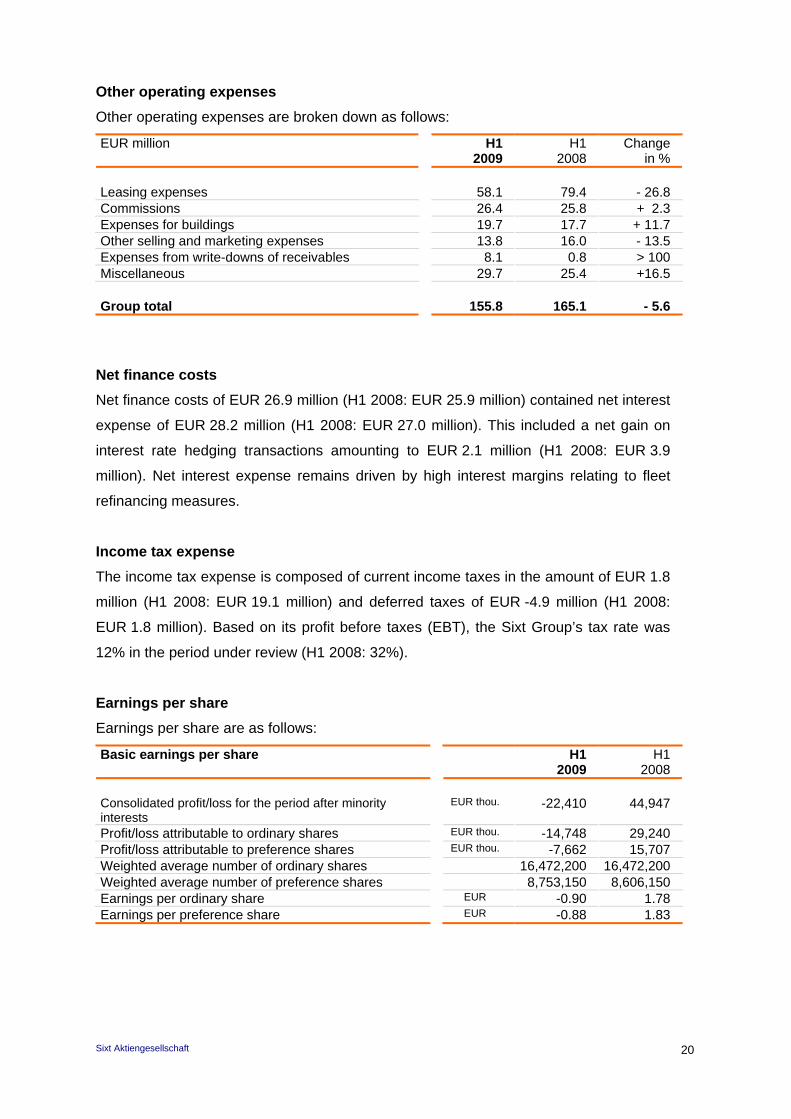
Other operating expenses
Other operating expenses are broken down as follows:
EUR million H1 2009
H1 2008
Change in %
Leasing expenses 58.1 79.4 - 26.8 Commissions 26.4 25.8 + 2.3 Expenses for buildings 19.7 17.7 + 11.7 Other selling and marketing expenses 13.8 16.0 - 13.5 Expenses from write-downs of receivables 8.1 0.8 > 100 Miscellaneous 29.7 25.4 +16.5 Group total 155.8 165.1 - 5.6
Net finance costs
Net finance costs of EUR 26.9 million (H1 2008: EUR 25.9 million) contained net interest
expense of EUR 28.2 million (H1 2008: EUR 27.0 million). This included a net gain on
interest rate hedging transactions amounting to EUR 2.1 million (H1 2008: EUR 3.9
million). Net interest expense remains driven by high interest margins relating to fleet
refinancing measures.
Income tax expense
The income tax expense is composed of current income taxes in the amount of EUR 1.8
million (H1 2008: EUR 19.1 million) and deferred taxes of EUR -4.9 million (H1 2008:
EUR 1.8 million). Based on its profit before taxes (EBT), the Sixt Group’s tax rate was
12% in the period under review (H1 2008: 32%).
Earnings per share
Earnings per share are as follows:
Basic earnings per share H1 2009
H1 2008
Consolidated profit/loss for the period after minority interests
EUR thou. -22,410 44,947
Profit/loss attributable to ordinary shares EUR thou. -14,748 29,240 Profit/loss attributable to preference shares EUR thou. -7,662 15,707 Weighted average number of ordinary shares 16,472,200 16,472,200 Weighted average number of preference shares 8,753,150 8,606,150 Earnings per ordinary share EUR -0.90 1.78 Earnings per preference share EUR -0.88 1.83
Sixt Aktiengesellschaft
20
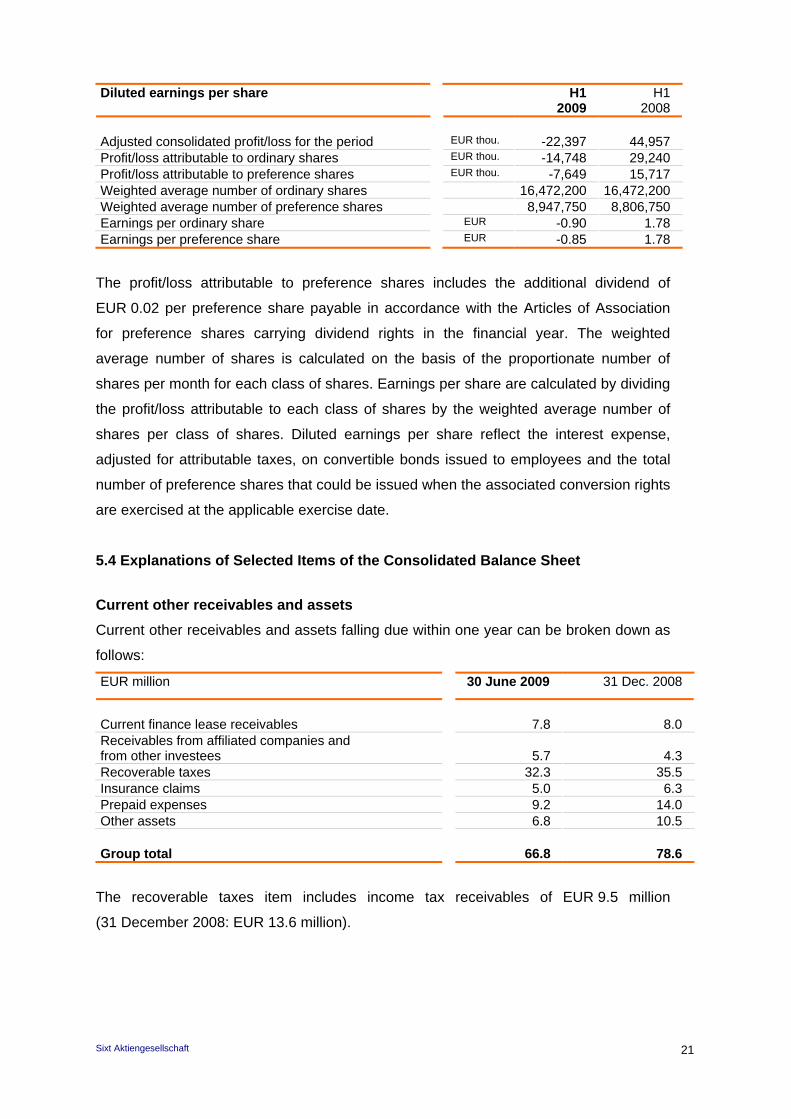
Diluted earnings per share H1 2009
H1 2008
Adjusted consolidated profit/loss for the period EUR thou. -22,397 44,957 Profit/loss attributable to ordinary shares EUR thou. -14,748 29,240 Profit/loss attributable to preference shares EUR thou. -7,649 15,717 Weighted average number of ordinary shares 16,472,200 16,472,200 Weighted average number of preference shares 8,947,750 8,806,750 Earnings per ordinary share EUR -0.90 1.78 Earnings per preference share EUR -0.85 1.78
The profit/loss attributable to preference shares includes the additional dividend of
EUR 0.02 per preference share payable in accordance with the Articles of Association
for preference shares carrying dividend rights in the financial year. The weighted
average number of shares is calculated on the basis of the proportionate number of
shares per month for each class of shares. Earnings per share are calculated by dividing
the profit/loss attributable to each class of shares by the weighted average number of
shares per class of shares. Diluted earnings per share reflect the interest expense,
adjusted for attributable taxes, on convertible bonds issued to employees and the total
number of preference shares that could be issued when the associated conversion rights
are exercised at the applicable exercise date.
5.4 Explanations of Selected Items of the Consolidated Balance Sheet
Current other receivables and assets
Current other receivables and assets falling due within one year can be broken down as
follows:
EUR million 30 June 2009 31 Dec. 2008
Current finance lease receivables 7.8 8.0 Receivables from affiliated companies and from other investees
5.7
4.3
Recoverable taxes 32.3 35.5 Insurance claims 5.0 6.3 Prepaid expenses 9.2 14.0 Other assets 6.8 10.5 Group total 66.8 78.6
The recoverable taxes item includes income tax receivables of EUR 9.5 million
(31 December 2008: EUR 13.6 million).
Sixt Aktiengesellschaft
21
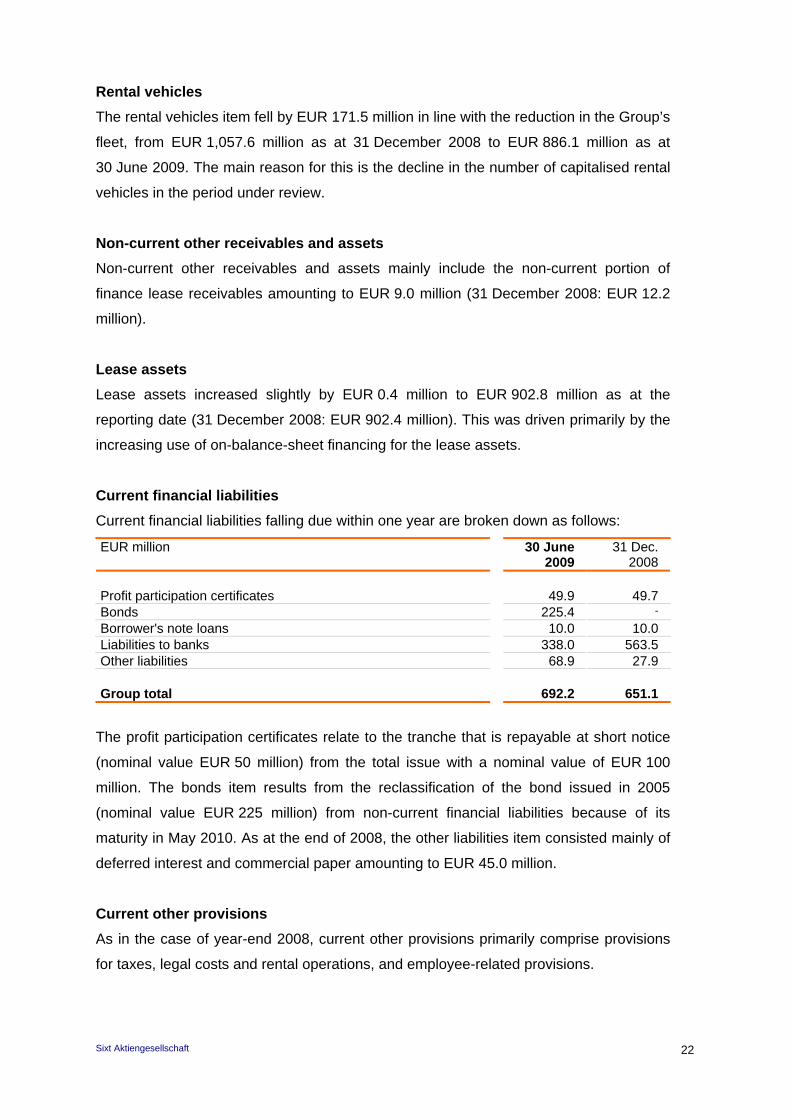
Rental vehicles
The rental vehicles item fell by EUR 171.5 million in line with the reduction in the Group’s
fleet, from EUR 1,057.6 million as at 31 December 2008 to EUR 886.1 million as at
30 June 2009. The main reason for this is the decline in the number of capitalised rental
vehicles in the period under review.
Non-current other receivables and assets
Non-current other receivables and assets mainly include the non-current portion of
finance lease receivables amounting to EUR 9.0 million (31 December 2008: EUR 12.2
million).
Lease assets
Lease assets increased slightly by EUR 0.4 million to EUR 902.8 million as at the
reporting date (31 December 2008: EUR 902.4 million). This was driven primarily by the
increasing use of on-balance-sheet financing for the lease assets.
Current financial liabilities
Current financial liabilities falling due within one year are broken down as follows:
EUR million 30 June 2009
31 Dec. 2008
Profit participation certificates 49.9 49.7 Bonds 225.4 -
Borrower's note loans 10.0 10.0 Liabilities to banks 338.0 563.5 Other liabilities 68.9 27.9 Group total 692.2 651.1
The profit participation certificates relate to the tranche that is repayable at short notice
(nominal value EUR 50 million) from the total issue with a nominal value of EUR 100
million. The bonds item results from the reclassification of the bond issued in 2005
(nominal value EUR 225 million) from non-current financial liabilities because of its
maturity in May 2010. As at the end of 2008, the other liabilities item consisted mainly of
deferred interest and commercial paper amounting to EUR 45.0 million.
Current other provisions
As in the case of year-end 2008, current other provisions primarily comprise provisions
for taxes, legal costs and rental operations, and employee-related provisions.
Sixt Aktiengesellschaft
22
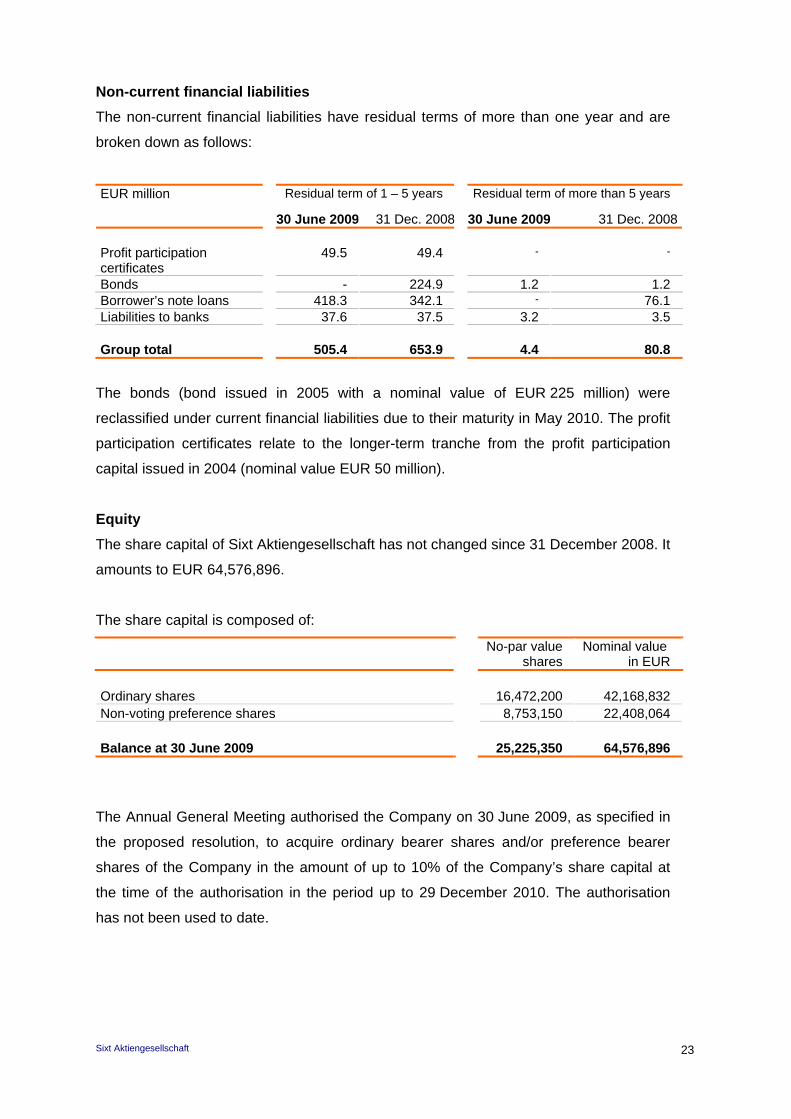
Non-current financial liabilities
The non-current financial liabilities have residual terms of more than one year and are
broken down as follows:
EUR million Residual term of 1 – 5 years Residual term of more than 5 years
30 June 2009 31 Dec. 2008 30 June 2009 31 Dec. 2008 Profit participation certificates
49.5 49.4 - -
Bonds - 224.9 1.2 1.2 Borrower’s note loans 418.3 342.1 - 76.1 Liabilities to banks 37.6 37.5 3.2 3.5 Group total 505.4 653.9 4.4 80.8
The bonds (bond issued in 2005 with a nominal value of EUR 225 million) were
reclassified under current financial liabilities due to their maturity in May 2010. The profit
participation certificates relate to the longer-term tranche from the profit participation
capital issued in 2004 (nominal value EUR 50 million).
Equity
The share capital of Sixt Aktiengesellschaft has not changed since 31 December 2008. It
amounts to EUR 64,576,896.
The share capital is composed of:
No-par value shares
Nominal value in EUR
Ordinary shares 16,472,200 42,168,832 Non-voting preference shares 8,753,150 22,408,064 Balance at 30 June 2009 25,225,350 64,576,896
The Annual General Meeting authorised the Company on 30 June 2009, as specified in
the proposed resolution, to acquire ordinary bearer shares and/or preference bearer
shares of the Company in the amount of up to 10% of the Company’s share capital at
the time of the authorisation in the period up to 29 December 2010. The authorisation
has not been used to date.
Sixt Aktiengesellschaft
23
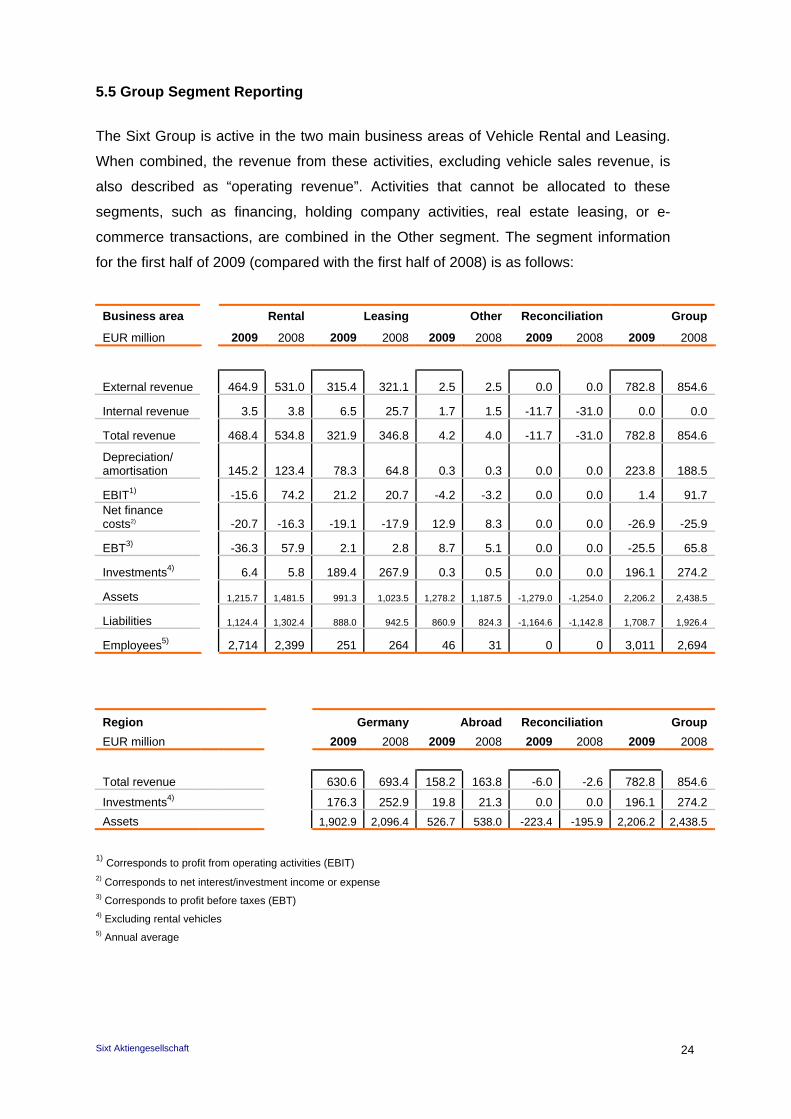
5.5 Group Segment Reporting
The Sixt Group is active in the two main business areas of Vehicle Rental and Leasing.
When combined, the revenue from these activities, excluding vehicle sales revenue, is
also described as “operating revenue”. Activities that cannot be allocated to these
segments, such as financing, holding company activities, real estate leasing, or e-
commerce transactions, are combined in the Other segment. The segment information
for the first half of 2009 (compared with the first half of 2008) is as follows:
Business area Rental Leasing Other Reconciliation Group
EUR million 2009 2008 2009 2008 2009 2008 2009 2008 2009 2008
External revenue 464.9 531.0 315.4 321.1 2.5 2.5 0.0 0.0 782.8 854.6
Internal revenue 3.5 3.8 6.5 25.7 1.7 1.5 -11.7 -31.0 0.0 0.0
Total revenue 468.4 534.8 321.9 346.8 4.2 4.0 -11.7 -31.0 782.8 854.6
Depreciation/ amortisation 145.2 123.4 78.3 64.8 0.3 0.3 0.0 0.0 223.8 188.5
EBIT1) -15.6 74.2 21.2 20.7 -4.2 -3.2 0.0 0.0 1.4 91.7Net finance costs2) -20.7 -16.3 -19.1 -17.9 12.9 8.3 0.0 0.0 -26.9 -25.9
EBT3) -36.3 57.9 2.1 2.8 8.7 5.1 0.0 0.0 -25.5 65.8
Investments4) 6.4 5.8 189.4 267.9 0.3 0.5 0.0 0.0 196.1 274.2
Assets 1,215.7 1,481.5 991.3 1,023.5 1,278.2 1,187.5 -1,279.0 -1,254.0 2,206.2 2,438.5
Liabilities 1,124.4 1,302.4 888.0 942.5 860.9 824.3 -1,164.6 -1,142.8 1,708.7 1,926.4
Employees5) 2,714 2,399 251 264 46 31 0 0 3,011 2,694
Region Germany Abroad Reconciliation Group
EUR million 2009 2008 2009 2008 2009 2008 2009 2008
Total revenue 630.6 693.4 158.2 163.8 -6.0 -2.6 782.8 854.6
Investments4) 176.3 252.9 19.8 21.3 0.0 0.0 196.1 274.2
Assets 1,902.9 2,096.4 526.7 538.0 -223.4 -195.9 2,206.2 2,438.5
1) Corresponds to profit from operating activities (EBIT) 2) Corresponds to net interest/investment income or expense 3) Corresponds to profit before taxes (EBT) 4) Excluding rental vehicles 5) Annual average
Sixt Aktiengesellschaft
24
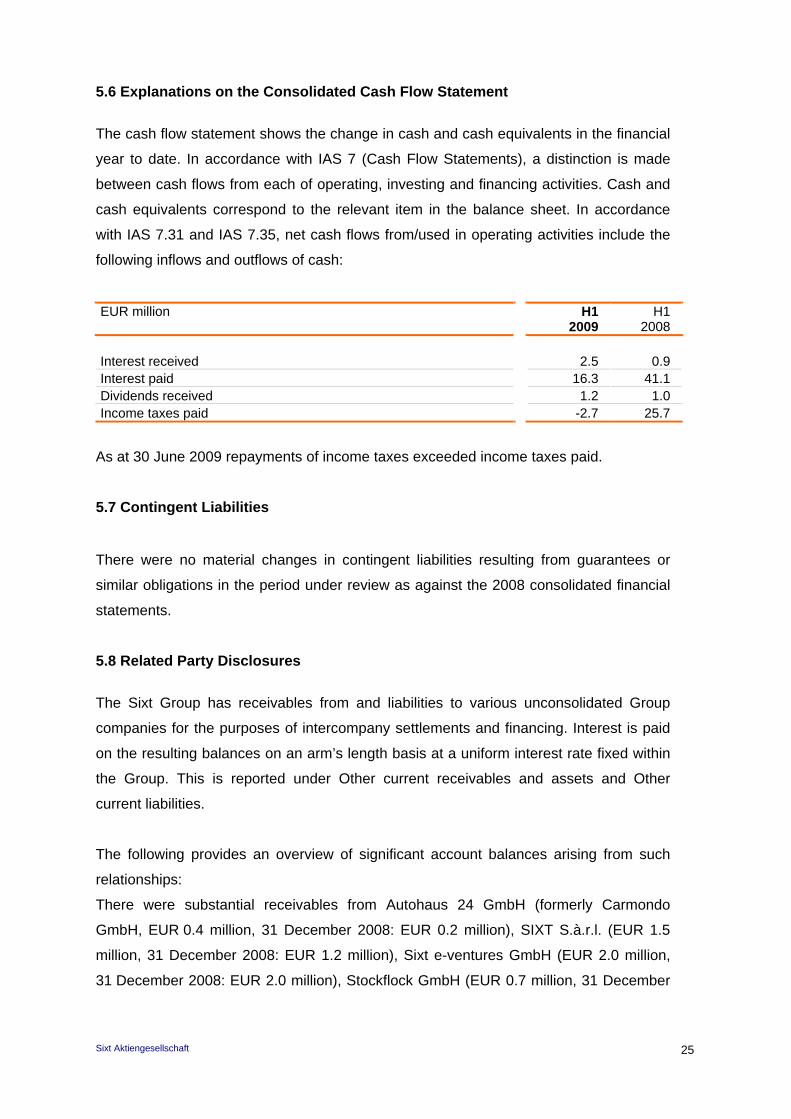
5.6 Explanations on the Consolidated Cash Flow Statement
The cash flow statement shows the change in cash and cash equivalents in the financial
year to date. In accordance with IAS 7 (Cash Flow Statements), a distinction is made
between cash flows from each of operating, investing and financing activities. Cash and
cash equivalents correspond to the relevant item in the balance sheet. In accordance
with IAS 7.31 and IAS 7.35, net cash flows from/used in operating activities include the
following inflows and outflows of cash:
EUR million H1 2009
H1 2008
Interest received 2.5 0.9 Interest paid 16.3 41.1 Dividends received 1.2 1.0 Income taxes paid -2.7 25.7
As at 30 June 2009 repayments of income taxes exceeded income taxes paid.
5.7 Contingent Liabilities
There were no material changes in contingent liabilities resulting from guarantees or
similar obligations in the period under review as against the 2008 consolidated financial
statements.
5.8 Related Party Disclosures
The Sixt Group has receivables from and liabilities to various unconsolidated Group
companies for the purposes of intercompany settlements and financing. Interest is paid
on the resulting balances on an arm’s length basis at a uniform interest rate fixed within
the Group. This is reported under Other current receivables and assets and Other
current liabilities.
The following provides an overview of significant account balances arising from such
relationships:
There were substantial receivables from Autohaus 24 GmbH (formerly Carmondo
GmbH, EUR 0.4 million, 31 December 2008: EUR 0.2 million), SIXT S.à.r.l. (EUR 1.5
million, 31 December 2008: EUR 1.2 million), Sixt e-ventures GmbH (EUR 2.0 million,
31 December 2008: EUR 2.0 million), Stockflock GmbH (EUR 0.7 million, 31 December
Sixt Aktiengesellschaft
25
2008: EUR 0.6 million), Sixt Verw.ges. mbH & Co. Sita Immobilien GmbH (EUR 0.2
million, 31 December 2008: EUR 0.1 million).
Substantial liabilities were recognised in respect of Sixt Aéroport SARL (EUR 0.2 million,
31 December 2008: EUR 0.2 million), Sixt Sud SARL (EUR 0.3 million, 31 December
2008: EUR 0.3 million), Sixti SARL (EUR 0.3 million, 31 December 2008: EUR 0.3
million), United rentalsystem SARL (EUR 0.2 million, 31 December 2008: EUR 0.1
million), Sixt GmbH (EUR 0.1 million, 31 December 2008: EUR 0.2 million) and Sixt Nord
SARL (EUR 0.2 million, 31 December 2008: EUR 0.1 million). The volume of
transactions with these related parties is insignificant. They are conducted at arm’s
length and result from the normal course of business.
The Group rents two properties belonging to the Sixt family for its operations. Rental
expenses in the period from January to June 2009 were less than EUR 0.1 million, as in
the prior-year period. For his services as Chairman of the Managing Board, Erich Sixt
receives remuneration which, in accordance with the resolution adopted by the Annual
General Meeting on 14 July 2005, is not published individually.
As at 30 June 2009, Erich Sixt Vermögensverwaltung GmbH, all shares of which are
held by the Sixt family, held an unchanged 56.8% (9,355,911 shares) of the ordinary
shares of Sixt Aktiengesellschaft.
6. Responsibility Statement
Responsibility statement in accordance with section 37y of the Wertpapierhandelsgesetz
(WpHG – German Securities Trading Act) in conjunction with section 37w(2) no. 3 of the
WpHG
“To the best of our knowledge, and in accordance with the applicable reporting principles
for interim financial reporting, the interim consolidated financial statements give a true
and fair view of the assets, liabilities, financial position and profit or loss of the Group,
and the interim management report of the Group includes a fair review of the
development and performance of the business and the position of the Group, together
with a description of the principal opportunities and risks associated with the expected
development of the Group for the remaining months of the financial year.”
Pullach, 18 August 2009
Sixt Aktiengesellschaft
The Managing Board
Sixt Aktiengesellschaft
26
Sixt Aktiengesellschaft
27
Contact:
Sixt Aktiengesellschaft
Zugspitzstrasse 1
82049 Pullach
Germany
Phone +49 (0)89/ 7 44 44 - 5104
Fax +49 (0)89/ 7 44 44 - 85104
www.sixt.com
Reservation Centre
+49 (0) 180/5 25 25 25 (€0.14/min. from the German fixed-line network. Mobile phone costs may vary.)
Published by:
Sixt Aktiengesellschaft
Zugspitzstrasse 1
82049 Pullach
Germany