Embed Size (px)
Citation preview
WE OFFER LONG-TERM
SAVINGS AND FINANCIAL SECURITY IN
ALL STAGES OF LIFE
WE HAVE BEEN DOING
THIS FOR DECADES WITH PROVEN GOOD
RESULTS
TO 1.
3 M
IL-
LIO
N C
UST
OM
ERS
IN VA
RIO
US
STAG
ES OF LIFE
Skandia Liv annual report2008
PROTECTION
PENSIONS
INVESTMENTS
HEALTHCARE
eBANKING
SOLUTIONS
GroupA Member of the
board
p.12
accounts
p.32
p.31
five-year overview
Skandia Liv is one of Sweden’s largest life assurance companies. We are active in both private and occupational pensions and at year-end had SEK 253 billion in assets under management for some 1.3 million customers.
Skandia Liv is a wholly owned subsidiary of Skandia, which has been a member of the London-based Old Mutual financial services group since 2006. Operationally, Skandia Liv is part of Skandia’s Nordic division.
Skandia Liv is run on a mutual basis, which means that the result of the company’s operations accrues to the policyholders.
Skandia Liv’s 2008 Annual Report and Corporate Governance Report can be downloaded from Skandia Liv’s website, skandia.se/liv.
contentschief executive’s messa¯e ...............................................2
business reviewour ¯uarantees prevail .................................................4
well equipped to continue offering our 1.3 million customers security in their savin¯s ...........................6
corporate ¯overnancecomposition and work of the board of directors ...9Skandia Liv’s board .................................................... 12Skandia Liv’s mana¯ement ....................................... 14
financial statementsboard of directors’ report ......................................... 16five-year overview ......................................................... 31total return ................................................................... 31income statement ...................................................... 32performance analysis for the parent company .... 33balance sheet ............................................................. 34equity ........................................................................... 36cash f low statement .................................................. 37proposed distribution of prof it ............................. 38notes ............................................................................ 39reconciliation of return in total return table a¯ainst f inancial statements ................................... 64auditors’ report .......................................................... 66¯lossary ........................................................................ 67contacts and information ......................................... 68
0
50
100
150
200
2004 2005 2006 2007 2008
Solvency
%
0
30
60
90
120
2004 2005 2006 2007 2008
Collective funding ratio
%
year at a ¯lance
Bonus rate
Date
1/1/2008 6.0 %
1/2/2008 3.0 %
1/9/2008 1.0 %
1/11/2008 0.0 %
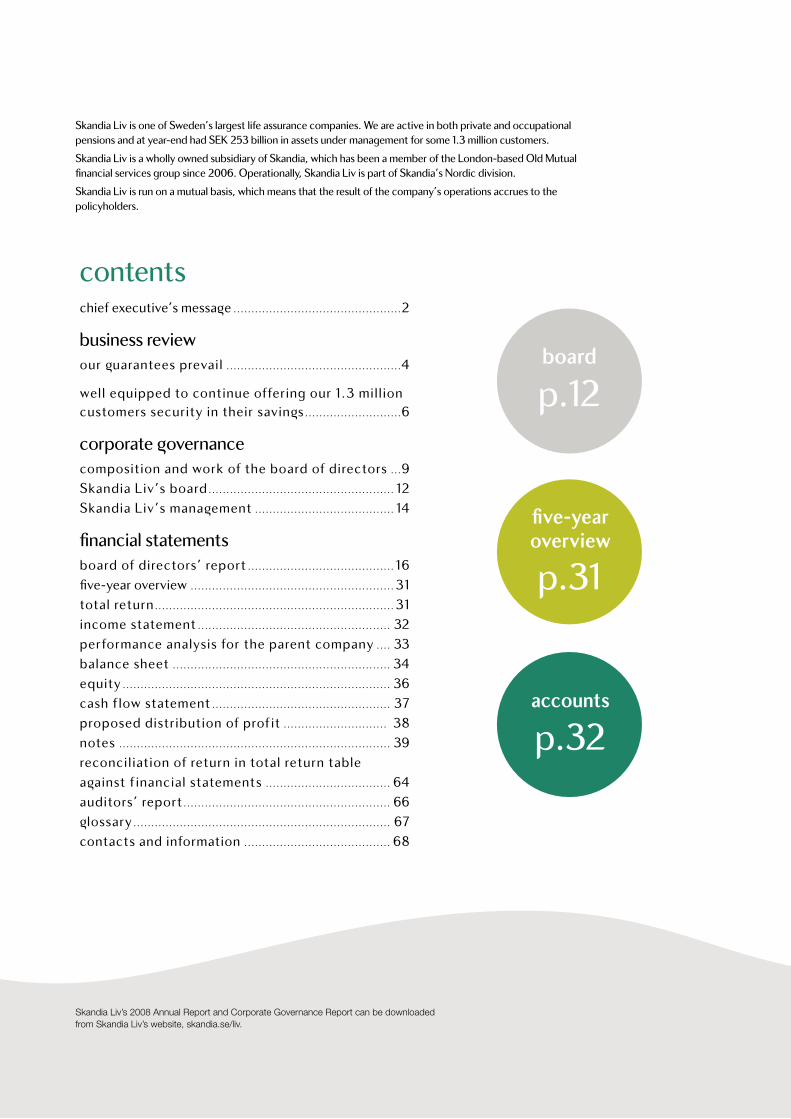
During the year, Skandia Liv changed its accounting principles for calculating technical provisions. For an explanation of the changes, see p. 22. Key ratios affected by these changes have been updated.
result
-82billion kronorThe result for 2008 was SEK -82 billion (25).
market share
17.7%The market share for new business in the market for other life assurance was 17.7% (22.0%).
total return
-13.4%Skandia Liv’s total return was -13.4% (4.4%).
solvency
127%Skandia Liv’s solvency level at year-end 2008.
collective funding ratio
91%Skandia Liv’s collective funding ratio at year-end.
bonus rate
0%The bonus rate was adjusted three times in 2008 and averaged 2.4% for the year.
1
year at a ¯lance
Skandia Liv’s average bonus rate for the last 15 years was 8.5%. The bonus rate is how we allocate preliminary surpluses to the policyholders and is designed to smoothen out returns over time.
8.5%
chief executive’s messa¯e
2
who can you depend on?
It’s been a turbulent year. Like our customers’ insurance capital, Skandia Liv has felt the effects of the current financial crisis, which has put the entire global economy to an immense test.
Despite our efforts to moderate the fluctuations, like other companies we expect that we may be forced to take extraordinary action, including a one-time reduction of policyholders’ insurance capital. However, we can also say that Skandia Liv – with a comforta-ble margin – can continue to guarantee the amounts that we have promised our policyholders. Through a highly refined asset management strategy, we can reduce the effects created by fluctua-tions in the economy and take advan-tage of the opportunities that they create. I think it is important to keep in mind that traditional life assurance is a form of long-term savings. Viewed over many years, our policyholders have enjoyed favourable returns.
success despite tou¯h conditionsDespite the financial crisis, Skandia Liv has had some bright spots. Our sales have risen, especially in the corporate segment, and we have made improve-ments in our customer service.* We owe this to a greater level of efficiency and our success at offering the right products. We see this as a confirmation of our customers’ confidence in our ability to deliver good results, which strengthens our competitiveness. This is just a small sparkle of success in a year that was otherwise burdened by the deep financial crisis.
This is not to say that we will be easing off. We know that we will have to perform at our utmost in order to deliver the goals that we have set. If we succeed at this, then we have great opportunities to confirm our position as one of the leading life assurance companies in the Nordic region.
demutualisation study be¯un During the year, a number of preparations were made to look into the opportu-nity of converting Skandia Liv from a company that is run on a mutual basis to a company that may distribute profits to its owners. This is an important process that will continue in 2009, and the goal is to create even better conditions for Skandia Liv’s policyholders. If this work culmi-
nates with a demutualisation proposal, in the end it will be the policyholders who decide if it is carried out. Such a proposal will only be presented if we are convinced that a demutualisation will be beneficial to our policyholders.
our policyholders reimbursed by SEK 870 millionThe previous dispute between Skandia Liv and the parent company Skandia came to a resolution during the year. The dispute concerned the improper transfer of profits in connection with Skandia’s sale of its asset management business to Den norske Bank (DnB NOR). For Skandia Liv, the settlement resulted in the payment of SEK 870 million in compensation to the com-pany in 2008. During the remaining term of the agreement (through 2013), an addition al SEK 450-600 million will be repaid to Skandia Liv. The money is now where it should be – with the policyholders.
with size comes responsibilityWe will continue to offer the best products. It is not through words or beating our chests that we will achieve this, but through action. We will keep our promises. Our new sales are strong, and many people contin-ue to choose Skandia Liv. But it is equally important that we take care
’’* According to a survey conducted by Investigo in spring 2008.
chief executive’s messa¯e
3
of our existing customers. Insurance products are complicated by nature, which is why taking a pedagogical approach to our offering is a major challenge. Accordingly, during the year we dedicated considerable effort to improving our customer service and communication in all areas. Our regu-larly recurring customer surveys show that we have made good progress. A great deal remains to be done, and our work will be intensified in 2009.
Skandia Liv is one of Sweden’s larg-est life assurance companies. Natur-ally, this is a great responsibility that we take very seriously. Our size gives us many advantages. We have a robust investment portfolio and the market’s broadest range of products. More-over, we have the ability to endure and deliver good results in an industry in which long-term focus is decisive. Our size and financial position allow us to honour the guarantees that we have made. Size is important.
our development continuesThe autumn of 2008 was a strain – not only for Skandia Liv and our customers, but for society as a whole. Even if the situation stabilises in 2009, the finan-cial markets will continue to be under immense pressure. For Skandia Liv, this means that the extensive cost-cutting programme that we have begun will con-
’’
I think it is important to keep in mind that traditional life assurance is a form of lon¯-term savin¯s. Viewed over many years, our policyholders have enjoyed favourable returns.
tinue. Increased co-operation between Skandia Liv and Skandia will be a key suc-cess factor, where the overarching goal is to achieve a more customer-oriented way of working.
We are currently facing a year in which security and spread of risk are at the top of the agenda. We understand that many people wonder who they can really depend on. On that point, my message is clear. You can depend on Skandia Liv.
With that, I and my colleagues at Skandia Liv would like to extend our heartfelt thanks for the past year. I pro-mise that we will do everything we can to ensure that we continue to be the best and most secure choice for our customers – new as well as old.
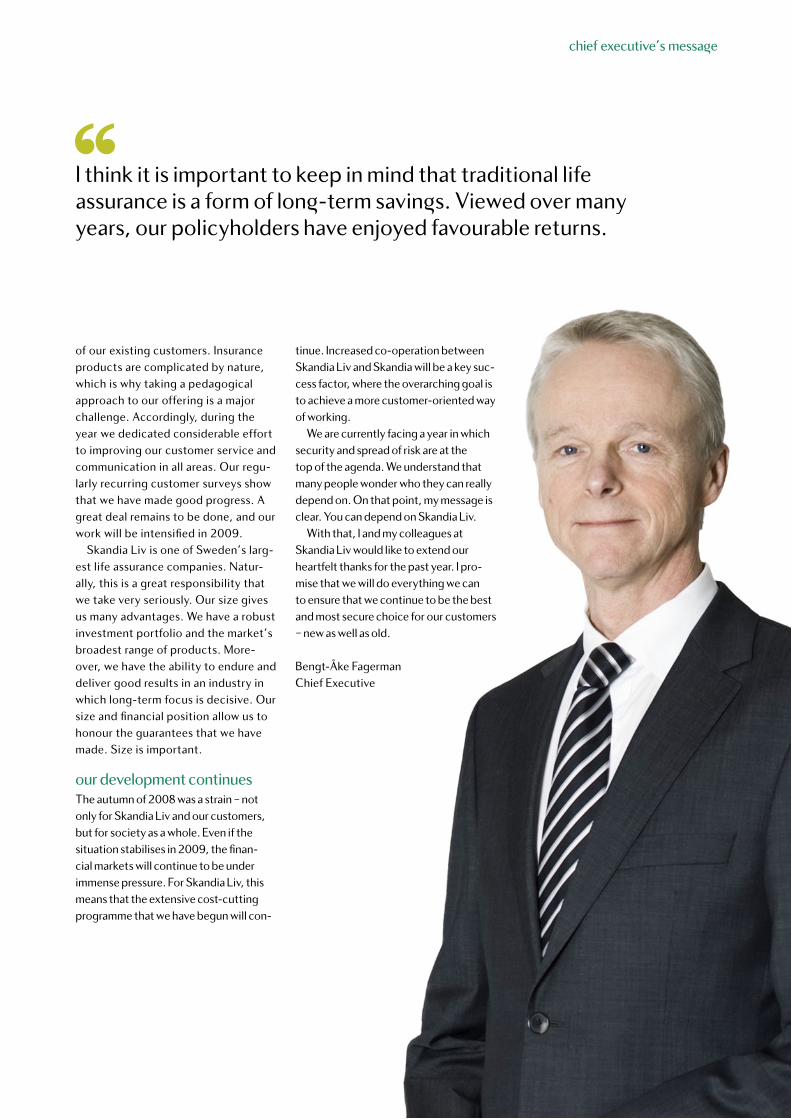
Bengt-Åke FagermanChief Executive
business review
4
our ¯uarantees prevail
Making guarantees is easy. The trick is in being able to honour them. The guarantees made by Skandia Liv rest on a solid financial foundation and good solvency level. It is comforting for our customers to know that regardless of when they save towards their life assur-ance and what happens in the market, their guaranteed benefits will be paid out the day they retire. This guarantee provides a reassuring shield against the type of financial anxiety that we have witnessed during the past year.
¯ood solvency ̄ ives freedom to manoeuvreSolvency is an important metric for a life assurance company. The solvency level shows the value of our total net
promised to pay out to our customers the day they retire are not affected by a reallocation. The dramatic fall on the world’s stock markets in 2008 has brought the reallocation issue into the spotlight. Any decision on a realloca-tion would be made by Skandia Liv’s board following an extensive analysis.
smoother peaks and valleysWe know that the situation that we witnessed in 2008 can occur again. At Skandia Liv we can withstand tempo-rary times of uncertainty as well as more prolonged economic downturns. Tra-ditional pension insurance smoothens out the effects of peaks and valleys in the financial market. The bonus rate is changed when needed and is used to smoothen fluctuations in investment returns. In this way, policyholders can enjoy low risk at the same time that their anticipated return can be kept at a high level. This is a key difference compared with other types of saving. Together with the guaranteed return as a foundation, this is a secure model in troubling times.
active work on stren¯thenin¯ protection for policyholdersSkandia Liv is working continuously on developing better products. An important part of this work entails being able to perform more extensive risk anal-yses. During the year we continued our involvement in the work with Solvency II, an EU project that is aimed at creating a more stable and effective insurance
’’
assets compared to the value of what we have promised our customers in the form of future, guaranteed benefits. Our solvency level fell during the year. Yet in view of the general financial situation, Skandia Liv has a good solvency level. It gives us freedom to manoeuvre as we invest our policyholders’ money, by allowing us to choose assets with a high anticipated return.
Skandia Liv’s customers generally have a long-term investment horizon. This means that the ability to invest in assets with a high anticipated return has major significance for the value of their policies over time.
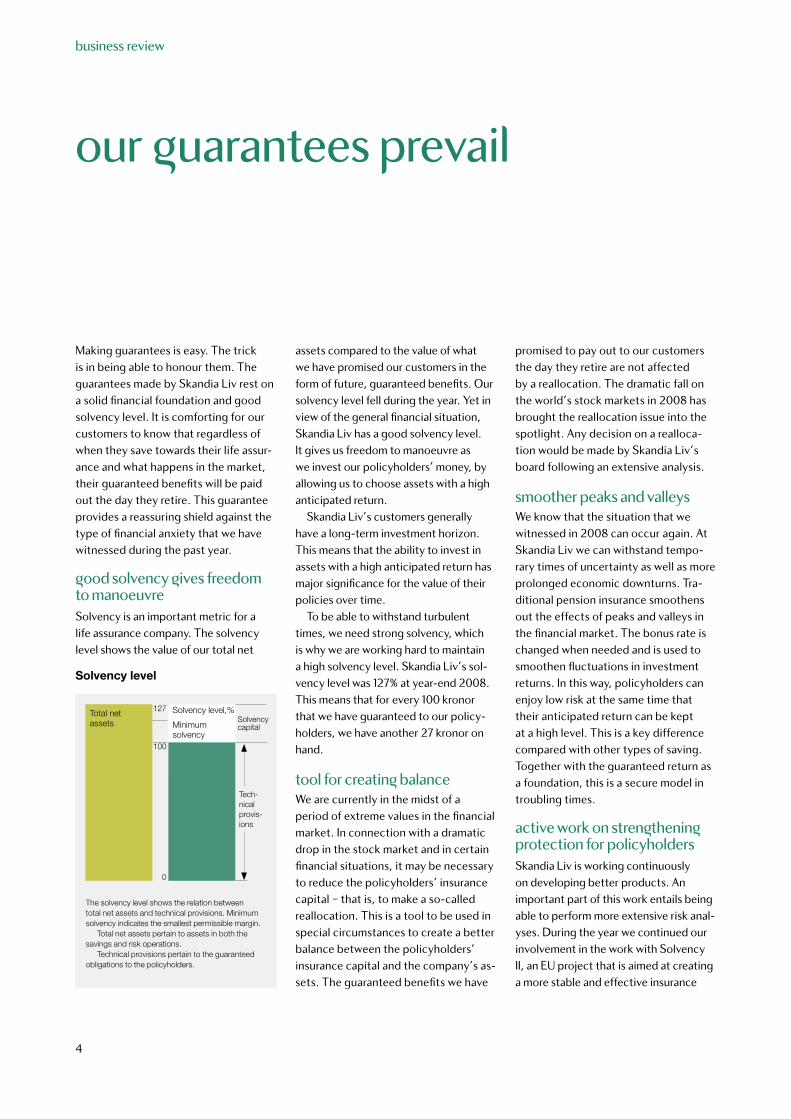
To be able to withstand turbulent times, we need strong solvency, which is why we are working hard to maintain a high solvency level. Skandia Liv’s sol-vency level was 127% at year-end 2008. This means that for every 100 kronor that we have guaranteed to our policy-holders, we have another 27 kronor on hand.
tool for creatin¯ balanceWe are currently in the midst of a period of extreme values in the financial market. In connection with a dramatic drop in the stock market and in certain financial situations, it may be necessary to reduce the policyholders’ insurance capital – that is, to make a so-called reallocation. This is a tool to be used in special circumstances to create a better balance between the policyholders’ insurance capital and the company’s as-sets. The guaranteed benefits we have
Solvency level
The solvency level shows the relation between total net assets and technical provisions. Minimum solvency indicates the smallest permissible margin.
Total net assets pertain to assets in both the savings and risk operations.
Technical provisions pertain to the guaranteed obligations to the policyholders.
Solvency level,%Total net assets
100
127
0
Minimumsolvency
Solvency capital
Tech-nical provis-ions
business review
5
’’
Skandia Liv’s customers ̄ enerally have a lon¯-term invest-ment horizon. This means that the ability to invest in assets with a high anticipated return has major si¯nificance for the value of their policies over time.
market. Among other things, the project is creating uniform and stronger protec-tion for policyholders in the EU as well as better methods for measuring risk. The establishment and participation in Solvency II are a priority project at Skandia Liv.
we listen to our customersInterest is growing in the type of guaran-tee products that Skandia Liv offers.
We know that the recent financial turbu-lence can make many people sceptical about the financial system. An important task for us at Skandia Liv is therefore to actively work for openness and clarity in communication with our customers. We will describe what we do, how we do it, and why. This is why we are constantly working on improving the dialogue we have with our customers. We are a large-scale insurer, we are financially strong,
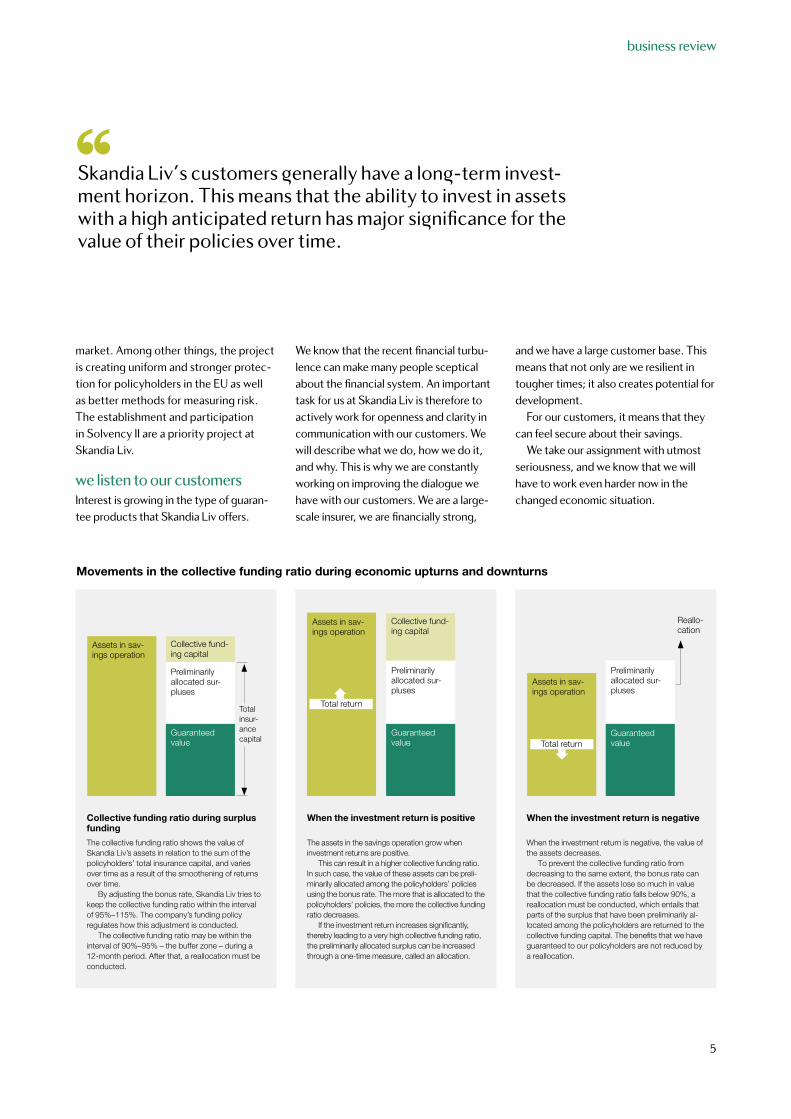
Movements in the collective funding ratio during economic upturns and downturns
and we have a large customer base. This means that not only are we resilient in tougher times; it also creates potential for development.
For our customers, it means that they can feel secure about their savings.
We take our assignment with utmost seriousness, and we know that we will have to work even harder now in the changed economic situation.
When the investment return is negative
When the investment return is negative, the value of the assets decreases.
To prevent the collective funding ratio from decreasing to the same extent, the bonus rate can be decreased. If the assets lose so much in value that the collective funding ratio falls below 90%, a reallocation must be conducted, which entails that parts of the surplus that have been preliminarily al-located among the policyholders are returned to the collective funding capital. The benefits that we have guaranteed to our policyholders are not reduced by a reallocation.
Reallo-cation
Preliminarily allocated sur-pluses
Assets in sav-ings operation
Guaranteed valueTotal return
Collective funding ratio during surplus funding
The collective funding ratio shows the value of Skandia Liv’s assets in relation to the sum of the policyholders’ total insurance capital, and varies over time as a result of the smoothening of returns over time.
By adjusting the bonus rate, Skandia Liv tries to keep the collective funding ratio within the interval of 95%–115%. The company’s funding policy regulates how this adjustment is conducted.
The collective funding ratio may be within the interval of 90%–95% – the buffer zone – during a 12-month period. After that, a reallocation must be conducted.
Collective fund-ing capital
Preliminarily allocated sur-pluses
Assets in sav-ings operation
Guaranteed value
Total insur-ance capital
Åter-bärings- ränta
When the investment return is positive
The assets in the savings operation grow when investment returns are positive.
This can result in a higher collective funding ratio. In such case, the value of these assets can be preli-minarily allocated among the policyholders’ policies using the bonus rate. The more that is allocated to the policyholders’ policies, the more the collective funding ratio decreases.
If the investment return increases significantly, thereby leading to a very high collective funding ratio, the preliminarily allocated surplus can be increased through a one-time measure, called an allocation.
Kollektivt konsoliderings- kapital
Preliminarily allocated sur-pluses
Assets in sav-ings operation
Guaranteed value
Collective fund-ing capital
Total return
business review
6
The ̄ lobal financial crisis is not leavin¯ anyone unaffected. Moreover, the crisis appears to be deeper and more complex than what many market watchers had anticipated.
well equipped to continue offerin¯ our 1.3 million policy-holders security in their savin¯s
Skandia Liv’s asset management is conducted with a distinct focus. We strive to offer long-term, secure savings with a high, stable return to our policyholders. And we have succeeded in doing that. The total return for the last 15 years has averaged 7.2%. Despite a stock market decline of major proportions, we have a good level of solvency in our operations. This makes us well equipped to continue our assignment of offering our 1.3 million policyholders security in their savings.
prepared – but not unaffectedThe global financial crisis has not left anyone unaffected. Moreover, the crisis appears to be deeper and more complex than what many market watchers had anticipated. But there is a difference between being unaffected and unpre-pared. Skandia Liv has worked in the capital market for decades. We have been through both ups and downs. It is with that experience that we now take on the new financial situation. This, combined with a stable financial foundation and the ability to make investments with a long time horizon, means that despite the grim situation, we see great opportunities for our pension-savers. Our asset manage-
ment strategy, with a broad spread of risk based on a large number of asset classes in markets around the world, gives the asset portfolio built-in resilience against fluctuations in the market. Unfortunately, 2008 turned out to be a year when good spread of risk did not pay off very well, and the return for the year was –13.4%. To be able to develop even during a down-turn, a way of thinking that challenges traditional notions is needed. And that is precisely what our asset management strategy is based on. Because our asset management is anything but traditional.
unsentimental asset mana¯ement strate¯yOur asset management is based on the insight that it is difficult to be best at everything. Our strategy entails that we decide on the orientation and structure of our asset management, but delegate the selection of which assets are to be included in the portfolio to the asset managers who have the best prospects for getting the money to grow. Ac-cordingly, in addition to our own asset management organisation, Skandia Liv co-operates with more than 50 carefully chosen asset managers around the world.
These managers work according to clear directives and are continuously evaluated on the basis of the results they deliver. This is an “unsentimental” form of asset management, which means that it is results that determine who makes the in-vestments, not relationships. It also gives us an opportunity to take advantage of investment opportunities that would be lost in a traditional form of management. This is a more sophisticated and modern approach to asset management. And it has made us one of the leading traditional life companies in Sweden.
size ̄ ives a ran¯e of optionsAll asset management is about managing risks. To achieve maximum effect at a given level of risk, investments must be spread out. All our eggs must be put in different baskets. By virtue of our size, we can choose from a greater number of as-set classes and markets than many of our competitors. This means that we spread our risks at the same time that we can take advantage of the opportunities that arise along the way.
Naturally, this gives us a clear advan-tage, especially when the global financial markets are teetering. Due to the large
’’
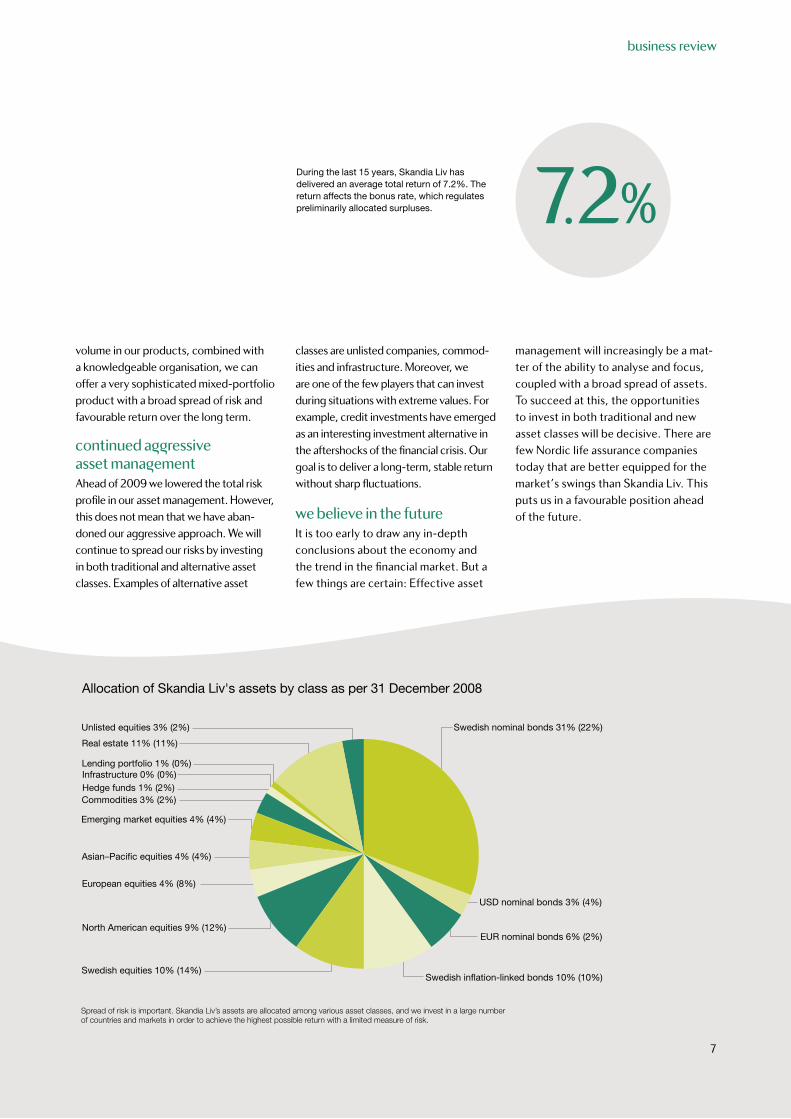
Allocation of Skandia Liv's assets by class as per 31 December 2008
Unlisted equities 3% (2%) Swedish nominal bonds 31% (22%)
Real estate 11% (11%)
Emerging market equities 4% (4%)
Commodities 3% (2%)Hedge funds 1% (2%)Infrastructure 0% (0%)Lending portfolio 1% (0%)
North American equities 9% (12%)
European equities 4% (8%)
Swedish equities 10% (14%)Swedish inflation-linked bonds 10% (10%)
EUR nominal bonds 6% (2%)
Asian–Pacific equities 4% (4%)
USD nominal bonds 3% (4%)
Spread of risk is important. Skandia Liv’s assets are allocated among various asset classes, and we invest in a large number of countries and markets in order to achieve the highest possible return with a limited measure of risk.
business review
7
volume in our products, combined with a knowledgeable organisation, we can offer a very sophisticated mixed-portfolio product with a broad spread of risk and favourable return over the long term.
continued a¯¯ressive asset mana¯ementAhead of 2009 we lowered the total risk profile in our asset management. However, this does not mean that we have aban-doned our aggressive approach. We will continue to spread our risks by investing in both traditional and alternative asset classes. Examples of alternative asset
classes are unlisted companies, commod-ities and infrastructure. Moreover, we are one of the few players that can invest during situations with extreme values. For example, credit investments have emerged as an interesting investment alternative in the aftershocks of the financial crisis. Our goal is to deliver a long-term, stable return without sharp fluctuations.
we believe in the futureIt is too early to draw any in-depth conclusions about the economy and the trend in the financial market. But a few things are certain: Effective asset
management will increasingly be a mat-ter of the ability to analyse and focus, coupled with a broad spread of assets. To succeed at this, the opportunities to invest in both traditional and new asset classes will be decisive. There are few Nordic life assurance companies today that are better equipped for the market’s swings than Skandia Liv. This puts us in a favourable position ahead of the future.
During the last 15 years, Skandia Liv has delivered an average total return of 7.2%. The return affects the bonus rate, which regulates preliminarily allocated surpluses. 7.2%

We will continue to offer the best products. We will achieve this not throu¯h words or boastin¯, but throu¯h action. We will keep our promise.
WHEN WE GROW OLDER,
WE RECEIVE CONFIRMATION OF THE
CHOICES WE'VE MADE WHEN WE WERE YOUNG.
A GOOD CHOICE IS AN ASSET MANAGER:
THAT KEEPS
ITS PROMISE
THAT IS
EXPERIENCED
WH
O C
AR
ES
AB
OU
T Y
OU
R S
ITU
ATIO
N WH
O Y
OU
CA
N
ALW
AYS T
RUST
AND WHO GENERATES GOOD
GROWTH IN YOUR MONEY
SKANDIA LIV'S POLICYHOLDERS TYPICALLY
HAVE A VERY LONG-TERM INVESTMENT HORIZON.
THIS MAKES OUR INVESTMENTS RESILIENT TO ECONOMIC
UPTURNS AND DOWNTURNS AND HELPS YOUR MONEY GROW
UNTIL THE DAY
YO
U REA
LLY N
EED IT.
9
corporate ¯overnance
composition and work of the board
the companyLivförsäkringsaktiebolaget Skandia (Skandia Liv) is a Swedish, public limited liability company with its registered office in Stockholm, Sweden. Skandia Liv is a subsidiary of Skandia Insurance Company Ltd (Skandia), which is a member of the Old Mutual Group. Since Skandia Liv’s policyholders bear the risk capital in the company and the company is not permitted to distribute profits to its owner, a number of special rules are in place to safeguard the policyholders’ interests.
Governance of the company and its subsidiaries is conducted on the basis of the Swedish Insurance Business Act (with special rules for so-called hybrid companies like Skandia Liv), the company’s Articles of Association, the guidelines adopted by the Board on conflicts of interest, a corporate gover-nance policy that is adopted by Skandia Liv’s Annual General Meeting, and other governance guidelines. Agree-ments between Skandia Liv and its parent company also have significance for the company’s governance.
re¯ulatory frameworkThe Swedish Insurance Business Act is the most important regulatory frame-work with respect to the company’s governance. It contains rules that correspond to the directives of the Swedish Companies Act for ordinary limited liability companies as well as special rules designed to protect the policyholders.
Skandia Liv’s business is conducted on a mutual basis, which means among
other things that the result of opera-tions accrues to the policyholders. In many cases, the law gives the Swedish Financial Supervisory Authority the right to issue binding regulations for insurance companies. The Financial Su-pervisory Authority also issues general recommendations for governance and control of financial companies. Skandia Liv’s Articles of Association stipulate that Skandia Liv may not distribute profits to its owner. The Articles of Association include rules on the Board’s composition that correspond to the sta-tutory rules requiring a majority of in-dependent directors, of whom one shall be a policyholder representative who is not elected by a general meeting of shareholders. The corporate governan-ce policy that is ratified by the Annual General Meeting states, among other things, that the company shall have a chief executive who is employed full-time and that certain functions, such as the actuary and legal affairs functions, shall be handled independently. Accor-ding to this policy, operation of certain businesses shall be conducted jointly, to the extent that the boards of Skandia and Skandia Liv deem it suitable. The corporate governance policy stipulates, among other things, that Skandia Liv shall provide insurance products with a financial security profile that offer long-term savings with a guar antee or financial security in the event of illness, accident and death. Returns shall be allocated among the policyholders in a reasonable manner. In 2003 Skandia Liv’s board adopted strict and detailed guidelines for transactions and other
relations between Skandia Liv and Skandia. A legal requirement was sub-sequently made that all life companies that are barred from distributing profits to their owners shall have guidelines of this type.
In autumn 2004 Skandia Liv and Skandia reached an agreement in prin-ciple as well as a framework agreement on their co-operation. The principles for the framework agreement are laid out in detail in various outsourc-ing agreements with Service Level Agreements for the individual functions covered by the co-operation. A clear process is in place for ensuring that the division of responsibility in this co- operation is clear and that guidelines and processes are followed up. In addi-tion to this internal regulatory frame-work are a number of internal policies and guidelines that govern operations.
Skandia Liv adheres to the Swedish Code of Corporate Governance in all applicable respects.
¯eneral shareholder meetin¯sSkandia Liv’s parent company, Skandia, owns all of the shares in Skandia Liv and decides at general shareholder meetings. Since there is only one shareholder, no nominating committee has been appoint-ed. General shareholder meetings are Skandia Liv’s highest governing body. At the Annual General Meeting (AGM), the company’s income statement and balance sheet are adopted, two auditors are elected, and the members of the Board of Directors are elected (except for a policyholder representative and the employee representatives).
10
Decisions are also made on directors’ and auditors’ fees. The AGM decides whether the operating result is to be trans-ferred to or deducted from the funding reserve (a reserve containing the policy-holders’ surplus funds, which constitutes the company’s equity, i.e., risk capital). The decision-making authority of the AGM rests – as mentioned – with Skandia, as Skandia Liv’s sole shareholder.
The Board of Skandia approves Skandia Liv’s strategy and business plan within the business planning framework of Skandia’s Nordic division. The AGM thereafter adopts the business plan.
board of directorsAccording to the Insurance Business Act, the Board is responsible for the company’s organisation and manage-ment. The Board sets Skandia Liv’s strategic direction, appoints the Chief Executive and adopts policies, guidelines and instructions. The Board is responsible for ensuring that suitable internal rules are in place for risk manage ment and risk control. In connection with the development of the business strategy, the Board has performed a risk analysis.
The Board’s duties include ensur-ing that there is satisfactory control over the company’s bookkeeping and treasury management. The Board continuously monitors the performance of Skandia Liv’s business, financial results and asset management. To assist it in this monitoring, the Board has its own, independent internal audit unit which reports directly to the Board.
The Board also handles matters related to guidelines on employee benefits at Skandia Liv and its subsidiaries, and it decides on salaries and other benefits for the company’s chief executive and head of internal audit.
The Board’s general decision-making authority is restricted by the general meeting’s exclusive decision-making authority on certain matters and the opportunity to decide on other mat-ters that are not expressly part of the Board’s or Chief Executive’s responsi-bility. Decisions may not entail the transfer of value from Skandia Liv wit-hout pure commercial value for Skandia Liv. According to the Insurance Business Act, more than half of the directors on the board of a mutually operated insu-rance company must be independent. By independent director is meant per-sons who are neither employed by the company nor employees or directors of companies included in the same group as the company or equivalent company grouping.
Skandia Liv’s board currently has eleven directors, of whom seven includ -ing the Chairman are independent. The status of the respective directors is reported in the presentation of each director in Skandia Liv’s annual report and corporate governance report. Eight of the Board’s directors, includ-ing the Chairman, are elected by the Annual General Meeting. One director is appointed by a special policyholder committee. The Board also includes two employee representatives, who by law are appointed by the unions.
corporate ¯overnance
Skandia Liv is bound by a special rule in the Insurance Business Act pertaining to disqualification at board meetings. This rule entails that when contracts and disputes between Skandia Liv and its parent company are taken up for consideration by the Board, directors with ties to the parent company may not participate. Skandia Liv’s Chief Executive is co-opted to the Board at board meetings.
audit committeeThe Board’s audit committee contin-uously monitors auditing work within Skandia Liv and its subsidiaries. The committee also deals with all essential accounting matters and financial reports issued by the company. Further, the committee is a forum for collabora-tion with and between the company’s internal and external audit functions. Through its work, the Audit Committee strives to ensure satisfactory internal control, especially of financial reporting within the company, and thus a set of procedures is in place that is well in compliance with the Financial Super-visory Authority’s general guidelines on governance and control of financial companies. The Finance unit, Internal Audit and the Risk Management and Risk Control unit are instruments in this work.
The Audit Committee also does drafting work on board matters that concern transactions between Skandia Liv and its parent company. In addition to the external auditors and the head of Internal Audit, the company’s CFO and Chief Executive are regularly present
11
corporate ¯overnance
at audit committee meetings. All of the members are independent.
The Risk Management and Risk Control unit is responsible for the overall management and monitoring of business risks as well as operational risks, and reports on a regular basis to the Audit Committee.
investment committeeThe Board’s investment committee monitors the performance and man-age ment of Skandia Liv’s investments and exercises oversight to ensure that the management is conducted in ac-cordance with the Board’s investment guidelines. These guidelines stipulate parameters for how Skandia Liv’s assets are to be invested, how risks in the in-vestment operations are to be measured, limited and controlled, and how the results of asset management are to be reported. The Investment Committee decides on the overall allocation among asset classes and does drafting work for board decisions on investment mat-ters. The Chief Executive is a member of the Investment Committee. All of the committee’s members except for the Chief Executive are independent.
In autumn 2008 the committee had more meetings than usual due to the prevailing financial situation in the market.
customer committeeThe Board has a customer commit-tee for contact at the board level with persons representing the customers’ interests. The Customer Committee
allows a dialogue to be conducted that promotes good contact with custo-mers. The committee does not do drafting work for board matters. All of the members are independent.
policyholder committeeThe Policyholder Committee appoints the policyholders’ representative on the Board and consists of Gunnar Holmgren (chair), Gunilla Berg, Ulf Mikaelsson and Bengt Rydén.
board work in 2008Skandia Liv’s board held twelve meet-ings in 2008. The Board addressed standing items of business, decided on guidelines for operations and adopted the business plan.
In addition, the Board continued its analysis work of the ownership structure of the risk capital in Skandia Liv, partly based on the investigation work that is being jointly conducted with the parent company and partly with the support of its own external experts.
At several meetings the Board discus-sed reorganisation proposals. The new organisation that has been adopted will result in better co-ordination of the Skandia companies’ resources in two business areas: Private and Corporate.
Operations of the subsidiaries in Denmark were studied in more detail.
During the year, the Board adjusted the funding policy and discussed the handling of the company’s surplus in the light of the financial crisis.
The Board also adopted new invest-ment guidelines and evaluated its own
work through an interview process. In addition, the Board held several
seminars focusing on strategy and in-depth analysis of various issues.
Finally, the Board reviewed the conse-quences of the outcome of the arbitra-tion proceedings on Skandia Liv’s asset management.
the chairman’s roleThe Chairman of the Board leads the work of the Board and, through regular contacts with the Chief Executive, monitors the company’s continuing development and matters of a more strategic nature. The Chairman repre-sents the company externally on certain overarching matters. The Chairman also maintains regular contact with the board of Skandia Liv’s parent company and its chief executive.
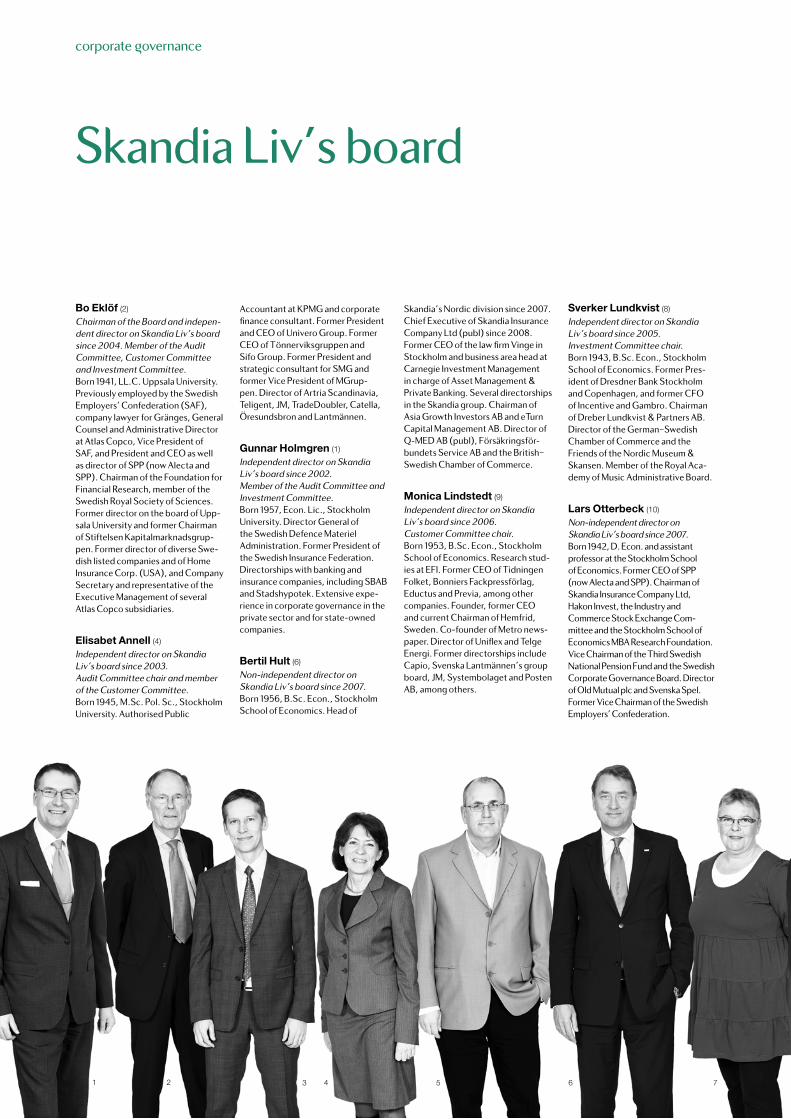
Skandia Liv’s board
Bo Eklöf (2)
Chairman of the Board and indepen-dent director on Skandia Liv’s board since 2004. Member of the Audit Committee, Customer Committee and Investment Committee.Born 1941, LL.C. Uppsala University. Previously employed by the Swedish Employers’ Confederation (SAF), company lawyer for Gränges, General Counsel and Administrative Director at Atlas Copco, Vice President of SAF, and President and CEO as well as director of SPP (now Alecta and SPP). Chairman of the Foundation for Financial Research, member of the Swedish Royal Society of Sciences. Former director on the board of Upp-sala University and former Chairman of Stiftelsen Kapitalmarknadsgrup-pen. Former director of diverse Swe-dish listed companies and of Home Insurance Corp. (USA), and Company Secretary and representative of the Executive Management of several Atlas Copco subsidiaries.
Elisabet Annell (4)
Independent director on Skandia Liv’s board since 2003.Audit Committee chair and member of the Customer Committee. Born 1945, M.Sc. Pol. Sc., Stockholm University. Authorised Public
Accountant at KPMG and corporate finance consultant. Former President and CEO of Univero Group. Former CEO of Tönnerviksgruppen and Sifo Group. Former President and strategic consultant for SMG and former Vice President of MGrup-pen. Director of Artria Scandinavia, Teligent, JM, TradeDoubler, Catella, Öresundsbron and Lantmännen.
Gunnar Holmgren (1)
Independent director on Skandia Liv’s board since 2002.Member of the Audit Committee and Investment Committee.Born 1957, Econ. Lic., Stockholm University. Director General of the Swedish Defence Materiel Administration. Former President of the Swedish Insurance Federation. Directorships with banking and insurance companies, including SBAB and Stadshypotek. Extensive expe-rience in corporate governance in the private sector and for state-owned companies.
Bertil Hult (6)
Non-independent director on Skandia Liv’s board since 2007.Born 1956, B.Sc. Econ., Stockholm School of Economics. Head of
Skandia’s Nordic division since 2007. Chief Executive of Skandia Insurance Company Ltd (publ) since 2008. Former CEO of the law firm Vinge in Stockholm and business area head at Carnegie Investment Management in charge of Asset Management & Private Banking. Several directorships in the Skandia group. Chairman of Asia Growth Investors AB and eTurn Capital Management AB. Director of Q-MED AB (publ), Försäkringsför-bundets Service AB and the British–Swedish Chamber of Commerce.
Monica Lindstedt (9)
Independent director on Skandia Liv’s board since 2006.Customer Committee chair.Born 1953, B.Sc. Econ., Stockholm School of Economics. Research stud-ies at EFI. Former CEO of Tidningen Folket, Bonniers Fackpressförlag, Eductus and Previa, among other companies. Founder, former CEO and current Chairman of Hemfrid, Sweden. Co-founder of Metro news-paper. Director of Uniflex and Telge Energi. Former directorships include Capio, Svenska Lantmännen’s group board, JM, Systembolaget and Posten AB, among others.
Sverker Lundkvist (8)
Independent director on Skandia Liv’s board since 2005.Investment Committee chair.Born 1943, B.Sc. Econ., Stockholm School of Economics. Former Pres-ident of Dresdner Bank Stockholm and Copenhagen, and former CFO of Incentive and Gambro. Chairman of Dreber Lundkvist & Partners AB. Director of the German–Swedish Chamber of Commerce and the Friends of the Nordic Museum & Skansen. Member of the Royal Aca-demy of Music Administrative Board.
Lars Otterbeck (10)
Non-independent director on Skandia Liv’s board since 2007.Born 1942, D. Econ. and assistant professor at the Stockholm Schoolof Economics. Former CEO of SPP (now Alecta and SPP). Chairman of Skandia Insurance Company Ltd, Hakon Invest, the Industry and Commerce Stock Exchange Com-mittee and the Stockholm School of Econom ics MBA Research Foundation. Vice Chairman of the Third Swedish Nation al Pension Fund and the Swedish Corporate Governance Board. Director of Old Mutual plc and Svenska Spel. Former Vice Chairman of the Swedish Employers’ Confederation.
corporate ¯overnance
1 2 3 4 5 6 7
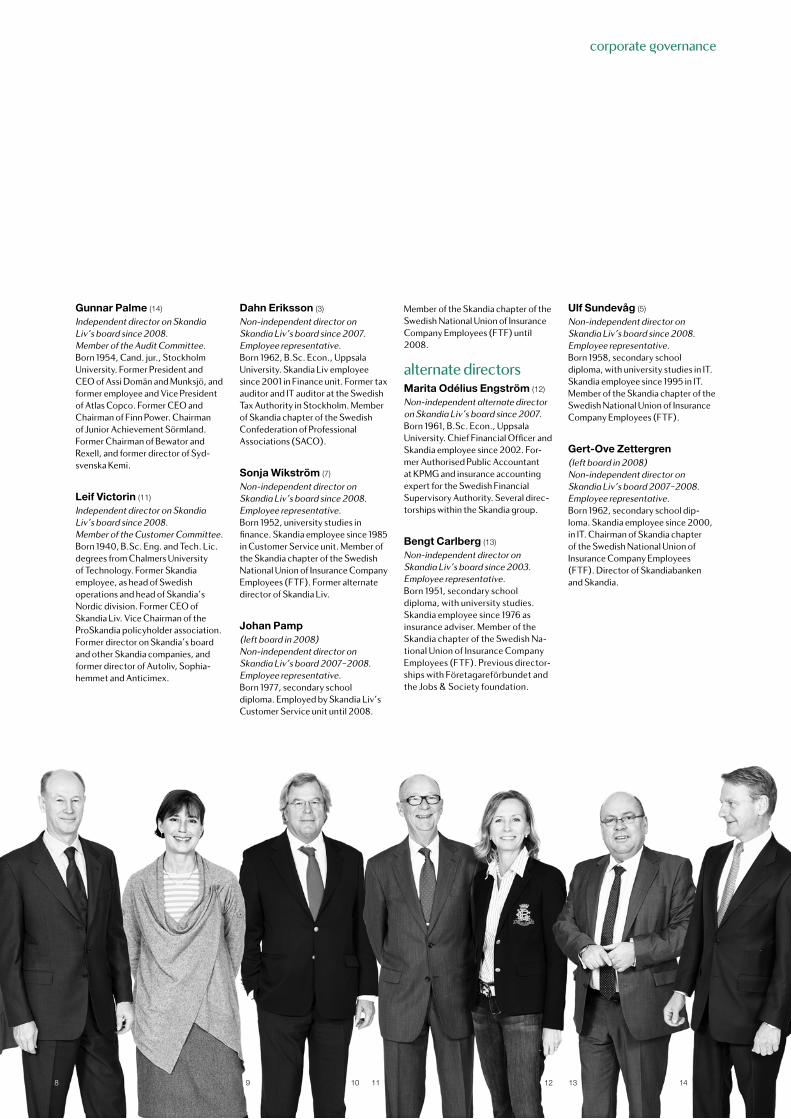
Gunnar Palme (14)
Independent director on Skandia Liv’s board since 2008.Member of the Audit Committee.Born 1954, Cand. jur., Stockholm University. Former President and CEO of Assi Domän and Munksjö, and former employee and Vice President of Atlas Copco. Former CEO and Chairman of Finn Power. Chairman of Junior Achievement Sörmland. Former Chairman of Bewator and Rexell, and former director of Syd-svenska Kemi.
Leif Victorin (11)
Independent director on Skandia Liv’s board since 2008. Member of the Customer Committee.Born 1940, B.Sc. Eng. and Tech. Lic. degrees from Chalmers Univer sity of Technology. Former Skandia employee, as head of Swedish operations and head of Skandia’s Nordic division. Former CEO of Skandia Liv. Vice Chairman of the ProSkandia policyholder association. Former director on Skandia’s board and other Skandia companies, and former director of Autoliv, Sophia-hemmet and Anticimex.
Dahn Eriksson (3)
Non-independent director on Skandia Liv’s board since 2007. Employee representative.Born 1962, B.Sc. Econ., Uppsala University. Skandia Liv employee since 2001 in Finance unit. Former tax auditor and IT auditor at the Swedish Tax Authority in Stockholm. Member of Skandia chapter of the Swedish Confederation of ProfessionalAssociations (SACO).
Sonja Wikström (7)
Non-independent director on Skandia Liv’s board since 2008.Employee representative.Born 1952, university studies in finance. Skandia employee since 1985 in Customer Service unit. Member of the Skandia chapter of the Swedish National Union of Insurance Company Employees (FTF). Former alternate director of Skandia Liv.
Johan Pamp (left board in 2008)Non-independent director on Skandia Liv’s board 2007–2008. Employee representative.Born 1977, secondary school diploma. Employed by Skandia Liv’s Customer Service unit until 2008.
Member of the Skandia chapter of the Swedish National Union of Insurance Company Employees (FTF) until 2008.
alternate directorsMarita Odélius Engström (12)
Non-independent alternate director on Skandia Liv’s board since 2007.Born 1961, B.Sc. Econ., Uppsala University. Chief Financial Officer and Skandia employee since 2002. For-mer Authorised Public Accountant at KPMG and insurance accounting expert for the Swedish Financial Supervisory Authority. Several direc-torships within the Skandia group.
Bengt Carlberg (13)
Non-independent director on Skandia Liv’s board since 2003.Employee representative.Born 1951, secondary school diploma, with university studies. Skandia employee since 1976 as insurance adviser. Member of the Skandia chapter of the Swedish Na-tional Union of Insurance Company Employees (FTF). Previous director-ships with Företagareförbundet and the Jobs & Society foundation.
Ulf Sundevåg (5)
Non-independent director on Skandia Liv’s board since 2008.Employee representative.Born 1958, secondary school diploma, with university studies in IT. Skandia employee since 1995 in IT. Member of the Skandia chapter of the Swedish National Union of Insurance Company Employees (FTF).
Gert-Ove Zettergren(left board in 2008)Non-independent director on Skandia Liv’s board 2007–2008. Employee representative.Born 1962, secondary school dip-loma. Skandia employee since 2000, in IT. Chairman of Skandia chapter of the Swedish National Union of Insurance Company Employees (FTF). Director of Skandiabanken and Skandia.
corporate ¯overnance
8 9 10 12 13 1411
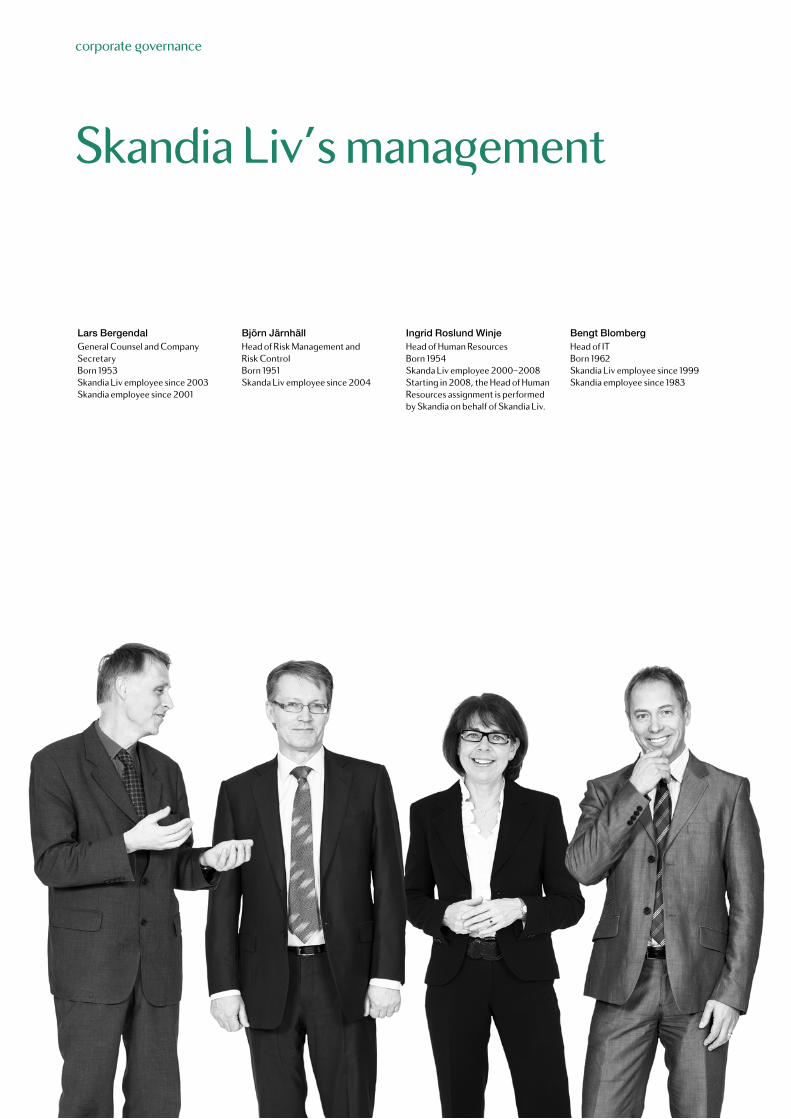
Skandia Liv’s mana¯ement
Lars BergendalGeneral Counsel and Company SecretaryBorn 1953 Skandia Liv employee since 2003Skandia employee since 2001
Björn JärnhällHead of Risk Management and Risk ControlBorn 1951 Skanda Liv employee since 2004
Ingrid Roslund WinjeHead of Human ResourcesBorn 1954Skanda Liv employee 2000–2008Starting in 2008, the Head of Human Resources assignment is performed by Skandia on behalf of Skandia Liv.
Bengt BlombergHead of ITBorn 1962Skandia Liv employee since 1999Skandia employee since 1983
corporate ¯overnance
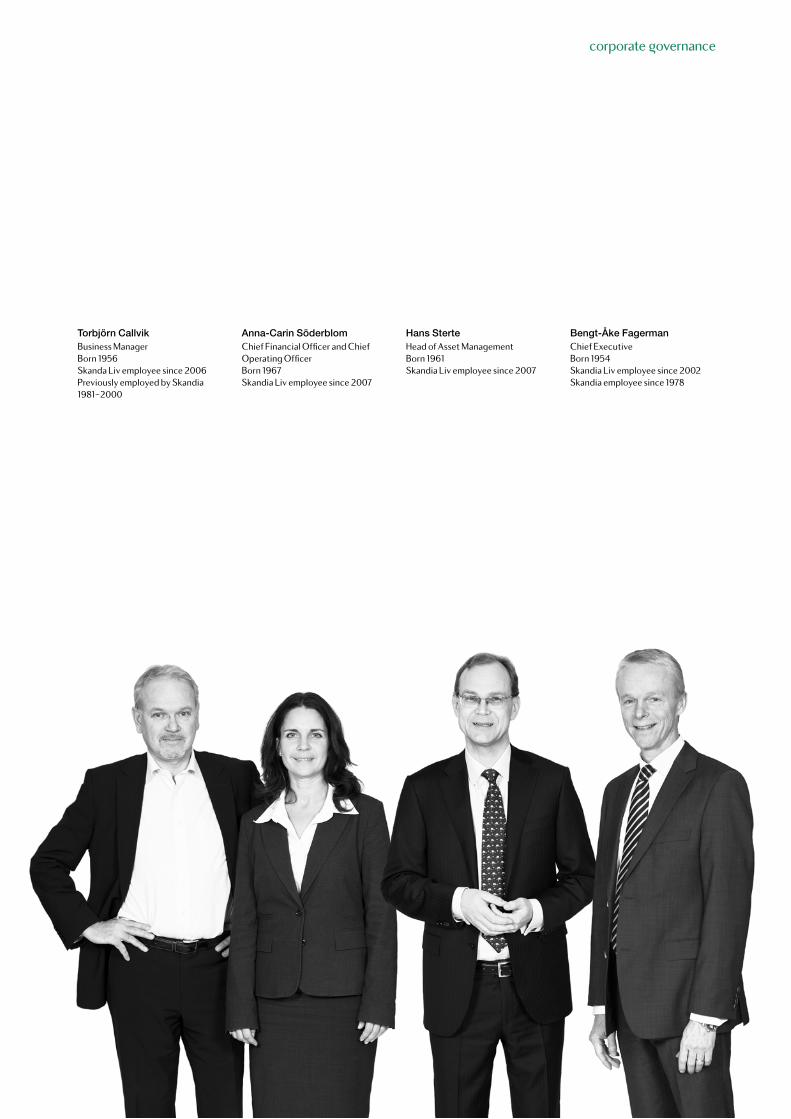
Torbjörn CallvikBusiness ManagerBorn 1956Skanda Liv employee since 2006Previously employed by Skandia 1981–2000
Anna-Carin SöderblomChief Financial Officer and Chief Operating OfficerBorn 1967Skandia Liv employee since 2007
Hans SterteHead of Asset ManagementBorn 1961Skandia Liv employee since 2007
Bengt-Åke FagermanChief ExecutiveBorn 1954Skandia Liv employee since 2002Skandia employee since 1978
corporate ¯overnance
board of directors’ report
16
board of directors’ report
The Board of Directors and President of Livförsäkringsaktiebolaget Skandia (publ), “Skandia Liv” (registered num-ber 502019-6365), hereby submit their Annual Report for 2008, the company’s 136th year in operation. Skandia Liv is a wholly owned subsidiary of Skandia Insurance Company Ltd (“Skandia”). Skandia is owned by Old Mutual plc (“Old Mutual”). Skandia Liv’s business is conducted on a mutual basis, which means that all operating surpluses are returned to the policyholders. No profit distribution may be made to the shareholder. Skandia Liv is active today in both the private and occupational pensions segments of the Swedish traditional life assurance market. The business mission is to offer simple, value-for-money products and services for long-term savings and financial se-curity for retirement, illness and death.
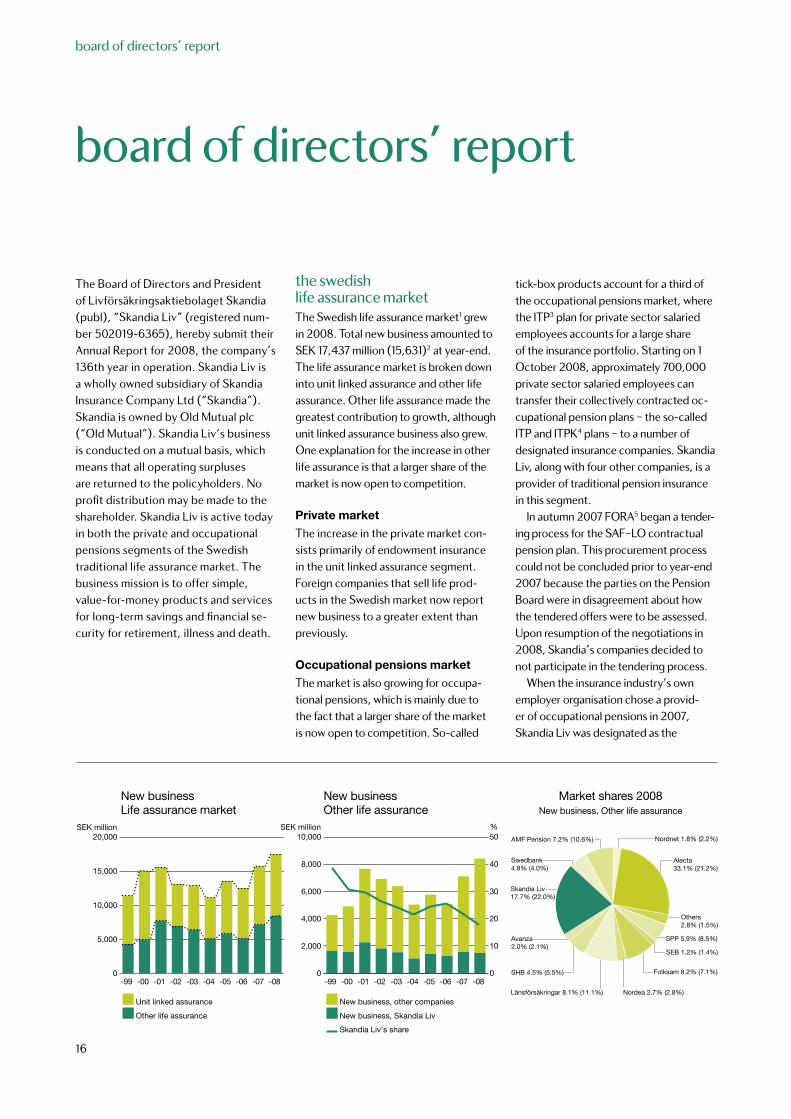
the swedish life assurance marketThe Swedish life assurance market1 grew in 2008. Total new business amounted to SEK 17,437 million (15,631)2 at year-end. The life assurance market is broken down into unit linked assurance and other life assurance. Other life assurance made the greatest contribution to growth, although unit linked assurance business also grew. One explanation for the increase in other life assurance is that a larger share of the market is now open to competition.
Private market
The increase in the private market con-sists primarily of endowment insurance in the unit linked assurance segment. Foreign companies that sell life prod-ucts in the Swedish market now report new business to a greater extent than previously.
Occupational pensions market
The market is also growing for occupa-tional pensions, which is mainly due to the fact that a larger share of the market is now open to competition. So-called
tick-box products account for a third of the occupational pensions market, where the ITP3 plan for private sector salaried employees accounts for a large share of the insurance portfolio. Starting on 1 October 2008, approximately 700,000 private sector salaried employees can transfer their collectively contracted oc-cupational pension plans – the so-called ITP and ITPK4 plans – to a number of designated insurance companies. Skandia Liv, along with four other companies, is a provider of traditional pension insurance in this segment.
In autumn 2007 FORA5 began a tender-ing process for the SAF–LO contractual pension plan. This procurement process could not be concluded prior to year-end 2007 because the parties on the Pension Board were in disagreement about how the tendered offers were to be assessed. Upon resumption of the negotiations in 2008, Skandia’s companies decided to not participate in the tendering process.
When the insurance industry’s own employer organisation chose a provid-er of occupational pensions in 2007, Skandia Liv was designated as the
Unit linked assurance
Other life assurance
Source: Skandia
New businessLife assurance market
0
5,000
10,000
15,000
20,000
-00-99 -04-03-02-01 -05 -06 -07 -08
SEK million
New business, other companies
New business, Skandia Liv
Source: Skandia
New business Other life assurance
0
2,000
4,000
6,000
8,000
10,000
-00-99 -04-03-02-01 -05 -06 -07 -08
Skandia Liv's share
SEK million %50
40
20
30
10
0
Market shares 2008New business, Other life assurance
Swedbank 4.8% (4.0%)
AMF Pension 7.2% (10.6%) Nordnet 1.8% (2.2%)
Alecta33.1% (21.2%)
Others2.8% (1.5%)
SPP 5.9% (8.5%)
SEB 1.2% (1.4%)
Folksam 8.2% (7.1%)
Nordea 2.7% (2.8%)Länsförsäkringar 8.1% (11.1%)
Avanza 2.0% (2.1%)
SHB 4.5% (5.5%)
Skandia Liv17.7% (22.0%)
board of directors’ report
17
default company, i.e., the company that is automatically chosen for customers who do not make an active choice. The FTP6 agreement, which took effect on 1 January 2008, entailed several changes. Among other things, certain younger age groups are covered by a defined contribu-tion system, instead of a defined benefit system as previously. Other life assurance from Skandia Liv
Skandia Liv’s new business decreased to SEK 1,491 million (1,562) in 2008, corresponding to a market share of 17.7% (22.0%).2 However, new business is increasing in the occupational pen-sions segment, partly as a result of our participation in a tendering process in the non-collectively contracted part of the market, where we have been selected as an eligible alternative. During the latter half of 2008 we saw favourable effects of sales from the FTP plan. Another reason for the rise in occupational pensions business was an increase in contractual retirement pensions in connection with company layoffs.
People who choose Skandia Liv for their ITP and ITPK plans are offered the GarantiPensionPlus product, where al-location of premiums takes the insured’s age into account. For young employees, a larger share of the capital is invested in equities, which normally generate higher returns. As the policyholder approaches
retirement age, the allocation of equities is reduced in favour of more secure investments. The product features a unique, enhanced guarantee designed to counteract decreases in the policyhold-ers’ insurance capital in connection with downturns in the financial markets.
In April Skandia Liv signed an agree-ment with the Chalmers University of Technology on the vesting of occupation-al pensions. The agreement with Chal-mers is one of the largest deals Skandia Liv has made during the 2000s.
In addition to new business, Skandia Liv’s new sales7 include expansions of existing policies. New sales amounted to SEK 2,553 million (2,484).
Skandia Liv 2008Group structure
In addition to the parent company Livförsäkringsaktiebolaget Skandia (publ), the Skandia Liv group consists of Livförsäkringsaktiebolaget Skandia Fastighetsinvesteringar AB and Diligen-tia AB (with several property-owning subsidiaries), Skandikon Pensionsadmin-istration AB, Skandikon Administration AB, Berlac AB (formerly Netline AB), Life Equity Sweden KB, Skandia Livsforsikring A/S, Skandia Asset Management A/S and Skandia Livsforsikring A A/S (all three in Denmark), and Finsinequa Consulting Oy i likvidation (formerly Henkivakuu-tusosakeyhtiö Skandia, Henki Skandia)
in Finland. All subsidiaries may distribute profits to their owner.
Organisation
Skandia Liv is a wholly owned subsidiary of Skandia. Since 2006 Skandia has been a member of the international financial services group Old Mutual, which offers financial services in life assurance, bank-ing and asset management. Old Mutual was established in 1845 and has its head offices in London. Operationally, Skandia Liv is part of Skandia’s Nordic division, which encompasses all operations Swe-den, Denmark and Norway.
Several businesses and functions have been conducted jointly with the entire Skandia group for some time. The aim is to create a more cohesive organisation and simplify things for customers while achieving revenue and cost synergies.
New organisation and cost-cutting programme
During the year a review was conducted of the organisation in accordance with a cost-cutting programme that had been decided on. Both organisational and staffing issues have been negotiated with the unions. The number of posi-tions was reduced by a net total of 20, in relation to the 2008 budget.
1) The market is measured in terms of new business according to the industry-wide defini-tion of single premiums divided by ten, plus annual premiums.
2) The Swedish Insurance Federation retroactively changed the figures for 2007. The 2007 Annual Report reported new business in the market to be SEK 15,820 million and Skan-dia Liv’s market share at 21.9%.
3) ITP is a supplementary pension plan for employees in industry and commerce that is pro-vided under collective bargaining agreements. The ITP plan is a complement to statutory insurance cover.
4) ITPK is a complementary occupational pension plan to the ITP plan for persons born in 1978 or earlier. In connection with the new ITP plan, a tendering process was conducted to select new, eligible companies.
5) FORA administrates collectively contracted insurance plans and other financial security solutions, handling annual volume of slightly more than SEK 20 billion in premiums and fees from 200,000 companies to some forty insurance companies, foundations and funds.
6) FTP is a pension plan for insurance industry employees provided under collective bar-gaining agreements.
7) New sales are measured as new business plus increases to existing policies, weighted according to the industry-wide definition: single premiums divided by 10, plus annual premiums.
board of directors’ report
18
Changed legislation
for pension insurance
Effective 1 January 2008, the deduction right for pension insurance premiums was reduced to SEK 12,000 per year.
New Skandia logo
On 1 January 2008 Skandia unveiled a new logotype for all parts of the group. The in-troduction is part of Skandia’s global brand-building work. The green colour clearly marks the affiliation with Skandia’s owner, Old Mutual.
New rules for calculating
technical provisions for other
insurance
On 1 April 2008 the Swedish Financial Supervisory Auth-ority introduced new rules (FFFS 2008:6) pertaining to the choice of interest rate to be used for calculating techni-cal provisions. The change pertains primarily to so-called other insurance. According to the change, insurance companies are to determine the discount rate for other insurance based on the market rate for government bonds. Previously, a maximum interest set by the Financial Supervi-sory Authority was used.
New rules for calculating techni-
cal provisions
As a result of nervousness in the financial markets, on 11 November 2008 the Financial Supervisory Authority adopt-ed new rules (FFFS 2008:23, which supersede FFFS 2008:6), pertaining to the choice of interest rate used in calculating technical provi-
sions. These new rules pertain primarily to insurance classified as occupational pensions business. The change entails that the discount rate for oc-cupational pension insurance shall correspond to the average of the current market interest rates for government bonds and either swap rates or cover-ed mortgage bonds. Skandia Liv has elected to use covered mortgage bonds. Previously, the average of the market rates for government bonds and swap rates was used.
Skandia Liv signs major agree-
ment with Chalmers University
of Technology
In April 2008 Skandia Liv signed an agreement with the Chalmers University of Technology for the vesting of occupational pensions, worth nearly SEK 0.5 billion in oc-cupational pension premiums in 2008. The agreement covers approximately 2,500 employees, former employees and retirees, and is one of the largest deals signed by Skandia Liv during the 2000s. The agreement strengthens Skandia’s position in its strategic focus on the state, municipal and county council segments of the market.
Study begun of demutualisation
of Skandia Liv
Skandia Liv and Skandia have decided to jointly look into the conditions for demutualising Skandia Liv. Skandia Liv’s current company form has been called into question by a government study. The hopes are that a restructuring into a more modern company form
• chan¯ed le¯islation for pension insurance
• new Skandia lo¯otype unveiled
• new rules for calculatin¯ technical provisions
• Skandia Liv si¯ned major a¯reement with Chalmers Univer-sity of Technolo¯y
• study be¯un of demutualisation of Skandia Liv
• ban on policy transfers lifted
• stron¯er oversi¯ht of how surpluses are handled in life companies
• Skandia withdrew from SAF–LO procurement process
• transfer ri¯hts for ITP/ITPK insurance
• application of market value factors
• proposal for new solvency rules within the EU
• new or¯anisation with focus on customers’ needs
• settlement reached in arbitration between Skandia and Skandia Liv
• tax dispute on loans to Skandia Liv’s property company
important events durin¯ the year
board of directors’ report
19
can lead to advantages for the policyholders as well as shareholders. Ban on policy transfers lifted
Starting on 1 May 2008, policyholders are allowed to transfer their insurance capital.
Skandia has offered transfer rights for all pri-vate pension insurance since 2003, and starting in 2006, transfer rights also apply for new capital in occupational pension plans.
Stronger oversight of how
surpluses are handled in life
companies
During the year, the Finan-cial Supervisory Authority announced that it is sharpening its oversight of how surpluses are handled in traditional life assurance. This is to ensure that all policyholders’ claims to sur-pluses are handled in a suitable manner. As part of the work on improving information on the handling of surpluses, Skandia Liv has renewed and improved the information it provides on its website. In addition, applicable rules and policies are under constant review.
Skandia withdraws from
SAF–LO procurement process
During the year, Skandia Liv criticised the Confederation of Swedish Enterprise (SAF) for inhibiting free competition due to its decisive influence in Alecta and AMF. During the autumn of 2008, Skandia announced that its companies will not be participating in the tendering process for the SAF–LO contractual pension plan. Skandia is of the opinion that
the tendering process is not being conducted on fair terms, since AMF, which is jointly owned by the Confederation of Swedish Enterprise and LO, is favoured in the tendering requirements for the default alternative. Skandia cannot accept a tendering process in which the labour market parties put their own interests ahead of the customers’. On 9 December 2008, FORA announced that AMF has been chosen as the default alterna-tive in the SAF–LO contractual pension plan.
Transfer rights for ITP/ITPK
insurance
Transfer rights were introduced on 1 October 2008 for ITP/ITPK insurance via Collectum. Private sector salaried employ-ees now have the opportunity to transfer their occupational pensions.
Application of
market value factors
The decline in the world’s stock exchanges has affected the value of Skandia Liv’s assets. As a result, during the year Skandia Liv adjusted the so-called market value factor. This factor is used when the company is under-funded, i.e., when the value of Skandia Liv’s assets is less than the value of the policy-holders’ combined insurance capital. Skandia Liv’s market value factor was 0.90 as per 31 December 2008, which means that at the time a policy is transferred or surren-dered, the insurance capital will be reduced by 10%. The market value factor is used to achieve a more equitable allocation of the surplus.
Proposal for new solvency
rules in the EU
The work in the EU on devising a new solvency rule system continued during the year. In February 2008 a revised proposal for a directive was presented, which served as the basis for the handling of proposals for new solvency rules that has been in prog-ress in the EU Council and Parliament. The intention is still to have a set of regulations ready by 2012. Parallel with the work that has been in progress within the Council and Parlia-ment, an additional Quantita-tive Impact Study, QIS 4, was carried out during the year to illuminate the effects of the proposed solvency rules. Skandia Liv participated in this study. The negotiations on the final design have not been completed, which is why there is still uncertainty regarding what a final set of rules in this area will look like. Based on the results of QIS 4, Skandia Liv meets the capital requirement with a good margin.
New organisation with focus on
customers’ needs
Skandia’s Swedish operations were divided into two busi-ness areas as from 1 January 2009: Corporate and Private. The legal company struct-ure remained intact. Within the framework of the new organisation, a cost-cutting programme is being carried out to improve operating efficiency and reduce operat-ing expenses.
DisputesSettlement reached in arbi-
tration between Skandia and
Skandia Liv
In 2004 Skandia Liv and its parent company, Skandia, reached an agreement to refer the issue of alleged, prohibited profit distribution in connection with Skandia’s sale of its asset management business in 2002 to DnB NOR to an arbitration board. The arbitration board announced its ruling on 2 October 2008. The arbitration board found that the asset management agreement entailed that a third of the asset management fee constituted an excess charge to Skandia Liv. This excess charge was a prohibited trans-fer of value.
See also under the heading Compensation from arbitra-tion between Skandia Liv and Skandia, on p. 21.
Tax dispute on loans to Skandia
Liv’s property company
Skandia Liv’s property com-pany borrowed money from Skandia Liv at an interest rate that has been disapproved by the tax authorities. The tax decision has been appealed, but has only been partly ad-justed in the judicial review.
A reserve that was pre-viously created is still judged to be sufficient.

SOLV
ENC
Y IS
AN
IMPO
RT
AN
T M
ETRI
C F
OR
A L
IFE
CO
MPA
NY
.
SK
AN
DIA
LIV
HA
S A
GO
OD
LE
VE
L O
F S
OL
VE
NC
Y.
CO
MPA
RED
WIT
H T
HE
VA
LUE
OF
WH
AT
WE
HA
VE
PRO
MIS
ED.
IT S
HO
WS
TH
E V
ALU
E O
F O
UR
TO
TA
L A
SS
ET
S
WH
ICH
GIV
ES
US
RO
OM
TO
MA
NO
EU
VR
E IN
HA
RD
TIM
ES
.
Skandia Liv’s vision is to be the most confidence-inspirin¯ company in the industry, with the ambition of bein¯ a trendsetter in the market. Our aim is always to be a little better and to make thin¯s a little easier for our customers.
SOLV
ENC
Y IS
AN
IMPO
RT
AN
T M
ETRI
C F
OR
A L
IFE
CO
MPA
NY
.
SK
AN
DIA
LIV
HA
S A
GO
OD
LE
VE
L O
F S
OL
VE
NC
Y.
CO
MPA
RED
WIT
H T
HE
VA
LUE
OF
WH
AT
WE
HA
VE
PRO
MIS
ED.
IT S
HO
WS
TH
E V
ALU
E O
F O
UR
TO
TA
L A
SS
ET
S
WH
ICH
GIV
ES
US
RO
OM
TO
MA
NO
EU
VR
E IN
HA
RD
TIM
ES
.
board of directors’ report
21
Our employees
Skandia Liv is a knowledge intensive com-pany in which the employees’ commit-ment, competence and performance are decisive for the company’s success and competitive strength. With a good human resources policy, culture and values, as well as firmly established leadership and employeeship processes, Skandia Liv will continue to be an employer of choice.
Employees
The average number of employees in the parent company Skandia Liv in 2008 was 273 (220), of whom 47% (47%) were wo-men. The share of women in management positions was 41% (41%), and the average age of all employees was 44 (44). Em-ployee turnover increased during the year compared with a year ago and was 12.1% (10.4%) at year-end. Total absence due to illness decreased to 2.6% (3.1%).
Attractive place to work
Skandia Liv strives to be an attractive workplace for existing as well as poten-tially new employees. This includes being able to offer a healthy and stimulating work environment that is conducive to job satisfaction, openness and involve-ment. Skandia’s annual employee survey was carried out in spring 2008. The survey is a tool for gaining information about work loads, motivation, quality of goals and leadership. Skandia Liv’s goal is to achieve results that are in parity with the target values or higher in all of the company’s units. As in previous years, the response rate in 2008 was high. The scores were slightly lower compared with a year earlier, mainly in the area of goal quality.
The business plan – a starting point for
employees’ individual goals
The business planning that is conduct-ed in advance of each coming year is a process that involves a high level of employee participation. As part of the business planning process, a long-term initiative has been undertaken in the area of performance management. This work was further intensified during the year in view of the slightly poorer scores in the
employee survey regarding goal quality. In the employees’ yearly planning and performance reviews, concrete individual goals are formulated for each employee based on the business plan. An individual assignment contract is prepared for each employee and is followed up through three obligatory talks between employees and their respective managers.
Livianen and other variable compensation
Livianen is Skandia Liv’s profit-sharing foundation. Its purpose is to motivate em-ployees and promote participation by giv-ing employees a financial incentive when the company performs according to set targets. According to the model, Skandia Liv is expected to deliver above-average performance than its competitors in two subsets – sales and total return. A third target is that Skandia Liv will meet the savings target set by the Board of Direct-ors for the year. The maximum compen-sation per employee, if all three targets are achieved, is 62.5% of the Price Base Amount, or approximately SEK 26,000. Skandia Liv offers variable compensation as a tool in setting managers’ salaries. This compensation is maximised to 10%, 20%, 30% or 50% of the employee’s base salary, depending on his or her position.
For details on salaries and compensa-tion, see note 37.
Health promotion at Skandia Liv
Having healthy employees who feel job satisfaction and are motivated is a vital component for a company’s success. Skandia Liv offers its employees access to advice and assistance on health matters. The aim is to detect and deal with issues and problems at an early stage in order to avoid a more extensive need of support and healthcare in the future. In addition, all employees are offered Skandia’s private healthcare insurance, which ensures fast access to specialist care when needed. Skandia Liv also supports employee fitness activities by providing fitness grants and subsidised activities.
Skandia Liv’s results 2008The Skandia Liv group’s result for 2008 was SEK –81,851 million (24,552). The result for the year for Skandia Liv Sweden was SEK –81,705 million (24,686). The technical result for Skandia Liv Sweden was SEK –81,180 million (27,726).
The technical result is derived primarily from three result sources: the investment result, the risk result and the administra-tive result. The investment result consists of the difference between the actual in-vestment return and the yield that is used to calculate the technical provisions. The risk result is the difference between the underlying assumptions on longevity and mortality and the actual outcome. The administrative result shows the difference between fees charged to insurance poli-cies and the company’s actual operating expenses.
Normally the investment result makes up the largest component of the total result, and for the 2008 financial year, the investment result was SEK –82,188 million (26,297). Risk business generated a result of SEK 941 million (921), and administration SEK 66 million (343).
The result will reduce the funding reserve, which makes up Skandia Liv’s accumulated surplus funds. For insurance with a savings component, surpluses are allocated primarily on the basis of the bonus rate, while for pure risk insurance, allocation of surpluses is done by lowering premiums, for example.
Compensation from arbitration settlement between Skandia Liv and Skandia
In 2008 the arbitration board issued its ruling on the dispute with Skandia concerning the asset management agree-ment with DnB NOR. As a result of the ruling, Skandia has paid SEK 871 million to Skandia Liv. Of this amount, SEK 540 million has been reported as other techni-cal income. This corresponds to excessive asset management fees for the years up to and including 2007. For 2008, SEK 79 million was reported net against the asset management fee for the year. The remaining SEK 252 million was received and reported as interest.
board of directors’ report
0
5,000
10,000
15,000
20,000
2004 2005 2006 2007 2008
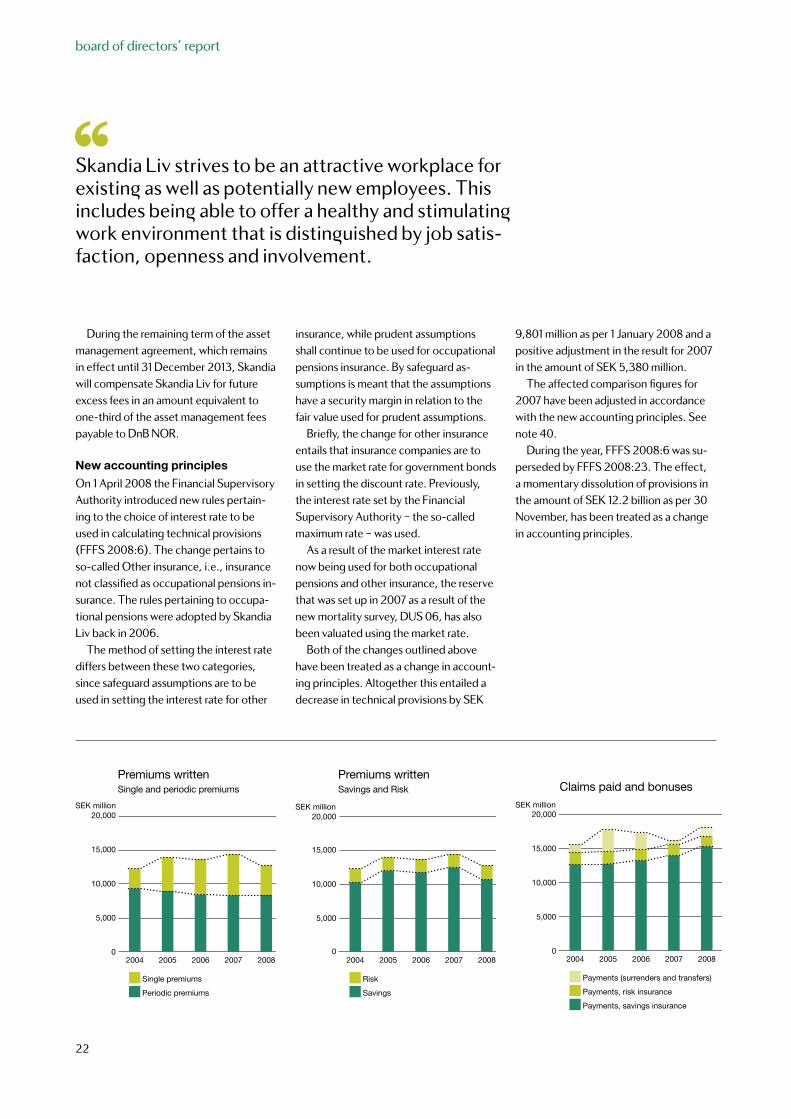
Single premiums
Periodic premiums
Source: Skandia
Premiums writtenSingle and periodic premiums
SEK million
0
5,000
10,000
15,000
20,000
2004 2005 2006 2007 2008
Risk
Savings
Source: Skandia
Premiums writtenSavings and Risk
SEK million
0
5,000
10,000
15,000
20,000
2004 2005 2006 2007 2008
Payments, risk insurance
Payments (surrenders and transfers)
Payments, savings insurance
Source: Skandia
Claims paid and bonuses SEK million
22
During the remaining term of the asset management agreement, which remains in effect until 31 December 2013, Skandia will compensate Skandia Liv for future excess fees in an amount equivalent to one-third of the asset management fees payable to DnB NOR.
New accounting principles
On 1 April 2008 the Financial Supervisory Authority introduced new rules pertain-ing to the choice of interest rate to be used in calculating technical provisions (FFFS 2008:6). The change pertains to so-called Other insurance, i.e., insurance not classified as occupational pensions in-surance. The rules pertaining to occupa-tional pensions were adopted by Skandia Liv back in 2006.
The method of setting the interest rate differs between these two categories, since safeguard assumptions are to be used in setting the interest rate for other
insurance, while prudent assumptions shall continue to be used for occupational pensions insurance. By safeguard as-sumptions is meant that the assumptions have a security margin in relation to the fair value used for prudent assumptions.
Briefly, the change for other insurance entails that insurance companies are to use the market rate for government bonds in setting the discount rate. Previously, the interest rate set by the Financial Supervisory Authority – the so-called maximum rate – was used.
As a result of the market interest rate now being used for both occupational pensions and other insurance, the reserve that was set up in 2007 as a result of the new mortality survey, DUS 06, has also been valuated using the market rate.
Both of the changes outlined above have been treated as a change in account-ing principles. Altogether this entailed a decrease in technical provisions by SEK
9,801 million as per 1 January 2008 and a positive adjustment in the result for 2007 in the amount of SEK 5,380 million.
The affected comparison figures for 2007 have been adjusted in accordance with the new accounting principles. See note 40.
During the year, FFFS 2008:6 was su-perseded by FFFS 2008:23. The effect, a momentary dissolution of provisions in the amount of SEK 12.2 billion as per 30 November, has been treated as a change in accounting principles.
Skandia Liv strives to be an attractive workplace for existin¯ as well as potentially new employees. This includes bein¯ able to offer a healthy and stimulatin¯ work environment that is distin¯uished by job satis-faction, openness and involvement.
’’
board of directors’ report
23
The following section pertains to Skandia Liv Sweden unless indicated otherwise. Skandia Liv Sweden consists of the pa-rent company, Livförsäkringsaktiebolaget Skandia (publ), Diligentia AB with several property-owning subsidiaries, Life Equity Sweden KB, Skandikon Pensionsadmini-stration AB, and Skandikon Administra-tion AB.
Premiums written
Skandia Liv’s premiums written total-led SEK 12,654 million (14,297) in 2008.
The decrease pertained primarily to single premiums for private savings products. This is attributable in part to the lower bonus rate, but also to high sales of the “Kapitalpension” product in January 2007, before that product was barred by changed legal rules in February of the same year. Another contributing reason for the decline was the reduced deduction right for private pension contributions, which took effect on 1 January 2008.
Premium inflow for occupational pension insurance increased during the year, however. The increase was mainly for public sector business, i.e., compa-nies owned by the state, municipalities and county councils.
Premiums written for risk business also increased slightly compared with a year earlier.
Other technical income
Other technical income amounted to SEK 574 million (2,070). The outcome for 2008 consists primarily of the compensation received from Skandia as a result of the arbitration ruling. See p. 21. The outcome for 2007 consisted primarily of the one-time compensa-tion that Skandia Liv received from Skandia as a result of the renegotiation of the companies’ joint occupational pensions business. For more informa-tion, see note 12.
Claims incurred
Claims paid increased to SEK 11,047 million (9,984). The increase is mainly attributable to disbursements asso-ciated with surrenders and transfers of insurance capital. The ban on trans-
fers that was instituted in 2007 was lifted in May 2008. During the year, capital transferred from the company amounted to SEK 278 million (61). Skandia Liv also saw a continued trend of higher disbursements during the year as a result of more policyholders reaching retirement age.
Claims incurred decreased during the year by SEK 746 million (743) through the change in the provision for claims outstanding. The change in market interest rates gave rise to a dissolution of SEK 136 million (45) in the reserve for claims outstanding. As in 2007, the number of open claims for disability and waiver of premium in-surance continued to decrease during the year, enabling the dissolution of SEK 610 million (698) in previous provisions.
Claims paid and the Change in provision for claims outstanding amounted to SEK 10,302 million (9,242). In addition to the benefits guaranteed to policyholders, part of the surplus accrued during the term of insurance policies (so-called bonus-es) is also paid out. Bonuses paid in 2008 amounted to SEK 7,008 million (6,213). Payments of surpluses are not reported in the income statement, but in the balance sheet as a decrease in the funding reserve.
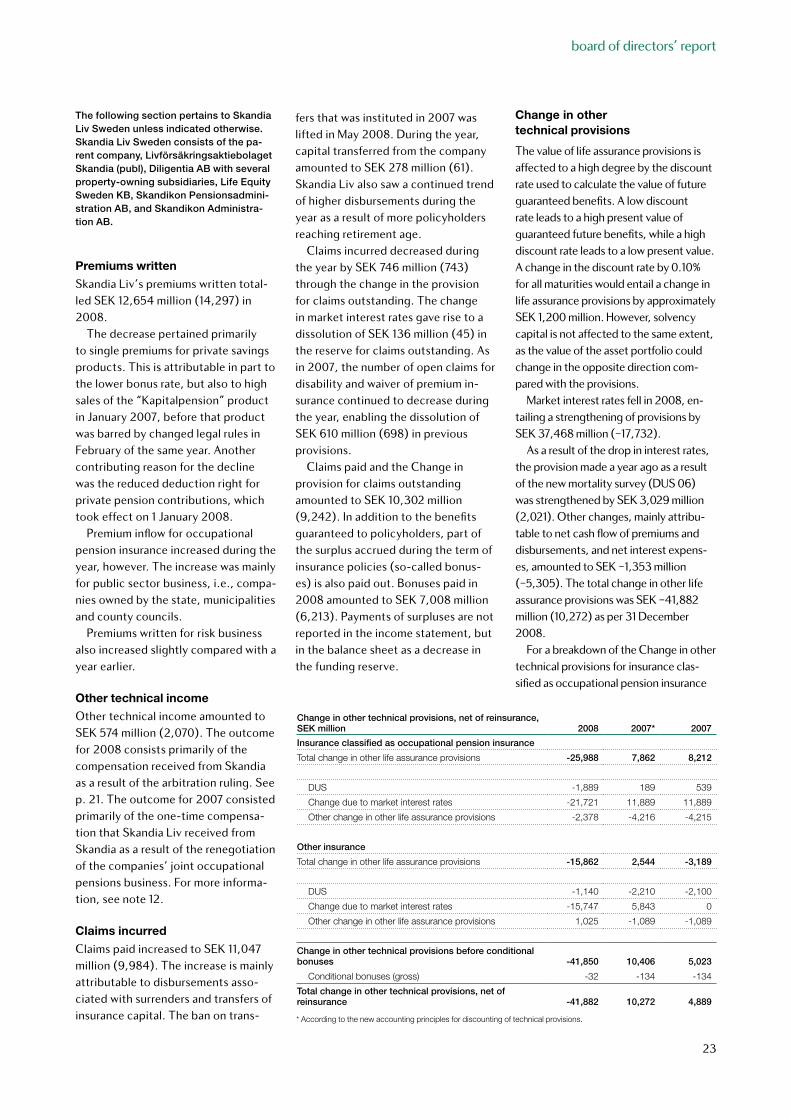
Change in other technical provisions
The value of life assurance provisions is affected to a high degree by the discount rate used to calculate the value of future guaranteed benefits. A low discount rate leads to a high present value of guaranteed future benefits, while a high discount rate leads to a low present value. A change in the discount rate by 0.10% for all maturities would entail a change in life assurance provisions by approximately SEK 1,200 million. However, solvency capital is not affected to the same extent, as the value of the asset portfolio could change in the opposite direction com-pared with the provisions.
Market interest rates fell in 2008, en-tailing a strengthening of provisions by SEK 37,468 million (–17,732).
As a result of the drop in interest rates, the provision made a year ago as a result of the new mortality survey (DUS 06) was strengthened by SEK 3,029 million (2,021). Other changes, mainly attribu-table to net cash flow of premiums and disbursements, and net interest expens-es, amounted to SEK –1,353 million (–5,305). The total change in other life assurance provisions was SEK –41,882 million (10,272) as per 31 December 2008.
For a breakdown of the Change in other technical provisions for insurance clas-sified as occupational pension insurance
Change in other technical provisions, net of reinsurance, SEK million 2008 2007* 2007
Insurance classified as occupational pension insurance
Total change in other life assurance provisions -25,988 7,862 8,212
DUS -1,889 189 539
Change due to market interest rates -21,721 11,889 11,889
Other change in other life assurance provisions -2,378 -4,216 -4,215
Other insurance
Total change in other life assurance provisions -15,862 2,544 -3,189
DUS -1,140 -2,210 -2,100
Change due to market interest rates -15,747 5,843 0
Other change in other life assurance provisions 1,025 -1,089 -1,089
Change in other technical provisions before conditional bonuses -41,850 10,406 5,023
Conditional bonuses (gross) -32 -134 -134
Total change in other technical provisions, net of reinsurance -41,882 10,272 4,889
* According to the new accounting principles for discounting of technical provisions.
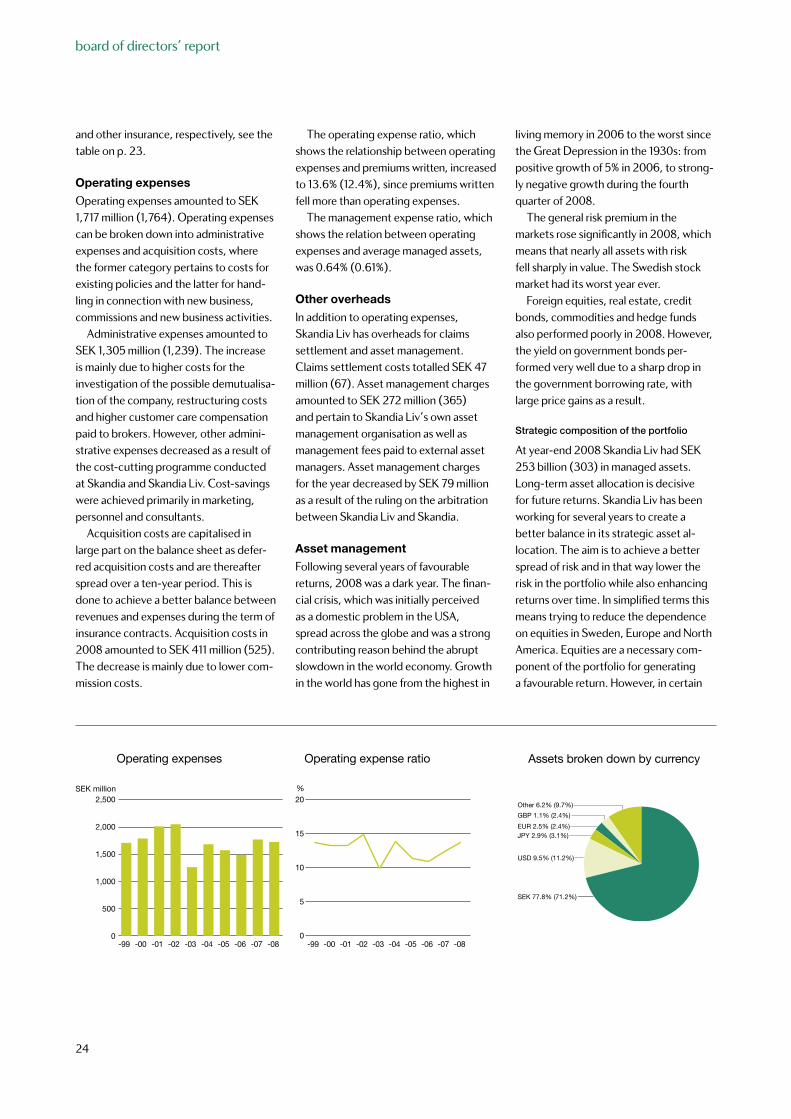
board of directors’ report
Assets broken down by currency
Other 6.2% (9.7%)
SEK 77.8% (71.2%)
USD 9.5% (11.2%)
JPY 2.9% (3.1%)EUR 2.5% (2.4%)
GBP 1.1% (2.4%)
0
500
1,000
1,500
2,000
2,500
-00-99 -04-03-02-01 -05 -06 -07 -08
Source: Skandia
Operating expenses
SEK million
-00-99 -04-03-02-01 -05 -06 -07 -08
Source: Skandia
Operating expense ratio
20
15
10
5
0
%
24
and other insurance, respectively, see the table on p. 23.
Operating expenses
Operating expenses amounted to SEK 1,717 million (1,764). Operating expenses can be broken down into administrative expenses and acquisition costs, where the former category pertains to costs for exist ing policies and the latter for hand-ling in connection with new business, commissions and new business activities.
Administrative expenses amounted to SEK 1,305 million (1,239). The increase is mainly due to higher costs for the investigation of the possible demutualisa-tion of the company, restructuring costs and higher customer care compensation paid to brokers. However, other admini-strative expenses decreased as a result of the cost-cutting programme conducted at Skandia and Skandia Liv. Cost-savings were achieved primarily in marketing, personnel and consultants.
Acquisition costs are capitalised in large part on the balance sheet as defer-red acquisition costs and are thereafter spread over a ten-year period. This is done to achieve a better balance between revenues and expenses during the term of insurance contracts. Acquisition costs in 2008 amounted to SEK 411 million (525). The decrease is mainly due to lower com-mission costs.
The operating expense ratio, which shows the relationship between oper ating expenses and premiums written, increased to 13.6% (12.4%), since premiums written fell more than operating expenses.
The management expense ratio, which shows the relation between operating expenses and average managed assets, was 0.64% (0.61%).
Other overheads
In addition to operating expenses, Skandia Liv has overheads for claims settlement and asset management. Claims settlement costs totalled SEK 47 million (67). Asset management charges amount ed to SEK 272 million (365) and pertain to Skandia Liv’s own asset management organisation as well as management fees paid to external asset managers. Asset management charges for the year decreased by SEK 79 million as a result of the ruling on the arbitration between Skandia Liv and Skandia.
Asset management
Following several years of favourable returns, 2008 was a dark year. The finan-cial crisis, which was initially perceived as a domestic problem in the USA, spread across the globe and was a strong contributing reason behind the abrupt slowdown in the world economy. Growth in the world has gone from the highest in
living memory in 2006 to the worst since the Great Depression in the 1930s: from positive growth of 5% in 2006, to strong-ly negative growth during the fourth quarter of 2008.
The general risk premium in the markets rose significantly in 2008, which means that nearly all assets with risk fell sharply in value. The Swedish stock market had its worst year ever.
Foreign equities, real estate, credit bonds, commodities and hedge funds also performed poorly in 2008. However, the yield on government bonds per-formed very well due to a sharp drop in the government borrowing rate, with large price gains as a result.
Strategic composition of the portfolio
At year-end 2008 Skandia Liv had SEK 253 billion (303) in managed assets. Long-term asset allocation is decisive for future returns. Skandia Liv has been working for several years to create a better balance in its strategic asset al-location. The aim is to achieve a better spread of risk and in that way lower the risk in the portfolio while also enhancing returns over time. In simplified terms this means trying to reduce the dependence on equities in Sweden, Europe and North America. Equities are a necessary com-ponent of the portfolio for generating a favourable return. However, in certain
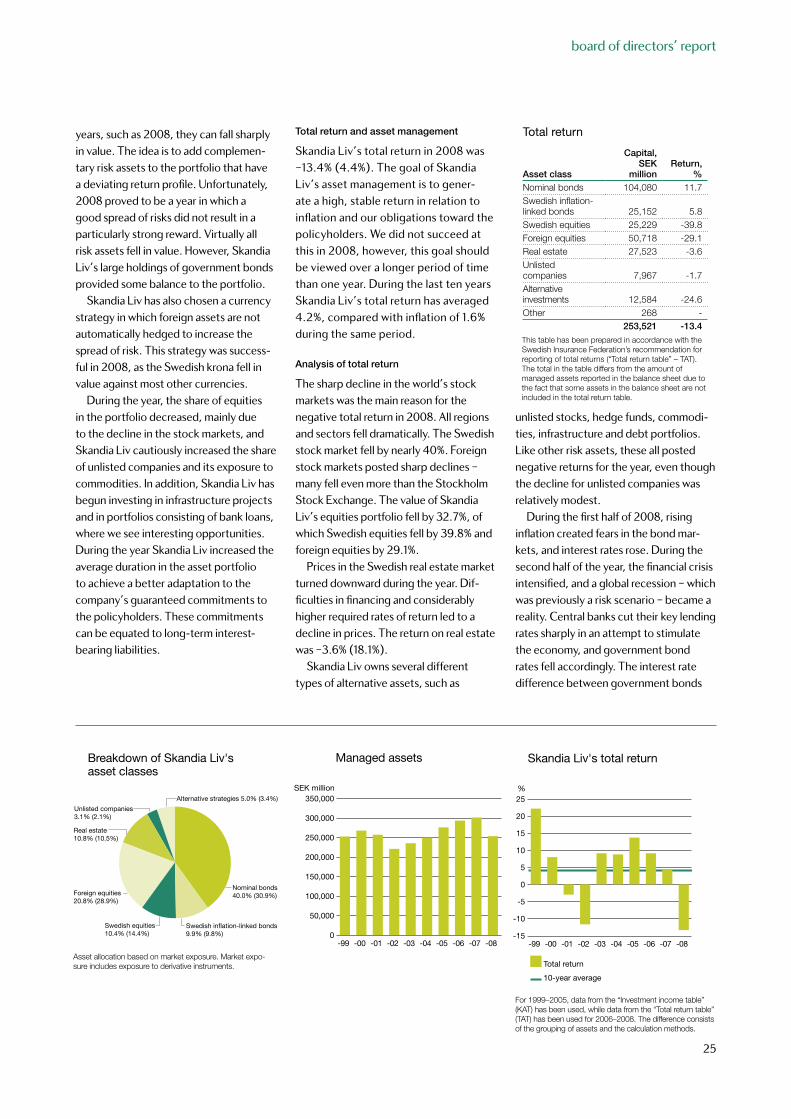
board of directors’ report
Breakdown of Skandia Liv's asset classes
Real estate 10.8% (10.5%)
Unlisted companies 3.1% (2.1%)
Foreign equities 20.8% (28.9%)
Swedish equities 10.4% (14.4%)
Swedish inflation-linked bonds 9.9% (9.8%)
Nominal bonds 40.0% (30.9%)
Alternative strategies 5.0% (3.4%)
0
50,000
100,000
150,000
200,000
250,000
300,000
350,000
-00-99 -04-03-02-01 -05 -06 -07 -08
Source: Skandia
Managed assets
SEK million
-15
-10
-5
0
5
10
15
20
25
-00-99 -04-03-02-01 -05 -06 -07 -08
Source: Skandia
Skandia Liv's total return
%
Total return
10-year average
This table has been prepared in accordance with the Swedish Insurance Federation’s recommendation for reporting of total returns (“Total return table” – TAT). The total in the table differs from the amount of managed assets reported in the balance sheet due to the fact that some assets in the balance sheet are not included in the total return table.
Total return
Asset class
Capital, SEK
millionReturn,
%Nominal bonds 104,080 11.7Swedish inflation-linked bonds 25,152 5.8Swedish equities 25,229 -39.8Foreign equities 50,718 -29.1Real estate 27,523 -3.6Unlisted companies 7,967 -1.7Alternative investments 12,584 -24.6Other 268 -
253,521 -13.4
25
years, such as 2008, they can fall sharply in value. The idea is to add complemen-tary risk assets to the portfolio that have a deviating return profile. Unfortunately, 2008 proved to be a year in which a good spread of risks did not result in a particularly strong reward. Virtually all risk assets fell in value. However, Skandia Liv’s large holdings of government bonds provided some balance to the portfolio.
Skandia Liv has also chosen a currency strategy in which foreign assets are not automatically hedged to increase the spread of risk. This strategy was success-ful in 2008, as the Swedish krona fell in value against most other currencies.
During the year, the share of equities in the portfolio decreased, mainly due to the decline in the stock markets, and Skandia Liv cautiously increased the share of unlisted companies and its exposure to commodities. In addition, Skandia Liv has begun investing in infrastructure projects and in portfolios consisting of bank loans, where we see interesting opportunities. During the year Skandia Liv increased the average duration in the asset portfolio to achieve a better adaptation to the company’s guaranteed commitments to the policyholders. These commitments can be equated to long-term interest-bearing liabilities.
For 1999–2005, data from the “Investment income table” (KAT) has been used, while data from the “Total return table” (TAT) has been used for 2006–2008. The difference consists of the grouping of assets and the calculation methods.
Asset allocation based on market exposure. Market exposure includes exposure to derivative instruments.
Total return and asset management
Skandia Liv’s total return in 2008 was –13.4% (4.4%). The goal of Skandia Liv’s asset management is to gener-ate a high, stable return in relation to inflation and our obligations toward the policyholders. We did not succeed at this in 2008, however, this goal should be viewed over a longer period of time than one year. During the last ten years Skandia Liv’s total return has averaged 4.2%, compared with inflation of 1.6% during the same period.
Analysis of total return
The sharp decline in the world’s stock markets was the main reason for the negative total return in 2008. All regions and sectors fell dramatically. The Swedish stock market fell by nearly 40%. Foreign stock markets posted sharp declines – many fell even more than the Stockholm Stock Exchange. The value of Skandia Liv’s equities portfolio fell by 32.7%, of which Swedish equities fell by 39.8% and foreign equities by 29.1%.
Prices in the Swedish real estate market turned downward during the year. Dif-ficulties in financing and considerably higher required rates of return led to a decline in prices. The return on real estate was –3.6% (18.1%).
Skandia Liv owns several different types of alternative assets, such as
unlisted stocks, hedge funds, commodi-ties, infrastructure and debt portfolios. Like other risk assets, these all posted negative returns for the year, even though the decline for unlisted companies was relatively modest.
During the first half of 2008, rising inflation created fears in the bond mar-kets, and interest rates rose. During the second half of the year, the financial crisis intensified, and a global recession – which was previously a risk scenario – became a reality. Central banks cut their key lending rates sharply in an attempt to stimulate the economy, and government bond rates fell accordingly. The interest rate difference between government bonds
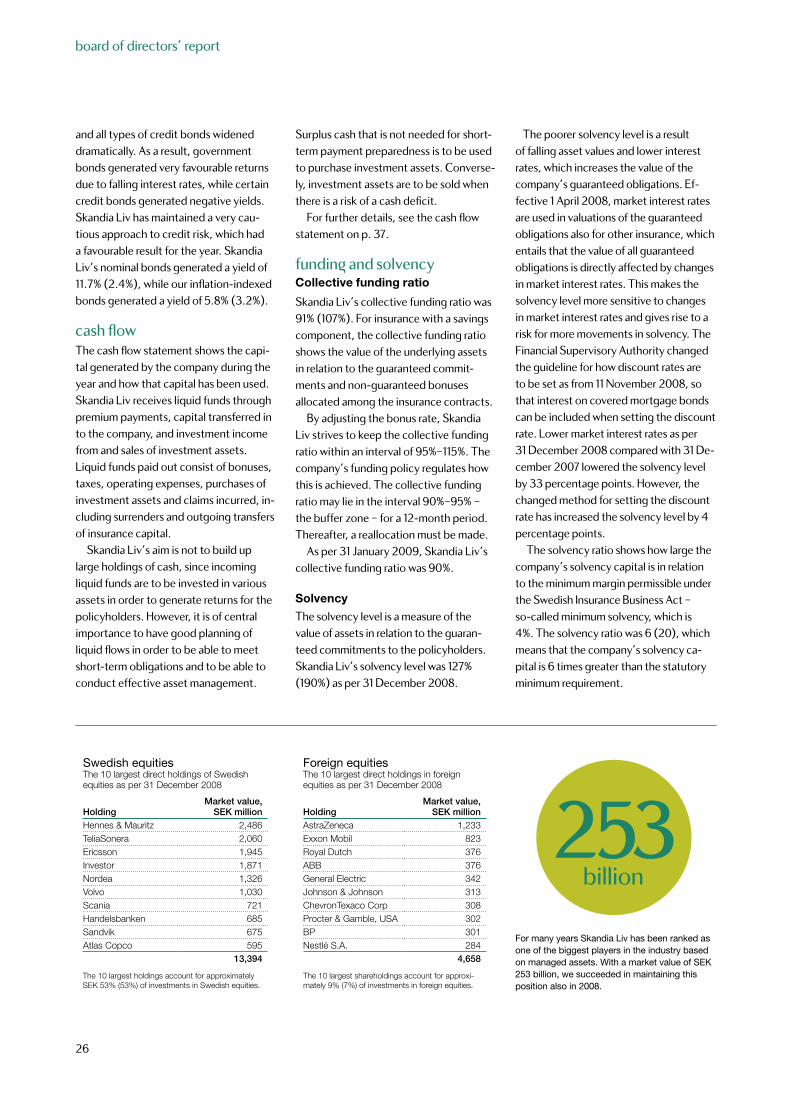
board of directors’ report
The 10 largest holdings account for approximately SEK 53% (53%) of investments in Swedish equities.
The 10 largest shareholdings account for approximately 9% (7%) of investments in foreign equities.
Swedish equitiesThe 10 largest direct holdings of Swedish equities as per 31 December 2008
HoldingMarket value,
SEK millionHennes & Mauritz 2,486TeliaSonera 2,060Ericsson 1,945Investor 1,871Nordea 1,326Volvo 1,030Scania 721Handelsbanken 685Sandvik 675Atlas Copco 595
13,394
Foreign equitiesThe 10 largest direct holdings in foreignequities as per 31 December 2008
HoldingMarket value,
SEK millionAstraZeneca 1,233Exxon Mobil 823Royal Dutch 376ABB 376General Electric 342Johnson & Johnson 313ChevronTexaco Corp 308Procter & Gamble, USA 302BP 301Nestlé S.A. 284
4,658
26
For many years Skandia Liv has been ranked as one of the biggest players in the industry based on managed assets. With a market value of SEK 253 billion, we succeeded in maintaining this position also in 2008.
and all types of credit bonds widened dramatically. As a result, government bonds generated very favourable returns due to falling interest rates, while certain credit bonds generated negative yields. Skandia Liv has maintained a very cau-tious approach to credit risk, which had a favourable result for the year. Skandia Liv’s nominal bonds generated a yield of 11.7% (2.4%), while our inflation-indexed bonds generated a yield of 5.8% (3.2%).
cash flowThe cash flow statement shows the capi-tal generated by the company during the year and how that capital has been used. Skandia Liv receives liquid funds through premium payments, capital transferred in to the company, and investment income from and sales of investment assets. Liquid funds paid out consist of bonuses, taxes, operating expenses, purchases of investment assets and claims incurred, in-cluding surrenders and outgoing transfers of insurance capital.
Skandia Liv’s aim is not to build up large holdings of cash, since incoming liquid funds are to be invested in various assets in order to generate returns for the policyholders. However, it is of central importance to have good planning of liquid flows in order to be able to meet short-term obligations and to be able to conduct effective asset management.
Surplus cash that is not needed for short-term payment preparedness is to be used to purchase investment assets. Converse-ly, investment assets are to be sold when there is a risk of a cash deficit.
For further details, see the cash flow statement on p. 37.
fundin¯ and solvencyCollective funding ratio
Skandia Liv’s collective funding ratio was 91% (107%). For insurance with a savings component, the collective funding ratio shows the value of the underlying assets in relation to the guaranteed commit-ments and non-guaranteed bonuses allocated among the insurance contracts.
By adjusting the bonus rate, Skandia Liv strives to keep the collective funding ratio within an interval of 95%–115%. The company’s funding policy regulates how this is achieved. The collective funding ratio may lie in the interval 90%–95% – the buffer zone – for a 12-month period. Thereafter, a reallocation must be made.
As per 31 January 2009, Skandia Liv’s collective funding ratio was 90%.
Solvency
The solvency level is a measure of the value of assets in relation to the guaran-teed commitments to the policyholders. Skandia Liv’s solvency level was 127% (190%) as per 31 December 2008.
The poorer solvency level is a result of falling asset values and lower interest rates, which increases the value of the company’s guaranteed obligations. Ef-fective 1 April 2008, market interest rates are used in valuations of the guaranteed obligations also for other insurance, which entails that the value of all guaranteed obligations is directly affected by changes in market interest rates. This makes the solvency level more sensitive to changes in market interest rates and gives rise to a risk for more movements in solvency. The Financial Supervisory Authority changed the guideline for how discount rates are to be set as from 11 November 2008, so that interest on covered mortgage bonds can be included when setting the discount rate. Lower market interest rates as per 31 December 2008 compared with 31 De-cember 2007 lowered the solvency level by 33 percentage points. However, the changed method for setting the discount rate has increased the solvency level by 4 percentage points.
The solvency ratio shows how large the company’s solvency capital is in relation to the minimum margin permissible under the Swedish Insurance Business Act – so-called minimum solvency, which is 4%. The solvency ratio was 6 (20), which means that the company’s solvency ca-pital is 6 times greater than the statutory minimum requirement.
253 billion
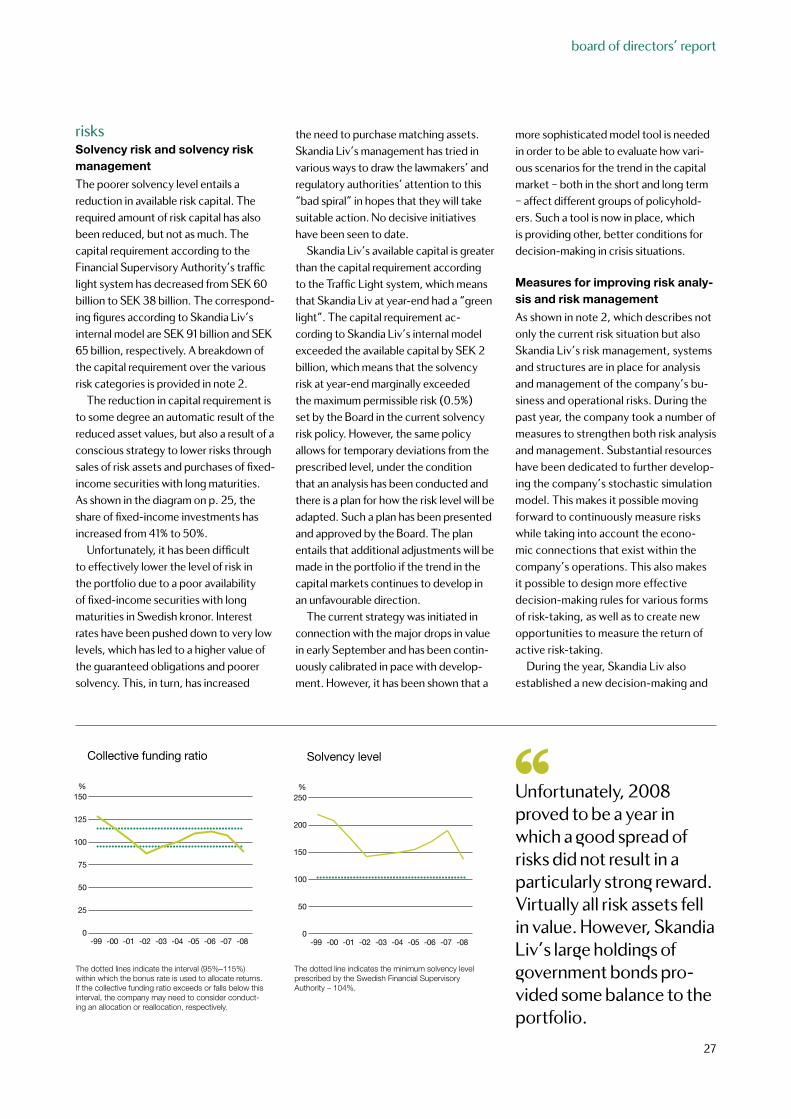
board of directors’ report
-99 -00 -04-03-02-01 -05 -06 -07 -08
Collective funding ratio
150
125
75
100
50
25
0
Collective funding ratio
Konsolideringsintervall
Source: Skandia
%
-99 -00 -04-03-02-01 -05 -06 -07 -08
Solvency level
250
200
100
150
50
0
Solvensgrad
Minimisolvens
Source: Skandia
%
The dotted lines indicate the interval (95%–115%) within which the bonus rate is used to allocate returns. If the collective funding ratio exceeds or falls below this interval, the company may need to consider conducting an allocation or reallocation, respectively.
The dotted line indicates the minimum solvency level prescribed by the Swedish Financial Supervisory Authority – 104%.
27
risks Solvency risk and solvency risk management
The poorer solvency level entails a reduction in available risk capital. The required amount of risk capital has also been reduced, but not as much. The capital requirement according to the Financial Supervisory Authority’s traffic light system has decreased from SEK 60 billion to SEK 38 billion. The correspond-ing figures according to Skandia Liv’s internal model are SEK 91 billion and SEK 65 billion, respectively. A breakdown of the capital requirement over the various risk categories is provided in note 2.
The reduction in capital requirement is to some degree an automatic result of the reduced asset values, but also a result of a conscious strategy to lower risks through sales of risk assets and purchases of fixed-income securities with long maturities. As shown in the diagram on p. 25, the share of fixed-income investments has increased from 41% to 50%.
Unfortunately, it has been difficult to effectively lower the level of risk in the portfolio due to a poor availability of fixed-income securities with long maturities in Swedish kronor. Interest rates have been pushed down to very low levels, which has led to a higher value of the guaranteed obligations and poorer solvency. This, in turn, has increased
the need to purchase matching assets. Skandia Liv’s management has tried in various ways to draw the lawmakers’ and regulatory authorities’ attention to this “bad spiral” in hopes that they will take suitable action. No decisive initiatives have been seen to date.
Skandia Liv’s available capital is greater than the capital requirement according to the Traffic Light system, which means that Skandia Liv at year-end had a “green light”. The capital requirement ac-cording to Skandia Liv’s internal model exceeded the available capital by SEK 2 billion, which means that the solvency risk at year-end marginally exceeded the maximum permissible risk (0.5%) set by the Board in the current solvency risk policy. However, the same policy allows for temporary deviations from the prescribed level, under the condition that an analysis has been conducted and there is a plan for how the risk level will be adapted. Such a plan has been presented and approved by the Board. The plan entails that additional adjustments will be made in the portfolio if the trend in the capital markets continues to develop in an unfavourable direction.
The current strategy was initiated in connection with the major drops in value in early September and has been contin-uously calibrated in pace with develop-ment. However, it has been shown that a
more sophisticated model tool is needed in order to be able to evaluate how vari-ous scenarios for the trend in the capital market – both in the short and long term – affect different groups of policyhold-ers. Such a tool is now in place, which is providing other, better conditions for decision-making in crisis situations.
Measures for improving risk analy-sis and risk management
As shown in note 2, which describes not only the current risk situation but also Skandia Liv’s risk management, systems and structures are in place for analysis and management of the company’s bu-siness and operational risks. During the past year, the company took a number of measures to strengthen both risk analysis and management. Substantial resources have been dedicated to further develop-ing the company’s stochastic simulation model. This makes it possible moving forward to continuously measure risks while taking into account the econo-mic connections that exist within the company’s operations. This also makes it possible to design more effective decision-making rules for various forms of risk-taking, as well as to create new opportunities to measure the return of active risk-taking.
During the year, Skandia Liv also established a new decision-making and
Unfortunately, 2008 proved to be a year in which a ̄ ood spread of risks did not result in a particularly stron¯ reward. Virtually all risk assets fell in value. However, Skandia Liv’s lar¯e holdin¯s of ¯overnment bonds pro-vided some balance to the portfolio.
’’
board of directors’ report
28
collaborative structure for the ongo-ing risk management in the form of an insurance committee that manages all underwriting risks, an ALM8 committee, which manages the connection between underwriting and investment risks, and a risk committee, which co-ordinates the management of operational risks. As support for the committees’ activities, a number of policies have been drawn up.
All this work is in line with the project that Old Mutual initiated to ensure that the group will have fully developed risk management and financial control that also meets the anticipated requirements of Solvency II. The new regulations for insurance companies are expected to take effect in 2012. Skandia Liv is actively participating in Solvency II to-gether with the rest of Skandia’s Nordic division.
the environmentSkandia Liv does not conduct any oper-ations that require a permit or reporting obligation pursuant to the Environmen-tal Code. However, Skandia’s ethical guidelines, which also cover Skandia Liv, stipulate that Skandia shall strive to limit the use of non-renewable resources and that environmental concerns shall be taken into account in all operations that the company is engaged in. The greatest adverse impact that Skandia Liv has on the environment concerns the use of energy and material, production of waste, and emissions to the air and water of the properties owned through the subsidiary Diligentia. Diligentia, which also owns the
building in which Skandia Liv has its head offices and where most of the company’s employees have their place of work, is working actively to minimise the environ-mental impact of its buildings. Diligentia has set a target to reduce energy con-sumption in its properties and for carbon dioxide emissions from its properties in Stockholm to be cut by 40 tonnes per year during the next five years. Diligentia is actively co-operating with its tenants to minimise its environmental impact, among other things through sorting and recycling. This is something that Skandia Liv welcomes in its role as a tenant.
Skandia Liv’s subsidiariesSwedish subsidiaries
Skandikon Administration AB, Skan-dikon Pensionsadministration AB and Svensk Pensionsadministration KB work under the Skandikon name. Skandikon’s business concept is to take a long-term, quality approach in its work on behalf of its clients in the areas of insurance administration, occupational pensions and foundations, and to provide con-sulting services in the area of pensions and foundations. Skandikon is engaged exclusively in outsourcing services in insurance and foundation administration, and consulting.
Livförsäkringsbolaget Skandia Fast-ighetsinvesteringar AB is a subsidiary of Skandia Liv and the parent company of Diligentia AB, where Skandia Liv’s real estate holdings are concentrated. Diligentia’s business concept is to engage in the long-term ownership, development
and management of offices, shopping centres and residential properties. At year-end the real estate holdings were estimated to be worth SEK 27.5 billion (31.5). Investments in existing properties amounted to SEK 1.4 billion (1.0). During the year, one property was acquired and 18 were sold (5). Berlac AB (formerly Net-line AB) did not conduct any operations in 2008.
Life Equity Sweden KB is an asset man-agement company focusing on unlisted companies in the biotech sector in the Nordic countries. At 31 December 2008 the company’s portfolio comprised seven companies. One of these is based in the USA and the others in Sweden. Three of the portfolio companies were introduced on the stock market during the year.
SMI Media Invest AB i likvidation was dissolved through liquidation in 2008 and did not conduct any operations during the year.
Foreign subsidiaries
Skandia Liv’s foreign subsidiaries are Skandia Livsforsikring A/S, Skandia Livs-forsikring A A/S, Skandia Asset Manage-ment A/S and Finsinequa Consulting Oy i likvidation (formerly Henkivakuutusosa-keyhtiö Skandia – Henki Skandia).
Denmark
Skandia Liv’s operations in Denmark comprise two separate insurance concepts. Skandia Livsforsikring A A/S handles private business and is closed for new business. Skandia Livsforsikring A/S handles “Bonuspension” business, which
Various scenarios for the trend in the capital markets and the economy are continuously bein¯ analysed and discussed in Skandia Liv’s asset mana¯ement or¯anisation, by its mana¯ement, and by the Board and its investment committee. The company was expectin¯ a ne¯ative turn in events, but the speed and drama of this development was surprisin¯.
’’8) Asset Liability Management.
board of directors’ report
29
is designed for the occupational pensions market. Skandia Asset Management A/S is a company that is jointly owned with Skandia, which handles asset manage-ment for the Danish operations.
During the year, Skandia Livsforsikring A/S experienced strong growth of new customers, as customers within Skan-dia are transferring from unit linked to traditional life assurance as a result of the anxiety in the financial markets. Falling share prices had an adverse impact on the result.
Written premiums amounted to SEK 2,256 million (1,721), operating expenses totalled SEK 249 million (187), and the result for the year was SEK –251 million (–202). Total assets amounted to SEK 14,318 million (11,095), of which life as surance provisions amounted to SEK 12,769 million (10,143).
Finland
The Finnish company Finsinequa Con-sulting Oy i likvidation is expected to be dissolved through liquidation in 2009. The result for the full year 2008 was SEK 0 million (–9).
outlook for 2009The economyUnfortunately, the economic outlook for 2009 is gloomy. We are currently in the midst of a global recession. The senti-ment in the world economy has rapidly switched from optimism and confidence in the future to pessimism and caution.
Various scenarios for the trend in the capital markets and the economy are
continuously being analysed and discus-sed in Skandia Liv’s asset management organisation, by its management, and by the Board and its investment committee. The company was expecting a negative turn in events, but the speed and drama of this development was surprising.
Uncertainty is great with respect to how deep the recession will be and how long it will last. The financial crisis is the worst in a very long time, but at the same time, extraordinary countermeasures have been taken.
To begin with, the world’s central banks sharply cut their key lending rates. In the USA, the Federal Reserve Bank cut its rate to virtually zero (0) per cent. Other countries also cut their key lending rates and can be expected to continue doing so in 2009. The Swedish repo rate was cut from 4.75% in September 2008 to 1.00% in February 2009.
Second, rescue programmes for the fi-nancial sector of an unprecedented scope have been launched. The reason for this is that a functioning financial system is essential for all developed economies.
Third, enormous financial stimulus packages are under way in most coun-tries, including infrastructure investment and tax cuts.
Moreover, the price of oil fell from USD 145/barrel at mid-year 2008 to USD 45 at year-end, which will also be a strong stimulus for households.
In many countries, such as the USA, the UK and Spain, households are severely in debt, and their most important asset – their homes – is falling in value. In these
countries, it is likely that private con-sumption will be dampened for several years. However, the strong counterme-asures vouch for a stabilisation of the global economy by 2010 at the latest. Perhaps Asia, which has a considerably smaller debt problem, will help buoy growth.
Uncertainty about the depth and dura-tion of the recession will affect both the stock and fixed-income markets in 2009.
Legislation
In the legislative area, there are a num-ber of clear trends that have already existed which may affect Skandia Liv’s products, distribution and organisa-tion. In addition, in connection with the financial crisis, key aspects of the existing regulation of financial com-panies have been called into question. Among these trends, the following are particularly noticeable:• Financial companies and intermedia-
ries are being assigned a greater in-formation obligation, which is leading to transparency in the insurance companies’ fees and compensation to intermediaries.
• The company form of traditional stock insurance companies conducting business on a mutual basis is being reconsidered. In the work within the EU on new capital base requirements (Solvency II), numerous countries argue that such companies should treat preliminarily allocated surpluses as a liability instead of as equity.
• A risk-related capital base requirement
board of directors’ report
30
is being developed within the frame-work of the EU’s work on devising new rules for insurance companies in Europe, and it can be assumed that the financial crisis will lead to stricter rules.
• The Financial Supervisory Authority’s guidelines for calculating liabilities in life companies have worked poorly in strongly volatile markets, such as in 2008, and hinder the design of long-term savings products with a guarantee. A discussion is in progress between the industry and the state on this matter.
• The manner of taxing life companies and policyholders may be changed. This became evident in the fact that the government, in its budget propo-sal in autumn 2008, announced that it will be reviewing and sharpening taxation of endowment insurance plans.
Skandia Liv
Initiatives in the municipal market will continue in 2009. Skandia Liv’s goal is to be a leading player in the public sector, which is a market segment char-acterised by stable growth.
One of Skandia Liv’s objectives is to offer its customers first-rate customer service. A major effort was
conduct ed in this area in 2008. The work on minimising manual work and increasing availability and the degree of self-service via online systems will continue in 2009.
Straightforward, credible commu-nication with customers is something that Skandia Liv values highly. A well working dialogue with customers, who are being given increasingly indivi-dual responsibility for their savings, is important for being able to meet their needs. Skandia Liv is well equipped for the future and will continue to have the ability to create good conditions for attractive offerings and favourable returns.
In 2008 an agreement was made at the board level between Skandia and Skandia Liv to look into the conditions for demutualising Skandia Liv. Skandia Liv is currently run on a mutual basis, even though the company is formally a stock corporation. This so-called hy-brid company form has been called into question and has already been aban-doned by several life companies.
A demutualisation could be beneficial for both policyholders and shareholders. In 2009, Skandia Liv – together with independent and impartial advisers – will further investigate the matter in an effort to safeguard the policyholders’ interests.
In 2008 a sweeping change process was begun at Skandia. Work is being conducted to increase collaboration between companies within the group, further increase efficiency, reduce op erating expenses and attain an organisa tion characterised by a clear customer focus. A cost-cutting prog-ramme was also begun, which will charact erise the years ahead for Skandia and Skandia Liv.
The new organisational structure took effect on 1 January 2009. The organisation is based on the custo-mers’ needs, and work at Skandia is now being conducted via two business areas: Corporate and Private. Skandia Liv co-operates with both. Parallel with this, a new governance model is being introduced with strong focus on clear roles, responsibility and decision-making.
Attractive customer offerings for private persons as well as companies, with innovative and value-for-money products, advice, and committed and qualified employees, set the stage for good results. The vision is that Skandia Liv will have the insurance market’s most satisfied customers by 2011.
proposed distribution of profitProvided on p. 38.
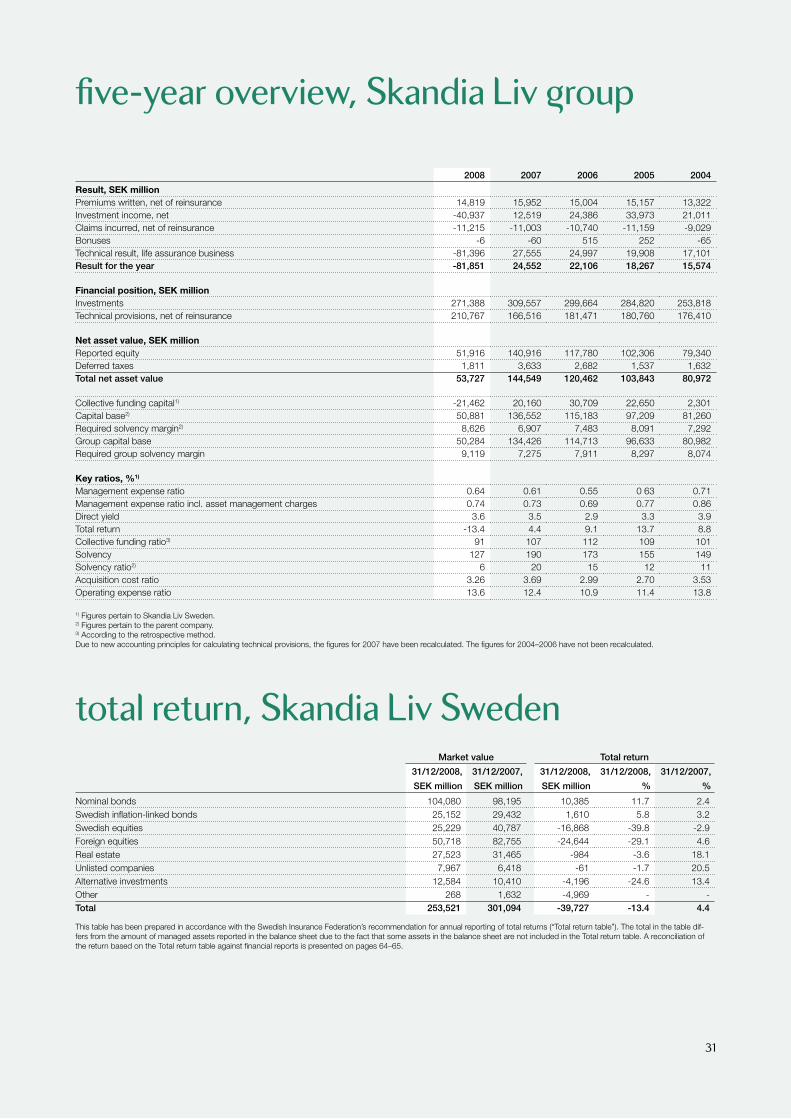
five-year overview, Skandia Liv ¯roup
2008 2007 2006 2005 2004
Result, SEK millionPremiums written, net of reinsurance 14,819 15,952 15,004 15,157 13,322Investment income, net -40,937 12,519 24,386 33,973 21,011Claims incurred, net of reinsurance -11,215 -11,003 -10,740 -11,159 -9,029Bonuses -6 -60 515 252 -65Technical result, life assurance business -81,396 27,555 24,997 19,908 17,101Result for the year -81,851 24,552 22,106 18,267 15,574
Financial position, SEK millionInvestments 271,388 309,557 299,664 284,820 253,818Technical provisions, net of reinsurance 210,767 166,516 181,471 180,760 176,410
Net asset value, SEK millionReported equity 51,916 140,916 117,780 102,306 79,340Deferred taxes 1,811 3,633 2,682 1,537 1,632Total net asset value 53,727 144,549 120,462 103,843 80,972
Collective funding capital1) -21,462 20,160 30,709 22,650 2,301Capital base2) 50,881 136,552 115,183 97,209 81,260Required solvency margin2) 8,626 6,907 7,483 8,091 7,292Group capital base 50,284 134,426 114,713 96,633 80,982Required group solvency margin 9,119 7,275 7,911 8,297 8,074
Key ratios, %1)
Management expense ratio 0.64 0.61 0.55 0 63 0.71Management expense ratio incl. asset management charges 0.74 0.73 0.69 0.77 0.86Direct yield 3.6 3.5 2.9 3.3 3.9Total return -13.4 4.4 9.1 13.7 8.8Collective funding ratio3) 91 107 112 109 101Solvency 127 190 173 155 149Solvency ratio2) 6 20 15 12 11Acquisition cost ratio 3.26 3.69 2.99 2.70 3.53Operating expense ratio 13.6 12.4 10.9 11.4 13.8
1) Figures pertain to Skandia Liv Sweden.2) Figures pertain to the parent company.3) According to the retrospective method.Due to new accounting principles for calculating technical provisions, the figures for 2007 have been recalculated. The figures for 2004–2006 have not been recalculated.
total return, Skandia Liv SwedenMarket value Total return
31/12/2008, 31/12/2007, 31/12/2008, 31/12/2008, 31/12/2007,
SEK million SEK million SEK million % %
Nominal bonds 104,080 98,195 10,385 11.7 2.4Swedish inflation-linked bonds 25,152 29,432 1,610 5.8 3.2Swedish equities 25,229 40,787 -16,868 -39.8 -2.9Foreign equities 50,718 82,755 -24,644 -29.1 4.6Real estate 27,523 31,465 -984 -3.6 18.1Unlisted companies 7,967 6,418 -61 -1.7 20.5Alternative investments 12,584 10,410 -4,196 -24.6 13.4Other 268 1,632 -4,969 - -Total 253,521 301,094 -39,727 -13.4 4.4
This table has been prepared in accordance with the Swedish Insurance Federation’s recommendation for annual reporting of total returns (“Total return table”). The total in the table dif-fers from the amount of managed assets reported in the balance sheet due to the fact that some assets in the balance sheet are not included in the Total return table. A reconciliation of the return based on the Total return table against financial reports is presented on pages 64–65.
31
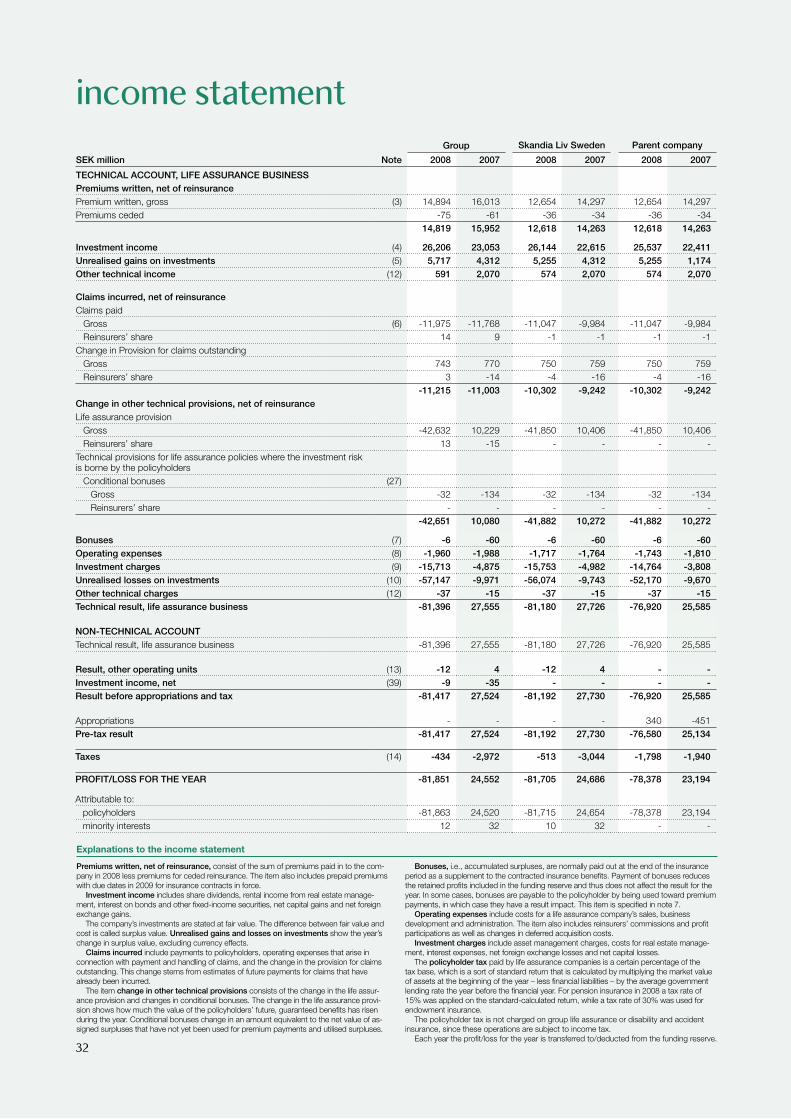
income statementGroup Skandia Liv Sweden Parent company
SEK million Note 2008 2007 2008 2007 2008 2007
TECHNICAL ACCOUNT, LIFE ASSURANCE BUSINESSPremiums written, net of reinsurancePremium written, gross (3) 14,894 16,013 12,654 14,297 12,654 14,297Premiums ceded -75 -61 -36 -34 -36 -34
14,819 15,952 12,618 14,263 12,618 14,263
Investment income (4) 26,206 23,053 26,144 22,615 25,537 22,411Unrealised gains on investments (5) 5,717 4,312 5,255 4,312 5,255 1,174Other technical income (12) 591 2,070 574 2,070 574 2,070
Claims incurred, net of reinsuranceClaims paid
Gross (6) -11,975 -11,768 -11,047 -9,984 -11,047 -9,984Reinsurers’ share 14 9 -1 -1 -1 -1
Change in Provision for claims outstandingGross 743 770 750 759 750 759Reinsurers’ share 3 -14 -4 -16 -4 -16
-11,215 -11,003 -10,302 -9,242 -10,302 -9,242Change in other technical provisions, net of reinsuranceLife assurance provision
Gross -42,632 10,229 -41,850 10,406 -41,850 10,406Reinsurers’ share 13 -15 - - - -
Technical provisions for life assurance policies where the investment risk is borne by the policyholders
Conditional bonuses (27)Gross -32 -134 -32 -134 -32 -134Reinsurers’ share - - - - - -
-42,651 10,080 -41,882 10,272 -41,882 10,272
Bonuses (7) -6 -60 -6 -60 -6 -60Operating expenses (8) -1,960 -1,988 -1,717 -1,764 -1,743 -1,810Investment charges (9) -15,713 -4,875 -15,753 -4,982 -14,764 -3,808Unrealised losses on investments (10) -57,147 -9,971 -56,074 -9,743 -52,170 -9,670Other technical charges (12) -37 -15 -37 -15 -37 -15Technical result, life assurance business -81,396 27,555 -81,180 27,726 -76,920 25,585
NON-TECHNICAL ACCOUNTTechnical result, life assurance business -81,396 27,555 -81,180 27,726 -76,920 25,585
Result, other operating units (13) -12 4 -12 4 - -Investment income, net (39) -9 -35 - - - -Result before appropriations and tax -81,417 27,524 -81,192 27,730 -76,920 25,585
Appropriations - - - - 340 -451Pre-tax result -81,417 27,524 -81,192 27,730 -76,580 25,134
Taxes (14) -434 -2,972 -513 -3,044 -1,798 -1,940
PROFIT/LOSS FOR THE YEAR -81,851 24,552 -81,705 24,686 -78,378 23,194
Attributable to:policyholders -81,863 24,520 -81,715 24,654 -78,378 23,194minority interests 12 32 10 32 - -
Explanations to the income statement
Premiums written, net of reinsurance, consist of the sum of premiums paid in to the com-pany in 2008 less premiums for ceded reinsurance. The item also includes prepaid premiums with due dates in 2009 for insurance contracts in force.
Investment income includes share dividends, rental income from real estate manage-ment, interest on bonds and other fixed-income securities, net capital gains and net foreign exchange gains.
The company’s investments are stated at fair value. The difference between fair value and cost is called surplus value. Unrealised gains and losses on investments show the year’s change in surplus value, excluding currency effects.
Claims incurred include payments to policyholders, operating expenses that arise in connection with payment and handling of claims, and the change in the provision for claims outstanding. This change stems from estimates of future payments for claims that have already been incurred.
The item change in other technical provisions consists of the change in the life assur-ance provision and changes in conditional bonuses. The change in the life assurance provi-sion shows how much the value of the policyholders’ future, guaranteed benefits has risen during the year. Conditional bonuses change in an amount equivalent to the net value of as-signed surpluses that have not yet been used for premium payments and utilised surpluses.
Bonuses, i.e., accumulated surpluses, are normally paid out at the end of the insurance period as a supplement to the contracted insurance benefits. Payment of bonuses reduces the retained profits included in the funding reserve and thus does not affect the result for the year. In some cases, bonuses are payable to the policyholder by being used toward premium payments, in which case they have a result impact. This item is specified in note 7.
Operating expenses include costs for a life assurance company’s sales, business development and administration. The item also includes reinsurers’ commissions and profit participations as well as changes in deferred acquisition costs.
Investment charges include asset management charges, costs for real estate manage-ment, interest expenses, net foreign exchange losses and net capital losses.
The policyholder tax paid by life assurance companies is a certain percentage of the tax base, which is a sort of standard return that is calculated by multiplying the market value of assets at the beginning of the year – less financial liabilities – by the average government lending rate the year before the financial year. For pension insurance in 2008 a tax rate of 15% was applied on the standard-calculated return, while a tax rate of 30% was used for endowment insurance.
The policyholder tax is not charged on group life assurance or disability and accident insurance, since these operations are subject to income tax.
Each year the profit/loss for the year is transferred to/deducted from the funding reserve.32
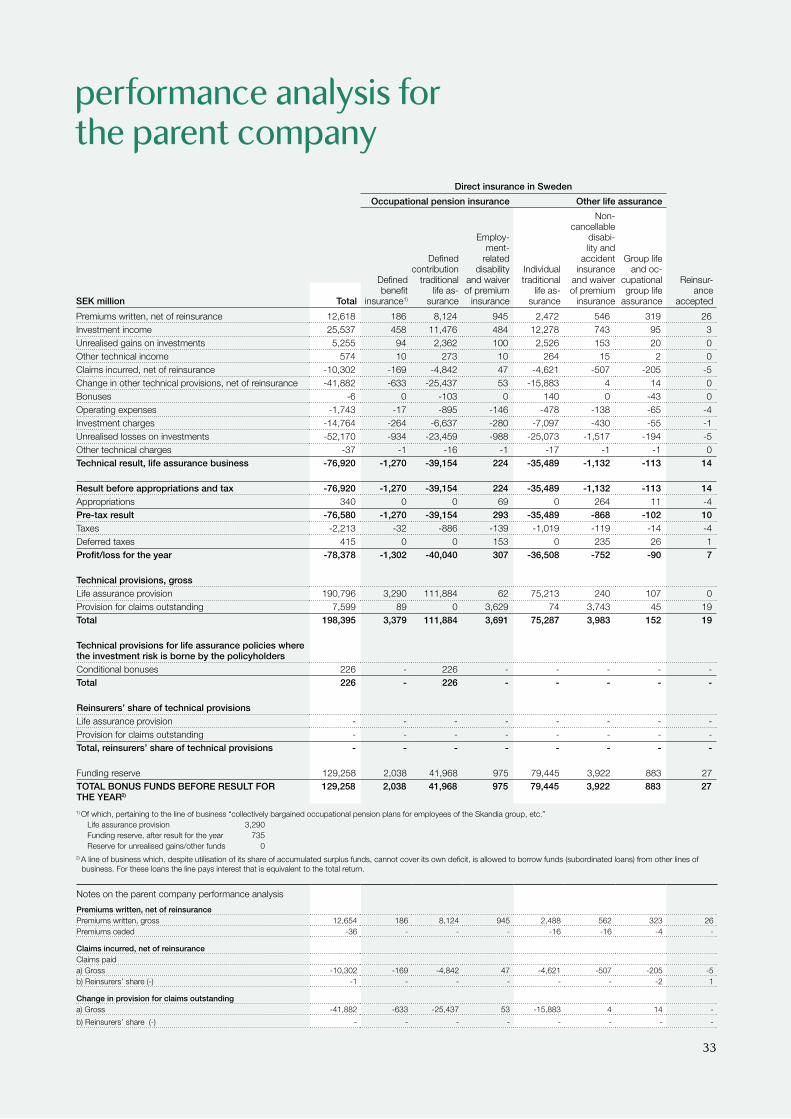
performance analysis for the parent company
Direct insurance in Sweden
Occupational pension insurance Other life assurance
SEK million
Defined benefit
insurance1)
Defined contribution
traditional life as-
surance
Employ-ment-
related disability
and waiver of premium
insurance
Individual traditional
life as-surance
Non-cancellable
disabi-lity and
accident insurance
and waiver of premium
insurance
Group life and oc-
cupational group life
assurance
Reinsur-ance
acceptedTotal
Premiums written, net of reinsurance 12,618 186 8,124 945 2,472 546 319 26Investment income 25,537 458 11,476 484 12,278 743 95 3Unrealised gains on investments 5,255 94 2,362 100 2,526 153 20 0Other technical income 574 10 273 10 264 15 2 0Claims incurred, net of reinsurance -10,302 -169 -4,842 47 -4,621 -507 -205 -5Change in other technical provisions, net of reinsurance -41,882 -633 -25,437 53 -15,883 4 14 0Bonuses -6 0 -103 0 140 0 -43 0Operating expenses -1,743 -17 -895 -146 -478 -138 -65 -4Investment charges -14,764 -264 -6,637 -280 -7,097 -430 -55 -1Unrealised losses on investments -52,170 -934 -23,459 -988 -25,073 -1,517 -194 -5Other technical charges -37 -1 -16 -1 -17 -1 -1 0Technical result, life assurance business -76,920 -1,270 -39,154 224 -35,489 -1,132 -113 14
Result before appropriations and tax -76,920 -1,270 -39,154 224 -35,489 -1,132 -113 14Appropriations 340 0 0 69 0 264 11 -4Pre-tax result -76,580 -1,270 -39,154 293 -35,489 -868 -102 10Taxes -2,213 -32 -886 -139 -1,019 -119 -14 -4Deferred taxes 415 0 0 153 0 235 26 1Profit/loss for the year -78,378 -1,302 -40,040 307 -36,508 -752 -90 7
Technical provisions, grossLife assurance provision 190,796 3,290 111,884 62 75,213 240 107 0Provision for claims outstanding 7,599 89 0 3,629 74 3,743 45 19Total 198,395 3,379 111,884 3,691 75,287 3,983 152 19
Technical provisions for life assurance policies wherethe investment risk is borne by the policyholdersConditional bonuses 226 - 226 - - - - -Total 226 - 226 - - - - -
Reinsurers’ share of technical provisionsLife assurance provision - - - - - - - -Provision for claims outstanding - - - - - - - -Total, reinsurers’ share of technical provisions - - - - - - - -
Funding reserve 129,258 2,038 41,968 975 79,445 3,922 883 27TOTAL BONUS FUNDS BEFORE RESULT FOR THE YEAR2)
129,258 2,038 41,968 975 79,445 3,922 883 27
1) Of which, pertaining to the line of business “collectively bargained occupational pension plans for employees of the Skandia group, etc.”Life assurance provision 3,290Funding reserve, after result for the year 735Reserve for unrealised gains/other funds 0
2) A line of business which, despite utilisation of its share of accumulated surplus funds, cannot cover its own deficit, is allowed to borrow funds (subordinated loans) from other lines of business. For these loans the line pays interest that is equivalent to the total return.
Notes on the parent company performance analysis
Premiums written, net of reinsurancePremiums written, gross 12,654 186 8,124 945 2,488 562 323 26Premiums ceded -36 - - - -16 -16 -4 -
Claims incurred, net of reinsuranceClaims paida) Gross -10,302 -169 -4,842 47 -4,621 -507 -205 -5b) Reinsurers’ share (-) -1 - - - - - -2 1
Change in provision for claims outstandinga) Gross -41,882 -633 -25,437 53 -15,883 4 14 -
b) Reinsurers’ share (-) - - - - - - - -
33
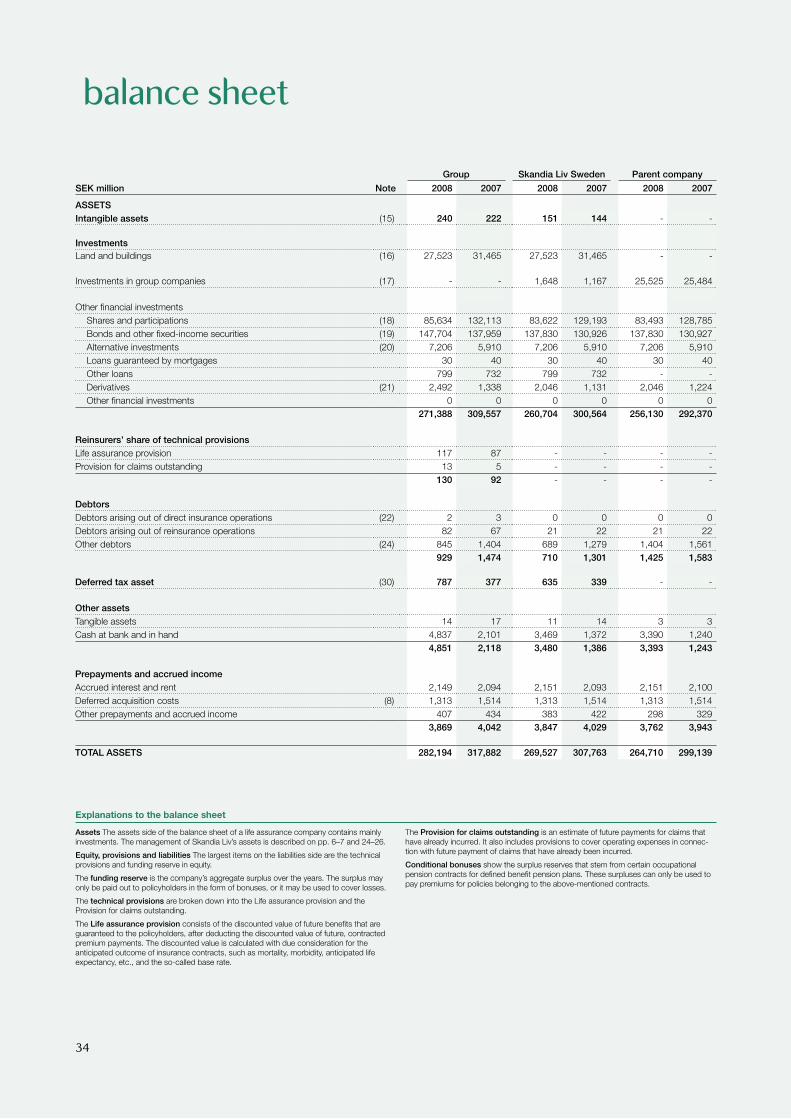
balance sheet
Explanations to the balance sheet
Group Skandia Liv Sweden Parent company
SEK million Note 2008 2007 2008 2007 2008 2007
ASSETSIntangible assets (15) 240 222 151 144 - -
InvestmentsLand and buildings (16) 27,523 31,465 27,523 31,465 - -
Investments in group companies (17) - - 1,648 1,167 25,525 25,484
Other financial investmentsShares and participations (18) 85,634 132,113 83,622 129,193 83,493 128,785Bonds and other fixed-income securities (19) 147,704 137,959 137,830 130,926 137,830 130,927Alternative investments (20) 7,206 5,910 7,206 5,910 7,206 5,910Loans guaranteed by mortgages 30 40 30 40 30 40Other loans 799 732 799 732 - -Derivatives (21) 2,492 1,338 2,046 1,131 2,046 1,224Other financial investments 0 0 0 0 0 0
271,388 309,557 260,704 300,564 256,130 292,370
Reinsurers’ share of technical provisionsLife assurance provision 117 87 - - - -Provision for claims outstanding 13 5 - - - -
130 92 - - - -
DebtorsDebtors arising out of direct insurance operations (22) 2 3 0 0 0 0Debtors arising out of reinsurance operations 82 67 21 22 21 22Other debtors (24) 845 1,404 689 1,279 1,404 1,561 929 1,474 710 1,301 1,425 1,583
Deferred tax asset (30) 787 377 635 339 - -
Other assetsTangible assets 14 17 11 14 3 3Cash at bank and in hand 4,837 2,101 3,469 1,372 3,390 1,240
4,851 2,118 3,480 1,386 3,393 1,243
Prepayments and accrued incomeAccrued interest and rent 2,149 2,094 2,151 2,093 2,151 2,100Deferred acquisition costs (8) 1,313 1,514 1,313 1,514 1,313 1,514Other prepayments and accrued income 407 434 383 422 298 329
3,869 4,042 3,847 4,029 3,762 3,943
TOTAL ASSETS 282,194 317,882 269,527 307,763 264,710 299,139
Assets The assets side of the balance sheet of a life assurance company contains mainly investments. The management of Skandia Liv’s assets is described on pp. 6–7 and 24–26.
Equity, provisions and liabilities The largest items on the liabilities side are the technical provisions and funding reserve in equity.
The funding reserve is the company’s aggregate surplus over the years. The surplus may only be paid out to policyholders in the form of bonuses, or it may be used to cover losses.
The technical provisions are broken down into the Life assurance provision and the Provision for claims outstanding.
The Life assurance provision consists of the discounted value of future benefits that are guaranteed to the policyholders, after deducting the discounted value of future, contracted premium payments. The discounted value is calculated with due consideration for the anticipated outcome of insurance contracts, such as mortality, morbidity, anticipated life expectancy, etc., and the so-called base rate.
The Provision for claims outstanding is an estimate of future payments for claims that have already incurred. It also includes provisions to cover operating expenses in connec-tion with future payment of claims that have already been incurred.
Conditional bonuses show the surplus reserves that stem from certain occupational pension contracts for defined benefit pension plans. These surpluses can only be used to pay premiums for policies belonging to the above-mentioned contracts.
34
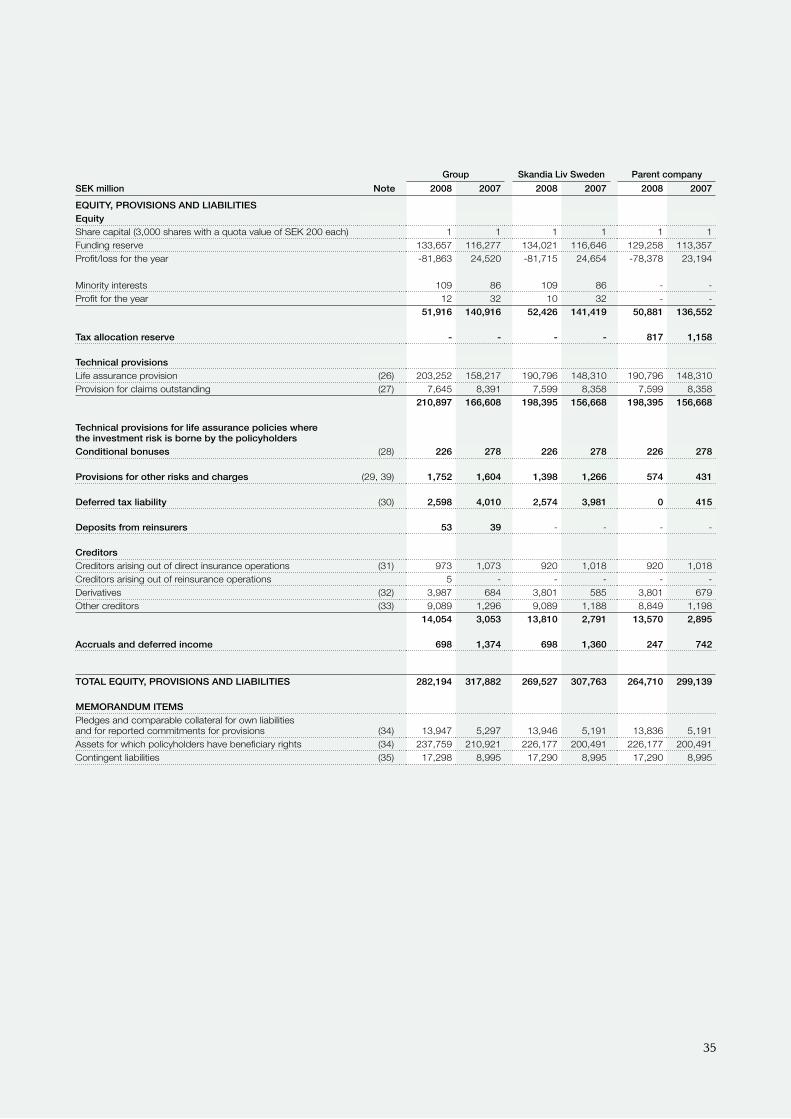
Group Skandia Liv Sweden Parent company
SEK million Note 2008 2007 2008 2007 2008 2007
EQUITY, PROVISIONS AND LIABILITIESEquity Share capital (3,000 shares with a quota value of SEK 200 each) 1 1 1 1 1 1Funding reserve 133,657 116,277 134,021 116,646 129,258 113,357Profit/loss for the year -81,863 24,520 -81,715 24,654 -78,378 23,194
Minority interests 109 86 109 86 - -Profit for the year 12 32 10 32 - -
51,916 140,916 52,426 141,419 50,881 136,552
Tax allocation reserve - - - - 817 1,158
Technical provisionsLife assurance provision (26) 203,252 158,217 190,796 148,310 190,796 148,310Provision for claims outstanding (27) 7,645 8,391 7,599 8,358 7,599 8,358
210,897 166,608 198,395 156,668 198,395 156,668
Technical provisions for life assurance policies wherethe investment risk is borne by the policyholdersConditional bonuses (28) 226 278 226 278 226 278
Provisions for other risks and charges (29, 39) 1,752 1,604 1,398 1,266 574 431
Deferred tax liability (30) 2,598 4,010 2,574 3,981 0 415
Deposits from reinsurers 53 39 - - - -
CreditorsCreditors arising out of direct insurance operations (31) 973 1,073 920 1,018 920 1,018Creditors arising out of reinsurance operations 5 - - - - -Derivatives (32) 3,987 684 3,801 585 3,801 679Other creditors (33) 9,089 1,296 9,089 1,188 8,849 1,198
14,054 3,053 13,810 2,791 13,570 2,895
Accruals and deferred income 698 1,374 698 1,360 247 742
TOTAL EQUITY, PROVISIONS AND LIABILITIES 282,194 317,882 269,527 307,763 264,710 299,139
MEMORANDUM ITEMSPledges and comparable collateral for own liabilitiesand for reported commitments for provisions (34) 13,947 5,297 13,946 5,191 13,836 5,191Assets for which policyholders have beneficiary rights (34) 237,759 210,921 226,177 200,491 226,177 200,491Contingent liabilities (35) 17,298 8,995 17,290 8,995 17,290 8,995
35
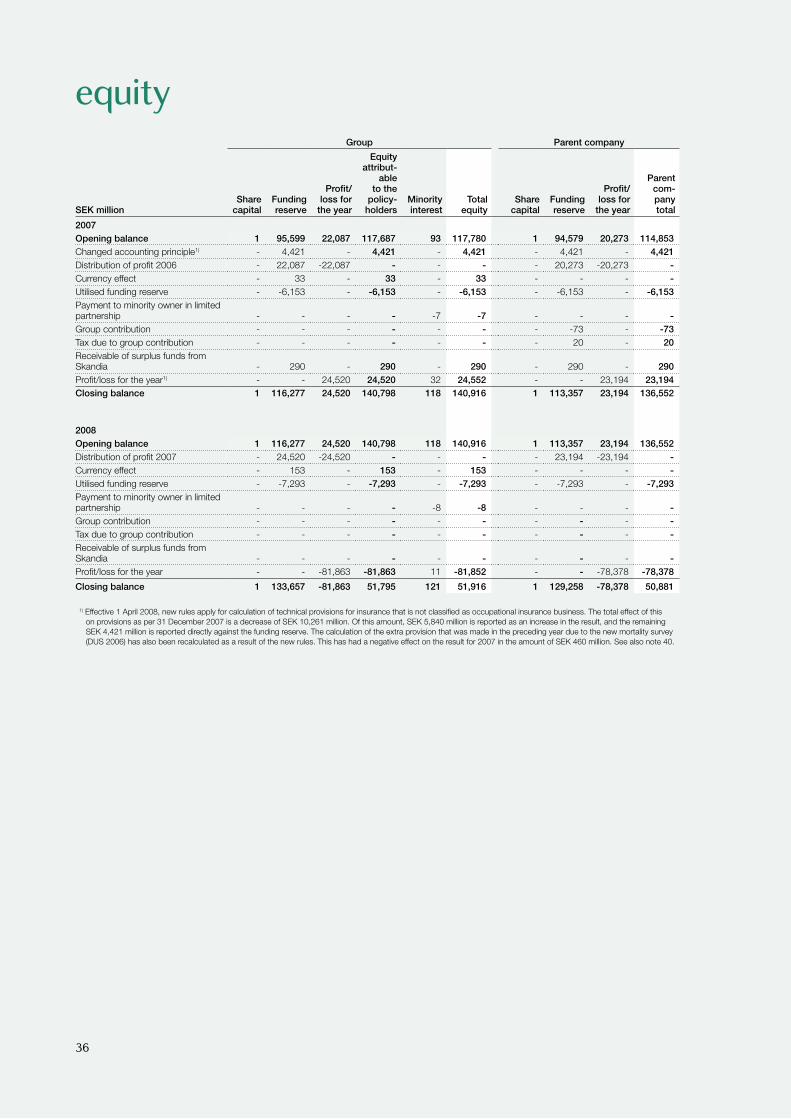
equityGroup Parent company
SEK millionShare
capitalFunding reserve
Profit/loss for
the year
Equity attribut-
able to the
policy-holders
Minority interest
Total equity
Share capital
Funding reserve
Profit/loss for
the year
Parent com-pany total
2007Opening balance 1 95,599 22,087 117,687 93 117,780 1 94,579 20,273 114,853Changed accounting principle1) - 4,421 - 4,421 - 4,421 - 4,421 - 4,421Distribution of profit 2006 - 22,087 -22,087 - - - - 20,273 -20,273 -Currency effect - 33 - 33 - 33 - - - -Utilised funding reserve - -6,153 - -6,153 - -6,153 - -6,153 - -6,153Payment to minority owner in limited partnership - - - - -7 -7 - - - -Group contribution - - - - - - - -73 - -73Tax due to group contribution - - - - - - - 20 - 20Receivable of surplus funds from Skandia - 290 - 290 - 290 - 290 - 290Profit/loss for the year1) - - 24,520 24,520 32 24,552 - - 23,194 23,194Closing balance 1 116,277 24,520 140,798 118 140,916 1 113,357 23,194 136,552
2008Opening balance 1 116,277 24,520 140,798 118 140,916 1 113,357 23,194 136,552Distribution of profit 2007 - 24,520 -24,520 - - - - 23,194 -23,194 -Currency effect - 153 - 153 - 153 - - - -Utilised funding reserve - -7,293 - -7,293 - -7,293 - -7,293 - -7,293Payment to minority owner in limited partnership - - - - -8 -8 - - - -Group contribution - - - - - - - - - -Tax due to group contribution - - - - - - - - - -Receivable of surplus funds from Skandia - - - - - - - - - -Profit/loss for the year - - -81,863 -81,863 11 -81,852 - - -78,378 -78,378
Closing balance 1 133,657 -81,863 51,795 121 51,916 1 129,258 -78,378 50,881
1) Effective 1 April 2008, new rules apply for calculation of technical provisions for insurance that is not classified as occupational insurance business. The total effect of this on provisions as per 31 December 2007 is a decrease of SEK 10,261 million. Of this amount, SEK 5,840 million is reported as an increase in the result, and the remaining SEK 4,421 million is reported directly against the funding reserve. The calculation of the extra provision that was made in the preceding year due to the new mortality survey (DUS 2006) has also been recalculated as a result of the new rules. This has had a negative effect on the result for 2007 in the amount of SEK 460 million. See also note 40.
36
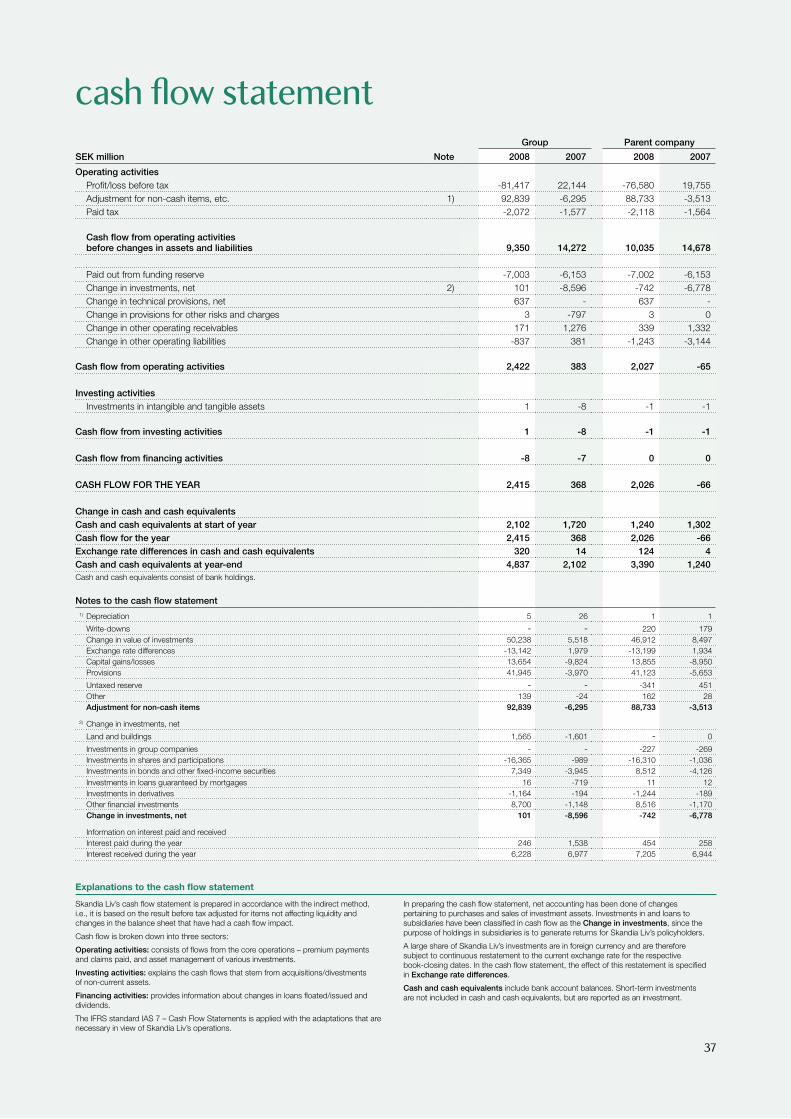
cash flow statement
Explanations to the cash flow statement
Skandia Liv’s cash flow statement is prepared in accordance with the indirect method,i.e., it is based on the result before tax adjusted for items not affecting liquidity andchanges in the balance sheet that have had a cash flow impact.
Cash flow is broken down into three sectors:
Operating activities: consists of flows from the core operations – premium paymentsand claims paid, and asset management of various investments.
Investing activities: explains the cash flows that stem from acquisitions/divestmentsof non-current assets.
Financing activities: provides information about changes in loans floated/issued anddividends.
The IFRS standard IAS 7 – Cash Flow Statements is applied with the adaptations that are necessary in view of Skandia Liv’s operations.
In preparing the cash flow statement, net accounting has been done of changespertaining to purchases and sales of investment assets. Investments in and loans tosubsidiaries have been classified in cash flow as the Change in investments, since thepurpose of holdings in subsidiaries is to generate returns for Skandia Liv’s policyholders.
A large share of Skandia Liv’s investments are in foreign currency and are thereforesubject to continuous restatement to the current exchange rate for the respectivebook-closing dates. In the cash flow statement, the effect of this restatement is specifiedin Exchange rate differences.
Cash and cash equivalents include bank account balances. Short-term investmentsare not included in cash and cash equivalents, but are reported as an investment.
Group Parent company
SEK million Note 2008 2007 2008 2007
Operating activitiesProfit/loss before tax -81,417 22,144 -76,580 19,755Adjustment for non-cash items, etc. 1) 92,839 -6,295 88,733 -3,513Paid tax -2,072 -1,577 -2,118 -1,564
Cash flow from operating activitiesbefore changes in assets and liabilities 9,350 14,272 10,035 14,678
Paid out from funding reserve -7,003 -6,153 -7,002 -6,153Change in investments, net 2) 101 -8,596 -742 -6,778Change in technical provisions, net 637 - 637 -Change in provisions for other risks and charges 3 -797 3 0Change in other operating receivables 171 1,276 339 1,332Change in other operating liabilities -837 381 -1,243 -3,144
Cash flow from operating activities 2,422 383 2,027 -65
Investing activitiesInvestments in intangible and tangible assets 1 -8 -1 -1
Cash flow from investing activities 1 -8 -1 -1
Cash flow from financing activities -8 -7 0 0
CASH FLOW FOR THE YEAR 2,415 368 2,026 -66
Change in cash and cash equivalentsCash and cash equivalents at start of year 2,102 1,720 1,240 1,302Cash flow for the year 2,415 368 2,026 -66Exchange rate differences in cash and cash equivalents 320 14 124 4Cash and cash equivalents at year-end 4,837 2,102 3,390 1,240Cash and cash equivalents consist of bank holdings.
Notes to the cash flow statement1) Depreciation 5 26 1 1
Write-downs - - 220 179Change in value of investments 50,238 5,518 46,912 8,497Exchange rate differences -13,142 1,979 -13,199 1,934Capital gains/losses 13,654 -9,824 13,855 -8,950Provisions 41,945 -3,970 41,123 -5,653
Untaxed reserve - - -341 451Other 139 -24 162 28Adjustment for non-cash items 92,839 -6,295 88,733 -3,513
2) Change in investments, net
Land and buildings 1,565 -1,601 - 0
Investments in group companies - - -227 -269Investments in shares and participations -16,365 -989 -16,310 -1,036Investments in bonds and other fixed-income securities 7,349 -3,945 8,512 -4,126Investments in loans guaranteed by mortgages 16 -719 11 12Investments in derivatives -1,164 -194 -1,244 -189Other financial investments 8,700 -1,148 8,516 -1,170Change in investments, net 101 -8,596 -742 -6,778
Information on interest paid and receivedInterest paid during the year 246 1,538 454 258Interest received during the year 6,228 6,977 7,205 6,944
37
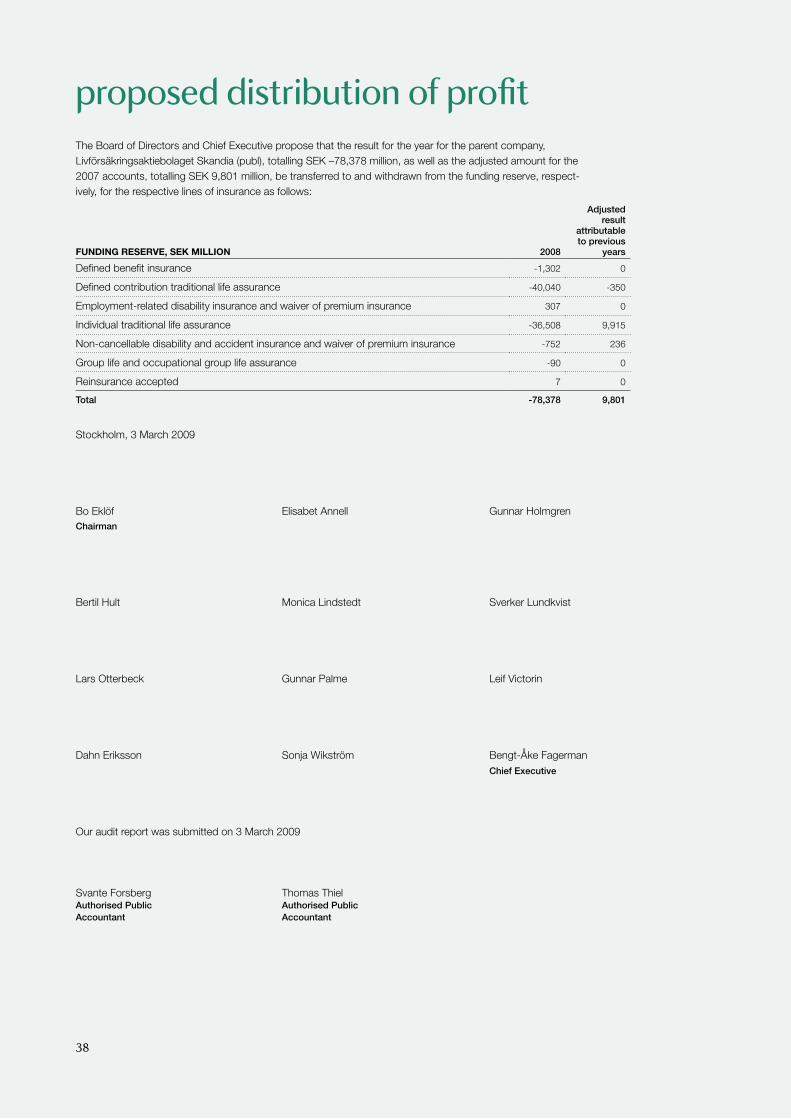
proposed distribution of profitThe Board of Directors and Chief Executive propose that the result for the year for the parent company, Livförsäkringsaktiebolaget Skandia (publ), totalling SEK –78,378 million, as well as the adjusted amount for the 2007 accounts, totalling SEK 9,801 million, be transferred to and withdrawn from the funding reserve, respectively, for the respective lines of insurance as follows:
Stockholm, 3 March 2009
Bo Eklöf Elisabet Annell Gunnar HolmgrenChairman
Bertil Hult Monica Lindstedt Sverker Lundkvist
Lars Otterbeck Gunnar Palme Leif Victorin
Dahn Eriksson Sonja Wikström BengtÅke Fagerman Chief Executive
Our audit report was submitted on 3 March 2009
Svante Forsberg Thomas Thiel Authorised Public Authorised PublicAccountant Accountant
FUNDING RESERVE, SEK mIllIoN 2008
Adjusted result
attributable to previous
years
Defined benefit insurance 1,302 0
Defined contribution traditional life assurance 40,040 350
Employmentrelated disability insurance and waiver of premium insurance 307 0
Individual traditional life assurance 36,508 9,915
Noncancellable disability and accident insurance and waiver of premium insurance 752 236
Group life and occupational group life assurance 90 0
Reinsurance accepted 7 0
Total -78,378 9,801
38
notes
notesAll amounts are stated in SEK million, unless specified otherwise.
1 Si¯nificant accountin ̄policies and valuation principles
This annual report is issued as per 31 December 2008 and pertains to Livförsäkringsaktiebolaget Skandia, with registered office in Stockholm. The address of the head offices is Sveavägen 44, Stockholm, and the company’s registered number is 502019-6365.
Basis of preparationThe 2008 Annual Report has been prepared in accordance with the Annual Accounts Act for Insurance Companies and the directions of the Swedish Financial Supervisory Authority (FFFS 2008:26). The latter took effect on 1 January 2009, however, Skandia Liv has opted to apply them already in 2008. Skandia Liv also applies recommendation no. 2 of the Swedish Financial Reporting Board.
Skandia Liv applies so-called legally limited IFRS. This entails application of all International Financial Reporting Standards (IFRS) endorsed by the EU, subject to the additions and limitations posed by Swedish law.
The parent company applies the same accounting policies as the group, with the exceptions described in the pertinent sections below.
Skandia Liv’s functional currency is the Swedish krona, and the financial statements for both the parent company and the group are presented in Swe-dish kronor, rounded off to the nearest million. The accounting policies de-scribed below have been used for all periods presented in these consolidated accounts, with exception for the years 2004–2005 in the five-year overview.
The Annual Report was approved for publication by the Board of Directors on 3 March 2009. The income statement and balance sheet will be subject to adoption by the Annual General Meeting, which is planned to be held on 30 June 2009 or earlier.
Basis of consolidationThe consolidated financial statements include the parent company and subsidiaries in which the parent company has a controlling interest. Control-ling interest entails the right to design the financial and operating strategies in order to obtain economic benefit. In determining this, consideration is given to whether the parent company directly or indirectly owns more than half of the votes for all shares/participations.
The consolidated financial statements have been prepared in accordance with the purchase method. Subsidiaries’ assets and liabilities are stated at their fair value as per the date of acquisition. If the cost upon acquisition is greater than the fair value of the net assets, this is reported as a part of goodwill. If the cost is lower, the difference is booked against profit. Profit/loss from operations that were acquired or sold during the year is taken up in the consolidated accounting from the date of acquisition until the day on which the controlling interest ceased.
Holdings in associated companies are reported under the heading “Shares and participations”. They are also valuated as other holdings under this heading. This is a departure from the instructions issued by the Financial Su-pervisory Authority, but is done since this is more compatible with the nature and purpose of the investments.
Skandia Liv and Skandia Insurance Company Ltd each own 50% of Skandia A/S. This company is consolidated in the Skandia Liv group as a joint venture, i.e., Skandia Liv’s share of the company’s assets, liabilities, revenues and expenses is included item for item.
The consolidated balance sheet is broken down into subsidiaries’ and the parent company’s untaxed reserves in deferred tax and equity. All intra-group transactions, balance sheet items, revenues and expenses are eliminated upon consolidation.
Foreign currenciesTransactions in foreign currency are recalculated, when included in the ac-counts, to SEK at the exchange rate in effect on the transaction date. As an approximation of the exchange rate in effect on the date of transaction, ordinarily the average exchange rate for the period is used. Foreign currency-denominated assets and liabilities are translated to SEK at financial year-end rates of exchange. Exchange rate differences that thereby arise are recog-nised in the income statement as net foreign exchange gains/losses.
The group’s foreign subsidiaries are classified as independent entities. Their balance sheets have thus been translated at financial year-end rates of exchange. The translation difference that arises as a result of translation of equity at a different exchange rate at the end of the year than at the start, and of translation of the result for the year in the balance sheet at a different rate than the average rate, is recorded directly to equity. Shares in group compa-nies are valued at the exchange rate in effect at the time of investment.
Important estimations and assessments for accounting purposesIn preparing the accounts, management must rely on certain estimations and assessments in certain cases. These are based on previous experience and assumptions which must be considered to be fair and reasonable. These estimations and assessments affect reported values in both the balance sheet and income statement as well as off balance sheet assumptions.
The most important assumptions regarding the future and sources of uncertainty that can affect the reported amounts of assets and liabilities are related to:
• investment properties• unlisted securities• technical provisions• pensions• disputes.
Investment propertiesSeveral assumptions and estimations are used to calculate the cash flows used to assess the value of real estate. These include such parameters as the trend in rents and overheads, inflation, the required rate of direct yield and the discount rate. A change in any of these parameters due to changes in vacancy rates, market conditions or similar affects the calculated cash flows and thus the value of the properties.
Unlisted securitiesIn valuations of instruments that lack a listed price in a well functioning mar-ket, generally accepted valuation models must be used. These are based on assumptions, estimations and market parameters.
Technical provisions Valuations of technical provisions include several estimations and assump-tions. Assumptions are made with respect to mortality, morbidity and fees, among other things. The mortality assumptions that are used are based on an industry-wide survey, but are adapted to Skandia Liv based on the company’s experience. Fee assumptions entail an estimation of future costs and future growth in assets and maturities. These assumptions are based on the company’s experience.
PensionsIn calculating Skandia Liv’s pension liability at the group level in accordance with IAS 19, assumptions are made primarily with respect to salary devel-opment, inflation and the discount rate, but also to employment time and mortality.
The absolute most important factor is the discount rate, which is based on government lending rates with durations corresponding to the pension liability. Other assumptions are based on the anticipated long-term development.
DisputesSkandia Liv is party to a number of disputes within the course of its normal business activities. Most pertain to small amounts and are judged to not have a material impact on the company’s financial position. In cases where they pertain to a major amount, an estimation is made of the probable economic outcome and the need of any provisions.
Intangible assets Intangible assets in the group are reported at cost less accumulated planned amortisation. They consist primarily of purchased or proprietary software that is judged to have economic value in coming years. All internally developed intangible assets that pertain to proprietary software are reported only if all of the following conditions are met:
• there is an identifiable asset,• it is likely that the asset that has been developed will generate future
eco nomic benefit, and• the asset’s cost can be calculated in a reliable manner.
The amortisation schedule is based on estimated useful life. If there are indi-cations that the fair value of the asset is lower than the book value, then the asset’s recoverable amount is established. If this value is judged to be below the book value, then the asset is carried at the lower amount. The impairment is recognised in the income statement.
39
notes
The costs for acquisitions or development that are reported as an asset as per the above are reported as operating expenses in the parent company’s balance sheet.
Investments Investments consist of land and buildings, investments in group companies, and financial instruments. These are stated, with the exception of shares and participations in group companies and small portfolios of loans, at their quoted or estimated fair value. Purchases and sales of securities and currencies are recognised or derecognised, respectively, in the balance sheet as per the trans-action date, i.e., on the day the transaction was carried out. The counterparty’s receivable or liability is reported gross between the transaction date and the settlement date under the items “Other debtors” or “Other creditors”. If clearing is done through a clearing organisation, the item is reported net. Purchases and sales of land and buildings are reported in the balance sheet on the day possession is taken/relinquished.
Land and buildings All of Skandia Liv’s real estate is accounted for in accordance with IAS 40 – Investment Properties. All real estate is classified as investment property, since it is held to generate rents or growth in value, or a combination of both. Real estate is carried at fair value in the income statement. Fair value is determined by external appraisals. The appraisal firms use a cash flow–based model complemented by a local price estimation in order to compare with similar properties that have been sold during a relevant comparison period.
Appraisals are normally performed yearly and include all properties. In cases where individual properties need to be re-appraised during the course of a year, these are done through entirely internal appraisals. See also note 16.
Additional costs are added to the carrying amount only if it is likely that the future economic benefit that is associated with the asset will accrue to the company and if the cost can be calculated in a reliable manner. All other ad-ditional costs are reported as costs in the period in which they are incurred. Investments in group companies Shares in group companies are stated at cost. If the fair value on the balance sheet date is judged to be below the cost, then the asset is stated at the lower value. The impairment is recognised in the income statement.
Financial instruments – classification and valuationSkandia Liv has classified its financial instruments in four categories:
• Financial assets stated at fair value through profit or loss and Financial liabilities stated at fair value through profit or loss. This category includes all investments except for a small portfolio of loans. Skandia Liv has initially chosen this classification for most assets, since the asset management is evaluated based on fair value. However, derivatives are automatically clas-sified in the subcategory “held for trading”.
• Loan receivables and trade accounts receivable. These are stated at amor-tised cost. This category includes loans, cash and securities settlement claims.
• Financial liabilities stated at amortised cost. This includes financial liabilities, such as securities settlement liabilities and creditors arising out of direct insurance operations.
• EquitiesEquities are stated at the time of acquisition as the purchase price less transaction cost, which is expensed directly. They are thereafter stated at fair value. Fair value is defined as the realisable value on the balance sheet date. For shares listed on an authorised stock exchange or marketplace, the realis-able value normally refers to the most recent bid price or, if such is lacking, the most recent quoted closing price as per the balance sheet date.
Unlisted securities are stated in accordance with the valuation principles used by industry organisations in Europe and the USA. In general, the holding shall be shown at fair value taking into account prudency and consequence in the valuation.
• Bonds and other fixed-income securitiesFixed-income securities are stated at the time of acquisition as the purchase price less transaction cost, which is expensed directly. Bonds and fixed-income securities are stated at fair value based on the most recently quoted bid price or, where such a price is lacking, at the most recently quoted closing price.
• Alternative investmentsAlternative investments consist of investments in hedge funds and other funds with a focus on commodities, infrastructure and loan portfolios. The assets are stated at fair value, set and verified by third parties.
• DerivativesDerivatives are stated at the time of acquisition at fair value, which cor-responds to the cost. Thereafter, all derivatives are stated at fair value. If the value of a derivative is positive, it is carried on the balance sheet as a receiv able, and if the value is negative, it is carried as a liability. Derivatives are valued at listed prices or published indices. Derivative transactions are con-ducted within the framework of current risk mandates and are used to reduce the financial risk and/or to improve the efficiency of asset management.
• Repurchase transactions (repos) and securities lendingIn a genuine repurchase transaction – a sale of a fixed-income security with an agreement to repurchase it at a predetermined price – the asset continues to be reported on the balance sheet, and the payment is reported as a liability under the item Other creditors. The sold security is reported as a pledged asset. In the case of a reverse repurchase transaction – the purchase of a fixed-income security with an agreement to resell it at a predetermined price – the security is not carried on the balance sheet. Instead, the payment made is reported under the item Other financial instruments. The result for both transactions is reported as interest in the item Investment income/Investment charges.
In the case of securities lending, fixed-income securities or stocks are lent out against payment. Securities out on loan continue to be reported as an asset. Security is pledged in the form of other securities, and these are stated at fair value under pledged assets together with the fair value of the securities out on loan. Compensation for the transaction is reported as interest in the item Investment income.
Realised and unrealised changes in value of investmentsChanges in value, both realised and unrealised, are recognised in the income statement and are included in the result for the year in the items Investment income or Investment charges and Unrealised gains or losses on investments, respectively. Unrealised gains or losses consist of the difference between the cost and fair value. Unrealised foreign exchange gains/losses are not included in the unrealised result, but are reported net as foreign exchange gains/losses under the item Investment income or Investment charges. By realised result is meant the difference in payments received from sales and the cost. Upon the sale of the asset in question, any previously booked, unrealised changes in value are re-entered in the income statement under unrealised gains or losses, respectively.
Deferred acquisition costsAcquisition costs that have a clear connection with the writing of insurance contracts and investment contracts are capitalised as Deferred acquisition costs in the balance sheet. The acquisition costs that are capitalised consist mainly of Skandia Liv’s variable costs related to new sales. Acquisition costs are amortised over a period of 10 years. The amortisation schedule reflects the fee charges on the policies that are to cover these costs. Consideration is given to policy lapses, among other things. If the fair value of the asset after amortisation is considered to be below the book value, the asset is carried at the lower value. The impairment is recognised in the income statement. Insurance contracts and investment contractsSkandia Liv issues insurance contracts and investment contracts. Insurance contracts are contracts under which Skandia Liv accepts significant insurance risk from the policyholder by agreeing to compensate the policyholder or other beneficiary on the occurrence of a defined insurance event. Contracts that cannot be defined as insurance contracts, because they do not transfer significant insurance risk from the policyholder to the company, are classified as investment contracts. By insignificant risk is meant that the compensation paid out on the occurrence of an insured future event does not exceed the compensation paid out if the event does not occur, by more than 5%. All of Skandia Liv’s investment contracts include a discretionary participation feature. This means that the policyholder can receive, as a supplement to guaranteed benefits, additional benefits in the form of bonuses. As a result, Skandia Liv reports investments contacts also in accordance with IFRS 4 – Insurance Contracts.
Embedded derivatives that make up a part of insurance contracts, and which in themselves constitute an insurance contract, are not unbundled from the main contract. Thus no separate valuation is made of the embedded derivative.
Preliminarily allocated, non-guaranteed surpluses, discretionary portionMost of Skandia Liv’s contracts include a discretionary participation feature. This means that a preliminarily calculated surplus is applied to every policy. This preliminarily allocated surplus is not guaranteed and thus can decrease. The surplus is used as risk capital to ensure that Skandia Liv can meet its guaran-teed obligations. Accumulated surpluses are therefore not carried as a liability, but as a funding reserve, which is part of the company’s equity.
Valuation of technical provisions• Life assurance provisionLife assurance provisions correspond to the discounted value of benefits guaranteed to policyholders by insurance contracts in force, after deducting the discounted value of future, contracted premium payments.
Life assurance provisions are calculated using generally accepted actuarial principles. This entails that the provisions are discounted to present value and that the calculations are based on assumptions on interest rates, mortality, taxes and operating expenses, among other things. Life assurance provisions and claims outstanding pertaining to occupational pensions are valued in ac-cordance with the EU’s Occupational Pensions Directive, which entails that pru-dent, realistic assumptions are to be used. For other life assurance, safeguard assumptions are used, i.e., assumptions that have a built-in safety margin.
The assumption on the discount rate has the greatest impact in the valua-tion. The choice of discount rate is prescribed in Financial Supervisory Authority guideline FFFS 2008:23. This guideline stipulates that market interest curves shall be used, which means that the choice of interest rate depends on the policies’ cash flow profile, i.e., when in time incoming and outgoing payments from the insurance are anticipated.
40
notes
A deduction for the policyholder tax and general overheads has been made from the interest rate assumption for both occupational pensions and other pensions business.
The mortality assumption used in the valuation is based on an industry-wide survey that was conducted in 1990 – the so-called M90 survey. A general adjustment of the mortality assumption has been made in view of a new industry-wide survey, called DUS 06.
Liability adequacy test: At each reporting date, Skandia Liv carries out a liability adequacy test of its insurance contract liabilities to ensure that the carrying amount of its liabilities is sufficient in the light of estimated future cash flows. The carrying amount of a liability is the value of the liability less any related intangible assets or deferred acquisition costs. In performing these tests, cur-rent best estimates of future contractual cash flows as well as administration ex penses and taxes are used. These cash flows are discounted and compared with the carrying amount of the liability. Any deficiency is immediately recogni-sed in the income statement.
In the consolidated financial statements, the life assurance provisions for the Danish operations have been calculated in accordance with Danish rules. These rules prescribe more realistic assumptions than the Swedish rules.
• Provision for claims outstandingFour separate provisions are made within the provision for claims outstand-ing: the provision for disability annuities, confirmed claims, incurred but not reported claims, and a claims handling reserve.
• The provision for disability annuities corresponds to the discounted value of the company’s obligations to insureds upon the occurrence of an accident or illness.
• The provision for confirmed claims is a provision for claims that have been reported and approved, but not paid out.
• The provision for incurred but not reported claims is based on Skandia Liv’s experience with the respective lines of insurance.
• The claims handling reserve consists of a valuation of future costs for handl-ing ongoing disability annuities.
Claims incurred for confirmed claims where the payment has fallen due but the beneficiary cannot be located are expensed. This item is reported under “Other creditors” in the balance sheet.
Other provisionsOther provisions are reported in the balance sheet when Skandia Liv has an obligation – legal or constructive – due to an event that has occurred and when it is likely that some form of financial compensation will be paid to settle the obligation and the amount can be reliably estimated.
LeasingWhether a lease is classified as a finance lease or not depends on the sub-stance of the transaction rather than the contract form. A lease is classified as a finance lease if it substantially transfers all the risks and rewards incidental to ownership of the asset. All other leasing is classified as an operating lease.
In its capacity as a lessor, the group has a finance lease. This is reported under Land and buildings. The lease payment is reported broken down into rental revenue and amortisation of the leasing claim. Other contracts are operating leases with focus on rental agreements.
PensionsParent company: Provisions for pension obligations for the parent company’s own employees are calculated in the same way as, and reported together with, the company’s other obligations for issued life assurance contracts.
Group: For defined benefit plans for Skandia Liv’s own employees, the cost of the pension obligation and pension cost is determined using the Projected Unit Credit Method, and actuarial computations are performed annually. Brief-ly, this method entails a more linear allocation of costs between the time for joining the plan and retirement age compared with previous accounting. The technical provisions that are made by the parent company are broken down in the group and are part of the calculated pension liability.
Revenues and expensesPremiumsThe cash principle is used for premium payments. The cash principle entails that paid-in premiums are recognised when they are received, regardless of which period they pertain to. Prepaid premiums are included where valid contracts exist.
Investment incomeThe item Investment income pertains to returns on investments and includes rental income from land and buildings, dividends from share and participa-tions (including dividends from shares in group and associated companies), interest income, net foreign exchange gains, reversed impairment charges and net capital gains. Investment chargesThe item Investment charges pertains to charges associated with investments and includes operating expenses for land and buildings, interest expenses, net foreign exchange losses, impairment charges, net capital losses and as-set management charges including costs for own employees, premises, etc. hat can be attributed to asset management.
Unrealised gains on investments and Unrealised losses on investmentsUnrealised changes in the value of investments when stating at fair value are reported under these items. The result is reported net for various types of investments.
Claims incurredGuaranteed benefits from investment contracts and insurance contracts are reported under this item. Any additional compensation in the form of allocated surpluses is taken directly from the funding reserve and thus does not have any result impact. Claims incurred also include the Provision for claims outstanding.
Operating expensesCosts for investment contracts and insurance contracts are recognised as expenses when they are incurred, with the exception of commissions related to new contracts and renewals of existing contracts. These are capitalised as deferred acquisition costs. The principles for deferring acquisition costs for insurance contracts are the same as for the principles for deferring acquisition costs for investment contracts.
Claims settlement costs, i.e., costs for continued handling of contracts in disbursement, are reported under Claims paid. Operating expenses for other operating companies in the group are reported under the item Result, other operating units.
TaxPolicyholder taxIn Sweden, life assurance companies pay a policyholder tax. This is not an income tax but is based on a standard calculation of the return on the net as-sets. This cost is calculated every year and is reported as a tax expense.
Income taxFor a small portion of Skandia Liv’s products – so-called risk products such as disability insurance – and for Skandia Liv’s subsidiaries, income tax is payable on the profit. Income tax consists of current tax and deferred tax and is recognised in the income statement. Current tax is calculated individually for each company in the group. Current tax also includes non-deductible withholding taxes on dividend income. The company income tax rate in Sweden is 28% of taxable income for the year.
Deferred taxes The provision for deferred taxes pertains to differences between reported and tax values of results. These include, for example, unrealised gains/losses on investments, tax depreciation of real estate and other untaxed reserves, such as the tax allocation reserve. Deferred tax assets are reported only if it is likely that these will entail lower tax payments in the near future. Deferred tax liabilities/assets are not discounted.
Deferred tax is charged or credited in the income statement, except when it relates to items charged or credited directly to equity, in which case the tax effect is also recognised immediately in equity.
Result, subsidiariesSubsidiaries that do not conduct insurance business and which are not held as part of asset management are reported under Result, other operating units.
Group contributions and shareholder contributions in legal entitiesShareholder contributions are recognised immediately in equity of the receiver and are capitalised in shares and participations of the rendering party. Group contributions are reported according to economic significance. This means that group contributions rendered and received in order to minimise the group’s total tax are reported directly against retained earnings after deduct-ing their current tax effect.
Cash flow statementThe cash flow statement is prepared using the indirect method and is broken down into operating activities, investing activities and financing activities. Since cash flow in the insurance operations strongly affects cash flow from the investment operations, both are reported under operating activities. In-vesting activities and financing activities are virtually nonexistent. Cash and cash equivalents consist only of bank balances.
2 Risks and risk mana¯ement
The operations of a life assurance company are based on active risk-taking. Through controlled and professional risk-taking, the company creates value for the policyholders in the form of insurance protection and a favourable, safe return on the savings tied to traditional life assurance. This risk-taking can give rise to losses from time to time for individual insurance products and certain investments. This is fully natural, however, the losses may not be so large so as to prevent the company from generating a favourable long-term return, and the company must at all times be able to meet its obligations to the policyholders.
Risks must be managed in different ways, depending on the following factors:
• Time perspective: Solvency risk is measured and managed in the short term, while profitability risks are long-term by nature, since they are associ-ated with contracts with long durations.
41
notes
• Ability to influence: Risks associated with the general operating environ-ment can often only be managed through changes in exposure, while risks in the company’s own operations can be influenced directly.
• Measurability: Objectively observable risks, such as financial risks on the one end of the spectrum, and future revenue risks, such as strategic risks and reputation risks, on the other.
Principles for measuring risk at Skandia LivRisk measurement – generalAll forms of risk must be measured, and preferably in a manner that makes it possible to compare various risks. One common way is to calculate sensitivity to a certain, set change in a risk factor, such as how much the result would be affected by a 1% change in all share prices, or a 5% higher mortality rate. This type of measurement is flawed in that the sensitivities are not compar-able, since the probabilities of such events are not necessarily the same.
Another common, but more practical, way of measuring risk is to use Value at Risk. This metric indicates how much of the result, or the value of the company, would be affected by a change with a certain, set probability (or level of confidence). By using the same probability for all risk factors, it is possible to compare risks. Another advantage of this type of metric is that it can be interpreted as a measure of how much capital is required to balance, or absorb, losses given a certain level of probability. Risk measured in this manner is equivalent to risk capital; therefore, in the following discussion, risk and capital requirement are synonymous concepts.
It is also desirable to be able to aggregate risks and calculate the total risk for several risk factors or even all risk factors, i.e., the company’s total risk. In general, it is not possible to only sum up the capital requirement for various risks, since it entails an assumption that a change in one risk factor always coincides with an equally large change in the other risk factors. In reality, the correlation is weaker or even non-existent. This means that a given amount of capital can be used to cover several risk factors, which is often referred to as diversification.
Measuring risk in Skandia LivSkandia Liv measures most risks – those that can be quantified in a meaning-ful manner – in terms of capital requirement. Many of the quantifiable risks are measured in different time perspectives, depending on the context. From a solvency risk perspective, risks are measured with a time horizon of one year with a confidence level of 99.5%. This means that the probability that the loss will be greater than the capital requirement is 0.5% in one year, which can also be expressed as such that losses of this magnitude can occur once every 200 years (one year divided by 0.5%). Profitability risks are measured from a longer time perspective. It is not possible to disclose in more detail how these risks are calculated, since this is considered to be a trade secret. All quantitative data in the continued reporting thus pertains to risks from a solvency risk perspective. This is also the most relevant risk metric from the customers’ standpoint, since it has direct bearing on Skandia Liv’s ability to meet its obligations.
Financial Supervisory Authority’s traffic light systemThe aim of the Financial Supervisory Authority’s traffic light system is to measure solvency risk in insurance companies. The system is based on a set grouping of risk factors, and for each of these, a capital requirement is com-puted based on measurements of risk exposure and sensitivity, which should correspond to an event that occurs at most once every 200 years. The risk factors currently cover most forms of financial risk and insurance risk, where the latter is a collective name for risks associated directly or indirectly with insurance contracts. However, the system does not include operational risks.
The traffic light system has the express purpose of encouraging diversifica-tion, which is expressed in the fact that many of the risks are assumed to be independent of each other, so that the combined capital requirement is con-siderably less than the sum of the individual capital requirements. However, at the same time, the fact is taken into account that the Swedish capital market is highly integrated with the world at large, which is why the diversification effect between Swedish and foreign securities is considerably lower than between other asset classes.
Skandia Liv’s internal model Because the traffic light system is not comprehensive and measures risk in a standard manner, it has been necessary for Skandia Liv to prepare its own model for internal risk control. This is essentially based on the same risk factors as the traffic light system, but it has been expanded to include a number of risk factors for operational risk. In addition, the internal model uses stricter assumptions regarding the covariance between various risk factors so that the diversification effects are smaller. Added to this, Skandia Liv applies a stricter valuation of assumptions – its calculations include a so-called market valuation margin in accordance with the principles that are expected to be applied in the new European Solvency II framework.
However, the internal model still contains so much uncertainty that the results cannot be publicly reported in detail. What is reported are calculations according to the traffic light system and a safety margin, which constitutes an aggregate measure of all deviations from the traffic light system.
Principles for controlling and monitoring risk at Skandia LivSolvency risk Naturally, it is important to manage all individual risks; in the end it is still the total risk for the company that determines whether the company will be able to meet all of its obligations to the policyholders. This risk is called solvency risk. Skandia Liv’s board has declared that solvency risk may be a maxi-
mum of 0.5%, which is also the risk level used by the Financial Supervisory Authority for determining the capital requirement in its traffic light system. This level is also decisive for determining how the capital requirement is to be calculated for all individual risk factors.
This is stipulated in the solvency risk policy adopted by the Board, which also stipulates that solvency risk is to be controlled by adapting the risk mandate for asset management on the basis of the value of assets and obli-gations as well as the capital requirement for insurance risks and operational risks. The utilisation of risk is based on the capital requirement for financial risks, both on the asset and liability side. If the utilisation of risk exceeds the risk mandate, the asset management must change the composition on the asset side to reduce the financial risk to the necessary extent.
Profitability risksNaturally, it is not adequate to control risks only from a solvency perspective. It is also necessary to ensure that the acceptance of risk in both the insurance operations and asset management provides a reasonable return, that is, satisfactory profitability. Control and monitoring of risks from a profitability per-spective are done at the overall company level as well as at the operational level for the two core businesses – the insurance (or product) operations, and asset management. The latter is described in more detail further below.
Overall control consists of principles/rules for the following, among other things:
• Product design• Pricing of products in general, and of risks in particular• Parameters for asset management which take into account the risks in the
company’s assumptions and the customers’ expectations of future returns.
These principles are codified in various policies that are decided on by the Board. Documentation for the principles is drawn up with the help of stochastic simulation models which make it possible to formulate the principles in a consistent manner and ensure that they remain valid under most conceivable conditions.
Operational risks Operational risks comprise several different types of risk:
• Process and security risks (including IT security, among others)• Continuity risks (disruption risks that affect many or all customers) • Compliance risks (defective compliance with rules) and reputation risks.
The distinctions reflect the fact that the risks are measured and managed in different ways. Process and security risks are measured from both solvency and profitability perspectives. This also applies for continuity risks, but they can also seriously affect future revenues and profitability to varying degrees. Reputation risks, by definition, also affect future profitability. However, they do not affect short-term profitability and thus cannot be taken into account from a solvency perspective. The fact that they are very difficult to quantify also means that they cannot be taken into account from a profitability perspective, either. This does not mean that they are disregarded, but rather that they are taken into account through various preventive measures.
Compliance risks can be viewed as a form of reputation risk: it is a matter of maintaining the confidence of legislators and regulators, and thus these are managed in a similar manner.
Strategic risksIn contrast to continuing business risks (insurance risk and financial risks), strategic risks are measured only from a profitability perspective. Granted, these do not differ with respect to the time perspective, and perhaps not with respect to the ability to influence, either. However, they do differ considerably with respect to risk management. The continuing business risks can be man-aged through changes in insurance contracts and the investment portfolio, while strategic risks usually can only be managed through major changes in operations. As a result, strategic risks are in essence much larger.
All strategic risks are measured and managed within the framework of the company’s business planning, which the Board actively participates in and also decides on.
OrganisationThe Board decides on all guidelines that control the company’s risk-taking, as well as the forms and frequency of reporting. The Board also plays an active role in risk management by deciding on the overall asset allocation via its In-vestment Committee. The CEO issues more detailed policies and instructions for the operative handling.
The Risk Management and Risk Control unit has overall responsibility for controlling and monitoring all risks. It draws up principles, methods and tools for controlling and monitoring, and drafts recommendations for guidelines and policies on behalf of the Board and CEO. The unit’s activities are headed by the Chief Risk Officer and also include the work of the Chief Actuaries and the Compliance Officer.
This business unit and the asset management unit are responsible for the ongoing management of business risks within the framework of the policies and rules adopted by the Board and CEO. Operational risks are managed in all units in consultation with various risk specialists. Co-ordination is done within the framework of the Risk Committee.
42
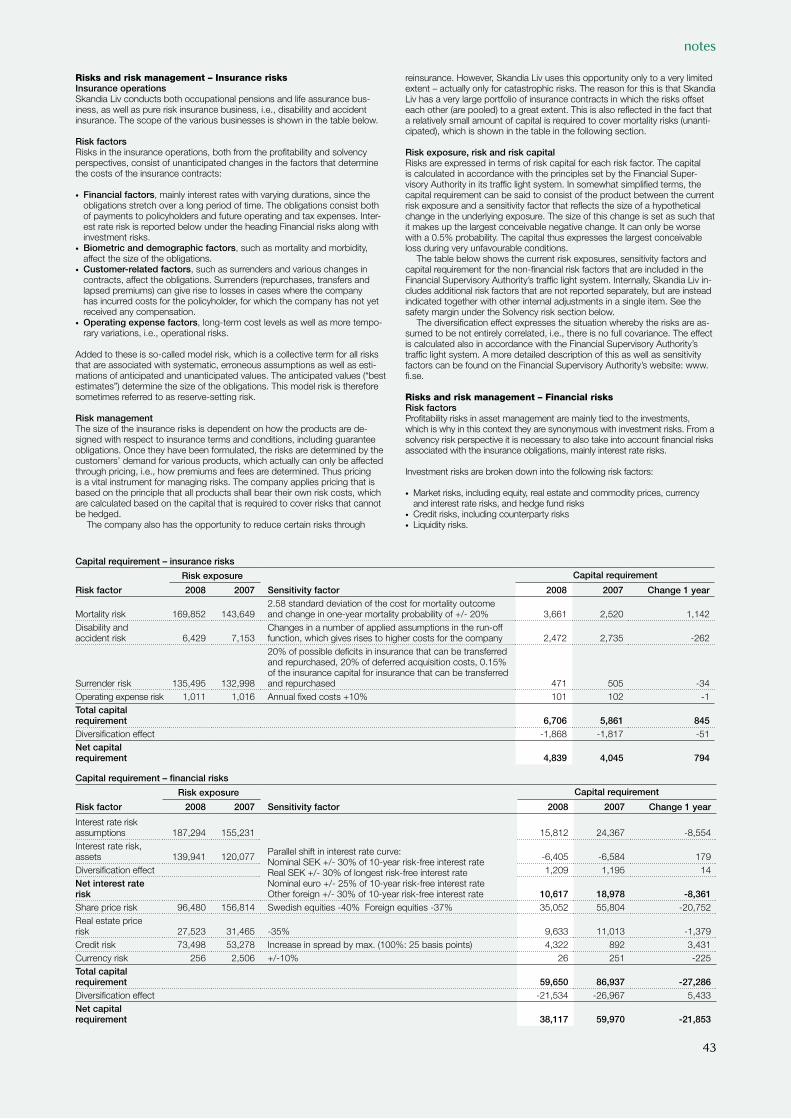
notes
Risks and risk management – Insurance risksInsurance operationsSkandia Liv conducts both occupational pensions and life assurance bus-iness, as well as pure risk insurance business, i.e., disability and accident insurance. The scope of the various businesses is shown in the table below.
Risk factorsRisks in the insurance operations, both from the profitability and solvency perspectives, consist of unanticipated changes in the factors that determine the costs of the insurance contracts:
• Financial factors, mainly interest rates with varying durations, since the obligations stretch over a long period of time. The obligations consist both of payments to policyholders and future operating and tax expenses. Inter-est rate risk is reported below under the heading Financial risks along with investment risks.
• Biometric and demographic factors, such as mortality and morbidity, affect the size of the obligations.
• Customer-related factors, such as surrenders and various changes in contracts, affect the obligations. Surrenders (repurchases, transfers and lapsed premiums) can give rise to losses in cases where the company has incurred costs for the policyholder, for which the company has not yet received any compensation.
• Operating expense factors, long-term cost levels as well as more tempo-rary variations, i.e., operational risks.
Added to these is so-called model risk, which is a collective term for all risks that are associated with systematic, erroneous assumptions as well as esti-mations of anticipated and unanticipated values. The anticipated values (“best estimates”) determine the size of the obligations. This model risk is therefore sometimes referred to as reserve-setting risk.
Risk managementThe size of the insurance risks is dependent on how the products are de-signed with respect to insurance terms and conditions, including guarantee obligations. Once they have been formulated, the risks are determined by the customers’ demand for various products, which actually can only be affected through pricing, i.e., how premiums and fees are determined. Thus pricing is a vital instrument for managing risks. The company applies pricing that is based on the principle that all products shall bear their own risk costs, which are calculated based on the capital that is required to cover risks that cannot be hedged.
The company also has the opportunity to reduce certain risks through
reinsurance. However, Skandia Liv uses this opportunity only to a very limited extent – actually only for catastrophic risks. The reason for this is that Skandia Liv has a very large portfolio of insurance contracts in which the risks offset each other (are pooled) to a great extent. This is also reflected in the fact that a relatively small amount of capital is required to cover mortality risks (unanti-cipated), which is shown in the table in the following section.
Risk exposure, risk and risk capitalRisks are expressed in terms of risk capital for each risk factor. The capital is calculated in accordance with the principles set by the Financial Super-visory Authority in its traffic light system. In somewhat simplified terms, the capital requirement can be said to consist of the product between the current risk exposure and a sensitivity factor that reflects the size of a hypothetical change in the underlying exposure. The size of this change is set as such that it makes up the largest conceivable negative change. It can only be worse with a 0.5% probability. The capital thus expresses the largest conceivable loss during very unfavourable conditions.
The table below shows the current risk exposures, sensitivity factors and capital requirement for the non-financial risk factors that are included in the Financial Supervisory Authority’s traffic light system. Internally, Skandia Liv in-cludes additional risk factors that are not reported separately, but are instead indicated together with other internal adjustments in a single item. See the safety margin under the Solvency risk section below.
The diversification effect expresses the situation whereby the risks are as-sumed to be not entirely correlated, i.e., there is no full covariance. The effect is calculated also in accordance with the Financial Supervisory Authority’s traffic light system. A more detailed description of this as well as sensitivity factors can be found on the Financial Supervisory Authority’s website: www.fi.se.
Risks and risk management – Financial risksRisk factorsProfitability risks in asset management are mainly tied to the investments, which is why in this context they are synonymous with investment risks. From a solvency risk perspective it is necessary to also take into account financial risks associated with the insurance obligations, mainly interest rate risks.
Investment risks are broken down into the following risk factors:
• Market risks, including equity, real estate and commodity prices, currency and interest rate risks, and hedge fund risks
• Credit risks, including counterparty risks• Liquidity risks.
Capital requirement – financial risks
Risk factor
Risk exposure
Sensitivity factor
Capital requirement
2008 2007 2008 2007 Change 1 year
Interest rate risk assumptions 187,294 155,231
Parallel shift in interest rate curve:Nominal SEK +/- 30% of 10-year risk-free interest rateReal SEK +/- 30% of longest risk-free interest rateNominal euro +/- 25% of 10-year risk-free interest rateOther foreign +/- 30% of 10-year risk-free interest rate
15,812 24,367 -8,554Interest rate risk, assets 139,941 120,077 -6,405 -6,584 179Diversification effect 1,209 1,195 14Net interest rate risk 10,617 18,978 -8,361Share price risk 96,480 156,814 Swedish equities -40% Foreign equities -37% 35,052 55,804 -20,752Real estate price risk 27,523 31,465 -35% 9,633 11,013 -1,379Credit risk 73,498 53,278 Increase in spread by max. (100%: 25 basis points) 4,322 892 3,431Currency risk 256 2,506 +/-10% 26 251 -225Total capital require ment 59,650 86,937 -27,286Diversification effect -21,534 -26,967 5,433Net capital require ment 38,117 59,970 -21,853
Capital requirement – insurance risks
Risk factor
Risk exposure
Sensitivity factor
Capital requirement
2008 2007 2008 2007 Change 1 year
Mortality risk 169,852 143,6492.58 standard deviation of the cost for mortality outcome and change in one-year mortality probability of +/- 20% 3,661 2,520 1,142
Disability and accident risk 6,429 7,153
Changes in a number of applied assumptions in the run-off function, which gives rises to higher costs for the company 2,472 2,735 -262
Surrender risk 135,495 132,998
20% of possible deficits in insurance that can be transferred and repurchased, 20% of deferred acquisition costs, 0.15% of the insurance capital for insurance that can be transferred and repurchased 471 505 -34
Operating expense risk 1,011 1,016 Annual fixed costs +10% 101 102 -1Total capital requirement 6,706 5,861 845Diversification effect -1,868 -1,817 -51Net capital requirement 4,839 4,045 794
43
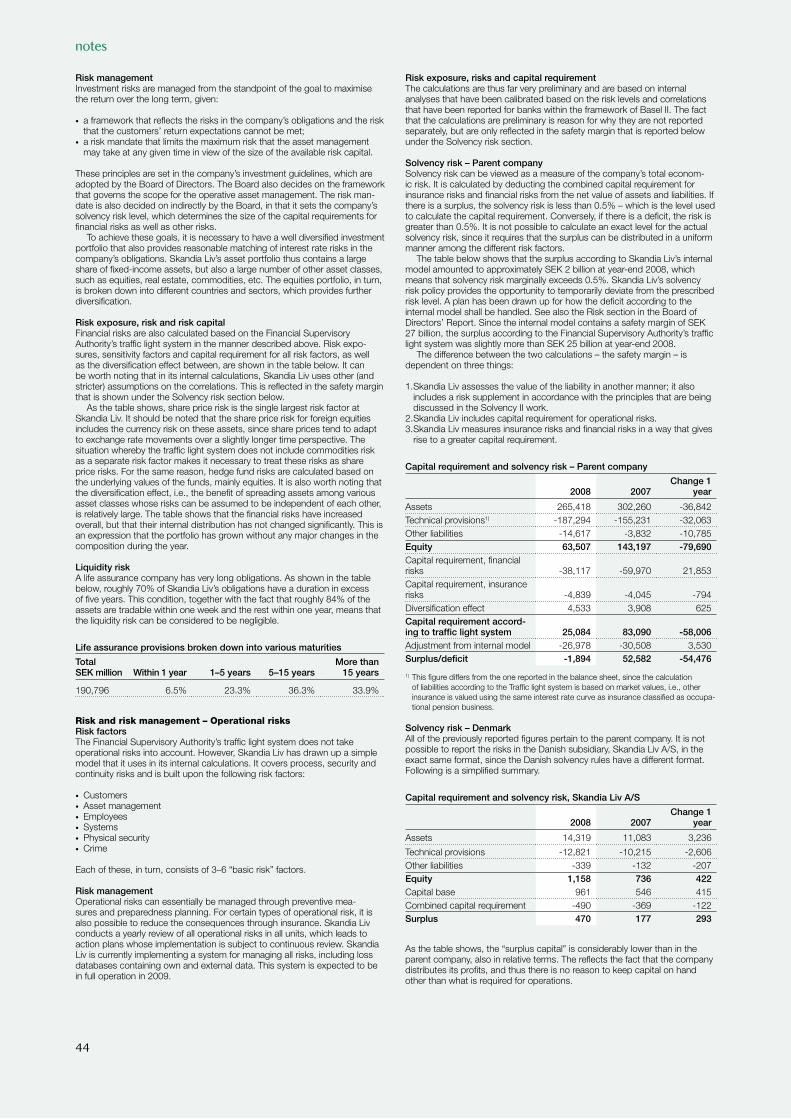
notes
Risk management Investment risks are managed from the standpoint of the goal to maximise the return over the long term, given:
• a framework that reflects the risks in the company’s obligations and the risk that the customers’ return expectations cannot be met;
• a risk mandate that limits the maximum risk that the asset management may take at any given time in view of the size of the available risk capital.
These principles are set in the company’s investment guidelines, which are adopted by the Board of Directors. The Board also decides on the framework that governs the scope for the operative asset management. The risk man-date is also decided on indirectly by the Board, in that it sets the company’s solvency risk level, which determines the size of the capital requirements for financial risks as well as other risks.
To achieve these goals, it is necessary to have a well diversified investment portfolio that also provides reasonable matching of interest rate risks in the company’s obligations. Skandia Liv’s asset portfolio thus contains a large share of fixed-income assets, but also a large number of other asset classes, such as equities, real estate, commodities, etc. The equities portfolio, in turn, is broken down into different countries and sectors, which provides further diversification.
Risk exposure, risk and risk capital Financial risks are also calculated based on the Financial Supervisory Authority’s traffic light system in the manner described above. Risk expo-sures, sensitivity factors and capital requirement for all risk factors, as well as the diversification effect between, are shown in the table below. It can be worth noting that in its internal calculations, Skandia Liv uses other (and stricter) assumptions on the correlations. This is reflected in the safety margin that is shown under the Solvency risk section below.
As the table shows, share price risk is the single largest risk factor at Skandia Liv. It should be noted that the share price risk for foreign equities includes the currency risk on these assets, since share prices tend to adapt to exchange rate movements over a slightly longer time perspective. The situation whereby the traffic light system does not include commodities risk as a separate risk factor makes it necessary to treat these risks as share price risks. For the same reason, hedge fund risks are calculated based on the underlying values of the funds, mainly equities. It is also worth noting that the diversification effect, i.e., the benefit of spreading assets among various asset classes whose risks can be assumed to be independent of each other, is relatively large. The table shows that the financial risks have increased overall, but that their internal distribution has not changed significantly. This is an expression that the portfolio has grown without any major changes in the composition during the year.
Liquidity riskA life assurance company has very long obligations. As shown in the table below, roughly 70% of Skandia Liv’s obligations have a duration in excess of five years. This condition, together with the fact that roughly 84% of the assets are tradable within one week and the rest within one year, means that the liquidity risk can be considered to be negligible.
Life assurance provisions broken down into various maturities
Total SEK million Within 1 year 1–5 years 5–15 years
More than 15 years
190,796 6.5% 23.3% 36.3% 33.9%
Risk and risk management – Operational risksRisk factorsThe Financial Supervisory Authority’s traffic light system does not take operational risks into account. However, Skandia Liv has drawn up a simple model that it uses in its internal calculations. It covers process, security and continuity risks and is built upon the following risk factors:
• Customers• Asset management• Employees• Systems• Physical security• Crime
Each of these, in turn, consists of 3–6 “basic risk” factors.
Risk managementOperational risks can essentially be managed through preventive mea-sures and preparedness planning. For certain types of operational risk, it is also possible to reduce the consequences through insurance. Skandia Liv conducts a yearly review of all operational risks in all units, which leads to action plans whose implementation is subject to continuous review. Skandia Liv is currently implementing a system for managing all risks, including loss databases containing own and external data. This system is expected to be in full operation in 2009.
Risk exposure, risks and capital requirementThe calculations are thus far very preliminary and are based on internal analyses that have been calibrated based on the risk levels and correlations that have been reported for banks within the framework of Basel II. The fact that the calculations are preliminary is reason for why they are not reported separately, but are only reflected in the safety margin that is reported below under the Solvency risk section.
Solvency risk – Parent companySolvency risk can be viewed as a measure of the company’s total econom-ic risk. It is calculated by deducting the combined capital requirement for insurance risks and financial risks from the net value of assets and liabilities. If there is a surplus, the solvency risk is less than 0.5% – which is the level used to calculate the capital requirement. Conversely, if there is a deficit, the risk is greater than 0.5%. It is not possible to calculate an exact level for the actual solvency risk, since it requires that the surplus can be distributed in a uniform manner among the different risk factors.
The table below shows that the surplus according to Skandia Liv’s internal model amounted to approximately SEK 2 billion at year-end 2008, which means that solvency risk marginally exceeds 0.5%. Skandia Liv’s solvency risk policy provides the opportunity to temporarily deviate from the prescribed risk level. A plan has been drawn up for how the deficit according to the internal model shall be handled. See also the Risk section in the Board of Directors’ Report. Since the internal model contains a safety margin of SEK 27 billion, the surplus according to the Financial Supervisory Authority’s traffic light system was slightly more than SEK 25 billion at year-end 2008.
The difference between the two calculations – the safety margin – is dependent on three things:
1. Skandia Liv assesses the value of the liability in another manner; it also includes a risk supplement in accordance with the principles that are being discussed in the Solvency II work.
2. Skandia Liv includes capital requirement for operational risks.3. Skandia Liv measures insurance risks and financial risks in a way that gives
rise to a greater capital requirement.
Capital requirement and solvency risk – Parent company
2008 2007Change 1
year
Assets 265,418 302,260 -36,842Technical provisions1) -187,294 -155,231 -32,063Other liabilities -14,617 -3,832 -10,785Equity 63,507 143,197 -79,690Capital requirement, financial risks -38,117 -59,970 21,853Capital requirement, insurance risks -4,839 -4,045 -794Diversification effect 4,533 3,908 625Capital requirement accord-ing to traffic light system 25,084 83,090 -58,006Adjustment from internal model -26,978 -30,508 3,530Surplus/deficit -1,894 52,582 -54,476
1) This figure differs from the one reported in the balance sheet, since the calculation of liabilities according to the Traffic light system is based on market values, i.e., other insurance is valued using the same interest rate curve as insurance classified as occupa-tional pension business.
Solvency risk – DenmarkAll of the previously reported figures pertain to the parent company. It is not possible to report the risks in the Danish subsidiary, Skandia Liv A/S, in the exact same format, since the Danish solvency rules have a different format. Following is a simplified summary.
Capital requirement and solvency risk, Skandia Liv A/S
2008 2007Change 1
year
Assets 14,319 11,083 3,236
Technical provisions -12,821 -10,215 -2,606Other liabilities -339 -132 -207Equity 1,158 736 422Capital base 961 546 415Combined capital requirement -490 -369 -122Surplus 470 177 293
As the table shows, the “surplus capital” is considerably lower than in the parent company, also in relative terms. The reflects the fact that the company distributes its profits, and thus there is no reason to keep capital on hand other than what is required for operations.
44
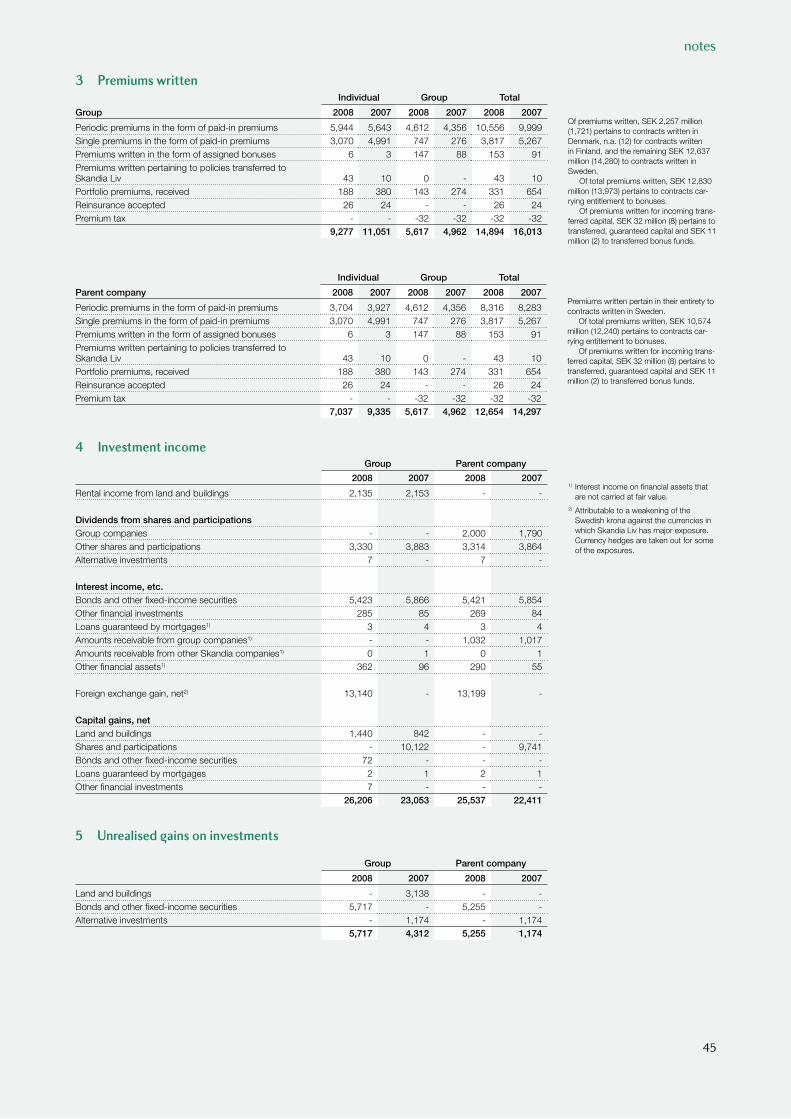
notes
3 Premiums writtenIndividual Group Total
Group 2008 2007 2008 2007 2008 2007
Periodic premiums in the form of paid-in premiums 5,944 5,643 4,612 4,356 10,556 9,999Single premiums in the form of paid-in premiums 3,070 4,991 747 276 3,817 5,267Premiums written in the form of assigned bonuses 6 3 147 88 153 91Premiums written pertaining to policies transferred to Skandia Liv 43 10 0 - 43 10Portfolio premiums, received 188 380 143 274 331 654Reinsurance accepted 26 24 - - 26 24Premium tax - - -32 -32 -32 -32
9,277 11,051 5,617 4,962 14,894 16,013
Individual Group Total
Parent company 2008 2007 2008 2007 2008 2007
Periodic premiums in the form of paid-in premiums 3,704 3,927 4,612 4,356 8,316 8,283Single premiums in the form of paid-in premiums 3,070 4,991 747 276 3,817 5,267Premiums written in the form of assigned bonuses 6 3 147 88 153 91Premiums written pertaining to policies transferred to Skandia Liv 43 10 0 - 43 10Portfolio premiums, received 188 380 143 274 331 654Reinsurance accepted 26 24 - - 26 24Premium tax - - -32 -32 -32 -32
7,037 9,335 5,617 4,962 12,654 14,297
4 Investment incomeGroup Parent company
2008 2007 2008 2007
Rental income from land and buildings 2,135 2,153 - -
Dividends from shares and participationsGroup companies - - 2,000 1,790Other shares and participations 3,330 3,883 3,314 3,864Alternative investments 7 - 7 -
Interest income, etc.Bonds and other fixed-income securities 5,423 5,866 5,421 5,854Other financial investments 285 85 269 84Loans guaranteed by mortgages1) 3 4 3 4Amounts receivable from group companies1) - - 1,032 1,017Amounts receivable from other Skandia companies1) 0 1 0 1Other financial assets1) 362 96 290 55
Foreign exchange gain, net2) 13,140 - 13,199 -
Capital gains, netLand and buildings 1,440 842 - -Shares and participations - 10,122 - 9,741Bonds and other fixed-income securities 72 - - -Loans guaranteed by mortgages 2 1 2 1Other financial investments 7 - - -
26,206 23,053 25,537 22,411
5 Unrealised ¯ains on investments
Group Parent company
2008 2007 2008 2007
Land and buildings - 3,138 - -Bonds and other fixed-income securities 5,717 - 5,255 -Alternative investments - 1,174 - 1,174
5,717 4,312 5,255 1,174
Of premiums written, SEK 2,257 million (1,721) pertains to contracts written in Denmark, n.a. (12) for contracts written in Finland, and the remaining SEK 12,637 million (14,280) to contracts written in Sweden.
Of total premiums written, SEK 12,830 million (13,973) pertains to contracts car-rying entitlement to bonuses.
Of premiums written for incoming trans-ferred capital, SEK 32 million (8) pertains to transferred, guaranteed capital and SEK 11 million (2) to transferred bonus funds.
Premiums written pertain in their entirety to contracts written in Sweden.
Of total premiums written, SEK 10,574 million (12,240) pertains to contracts car-rying entitlement to bonuses.
Of premiums written for incoming trans-ferred capital, SEK 32 million (8) pertains to transferred, guaranteed capital and SEK 11 million (2) to transferred bonus funds.
1) Interest income on financial assets that are not carried at fair value.
2) Attributable to a weakening of the Swedish krona against the currencies in which Skandia Liv has major exposure. Currency hedges are taken out for some of the exposures.
45
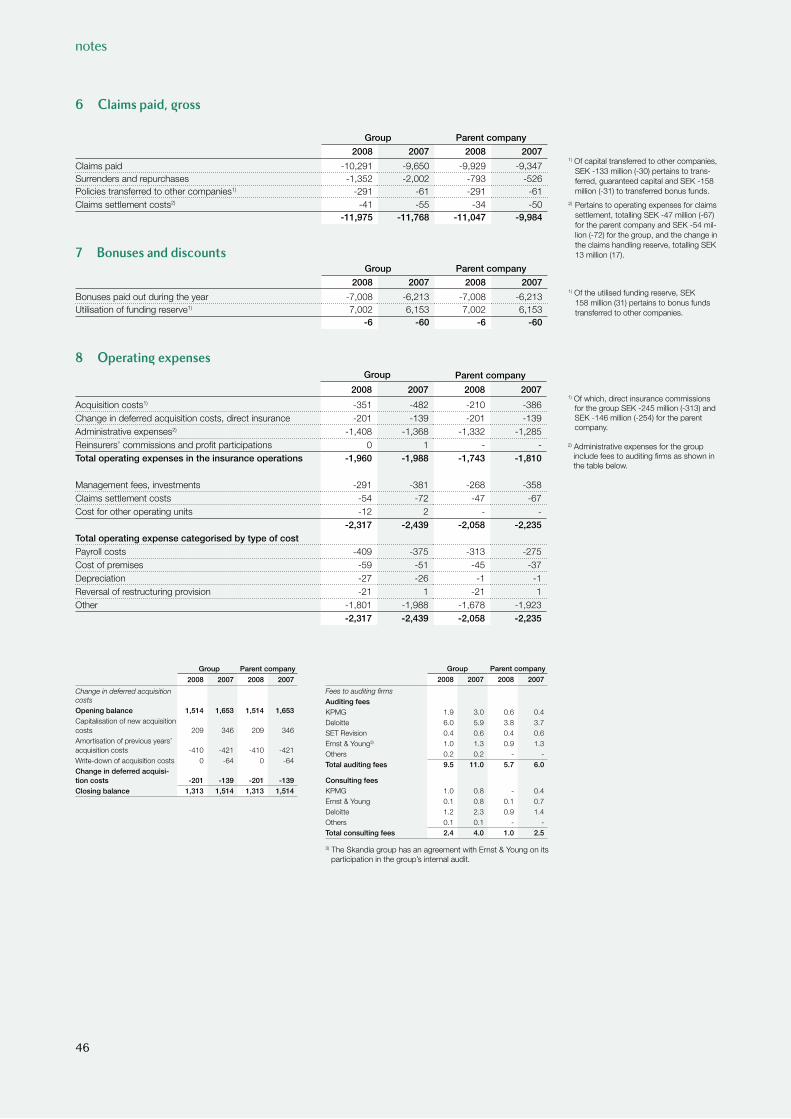
notes
6 Claims paid, ¯ross
Group Parent company
2008 2007 2008 2007
Claims paid 10,291 9,650 9,929 9,347Surrenders and repurchases 1,352 2,002 793 526Policies transferred to other companies1) 291 61 291 61Claims settlement costs2) 41 55 34 50
-11,975 -11,768 -11,047 -9,984
7 Bonuses and discountsGroup Parent company
2008 2007 2008 2007
Bonuses paid out during the year 7,008 6,213 7,008 6,213Utilisation of funding reserve1) 7,002 6,153 7,002 6,153
-6 -60 -6 -60
8 Operatin¯ expensesGroup Parent company
2008 2007 2008 2007
Acquisition costs1) -351 -482 -210 -386Change in deferred acquisition costs, direct insurance -201 -139 -201 -139Administrative expenses2) -1,408 -1,368 -1,332 -1,285Reinsurers’ commissions and profit participations 0 1 - -Total operating expenses in the insurance operations -1,960 -1,988 -1,743 -1,810
Management fees, investments -291 -381 -268 -358Claims settlement costs -54 -72 -47 -67Cost for other operating units -12 2 - -
-2,317 -2,439 -2,058 -2,235Total operating expense categorised by type of costPayroll costs -409 -375 -313 -275Cost of premises -59 -51 -45 -37Depreciation -27 -26 -1 -1Reversal of restructuring provision -21 1 -21 1Other -1,801 -1,988 -1,678 -1,923
-2,317 -2,439 -2,058 -2,235
1) Of capital transferred to other companies, SEK -133 million (-30) pertains to trans-ferred, guaranteed capital and SEK -158 million (-31) to transferred bonus funds.
2) Pertains to operating expenses for claims settlement, totalling SEK -47 million (-67) for the parent company and SEK -54 mil-lion (-72) for the group, and the change in the claims handling reserve, totalling SEK 13 million (17).
1) Of the utilised funding reserve, SEK 158 million (31) pertains to bonus funds transferred to other companies.
Group Parent company
2008 2007 2008 2007
Change in deferred acquisition costsOpening balance 1,514 1,653 1,514 1,653Capitalisation of new acquisition costs 209 346 209 346Amortisation of previous years’ acquisition costs 410 421 410 421Writedown of acquisition costs 0 64 0 64Change in deferred acquisi-tion costs -201 -139 -201 -139Closing balance 1,313 1,514 1,313 1,514
Group Parent company
2008 2007 2008 2007
Fees to auditing firmsAuditing feesKPMG 1.9 3.0 0.6 0.4Deloitte 6.0 5.9 3.8 3.7SET Revision 0.4 0.6 0.4 0.6Ernst & Young3) 1.0 1.3 0.9 1.3Others 0.2 0.2 Total auditing fees 9.5 11.0 5.7 6.0
Consulting feesKPMG 1.0 0.8 0.4Ernst & Young 0.1 0.8 0.1 0.7Deloitte 1.2 2.3 0.9 1.4Others 0.1 0.1 Total consulting fees 2.4 4.0 1.0 2.5
3) The Skandia group has an agreement with Ernst & Young on its participation in the group’s internal audit.
1) Of which, direct insurance commissions for the group SEK 245 million (313) and SEK 146 million (254) for the parent company.
2) Administrative expenses for the group include fees to auditing firms as shown in the table below.
46
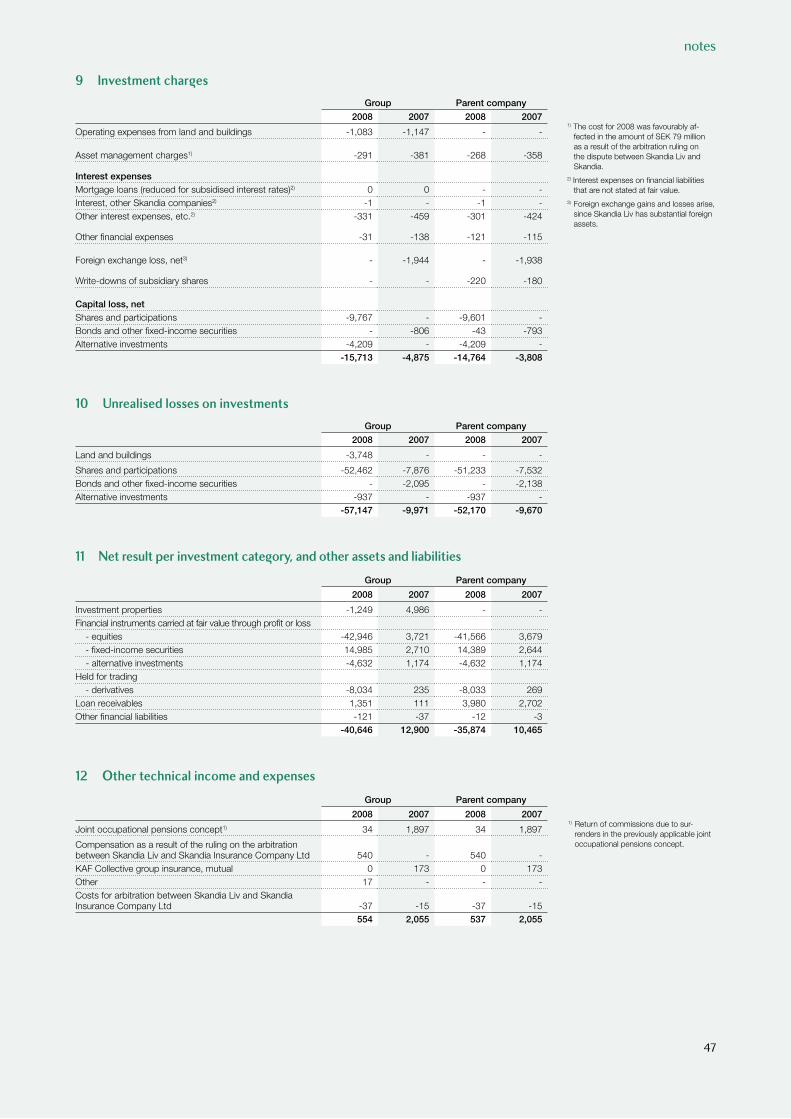
notes
1) Return of commissions due to sur-renders in the previously applicable joint occupational pensions concept.
9 Investment char¯es
Group Parent company
2008 2007 2008 2007
Operating expenses from land and buildings -1,083 -1,147 - -
Asset management charges1) -291 -381 -268 -358
Interest expensesMortgage loans (reduced for subsidised interest rates)2) 0 0 - -Interest, other Skandia companies2) -1 - -1 -Other interest expenses, etc.2) -331 -459 -301 -424
Other financial expenses -31 -138 -121 -115
Foreign exchange loss, net3) - -1,944 - -1,938
Write-downs of subsidiary shares - - -220 -180
Capital loss, netShares and participations -9,767 - -9,601 -Bonds and other fixed-income securities - -806 -43 -793Alternative investments -4,209 - -4,209 -
-15,713 -4,875 -14,764 -3,808
10 Unrealised losses on investments
Group Parent company
2008 2007 2008 2007
Land and buildings -3,748 - - -
Shares and participations -52,462 -7,876 -51,233 -7,532Bonds and other fixed-income securities - -2,095 - -2,138Alternative investments -937 - -937 -
-57,147 -9,971 -52,170 -9,670
11 Net result per investment cate¯ory, and other assets and liabilities
Group Parent company
2008 2007 2008 2007
Investment properties -1,249 4,986 - -Financial instruments carried at fair value through profit or loss
- equities -42,946 3,721 -41,566 3,679 - fixed-income securities 14,985 2,710 14,389 2,644
- alternative investments -4,632 1,174 -4,632 1,174Held for trading
- derivatives -8,034 235 -8,033 269Loan receivables 1,351 111 3,980 2,702Other financial liabilities -121 -37 -12 -3
-40,646 12,900 -35,874 10,465
12 Other technical income and expenses
Group Parent company
2008 2007 2008 2007
Joint occupational pensions concept1) 34 1,897 34 1,897
Compensation as a result of the ruling on the arbitration between Skandia Liv and Skandia Insurance Company Ltd 540 - 540 -KAF Collective group insurance, mutual 0 173 0 173Other 17 - - -Costs for arbitration between Skandia Liv and Skandia Insurance Company Ltd -37 -15 -37 -15
554 2,055 537 2,055
1) The cost for 2008 was favourably af-fected in the amount of SEK 79 million as a result of the arbitration ruling on the dispute between Skandia Liv and Skandia.
2) Interest expenses on financial liabilities that are not stated at fair value.
3) Foreign exchange gains and losses arise, since Skandia Liv has substantial foreign assets.
47
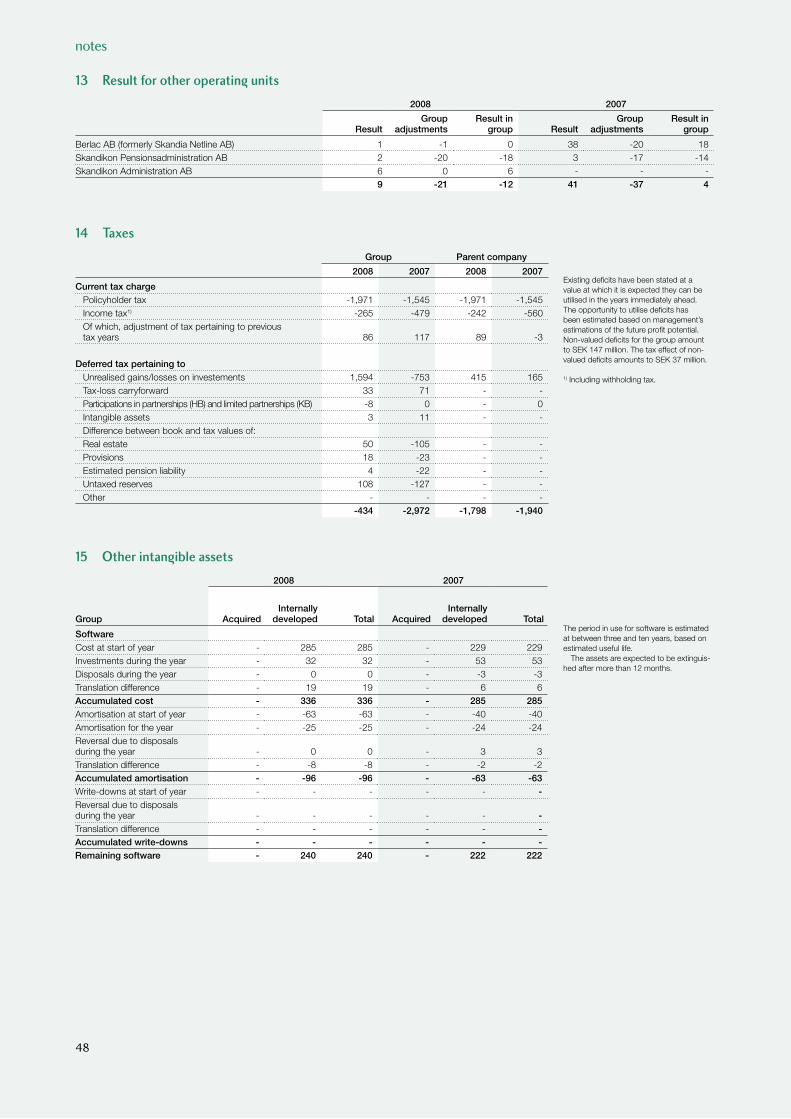
notes
Existing deficits have been stated at a value at which it is expected they can be utilised in the years immediately ahead. The opportunity to utilise deficits has been estimated based on management’s estimations of the future profit potential. Non-valued deficits for the group amount to SEK 147 million. The tax effect of non-valued deficits amounts to SEK 37 million.
1) Including withholding tax.
The period in use for software is estimated at between three and ten years, based on estimated useful life.
The assets are expected to be extinguis-hed after more than 12 months.
13 Result for other operatin¯ units
2008 2007
ResultGroup
adjustmentsResult in
group ResultGroup
adjustmentsResult in
group
Berlac AB (formerly Skandia Netline AB) 1 -1 0 38 -20 18Skandikon Pensionsadministration AB 2 -20 -18 3 -17 -14Skandikon Administration AB 6 0 6 - - -
9 -21 -12 41 -37 4
14 Taxes
Group Parent company
2008 2007 2008 2007
Current tax chargePolicyholder tax -1,971 -1,545 -1,971 -1,545Income tax1) -265 -479 -242 -560Of which, adjustment of tax pertaining to previoustax years 86 117 89 -3
Deferred tax pertaining toUnrealised gains/losses on investements 1,594 -753 415 165Tax-loss carryforward 33 71 - -Participations in partnerships (HB) and limited partnerships (KB) -8 0 - 0Intangible assets 3 11 - -Difference between book and tax values of:Real estate 50 -105 - -Provisions 18 -23 - -Estimated pension liability 4 -22 - -Untaxed reserves 108 -127 - -Other - - - -
-434 -2,972 -1,798 -1,940
15 Other intan¯ible assets
2008 2007
Group AcquiredInternally
developed Total AcquiredInternally
developed Total
SoftwareCost at start of year - 285 285 - 229 229Investments during the year - 32 32 - 53 53Disposals during the year - 0 0 - -3 -3Translation difference - 19 19 - 6 6Accumulated cost - 336 336 - 285 285Amortisation at start of year - -63 -63 - -40 -40Amortisation for the year - -25 -25 - -24 -24Reversal due to disposals during the year - 0 0 - 3 3Translation difference - -8 -8 - -2 -2Accumulated amortisation - -96 -96 - -63 -63Write-downs at start of year - - - - - -Reversal due to disposals during the year - - - - - -Translation difference - - - - - -Accumulated write-downs - - - - - -Remaining software - 240 240 - 222 222
48
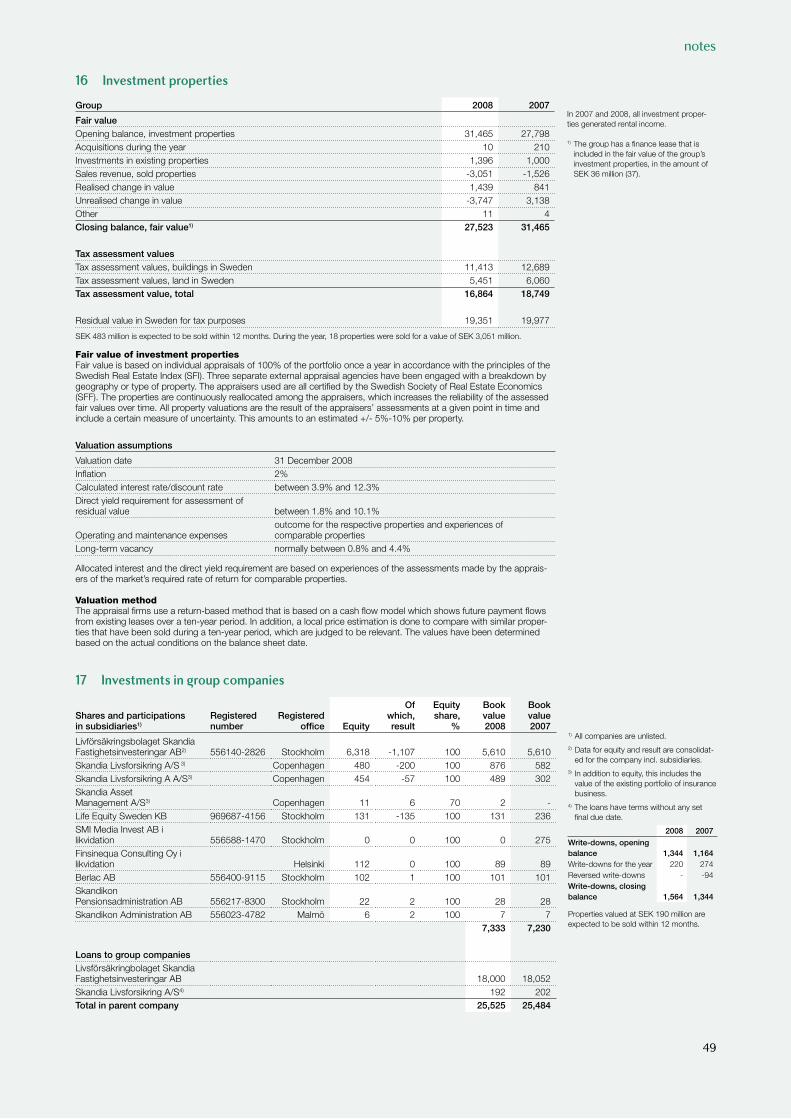
notes
16 Investment properties
Group 2008 2007
Fair valueOpening balance, investment properties 31,465 27,798Acquisitions during the year 10 210Investments in existing properties 1,396 1,000Sales revenue, sold properties -3,051 -1,526Realised change in value 1,439 841Unrealised change in value -3,747 3,138Other 11 4Closing balance, fair value1) 27,523 31,465
Tax assessment valuesTax assessment values, buildings in Sweden 11,413 12,689Tax assessment values, land in Sweden 5,451 6,060Tax assessment value, total 16,864 18,749
Residual value in Sweden for tax purposes 19,351 19,977
SEK 483 million is expected to be sold within 12 months. During the year, 18 properties were sold for a value of SEK 3,051 million.
Fair value of investment properties Fair value is based on individual appraisals of 100% of the portfolio once a year in accordance with the principles of the Swedish Real Estate Index (SFI). Three separate external appraisal agencies have been engaged with a breakdown by geography or type of property. The appraisers used are all certified by the Swedish Society of Real Estate Economics (SFF). The properties are continuously reallocated among the appraisers, which increases the reliability of the assessed fair values over time. All property valuations are the result of the appraisers’ assessments at a given point in time and include a certain measure of uncertainty. This amounts to an estimated +/- 5%-10% per property.
Valuation assumptions
Valuation date 31 December 2008Inflation 2%Calculated interest rate/discount rate between 3.9% and 12.3%Direct yield requirement for assessment of residual value between 1.8% and 10.1%
Operating and maintenance expensesoutcome for the respective properties and experiences of comparable properties
Long-term vacancy normally between 0.8% and 4.4%
Allocated interest and the direct yield requirement are based on experiences of the assessments made by the apprais-ers of the market’s required rate of return for comparable properties.
Valuation method The appraisal firms use a return-based method that is based on a cash flow model which shows future payment flows from existing leases over a ten-year period. In addition, a local price estimation is done to compare with similar proper-ties that have been sold during a ten-year period, which are judged to be relevant. The values have been determined based on the actual conditions on the balance sheet date.
17 Investments in ¯roup companies
Shares and participations in subsidiaries1)
Registered number
Registered office Equity
Of which, result
Equity share,
%
Book value 2008
Book value 2007
Livförsäkringsbolaget Skandia Fastighetsinvesteringar AB2) 556140-2826 Stockholm 6,318 -1,107 100 5,610 5,610Skandia Livsforsikring A/S 3) Copenhagen 480 -200 100 876 582Skandia Livsforsikring A A/S3) Copenhagen 454 -57 100 489 302Skandia Asset Management A/S3) Copenhagen 11 6 70 2 -Life Equity Sweden KB 969687-4156 Stockholm 131 -135 100 131 236SMI Media Invest AB i likvidation 556588-1470 Stockholm 0 0 100 0 275Finsinequa Consulting Oy i likvidation Helsinki 112 0 100 89 89Berlac AB 556400-9115 Stockholm 102 1 100 101 101Skandikon Pensionsadministration AB 556217-8300 Stockholm 22 2 100 28 28Skandikon Administration AB 556023-4782 Malmö 6 2 100 7 7
7,333 7,230 Loans to group companiesLivsförsäkringbolaget Skandia Fastighetsinvesteringar AB 18,000 18,052Skandia Livsforsikring A/S4) 192 202Total in parent company 25,525 25,484
1) All companies are unlisted. 2) Data for equity and result are consolidat-
ed for the company incl. subsidiaries.3) In addition to equity, this includes the
value of the existing portfolio of insurance business.
4) The loans have terms without any set final due date.
2008 2007
Write-downs, opening balance 1,344 1,164Writedowns for the year 220 274Reversed writedowns 94Write-downs, closing balance 1,564 1,344
Properties valued at SEK 190 million are expected to be sold within 12 months.
In 2007 and 2008, all investment proper-ties generated rental income. 1) The group has a finance lease that is
included in the fair value of the group’s investment properties, in the amount of SEK 36 million (37).
49
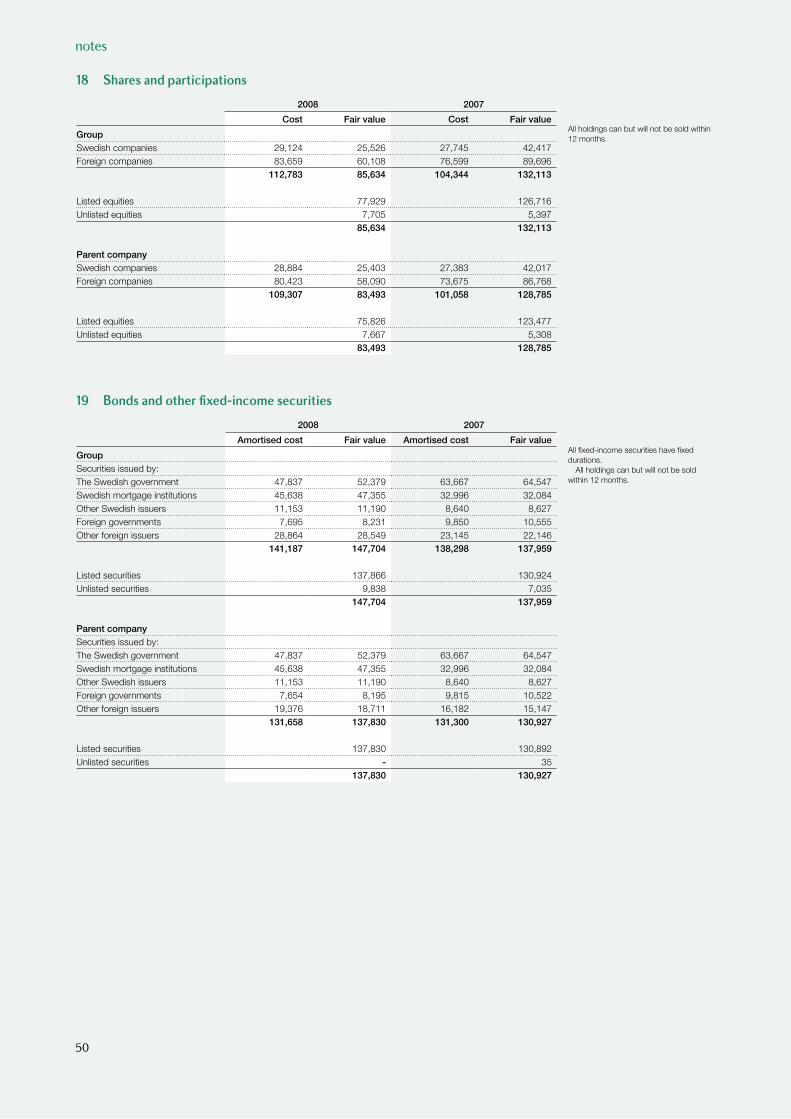
notes
18 Shares and participations
2008 2007
Cost Fair value Cost Fair value
GroupSwedish companies 29,124 25,526 27,745 42,417Foreign companies 83,659 60,108 76,599 89,696
112,783 85,634 104,344 132,113
Listed equities 77,929 126,716Unlisted equities 7,705 5,397
85,634 132,113
Parent companySwedish companies 28,884 25,403 27,383 42,017Foreign companies 80,423 58,090 73,675 86,768
109,307 83,493 101,058 128,785
Listed equities 75,826 123,477Unlisted equities 7,667 5,308
83,493 128,785
19 Bonds and other fixed-income securities
2008 2007
Amortised cost Fair value Amortised cost Fair value
GroupSecurities issued by:The Swedish government 47,837 52,379 63,667 64,547Swedish mortgage institutions 45,638 47,355 32,996 32,084Other Swedish issuers 11,153 11,190 8,640 8,627Foreign governments 7,695 8,231 9,850 10,555Other foreign issuers 28,864 28,549 23,145 22,146
141,187 147,704 138,298 137,959
Listed securities 137,866 130,924Unlisted securities 9,838 7,035
147,704 137,959
Parent companySecurities issued by:The Swedish government 47,837 52,379 63,667 64,547Swedish mortgage institutions 45,638 47,355 32,996 32,084Other Swedish issuers 11,153 11,190 8,640 8,627Foreign governments 7,654 8,195 9,815 10,522Other foreign issuers 19,376 18,711 16,182 15,147
131,658 137,830 131,300 130,927
Listed securities 137,830 130,892Unlisted securities - 35
137,830 130,927
All holdings can but will not be sold within 12 months.
All fixed-income securities have fixed durations.
All holdings can but will not be sold within 12 months.
50
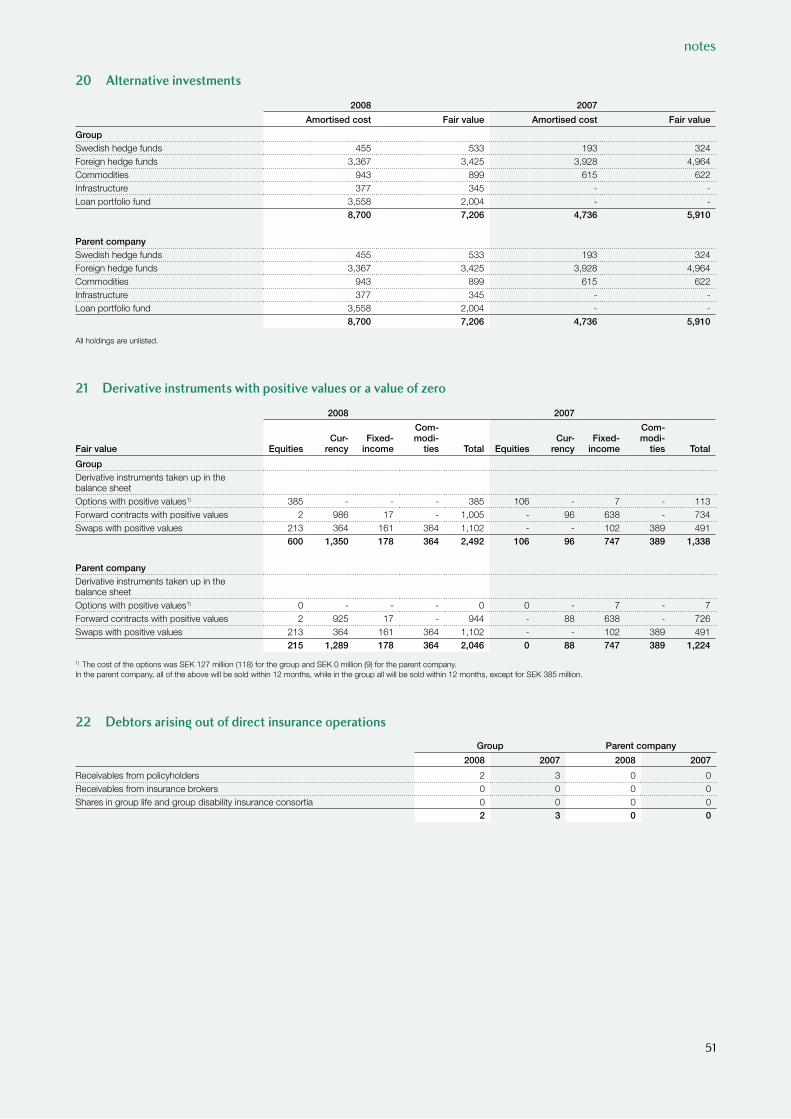
notes
20 Alternative investments
2008 2007
Amortised cost Fair value Amortised cost Fair value
GroupSwedish hedge funds 455 533 193 324Foreign hedge funds 3,367 3,425 3,928 4,964Commodities 943 899 615 622Infrastructure 377 345 - -Loan portfolio fund 3,558 2,004 - -
8,700 7,206 4,736 5,910
Parent companySwedish hedge funds 455 533 193 324Foreign hedge funds 3,367 3,425 3,928 4,964Commodities 943 899 615 622Infrastructure 377 345 - -Loan portfolio fund 3,558 2,004 - -
8,700 7,206 4,736 5,910
All holdings are unlisted.
21 Derivative instruments with positive values or a value of zero
2008 2007
Fair value Equities Cur-
rency Fixed-
income
Com-modi-
ties Total EquitiesCur-
rency Fixed-
income
Com-modi-
ties Total
GroupDerivative instruments taken up in the balance sheetOptions with positive values1) 385 - - - 385 106 - 7 - 113Forward contracts with positive values 2 986 17 - 1,005 - 96 638 - 734Swaps with positive values 213 364 161 364 1,102 - - 102 389 491
600 1,350 178 364 2,492 106 96 747 389 1,338
Parent companyDerivative instruments taken up in the balance sheetOptions with positive values1) 0 - - - 0 0 - 7 - 7Forward contracts with positive values 2 925 17 - 944 - 88 638 - 726Swaps with positive values 213 364 161 364 1,102 - - 102 389 491
215 1,289 178 364 2,046 0 88 747 389 1,224
1) The cost of the options was SEK 127 million (118) for the group and SEK 0 million (9) for the parent company.In the parent company, all of the above will be sold within 12 months, while in the group all will be sold within 12 months, except for SEK 385 million.
22 Debtors arisin¯ out of direct insurance operations
Group Parent company
2008 2007 2008 2007
Receivables from policyholders 2 3 0 0Receivables from insurance brokers 0 0 0 0Shares in group life and group disability insurance consortia 0 0 0 0
2 3 0 0
51
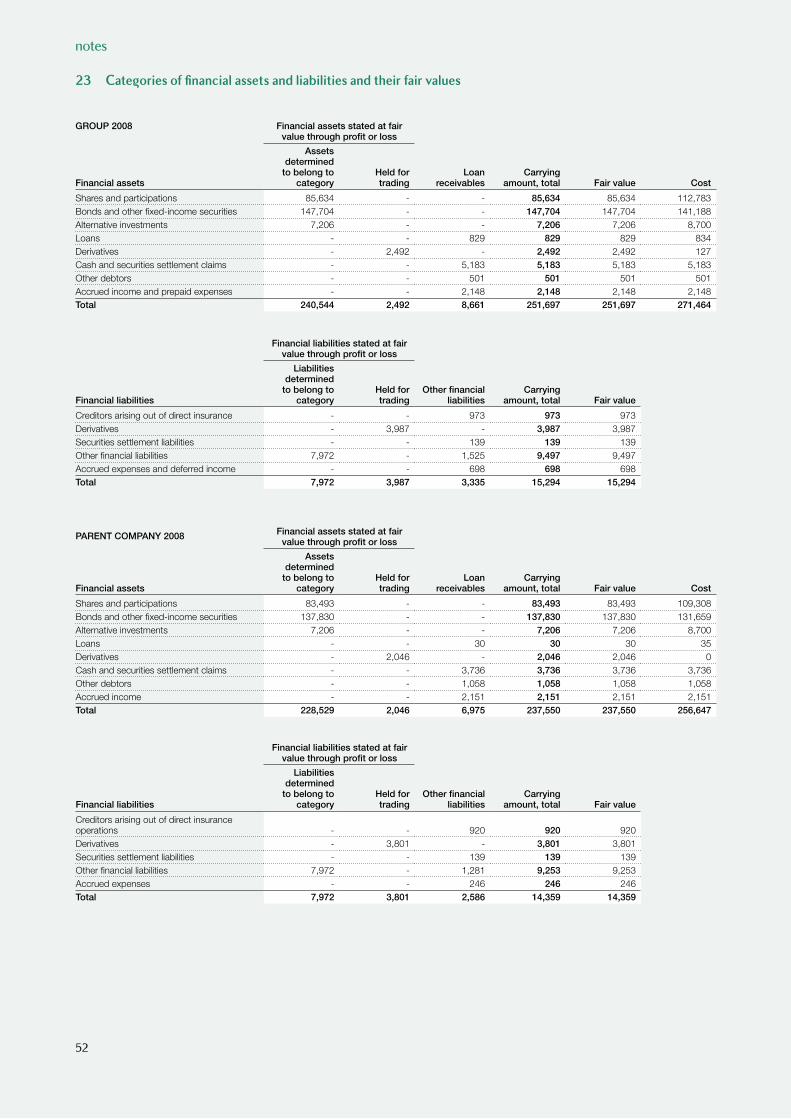
förvaltningsberättelsenotes
23 Cate¯ories of financial assets and liabilities and their fair values
GROUP 2008 Financial assets stated at fair value through profit or loss
Financial assets
Assets determined
to belong to category
Held for trading
Loan receivables
Carrying amount, total Fair value Cost
Shares and participations 85,634 - - 85,634 85,634 112,783Bonds and other fixed-income securities 147,704 - - 147,704 147,704 141,188Alternative investments 7,206 - - 7,206 7,206 8,700Loans - - 829 829 829 834Derivatives - 2,492 - 2,492 2,492 127Cash and securities settlement claims - - 5,183 5,183 5,183 5,183Other debtors - - 501 501 501 501Accrued income and prepaid expenses - - 2,148 2,148 2,148 2,148Total 240,544 2,492 8,661 251,697 251,697 271,464
Financial liabilities stated at fair value through profit or loss
Financial liabilities
Liabilities determined
to belong to category
Held for trading
Other financial liabilities
Carrying amount, total Fair value
Creditors arising out of direct insurance - - 973 973 973Derivatives - 3,987 - 3,987 3,987Securities settlement liabilities - - 139 139 139Other financial liabilities 7,972 - 1,525 9,497 9,497Accrued expenses and deferred income - - 698 698 698Total 7,972 3,987 3,335 15,294 15,294
PARENT COMPANY 2008 Financial assets stated at fair value through profit or loss
Financial assets
Assets determined to belong to
categoryHeld for trading
Loan receivables
Carrying amount, total Fair value Cost
Shares and participations 83,493 - - 83,493 83,493 109,308Bonds and other fixed-income securities 137,830 - - 137,830 137,830 131,659Alternative investments 7,206 - - 7,206 7,206 8,700Loans - - 30 30 30 35Derivatives - 2,046 - 2,046 2,046 0Cash and securities settlement claims - - 3,736 3,736 3,736 3,736Other debtors - - 1,058 1,058 1,058 1,058Accrued income - - 2,151 2,151 2,151 2,151Total 228,529 2,046 6,975 237,550 237,550 256,647
Financial liabilities stated at fair value through profit or loss
Financial liabilities
Liabilities determined
to belong to category
Held for trading
Other financial liabilities
Carrying amount, total Fair value
Creditors arising out of direct insurance operations - - 920 920 920Derivatives - 3,801 - 3,801 3,801Securities settlement liabilities - - 139 139 139Other financial liabilities 7,972 - 1,281 9,253 9,253Accrued expenses - - 246 246 246Total 7,972 3,801 2,586 14,359 14,359
52
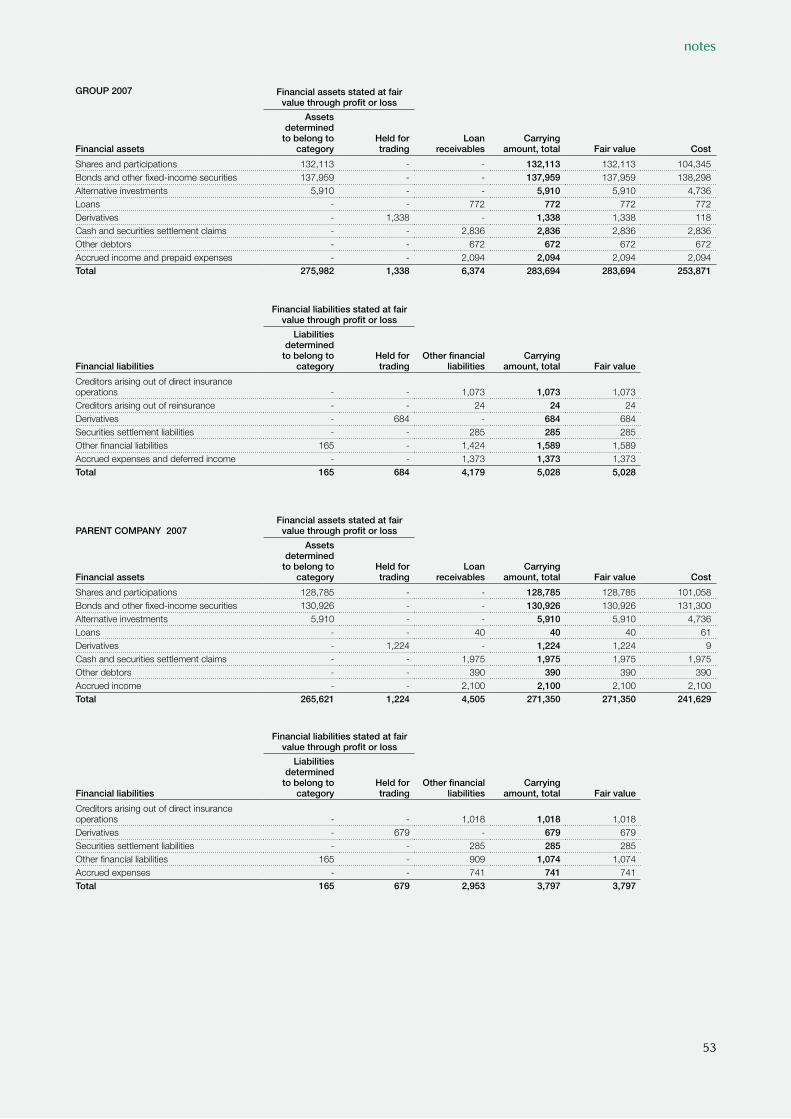
notes
GROUP 2007 Financial assets stated at fair value through profit or loss
Financial assets
Assets determined
to belong to category
Held for trading
Loan receivables
Carrying amount, total Fair value Cost
Shares and participations 132,113 - - 132,113 132,113 104,345Bonds and other fixed-income securities 137,959 - - 137,959 137,959 138,298Alternative investments 5,910 - - 5,910 5,910 4,736Loans - - 772 772 772 772Derivatives - 1,338 - 1,338 1,338 118Cash and securities settlement claims - - 2,836 2,836 2,836 2,836Other debtors - - 672 672 672 672Accrued income and prepaid expenses - - 2,094 2,094 2,094 2,094Total 275,982 1,338 6,374 283,694 283,694 253,871
Financial liabilities stated at fair value through profit or loss
Financial liabilities
Liabilities determined
to belong to category
Held for trading
Other financial liabilities
Carrying amount, total Fair value
Creditors arising out of direct insurance operations - - 1,073 1,073 1,073Creditors arising out of reinsurance - - 24 24 24Derivatives - 684 - 684 684Securities settlement liabilities - - 285 285 285Other financial liabilities 165 - 1,424 1,589 1,589Accrued expenses and deferred income - - 1,373 1,373 1,373Total 165 684 4,179 5,028 5,028
PARENT COMPANY 2007Financial assets stated at fair
value through profit or loss
Financial assets
Assets determined
to belong to category
Held for trading
Loan receivables
Carrying amount, total Fair value Cost
Shares and participations 128,785 - - 128,785 128,785 101,058Bonds and other fixed-income securities 130,926 - - 130,926 130,926 131,300Alternative investments 5,910 - - 5,910 5,910 4,736Loans - - 40 40 40 61Derivatives - 1,224 - 1,224 1,224 9Cash and securities settlement claims - - 1,975 1,975 1,975 1,975Other debtors - - 390 390 390 390Accrued income - - 2,100 2,100 2,100 2,100Total 265,621 1,224 4,505 271,350 271,350 241,629
Financial liabilities stated at fair value through profit or loss
Financial liabilities
Liabilities determined
to belong to category
Held for trading
Other financial liabilities
Carrying amount, total Fair value
Creditors arising out of direct insurance operations - - 1,018 1,018 1,018Derivatives - 679 - 679 679Securities settlement liabilities - - 285 285 285Other financial liabilities 165 - 909 1,074 1,074Accrued expenses - - 741 741 741Total 165 679 2,953 3,797 3,797
53
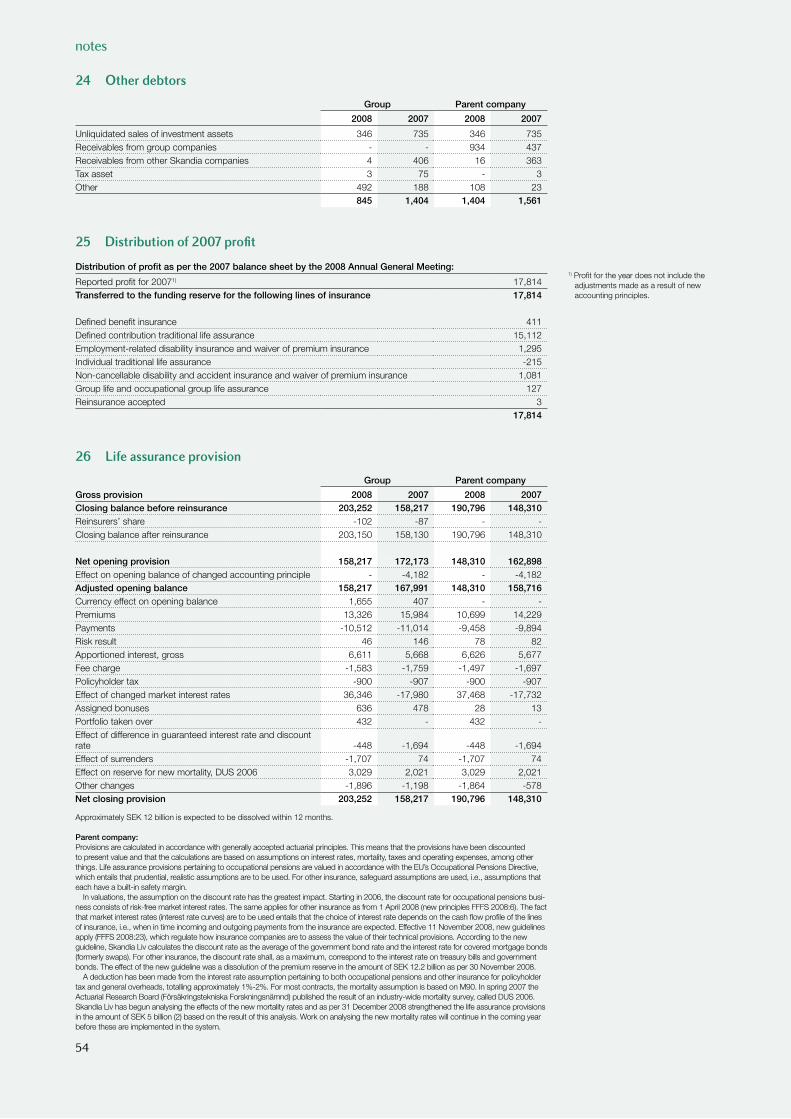
notes
24 Other debtors
Group Parent company
2008 2007 2008 2007
Unliquidated sales of investment assets 346 735 346 735Receivables from group companies - - 934 437Receivables from other Skandia companies 4 406 16 363Tax asset 3 75 - 3Other 492 188 108 23
845 1,404 1,404 1,561
25 Distribution of 2007 profit
Distribution of profit as per the 2007 balance sheet by the 2008 Annual General Meeting:
Reported profit for 20071) 17,814Transferred to the funding reserve for the following lines of insurance 17,814
Defined benefit insurance 411Defined contribution traditional life assurance 15,112Employment-related disability insurance and waiver of premium insurance 1,295Individual traditional life assurance -215Non-cancellable disability and accident insurance and waiver of premium insurance 1,081Group life and occupational group life assurance 127Reinsurance accepted 3
17,814
26 Life assurance provision
Group Parent company
Gross provision 2008 2007 2008 2007Closing balance before reinsurance 203,252 158,217 190,796 148,310Reinsurers’ share -102 -87 - -Closing balance after reinsurance 203,150 158,130 190,796 148,310
Net opening provision 158,217 172,173 148,310 162,898Effect on opening balance of changed accounting principle - -4,182 - -4,182Adjusted opening balance 158,217 167,991 148,310 158,716Currency effect on opening balance 1,655 407 - -Premiums 13,326 15,984 10,699 14,229Payments -10,512 -11,014 -9,458 -9,894Risk result 46 146 78 82Apportioned interest, gross 6,611 5,668 6,626 5,677Fee charge -1,583 -1,759 -1,497 -1,697Policyholder tax -900 -907 -900 -907Effect of changed market interest rates 36,346 -17,980 37,468 -17,732Assigned bonuses 636 478 28 13Portfolio taken over 432 - 432 -Effect of difference in guaranteed interest rate and discount rate -448 -1,694 -448 -1,694Effect of surrenders -1,707 74 -1,707 74Effect on reserve for new mortality, DUS 2006 3,029 2,021 3,029 2,021Other changes -1,896 -1,198 -1,864 -578Net closing provision 203,252 158,217 190,796 148,310
Approximately SEK 12 billion is expected to be dissolved within 12 months.
Parent company:Provisions are calculated in accordance with generally accepted actuarial principles. This means that the provisions have been discounted to present value and that the calculations are based on assumptions on interest rates, mortality, taxes and operating expenses, among other things. Life assurance provisions pertaining to occupational pensions are valued in accordance with the EU’s Occupational Pensions Directive, which entails that prudential, realistic assumptions are to be used. For other insurance, safeguard assumptions are used, i.e., assumptions that each have a built-in safety margin.
In valuations, the assumption on the discount rate has the greatest impact. Starting in 2006, the discount rate for occupational pensions busi-ness consists of risk-free market interest rates. The same applies for other insurance as from 1 April 2008 (new principles FFFS 2008:6). The fact that market interest rates (interest rate curves) are to be used entails that the choice of interest rate depends on the cash flow profile of the lines of insurance, i.e., when in time incoming and outgoing payments from the insurance are expected. Effective 11 November 2008, new guidelines apply (FFFS 2008:23), which regulate how insurance companies are to assess the value of their technical provisions. According to the new guideline, Skandia Liv calculates the discount rate as the average of the government bond rate and the interest rate for covered mortgage bonds (formerly swaps). For other insurance, the discount rate shall, as a maximum, correspond to the interest rate on treasury bills and government bonds. The effect of the new guideline was a dissolution of the premium reserve in the amount of SEK 12.2 billion as per 30 November 2008.
A deduction has been made from the interest rate assumption pertaining to both occupational pensions and other insurance for policyholder tax and general overheads, totalling approximately 1%-2%. For most contracts, the mortality assumption is based on M90. In spring 2007 the Actuarial Research Board (Försäkringstekniska Forskningsnämnd) published the result of an industry-wide mortality survey, called DUS 2006. Skandia Liv has begun analysing the effects of the new mortality rates and as per 31 December 2008 strengthened the life assurance provisions in the amount of SEK 5 billion (2) based on the result of this analysis. Work on analysing the new mortality rates will continue in the coming year before these are implemented in the system.
1) Profit for the year does not include the adjustments made as a result of new accounting principles.
54
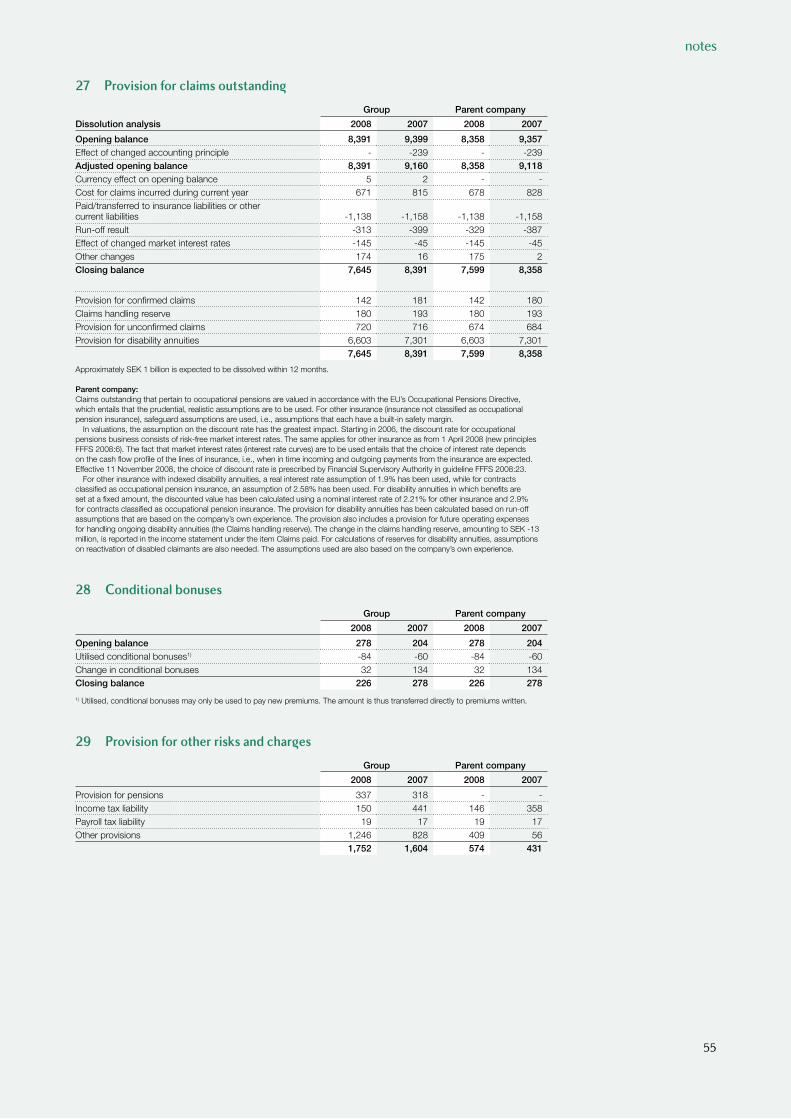
notes
27 Provision for claims outstandin¯
Group Parent company
Dissolution analysis 2008 2007 2008 2007
Opening balance 8,391 9,399 8,358 9,357Effect of changed accounting principle - -239 - -239Adjusted opening balance 8,391 9,160 8,358 9,118Currency effect on opening balance 5 2 - -Cost for claims incurred during current year 671 815 678 828Paid/transferred to insurance liabilities or othercurrent liabilities -1,138 -1,158 -1,138 -1,158Run-off result -313 -399 -329 -387Effect of changed market interest rates -145 -45 -145 -45Other changes 174 16 175 2Closing balance 7,645 8,391 7,599 8,358
Provision for confirmed claims 142 181 142 180Claims handling reserve 180 193 180 193Provision for unconfirmed claims 720 716 674 684Provision for disability annuities 6,603 7,301 6,603 7,301
7,645 8,391 7,599 8,358
Approximately SEK 1 billion is expected to be dissolved within 12 months.
Parent company:Claims outstanding that pertain to occupational pensions are valued in accordance with the EU’s Occupational Pensions Directive, which entails that the prudential, realistic assumptions are to be used. For other insurance (insurance not classified as occupational pension insurance), safeguard assumptions are used, i.e., assumptions that each have a built-in safety margin.
In valuations, the assumption on the discount rate has the greatest impact. Starting in 2006, the discount rate for occupational pensions business consists of risk-free market interest rates. The same applies for other insurance as from 1 April 2008 (new principles FFFS 2008:6). The fact that market interest rates (interest rate curves) are to be used entails that the choice of interest rate depends on the cash flow profile of the lines of insurance, i.e., when in time incoming and outgoing payments from the insurance are expected. Effective 11 November 2008, the choice of discount rate is prescribed by Financial Supervisory Authority in guideline FFFS 2008:23.
For other insurance with indexed disability annuities, a real interest rate assumption of 1.9% has been used, while for contracts classified as occupational pension insurance, an assumption of 2.58% has been used. For disability annuities in which benefits are set at a fixed amount, the discounted value has been calculated using a nominal interest rate of 2.21% for other insurance and 2.9% for contracts classified as occupational pension insurance. The provision for disability annuities has been calculated based on run-off assumptions that are based on the company’s own experience. The provision also includes a provision for future operating expenses for handling ongoing disability annuities (the Claims handling reserve). The change in the claims handling reserve, amounting to SEK -13 million, is reported in the income statement under the item Claims paid. For calculations of reserves for disability annuities, assumptions on reactivation of disabled claimants are also needed. The assumptions used are also based on the company’s own experience.
28 Conditional bonuses
Group Parent company
2008 2007 2008 2007
Opening balance 278 204 278 204Utilised conditional bonuses1) -84 -60 -84 -60Change in conditional bonuses 32 134 32 134Closing balance 226 278 226 278
1) Utilised, conditional bonuses may only be used to pay new premiums. The amount is thus transferred directly to premiums written.
29 Provision for other risks and char¯es
Group Parent company
2008 2007 2008 2007
Provision for pensions 337 318 - -Income tax liability 150 441 146 358Payroll tax liability 19 17 19 17Other provisions 1,246 828 409 56
1,752 1,604 574 431
55
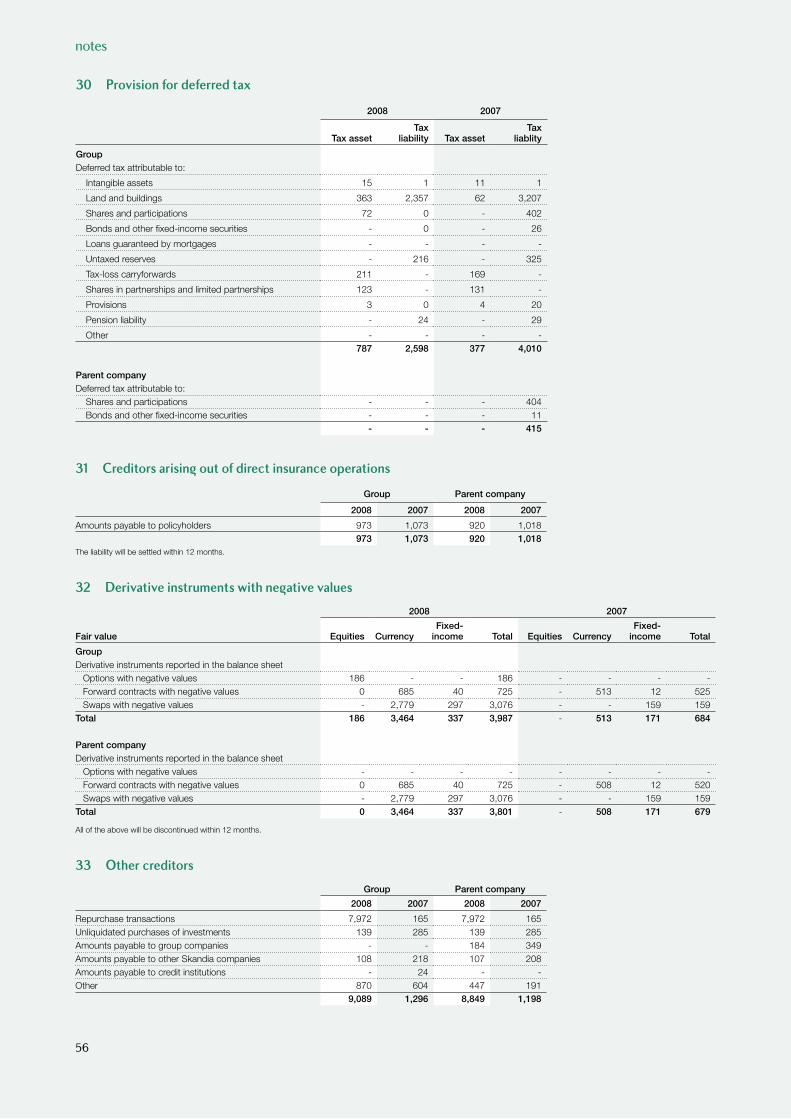
notes
31 Creditors arisin¯ out of direct insurance operations
Group Parent company
2008 2007 2008 2007
Amounts payable to policyholders 973 1,073 920 1,018973 1,073 920 1,018
The liability will be settled within 12 months.
32 Derivative instruments with ne¯ative values
2008 2007
Fair value Equities Currency Fixed-
income Total Equities Currency Fixed-
income Total
GroupDerivative instruments reported in the balance sheet
Options with negative values 186 - - 186 - - - -Forward contracts with negative values 0 685 40 725 - 513 12 525Swaps with negative values - 2,779 297 3,076 - - 159 159
Total 186 3,464 337 3,987 - 513 171 684
Parent companyDerivative instruments reported in the balance sheet
Options with negative values - - - - - - - -Forward contracts with negative values 0 685 40 725 - 508 12 520Swaps with negative values - 2,779 297 3,076 - - 159 159
Total 0 3,464 337 3,801 - 508 171 679
All of the above will be discontinued within 12 months.
33 Other creditors
Group Parent company
2008 2007 2008 2007
Repurchase transactions 7,972 165 7,972 165Unliquidated purchases of investments 139 285 139 285Amounts payable to group companies - - 184 349Amounts payable to other Skandia companies 108 218 107 208Amounts payable to credit institutions - 24 - -Other 870 604 447 191
9,089 1,296 8,849 1,198
30 Provision for deferred tax
2008 2007
Tax assetTax
liability Tax assetTax
liablity
GroupDeferred tax attributable to:
Intangible assets 15 1 11 1
Land and buildings 363 2,357 62 3,207
Shares and participations 72 0 - 402
Bonds and other fixed-income securities - 0 - 26
Loans guaranteed by mortgages - - - -
Untaxed reserves - 216 - 325
Tax-loss carryforwards 211 - 169 -
Shares in partnerships and limited partnerships 123 - 131 -
Provisions 3 0 4 20
Pension liability - 24 - 29
Other - - - -787 2,598 377 4,010
Parent companyDeferred tax attributable to:
Shares and participations - - - 404 Bonds and other fixed-income securities - - - 11
- - - 415
56
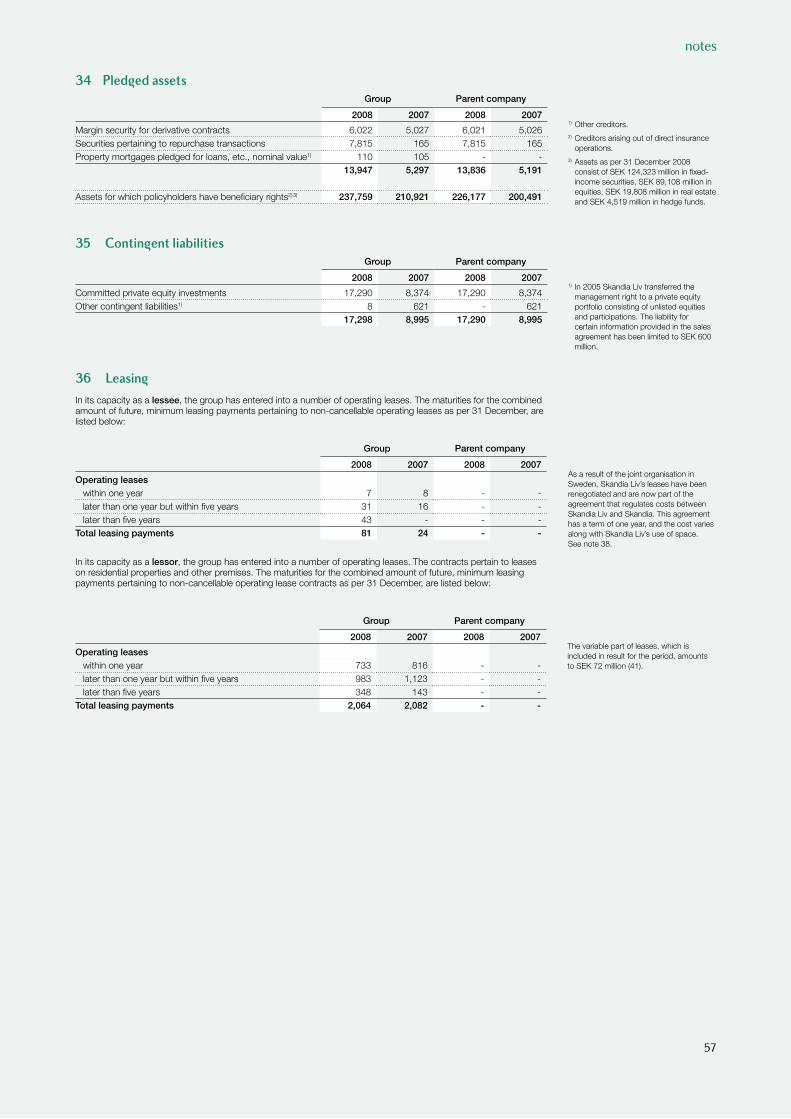
notes
36 Leasin¯
In its capacity as a lessee, the group has entered into a number of operating leases. The maturities for the combined amount of future, minimum leasing payments pertaining to non-cancellable operating leases as per 31 December, are listed below:
Group Parent company
2008 2007 2008 2007
Operating leaseswithin one year 7 8 - -later than one year but within five years 31 16 - -later than five years 43 - - -
Total leasing payments 81 24 - -
In its capacity as a lessor, the group has entered into a number of operating leases. The contracts pertain to leases on residential properties and other premises. The maturities for the combined amount of future, minimum leasing payments pertaining to non-cancellable operating lease contracts as per 31 December, are listed below:
Group Parent company
2008 2007 2008 2007
Operating leaseswithin one year 733 816 - -later than one year but within five years 983 1,123 - -later than five years 348 143 - -
Total leasing payments 2,064 2,082 - -
As a result of the joint organisation in Sweden, Skandia Liv’s leases have been renegotiated and are now part of the agreement that regulates costs between Skandia Liv and Skandia. This agreement has a term of one year, and the cost varies along with Skandia Liv’s use of space. See note 38.
The variable part of leases, which is included in result for the period, amounts to SEK 72 million (41).
34 Pled¯ed assetsGroup Parent company
2008 2007 2008 2007
Margin security for derivative contracts 6,022 5,027 6,021 5,026Securities pertaining to repurchase transactions 7,815 165 7,815 165Property mortgages pledged for loans, etc., nominal value1) 110 105 - -
13,947 5,297 13,836 5,191
Assets for which policyholders have beneficiary rights2)3) 237,759 210,921 226,177 200,491
35 Contin¯ent liabilities Group Parent company
2008 2007 2008 2007
Committed private equity investments 17,290 8,374 17,290 8,374Other contingent liabilities1) 8 621 - 621
17,298 8,995 17,290 8,995
1) Other creditors. 2) Creditors arising out of direct insurance
operations. 3) Assets as per 31 December 2008
consist of SEK 124,323 million in fixed-income securities, SEK 89,108 million in equities, SEK 19,808 million in real estate and SEK 4,519 million in hedge funds.
1) In 2005 Skandia Liv transferred the management right to a private equity portfolio consisting of unlisted equities and participations. The liability for certain information provided in the sales agreement has been limited to SEK 600 million.
57
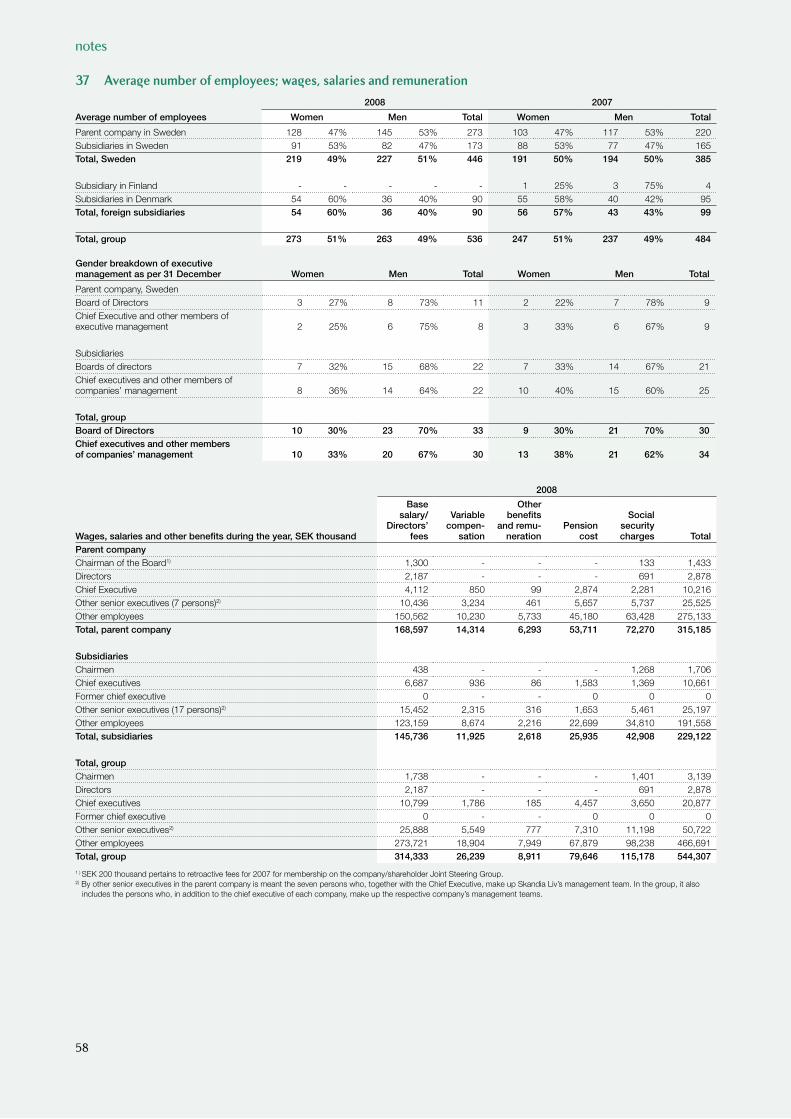
notes
2008
Wages, salaries and other benefits during the year, SEK thousand
Base salary/
Directors’ fees
Variable compen-
sation
Other benefits
and remu-neration
Pension cost
Social security charges Total
Parent company Chairman of the Board1) 1,300 - - - 133 1,433Directors 2,187 - - - 691 2,878Chief Executive 4,112 850 99 2,874 2,281 10,216Other senior executives (7 persons)2) 10,436 3,234 461 5,657 5,737 25,525Other employees 150,562 10,230 5,733 45,180 63,428 275,133Total, parent company 168,597 14,314 6,293 53,711 72,270 315,185
SubsidiariesChairmen 438 - - - 1,268 1,706Chief executives 6,687 936 86 1,583 1,369 10,661Former chief executive 0 - - 0 0 0Other senior executives (17 persons)2) 15,452 2,315 316 1,653 5,461 25,197Other employees 123,159 8,674 2,216 22,699 34,810 191,558Total, subsidiaries 145,736 11,925 2,618 25,935 42,908 229,122
Total, groupChairmen 1,738 - - - 1,401 3,139Directors 2,187 - - - 691 2,878Chief executives 10,799 1,786 185 4,457 3,650 20,877Former chief executive 0 - - 0 0 0Other senior executives2) 25,888 5,549 777 7,310 11,198 50,722Other employees 273,721 18,904 7,949 67,879 98,238 466,691Total, group 314,333 26,239 8,911 79,646 115,178 544,307
1 ) SEK 200 thousand pertains to retroactive fees for 2007 for membership on the company/shareholder Joint Steering Group.2) By other senior executives in the parent company is meant the seven persons who, together with the Chief Executive, make up Skandia Liv’s management team. In the group, it also
includes the persons who, in addition to the chief executive of each company, make up the respective company’s management teams.
37 Avera¯e number of employees; wa¯es, salaries and remuneration
2008 2007
Average number of employees Women Men Total Women Men Total
Parent company in Sweden 128 47% 145 53% 273 103 47% 117 53% 220Subsidiaries in Sweden 91 53% 82 47% 173 88 53% 77 47% 165Total, Sweden 219 49% 227 51% 446 191 50% 194 50% 385
Subsidiary in Finland - - - - - 1 25% 3 75% 4Subsidiaries in Denmark 54 60% 36 40% 90 55 58% 40 42% 95Total, foreign subsidiaries 54 60% 36 40% 90 56 57% 43 43% 99
Total, group 273 51% 263 49% 536 247 51% 237 49% 484
Gender breakdown of executive management as per 31 December Women Men Total Women Men Total
Parent company, SwedenBoard of Directors 3 27% 8 73% 11 2 22% 7 78% 9Chief Executive and other members of executive management 2 25% 6 75% 8 3 33% 6 67% 9
Subsidiaries Boards of directors 7 32% 15 68% 22 7 33% 14 67% 21Chief executives and other members of companies’ management 8 36% 14 64% 22 10 40% 15 60% 25
Total, groupBoard of Directors 10 30% 23 70% 33 9 30% 21 70% 30Chief executives and other members of companies’ management 10 33% 20 67% 30 13 38% 21 62% 34
58
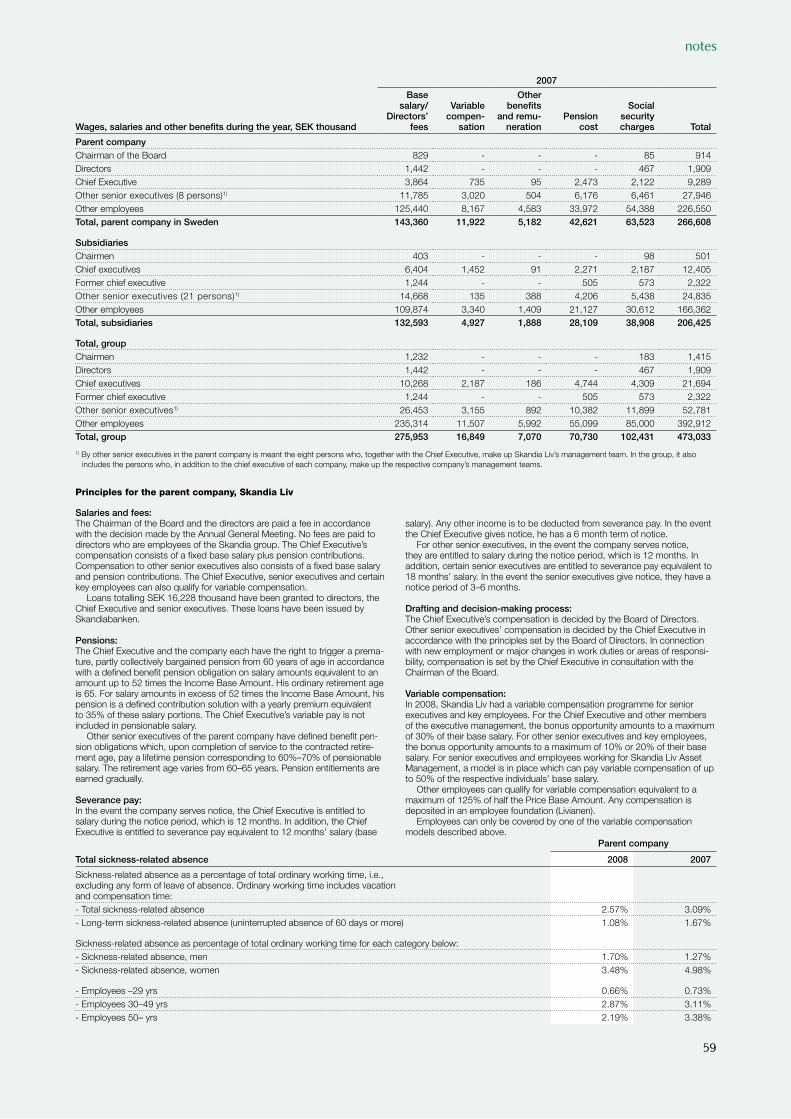
notes
Principles for the parent company, Skandia Liv
Salaries and fees:The Chairman of the Board and the directors are paid a fee in accordance with the decision made by the Annual General Meeting. No fees are paid to directors who are employees of the Skandia group. The Chief Executive’s compensation consists of a fixed base salary plus pension contributions. Compensation to other senior executives also consists of a fixed base salary and pension contributions. The Chief Executive, senior executives and certain key employees can also qualify for variable compensation.
Loans totalling SEK 16,228 thousand have been granted to directors, the Chief Executive and senior executives. These loans have been issued by Skandiabanken.
Pensions:The Chief Executive and the company each have the right to trigger a prema-ture, partly collectively bargained pension from 60 years of age in accordance with a defined benefit pension obligation on salary amounts equivalent to an amount up to 52 times the Income Base Amount. His ordinary retirement age is 65. For salary amounts in excess of 52 times the Income Base Amount, his pension is a defined contribution solution with a yearly premium equivalent to 35% of these salary portions. The Chief Executive’s variable pay is not included in pensionable salary.
Other senior executives of the parent company have defined benefit pen-sion obligations which, upon completion of service to the contracted retire-ment age, pay a lifetime pension corresponding to 60%–70% of pensionable salary. The retirement age varies from 60–65 years. Pension entitlements are earned gradually.
Severance pay:In the event the company serves notice, the Chief Executive is entitled to salary during the notice period, which is 12 months. In addition, the Chief Executive is entitled to severance pay equivalent to 12 months’ salary (base
Parent company
Total sickness-related absence 2008 2007
Sickness-related absence as a percentage of total ordinary working time, i.e.,excluding any form of leave of absence. Ordinary working time includes vacationand compensation time:- Total sickness-related absence 2.57% 3.09%- Long-term sickness-related absence (uninterrupted absence of 60 days or more) 1.08% 1.67%
Sickness-related absence as percentage of total ordinary working time for each category below:- Sickness-related absence, men 1.70% 1.27%- Sickness-related absence, women 3.48% 4.98%
- Employees –29 yrs 0.66% 0.73%- Employees 30–49 yrs 2.87% 3.11%- Employees 50– yrs 2.19% 3.38%
salary). Any other income is to be deducted from severance pay. In the event the Chief Executive gives notice, he has a 6 month term of notice.
For other senior executives, in the event the company serves notice, they are entitled to salary during the notice period, which is 12 months. In addition, certain senior executives are entitled to severance pay equivalent to 18 months’ salary. In the event the senior executives give notice, they have a notice period of 3–6 months.
Drafting and decision-making process:The Chief Executive’s compensation is decided by the Board of Directors. Other senior executives’ compensation is decided by the Chief Executive in accordance with the principles set by the Board of Directors. In connection with new employment or major changes in work duties or areas of responsi-bility, compensation is set by the Chief Executive in consultation with the Chairman of the Board.
Variable compensation:In 2008, Skandia Liv had a variable compensation programme for senior executives and key employees. For the Chief Executive and other members of the executive management, the bonus opportunity amounts to a maximum of 30% of their base salary. For other senior executives and key employees, the bonus opportunity amounts to a maximum of 10% or 20% of their base salary. For senior executives and employees working for Skandia Liv Asset Management, a model is in place which can pay variable compensation of up to 50% of the respective individuals’ base salary.
Other employees can qualify for variable compensation equivalent to a maximum of 125% of half the Price Base Amount. Any compensation is deposited in an employee foundation (Livianen).
Employees can only be covered by one of the variable compensation models described above.
2007
Wages, salaries and other benefits during the year, SEK thousand
Base salary/
Directors’ fees
Variable compen-
sation
Other benefits
and remu-neration
Pension cost
Social security charges Total
Parent company Chairman of the Board 829 - - - 85 914Directors 1,442 - - - 467 1,909Chief Executive 3,864 735 95 2,473 2,122 9,289Other senior executives (8 persons)1) 11,785 3,020 504 6,176 6,461 27,946Other employees 125,440 8,167 4,583 33,972 54,388 226,550Total, parent company in Sweden 143,360 11,922 5,182 42,621 63,523 266,608
SubsidiariesChairmen 403 - - - 98 501Chief executives 6,404 1,452 91 2,271 2,187 12,405Former chief executive 1,244 - - 505 573 2,322Other senior executives (21 persons)1) 14,668 135 388 4,206 5,438 24,835Other employees 109,874 3,340 1,409 21,127 30,612 166,362Total, subsidiaries 132,593 4,927 1,888 28,109 38,908 206,425
Total, groupChairmen 1,232 - - - 183 1,415Directors 1,442 - - - 467 1,909Chief executives 10,268 2,187 186 4,744 4,309 21,694Former chief executive 1,244 - - 505 573 2,322Other senior executives1) 26,453 3,155 892 10,382 11,899 52,781Other employees 235,314 11,507 5,992 55,099 85,000 392,912Total, group 275,953 16,849 7,070 70,730 102,431 473,033
1) By other senior executives in the parent company is meant the eight persons who, together with the Chief Executive, make up Skandia Liv’s management team. In the group, it also includes the persons who, in addition to the chief executive of each company, make up the respective company’s management teams.
59
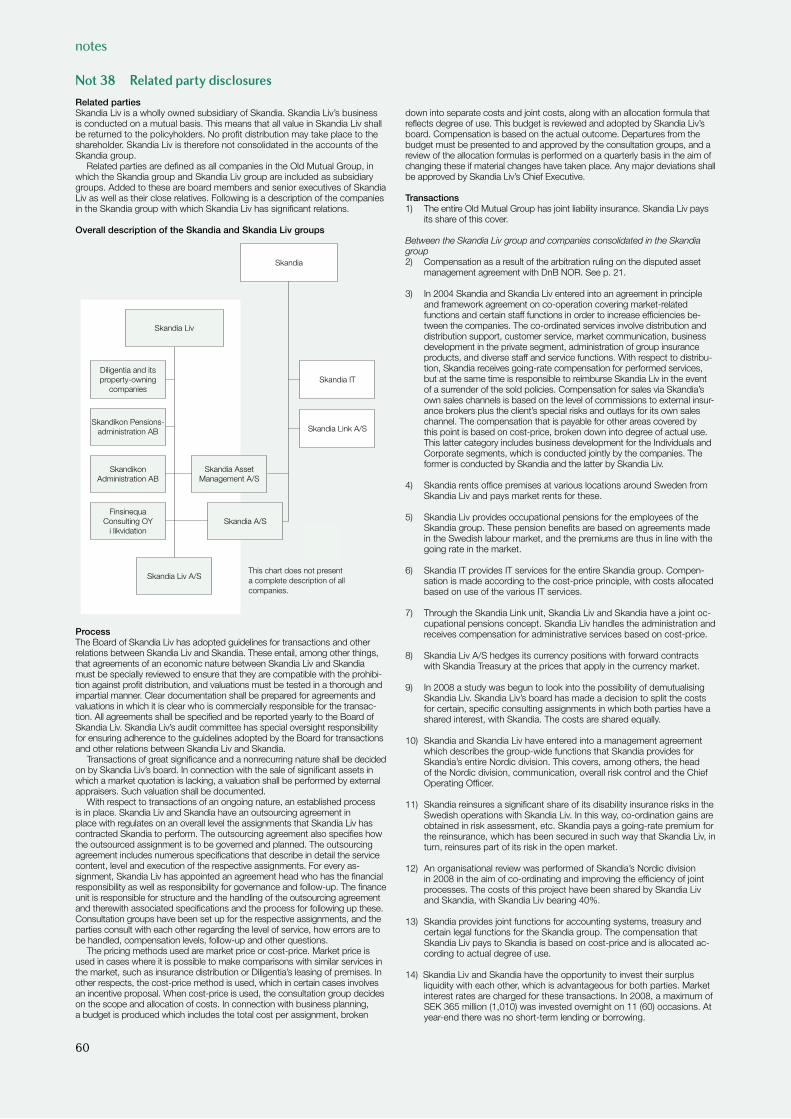
notes
Not 38 Related party disclosures
Related partiesSkandia Liv is a wholly owned subsidiary of Skandia. Skandia Liv’s business is conducted on a mutual basis. This means that all value in Skandia Liv shall be returned to the policyholders. No profit distribution may take place to the shareholder. Skandia Liv is therefore not consolidated in the accounts of the Skandia group.
Related parties are defined as all companies in the Old Mutual Group, in which the Skandia group and Skandia Liv group are included as subsidiary groups. Added to these are board members and senior executives of Skandia Liv as well as their close relatives. Following is a description of the companies in the Skandia group with which Skandia Liv has significant relations.
Overall description of the Skandia and Skandia Liv groups
This chart does not present a complete description of all companies.
Skandia IT
Skandia
Skandia Liv
Skandia Link A/S
Skandia Asset Management A/S
Skandia A/S
Diligentia and its property-owning
companies
Skandikon Pensions-administration AB
Skandikon Administration AB
Finsinequa Consulting OY
i likvidation
Skandia Liv A/S
ProcessThe Board of Skandia Liv has adopted guidelines for transactions and other relations between Skandia Liv and Skandia. These entail, among other things, that agreements of an economic nature between Skandia Liv and Skandia must be specially reviewed to ensure that they are compatible with the prohibi-tion against profit distribution, and valuations must be tested in a thorough and impartial manner. Clear documentation shall be prepared for agreements and valuations in which it is clear who is commercially responsible for the transac-tion. All agreements shall be specified and be reported yearly to the Board of Skandia Liv. Skandia Liv’s audit committee has special oversight responsibility for ensuring adherence to the guidelines adopted by the Board for transactions and other relations between Skandia Liv and Skandia.
Transactions of great significance and a nonrecurring nature shall be decided on by Skandia Liv’s board. In connection with the sale of significant assets in which a market quotation is lacking, a valuation shall be performed by external appraisers. Such valuation shall be documented.
With respect to transactions of an ongoing nature, an established process is in place. Skandia Liv and Skandia have an outsourcing agreement in place with regulates on an overall level the assignments that Skandia Liv has contracted Skandia to perform. The outsourcing agreement also specifies how the outsourced assignment is to be governed and planned. The outsourcing agreement includes numerous specifications that describe in detail the service content, level and execution of the respective assignments. For every as-signment, Skandia Liv has appointed an agreement head who has the financial responsibility as well as responsibility for governance and follow-up. The finance unit is responsible for structure and the handling of the outsourcing agreement and therewith associated specifications and the process for following up these. Consultation groups have been set up for the respective assignments, and the parties consult with each other regarding the level of service, how errors are to be handled, compensation levels, follow-up and other questions.
The pricing methods used are market price or cost-price. Market price is used in cases where it is possible to make comparisons with similar services in the market, such as insurance distribution or Diligentia’s leasing of premises. In other respects, the cost-price method is used, which in certain cases involves an incentive proposal. When cost-price is used, the consultation group decides on the scope and allocation of costs. In connection with business planning, a budget is produced which includes the total cost per assignment, broken
down into separate costs and joint costs, along with an allocation formula that reflects degree of use. This budget is reviewed and adopted by Skandia Liv’s board. Compensation is based on the actual outcome. Departures from the budget must be presented to and approved by the consultation groups, and a review of the allocation formulas is performed on a quarterly basis in the aim of changing these if material changes have taken place. Any major deviations shall be approved by Skandia Liv’s Chief Executive.
Transactions1) The entire Old Mutual Group has joint liability insurance. Skandia Liv pays
its share of this cover.
Between the Skandia Liv group and companies consolidated in the Skandia group2) Compensation as a result of the arbitration ruling on the disputed asset
management agreement with DnB NOR. See p. 21.
3) In 2004 Skandia and Skandia Liv entered into an agreement in principle and framework agreement on co-operation covering market-related functions and certain staff functions in order to increase efficiencies be-tween the companies. The co-ordinated services involve distribution and distribution support, customer service, market communication, business development in the private segment, administration of group insurance products, and diverse staff and service functions. With respect to distribu-tion, Skandia receives going-rate compensation for performed services, but at the same time is responsible to reimburse Skandia Liv in the event of a surrender of the sold policies. Compensation for sales via Skandia’s own sales channels is based on the level of commissions to external insur-ance brokers plus the client’s special risks and outlays for its own sales channel. The compensation that is payable for other areas covered by this point is based on cost-price, broken down into degree of actual use. This latter category includes business development for the Individuals and Corporate segments, which is conducted jointly by the companies. The former is conducted by Skandia and the latter by Skandia Liv.
4) Skandia rents office premises at various locations around Sweden from Skandia Liv and pays market rents for these.
5) Skandia Liv provides occupational pensions for the employees of the Skandia group. These pension benefits are based on agreements made in the Swedish labour market, and the premiums are thus in line with the going rate in the market.
6) Skandia IT provides IT services for the entire Skandia group. Compen-sation is made according to the cost-price principle, with costs allocated based on use of the various IT services.
7) Through the Skandia Link unit, Skandia Liv and Skandia have a joint oc-cupational pensions concept. Skandia Liv handles the administration and receives compensation for administrative services based on cost-price.
8) Skandia Liv A/S hedges its currency positions with forward contracts with Skandia Treasury at the prices that apply in the currency market.
9) In 2008 a study was begun to look into the possibility of demutualising Skandia Liv. Skandia Liv’s board has made a decision to split the costs for certain, specific consulting assignments in which both parties have a shared interest, with Skandia. The costs are shared equally.
10) Skandia and Skandia Liv have entered into a management agreement which describes the group-wide functions that Skandia provides for Skandia’s entire Nordic division. This covers, among others, the head of the Nordic division, communication, overall risk control and the Chief Operating Officer.
11) Skandia reinsures a significant share of its disability insurance risks in the Swedish operations with Skandia Liv. In this way, co-ordination gains are obtained in risk assessment, etc. Skandia pays a going-rate premium for the reinsurance, which has been secured in such way that Skandia Liv, in turn, reinsures part of its risk in the open market.
12) An organisational review was performed of Skandia’s Nordic division in 2008 in the aim of co-ordinating and improving the efficiency of joint processes. The costs of this project have been shared by Skandia Liv and Skandia, with Skandia Liv bearing 40%.
13) Skandia provides joint functions for accounting systems, treasury and certain legal functions for the Skandia group. The compensation that Skandia Liv pays to Skandia is based on cost-price and is allocated ac-cording to actual degree of use.
14) Skandia Liv and Skandia have the opportunity to invest their surplus liquidity with each other, which is advantageous for both parties. Market interest rates are charged for these transactions. In 2008, a maximum of SEK 365 million (1,010) was invested overnight on 11 (60) occasions. At year-end there was no short-term lending or borrowing.
60
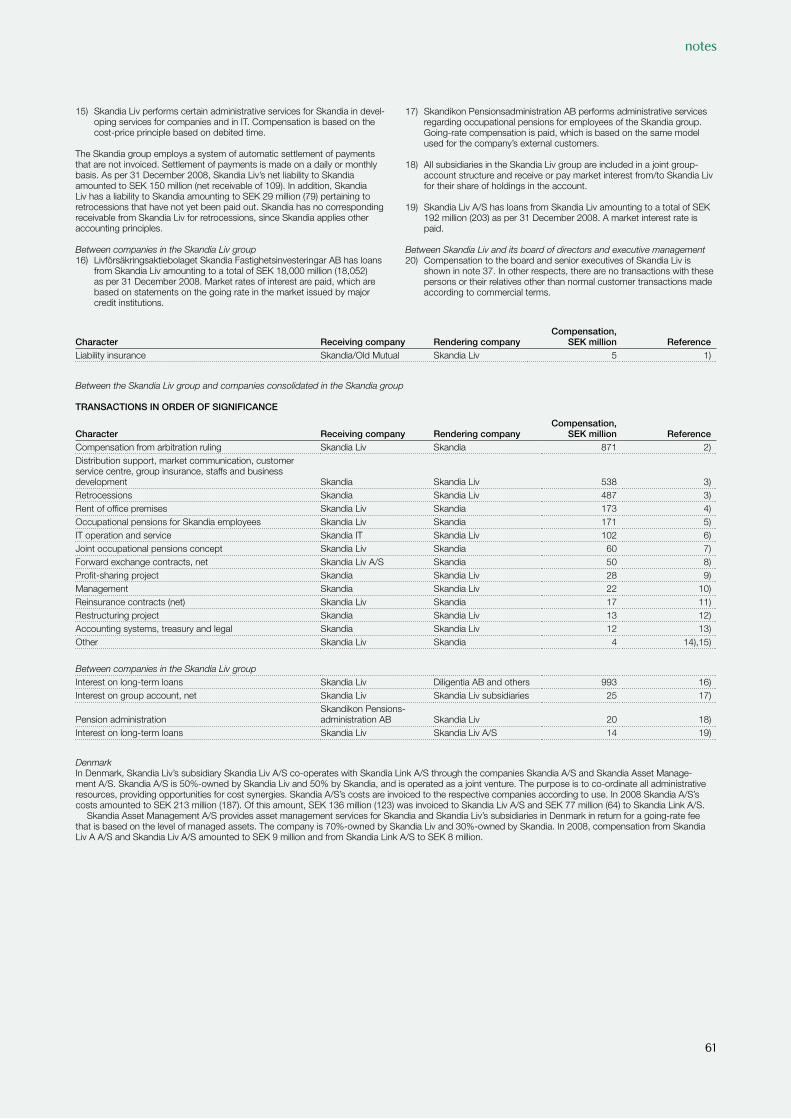
notes
15) Skandia Liv performs certain administrative services for Skandia in devel-oping services for companies and in IT. Compensation is based on the cost-price principle based on debited time.
The Skandia group employs a system of automatic settlement of payments that are not invoiced. Settlement of payments is made on a daily or monthly basis. As per 31 December 2008, Skandia Liv’s net liability to Skandia amounted to SEK 150 million (net receivable of 109). In addition, Skandia Liv has a liability to Skandia amounting to SEK 29 million (79) pertaining to retrocessions that have not yet been paid out. Skandia has no corresponding receivable from Skandia Liv for retrocessions, since Skandia applies other accounting principles.
Between companies in the Skandia Liv group16) Livförsäkringsaktiebolaget Skandia Fastighetsinvesteringar AB has loans
from Skandia Liv amounting to a total of SEK 18,000 million (18,052) as per 31 December 2008. Market rates of interest are paid, which are based on statements on the going rate in the market issued by major credit institutions.
17) Skandikon Pensionsadministration AB performs administrative services regarding occupational pensions for employees of the Skandia group. Going-rate compensation is paid, which is based on the same model used for the company’s external customers.
18) All subsidiaries in the Skandia Liv group are included in a joint group-account structure and receive or pay market interest from/to Skandia Liv for their share of holdings in the account.
19) Skandia Liv A/S has loans from Skandia Liv amounting to a total of SEK 192 million (203) as per 31 December 2008. A market interest rate is paid.
Between Skandia Liv and its board of directors and executive management 20) Compensation to the board and senior executives of Skandia Liv is
shown in note 37. In other respects, there are no transactions with these persons or their relatives other than normal customer transactions made according to commercial terms.
Character Receiving company Rendering companyCompensation,
SEK million ReferenceLiability insurance Skandia/Old Mutual Skandia Liv 5 1)
Between the Skandia Liv group and companies consolidated in the Skandia group
TRANSACTIONS IN ORDER OF SIGNIFICANCE
Character Receiving company Rendering companyCompensation,
SEK million ReferenceCompensation from arbitration ruling Skandia Liv Skandia 871 2)Distribution support, market communication, customer service centre, group insurance, staffs and business development Skandia Skandia Liv 538 3)Retrocessions Skandia Skandia Liv 487 3)Rent of office premises Skandia Liv Skandia 173 4)Occupational pensions for Skandia employees Skandia Liv Skandia 171 5)IT operation and service Skandia IT Skandia Liv 102 6)Joint occupational pensions concept Skandia Liv Skandia 60 7)Forward exchange contracts, net Skandia Liv A/S Skandia 50 8)Profit-sharing project Skandia Skandia Liv 28 9)Management Skandia Skandia Liv 22 10)Reinsurance contracts (net) Skandia Liv Skandia 17 11)Restructuring project Skandia Skandia Liv 13 12)Accounting systems, treasury and legal Skandia Skandia Liv 12 13)Other Skandia Liv Skandia 4 14),15)
Between companies in the Skandia Liv groupInterest on long-term loans Skandia Liv Diligentia AB and others 993 16)Interest on group account, net Skandia Liv Skandia Liv subsidiaries 25 17)
Pension administration Skandikon Pensions-administration AB Skandia Liv 20 18)
Interest on long-term loans Skandia Liv Skandia Liv A/S 14 19)
DenmarkIn Denmark, Skandia Liv’s subsidiary Skandia Liv A/S co-operates with Skandia Link A/S through the companies Skandia A/S and Skandia Asset Manage-ment A/S. Skandia A/S is 50%-owned by Skandia Liv and 50% by Skandia, and is operated as a joint venture. The purpose is to co-ordinate all administrative resourc es, providing opportunities for cost synergies. Skandia A/S’s costs are invoiced to the respective companies according to use. In 2008 Skandia A/S’s costs amounted to SEK 213 million (187). Of this amount, SEK 136 million (123) was invoiced to Skandia Liv A/S and SEK 77 million (64) to Skandia Link A/S.
Skandia Asset Management A/S provides asset management services for Skandia and Skandia Liv’s subsidiaries in Denmark in return for a going-rate fee that is based on the level of managed assets. The company is 70%-owned by Skandia Liv and 30%-owned by Skandia. In 2008, compensation from Skandia Liv A A/S and Skandia Liv A/S amounted to SEK 9 million and from Skandia Link A/S to SEK 8 million.
61
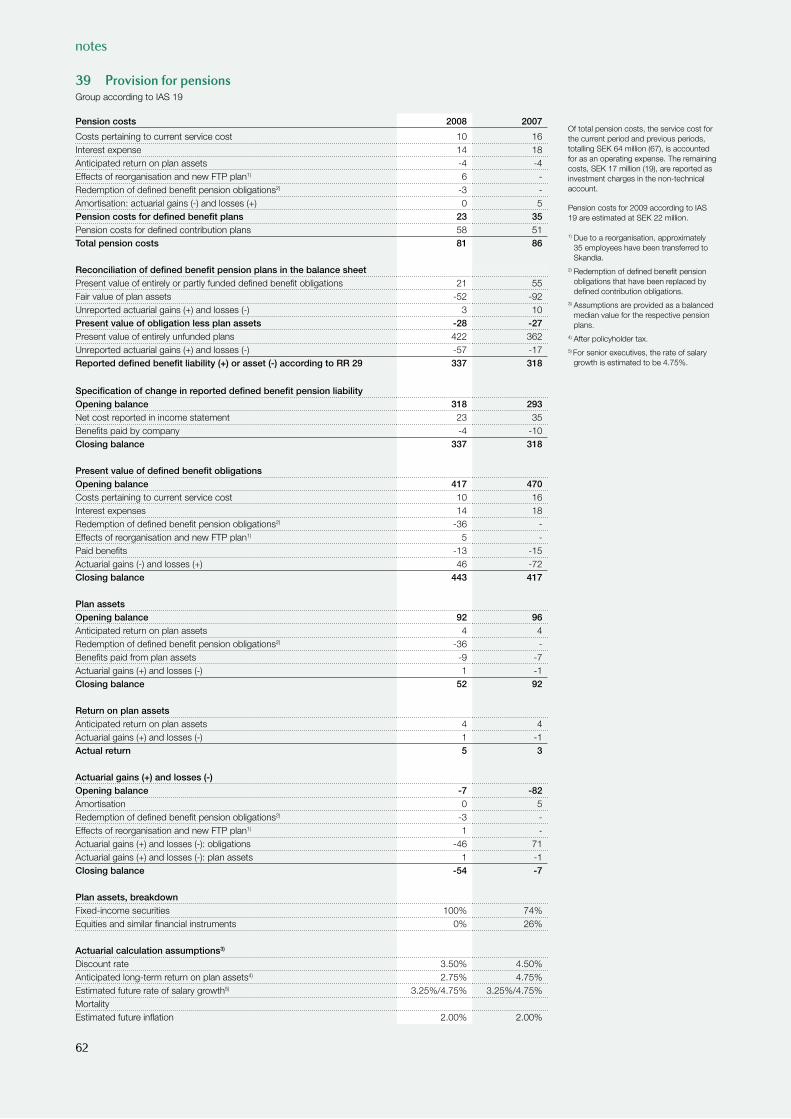
notes
39 Provision for pensions Group according to IAS 19
Pension costs 2008 2007
Costs pertaining to current service cost 10 16Interest expense 14 18Anticipated return on plan assets -4 -4Effects of reorganisation and new FTP plan1) 6 - Redemption of defined benefit pension obligations2) -3 - Amortisation: actuarial gains (-) and losses (+) 0 5Pension costs for defined benefit plans 23 35Pension costs for defined contribution plans 58 51Total pension costs 81 86
Reconciliation of defined benefit pension plans in the balance sheet Present value of entirely or partly funded defined benefit obligations 21 55Fair value of plan assets -52 -92Unreported actuarial gains (+) and losses (-) 3 10Present value of obligation less plan assets -28 -27Present value of entirely unfunded plans 422 362Unreported actuarial gains (+) and losses (-) -57 -17Reported defined benefit liability (+) or asset (-) according to RR 29 337 318
Specification of change in reported defined benefit pension liabilityOpening balance 318 293Net cost reported in income statement 23 35Benefits paid by company -4 -10Closing balance 337 318
Present value of defined benefit obligations Opening balance 417 470Costs pertaining to current service cost 10 16Interest expenses 14 18Redemption of defined benefit pension obligations2) -36 -Effects of reorganisation and new FTP plan1) 5 -Paid benefits -13 -15Actuarial gains (-) and losses (+) 46 -72Closing balance 443 417
Plan assetsOpening balance 92 96Anticipated return on plan assets 4 4Redemption of defined benefit pension obligations2) -36 -Benefits paid from plan assets -9 -7Actuarial gains (+) and losses (-) 1 -1Closing balance 52 92
Return on plan assetsAnticipated return on plan assets 4 4Actuarial gains (+) and losses (-) 1 -1Actual return 5 3
Actuarial gains (+) and losses (-)Opening balance -7 -82Amortisation 0 5Redemption of defined benefit pension obligations2) -3 -Effects of reorganisation and new FTP plan1) 1 -Actuarial gains (+) and losses (-): obligations -46 71Actuarial gains (+) and losses (-): plan assets 1 -1Closing balance -54 -7
Plan assets, breakdownFixed-income securities 100% 74%Equities and similar financial instruments 0% 26%
Actuarial calculation assumptions3)
Discount rate 3.50% 4.50%Anticipated long-term return on plan assets4) 2.75% 4.75%Estimated future rate of salary growth5) 3.25%/4.75% 3.25%/4.75%MortalityEstimated future inflation 2.00% 2.00%
Of total pension costs, the service cost for the current period and previous periods, totalling SEK 64 million (67), is accounted for as an operating expense. The remaining costs, SEK 17 million (19), are reported as investment charges in the non-technical account.
Pension costs for 2009 according to IAS 19 are estimated at SEK 22 million.
1) Due to a reorganisation, approximately 35 employees have been transferred to Skandia.
2) Redemption of defined benefit pension obligations that have been replaced by defined contribution obligations.
3) Assumptions are provided as a balanced median value for the respective pension plans.
4) After policyholder tax. 5) For senior executives, the rate of salary
growth is estimated to be 4.75%.
62
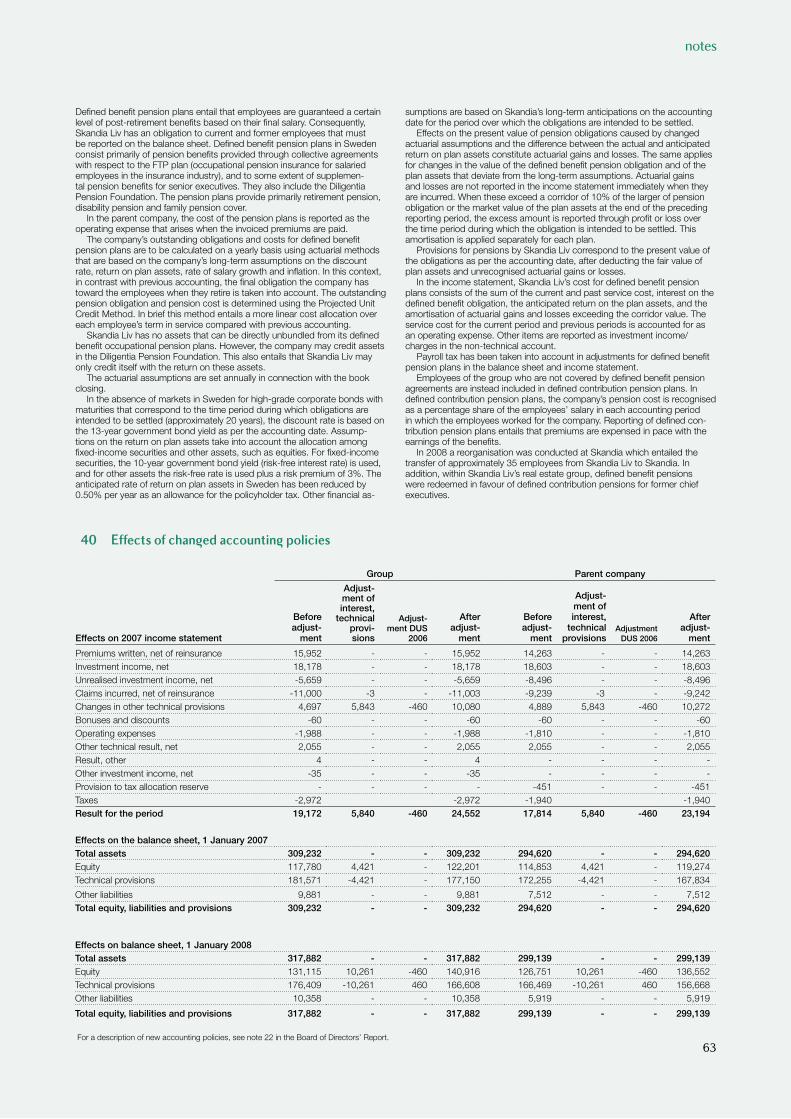
notes
Defined benefit pension plans entail that employees are guaranteed a certain level of post-retirement benefits based on their final salary. Consequently, Skandia Liv has an obligation to current and former employees that must be reported on the balance sheet. Defined benefit pension plans in Sweden consist primarily of pension benefits provided through collective agreements with respect to the FTP plan (occupational pension insurance for salaried employees in the insurance industry), and to some extent of supplemen-tal pension benefits for senior executives. They also include the Diligentia Pension Foundation. The pension plans provide primarily retirement pension, disability pension and family pension cover.
In the parent company, the cost of the pension plans is reported as the operating expense that arises when the invoiced premiums are paid.
The company’s outstanding obligations and costs for defined benefit pension plans are to be calculated on a yearly basis using actuarial methods that are based on the company’s long-term assumptions on the discount rate, return on plan assets, rate of salary growth and inflation. In this context, in contrast with previous accounting, the final obligation the company has toward the employees when they retire is taken into account. The outstanding pension obligation and pension cost is determined using the Projected Unit Credit Method. In brief this method entails a more linear cost allocation over each employee’s term in service compared with previous accounting.
Skandia Liv has no assets that can be directly unbundled from its defined benefit occupational pension plans. However, the company may credit assets in the Diligentia Pension Foundation. This also entails that Skandia Liv may only credit itself with the return on these assets.
The actuarial assumptions are set annually in connection with the book closing.
In the absence of markets in Sweden for high-grade corporate bonds with maturities that correspond to the time period during which obligations are intended to be settled (approximately 20 years), the discount rate is based on the 13-year government bond yield as per the accounting date. Assump-tions on the return on plan assets take into account the allocation among fixed-income securities and other assets, such as equities. For fixed-income securities, the 10-year government bond yield (risk-free interest rate) is used, and for other assets the risk-free rate is used plus a risk premium of 3%. The anticipated rate of return on plan assets in Sweden has been reduced by 0.50% per year as an allowance for the policyholder tax. Other financial as-
sumptions are based on Skandia’s long-term anticipations on the accounting date for the period over which the obligations are intended to be settled.
Effects on the present value of pension obligations caused by changed actuarial assumptions and the difference between the actual and anticipated return on plan assets constitute actuarial gains and losses. The same applies for changes in the value of the defined benefit pension obligation and of the plan assets that deviate from the long-term assumptions. Actuarial gains and losses are not reported in the income statement immediately when they are incurred. When these exceed a corridor of 10% of the larger of pension obligation or the market value of the plan assets at the end of the preceding reporting period, the excess amount is reported through profit or loss over the time period during which the obligation is intended to be settled. This amortisation is applied separately for each plan.
Provisions for pensions by Skandia Liv correspond to the present value of the obligations as per the accounting date, after deducting the fair value of plan assets and unrecognised actuarial gains or losses.
In the income statement, Skandia Liv’s cost for defined benefit pension plans consists of the sum of the current and past service cost, interest on the defined benefit obligation, the anticipated return on the plan assets, and the amortisation of actuarial gains and losses exceeding the corridor value. The service cost for the current period and previous periods is accounted for as an operating expense. Other items are reported as investment income/ charges in the non-technical account.
Payroll tax has been taken into account in adjustments for defined benefit pension plans in the balance sheet and income statement.
Employees of the group who are not covered by defined benefit pension agreements are instead included in defined contribution pension plans. In defined contribution pension plans, the company’s pension cost is recognised as a percentage share of the employees’ salary in each accounting period in which the employees worked for the company. Reporting of defined con-tribution pension plans entails that premiums are expensed in pace with the earnings of the benefits.
In 2008 a reorganisation was conducted at Skandia which entailed the transfer of approximately 35 employees from Skandia Liv to Skandia. In addition, within Skandia Liv’s real estate group, defined benefit pensions were redeemed in favour of defined contribution pensions for former chief executives.
40 Effects of chan¯ed accountin¯ policies
Group Parent company
Effects on 2007 income statement
Before adjust-
ment
Adjust-ment of interest,
technical provi-sions
Adjust-
ment DUS 2006
After adjust-
ment
Before adjust-
ment
Adjust-ment of interest,
technical provisions
Adjustment
DUS 2006
After adjust-
ment
Premiums written, net of reinsurance 15,952 - - 15,952 14,263 - - 14,263Investment income, net 18,178 - - 18,178 18,603 - - 18,603Unrealised investment income, net -5,659 - - -5,659 -8,496 - - -8,496Claims incurred, net of reinsurance -11,000 -3 - -11,003 -9,239 -3 - -9,242Changes in other technical provisions 4,697 5,843 -460 10,080 4,889 5,843 -460 10,272Bonuses and discounts -60 - - -60 -60 - - -60Operating expenses -1,988 - - -1,988 -1,810 - - -1,810Other technical result, net 2,055 - - 2,055 2,055 - - 2,055Result, other 4 - - 4 - - - -Other investment income, net -35 - - -35 - - - -Provision to tax allocation reserve - - - - -451 - - -451Taxes -2,972 -2,972 -1,940 -1,940Result for the period 19,172 5,840 -460 24,552 17,814 5,840 -460 23,194
Effects on the balance sheet, 1 January 2007Total assets 309,232 - - 309,232 294,620 - - 294,620Equity 117,780 4,421 - 122,201 114,853 4,421 - 119,274Technical provisions 181,571 -4,421 - 177,150 172,255 -4,421 - 167,834
Other liabilities 9,881 - - 9,881 7,512 - - 7,512Total equity, liabilities and provisions 309,232 - - 309,232 294,620 - - 294,620
Effects on balance sheet, 1 January 2008Total assets 317,882 - - 317,882 299,139 - - 299,139Equity 131,115 10,261 -460 140,916 126,751 10,261 -460 136,552Technical provisions 176,409 -10,261 460 166,608 166,469 -10,261 460 156,668Other liabilities 10,358 - - 10,358 5,919 - - 5,919
Total equity, liabilities and provisions 317,882 - - 317,882 299,139 - - 299,139
For a description of new accounting policies, see note 22 in the Board of Directors’ Report.63
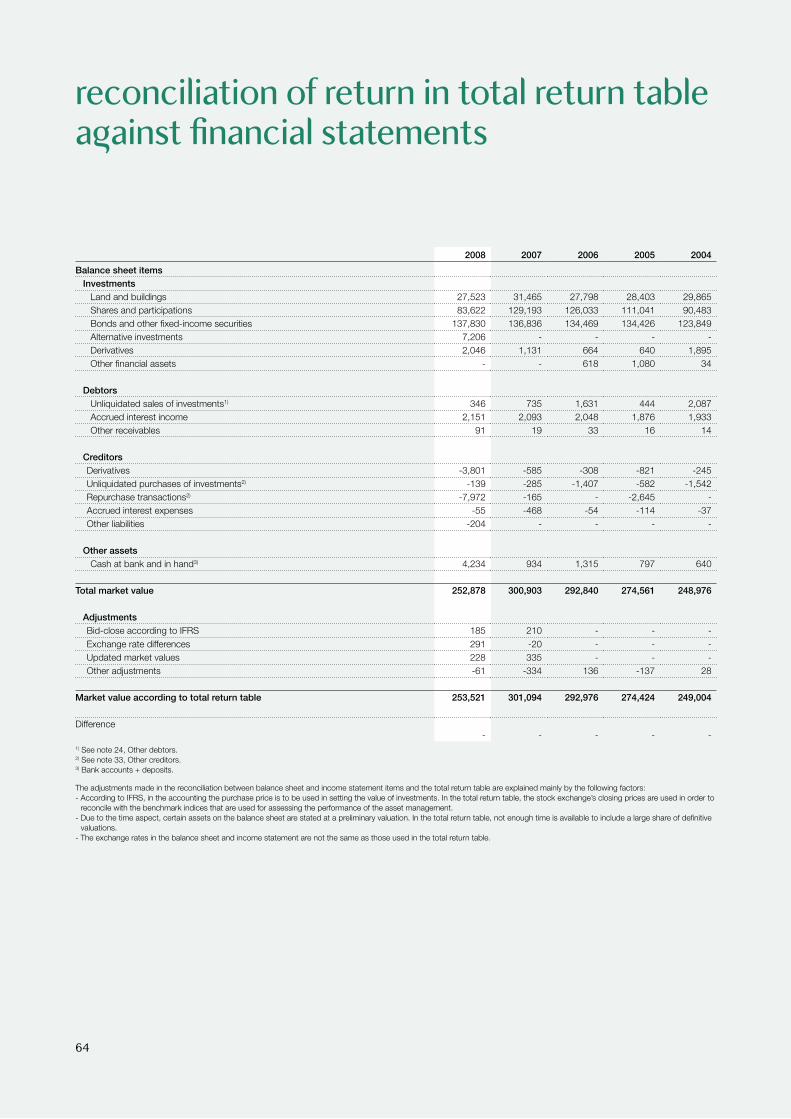
reconciliation of return in total return table a¯ainst financial statements
2008 2007 2006 2005 2004
Balance sheet itemsInvestments
Land and buildings 27,523 31,465 27,798 28,403 29,865Shares and participations 83,622 129,193 126,033 111,041 90,483Bonds and other fixed-income securities 137,830 136,836 134,469 134,426 123,849Alternative investments 7,206 - - - -Derivatives 2,046 1,131 664 640 1,895Other financial assets - - 618 1,080 34
DebtorsUnliquidated sales of investments1) 346 735 1,631 444 2,087Accrued interest income 2,151 2,093 2,048 1,876 1,933Other receivables 91 19 33 16 14
CreditorsDerivatives -3,801 -585 -308 -821 -245Unliquidated purchases of investments2) -139 -285 -1,407 -582 -1,542Repurchase transactions2) -7,972 -165 - -2,645 -Accrued interest expenses -55 -468 -54 -114 -37Other liabilities -204 - - - -
Other assetsCash at bank and in hand3) 4,234 934 1,315 797 640
Total market value 252,878 300,903 292,840 274,561 248,976
AdjustmentsBid-close according to IFRS 185 210 - - -Exchange rate differences 291 -20 - - -Updated market values 228 335 - - -Other adjustments -61 -334 136 -137 28
Market value according to total return table 253,521 301,094 292,976 274,424 249,004
Difference- - - - -
1) See note 24, Other debtors. 2) See note 33, Other creditors. 3) Bank accounts + deposits.
The adjustments made in the reconciliation between balance sheet and income statement items and the total return table are explained mainly by the following factors: - According to IFRS, in the accounting the purchase price is to be used in setting the value of investments. In the total return table, the stock exchange’s closing prices are used in order to
reconcile with the benchmark indices that are used for assessing the performance of the asset management.- Due to the time aspect, certain assets on the balance sheet are stated at a preliminary valuation. In the total return table, not enough time is available to include a large share of definitive
valuations.- The exchange rates in the balance sheet and income statement are not the same as those used in the total return table.
64
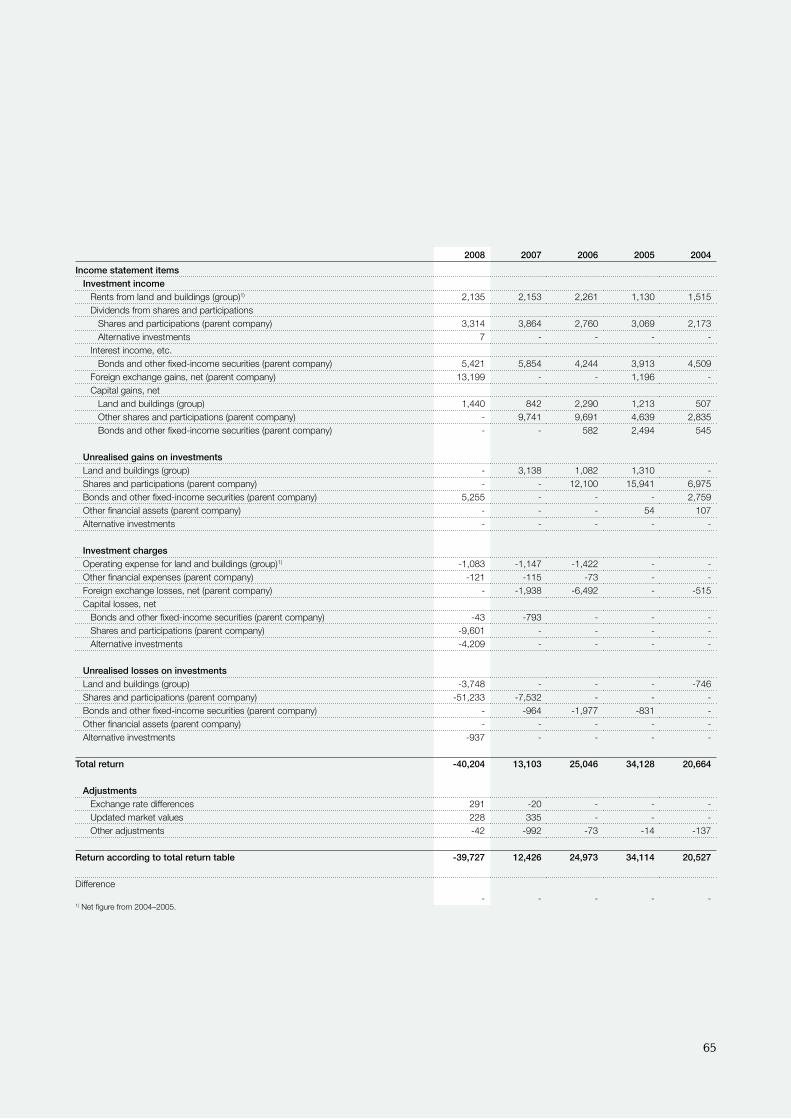
2008 2007 2006 2005 2004
Income statement itemsInvestment income
Rents from land and buildings (group)1) 2,135 2,153 2,261 1,130 1,515Dividends from shares and participations
Shares and participations (parent company) 3,314 3,864 2,760 3,069 2,173Alternative investments 7 - - - -
Interest income, etc.Bonds and other fixed-income securities (parent company) 5,421 5,854 4,244 3,913 4,509
Foreign exchange gains, net (parent company) 13,199 - - 1,196 -Capital gains, net
Land and buildings (group) 1,440 842 2,290 1,213 507Other shares and participations (parent company) - 9,741 9,691 4,639 2,835Bonds and other fixed-income securities (parent company) - - 582 2,494 545
Unrealised gains on investments Land and buildings (group) - 3,138 1,082 1,310 -Shares and participations (parent company) - - 12,100 15,941 6,975Bonds and other fixed-income securities (parent company) 5,255 - - - 2,759Other financial assets (parent company) - - - 54 107Alternative investments - - - - -
Investment chargesOperating expense for land and buildings (group)1) -1,083 -1,147 -1,422 - -Other financial expenses (parent company) -121 -115 -73 - -Foreign exchange losses, net (parent company) - -1,938 -6,492 - -515Capital losses, net
Bonds and other fixed-income securities (parent company) -43 -793 - - -Shares and participations (parent company) -9,601 - - - -Alternative investments -4,209 - - - -
Unrealised losses on investments Land and buildings (group) -3,748 - - - -746Shares and participations (parent company) -51,233 -7,532 - - -Bonds and other fixed-income securities (parent company) - -964 -1,977 -831 -Other financial assets (parent company) - - - - -Alternative investments -937 - - - -
Total return -40,204 13,103 25,046 34,128 20,664
AdjustmentsExchange rate differences 291 -20 - - -Updated market values 228 335 - - -Other adjustments -42 -992 -73 -14 -137
Return according to total return table -39,727 12,426 24,973 34,114 20,527
Difference
- - - - -1) Net figure from 2004–2005.
65
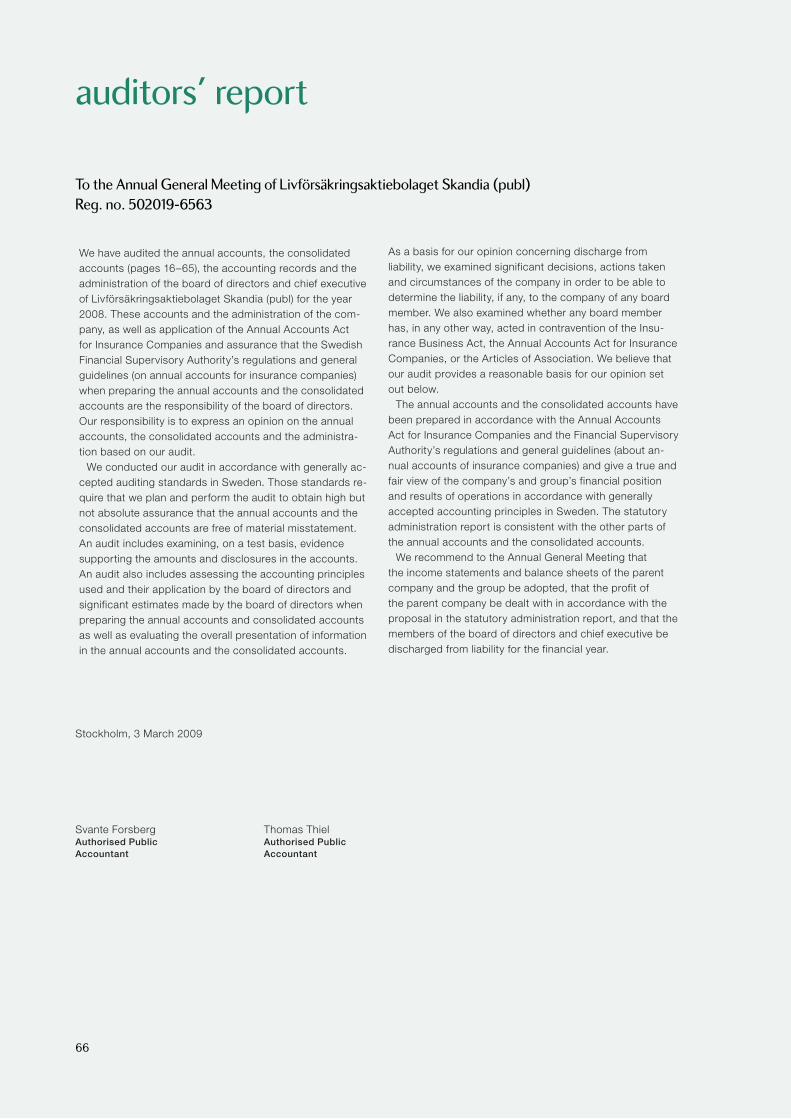
auditors’ report
We have audited the annual accounts, the consolidated accounts (pages 16–65), the accounting records and the administration of the board of directors and chief executive of Livförsäkringsaktiebolaget Skandia (publ) for the year 2008. These accounts and the administration of the com-pany, as well as application of the Annual Accounts Act for Insurance Companies and assurance that the Swedish Financial Supervisory Authority’s regulations and general guidelines (on annual accounts for insurance companies) when preparing the annual accounts and the consolidated accounts are the responsibility of the board of directors. Our responsibility is to express an opinion on the annual accounts, the consolidated accounts and the administra-tion based on our audit.
We conducted our audit in accordance with generally ac-cepted auditing standards in Sweden. Those standards re-quire that we plan and perform the audit to obtain high but not absolute assurance that the annual accounts and the consolidated accounts are free of material misstatement. An audit includes examining, on a test basis, evidence supporting the amounts and disclosures in the accounts. An audit also includes assessing the accounting principles used and their application by the board of directors and significant estimates made by the board of directors when preparing the annual accounts and consolidated accounts as well as evaluating the overall presentation of information in the annual accounts and the consolidated accounts.
As a basis for our opinion concerning discharge from liability, we examined significant decisions, actions taken and circumstances of the company in order to be able to determine the liability, if any, to the company of any board member. We also examined whether any board member has, in any other way, acted in contravention of the Insu-rance Business Act, the Annual Accounts Act for Insurance Companies, or the Articles of Association. We believe that our audit provides a reasonable basis for our opinion set out below.
The annual accounts and the consolidated accounts have been prepared in accordance with the Annual Accounts Act for Insurance Companies and the Financial Supervisory Authority’s regulations and general guidelines (about an-nual accounts of insurance companies) and give a true and fair view of the company’s and group’s financial position and results of operations in accordance with generally accepted accounting principles in Sweden. The statutory administration report is consistent with the other parts of the annual accounts and the consolidated accounts.
We recommend to the Annual General Meeting that the income statements and balance sheets of the parent company and the group be adopted, that the profit of the parent company be dealt with in accordance with the proposal in the statutory administration report, and that the members of the board of directors and chief executive be discharged from liability for the financial year.
To the Annual General Meeting of Livförsäkringsaktiebolaget Skandia (publ)Reg. no. 502019-6563
Stockholm, 3 March 2009
Svante Forsberg Thomas Thiel Authorised Public Authorised Public Accountant Accountant
66
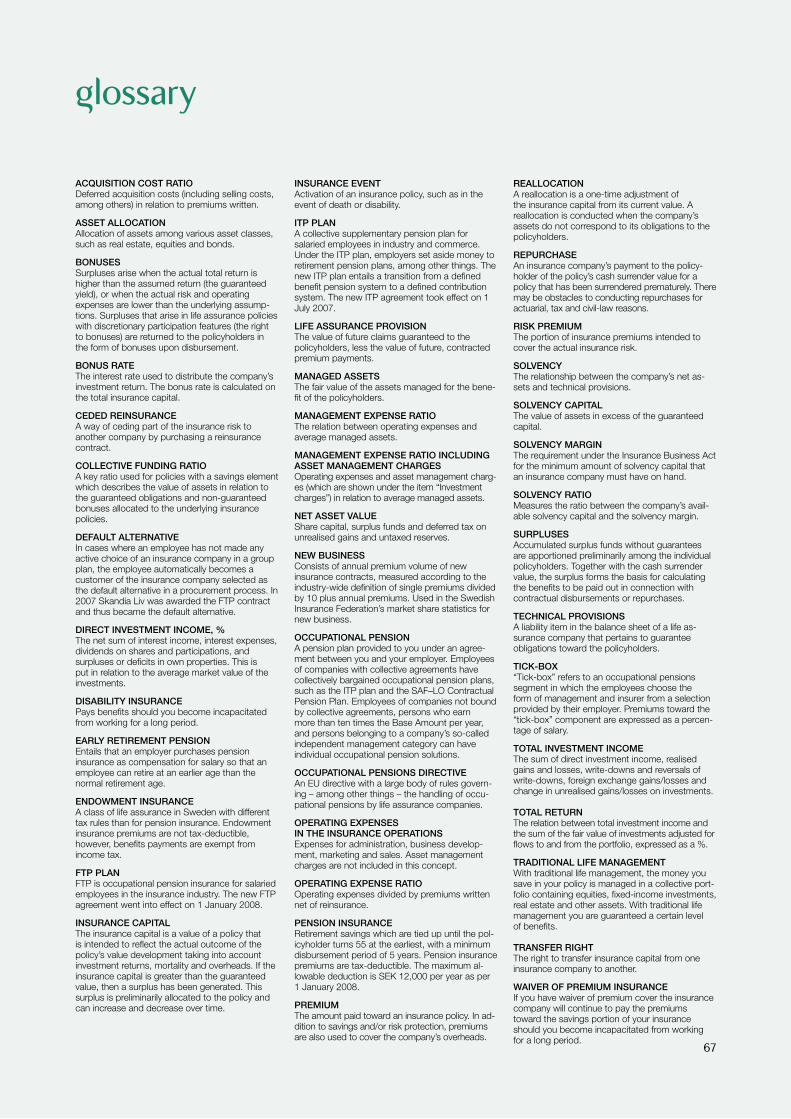
¯lossary
ACQUISITION COST RATIODeferred acquisition costs (including selling costs, among others) in relation to premiums written.
ASSET ALLOCATIONAllocation of assets among various asset classes, such as real estate, equities and bonds.
BONUSESSurpluses arise when the actual total return is higher than the assumed return (the guaranteed yield), or when the actual risk and operating expenses are lower than the underlying assump-tions. Surpluses that arise in life assurance policies with discretionary participation features (the right to bonuses) are returned to the policyholders in the form of bonuses upon disbursement.
BONUS RATEThe interest rate used to distribute the company’s investment return. The bonus rate is calculated on the total insurance capital.
CEDED REINSURANCEA way of ceding part of the insurance risk to another company by purchasing a reinsurance contract.
COLLECTIVE FUNDING RATIOA key ratio used for policies with a savings element which describes the value of assets in relation to the guaranteed obligations and non-guaranteed bonuses allocated to the underlying insurance policies.
DEFAULT ALTERNATIVEIn cases where an employee has not made any active choice of an insurance company in a group plan, the employee automatically becomes a customer of the insurance company selected as the default alternative in a procurement process. In 2007 Skandia Liv was awarded the FTP contract and thus became the default alternative.
DIRECT INVESTMENT INCOME, %The net sum of interest income, interest expenses, dividends on shares and participations, and surpluses or deficits in own properties. This is put in relation to the average market value of the investments.
DISABILITY INSURANCEPays benefits should you become incapacitated from working for a long period.
EARLY RETIREMENT PENSION Entails that an employer purchases pension insurance as compensation for salary so that an employee can retire at an earlier age than the normal retirement age.
ENDOWMENT INSURANCEA class of life assurance in Sweden with different tax rules than for pension insurance. Endowment insurance premiums are not tax-deductible, however, benefits payments are exempt from income tax.
FTP PLANFTP is occupational pension insurance for salaried employees in the insurance industry. The new FTP agreement went into effect on 1 January 2008.
INSURANCE CAPITALThe insurance capital is a value of a policy that is intended to reflect the actual outcome of the policy’s value development taking into account investment returns, mortality and overheads. If the insurance capital is greater than the guaranteed value, then a surplus has been generated. This surplus is preliminarily allocated to the policy and can increase and decrease over time.
INSURANCE EVENTActivation of an insurance policy, such as in the event of death or disability.
ITP PLANA collective supplementary pension plan for salaried employees in industry and commerce. Under the ITP plan, employers set aside money to retirement pension plans, among other things. The new ITP plan entails a transition from a defined benefit pension system to a defined contribution system. The new ITP agreement took effect on 1 July 2007.
LIFE ASSURANCE PROVISIONThe value of future claims guaranteed to the policyholders, less the value of future, contracted premium payments.
MANAGED ASSETSThe fair value of the assets managed for the bene-fit of the policyholders.
MANAGEMENT EXPENSE RATIOThe relation between operating expenses and average managed assets.
MANAGEMENT EXPENSE RATIO INCLUDING ASSET MANAGEMENT CHARGESOperating expenses and asset management charg-es (which are shown under the item “Investment charges”) in relation to average managed assets.
NET ASSET VALUEShare capital, surplus funds and deferred tax on unrealised gains and untaxed reserves.
NEW BUSINESSConsists of annual premium volume of new insurance contracts, measured according to the industry-wide definition of single premiums divided by 10 plus annual premiums. Used in the Swedish Insurance Federation’s market share statistics for new business.
OCCUPATIONAL PENSIONA pension plan provided to you under an agree-ment between you and your employer. Employees of companies with collective agreements have collectively bargained occupational pension plans, such as the ITP plan and the SAF–LO Contractual Pension Plan. Employees of companies not bound by collective agreements, persons who earn more than ten times the Base Amount per year, and persons belonging to a company’s so-called independent management category can have individual occupational pension solutions.
OCCUPATIONAL PENSIONS DIRECTIVEAn EU directive with a large body of rules govern-ing – among other things – the handling of occu-pational pensions by life assurance companies.
OPERATING EXPENSES IN THE INSURANCE OPERATIONSExpenses for administration, business develop-ment, marketing and sales. Asset management charges are not included in this concept.
OPERATING EXPENSE RATIOOperating expenses divided by premiums written net of reinsurance.
PENSION INSURANCERetirement savings which are tied up until the pol-icyholder turns 55 at the earliest, with a minimum disbursement period of 5 years. Pension insurance premiums are tax-deductible. The maximum al-lowable deduction is SEK 12,000 per year as per 1 January 2008.
PREMIUMThe amount paid toward an insurance policy. In ad-dition to savings and/or risk protection, premiums are also used to cover the company’s overheads.
REALLOCATIONA reallocation is a one-time adjustment of the insur ance capital from its current value. A reallocation is conducted when the company’s assets do not correspond to its obligations to the policyholders.
REPURCHASEAn insurance company’s payment to the policy-hold er of the policy’s cash surrender value for a policy that has been surrendered prematurely. There may be obstacles to conducting repurchases for actuarial, tax and civil-law reasons.
RISK PREMIUMThe portion of insurance premiums intended to cover the actual insurance risk.
SOLVENCYThe relationship between the company’s net as-sets and technical provisions.
SOLVENCY CAPITALThe value of assets in excess of the guaranteed capital.
SOLVENCY MARGINThe requirement under the Insurance Business Act for the minimum amount of solvency capital that an insurance company must have on hand.
SOLVENCY RATIOMeasures the ratio between the company’s avail-able solvency capital and the solvency margin.
SURPLUSESAccumulated surplus funds without guarantees are apportioned preliminarily among the individual policyholders. Together with the cash surrender value, the surplus forms the basis for calculating the benefits to be paid out in connection with contractual disbursements or repurchases.
TECHNICAL PROVISIONSA liability item in the balance sheet of a life as-surance company that pertains to guarantee obligations toward the policyholders.
TICK-BOX“Tick-box” refers to an occupational pensions segment in which the employees choose the form of management and insurer from a selection provided by their employer. Premiums toward the “tick-box” component are expressed as a percen-tage of salary.
TOTAL INVESTMENT INCOMEThe sum of direct investment income, realised gains and losses, write-downs and reversals of write-downs, foreign exchange gains/losses and change in unrealised gains/losses on investments.
TOTAL RETURNThe relation between total investment income and the sum of the fair value of investments adjusted for flows to and from the portfolio, expressed as a %.
TRADITIONAL LIFE MANAGEMENTWith traditional life management, the money you save in your policy is managed in a collective port-folio containing equities, fixed-income investments, real estate and other assets. With traditional life management you are guaranteed a certain level of benefits.
TRANSFER RIGHTThe right to transfer insurance capital from one insurance company to another.
WAIVER OF PREMIUM INSURANCEIf you have waiver of premium cover the insurance company will continue to pay the premiums toward the savings portion of your insurance should you become incapacitated from working for a long period.
67
contacts and information
interested in more information or in contactin¯ Skandia Liv?– visit skandia.se/liv or call: Skandia customer service +46 20-55 55 00
– you can also write to us: Skandia Liv SE 103 50 Stockholm
68

Livförsäkringsaktiebolaget Skandia (publ)Reg. no. 502019-6365Registered office: Stockholm
Production and design: NarvaText: Narva and Skandia LivPhotos: Jenny HallengrenPaper: Maxioffset (text 120g, cover 250g)Printing: Elanders AB
Printed in Sweden 2009Publication number: 20069:6


![Ebanking 4th sem[1]](https://img.pdfslide.net/doc/110x75/577d2c731a28ab4e1eac3f73/ebanking-4th-sem1.jpg)