Embed Size (px)
Citation preview
Nutrigenomics
NEW ZEALAND
NutrigenomicsNEW ZEALAND
Nutrigenomics - A source of new statistical challenges
Chris Triggs, Lynn Ferguson,
The University of Auckland,Auckland, New Zealand
Nutrigenomics
NEW ZEALAND
Nutrigenomics:
how nutrients affect genes
i.e. diet/gene interactions

Nutrigenomics
NEW ZEALAND
What is Nutrigenomics New Zealand?
Nutrigenomics New Zealand is a national, collaborative
research program between three major research
organisations:
It began in June 2004 and has multi-
regional ethics approval
It has approximately 60 members, mainly
scientists
It is funded by the New Zealand government
through the Foundation for Research,
Science and Technology

Nutrigenomics
NEW ZEALAND
The goals
● Tailored diets to match peoples genes
● Customised foods to optimise health
and minimise disease risks
● Dietary advice for ethnic subgroubs
● Dietary advice for medical conditions

Nutrigenomics
NEW ZEALAND
Plant & Food Research
Led by The University of Auckland
University of Auckland
Agresearch
Human
in vivo
Human
in vitroAnimal
in vivo
Food
Nutrigenomics
NEW ZEALAND
Inflammatory bowel disease
Proof of principle
Nutrigenomics
NEW ZEALAND
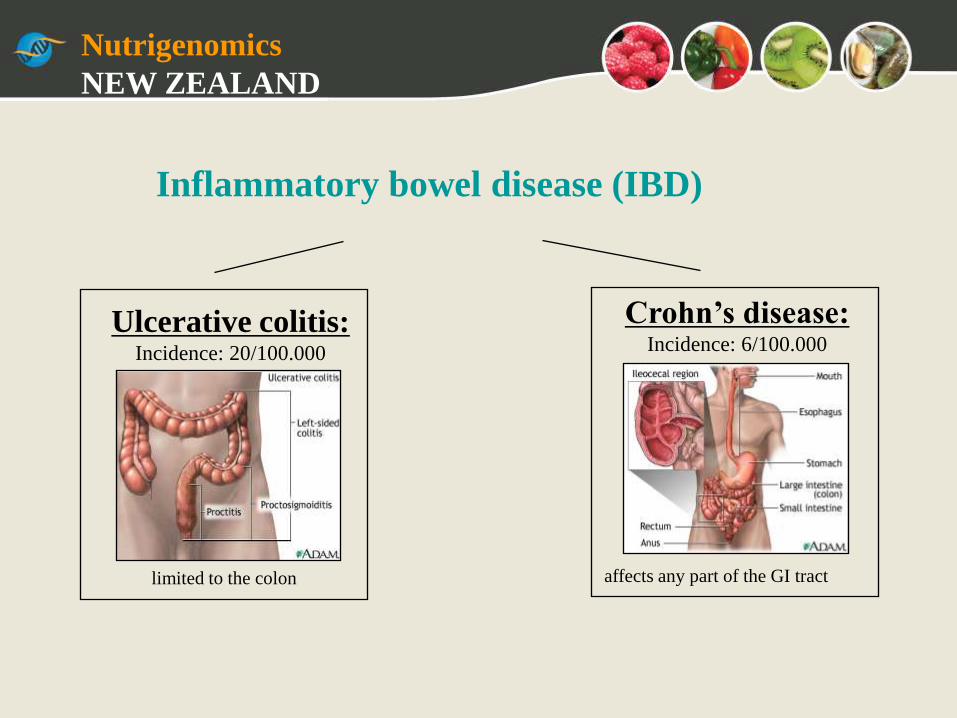
Inflammatory bowel disease (IBD)
Ulcerative colitis:Incidence: 20/100.000
Crohn’s disease:Incidence: 6/100.000
limited to the colon affects any part of the GI tract

Nutrigenomics
NEW ZEALAND
Inflammatory bowel disease in New Zealand children—
a growing problem Richard B Gearry, Andrew S DayThe inflammatory bowel diseases (IBD), Crohn’s disease and
ulcerative colitis, are no longer rare medical conditions seen only by
hospital specialists.NZMJ 3 October 2008, Vol 121 No 1283; Page 5
IBD epidemiology—what’s happening in New Zealand?Over the past 50 years there has been a dramatic rise in the incidence of IBD in New
Zealand.
A particularly striking increase in the incidence of CD has been seen in
Canterbury…..

Nutrigenomics
NEW ZEALAND
Paediatric inflammatory bowel
disease in New Zealand Jason Yap, Alison Wesley, Stephen
Mouat, Simon Chin, 2008

Nutrigenomics
NEW ZEALAND
Impact of Race and Ethnicity
Basu, D; Am J Gastroenterology 100:2254-2261, 2005
Whites had stronger family history of IBD and colorectal cancer.
African Americans with CD had higher incidence of arthritis.

Nutrigenomics
NEW ZEALAND
Genetic Susceptibility
Concordance in twins
Monozygotic
Dizygotic
Shows the importance
of the environment
Nutrigenomics
NEW ZEALAND
First phase
Data gathering + Gene discovery
• >1400 IBD participants
• 620 controls
• Most participants have given a DNA
sample and completed extensive dietary
and risk factor questionnaires
Nutrigenomics
NEW ZEALAND
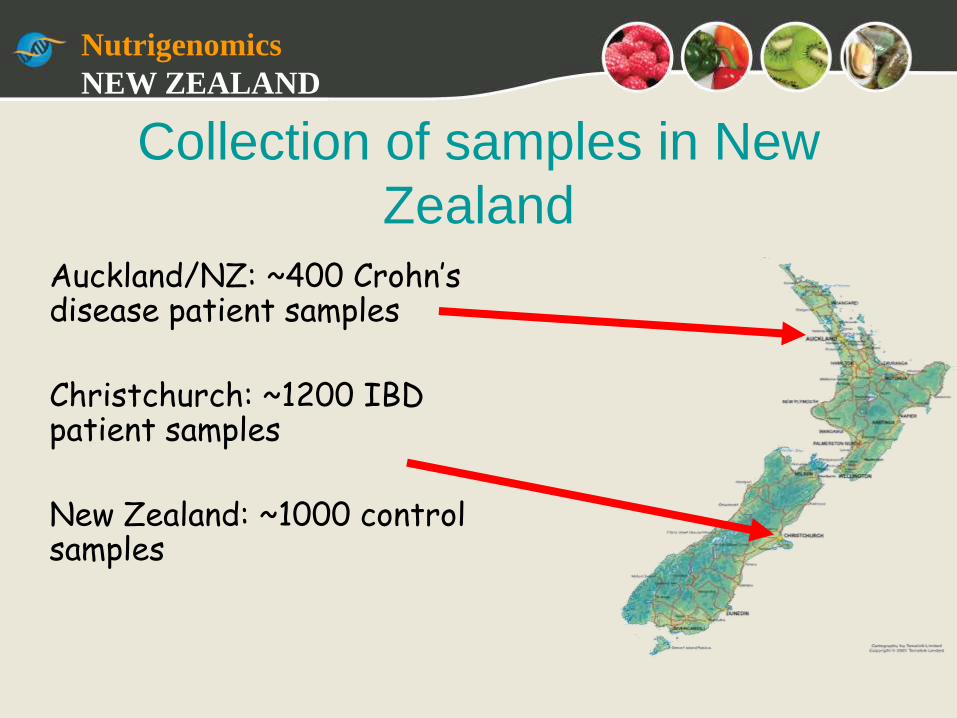
Collection of samples in New
Zealand
Auckland/NZ: ~400 Crohn’s disease patient samples
Christchurch: ~1200 IBD patient samples
New Zealand: ~1000 control samples

Nutrigenomics
NEW ZEALAND
Tumour necrosis factor alpha (TNF )Pathways• Toll-like receptor
signaling pathway• Cytokine-cytokine
receptor interaction• TGF-beta signaling
pathway• MAPK signaling
pathway• Apoptosis
Key player in development and control of inflammatory response
TNFα
From: TT Macdonald and G.
Monteleone, Science (2005) 307, 1920 -5

Nutrigenomics
NEW ZEALAND
Interleukin 23 receptor
Schematic representation of IL23R isoforms and susceptibility loci
implicated in Crohn's disease.
From: Xavier and Podolsky, Nature 448, 427-432 (2007)
Nutrigenomics
NEW ZEALAND
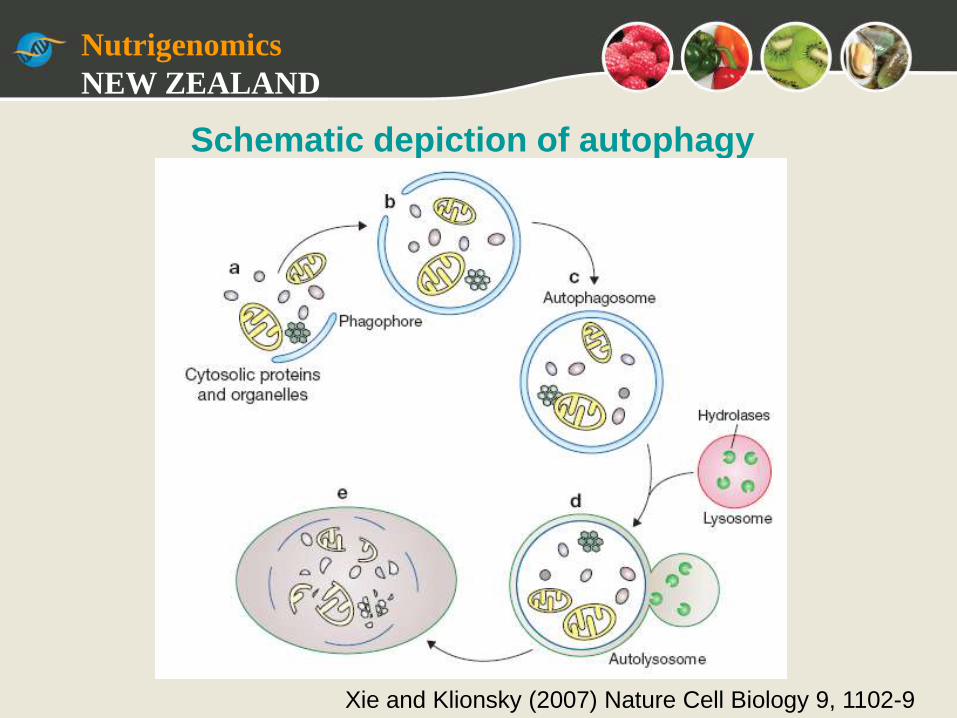
Schematic depiction of autophagy
Xie and Klionsky (2007) Nature Cell Biology 9, 1102-9

Nutrigenomics
NEW ZEALAND
Genotypes common in CD in NZ become candidates
for high throughput screens
TNF
promoter
IL23RCARD15
ATG16L1 OCTN2

Nutrigenomics
NEW ZEALAND
Other CD susceptibility genes
Other genes may be important.
The majority of them are involved in the same processes as CARD15, IL23R, and ATG16L1
Not all pathways seen in overseas studies appear important in New Zealand
A good example is the autophagy pathway, which does not seem as important as other pathways in Auckland.
Gene-diet interactions may obscure the role of other pathways…

Nutrigenomics
NEW ZEALAND
Gene discovery

Nutrigenomics
NEW ZEALAND
Key genes in CD – overlap with
• Eczema
• Asthma
• Rheumatoid arthritis
• Type 1 diabetes
• Type II diabetes
• Psoriasis
• Lupus

Nutrigenomics
NEW ZEALAND
Problems with Gene Discovery approach
PTPN2 SNP rs2542151
Genotype Controls Cases
AA 9 (1.8) 20 (6.0)
AG 161 (31.3) 112 (33.6)
GG 344 (66.9) 201 (60.4)
Cochran – Armitage
test for trend
(Chi-squared with 1df)
p-value = 0.0055.
Odds ratioConfidence
Interval
AA 3.80 1.70 – 8.51
AG 1.19 0.88 – 1.60
GG 1.00
Nutrigenomics
NEW ZEALAND
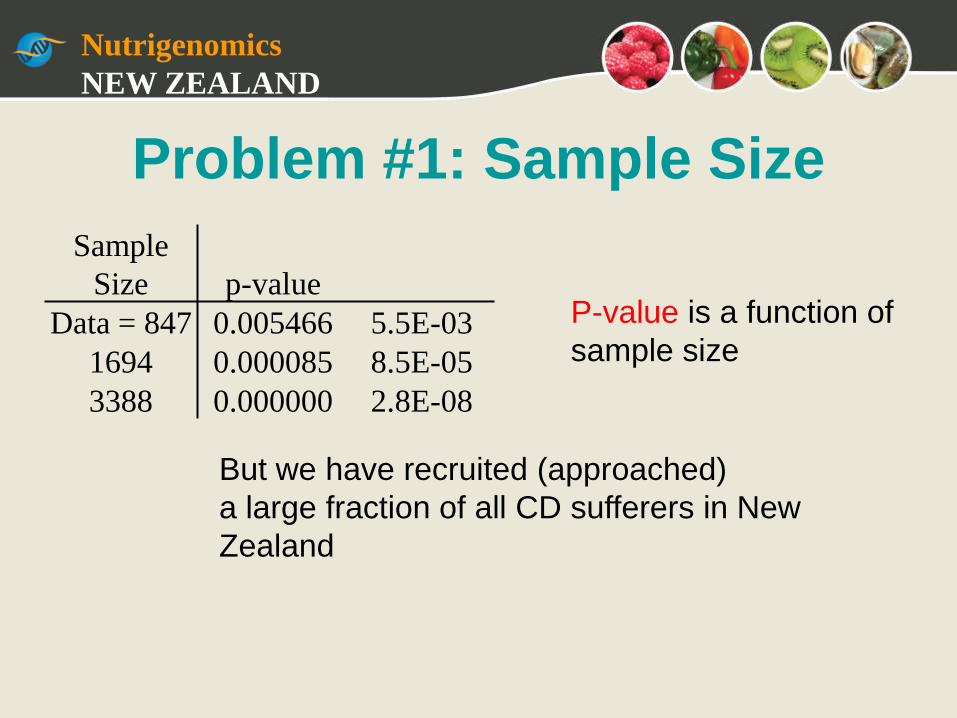
Problem #1: Sample Size
Sample
Size p-value
Data = 847 0.005466 5.5E-03
1694 0.000085 8.5E-05
3388 0.000000 2.8E-08
P-value is a function of
sample size
But we have recruited (approached)
a large fraction of all CD sufferers in New
Zealand

Nutrigenomics
NEW ZEALAND
Problem #2 Multiple comparisons
• Consider testing 2 unlinked SNPs, neither
with any effect on IBD
• Probability that (at least) one SNP gives a
―significant‖ p-value (< 0.05)?
0.05 + 0.05 – 0.05 x 0.05 = 0.0975
NOT 0.05

Nutrigenomics
NEW ZEALAND
Odds ratio
STAT3 Genotype AA
AG
GG
1.7
1.2
1.0
rs744166 p-value 0.02
STAT3 Genotype CC
CT
TT
1.0
1.2
2.0
rs3816769 p-value 0.006
JAK2 Genotype AA
AC
CC
1.0
2.0
2.5
Rs10758669 p-value 0.0003
Nutrigenomics
NEW ZEALAND
0.0 0.2 0.4 0.6 0.8 1.0
0.0
0.2
0.4
0.6
0.8
1.0
Expected p-values
Observ
ed p
-valu
es
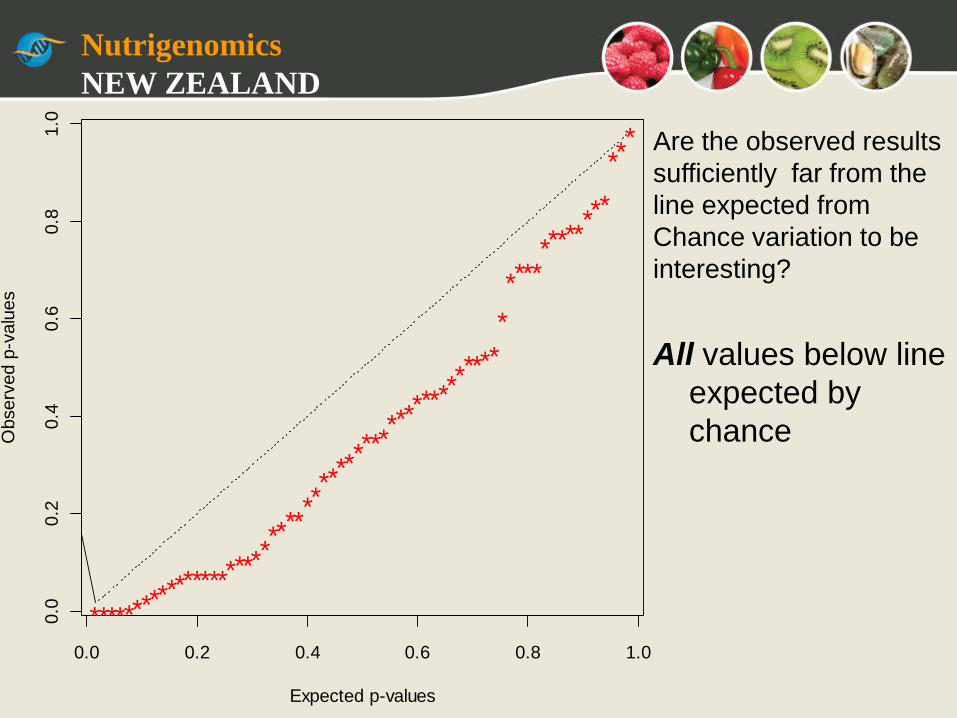
Ulcerative Colitis
**********
**********
***
****
****
*******
******
****
*
*******
****
*
*** Are the observed results
sufficiently far from the
line expected from
Chance variation to be
interesting?
All values below line
expected by
chance

Nutrigenomics
NEW ZEALAND
Adjusting for Multiple
comparisons
- Testing > 60 SNPs
Simes False Discovery
Rate (FDR)
Uses Benjamini &
Hochberg procedure
0.00 0.02 0.04 0.06 0.08 0.10 0.12 0.14
0.0
00.0
20.0
40.0
60.0
80.1
00.1
20.1
4
Expected p-values
Observ
ed p
-valu
es
Ulcerative Colitis
* * * * *
*
*
*
*
*
Simes False Discovery Rate 10 SNPs have raw
p-values <0.05
SNPs with smallest
p-values of interest
0.0 0.2 0.4 0.6 0.8 1.0
0.0
0.2
0.4
0.6
0.8
1.0
Expected p-values
Observ
ed p
-valu
es
Ulcerative Colitis
**********
**********
***
****
****
*******
******
****
*
*******
****
*
***

Nutrigenomics
NEW ZEALAND
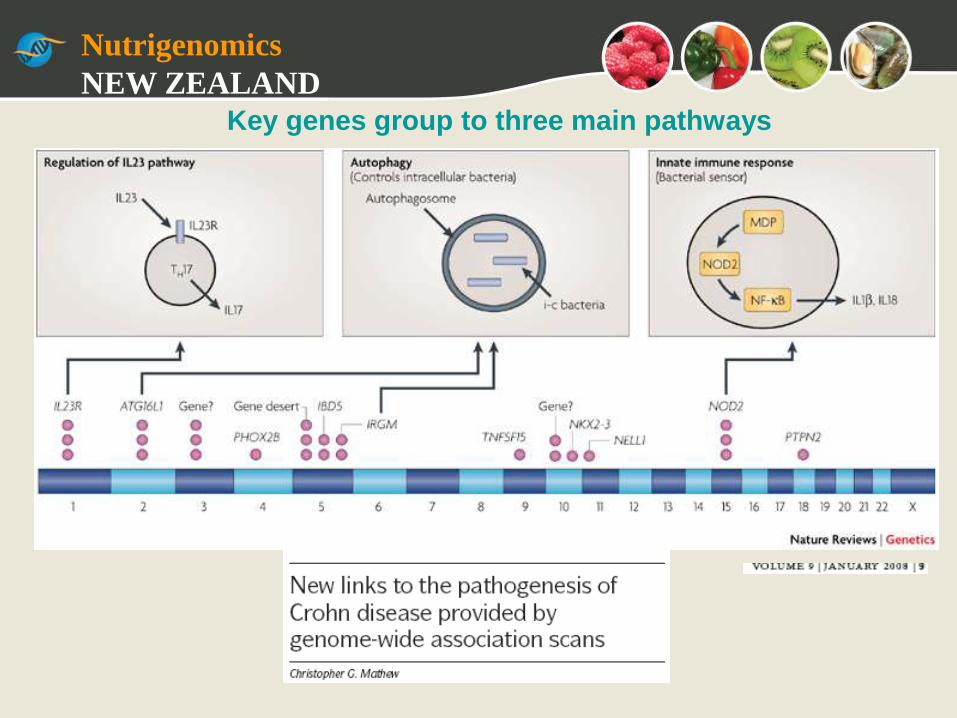
The Wellcome Trust Case
Control Consortium
Genome-wide association study of 14,000
cases of seven common diseases and
3,000 shared controls
Vol 447, 7 June 2007, doi:10.1038/nature05911

Nutrigenomics
NEW ZEALAND
13 May 2009
Nutrigenomics
NEW ZEALAND
Key genes group to three main pathways

Nutrigenomics
NEW ZEALAND
Dietary questionnaire
• 257 foods and drinks
• individuals’ perception of food tolerances
• food-related symptoms
• comments and commentary
• supplements, medication, surgery

Nutrigenomics
NEW ZEALAND
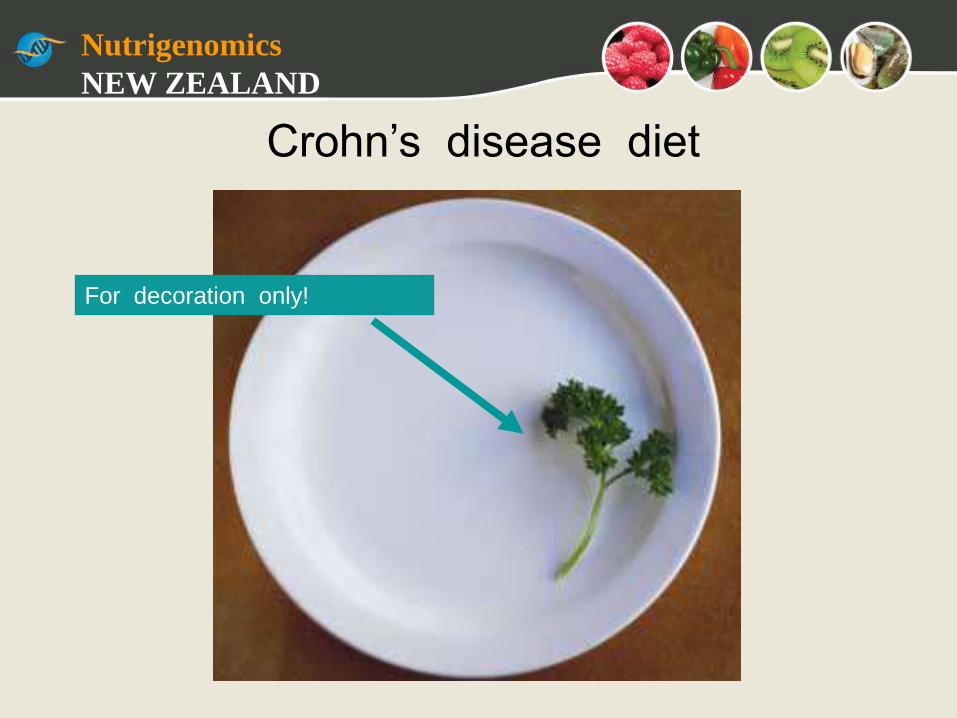
Crohn’s disease diet
Nutrigenomics
NEW ZEALAND
Crohn’s disease diet
For decoration only!

Nutrigenomics
NEW ZEALAND
Dietary preferences and intolerances
Beneficial effect
• Mushrooms
• Red wine
• Corn
• Soy milk
• Yoghurt
• Oily fish
• Apples
Intolerance
• Mushrooms
• Red wine
• Corn
• Soy milk
• Yoghurt
• Oily fish
• Apples

Nutrigenomics
NEW ZEALAND
13 May 2009
Food Questionnaire • 15 Food Categories
• Each category 8 – 44 specific food options
• 257 specific food types
476 responses
low non-response rate
Makes condition worse Makes condition better
Definitely Probably No Difference Probably Definitely
Score 0 Score 1 Score 2 Score 3 Score 4

Nutrigenomics
NEW ZEALAND
Can we find foods thatbenefit substantial proportion of people
hurt substantial proportion of others
Are there neutral foods - low proportions of both Score 0 and 4?
Goals
Cluster foods
good and bad
look at distribution of ordered responses 0(--) 4 (++)
Cluster subjects
profiles of response
link to genotype
476 (subjects) x 15 (Food Type) matrix
Or 476 x 269 matrix
Ordered Scale 0 = -- 4 = ++

Nutrigenomics
NEW ZEALAND
1 2 3
y
Den
sity
Look at distribution of ordered responses
0 = Def. worse 4 = Def. better
Underlying continuous latent variable,
Modeling the cumulative probability,
i,k of ordinal score k for food i
,3iP,3i
,2i
1 2 3
1P 2P3P 4P
y
Density
1 2 3
Density
1P 2P3P 4P
y
Den
sit
y
Use of cut points k to define probabilities of ordinal categories, Pi,k

Nutrigenomics
NEW ZEALAND
First
answers
Foods don’t clusterSpectrum of response
Muesl
iBars
Corn
Cra
ckers
Cro
issa
nts
Cake
Muffin
sSw
eetB
uns
Sco
nes
Pla
inB
iscu
its
Pita
Fla
tBre
ad
Ric
eC
rack
ers
Doughnuts
Panca
ke
Choco
late
Bis
cuits
Cra
ckers
Wheat
Bad Good
Least significant difference
Higher proportion of Definitely
or Probably worse
Higher proportion of Definitely
or Probably better
Muesli Bars Croissants Pancake
Doughnuts Cake Plain Biscuits
Chocolate Biscuits Muffins Pita FlatBread
Corn Crackers Scones Rice Crackers
Sweet Buns

Nutrigenomics
NEW ZEALAND
Biscuits
1
2
34
56
78
9
10
11
12
13
Increasing adverse effects
Incre
asin
g b
eneficia
l eff
ects
RiceCrackers
MuesliBars
36% report
adverse effects

Nutrigenomics
NEW ZEALAND
Increasing adverse effects
Incre
asin
g b
eneficia
l eff
ects
*
***
**
**
*
*
*
*
*
Biscuits
Increasing adverse effects
Incre
asin
g b
eneficia
l eff
ects
*
***
**
**
*
*
*
*
*
Biscuits
*
*
**
*
**
*
**
*
***
**
**
Meat
Increasing adverse effects
Incre
asin
g b
eneficia
l eff
ects
*
***
**
**
*
*
*
*
*
Biscuits
*
*
**
*
**
*
**
*
***
**
**
Meat
**
****
*
***
**
*
*
**
*
**
**
*
**
**
**
*
*
*
*
*
*
*
*
**
****
*
*
Vegetables
Increasing adverse effects
Incre
asin
g b
eneficia
l eff
ects
*
***
**
**
*
*
*
*
*
Biscuits
*
*
**
*
**
*
**
*
***
**
**
Meat
**
****
*
***
**
*
*
**
*
**
**
*
**
**
**
*
*
*
*
*
*
*
*
**
****
*
*
Vegetables
*
**
*
*
**
****
*
*
*
*
**
***
***
*
**
*
*
*
*
*
Fruit
Increasing adverse effects
Incre
asin
g b
eneficia
l eff
ects
*
***
**
**
*
*
*
*
*
Biscuits
*
*
**
*
**
*
**
*
***
**
**
Meat
**
****
*
***
**
*
*
**
*
**
**
*
**
**
**
*
*
*
*
*
*
*
*
**
****
*
*
Vegetables
*
**
*
*
**
****
*
*
*
*
**
***
***
*
**
*
*
*
*
*
Fruit
*
*
*
*
**
*
**
*
*
*
*
*
Dairy
*
*
*
*
**
*
*
*
*
*
*
* *
**
** **
Spread

Nutrigenomics
NEW ZEALAND
12
3
456
7
89
10
1112
13
14
1516
17
1819
2021
22
2324
2526
2728
29
30
31
32
33
34
35
36
37
38
39
4041
42
43
44
Increasing adverse effects
Inc
rea
sin
g b
en
efi
cia
l eff
ec
ts
Vegetables
Nutrigenomics
NEW ZEALAND
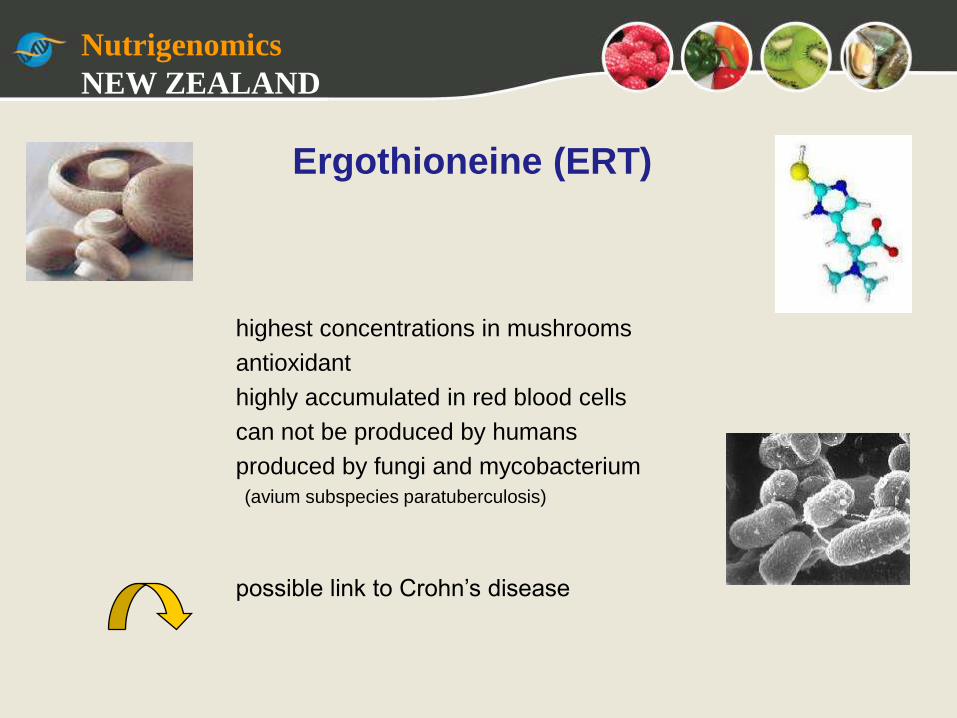
Ergothioneine (ERT)
highest concentrations in mushrooms
antioxidant
highly accumulated in red blood cells
can not be produced by humans
produced by fungi and mycobacterium
(avium subspecies paratuberculosis)
possible link to Crohn’s disease

Nutrigenomics
NEW ZEALAND
OCTN 1 transports ergothioneine
Grundemann et al. (2005)
OCTN1h
OCTN1
Organic cation transporter SLC22A5

Nutrigenomics
NEW ZEALAND
OCTN1 503F has 50% greater
initial ergothioneine (10mM)
transport capacity
Accumulation of ergothioneine in
503F carriers
Possible risk factor for CD
OCTN1- Gain of Function Variant
Taubert et al. (2005)
OCTN1 WT
OCTN1 503F

Nutrigenomics
NEW ZEALAND
Our study: Leu503Phe (rs1050152) C/T
p=0.9 UC+CD, p=0.56 CD p=0.39 UC
814 patients 409 controls
OCTN1 and CD in New Zealand
No paper to Nature
with these p-values

Nutrigenomics
NEW ZEALAND
12
3
456
7
89
10
1112
13
14
1516
17
1819
2021
22
2324
2526
2728
29
30
31
32
33
34
35
36
37
38
39
4041
42
43
44
Increasing adverse effects
Inc
rea
sin
g b
en
efi
cia
l eff
ec
ts
Vegetables
Analysis:
adverse effect
beneficial effect
Match with OCTN1 genotype

Nutrigenomics
NEW ZEALAND
0%
10%
20%
30%
40%
50%
60%
70%
80%
90%
100%
0 DefWorse 1 ProbWorse 2 NoDiff 3 ProbBetter 4 DefBetter
T/T - mutant
C/T - heterozygous
C/C - wildtype
OCTN1 – mushroom analysis
p=0.01
Accumulation of ergothioneine in 503F carriers may be a risk factor for CD

Nutrigenomics
NEW ZEALAND
First gene – diet association in our study!
OCTN1 itself doesn’t seem to be a consistent
causative genetic marker for CD
When food comes into play the genotype
becomes significantly important

Nutrigenomics
NEW ZEALAND
Acknowledgements

Nutrigenomics
NEW ZEALAND


![ppt CV strut&uso [modalità compatibilità] · 2014-09-03 · 2 slide 1 slide Premessa 1 slide Struttura Presentazione generale Nella progettazione didattica 3 slide 4 slide 4 slide](https://img.pdfslide.net/doc/110x75/5ec2cecb5f432f006d0f52ea/ppt-cv-strutuso-modalit-compatibilit-2014-09-03-2-slide-1-slide-premessa.jpg)


![[Slide 1 – Introductory Slide] [Slide 2] · 2020-01-16 · ICN Training on Demand Module VIII-3: Competition Policy in Developing Countries 1 [Slide 1 – Introductory Slide] [Slide](https://img.pdfslide.net/doc/110x75/5ea56dca775f6149921ddc00/slide-1-a-introductory-slide-slide-2-2020-01-16-icn-training-on-demand-module.jpg)