Embed Size (px)
Citation preview
dominique <dot> toupin <at> ericsson <dot> com PATRICK <dot> tasse <at> ericsson <dot> com
© Ericsson AB 2013 | 2013-03-27 | Page 2 (49)
› Safety critical, High throughput/Low latency, High availability, Real time systems
› Usually NO system admin› Problems can be hard/impossible to reproduce in the lab› Trace is the only approach to get enough data to pinpoint
the problem and fix it
› For enterprise systems with system admin, it eliminates lengthy debug cycles!
Why tracing?ComplexComplex diagnostic!
© Ericsson AB 2013 | 2013-03-27 | Page 3 (49)
© Ericsson AB 2013 | 2013-03-27 | Page 4 (49)
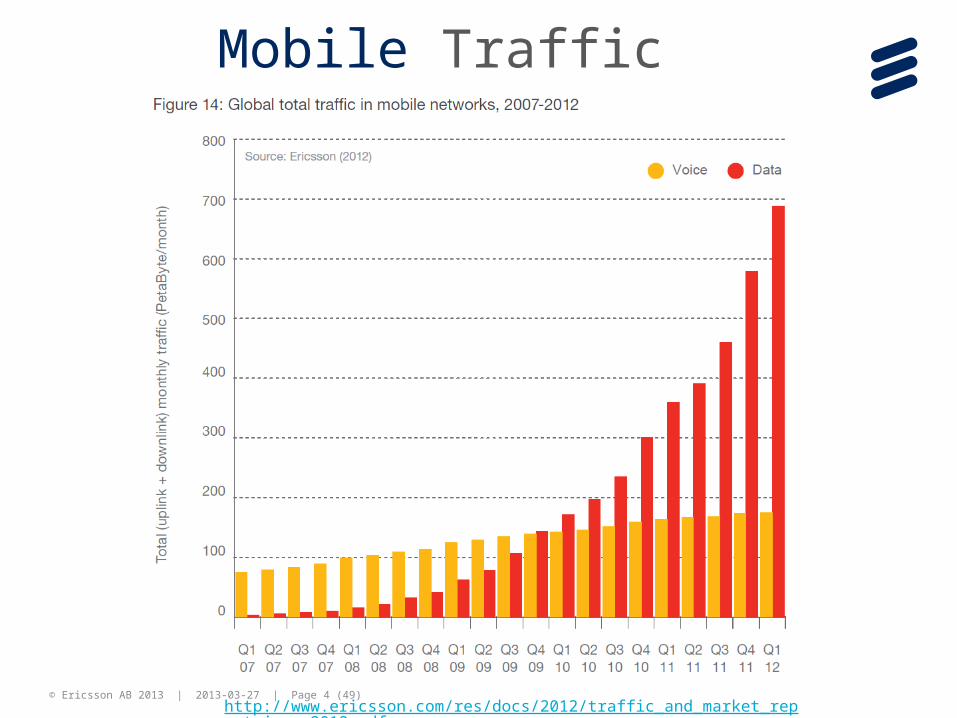
Mobile Traffic
http://www.ericsson.com/res/docs/2012/traffic_and_market_report_june_2012.pdf
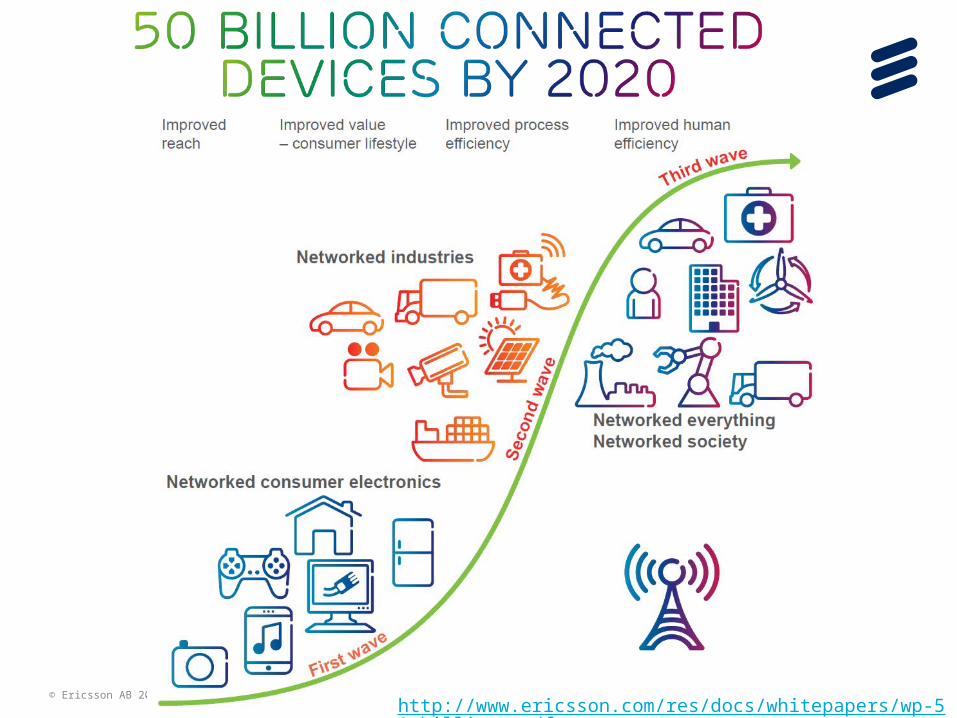
© Ericsson AB 2013 | 2013-03-27 | Page 5 (49)http://www.ericsson.com/res/docs/whitepapers/wp-50-billions.pdf
© Ericsson AB 2013 | 2013-03-27 | Page 6 (49)
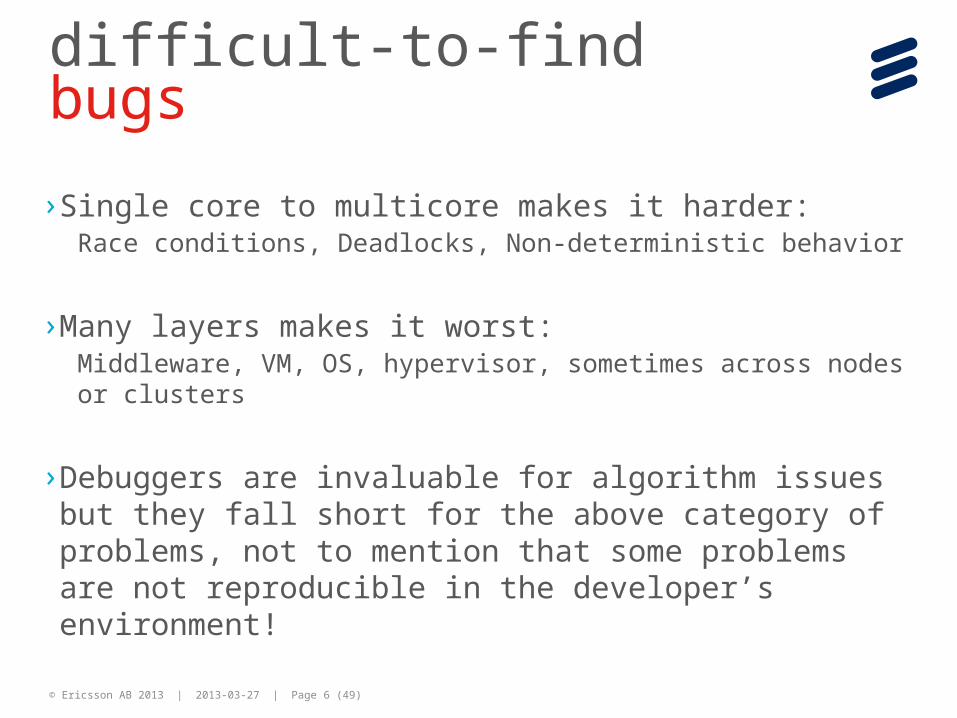
› Single core to multicore makes it harder:Race conditions, Deadlocks, Non-deterministic behavior
› Many layers makes it worst:Middleware, VM, OS, hypervisor, sometimes across nodes or clusters
› Debuggers are invaluable for algorithm issues but they fall short for the above category of problems, not to mention that some problems are not reproducible in the developer’s environment!
difficult-to-find bugs
© Ericsson AB 2013 | 2013-03-27 | Page 7 (49)
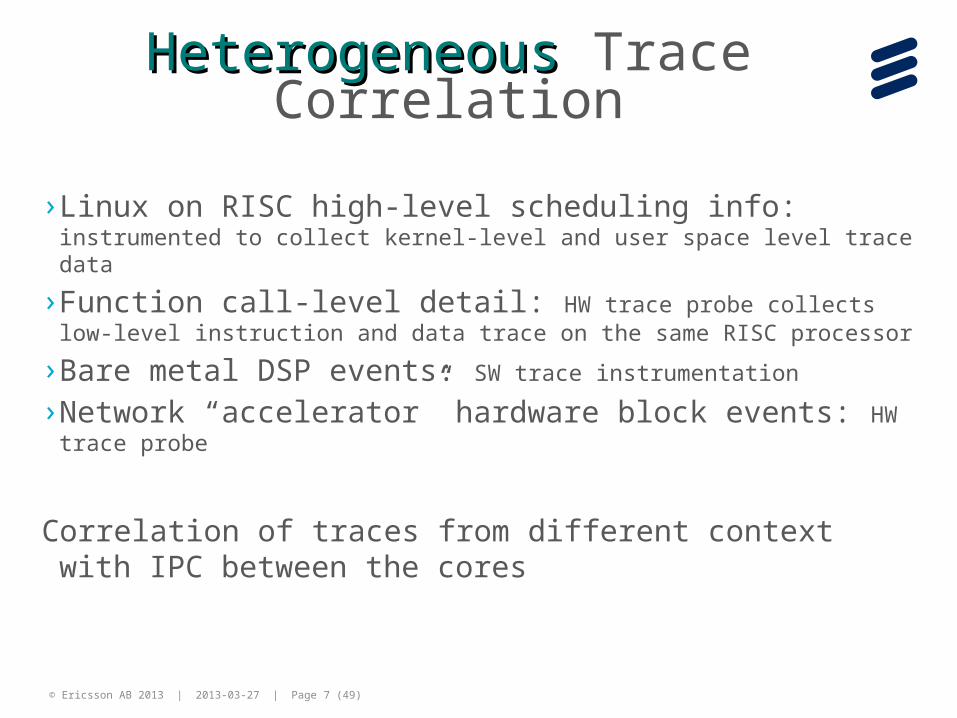
HeterogeneousHeterogeneous Trace Correlation
› Linux on RISC high-level scheduling info: instrumented to collect kernel-level and user space level trace data
› Function call-level detail: HW trace probe collects low-level instruction and data trace on the same RISC processor
› Bare metal DSP events: SW trace instrumentation
› Network “accelerator” hardware block events: HW trace probe
Correlation of traces from different context with IPC between the cores
© Ericsson AB 2013 | 2013-03-27 | Page 8 (49)
Ericsson SW Research Day, November 2011
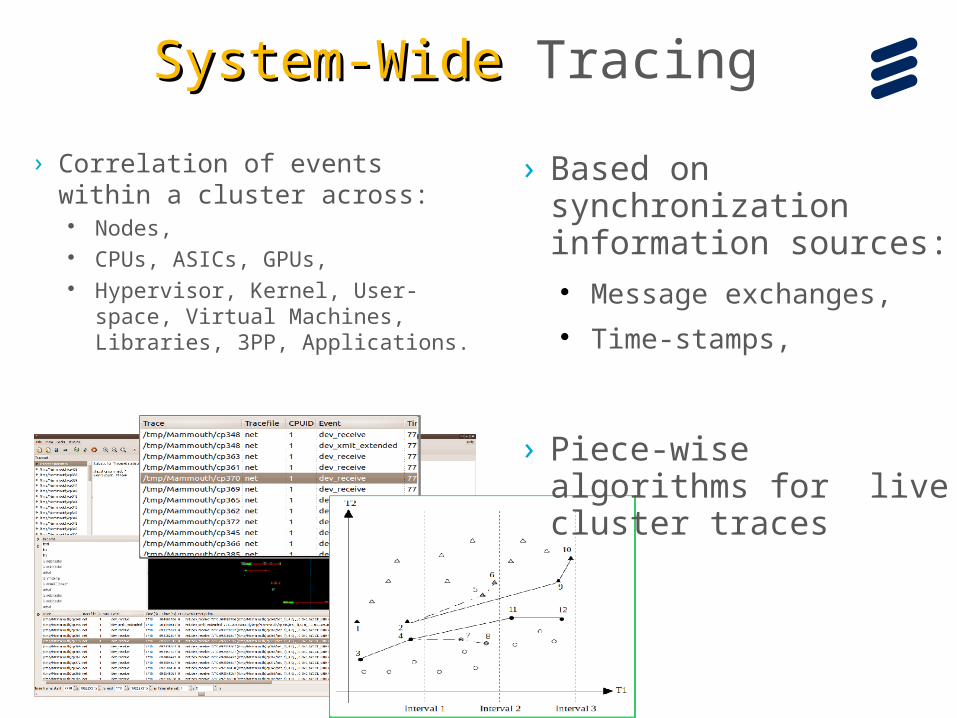
System-WideSystem-Wide Tracing
› Correlation of events within a cluster across:
Nodes, CPUs, ASICs, GPUs, Hypervisor, Kernel, User-space,
Virtual Machines, Libraries, 3PP, Applications.
› Based on synchronization information sources:
Message exchanges, Time-stamps,
› Piece-wise algorithms for live cluster traces
© Ericsson AB 2013 | 2013-03-27 | Page 9 (49)
Tracing Usefulness
› Trace is usually the only approach for diagnostic of complex problems
› Tracing instead of logging to minimize impact on system behaviour
› Performance tuning
› Monitoring of live systems
Extreme cases and simple one: Linux Kernel, ust database
© Ericsson AB 2013 | 2013-03-27 | Page 10 (49)
Tracing Concept
Static Tracepoint– Inserted before compile-time, enabled/disabled at run-time– Low overhead, large amount of data– Development with diagnostic in mind, represent the wisdom of developers
who are most familiar with the code– Think before you act approach – Rest of the world can use them to extract a great deal of useful information
without having to know the code
Dynamic Tracepoint– Inserted at run-time, enabled/disabled at run-time– Large overhead, small amount of data– Use it when a static tracepoint is missing– If used a lot over a long period of time, think about converting them to static– Trial and error / ad hoc approach
© Ericsson AB 2013 | 2013-03-27 | Page 11 (49)
› Log Levels
Assigned to static tracepoints, with a verbosity level: 0 less verbose to 14, most verbose
› Wildcards
Enable all events under certain hierarchy level: * for all events, libc_* for all events within libc, etc.
The combination of wildcards and loglevels allow users to gradually enable more specific instrumentation, and increase the verbosity level, as they narrow-down the source of their problem.
› FilteringFiltering on specific event fields allow use-cases such as following a call-id
A Trace use case
© Ericsson AB 2013 | 2013-03-27 | Page 12 (49)
Common Trace Format In collaboration with
Multi-Core Association Tool Infrastructure Workgroup
Freescale, Mentor Graphics, IBM, IMEC, National Instruments, Nokia Siemens Networks, Samsung, Texas Instruments, Tilera, Wind River, University of Houston, Polytechnique Montréal, University of Utah, …
Ericsson and Linux Foundation CE Linux Workgroup
Reviewed by Linux kernel developers
Requirement, specification, reference implementation http://www.efficios.com/ctf
© Ericsson AB 2013 | 2013-03-27 | Page 13 (49)
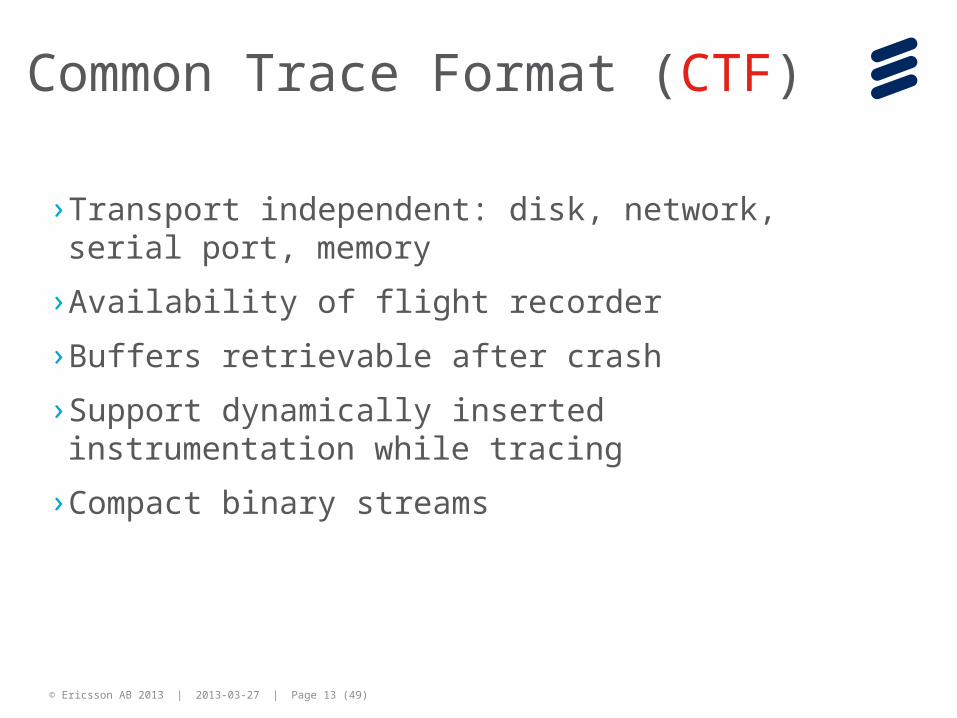
› Transport independent: disk, network, serial port, memory
› Availability of flight recorder
› Buffers retrievable after crash
› Support dynamically inserted instrumentation while tracing
› Compact binary streams
Common Trace Format (CTF)
© Ericsson AB 2013 | 2013-03-27 | Page 14 (49)
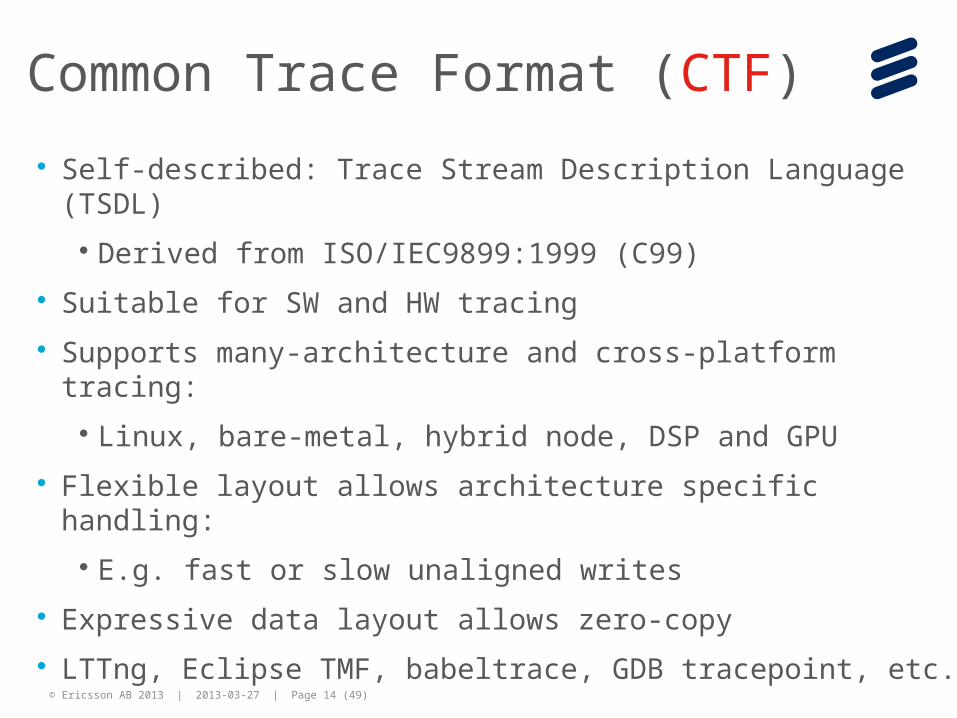
Common Trace Format (CTF)
Self-described: Trace Stream Description Language (TSDL)
Derived from ISO/IEC9899:1999 (C99)
Suitable for SW and HW tracing
Supports many-architecture and cross-platform tracing:
Linux, bare-metal, hybrid node, DSP and GPU
Flexible layout allows architecture specific handling:
E.g. fast or slow unaligned writes
Expressive data layout allows zero-copy
LTTng, Eclipse TMF, babeltrace, GDB tracepoint, etc.
© Ericsson AB 2013 | 2013-03-27 | Page 15 (49)
© Ericsson AB 2013 | 2013-03-27 | Page 16 (49)
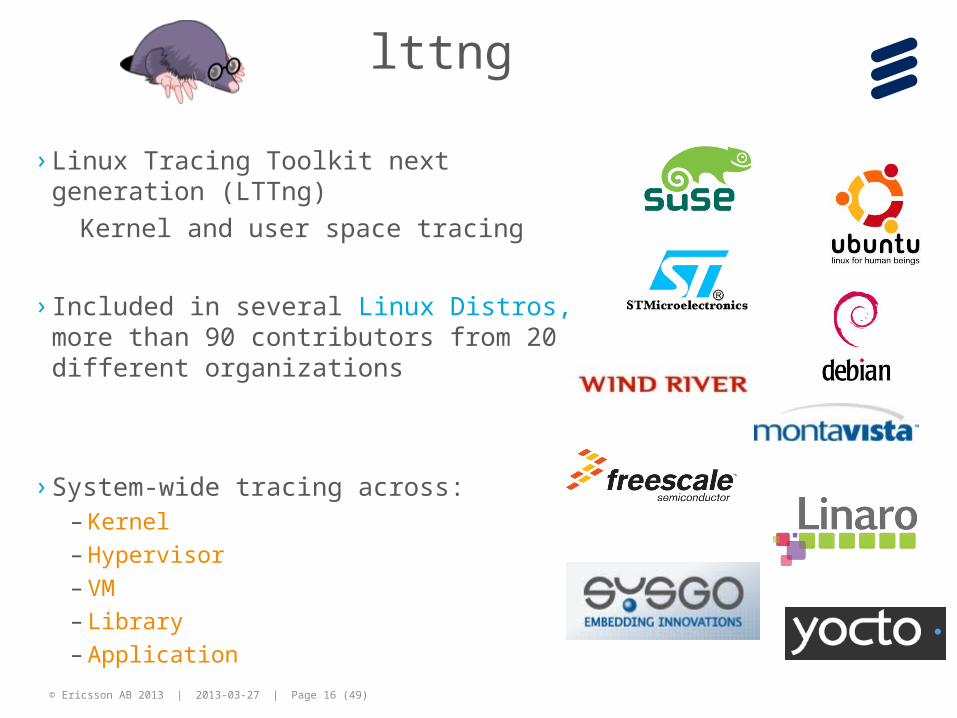
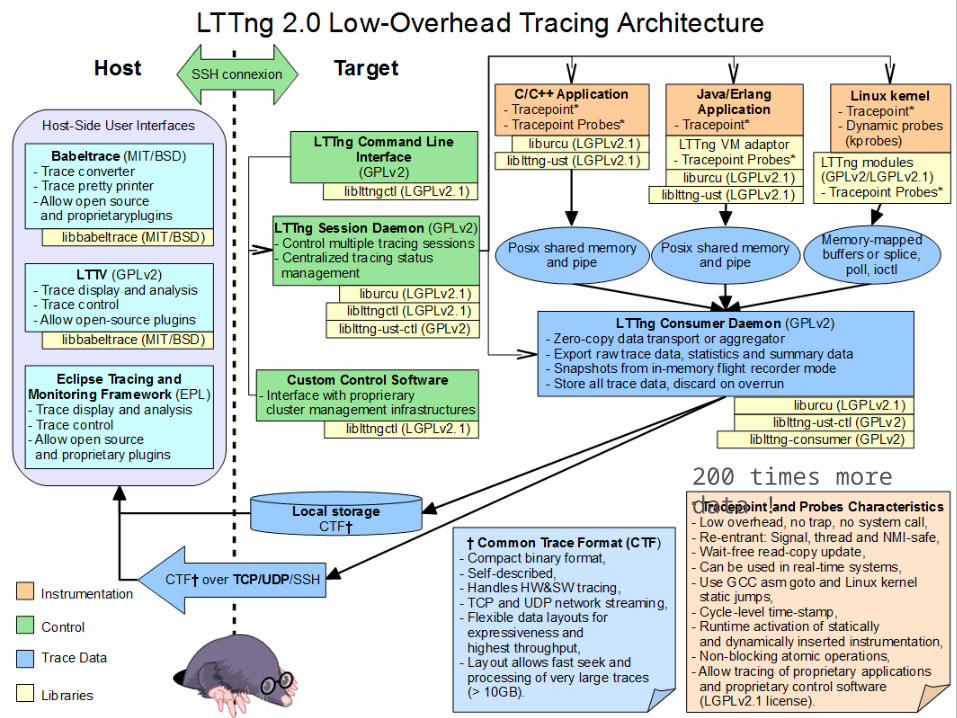
lttng
› Linux Tracing Toolkit next generation (LTTng)
Kernel and user space tracing
› Included in several Linux Distros, more than 90 contributors from 20 different organizations
› System-wide tracing across:– Kernel– Hypervisor– VM– Library– Application
© Ericsson AB 2013 | 2013-03-27 | Page 17 (49)
200 times more data !
© Ericsson AB 2013 | 2013-03-27 | Page 18 (49)
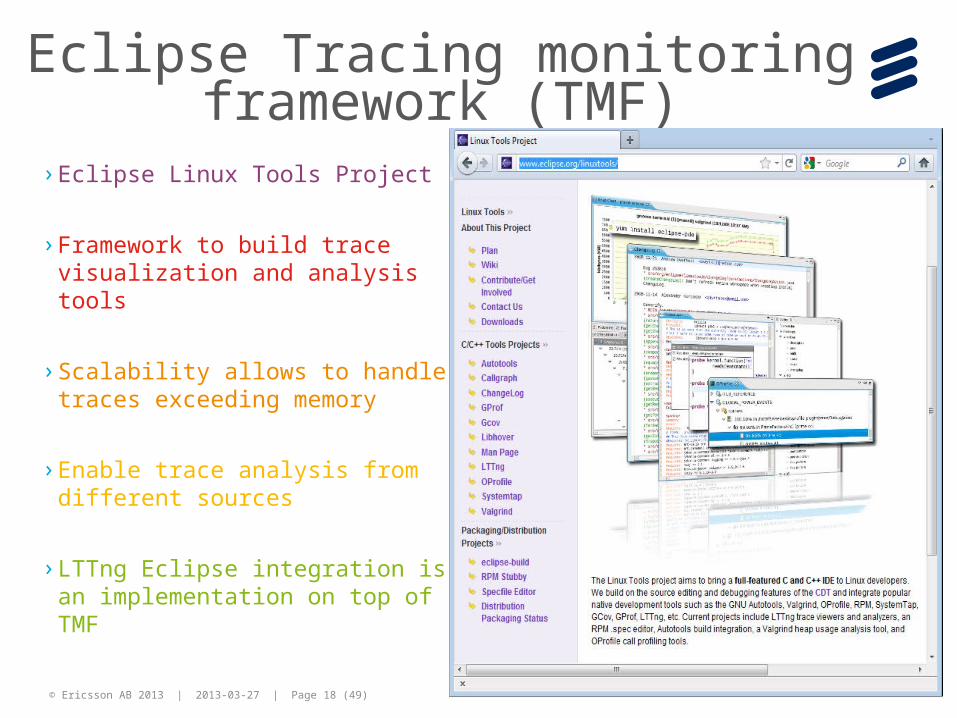
Eclipse Tracing monitoring framework (TMF)
› Eclipse Linux Tools Project
› Framework to build trace visualization and analysis tools
› Scalability allows to handle traces exceeding memory
› Enable trace analysis from different sources
› LTTng Eclipse integration is an implementation on top of TMF
© Ericsson AB 2013 | 2013-03-27 | Page 19 (49)
© Ericsson AB 2013 | 2013-03-27 | Page 20 (49)
What TMF provides(for plug-in developer)› A trace and event data model› Event request handling with coalescing› Extension point to add new trace types› Reusable views and widgets› Integration into common navigator framework
(e.g. project explorer)› An event filter model› Signal broadcasting between components› Time window and event synchronization› Generic state system› Sequence diagram framework› Common Trace Format (CTF) java parser
© Ericsson AB 2013 | 2013-03-27 | Page 21 (49)
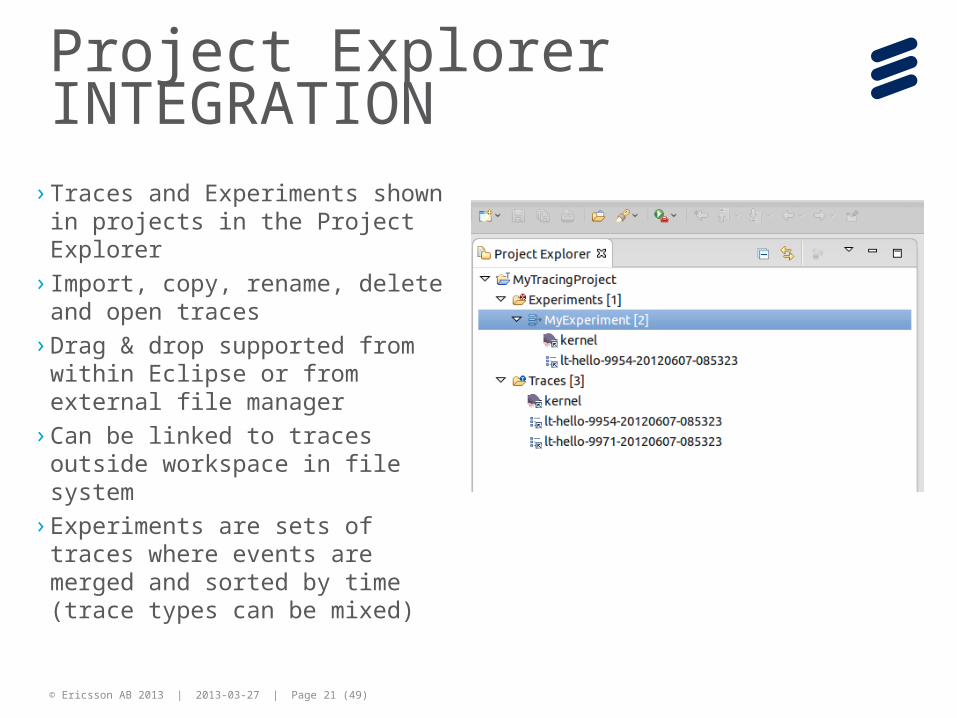
Project Explorer INTEGRATION
› Traces and Experiments shown in projects in the Project Explorer
› Import, copy, rename, delete and open traces
› Drag & drop supported from within Eclipse or from external file manager
› Can be linked to traces outside workspace in file system
› Experiments are sets of traces where events are merged and sorted by time (trace types can be mixed)
© Ericsson AB 2013 | 2013-03-27 | Page 22 (49)
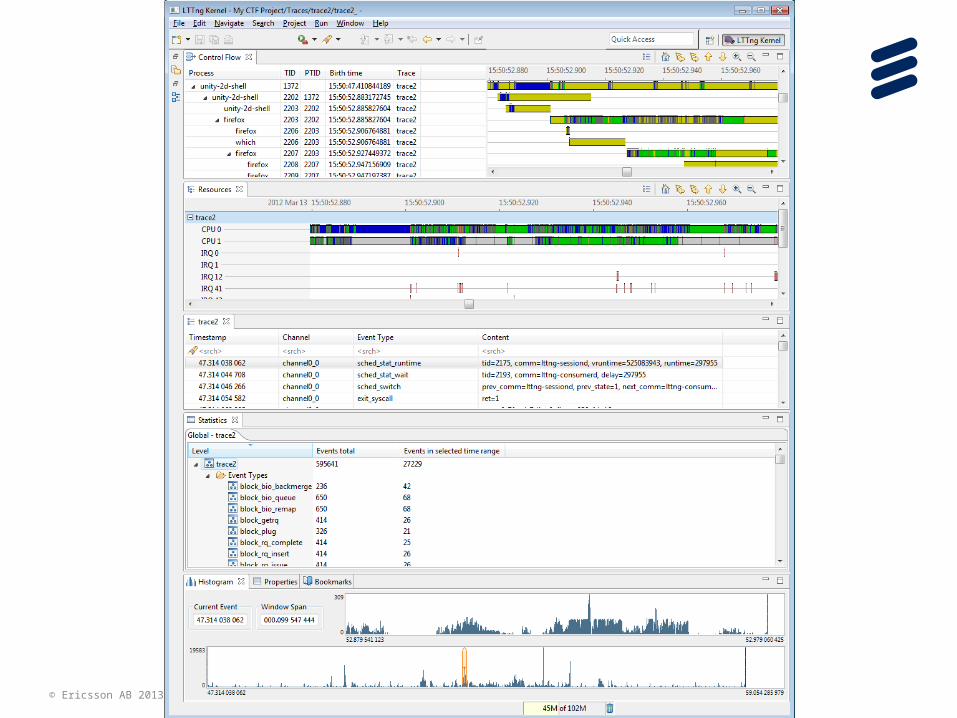
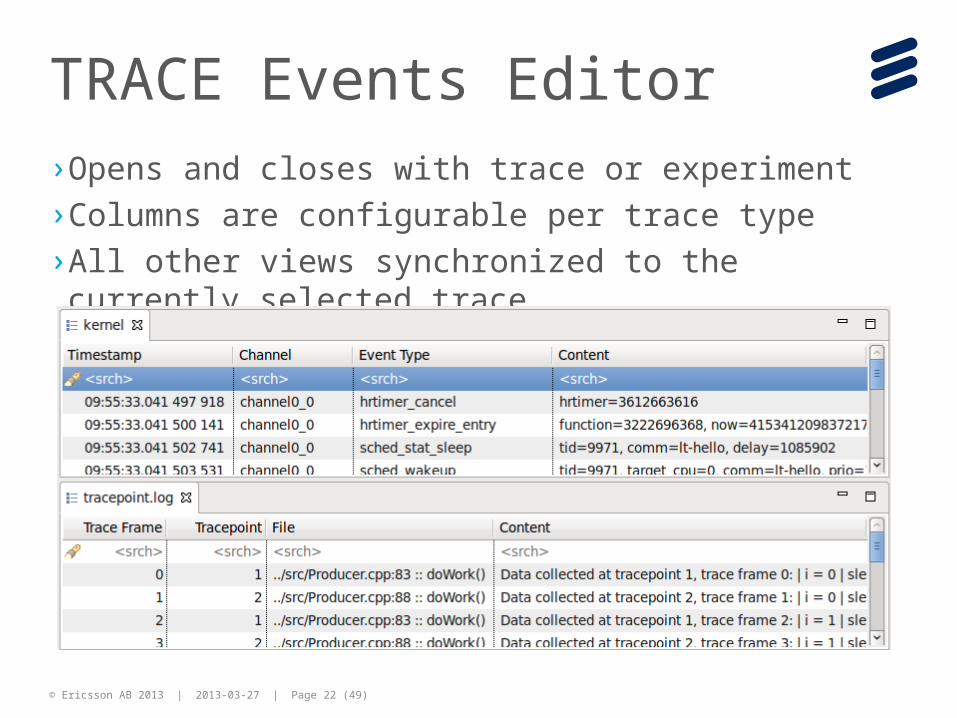
TRACE Events Editor› Opens and closes with trace or experiment› Columns are configurable per trace type› All other views synchronized to the currently selected trace
© Ericsson AB 2013 | 2013-03-27 | Page 23 (49)
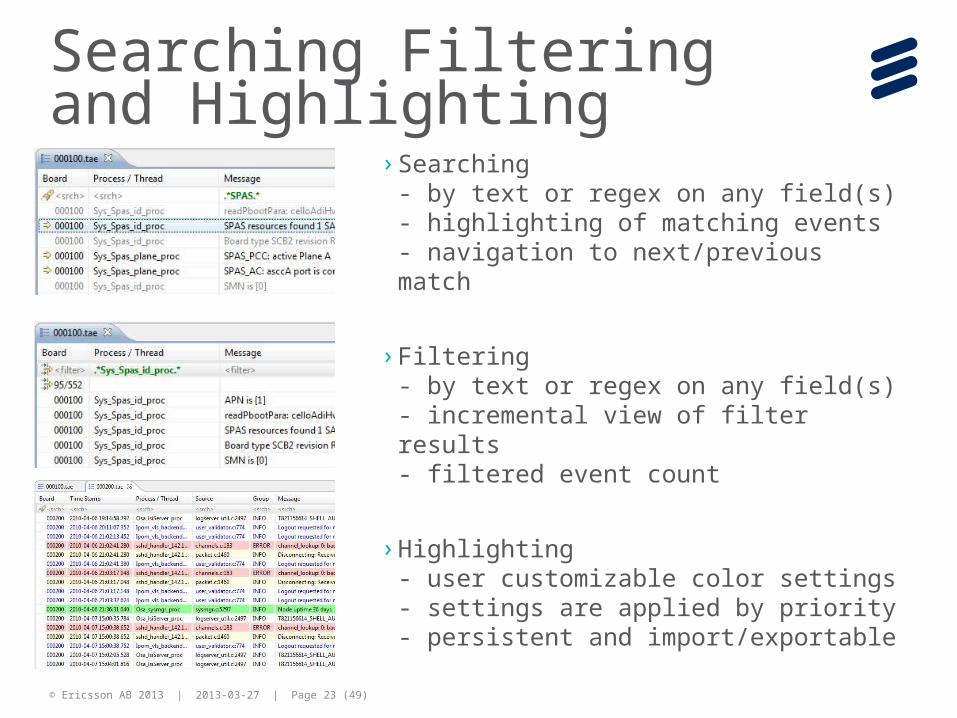
Searching Filtering and Highlighting
› Searching- by text or regex on any field(s)- highlighting of matching events- navigation to next/previous match
› Filtering- by text or regex on any field(s)- incremental view of filter results- filtered event count
› Highlighting- user customizable color settings- settings are applied by priority- persistent and import/exportable
© Ericsson AB 2013 | 2013-03-27 | Page 24 (49)
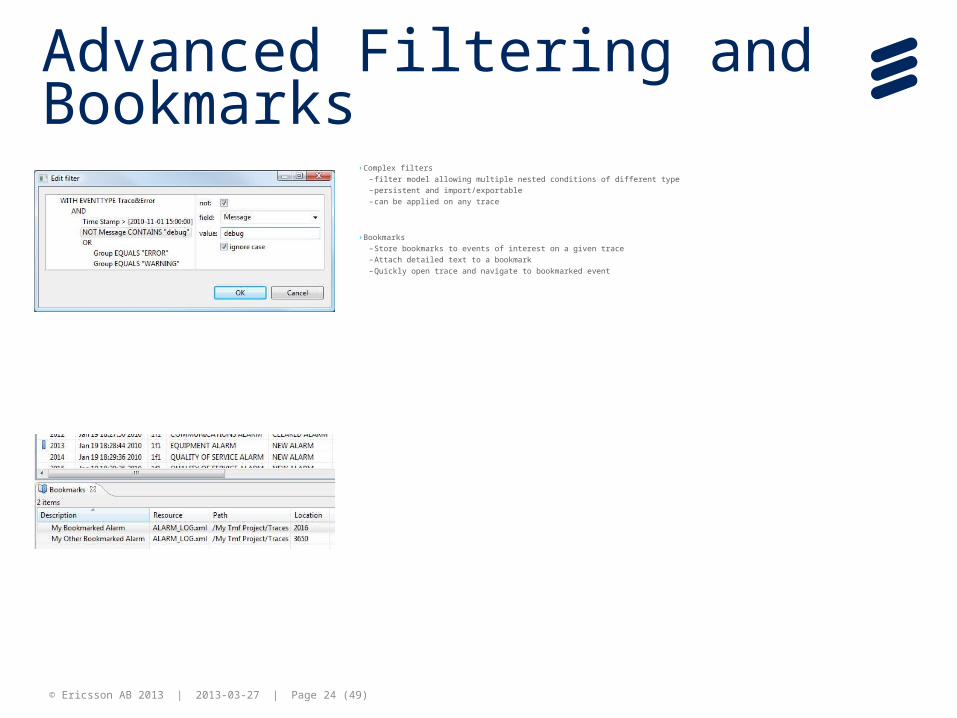
› Complex filters– filter model allowing multiple nested conditions of different type– persistent and import/exportable– can be applied on any trace
› Bookmarks– Store bookmarks to events of interest on a given trace– Attach detailed text to a bookmark– Quickly open trace and navigate to bookmarked event
Advanced Filtering and Bookmarks
© Ericsson AB 2013 | 2013-03-27 | Page 25 (49)
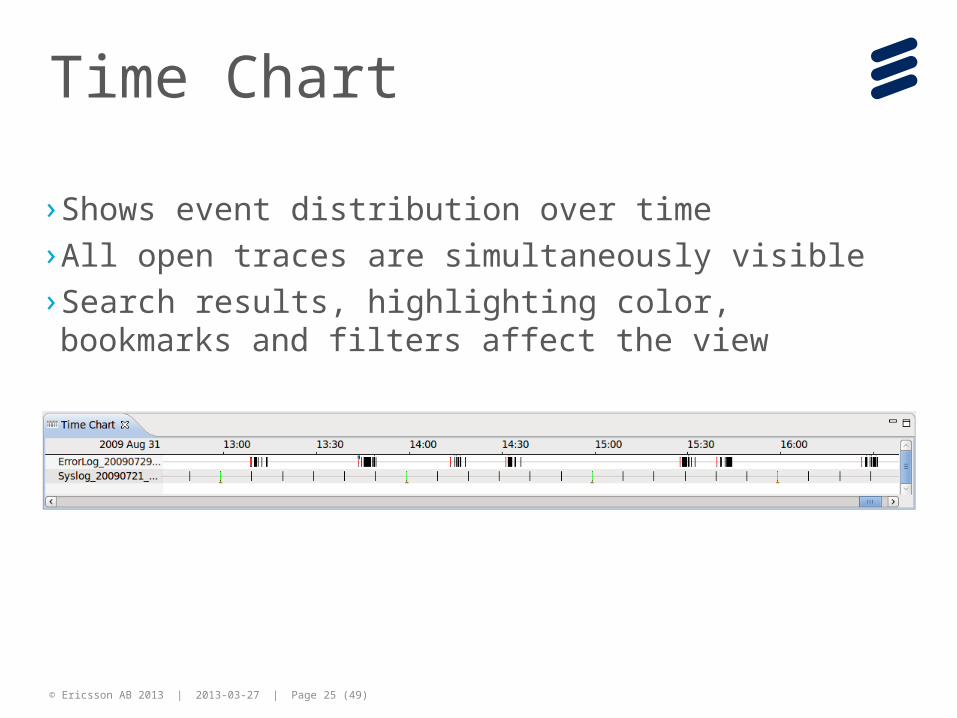
Time Chart
› Shows event distribution over time› All open traces are simultaneously visible› Search results, highlighting color, bookmarks and filters
affect the view
© Ericsson AB 2013 | 2013-03-27 | Page 26 (49)
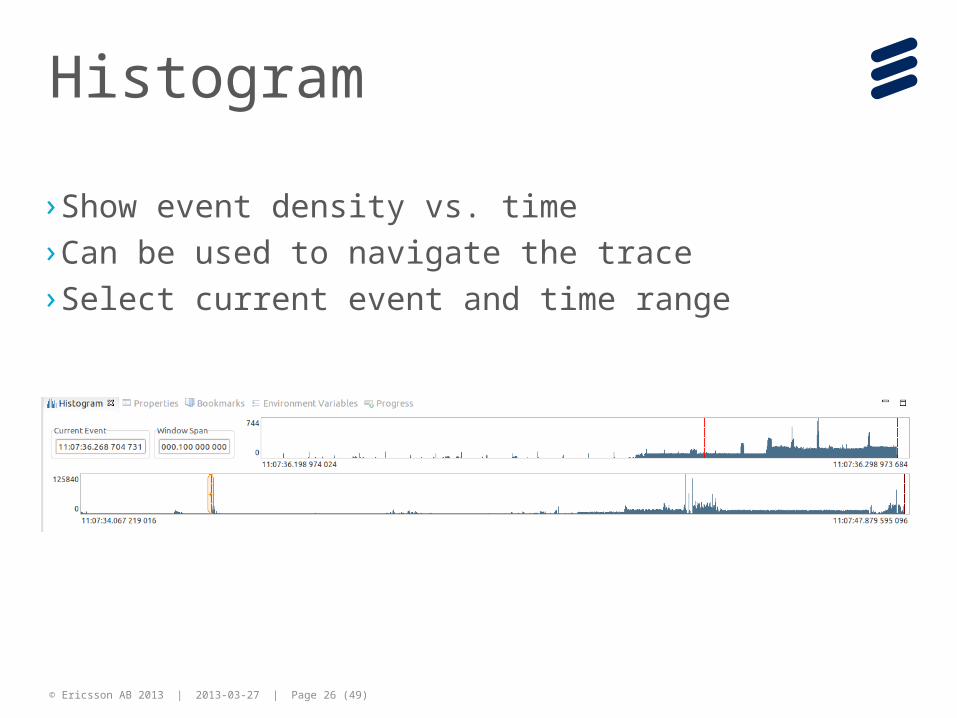
Histogram
› Show event density vs. time› Can be used to navigate the trace› Select current event and time range
© Ericsson AB 2013 | 2013-03-27 | Page 27 (49)
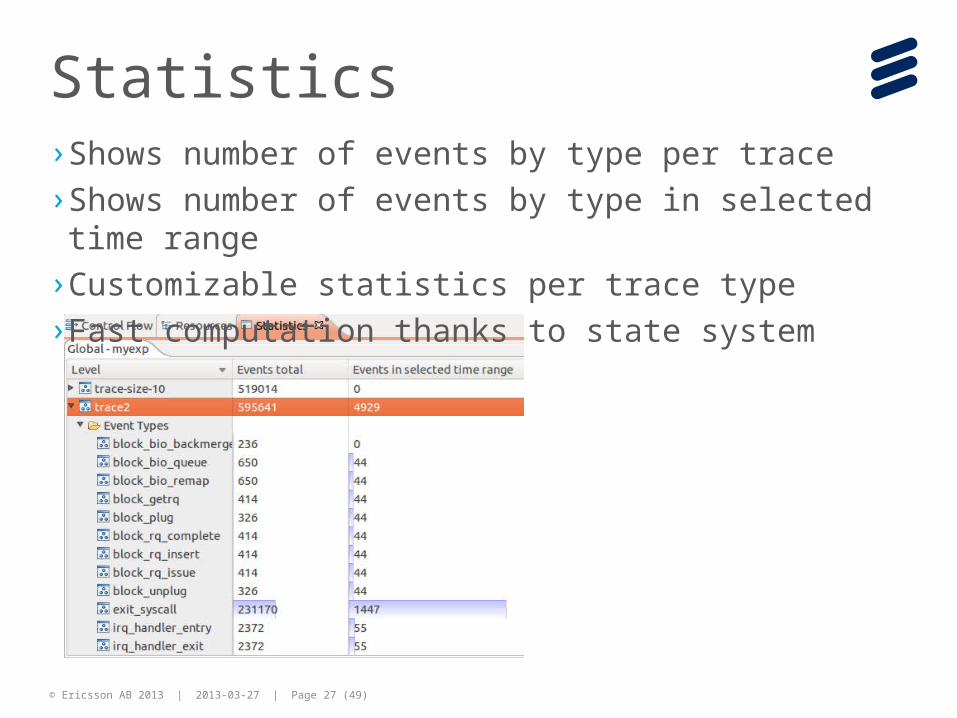
Statistics› Shows number of events by type per trace› Shows number of events by type in selected time range› Customizable statistics per trace type› Fast computation thanks to state system
© Ericsson AB 2013 | 2013-03-27 | Page 28 (49)
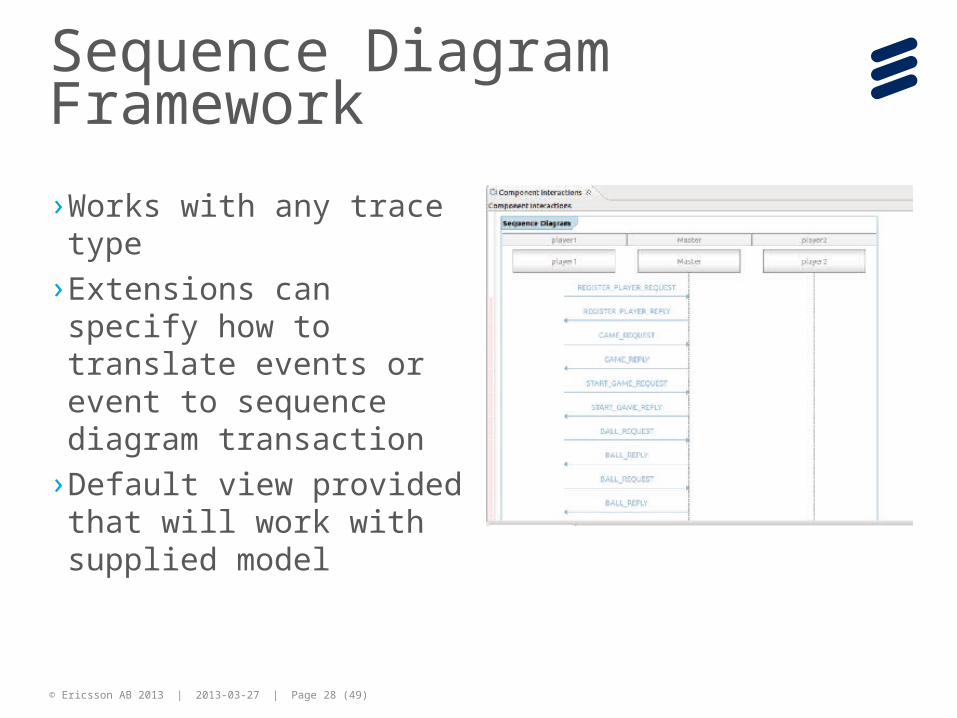
Sequence Diagram Framework
› Works with any trace type› Extensions can specify how
to translate events or event to sequence diagram transaction
› Default view provided that will work with supplied model
© Ericsson AB 2013 | 2013-03-27 | Page 29 (49)
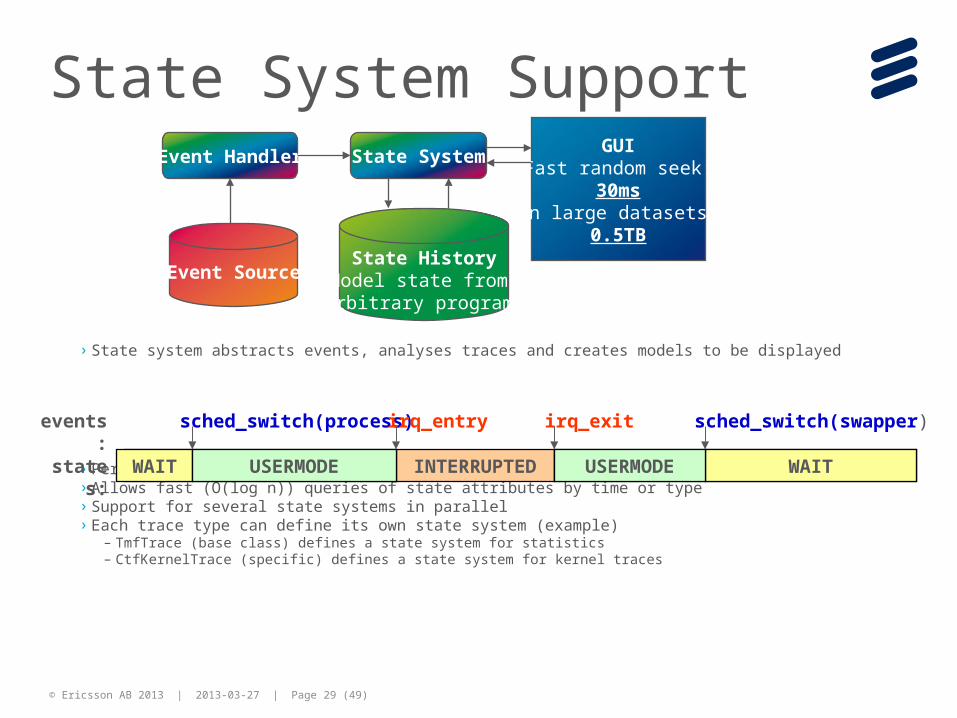
State System Support
› State system abstracts events, analyses traces and creates models to be displayed
› Persistent on disk, does not need to be rebuilt between runs› Allows fast (O(log n)) queries of state attributes by time or type› Support for several state systems in parallel› Each trace type can define its own state system (example)
– TmfTrace (base class) defines a state system for statistics– CtfKernelTrace (specific) defines a state system for kernel traces
State HistoryModel state from arbitrary programs
Event Handler State System
Event Source
GUIFast random seek:
30msIn large datasets:
0.5TB
IDLE USERMODE INTERRUPTED USERMODE IDLE
sched_switch(process)irq_entry irq_exit sched_switch(swapper)
states: WAIT WAITUSERMODE USERMODE
events:
© Ericsson AB 2013 | 2013-03-27 | Page 30 (49)
Trace extensions:LTTNG kernel analysis
› Reference implementation of a TMF plug-in extension› Control, visualization and analysis of Linux kernel traces in
CTF format collected with the lttng tracer
© Ericsson AB 2013 | 2013-03-27 | Page 31 (49)
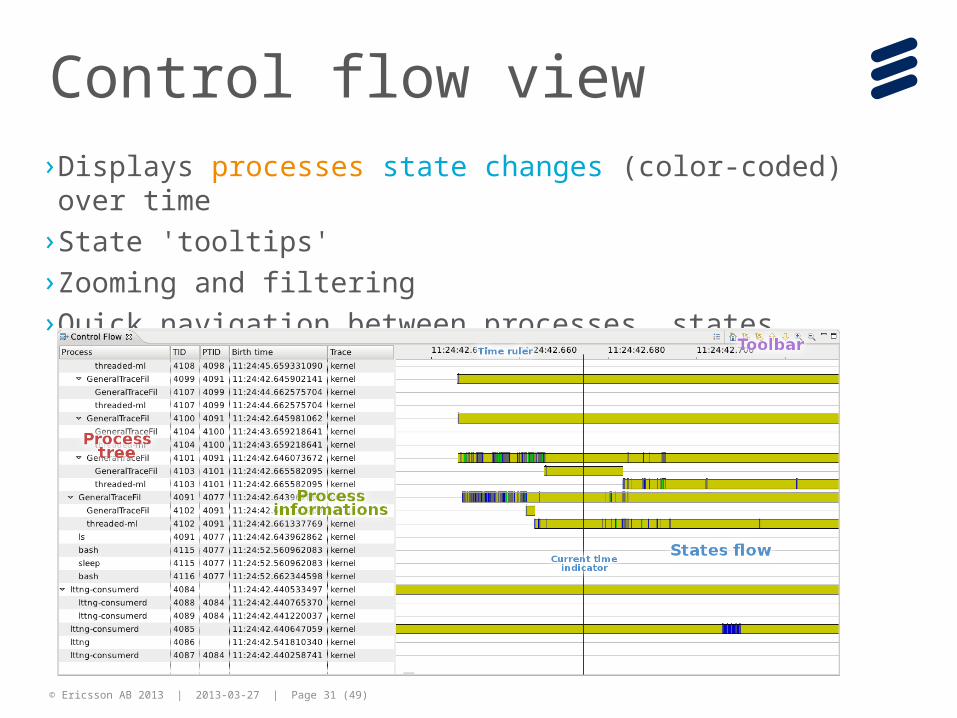
Control flow view› Displays processes state changes (color-coded) over time› State 'tooltips'› Zooming and filtering› Quick navigation between processes, states
© Ericsson AB 2013 | 2013-03-27 | Page 32 (49)
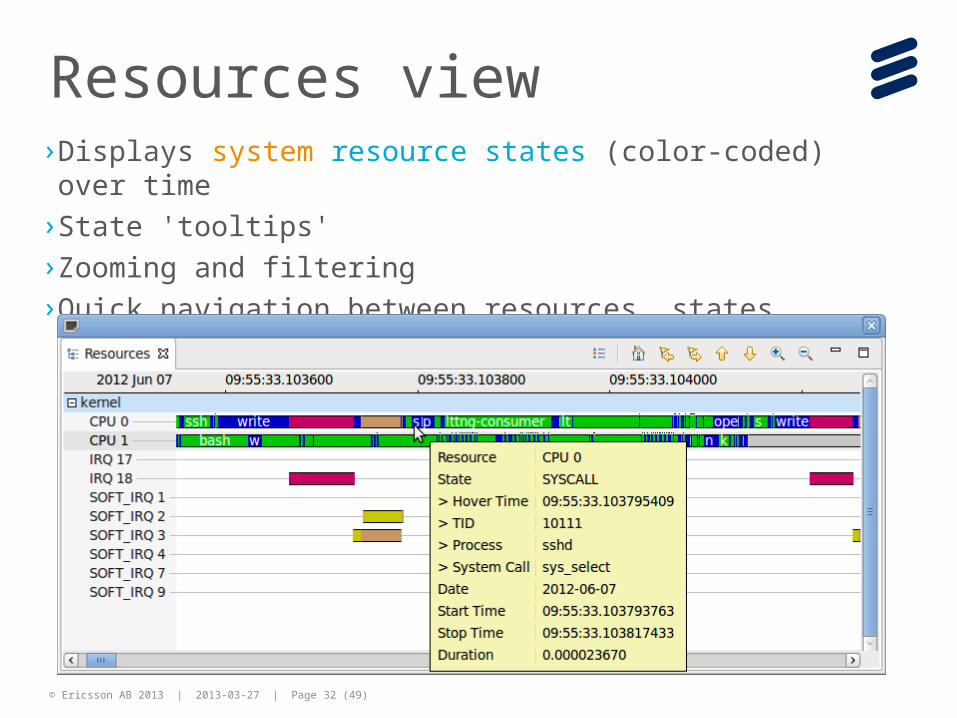
Resources view› Displays system resource states (color-coded) over time› State 'tooltips'› Zooming and filtering› Quick navigation between resources, states
© Ericsson AB 2013 | 2013-03-27 | Page 33 (49)
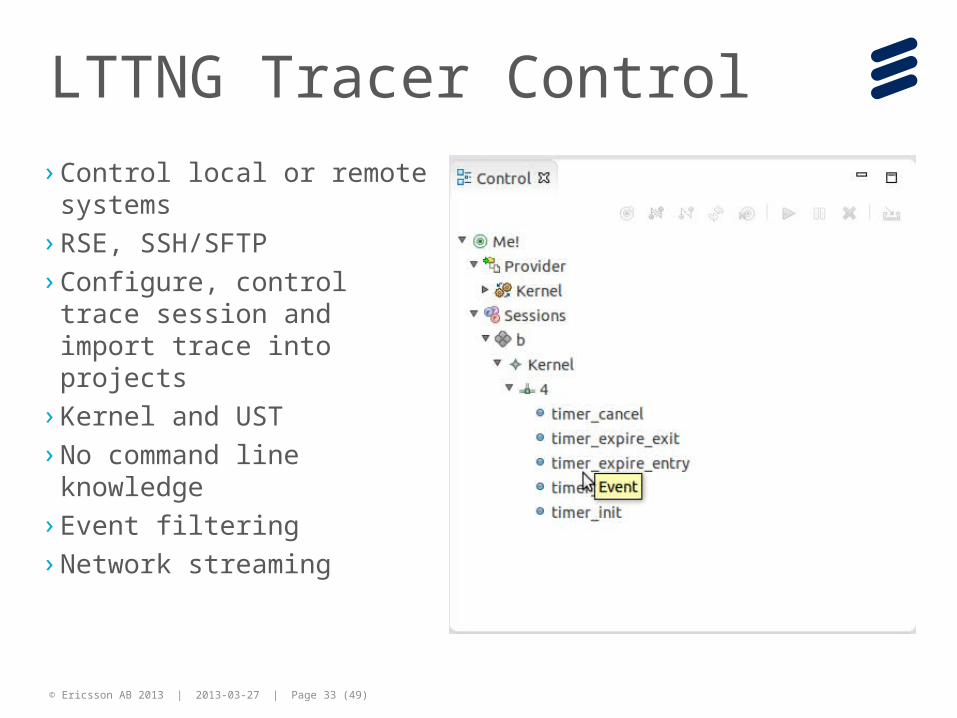
LTTNG Tracer Control› Control local or remote systems› RSE, SSH/SFTP› Configure, control trace session
and import trace into projects› Kernel and UST› No command line knowledge› Event filtering› Network streaming
© Ericsson AB 2013 | 2013-03-27 | Page 34 (49)
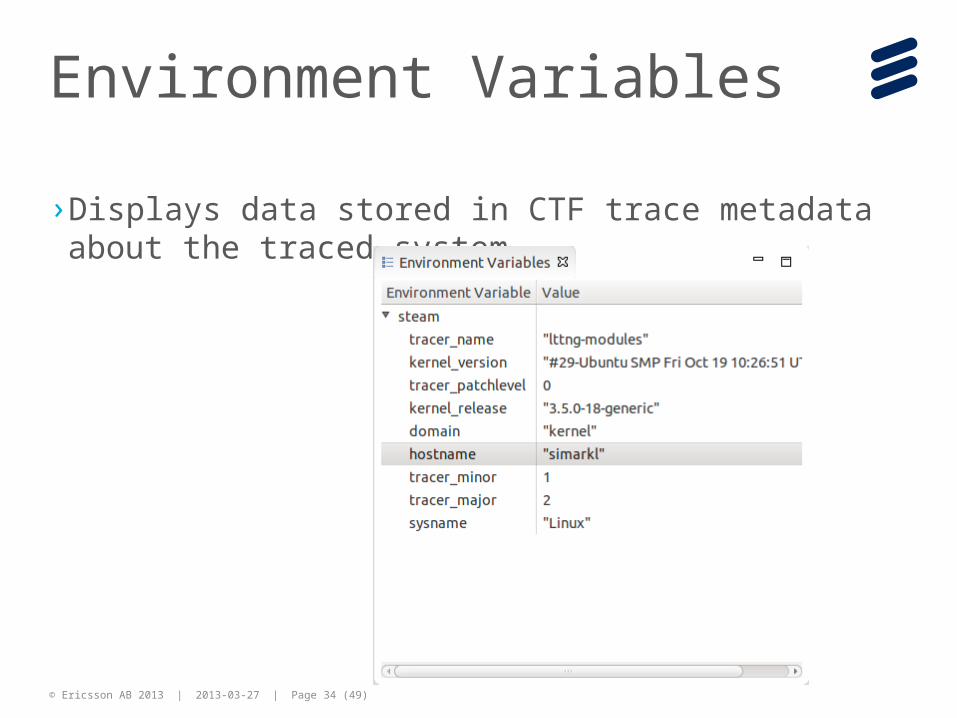
Environment Variables
› Displays data stored in CTF trace metadata about the traced system
© Ericsson AB 2013 | 2013-03-27 | Page 35 (49)
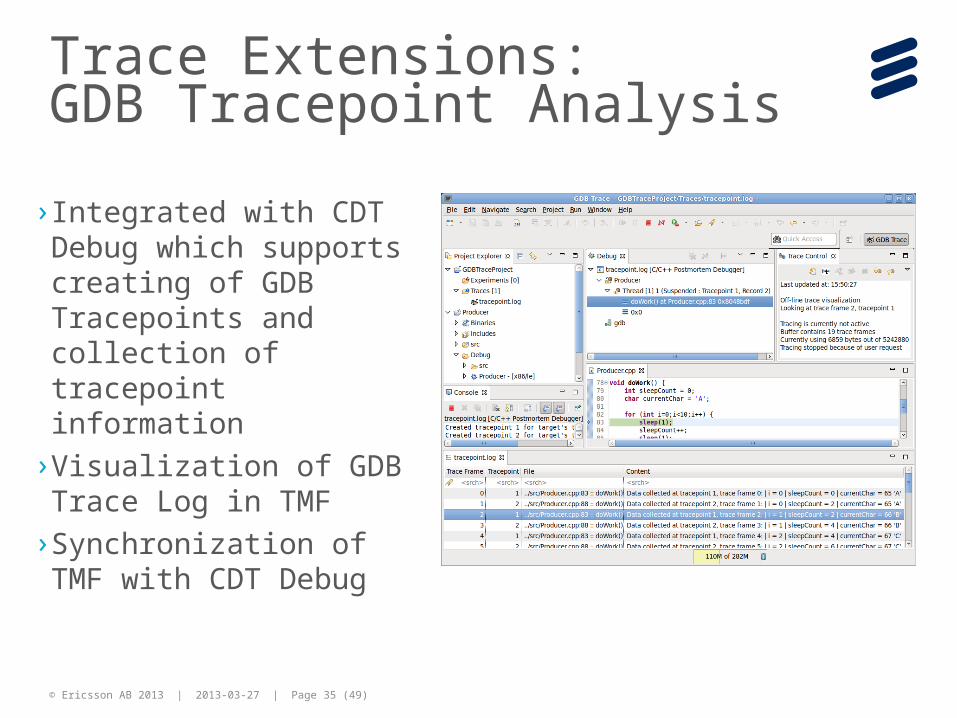
Trace Extensions:GDB Tracepoint Analysis
› Integrated with CDT Debug which supports creating of GDB Tracepoints and collection of tracepoint information
› Visualization of GDB Trace Log in TMF
› Synchronization of TMF with CDT Debug
© Ericsson AB 2013 | 2013-03-27 | Page 36 (49)
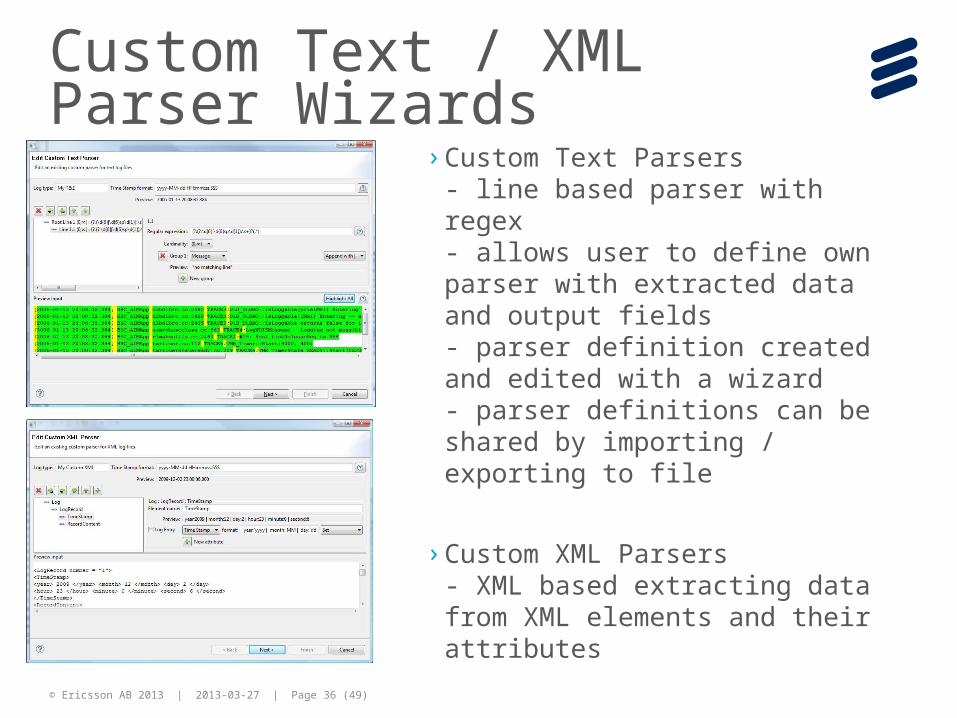
Custom Text / XML Parser Wizards
› Custom Text Parsers- line based parser with regex- allows user to define own parser with extracted data and output fields- parser definition created and edited with a wizard- parser definitions can be shared by importing / exporting to file
› Custom XML Parsers- XML based extracting data from XML elements and their attributes
© Ericsson AB 2013 | 2013-03-27 | Page 37 (49)
what’s new in Kepler› Trace “editors”, a.k.a. multi-tabbed view, multiple opened
– Time synchronization between traces for comparison purposes
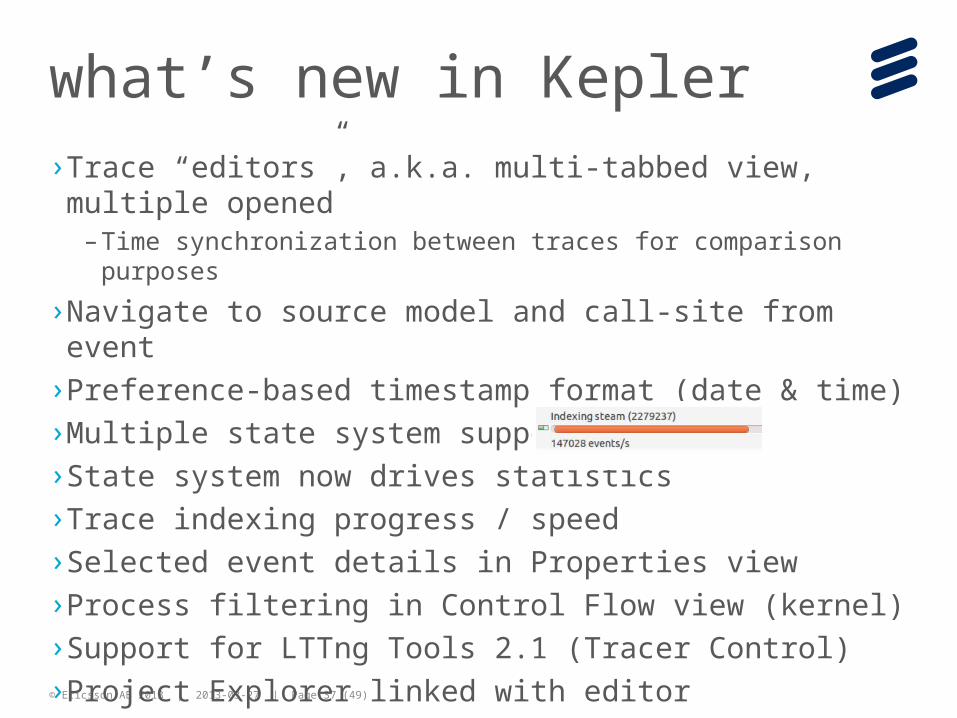
› Navigate to source model and call-site from event› Preference-based timestamp format (date & time)› Multiple state system support› State system now drives statistics› Trace indexing progress / speed› Selected event details in Properties view› Process filtering in Control Flow view (kernel)› Support for LTTng Tools 2.1 (Tracer Control)› Project Explorer linked with editor
© Ericsson AB 2013 | 2013-03-27 | Page 38 (49)
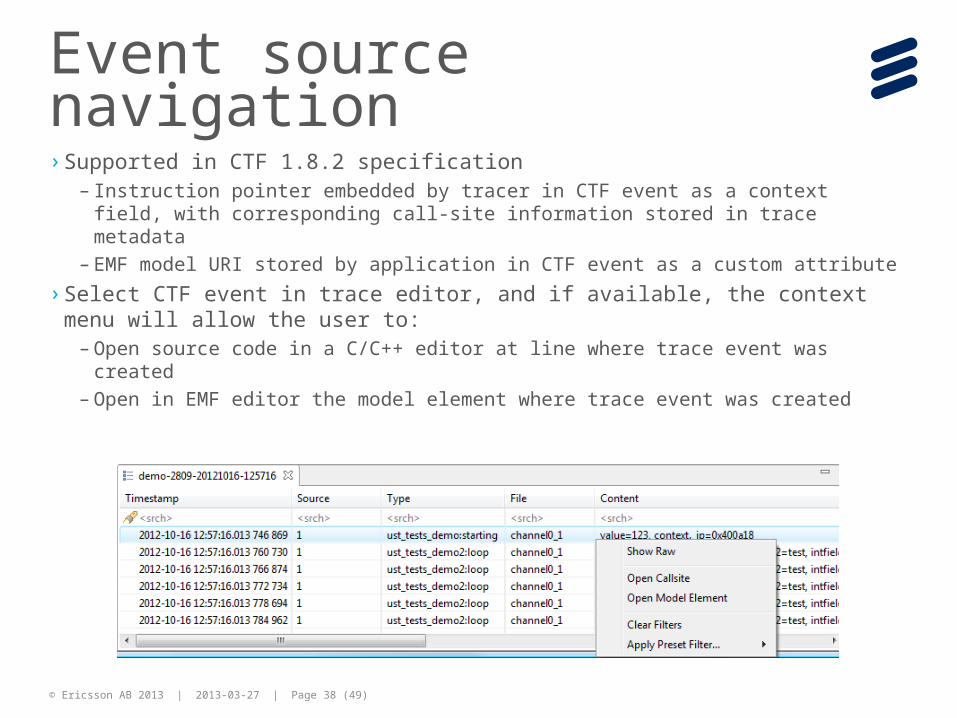
Event source navigation› Supported in CTF 1.8.2 specification
– Instruction pointer embedded by tracer in CTF event as a context field, with corresponding call-site information stored in trace metadata
– EMF model URI stored by application in CTF event as a custom attribute
› Select CTF event in trace editor, and if available, the context menu will allow the user to:
– Open source code in a C/C++ editor at line where trace event was created– Open in EMF editor the model element where trace event was created
© Ericsson AB 2013 | 2013-03-27 | Page 39 (49)
Upcoming features› Clock synchronization of traces from multiple hosts
› Pin and clone of views
› Live traces (reading and viewing while tracing is ongoing)
› Batch import trace wizard
› State system back-ends (partial history, stored in memory)
› User-customizable column chooser / sorter
› Custom state system
› CTF Writer
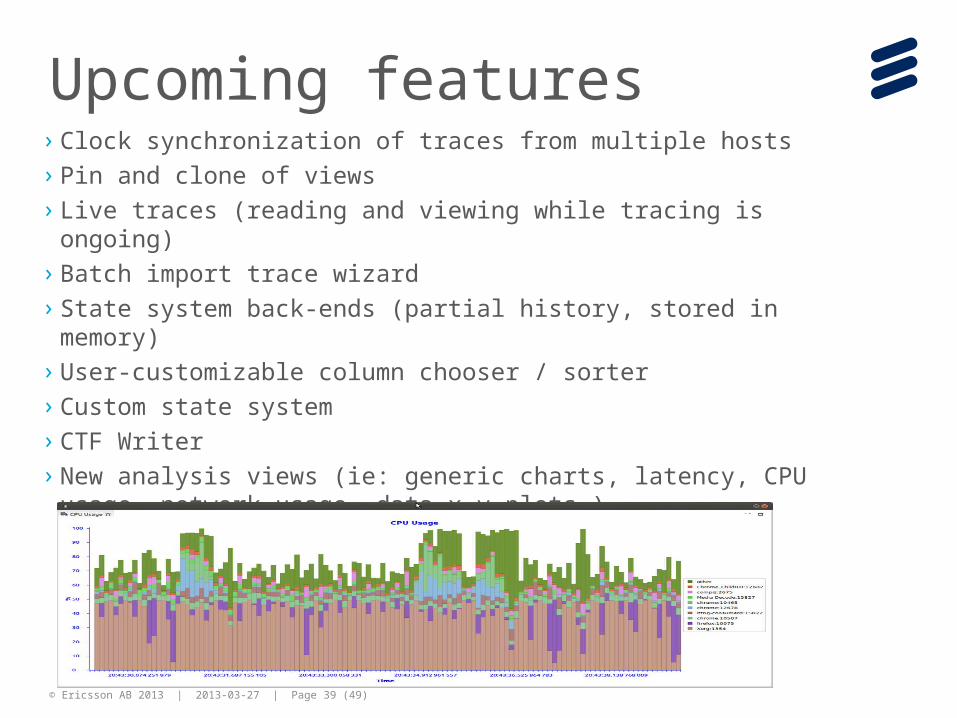
› New analysis views (ie: generic charts, latency, CPU usage, network usage, data x-y plots…)
© Ericsson AB 2013 | 2013-03-27 | Page 40 (49)
HW-CTF
› For HW traces converted by a Nexus-To-CTF converter› Oscilloscope View› Execution Stack View
© Ericsson AB 2013 | 2013-03-27 | Page 41 (49)
Some References› Multicore Association Tool Infrastructure Working Groups
http://www.multicore-association.org/workgroup/tiwg.php
› CTF Requirement, specification, reference implementation http://www.efficios.com/ctf
› Multicore Debug workgroup, http://wiki.eclipse.org/CDT/MultiCoreDebugWorkingGroup
› Eclipse LTTng Project http://www.eclipse.org/linuxtools/projectPages/lttng
› Eclipse LTTng wiki http://wiki.eclipse.org/Linux_Tools_Project/LTTng
› Eclipse Tracing Monitoring http://wiki.eclipse.org/Linux_Tools_Project/TMF/User_Guide
› LTTng project: http://lttng.org
› Read-Copy Update, http://lttng.org/urcu, http://www.rdrop.com/users/paulmck/RCU
› GCC ASM goto, nop when tracepoint is disabledhttp://gcc.gnu.org/onlinedocs/gcc-4.6.2/gcc/Extended-Asm.html
› GDB http://sourceware.org/gdb/
© Ericsson AB 2013 | 2013-03-27 | Page 42 (49)
Questions?
© Ericsson AB 2013 | 2013-03-27 | Page 43 (49)
printf(“Program X Init”, tracefile) is not enough!printf(“Program X Init”, tracefile) is not enough!
›Settings/Config: port, mode, pins, frame, speed, etc.
›Settings/Config changes!
›Key global variables, state of the state machine, sensor readings, etc.
›Timestamp, time of day
RelevantRelevant Data
© Ericsson AB 2013 | 2013-03-27 | Page 44 (49)
› Message passing info, e.g.– Sent or received– Who is the sender and receiver– Size of message– Message type / command– First few bytes of message data
› Version of the program
› Where did the tracepoint came from, e.g. main@subdir/test.c:5
RelevantRelevant data
© Ericsson AB 2013 | 2013-03-27 | Page 45 (49)
› Confidential Data
› Classified Data
› Special Military Data
What notnot to TRACE
© Ericsson AB 2013 | 2013-03-27 | Page 46 (49)
› Trace is not overhead, it adds value to your system
› How much will it cost to fix bugs without trace data?
› Long debug cycles are damaging a company reputation
› Still, try to keep it under 5%
› For the same amount of trace events, an optimized tracer can reduce the overhead by a factor of 200!200! compared to dynamic tracing.
Trace overheadoverhead
© Ericsson AB 2013 | 2013-03-27 | Page 47 (49)
› Evaluate amount of total trace storage
› Optimize the trace size– Sometimes need to remove less essential trace info
– Store it less frequently
– Detect when system is idle
– Use circular buffer and overwrite oldest data
› Compact binary can shrink trace data by a factor of 10
› Streaming to offload nodes or do live monitoring
Trace DesignDesign
© Ericsson AB 2013 | 2013-03-27 | Page 48 (49)
› Test trace data in the lab by injecting problems, is the trace data good enough to fix the problem?
› Do not provide an ability to disable essential trace point
› Name-space division in order to guarantee uniqueness of trace-point names and avoid name collisions
› Structure of trace-points into “layers” in order to give system insight in a certain level (system/function) e.g. com.<company>.<component>.<layer>.<function>.<…>
› Verbosity levels, e.g. lab vs production
Trace DesignDesign