Embed Size (px)
Citation preview
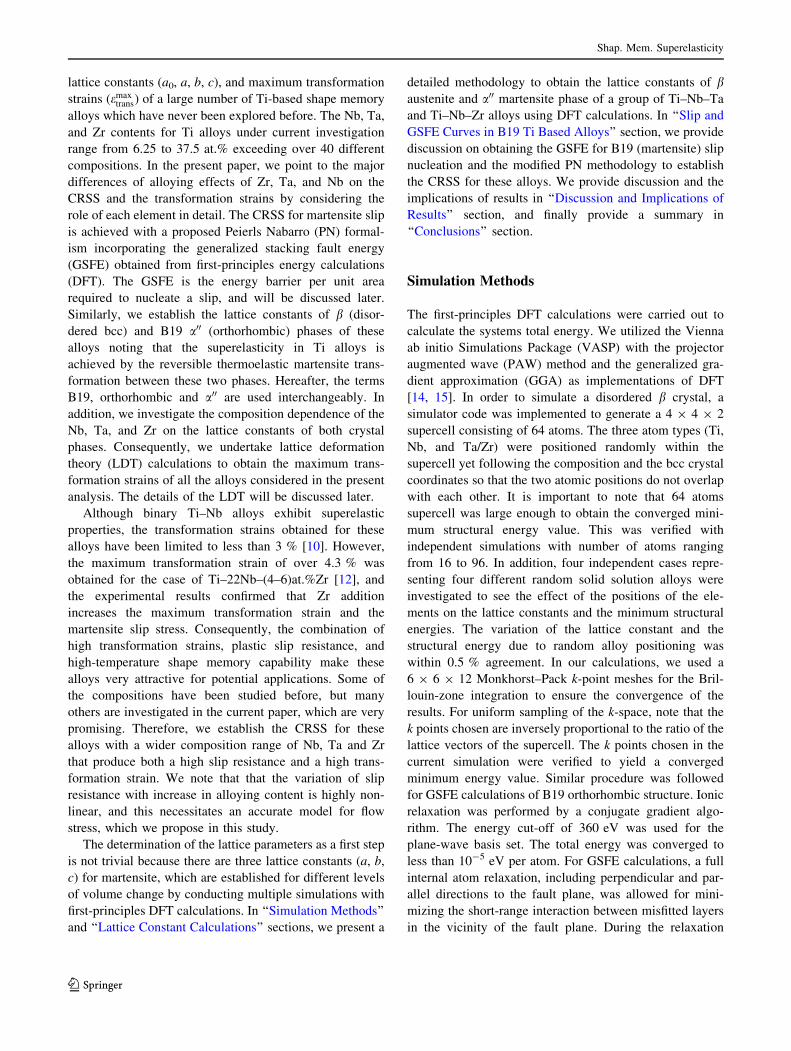
SPECIAL ISSUE: HIGH-TEMPERATURE SHAPE MEMORY ALLOYS, INVITED PAPER
Slip Resistance of Ti-Based High-Temperature Shape MemoryAlloys
A. Ojha1 • H. Sehitoglu1
� ASM International 2016
Abstract Titanium with Nb, Zr, and Ta alloying substi-
tutions possesses high plastic slip resistance and high
transformation strains upon bcc (b) to orthorhombic ða00Þtransformation. In the current study, we determine the
critical resolved shear stress (CRSS) for slip in Ti alloyed
for a wide composition range of Nb, Ta, and Zr. The CRSS
is obtained with a proposed Peierls–Nabarro formalism
incorporating the generalized stacking fault energy barrier
profile for slip obtained from the first-principles Density
Functional Theory (DFT) calculations. The CRSS for slip
of the orthorhombic martensite increases from 80 to
280 MPa linearly with increasing unstable fault energy.
The addition of tantalum is most effective in raising the
energy barriers. We also demonstrate the composition
dependence of the lattice parameters of both b and a00
crystal structures as a function of Nb, Ta, and Zr additions
showing agreement with experiments. Using the lattice
constants, the transformation strain is determined as high as
11 % in the [011] pole and its magnitude increases mainly
with Zr addition.
Keywords Shape memory � Superelasticity � Ti–Nb–Ta �Ti–Nb–Zr � Transformation strain � Slip � Martensite
Introduction
It is now well accepted that high-temperature Ti-based
alloys represent a formidable class of new shape memory
alloys. The research on Ti-based shape memory alloys dates
back to key works in the 1970s through the early 1980s [1–
5]. These alloys can be used in biomedical applications [6, 7]
in addition to exhibiting high-temperature shape memory
response [8–11]. Upon alloying with Nb, Zr, and Ta, high
slip resistance and high transformation strains can be
achieved [8, 9, 11, 12], and improving such properties is a
topic of continued scientific and engineering interest. While
a number of key works listed above have emphasized
experiments, less work has focused on theory and simula-
tion. For example, the plastic slip resistance is a very
important parameter in constitutive modeling [13] and to
achieve good shape memory functionality and fatigue
resistance. In order to minimize the plastic deformation
mediated via dislocation slip, it is desirable to elevate the
slip stress well above the stress required to induce martensite
transformation. Experiments [9, 11, 12] on Ti alloys
demonstrate considerable martensite slip resistance partic-
ularly when alloyed with Zr, Nb and Ta. In addition, the slip
stress magnitudes reported from these experiments are uni-
axial stress magnitudes with 0.2 % strain offset, and not the
CRSS levels for slip nucleation. Hence, it is imperative to
establish the composition dependence of the CRSS for slip
nucleation in Ti-based alloys over a wide composition range
of Zr, Nb, and Ta. Most importantly, a quantitative model
has not emerged that predicts the slip resistance over a broad
range of compositions. This information is crucial for the
design of new alloys and is the topic of this paper.
The present work represents a significant advancement
in establishing the CRSS (sslipcritical) for martensite slip, the
& H. Sehitoglu
1 Department of Mechanical Science and Engineering,
University of Illinois at Urbana-Champaign, 1206 W. Green
Street, Urbana, IL 61801, USA
123
Shap. Mem. Superelasticity
DOI 10.1007/s40830-015-0050-z
lattice constants (a0, a, b, c), and maximum transformation
strains (emaxtrans) of a large number of Ti-based shape memory
alloys which have never been explored before. The Nb, Ta,
and Zr contents for Ti alloys under current investigation
range from 6.25 to 37.5 at.% exceeding over 40 different
compositions. In the present paper, we point to the major
differences of alloying effects of Zr, Ta, and Nb on the
CRSS and the transformation strains by considering the
role of each element in detail. The CRSS for martensite slip
is achieved with a proposed Peierls Nabarro (PN) formal-
ism incorporating the generalized stacking fault energy
(GSFE) obtained from first-principles energy calculations
(DFT). The GSFE is the energy barrier per unit area
required to nucleate a slip, and will be discussed later.
Similarly, we establish the lattice constants of b (disor-
dered bcc) and B19 a00 (orthorhombic) phases of these
alloys noting that the superelasticity in Ti alloys is
achieved by the reversible thermoelastic martensite trans-
formation between these two phases. Hereafter, the terms
B19, orthorhombic and a00 are used interchangeably. In
addition, we investigate the composition dependence of the
Nb, Ta, and Zr on the lattice constants of both crystal
phases. Consequently, we undertake lattice deformation
theory (LDT) calculations to obtain the maximum trans-
formation strains of all the alloys considered in the present
analysis. The details of the LDT will be discussed later.
Although binary Ti–Nb alloys exhibit superelastic
properties, the transformation strains obtained for these
alloys have been limited to less than 3 % [10]. However,
the maximum transformation strain of over 4.3 % was
obtained for the case of Ti–22Nb–(4–6)at.%Zr [12], and
the experimental results confirmed that Zr addition
increases the maximum transformation strain and the
martensite slip stress. Consequently, the combination of
high transformation strains, plastic slip resistance, and
high-temperature shape memory capability make these
alloys very attractive for potential applications. Some of
the compositions have been studied before, but many
others are investigated in the current paper, which are very
promising. Therefore, we establish the CRSS for these
alloys with a wider composition range of Nb, Ta and Zr
that produce both a high slip resistance and a high trans-
formation strain. We note that that the variation of slip
resistance with increase in alloying content is highly non-
linear, and this necessitates an accurate model for flow
stress, which we propose in this study.
The determination of the lattice parameters as a first step
is not trivial because there are three lattice constants (a, b,
c) for martensite, which are established for different levels
of volume change by conducting multiple simulations with
first-principles DFT calculations. In ‘‘Simulation Methods’’
and ‘‘Lattice Constant Calculations’’ sections, we present a
detailed methodology to obtain the lattice constants of baustenite and a00 martensite phase of a group of Ti–Nb–Ta
and Ti–Nb–Zr alloys using DFT calculations. In ‘‘Slip and
GSFE Curves in B19 Ti Based Alloys’’ section, we provide
discussion on obtaining the GSFE for B19 (martensite) slip
nucleation and the modified PN methodology to establish
the CRSS for these alloys. We provide discussion and the
implications of results in ‘‘Discussion and Implications of
Results’’ section, and finally provide a summary in
‘‘Conclusions’’ section.
Simulation Methods
The first-principles DFT calculations were carried out to
calculate the systems total energy. We utilized the Vienna
ab initio Simulations Package (VASP) with the projector
augmented wave (PAW) method and the generalized gra-
dient approximation (GGA) as implementations of DFT
[14, 15]. In order to simulate a disordered b crystal, a
simulator code was implemented to generate a 4 9 4 9 2
supercell consisting of 64 atoms. The three atom types (Ti,
Nb, and Ta/Zr) were positioned randomly within the
supercell yet following the composition and the bcc crystal
coordinates so that the two atomic positions do not overlap
with each other. It is important to note that 64 atoms
supercell was large enough to obtain the converged mini-
mum structural energy value. This was verified with
independent simulations with number of atoms ranging
from 16 to 96. In addition, four independent cases repre-
senting four different random solid solution alloys were
investigated to see the effect of the positions of the ele-
ments on the lattice constants and the minimum structural
energies. The variation of the lattice constant and the
structural energy due to random alloy positioning was
within 0.5 % agreement. In our calculations, we used a
6 9 6 9 12 Monkhorst–Pack k-point meshes for the Bril-
louin-zone integration to ensure the convergence of the
results. For uniform sampling of the k-space, note that the
k points chosen are inversely proportional to the ratio of the
lattice vectors of the supercell. The k points chosen in the
current simulation were verified to yield a converged
minimum energy value. Similar procedure was followed
for GSFE calculations of B19 orthorhombic structure. Ionic
relaxation was performed by a conjugate gradient algo-
rithm. The energy cut-off of 360 eV was used for the
plane-wave basis set. The total energy was converged to
less than 10-5 eV per atom. For GSFE calculations, a full
internal atom relaxation, including perpendicular and par-
allel directions to the fault plane, was allowed for mini-
mizing the short-range interaction between misfitted layers
in the vicinity of the fault plane. During the relaxation
Shap. Mem. Superelasticity
123
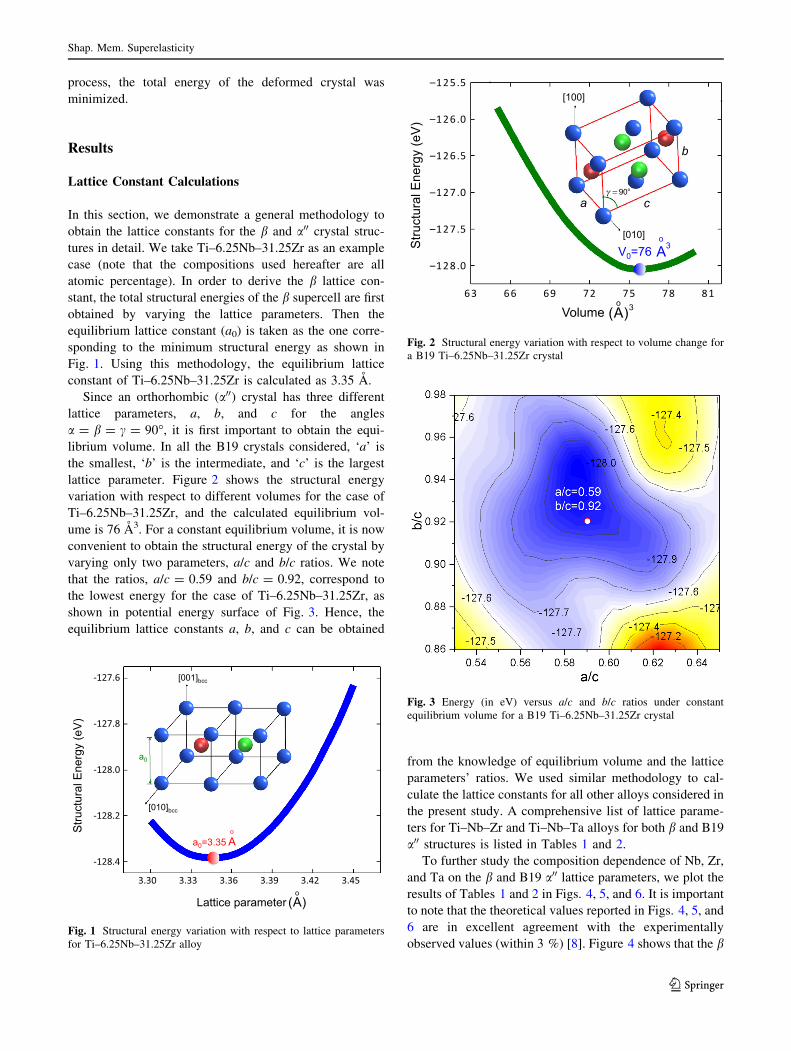
process, the total energy of the deformed crystal was
minimized.
Results
Lattice Constant Calculations
In this section, we demonstrate a general methodology to
obtain the lattice constants for the b and a00 crystal struc-
tures in detail. We take Ti–6.25Nb–31.25Zr as an example
case (note that the compositions used hereafter are all
atomic percentage). In order to derive the b lattice con-
stant, the total structural energies of the b supercell are first
obtained by varying the lattice parameters. Then the
equilibrium lattice constant (a0) is taken as the one corre-
sponding to the minimum structural energy as shown in
Fig. 1. Using this methodology, the equilibrium lattice
constant of Ti–6.25Nb–31.25Zr is calculated as 3.35 A.
Since an orthorhombic (a00) crystal has three different
lattice parameters, a, b, and c for the angles
a = b = c = 90�, it is first important to obtain the equi-
librium volume. In all the B19 crystals considered, ‘a’ is
the smallest, ‘b’ is the intermediate, and ‘c’ is the largest
lattice parameter. Figure 2 shows the structural energy
variation with respect to different volumes for the case of
Ti–6.25Nb–31.25Zr, and the calculated equilibrium vol-
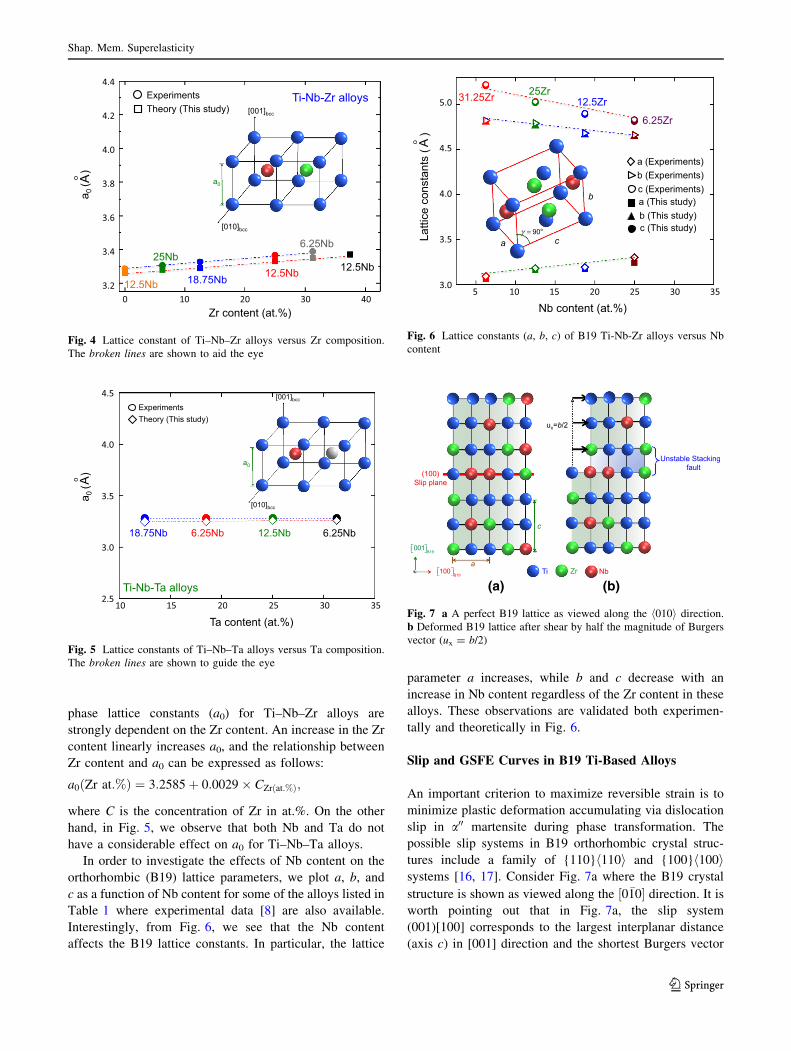
ume is 76 A3. For a constant equilibrium volume, it is now
convenient to obtain the structural energy of the crystal by
varying only two parameters, a/c and b/c ratios. We note
that the ratios, a/c = 0.59 and b/c = 0.92, correspond to
the lowest energy for the case of Ti–6.25Nb–31.25Zr, as
shown in potential energy surface of Fig. 3. Hence, the
equilibrium lattice constants a, b, and c can be obtained
from the knowledge of equilibrium volume and the lattice
parameters’ ratios. We used similar methodology to cal-
culate the lattice constants for all other alloys considered in
the present study. A comprehensive list of lattice parame-
ters for Ti–Nb–Zr and Ti–Nb–Ta alloys for both b and B19
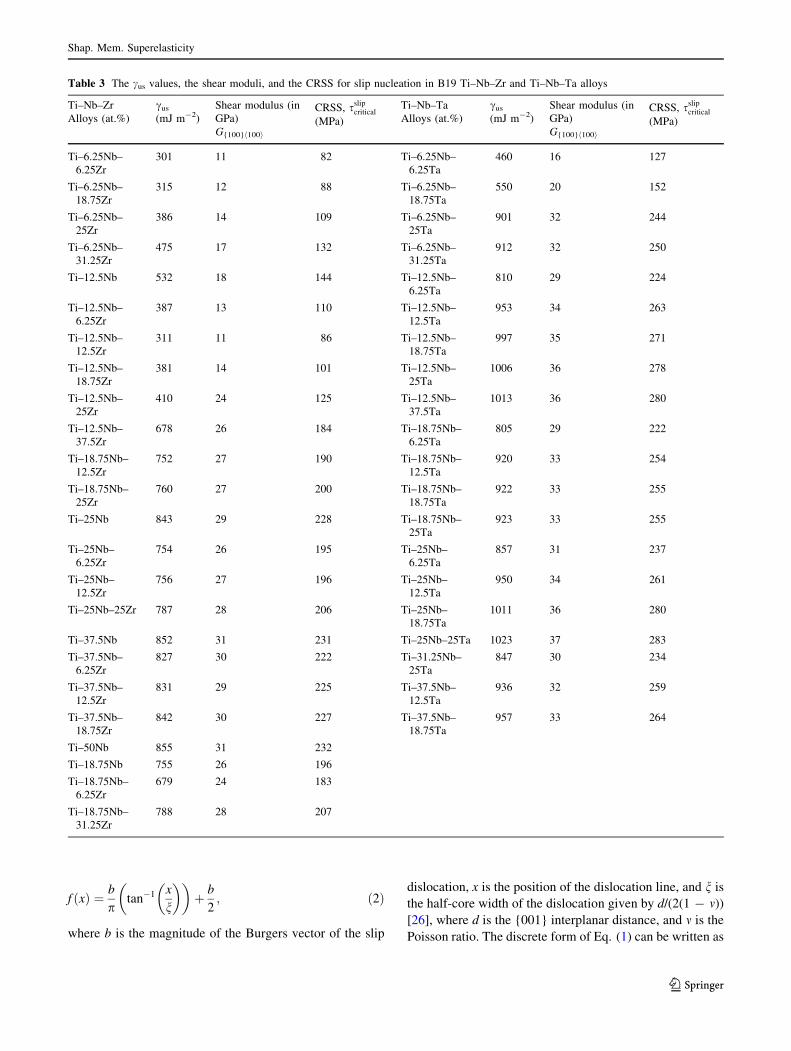
a00 structures is listed in Tables 1 and 2.
To further study the composition dependence of Nb, Zr,
and Ta on the b and B19 a00 lattice parameters, we plot the
results of Tables 1 and 2 in Figs. 4, 5, and 6. It is important
to note that the theoretical values reported in Figs. 4, 5, and
6 are in excellent agreement with the experimentally
observed values (within 3 %) [8]. Figure 4 shows that the b
3.30 3.33 3.36 3.39 3.42 3.45
-128.4
-128.2
-128.0
-127.8
-127.6
a0
[010]bcc
[001]bcc
a0=3.35 Ao
Lattice parameter (Ao)
Stru
ctur
al E
nerg
y (e
V)
Fig. 1 Structural energy variation with respect to lattice parameters
for Ti–6.25Nb–31.25Zr alloy
63 66 69 72 75 78 81
–128.0
–127.5
–127.0
–126.5
–126.0
–125.5
V0=76 Ao
Volume (Ao)
Stru
ctur
al E
nerg
y (e
V)
3
a
[100]
[010]
γ = 90o
3
a c
b
Fig. 2 Structural energy variation with respect to volume change for
a B19 Ti–6.25Nb–31.25Zr crystal
Fig. 3 Energy (in eV) versus a/c and b/c ratios under constant
equilibrium volume for a B19 Ti–6.25Nb–31.25Zr crystal
Shap. Mem. Superelasticity
123
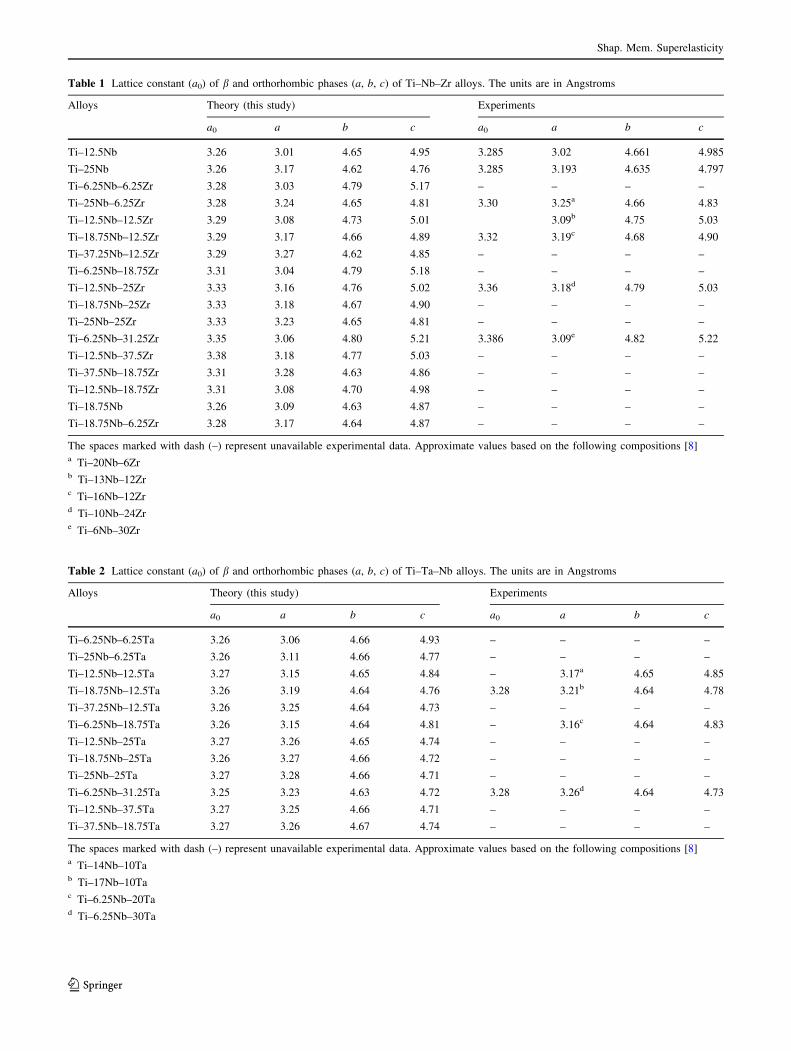
Table 1 Lattice constant (a0) of b and orthorhombic phases (a, b, c) of Ti–Nb–Zr alloys. The units are in Angstroms
Alloys Theory (this study) Experiments
a0 a b c a0 a b c
Ti–12.5Nb 3.26 3.01 4.65 4.95 3.285 3.02 4.661 4.985
Ti–25Nb 3.26 3.17 4.62 4.76 3.285 3.193 4.635 4.797
Ti–6.25Nb–6.25Zr 3.28 3.03 4.79 5.17 – – – –
Ti–25Nb–6.25Zr 3.28 3.24 4.65 4.81 3.30 3.25a 4.66 4.83
Ti–12.5Nb–12.5Zr 3.29 3.08 4.73 5.01 3.09b 4.75 5.03
Ti–18.75Nb–12.5Zr 3.29 3.17 4.66 4.89 3.32 3.19c 4.68 4.90
Ti–37.25Nb–12.5Zr 3.29 3.27 4.62 4.85 – – – –
Ti–6.25Nb–18.75Zr 3.31 3.04 4.79 5.18 – – – –
Ti–12.5Nb–25Zr 3.33 3.16 4.76 5.02 3.36 3.18d 4.79 5.03
Ti–18.75Nb–25Zr 3.33 3.18 4.67 4.90 – – – –
Ti–25Nb–25Zr 3.33 3.23 4.65 4.81 – – – –
Ti–6.25Nb–31.25Zr 3.35 3.06 4.80 5.21 3.386 3.09e 4.82 5.22
Ti–12.5Nb–37.5Zr 3.38 3.18 4.77 5.03 – – – –
Ti–37.5Nb–18.75Zr 3.31 3.28 4.63 4.86 – – – –
Ti–12.5Nb–18.75Zr 3.31 3.08 4.70 4.98 – – – –
Ti–18.75Nb 3.26 3.09 4.63 4.87 – – – –
Ti–18.75Nb–6.25Zr 3.28 3.17 4.64 4.87 – – – –
The spaces marked with dash (–) represent unavailable experimental data. Approximate values based on the following compositions [8]a Ti–20Nb–6Zrb Ti–13Nb–12Zrc Ti–16Nb–12Zrd Ti–10Nb–24Zre Ti–6Nb–30Zr
Table 2 Lattice constant (a0) of b and orthorhombic phases (a, b, c) of Ti–Ta–Nb alloys. The units are in Angstroms
Alloys Theory (this study) Experiments
a0 a b c a0 a b c
Ti–6.25Nb–6.25Ta 3.26 3.06 4.66 4.93 – – – –
Ti–25Nb–6.25Ta 3.26 3.11 4.66 4.77 – – – –
Ti–12.5Nb–12.5Ta 3.27 3.15 4.65 4.84 – 3.17a 4.65 4.85
Ti–18.75Nb–12.5Ta 3.26 3.19 4.64 4.76 3.28 3.21b 4.64 4.78
Ti–37.25Nb–12.5Ta 3.26 3.25 4.64 4.73 – – – –
Ti–6.25Nb–18.75Ta 3.26 3.15 4.64 4.81 – 3.16c 4.64 4.83
Ti–12.5Nb–25Ta 3.27 3.26 4.65 4.74 – – – –
Ti–18.75Nb–25Ta 3.26 3.27 4.66 4.72 – – – –
Ti–25Nb–25Ta 3.27 3.28 4.66 4.71 – – – –
Ti–6.25Nb–31.25Ta 3.25 3.23 4.63 4.72 3.28 3.26d 4.64 4.73
Ti–12.5Nb–37.5Ta 3.27 3.25 4.66 4.71 – – – –
Ti–37.5Nb–18.75Ta 3.27 3.26 4.67 4.74 – – – –
The spaces marked with dash (–) represent unavailable experimental data. Approximate values based on the following compositions [8]a Ti–14Nb–10Tab Ti–17Nb–10Tac Ti–6.25Nb–20Tad Ti–6.25Nb–30Ta
Shap. Mem. Superelasticity
123
phase lattice constants (a0) for Ti–Nb–Zr alloys are
strongly dependent on the Zr content. An increase in the Zr
content linearly increases a0, and the relationship between
Zr content and a0 can be expressed as follows:
a0 Zr at:%ð Þ ¼ 3:2585 þ 0:0029 � CZrðat:%Þ;
where C is the concentration of Zr in at.%. On the other
hand, in Fig. 5, we observe that both Nb and Ta do not
have a considerable effect on a0 for Ti–Nb–Ta alloys.
In order to investigate the effects of Nb content on the
orthorhombic (B19) lattice parameters, we plot a, b, and
c as a function of Nb content for some of the alloys listed in
Table 1 where experimental data [8] are also available.
Interestingly, from Fig. 6, we see that the Nb content
affects the B19 lattice constants. In particular, the lattice
parameter a increases, while b and c decrease with an
increase in Nb content regardless of the Zr content in these
alloys. These observations are validated both experimen-
tally and theoretically in Fig. 6.
Slip and GSFE Curves in B19 Ti-Based Alloys
An important criterion to maximize reversible strain is to
minimize plastic deformation accumulating via dislocation
slip in a00 martensite during phase transformation. The
possible slip systems in B19 orthorhombic crystal struc-
tures include a family of {110}h110i and {100}h100isystems [16, 17]. Consider Fig. 7a where the B19 crystal
structure is shown as viewed along the ½0�10� direction. It is
worth pointing out that in Fig. 7a, the slip system
(001)[100] corresponds to the largest interplanar distance
(axis c) in [001] direction and the shortest Burgers vector
0 10 20 30 403.2
3.4
3.6
3.8
4.0
4.2
4.4
a0
[010]bcc
[001]bcc
Ti-Nb-Zr alloys
Zr content (at.%)
25Nb
18.75Nb 12.5Nb 12.5Nb 12.5Nb
Experiments Theory (This study)
a 0 (
)
6.25Nb
Ao
Fig. 4 Lattice constant of Ti–Nb–Zr alloys versus Zr composition.
The broken lines are shown to aid the eye
10 15 20 25 30 352.5
3.0
3.5
4.0
4.5Experiments Theory (This study)
18.75Nb 6.25Nb 12.5Nb 6.25Nb
Ti-Nb-Ta alloys
Ta content (at.%)
a0
[010]bcc
[001]bcc
a 0 (
) Ao
Fig. 5 Lattice constants of Ti–Nb–Ta alloys versus Ta composition.
The broken lines are shown to guide the eye
5 10 15 20 25 30 353.0
3.5
4.0
4.5
5.0
b
a cγ = 90o
Nb content (at.%)
Latti
ce c
onst
ants
(
)
a (This study) b (This study) c (This study)
a (Experiments) b (Experiments) c (Experiments)
31.25Zr 25Zr 12.5Zr
6.25Zr
Ao
Fig. 6 Lattice constants (a, b, c) of B19 Ti-Nb-Zr alloys versus Nb
content
(a) (b)
Fig. 7 a A perfect B19 lattice as viewed along the h010i direction.
b Deformed B19 lattice after shear by half the magnitude of Burgers
vector (ux = b/2)
Shap. Mem. Superelasticity
123

(axis a) in [100] direction. Based on this slip system, the
Burgers vector (b) for B19 Ti–6.25Zr–25Nb lattice is equal
to 3.24 A, for example.
The GSFE is obtained by shearing one half (001) plane of
the crystal with respect to another half by continuous rigid
displacements of ux = nb along [100] direction, where b is
the magnitude of the Burgers vector and n is a parameter
ranging from 0 to 1 [18–20]. Similarly, Fig. 7b is the
deformed lattice after shear by half a Burgers vector
(ux = 0.5b). The GSFE curves for both alloy systems, Ti–
Nb–Ta and Ti–Nb–Zr, for four different compositions
exhibiting the highest cus values and the lowest cus values are
shown in Fig. 8. The cus is the maximum energy barrier
required to nucleate a slip, and corresponds to the displace-
ment of ux = 0.5b on the GSFE curve. The (001)[100] cus
values for each alloy considered in the present analysis are
reported in Table 3, and graphically represented in Fig. 8.
The GSFE curve also allows us to derive the {100}h100ishear modulus using the equation, Gf100g 100h i ¼ 2poc
ou
��max
.
The magnitudes of the shear moduli for Ti–Nb–Zr and Ti–
Nb–Ta alloys are also listed in Table 3.
In the present analysis, we determined that the
{100}h100i are the active slip systems in Ti-Nb-Zr and Ti-
Nb-Ta alloys. We also obtained the GSFE curves for
{110}h110i slip systems using similar methodology dis-
cussed above. The {110}h110i cus values for all the alloys
considered are approximately 3–5 times higher than those
for {100}h100i slip systems. For example, the {110}h110icus for Ti–6.25Zr–6.25Nb, Ti–18.75Zr–37.5Nb, Ti–25Ta–
25Nb, and Ti–6.25Ta–6.25Nb alloys were obtained as 922,
2124, 3276, and 1613 mJ m-2, respectively. These values
are significantly higher than the cus for {100}h100i slip
systems, and hence rule out the possibility of slip nucle-
ation in {110}h110i slip systems. Recently, similar theo-
retical calculations [21] on NiTiHf have shown that the
activation of slip systems of {110}h110i family in B19
lattice is unfavorable due to the high energy barrier asso-
ciated with the generalized stacking fault energy (GSFE)
curve, and ultimately high CRSS (in orders of GPa).
Hence, the {100}h100i slip system is considered for further
analysis in the present paper.
Figure 9a, b shows the ternary contour plot of cus vari-
ation for Ti–Nb–Zr and Ti–Nb–Ta alloys. Upon comparing
the plots, we observe that the cus values for all Ti–Nb–Ta
alloys are higher than that of Ti–Nb–Zr alloys for the same
composition of Ti and Nb. For the case of Ti–Nb–Zr alloys,
the maximum cus values lie in the region of high Nb and
high Zr content, shown by as shown by red shades in
Fig. 9a, while in the case of Ti–Nb–Ta alloys, the maxi-
mum cus values are obtained in low Nb and high Ta con-
tent. The lower cus values for Ti–Nb–Zr lie along the
constant Nb content of 12.5 at.%, while for Ti–Nb–Ta
alloys, the region is observed in low Ta and low Nb con-
tent. As we see later, the magnitude of cus influences the
CRSS for martensite slip nucleation. Therefore, the results
in Fig. 9 provide useful insights for slip resistance associ-
ated with different compositions of Nb, Ta, and Zr in Ti-
based alloys.
Peierls Nabarro Modeling of the Critical Resolved
Shear Stress (CRSS) for Slip
The modified PN formalism is adopted in the current work
to calculate the slip stress, which is an advancement to the
original PN model [22, 23]. The major advancements of the
modified PN formalism are the use of actual energy land-
scape (GSFE) of the alloy to calculate the energy variation
with respect to the dislocation position and the considera-
tion of the lattice discreteness to obtain the misfit energy
curve [24–27]. The misfit energy across a slip plane is
defined as the sum over energy contributions due to slip
between pairs of atomic planes [26, 27], and can be
obtained from the GSFE as follows:
Esc ¼
Zþ1
�1
cGSFE f xð Þð Þdx ð1Þ
The term cGSFE is the GSFE energy landscape (as shown
in Fig. 8) expressed in sinusoidal form, and f(x) is defined
as the disregistry function which is a measure of the slip
distribution on the slip plane, uA - uB as shown in
Fig. 10a. The solution to f(x) can be written as follows [26,
27]:
0.00 0.25 0.50 0.75 1.000
200
400
600
800
1000 Ti-25Ta-25Nb Ti-6.25Ta-6.25Nb
Ti-18.75Zr-37.5Nb
Ti-6.25Zr-6.25Nb
γus
x
Fig. 8 Generalized stacking fault energy (GSFE) for Ti–Nb–Ta and
Ti–Nb–Zr alloys for the compositions exhibiting the highest and the
lowest values
Shap. Mem. Superelasticity
123
f xð Þ ¼ b
ptan�1 x
n
� �� �
þ b
2; ð2Þ
where b is the magnitude of the Burgers vector of the slip
dislocation, x is the position of the dislocation line, and n is
the half-core width of the dislocation given by d/(2(1 - m))
[26], where d is the {001} interplanar distance, and m is the
Poisson ratio. The discrete form of Eq. (1) can be written as
Table 3 The cus values, the shear moduli, and the CRSS for slip nucleation in B19 Ti–Nb–Zr and Ti–Nb–Ta alloys
Ti–Nb–Zr
Alloys (at.%)
cus
(mJ m-2)
Shear modulus (in
GPa)
G{100}h100i
CRSS, sslipcritical
(MPa)
Ti–Nb–Ta
Alloys (at.%)
cus
(mJ m-2)
Shear modulus (in
GPa)
G{100}h100i
CRSS, sslipcritical
(MPa)
Ti–6.25Nb–
6.25Zr
301 11 82 Ti–6.25Nb–
6.25Ta
460 16 127
Ti–6.25Nb–
18.75Zr
315 12 88 Ti–6.25Nb–
18.75Ta
550 20 152
Ti–6.25Nb–
25Zr
386 14 109 Ti–6.25Nb–
25Ta
901 32 244
Ti–6.25Nb–
31.25Zr
475 17 132 Ti–6.25Nb–
31.25Ta
912 32 250
Ti–12.5Nb 532 18 144 Ti–12.5Nb–
6.25Ta
810 29 224
Ti–12.5Nb–
6.25Zr
387 13 110 Ti–12.5Nb–
12.5Ta
953 34 263
Ti–12.5Nb–
12.5Zr
311 11 86 Ti–12.5Nb–
18.75Ta
997 35 271
Ti–12.5Nb–
18.75Zr
381 14 101 Ti–12.5Nb–
25Ta
1006 36 278
Ti–12.5Nb–
25Zr
410 24 125 Ti–12.5Nb–
37.5Ta
1013 36 280
Ti–12.5Nb–
37.5Zr
678 26 184 Ti–18.75Nb–
6.25Ta
805 29 222
Ti–18.75Nb–
12.5Zr
752 27 190 Ti–18.75Nb–
12.5Ta
920 33 254
Ti–18.75Nb–
25Zr
760 27 200 Ti–18.75Nb–
18.75Ta
922 33 255
Ti–25Nb 843 29 228 Ti–18.75Nb–
25Ta
923 33 255
Ti–25Nb–
6.25Zr
754 26 195 Ti–25Nb–
6.25Ta
857 31 237
Ti–25Nb–
12.5Zr
756 27 196 Ti–25Nb–
12.5Ta
950 34 261
Ti–25Nb–25Zr 787 28 206 Ti–25Nb–
18.75Ta
1011 36 280
Ti–37.5Nb 852 31 231 Ti–25Nb–25Ta 1023 37 283
Ti–37.5Nb–
6.25Zr
827 30 222 Ti–31.25Nb–
25Ta
847 30 234
Ti–37.5Nb–
12.5Zr
831 29 225 Ti–37.5Nb–
12.5Ta
936 32 259
Ti–37.5Nb–
18.75Zr
842 30 227 Ti–37.5Nb–
18.75Ta
957 33 264
Ti–50Nb 855 31 232
Ti–18.75Nb 755 26 196
Ti–18.75Nb–
6.25Zr
679 24 183
Ti–18.75Nb–
31.25Zr
788 28 207
Shap. Mem. Superelasticity
123

Esc ¼
Xm¼þ1
m¼�1cGSFE f ma0 � uð Þð Þa0; ð3Þ
where m is an integer, u is the position of the dislocation
line, and a0 is the lattice periodicity defined as the shortest
distance between two equivalent atomic rows in the
direction of the dislocation displacement. The numerical
solution to Eq. (3) for the case of Ti–6.25Nb–25Ta is
shown in Fig. 10b. In Fig. 10b, the term Esc
� �
a0=2is the
minimum of the Esc function and provides an estimate of
the core energy of the dislocation. Similarly, the term
Esc
� �
pis the Peierls energy (marked on Fig. 10b) which is
the amplitude of the variation and the barrier required to
move the dislocation. The Peierls stress is calculated as the
maximum slope of the misfit energy curve which describes
the potential energy of the dislocation as a function of the
dislocation position u [26], and can be written as follows:
sslipcritical ¼ max
1
b
oEsc
ou
� �� �
ð4Þ
The values of the CRSS for slip using Eq. (4) are given
in Table 3. We note that the cus and ultimately the slip
stress of Ti–Nb–Ta alloys are higher than Ti–Nb–Zr alloys
for the same composition of Ti and Nb. Therefore, higher
the cus, the higher is the CRSS obtained using Eq. (4).
Fig. 9 Composition dependence of unstable fault energy in a Ti–Nb–Zr, b Ti–Nb–Ta alloys
Slip plane x
y
d
b
uA
uB
Perfect crystal Crystal with dislocation
0.0 0.2 0 .4 0.6 0.8 1 .0
11
12
13
14
τ p = 1b
max∂Eγ
s
∂u
⎧⎨⎪
⎩⎪
⎫⎬⎪
⎭⎪
u / a'
Eγs = γ GSFE
m=−∞
m=+∞
∑ f ma '− u( )( )a '
Eγs( )
a'/2
Eγs( )
p
(a) (b)
Fig. 10 a Schematic of the PN
model for slip nucleation.
b Misfit energy (Esc) variation
with respect to the dislocation
position for the case of Ti–
6.25Nb–25Ta
Shap. Mem. Superelasticity
123
Discussion and Implications of Results
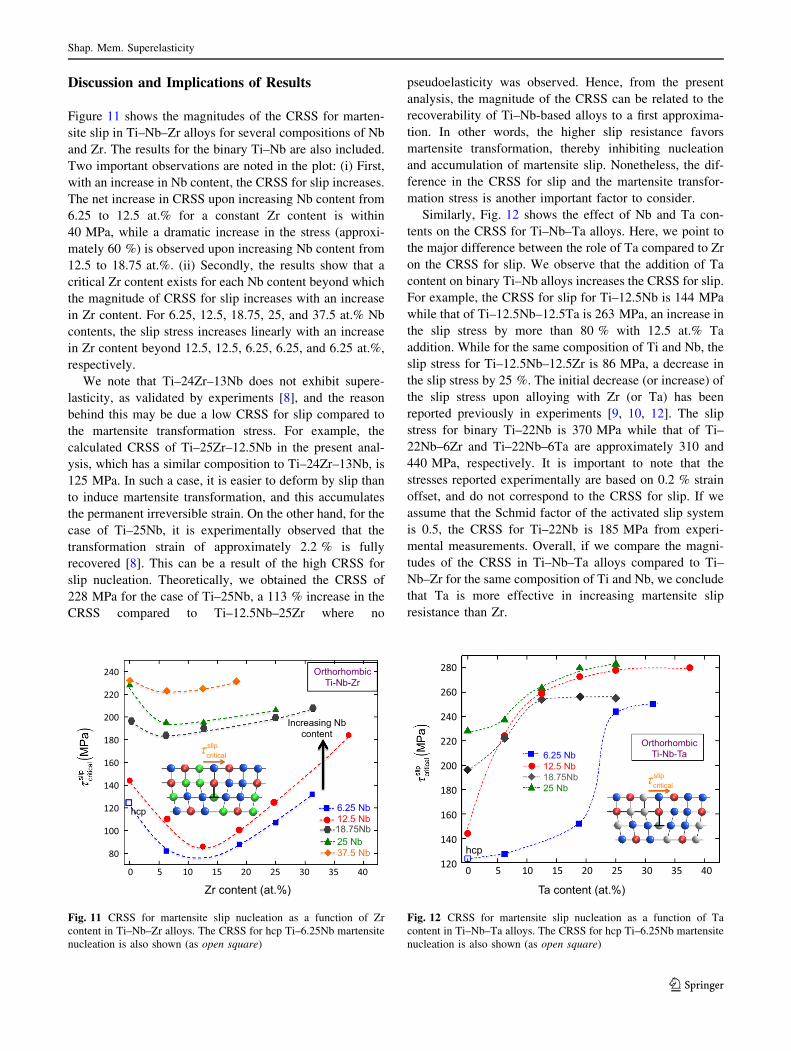
Figure 11 shows the magnitudes of the CRSS for marten-
site slip in Ti–Nb–Zr alloys for several compositions of Nb
and Zr. The results for the binary Ti–Nb are also included.
Two important observations are noted in the plot: (i) First,
with an increase in Nb content, the CRSS for slip increases.
The net increase in CRSS upon increasing Nb content from
6.25 to 12.5 at.% for a constant Zr content is within
40 MPa, while a dramatic increase in the stress (approxi-
mately 60 %) is observed upon increasing Nb content from
12.5 to 18.75 at.%. (ii) Secondly, the results show that a
critical Zr content exists for each Nb content beyond which
the magnitude of CRSS for slip increases with an increase
in Zr content. For 6.25, 12.5, 18.75, 25, and 37.5 at.% Nb
contents, the slip stress increases linearly with an increase
in Zr content beyond 12.5, 12.5, 6.25, 6.25, and 6.25 at.%,
respectively.
We note that Ti–24Zr–13Nb does not exhibit supere-
lasticity, as validated by experiments [8], and the reason
behind this may be due a low CRSS for slip compared to
the martensite transformation stress. For example, the
calculated CRSS of Ti–25Zr–12.5Nb in the present anal-
ysis, which has a similar composition to Ti–24Zr–13Nb, is
125 MPa. In such a case, it is easier to deform by slip than
to induce martensite transformation, and this accumulates
the permanent irreversible strain. On the other hand, for the
case of Ti–25Nb, it is experimentally observed that the
transformation strain of approximately 2.2 % is fully
recovered [8]. This can be a result of the high CRSS for
slip nucleation. Theoretically, we obtained the CRSS of
228 MPa for the case of Ti–25Nb, a 113 % increase in the
CRSS compared to Ti–12.5Nb–25Zr where no
pseudoelasticity was observed. Hence, from the present
analysis, the magnitude of the CRSS can be related to the
recoverability of Ti–Nb-based alloys to a first approxima-
tion. In other words, the higher slip resistance favors
martensite transformation, thereby inhibiting nucleation
and accumulation of martensite slip. Nonetheless, the dif-
ference in the CRSS for slip and the martensite transfor-
mation stress is another important factor to consider.
Similarly, Fig. 12 shows the effect of Nb and Ta con-
tents on the CRSS for Ti–Nb–Ta alloys. Here, we point to
the major difference between the role of Ta compared to Zr
on the CRSS for slip. We observe that the addition of Ta
content on binary Ti–Nb alloys increases the CRSS for slip.
For example, the CRSS for slip for Ti–12.5Nb is 144 MPa
while that of Ti–12.5Nb–12.5Ta is 263 MPa, an increase in
the slip stress by more than 80 % with 12.5 at.% Ta
addition. While for the same composition of Ti and Nb, the
slip stress for Ti–12.5Nb–12.5Zr is 86 MPa, a decrease in
the slip stress by 25 %. The initial decrease (or increase) of
the slip stress upon alloying with Zr (or Ta) has been
reported previously in experiments [9, 10, 12]. The slip
stress for binary Ti–22Nb is 370 MPa while that of Ti–
22Nb–6Zr and Ti–22Nb–6Ta are approximately 310 and
440 MPa, respectively. It is important to note that the
stresses reported experimentally are based on 0.2 % strain
offset, and do not correspond to the CRSS for slip. If we
assume that the Schmid factor of the activated slip system
is 0.5, the CRSS for Ti–22Nb is 185 MPa from experi-
mental measurements. Overall, if we compare the magni-
tudes of the CRSS in Ti–Nb–Ta alloys compared to Ti–
Nb–Zr for the same composition of Ti and Nb, we conclude
that Ta is more effective in increasing martensite slip
resistance than Zr.
0 5 10 15 20 25 30 35 40
80
100
120
140
160
180
200
220
240
Zr content (at.%)
Increasing Nb content
Orthorhombic Ti-Nb-Zr
hcp 6.25 Nb 12.5 Nb
25 Nb 37.5 Nb
τcriticalslip
18.75Nb
Fig. 11 CRSS for martensite slip nucleation as a function of Zr
content in Ti–Nb–Zr alloys. The CRSS for hcp Ti–6.25Nb martensite
nucleation is also shown (as open square)
Ta content (at.%)
hcp
Orthorhombic Ti-Nb-Ta 6.25 Nb
12.5 Nb 18.75Nb 25 Nb
τ criticalslip
0 5 10 15 20 25 30 35 40120
140
160
180
200
220
240
260
280
Fig. 12 CRSS for martensite slip nucleation as a function of Ta
content in Ti–Nb–Ta alloys. The CRSS for hcp Ti–6.25Nb martensite
nucleation is also shown (as open square)
Shap. Mem. Superelasticity
123
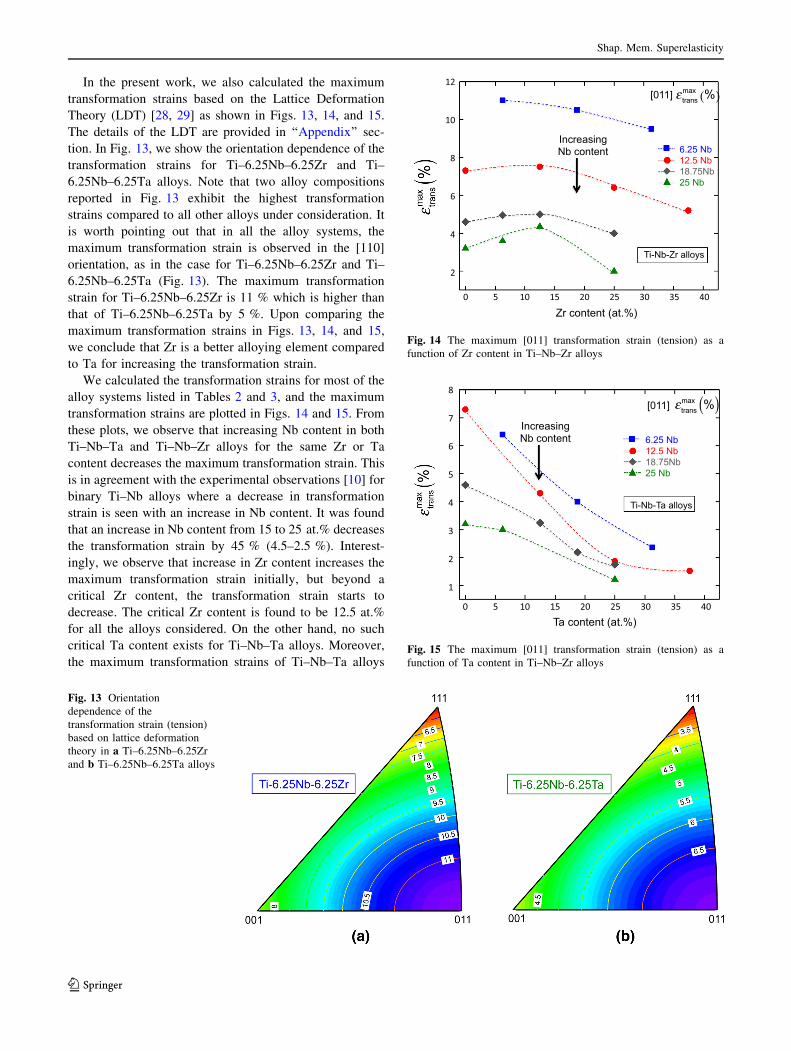
In the present work, we also calculated the maximum
transformation strains based on the Lattice Deformation
Theory (LDT) [28, 29] as shown in Figs. 13, 14, and 15.
The details of the LDT are provided in ‘‘Appendix’’ sec-
tion. In Fig. 13, we show the orientation dependence of the
transformation strains for Ti–6.25Nb–6.25Zr and Ti–
6.25Nb–6.25Ta alloys. Note that two alloy compositions
reported in Fig. 13 exhibit the highest transformation
strains compared to all other alloys under consideration. It
is worth pointing out that in all the alloy systems, the
maximum transformation strain is observed in the [110]
orientation, as in the case for Ti–6.25Nb–6.25Zr and Ti–
6.25Nb–6.25Ta (Fig. 13). The maximum transformation
strain for Ti–6.25Nb–6.25Zr is 11 % which is higher than
that of Ti–6.25Nb–6.25Ta by 5 %. Upon comparing the
maximum transformation strains in Figs. 13, 14, and 15,
we conclude that Zr is a better alloying element compared
to Ta for increasing the transformation strain.
We calculated the transformation strains for most of the
alloy systems listed in Tables 2 and 3, and the maximum
transformation strains are plotted in Figs. 14 and 15. From
these plots, we observe that increasing Nb content in both
Ti–Nb–Ta and Ti–Nb–Zr alloys for the same Zr or Ta
content decreases the maximum transformation strain. This
is in agreement with the experimental observations [10] for
binary Ti–Nb alloys where a decrease in transformation
strain is seen with an increase in Nb content. It was found
that an increase in Nb content from 15 to 25 at.% decreases
the transformation strain by 45 % (4.5–2.5 %). Interest-
ingly, we observe that increase in Zr content increases the
maximum transformation strain initially, but beyond a
critical Zr content, the transformation strain starts to
decrease. The critical Zr content is found to be 12.5 at.%
for all the alloys considered. On the other hand, no such
critical Ta content exists for Ti–Nb–Ta alloys. Moreover,
the maximum transformation strains of Ti–Nb–Ta alloys
Fig. 13 Orientation
dependence of the
transformation strain (tension)
based on lattice deformation
theory in a Ti–6.25Nb–6.25Zr
and b Ti–6.25Nb–6.25Ta alloys
6.25 Nb 12.5 Nb 18.75Nb 25 Nb
Zr content (at.%)
ε transmax %( )[011]
Ti-Nb-Zr alloys
Increasing Nb content
0 5 10 15 20 25 30 35 40
2
4
6
8
10
12
Fig. 14 The maximum [011] transformation strain (tension) as a
function of Zr content in Ti–Nb–Zr alloys
6.25 Nb 12.5 Nb 18.75Nb 25 Nb
Ta content (at.%)
εtransmax %( )[011]
Ti-Nb-Ta alloys
Increasing Nb content
0 5 10 15 20 25 30 35 40
1
2
3
4
5
6
7
8
Fig. 15 The maximum [011] transformation strain (tension) as a
function of Ta content in Ti–Nb–Zr alloys
Shap. Mem. Superelasticity
123
are lower than those of Ti–Nb–Zr alloys for the same
composition of Ti and Nb.
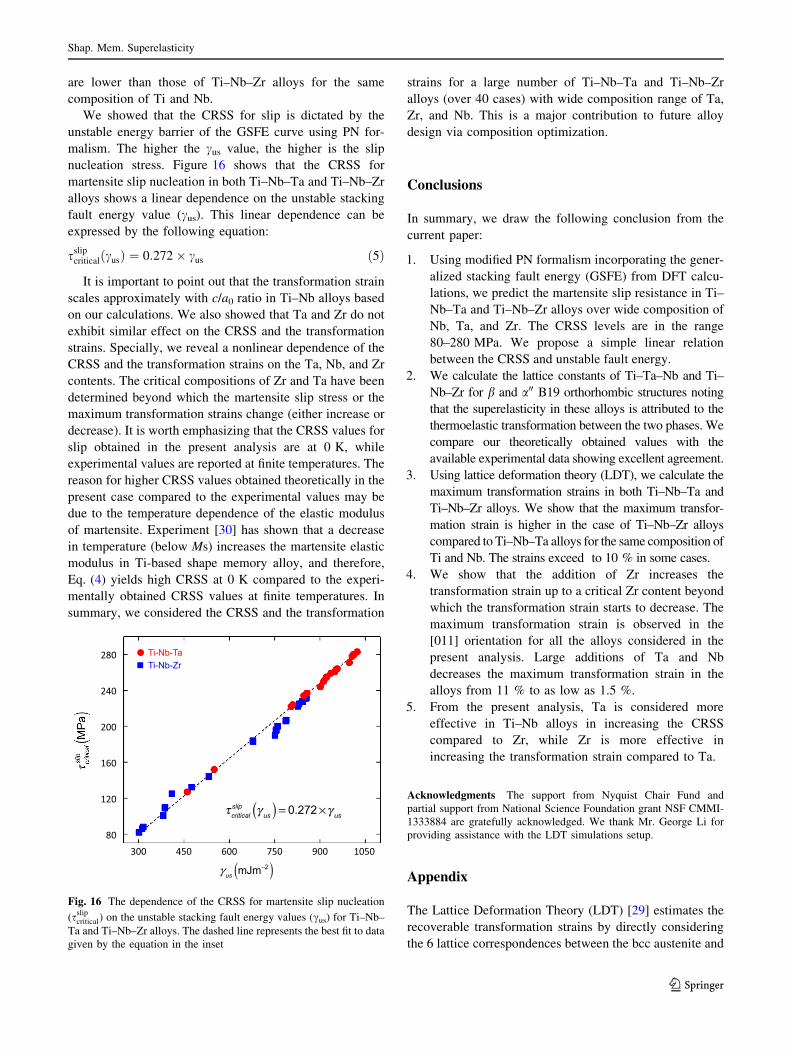
We showed that the CRSS for slip is dictated by the
unstable energy barrier of the GSFE curve using PN for-
malism. The higher the cus value, the higher is the slip
nucleation stress. Figure 16 shows that the CRSS for
martensite slip nucleation in both Ti–Nb–Ta and Ti–Nb–Zr
alloys shows a linear dependence on the unstable stacking
fault energy value (cus). This linear dependence can be
expressed by the following equation:
sslipcritical cusð Þ ¼ 0:272 � cus ð5Þ
It is important to point out that the transformation strain
scales approximately with c/a0 ratio in Ti–Nb alloys based
on our calculations. We also showed that Ta and Zr do not
exhibit similar effect on the CRSS and the transformation
strains. Specially, we reveal a nonlinear dependence of the
CRSS and the transformation strains on the Ta, Nb, and Zr
contents. The critical compositions of Zr and Ta have been
determined beyond which the martensite slip stress or the
maximum transformation strains change (either increase or
decrease). It is worth emphasizing that the CRSS values for
slip obtained in the present analysis are at 0 K, while
experimental values are reported at finite temperatures. The
reason for higher CRSS values obtained theoretically in the
present case compared to the experimental values may be
due to the temperature dependence of the elastic modulus
of martensite. Experiment [30] has shown that a decrease
in temperature (below Ms) increases the martensite elastic
modulus in Ti-based shape memory alloy, and therefore,
Eq. (4) yields high CRSS at 0 K compared to the experi-
mentally obtained CRSS values at finite temperatures. In
summary, we considered the CRSS and the transformation
strains for a large number of Ti–Nb–Ta and Ti–Nb–Zr
alloys (over 40 cases) with wide composition range of Ta,
Zr, and Nb. This is a major contribution to future alloy
design via composition optimization.
Conclusions
In summary, we draw the following conclusion from the
current paper:
1. Using modified PN formalism incorporating the gener-
alized stacking fault energy (GSFE) from DFT calcu-
lations, we predict the martensite slip resistance in Ti–
Nb–Ta and Ti–Nb–Zr alloys over wide composition of
Nb, Ta, and Zr. The CRSS levels are in the range
80–280 MPa. We propose a simple linear relation
between the CRSS and unstable fault energy.
2. We calculate the lattice constants of Ti–Ta–Nb and Ti–
Nb–Zr for b and a00 B19 orthorhombic structures noting
that the superelasticity in these alloys is attributed to the
thermoelastic transformation between the two phases. We
compare our theoretically obtained values with the
available experimental data showing excellent agreement.
3. Using lattice deformation theory (LDT), we calculate the
maximum transformation strains in both Ti–Nb–Ta and
Ti–Nb–Zr alloys. We show that the maximum transfor-
mation strain is higher in the case of Ti–Nb–Zr alloys
compared to Ti–Nb–Ta alloys for the same composition of
Ti and Nb. The strains exceed to 10 % in some cases.
4. We show that the addition of Zr increases the
transformation strain up to a critical Zr content beyond
which the transformation strain starts to decrease. The
maximum transformation strain is observed in the
[011] orientation for all the alloys considered in the
present analysis. Large additions of Ta and Nb
decreases the maximum transformation strain in the
alloys from 11 % to as low as 1.5 %.
5. From the present analysis, Ta is considered more
effective in Ti–Nb alloys in increasing the CRSS
compared to Zr, while Zr is more effective in
increasing the transformation strain compared to Ta.
Acknowledgments The support from Nyquist Chair Fund and
partial support from National Science Foundation grant NSF CMMI-
1333884 are gratefully acknowledged. We thank Mr. George Li for
providing assistance with the LDT simulations setup.
Appendix
The Lattice Deformation Theory (LDT) [29] estimates the
recoverable transformation strains by directly considering
the 6 lattice correspondences between the bcc austenite and
γ us mJm−2( )
Ti-Nb-Ta Ti-Nb-Zr
τcriticalslip γ us( ) = 0.272 ×γ us
300 450 600 750 900 105080
120
160
200
240
280
Fig. 16 The dependence of the CRSS for martensite slip nucleation
(sslipcritical) on the unstable stacking fault energy values (cus) for Ti–Nb–
Ta and Ti–Nb–Zr alloys. The dashed line represents the best fit to data
given by the equation in the inset
Shap. Mem. Superelasticity
123
the orthorhombic martensite crystal structures. For each
lattice correspondence variant, a symmetric transformation
matrix U can be determined. The components of U matrix
are functions of the lattice constants of the parent austenite
and transformed martensite phases. An example of U for
the case of cubic to orthorhombic transformation is
U1 ¼
a 0 0
0cþ b
2
c� b2
0c� b
2
cþ b2
2
664
3
775; ð6Þ
where a ¼ffiffiffi
2p
a=a0; b¼b=a0; c¼ffiffiffi
2p
c=a0; a0, and a, b, and
c are the lattice constants of the bcc austenite and the
orthorhombic martensite phases, respectively.
The maximum recoverable strains is obtained as
e ¼ffiffiffiffiffiffiffiffiffiffiffiffiffiffiffiffiffiffiffi
e~: FTF �
e~q
� 1; ð7Þ
where F is the deformation gradient and e~ is the unit vector
in the crystallographic direction of interest. Using polar
decomposition theorem, the deformation gradient F can be
written as
F ¼ RU; ð8Þ
where R represents a rigid body rotation and U is the
symmetric part of F.
Upon substituting Eq. (8) into Eq. (7), we have the
following equivalent equation:
e ¼ffiffiffiffiffiffiffiffiffiffiffiffiffiffiffiffiffiffiffiffiffiffiffiffiffiffiffiffiffi
e~: UTRTRU �
e~q
� 1 ¼ffiffiffiffiffiffiffiffiffiffiffiffiffiffiffiffiffiffiffiffi
e~: UTU �
e~q
� 1 ð9Þ
References
1. Baker C (1971) Shape memory behavior in Ti–35 wt% Nb alloy.
J Met Sci 5:92–100
2. Duerig TW, Albrecht J, Richter D, Fischer P (1982) Formation
and reversion of stress induced martensite in Ti-10 V-2Fe-3Al.
Acta Metall 30:2161–2172
3. Duerig TW, Richter DF, Albrecht J (1982) Shape memory in Ti-
10 V-2Fe-3Al. Scr Metall 16:957–961
4. Blackburn MJ, Feeney JA (1970) Stress-induced transformations
in Ti-Mo alloys. DTIC Document
5. Hochstuhl P, Obst B (1982) Beta-phase instability and marten-
sitic transformation in Ti-22 a/o Nb alloy. Le Journal de Physique
Colloques 43:C4-133–C4-138
6. Ozaki T, Matsumoto H, Watanabe S, Hanada S (2004) Beta Ti
alloys with low Young’s modulus. Mater Trans 45:2776–2779
7. Hao YL, Li SJ, Sun SY, Zheng CY, Hu QM, Yang R (2005)
Super-elastic titanium alloy with unstable plastic deformation.
Appl Phys Lett 87:091906
8. Kim HY, Fu J, Tobe H, Kim JI, Miyazaki S (2015) Crystal
structure, transformation strain, and superelastic property of Ti–
Nb–Zr and Ti–Nb–Ta alloys. Shape Mem Superelast 1:107–116
9. Kim HY, Hashimoto S, Kim JI, Inamura T, Hosoda H, Miyazaki
S (2006) Effect of Ta addition on shape memory behavior of Ti–
22Nb alloy. Mater Sci Eng A 417:120–128
10. Kim HY, Ikehara Y, Kim JI, Hosoda H, Miyazaki S (2006)
Martensitic transformation, shape memory effect and superelas-
ticity of Ti–Nb binary alloys. Acta Mater 54:2419–2429
11. Miyazaki S, Kim HY, Hosoda H (2006) Development and
characterization of Ni-free Ti-base shape memory and supere-
lastic alloys. Mater Sci Eng A 438:18–24
12. Kim JI, Kim HY, Inamura T, Hosoda H, Miyazaki S (2005)
Shape memory characteristics of Ti–22Nb–(2–8) Zr (at.%)
biomedical alloys. Mater Sci Eng A 403:334–339
13. Karaman I, Sehitoglu H, Beaudoin AJ, Chumlyakov YI, Maier
HJ, Tome CN (2000) Modeling the deformation behavior of
Hadfield steel single and polycrystals due to twinning and slip.
Acta Mater 48:2031–2047
14. Kresse G, Furthmuller J (1996) Efficient iterative schemes for
ab initio total-energy calculations using a plane-wave basis set.
Phys Rev B 54:11169–11186
15. Kresse G, Hafner J (1993) Ab initio molecular dynamics for
open-shell transition metals. Phys Rev B 48:13115–13118
16. Banerjee D, Rowe RG, Hall EL (1990) Deformation of the
orthorhombic phase in Ti–Al-Nb alloys. MRS Proceedings.
Cambridge University Press, Cambridge, p 285
17. Poirier J-P (1975) On the slip systems of olivine. J Geophys Res
80:4059–4061
18. Vitek V (1968) Intrinsic stacking faults in body-centred cubic
crystals. Philos Mag 18:773–786
19. Ojha A, Sehitoglu H (2014) Twinning stress prediction in bcc
metals and alloys. Philos Mag Lett 94:647–657
20. Ojha A, Sehitoglu H, Patriarca L, Maier HJ (2014) Twin nucle-
ation in Fe-based bcc alloys—modeling and experiments. Modell
Simul Mater Sci Eng 22:075010
21. Wang J, Sehitoglu H (2014) Modelling of martensite slip and
twinning in NiTiHf shape memory alloys. Phil Mag 94:2297–2317
22. Lu G, Kioussis N, Bulatov VV, Kaxiras E (2000) The peierls-
nabarro model revisited. Philos Mag Lett 80:675–682
23. Peierls R (1940) The size of a dislocation. Proc Phys Soc 52:34
24. Carrez P, Ferre D, Cordier P (2007) Peierls-Nabarro model for
dislocations in MgSiO3 post-perovskite calculated at 120 GPa
from first principles. Philos Mag 87:3229–3247
25. Joos B, Duesbery MS (1997) The Peierls stress of dislocations: an
analytic formula. Phys Rev Lett 78:266
26. Joos B, Ren Q, Duesbery MS (1994) Peierls-Nabarro model of
dislocations in silicon with generalized stacking-fault restoring
forces. Phys Rev B 50:5890–5898
27. Schoeck G (2011) The Peierls stress in a simple cubic lattice.
Phys Status Solidi (b) 248:2284–2289
28. Bhattacharya K (2003) Microstructure of martensite: why it
forms and how it gives rise to the shape-memory effect. Oxford
University Press, Oxford
29. Saburi T, Nenno S (1981) The shape memory effect and related
phenomena. Solid to solid phase transformations. The Metallur-
gical Society of AIME, New York, pp 1455–1479
30. Inamura T, Hosoda H, Wakashima K, Miyazaki S (2005) Ani-
sotropy and temperature dependence of Young’s modulus in
textured TiNbAl biomedical shape memory alloy. Mater Trans
46:1597–1603
Shap. Mem. Superelasticity
123