Embed Size (px)
Citation preview
Journal of Business and Economics, ISSN 2155-7950, USA February 2014, Volume 5, No. 2, pp. 142-161 Academic Star Publishing Company, 2014 http://www.academicstar.us
142
Small and Medium Enterprises Landscape in Egypt:
New Facts from a New Dataset*
Hala El-Said, Mahmoud Al-Said, Chahir Zaki
(Faculty of Economics and Political Science, Cairo University, Cairo, Egypt)
Abstract: Small and medium sized enterprises (SMEs) have usually been perceived as a dynamic force for
sustained economic growth and job creation in developing countries. In Egypt, despite banking reforms that have
been launched in 2004, the ability of SMEs to more easily access suitable and sufficient means of finance has
always been considered a major obstacle facing many SMEs. For this reason, and in order to be able to extend the
financial services provided to this segment and increase the benefits of the banking reform, the Central Bank of
Egypt launched in December 2008 an initiative, as an integral part of the Second Phase of the Banking Sector
Reform Program (2008-2011), to enhance SMEs access to finance and banking services. In this paper, we present
a descriptive analysis of the SMEs landscape in Egypt relying on this extensive census. The main findings of the
census show that there is a high concentration of SMEs at different levels. First, the geographical distribution of
SMEs is significantly skewed since almost half of them are concentrated in three governorates Sharkeya, Cairo
and Gharbeya. Second, they are chiefly operating in two economic activities, namely manufacturing and trade.
Third, a very few firms are exporting. Finally, financial services seem to be under-utilized by SMEs as only 50
percent are dealing with banks and benefiting from an improved access to finance.
Key words: SMEs; access to finance; Egypt
JEL codes: D2, G21, P42
1. Introduction
Micro, small and medium sized enterprises (SMEs) have usually been perceived as a dynamic force for
sustained economic growth and job creation in developing countries. From a social viewpoint, SMEs secure
livelihood for a large and ever expanding segment of the population. In Egypt, there are around 2.5 Million SMEs
representing 75% of the total employed workforce and 99% of non-agricultural private sector establishments.
Despite their importance, they are still facing several problems, in particular access to finance which a typical
challenge in developing countries. In fact, 70% of non-OECD countries report SME financing gap compared to 30%
in OECD ones. Therefore, reducing this SMEs financing gap in low-income countries should increase the
* An empirical version of this paper entitled “Access to Finance and Financial Problems of SMEs: Evidence from Egypt” in the International Journal of Entrepreneurship and Small Business, Vol. 20, No. 3, pp. 286-309.
Hala El Said, Professor of Economics and Dean of the Faculty of Economics and Political Science, Cairo University; research areas: financial sector, privatization and economic reform. E-mail: [email protected].
Mahmoud Al-Said, Associate Professor of Statistics, Cairo University; research areas: statistics and quality control. E-mail: [email protected].
Chahir Zaki, Assistant Professor of Economics, Cairo University; research areas: international trade, modeling and macroeconomics. E-mail: [email protected].
Small and Medium Enterprises Landscape in Egypt: New Facts from a New Dataset
143
incentive of SMEs creation and consequently improve economic growth and increase job creation. In addition,
improving the access to finance of SMEs is significantly important in promoting entrepreneurship and innovation.
In Egypt, despite banking reforms that have been launched in 2004, the ability of SMEs to more easily access
suitable and sufficient means of finance has always been considered a major obstacle facing many SMEs (Egyptian
Banking Institute, 2009). It is worthy to mention that, from a supply point of view, the majority of banks are
becoming more risk averse towards SMEs, especially due to a wide spread notion that financing SMEs is risky and
that serving them requires high transaction costs which makes them less profitable than larger companies (El Said
et al., 2013).
For this reason, and in order to be able to extend the financial services provided to this segment and increase
the benefits of the banking reform, establishing a database for SMEs to serve bankers as well as policy makers
seems to be an important priority. Hence, the Central Bank of Egypt launched in December 2008 an initiative, as
an integral part of the Second Phase of the Banking Sector Reform Program (2008-2011), to enhance SMEs access
to finance and banking services. In this respect, and due to the importance of the availability of timely and
accurate information, the Central Bank of Egypt (CBE) and the Egyptian Banking Institute (EBI) commissioned
the Central Agency for Public Mobilization and Statistics (CAPMAS) to conduct an SME nation-wide census,
fully focusing on value added formal economic activities on a full census basis. The Center of Surveys and
Statistical Applications (CSSA) at the Faculty of Economics and Political Science, Cairo University undertook the
project on- site quality control. This survey includes quantitative and qualitative characteristics of each company
or unit. This includes identifying the number of employees, legal status, economic activity, level of exports, sales
turnover, invested capital and the problems facing each company in dealing with banks, etc.
The descriptive analysis of this paper is largely inspired from a companion paper (El-Said et al., 2013) in
which we conduct an empirical analysis of the determinants of access to finance of SMEs in Egypt. Yet, the
contribution of this paper is that it provides a much more detailed descriptive analysis at several fronts: access to
finance, exports, regional location, economic sectors and factors of production. The main findings of the census
show that there is a high concentration of SMEs at different levels. First, the geographical distribution of SMEs is
significantly skewed since almost half of them are concentrated in three governorates (Sharkeya, Cairo &
Gharbeya). Second, they are chiefly operating in two economic activities, namely manufacturing and trade. Third,
a very few firms are exporting. Finally, financial services seem to be under-utilized by those firms as only 50
percent are dealing with banks and benefiting from an improved access to finance. It is worthy to mention that
those financial services are also concentrated in the same governorates and the same economic activities that have
been mentioned above.
The paper is organized as follows: Section 2 presents some stylized facts regarding the banking sector reform
in Egypt. Section 3 shows the questionnaire design. Section 4 presents a landscape of SMEs characteristics using
the firm-level data that have been collected. Section 5 focuses on SMEs and their access to finance. Finally,
section 6 concludes and presents some policy implications.
2. Banking Reform in Egypt
The Central Bank of Egypt in 2004 adopted a reform program that aims at building solid infrastructure and
more efficient and sound banking sector. Although the global financial crisis led to many negative repercussions
on several world economies, the Egyptian banking sector weathered the negative repercussions due to the
Small and Medium Enterprises Landscape in Egypt: New Facts from a New Dataset
144
successful reform program that have launched in 2004. Indeed, as it was mentioned by the World Bank (2009)
“the Egyptian financial sector is the most far reaching, substantive and comprehensive drive toward financial
sector strengthening so far in Egypt-and indeed in any other country of the Middle East and North Africa region”.
This reform has been implemented in two phases. The first phase had three main pillars: first, strengthening
the legal, regulatory and supervisory framework; second, consolidating the banking sector and increasing private
participation within banking assets and finally the financial, operational and institutional restructuring of
public-sector banks. Those reforms led to a robust, solid and well capitalized banks (see Table 1), as banks
decreased from 57 to 39; assets increased by 88% to reach EGP 1.1 billion in 2008 up from EGP 0.57 billion in
2003; total deposits increased by 85% over the same period; capital adequacy ratio increased from 12.2% to reach
15.1% and total net worth increased by more than 100% from EGP 32 billion to EGP 75 billion.
Table 1 Banking Aggregates before and after 2004 Reform
LE million (as at June) 2003 2008 % change
Total Assets 577,938 1,083,311 + 87.7%
Total Deposits 403,144 747,199 + 85,3%
Loans & Discounts 284,722 401,425 + 41.2%
Capital & Reserves 29,960 53,436 +82.7%
Source: Central Bank of Egypt.
The second phase of the banking sector reform program that started in 2009 aims at deepening the Egyptian
banking sector and enhancing its efficiency and competitiveness through enhancing Access to Financial Services,
continuing the strengthening of the regulatory and supervisory framework through the implementation of Basel
II/III and enhancing the implementation of Corporate Governance rules and regulations. Those reforms increased
the loans-deposits ratio reaching 54%, average loans-GDP ratio reaching 49.4% and average deposits-GDP ratio
reaching 90%. Those figures are much higher than the world average in 2008.
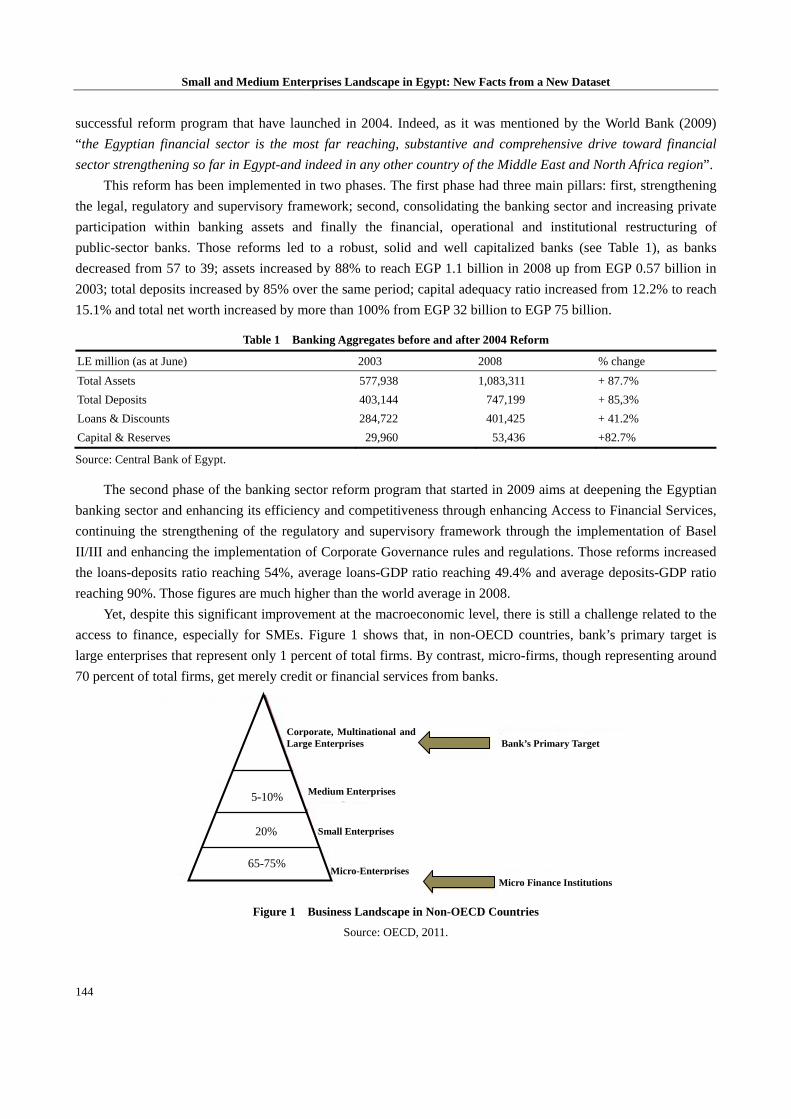
Yet, despite this significant improvement at the macroeconomic level, there is still a challenge related to the
access to finance, especially for SMEs. Figure 1 shows that, in non-OECD countries, bank’s primary target is
large enterprises that represent only 1 percent of total firms. By contrast, micro-firms, though representing around
70 percent of total firms, get merely credit or financial services from banks.
Figure 1 Business Landscape in Non-OECD Countries
Source: OECD, 2011.
Micro-Enterprises
Small Enterprises
1%
5-10%
20%
65-75%
Corporate, Multinational andLarge Enterprises Bank’s Primary Target
Medium Enterprises
Micro Finance Institutions
Small and Medium Enterprises Landscape in Egypt: New Facts from a New Dataset
145
For this reason, and in order to be able to extend the financial services provided to this segment and increase
the benefits of the banking reform, establishing a database for SMEs to serve bankers as well as policy makers
seems to be an important priority. Hence, as it was mentioned before, the Central Bank of Egypt launched in
December 2008 an initiative, as an integral part of the Second Phase of the Banking Sector Reform Program
(2008-2011), to enhance SMEs access to finance and banking services. The next section provides more details
about this census.
3. Questionnaire Design
3.1 Structure
The questionnaire includes four main categories of questions.
First, it contains some general information regarding the legal status of the firm (whether it is a partnership, a
limited liability firm, branch of a foreign firm, sole proprietorship, etc.). In addition, since only formal firms are
taken into account, the interviewee should mention the number and the date of his industrial and commercial
registration.
Second, it includes some information related to the firm endowments, such as the number of workers (less
than 20; from 20 to 34; from 35 to 50 and more than 51) and the value of the capital.
Third, the questionnaire is categorizing firms according to the sales turnover which is the variable banks
consider the most while giving loans. In addition, this section includes some questions showing whether the firm
exports or not, the destination of exports (Arab countries, African countries, other) and the share of exports to total
sales (less than 25%, from 25 to 50% and more than 50%).
Fourth, the questionnaire contains a final module on access to finance by asking the interviewee:
whether she/he deals with banks or not,
whether she/he benefits from some banking facilities or not,
whether she/he faces problems with banks or not and if yes, she has to determine the type of the problems
(high interests, commissions and administrative expenses; banks ask for a lot of collaterals; procedures are lengthy
and complicated; banks ask for a lot of documents; others)
3.2 Scope
The census covers all SMEs in Egypt, identified here as every company or economic activity:
That is formally registered: therefore we exclude informal firms which represent almost 20 percent in Egypt
That employs five employees or more.
That has a significant economic value added: thus activities of limited economic value added have been
excluded, namely Barber shops, beauty salons and kiosks were excluded from the survey.
In other words, three filters have been taken into account in order to include only registered firms with more
than 5 employees and having a significant value-added. Based on these criteria, the census ended-up by including
around 36,492 firms.
3.3 Methodology
First, it is worth to mention that the framework used is that developed by the Central Agency for Public
Mobilization and Statistics (CAPMAS) in 2006 adding new establishments and excluding activities of limited
economic value added. Second, the primary data was obtained through conducting face to face interviews with
SMEs, using a well-structured questionnaire designed jointly by Central Bank of Egypt (CBE)/Egyptian Banking
Small and Medium Enterprises Landscape in Egypt: New Facts from a New Dataset
146
Institute (EBI) committee in consultation with an experienced statistician to measure both quantitative and
qualitative factors. The census was done through seven phases to guarantee the quality of the collected data
Pre-testing the questionnaire: A pretest of the questionnaire was conducted to a sample of SMEs in “El
Qualiobia” governorate whereby some modifications and repositioning of sequence of questions was made
according to the pretest results.
Training of CAPMAS researchers: Extensive training sessions were conducted to all CAPMAS field
researchers to ensure their understanding of the questionnaire and the approach in conducting the interviews. The
training was conducted jointly by CAPMAS and the Center of Surveys and Statistical Applications (CSSA) at the
Faculty of Economics and Political Science under the supervision of CBE and EBI.
Pilot: After collecting the data of the pilot (that was conducted in “El-Sharkia” governorate in April 2010) the
data collected was analyzed, verified and validated, accordingly, some activities of limited economic value added
were excluded throughout the survey.
Collecting the data: Data was collected through face-to-face interviews conducted by CAPMAS researches
using the developed questionnaire.
Quality control: Two different quality control teams were assigned to ensure the validity and accuracy of the
data collection process
On-site QC: Undertaken by the (CSSA) that was responsible for monitoring and controlling the process of
data collection in the field on a daily basis.
Off-site QC: Undertaken by a joint team from CBE and EBI responsible for verification and quality
controlling the data entry process with random checks.
4. Landscape of SMEs in Egypt
4.1 Legal Form
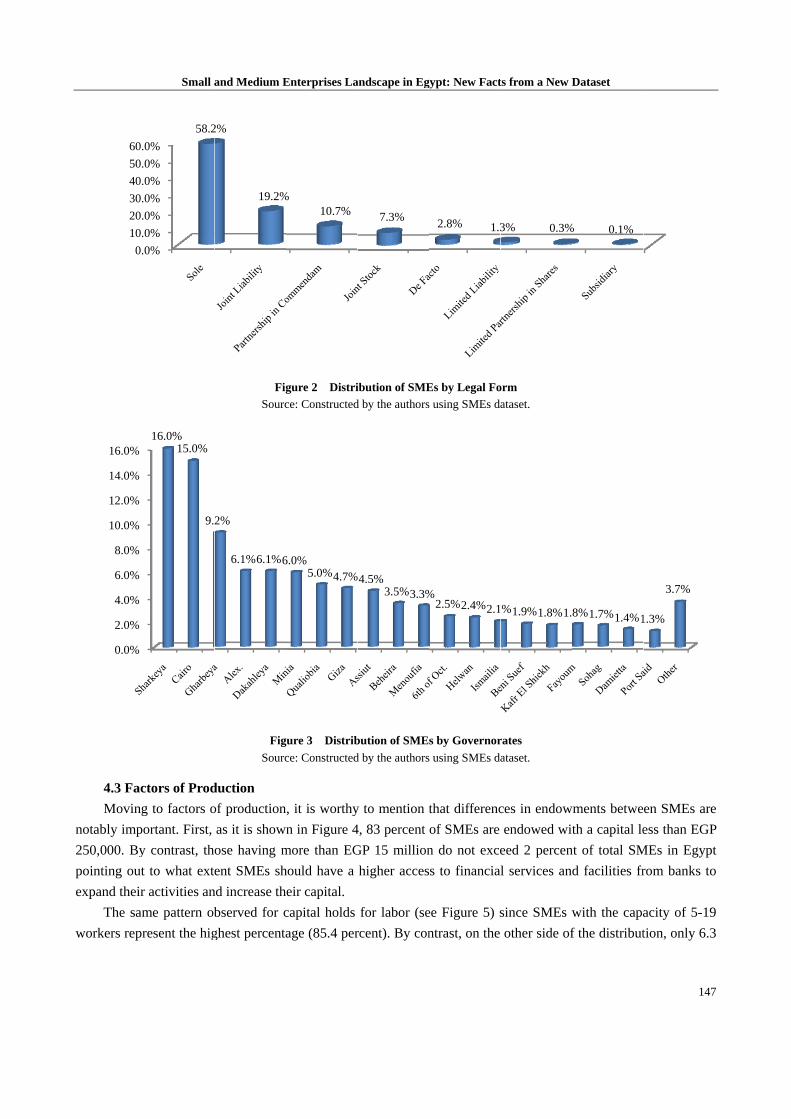
Figure 2 shows the distribution of SMEs according to the legal form. SMEs adopt chiefly a
sole-proprietorship (that represents almost 60 percent of total firms) given the fact that it is the easiest to be
created. Those firms are owned and run by one individual and in which there is no legal distinction between the
owner and the business. The owner receives all profits (subject to taxation specific to the business) and has
unlimited responsibility for all losses and debts. Its advantages are related to the fact that entrepreneurs have the
ability to limit risk to investors. Sole proprietorships also have the least government rules and regulations affecting
it which fosters their creation by entrepreneurs. The remaining 40 percent are distributed among joint liability,
partnership in commendams, joint stock, de facto, limited liability, limited partnership in shares and subsidiaries.
4.2 Geographical Location
It is worthy to note that SMEs are highly skewed at the geographical level since almost half of them is
concentrated in the three governorates of Sharkeya, Cairo and Gharbeya (see Figure 3). This may be explained by
higher externalities coming from other firms which are located in large governorates that are located in urban
regions. Similarly, access to road and to transportation of goods positively and significantly affects firms’
productivity as they allow firms to better produce and market their products or services to a wider scope of clients.
Finally, since other governorates have not a significant share of SMEs, more attention should be attribute to them
in order to improve their infrastructure and therefore to allow firms to be established there.
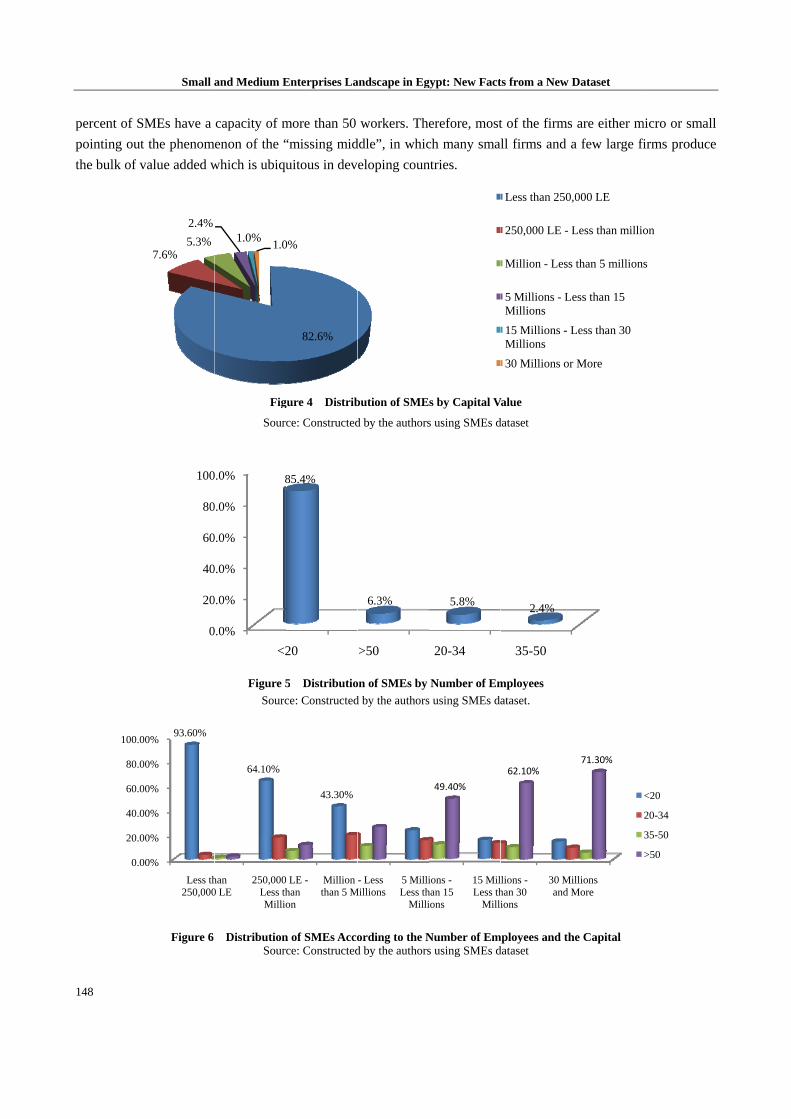
4.3 Fac
Moving
notably imp
250,000. By
pointing out
expand their
The sam
workers repr
0.
10.
20.
30.
40.
50.
60.
0.0%
2.0%
4.0%
6.0%
8.0%
10.0%
12.0%
14.0%
16.0%
Small a
ctors of Prod
g to factors o
ortant. First,
y contrast, th
t to what ext
r activities an
me pattern ob
resent the hig
.0%
.0%
.0%
.0%
.0%
.0%
.0%
58.2
16.0%15.0%
9.
and Medium E
Fig
Sourc
Fig
Sourc
duction
of production
as it is show
ose having m
ent SMEs sh
nd increase th
bserved for c
ghest percenta
2%
19.2%
2%
6.1%6.1%6
Enterprises La
gure 2 Distri
ce: Constructed
gure 3 Distrib
ce: Constructed
n, it is worthy
n in Figure 4
more than EG
hould have a
eir capital.
capital holds
age (85.4 per
%10.7%
6.0%5.0%4.7%
andscape in Eg
ibution of SME
d by the authors
bution of SME
d by the authors
y to mention t
4, 83 percent
GP 15 million
higher acces
for labor (se
rcent). By con
7.3%
%4.5%3.5%3.3%
gypt: New Fact
Es by Legal Fo
s using SMEs da
s by Governor
s using SMEs da
that differenc
of SMEs are
n do not exce
s to financia
ee Figure 5) s
ntrast, on the
2.8% 1.3
%2.5%2.4%2.1
ts from a New D
orm
ataset.
rates
ataset.
ces in endow
endowed wi
eed 2 percen
l services an
since SMEs w
other side of
3% 0.3%
%1.9%1.8%1.
Dataset
wments betwe
th a capital le
nt of total SM
d facilities fr
with the capa
f the distribut
% 0.1%
8%1.7%1.4%1
147
en SMEs are
ess than EGP
MEs in Egypt
rom banks to
acity of 5-19
tion, only 6.3
1.3%
3.7%
7
e
P
t
o
9
3
148
percent of S
pointing out
the bulk of v
0.0
20.0
40.0
60.0
80.0
100.0
Small a
SMEs have a
t the phenom
value added w
Figure 6
7.6%5.3%
2.4%
0
20
40
60
80
100
00%
00%
00%
00%
00%
00%
Less th250,000
93.60%
and Medium E
capacity of m
menon of the “
which is ubiqu
Fig
Sour
Figure 5
Sourc
DistributionSour
1.0%1.0
0.0%
0.0%
0.0%
0.0%
0.0%
0.0%
<2
8
han 0 LE
250,000Less thMillio
64.10%
Enterprises La
more than 50
“missing mid
uitous in dev
gure 4 Distrib
ce: Constructed
5 Distributio
ce: Constructed
n of SMEs Accoce: Constructed
82.6%
0%
20
85.4%
0 LE -han on
Million than 5 M
43.30%
andscape in Eg
workers. The
ddle”, in whic
eloping coun
bution of SME
d by the authors
on of SMEs by
d by the authors
ording to the Nd by the authors
>50
6.3%
- Less Millions
5 MilliLess th
Milli
gypt: New Fact
erefore, most
ch many sma
ntries.
s by Capital V
s using SMEs d
Number of Em
s using SMEs da
Number of Ems using SMEs d
20-34
5.8%
ions -han 15 ions
15 MilLess th
Milli
49.40%
ts from a New D
t of the firms
ll firms and a
Value
dataset
mployees
ataset.
mployees and thdataset
Less than 250
250,000 LE - L
Million - Less
5 Millions - LMillions
15 Millions - LMillions
30 Millions or
35-50
2.4%
llions -han 30 ions
30 Miand M
62.10%
Dataset
s are either m
a few large fi
he Capital
,000 LE
Less than millio
s than 5 million
ess than 15
Less than 30
r More
illions More
71.30%
micro or small
firms produce
on
s
<20
20-34
35-50
>50
l
e
Figure
conclude tha
the coefficie
especially m
there are som
Table 2
Activities
Agriculture
Manufacturing
Trade
Food & Bever
Health
Construction &
Other
Source: Const
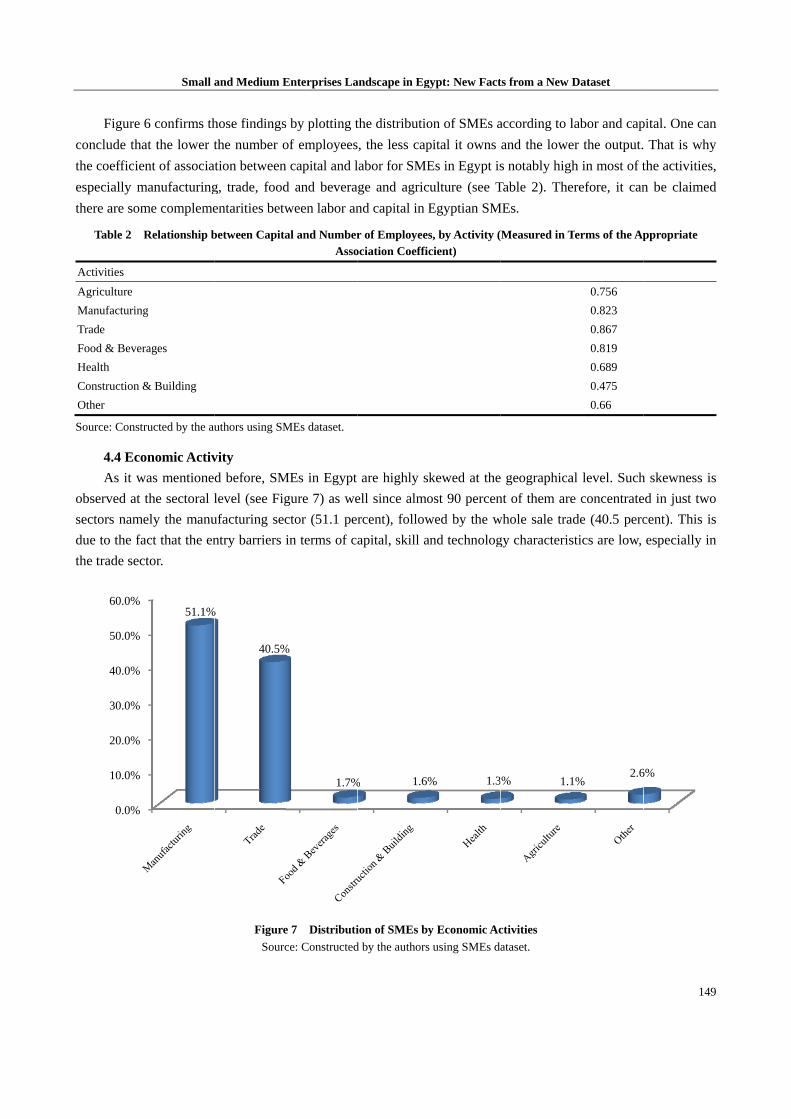
4.4 Eco
As it w
observed at
sectors nam
due to the fa
the trade sec
0.0%
10.0%
20.0%
30.0%
40.0%
50.0%
60.0%
Small a
6 confirms th
at the lower t
ent of associa
manufacturing
me compleme
Relationship b
g
rages
& Building
tructed by the au
onomic Activ
was mentione
the sectoral l
ely the manu
act that the en
ctor.
51.1%
and Medium E
hose findings
the number o
ation between
g, trade, food
entarities betw
between Capita
uthors using SM
vity
d before, SM
level (see Fig
ufacturing sec
ntry barriers i
Figure
Sourc
%
40.5%
Enterprises La
s by plotting t
of employees
n capital and l
d and bevera
ween labor an
al and NumberAsso
MEs dataset.
MEs in Egypt
gure 7) as we
ctor (51.1 per
in terms of ca
e 7 Distributi
ce: Constructed
%
1.7%
andscape in Eg
the distributio
s, the less cap
labor for SME
ge and agric
nd capital in E
r of Employeesociation Coeffic
are highly sk
ell since almo
rcent), follow
apital, skill a
ion of SMEs by
d by the authors
% 1.6%
gypt: New Fact
on of SMEs a
pital it owns
Es in Egypt is
ulture (see T
Egyptian SM
s, by Activity (cient)
kewed at the
ost 90 percen
wed by the w
and technolog
y Economic Ac
s using SMEs da
% 1.3
ts from a New D
according to l
and the lowe
s notably high
Table 2). The
MEs.
(Measured in T
e geographica
nt of them are
whole sale tra
gy characteris
ctivities
ataset.
% 1.1
Dataset
labor and cap
er the output.
h in most of t
erefore, it can
Terms of the Ap
0.756
0.823
0.867
0.819
0.689
0.475
0.66
al level. Such
e concentrate
ade (40.5 perc
stics are low,
1%2.6
149
pital. One can
That is why
the activities,
n be claimed
ppropriate
h skewness is
ed in just two
cent). This is
especially in
6%
9
n
y
,
d
s
o
s
n
150
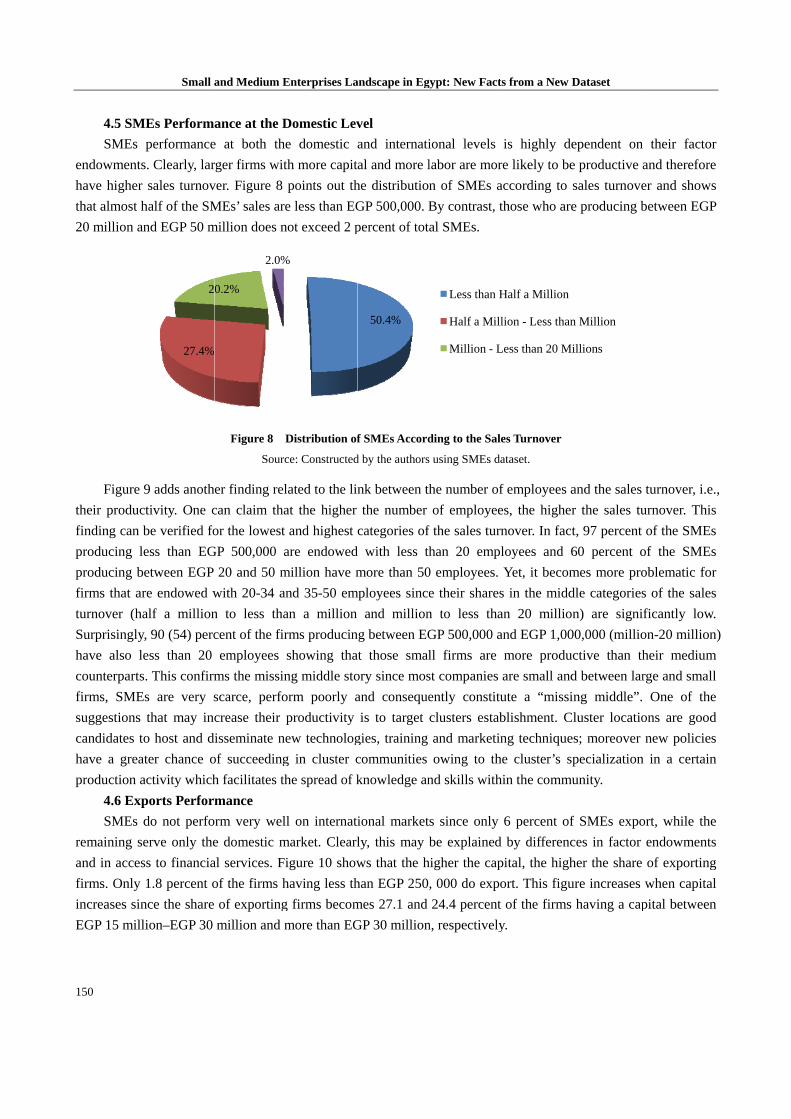
4.5 SM
SMEs
endowments
have higher
that almost h
20 million a
Figure
their produc
finding can b
producing l
producing b
firms that ar
turnover (ha
Surprisingly
have also l
counterparts
firms, SME
suggestions
candidates t
have a grea
production a
4.6 Exp
SMEs
remaining s
and in acces
firms. Only
increases sin
EGP 15 mill
Small a
MEs Perform
performance
s. Clearly, lar
sales turnov
half of the SM
and EGP 50 m
9 adds anoth
ctivity. One c
be verified fo
ess than EG
between EGP
re endowed w
alf a million
y, 90 (54) perc
ess than 20
s. This confirm
Es are very s
that may inc
o host and d
ater chance o
activity which
ports Perfor
do not perfo
erve only the
ss to financia
1.8 percent o
nce the share
lion–EGP 30
27.4%
2
and Medium E
ance at the D
e at both the
rger firms wit
ver. Figure 8
MEs’ sales are
million does n
Figure 8 D
Sourc
er finding rel
can claim tha
or the lowest
GP 500,000 a
20 and 50 m
with 20-34 an
n to less tha
cent of the fir
employees
ms the missin
scarce, perfo
crease their p
isseminate ne
of succeeding
h facilitates th
mance
rm very wel
e domestic m
al services. Fi
of the firms h
of exporting
million and m
0.2%
2.0%
Enterprises La
Domestic Lev
e domestic
th more capit
points out th
e less than EG
not exceed 2 p
Distribution of
ce: Constructed
lated to the lin
at the higher
and highest
are endowed
million have m
nd 35-50 em
an a million
rms producin
showing tha
ng middle sto
orm poorly a
productivity
ew technolog
g in cluster c
he spread of k
l on internati
market. Clearl
igure 10 show
having less th
g firms becom
more than EG
%
andscape in Eg
vel
and internati
al and more l
he distributio
GP 500,000. B
percent of tot
f SMEs Accord
d by the authors
nk between th
the number
categories of
d with less th
more than 50
mployees since
and million
ng between EG
at those smal
ory since mos
and conseque
is to target
gies, training
communities
knowledge an
ional market
ly, this may
ws that the h
han EGP 250
mes 27.1 and
GP 30 million
50.4%
gypt: New Fact
ional levels
labor are mor
n of SMEs a
By contrast, t
al SMEs.
ding to the Sal
s using SMEs da
he number of
of employee
f the sales tur
han 20 emp
0 employees.
e their shares
n to less tha
GP 500,000 a
ll firms are
st companies
ently constitu
clusters estab
and marketin
owing to th
nd skills with
s since only
be explained
higher the cap
, 000 do expo
24.4 percent
n, respectively
Less than H
Half a Mill
Million - L
ts from a New D
is highly de
re likely to be
according to
those who are
es Turnover
ataset.
f employees a
es, the higher
rnover. In fact
loyees and 6
Yet, it becom
s in the midd
an 20 millio
and EGP 1,00
more produ
are small and
ute a “missi
blishment. C
ng technique
he cluster’s s
hin the commu
6 percent of
d by differenc
pital, the high
ort. This figu
t of the firms
y.
Half a Million
lion - Less than
Less than 20 M
Dataset
ependent on
e productive a
sales turnove
e producing b
and the sales
r the sales tu
t, 97 percent
60 percent o
mes more pro
dle categories
n) are signi
00,000 (millio
uctive than th
d between lar
ing middle”.
Cluster locatio
es; moreover
pecialization
unity.
f SMEs expo
ces in factor
her the share
ure increases
having a cap
n Million
illions
their factor
and therefore
er and shows
between EGP
turnover, i.e.
urnover. This
of the SMEs
of the SMEs
oblematic for
s of the sales
ficantly low.
on-20 million
heir medium
rge and small
One of the
ons are good
new policies
n in a certain
ort, while the
endowments
of exporting
when capital
pital between
r
e
s
P
.,
s
s
s
r
s
.
n)
m
l
e
d
s
n
e
s
g
l
n
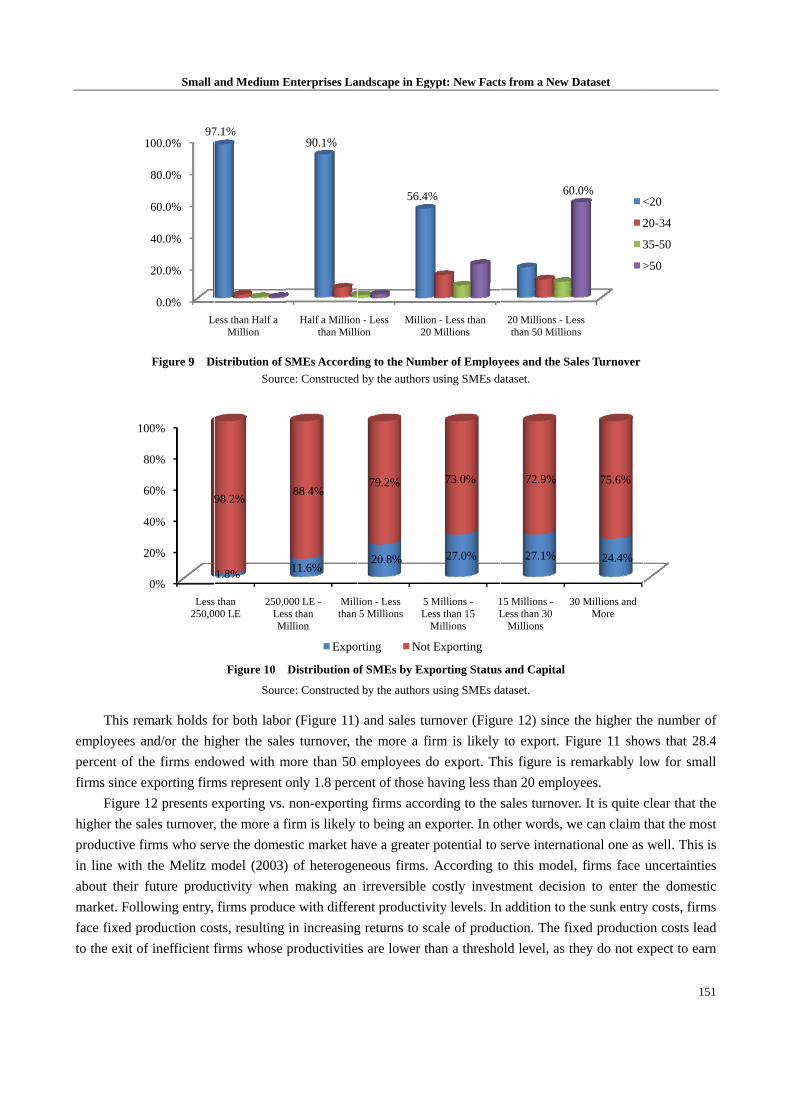
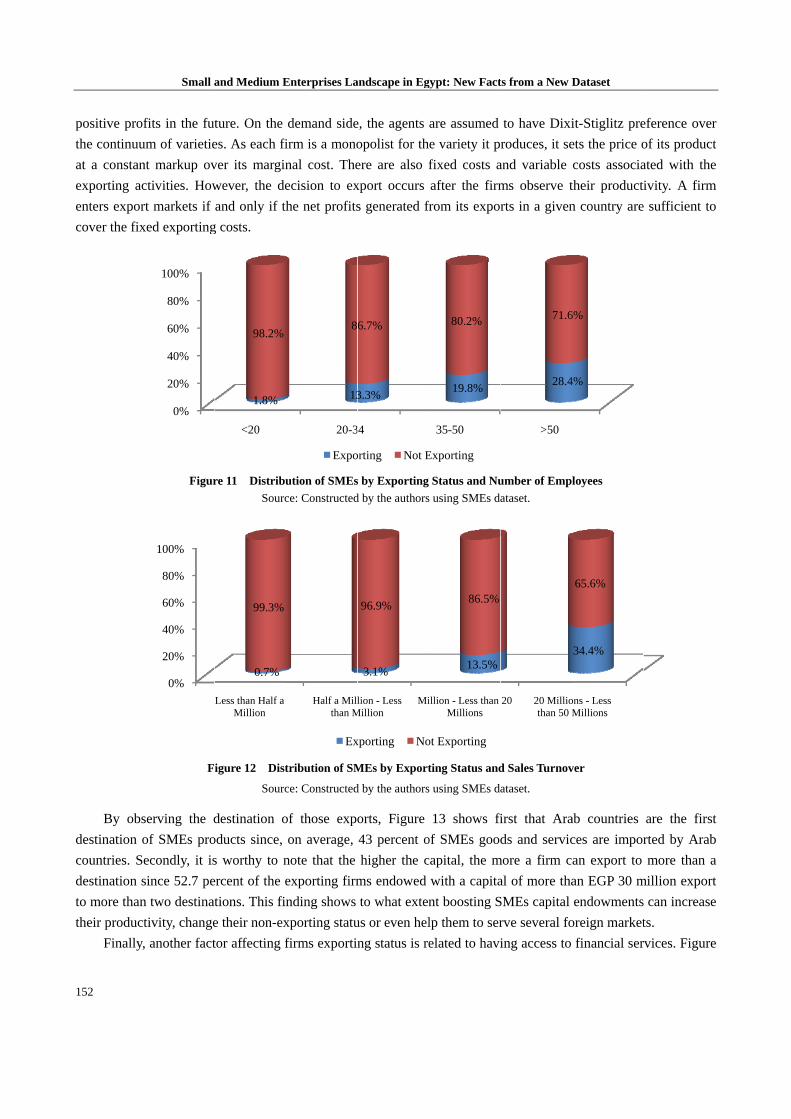
This re
employees a
percent of th
firms since e
Figure
higher the sa
productive f
in line with
about their
market. Foll
face fixed pr
to the exit o
1
Small a
Figure 9 D
emark holds f
and/or the hi
he firms end
exporting firm
12 presents e
ales turnover,
firms who ser
the Melitz m
future produ
lowing entry,
roduction cos
of inefficient f
0.0%
20.0%
40.0%
60.0%
80.0%
100.0%
L
97
0%
20%
40%
60%
80%
00%
Less250,0
9
and Medium E
istribution of S
Sourc
Figure 10
Sourc
for both labo
gher the sale
dowed with m
ms represent o
exporting vs.
, the more a f
rve the domes
model (2003)
uctivity when
firms produc
sts, resulting
firms whose
Less than Half a Million
7.1%
s than 00 LE
250,0LesM
1.8%
98.2%
Enterprises La
SMEs Accordi
ce: Constructed
Distribution o
ce: Constructed
r (Figure 11)
es turnover, t
more than 50
only 1.8 perc
non-exportin
firm is likely
stic market h
) of heteroge
n making an
ce with differ
in increasing
productivitie
Half a Millionthan Milli
90.1%
000 LE -ss than
Million
Millthan
11.6%
88.4%
Expo
andscape in Eg
ing to the Num
d by the authors
of SMEs by Ex
d by the authors
) and sales tu
the more a fi
employees d
cent of those h
ng firms acco
to being an e
have a greater
eneous firms.
irreversible
rent productiv
g returns to sc
s are lower th
n - Less ion
Millio20
56.4%
lion - Less 5 Millions
5 Le
20.8%
79.2%
orting Not
gypt: New Fact
mber of Employ
s using SMEs da
porting Status
s using SMEs da
urnover (Figu
firm is likely
do export. Th
having less th
ording to the
exporter. In ot
r potential to
According t
costly inves
vity levels. In
cale of produ
han a thresho
on - Less than 0 Millions
%
Millions -ess than 15 Millions
1L
27.0%
73.0%
t Exporting
ts from a New D
yees and the Sa
ataset.
s and Capital
ataset.
ure 12) since
to export. F
his figure is r
han 20 emplo
sales turnove
ther words, w
serve interna
to this model
stment decisi
n addition to t
uction. The fi
old level, as t
20 Millions - Lthan 50 Million
60
15 Millions -Less than 30
Millions
3
27.1%
72.9%
Dataset
ales Turnover
the higher th
Figure 11 sho
remarkably lo
oyees.
er. It is quite
we can claim
ational one as
l, firms face
on to enter t
the sunk entry
ixed producti
they do not ex
ess ns
0.0%<
2
3
>
30 Millions and More
24.4%
75.6%
151
he number of
ows that 28.4
ow for small
clear that the
that the most
well. This is
uncertainties
the domestic
y costs, firms
on costs lead
xpect to earn
<20
20-34
35-50
>50
f
4
l
e
t
s
s
c
s
d
n
152
positive pro
the continuu
at a constan
exporting ac
enters expor
cover the fix
By obs
destination o
countries. S
destination s
to more than
their produc
Finally,
Small a
fits in the fut
um of varietie
nt markup ov
ctivities. How
rt markets if
xed exporting
Figur
F
serving the d
of SMEs pro
econdly, it is
since 52.7 pe
n two destinat
tivity, change
, another fact
0%
20%
40%
60%
80%
100%
0%
20%
40%
60%
80%
100%
and Medium E
ture. On the
es. As each fi
ver its margin
wever, the de
and only if th
g costs.
re 11 Distribu
Sourc
igure 12 Dist
Sourc
destination o
oducts since,
s worthy to n
ercent of the e
tions. This fin
e their non-ex
tor affecting f
<20
1.8%
98.2%
Less than Half a Million
0.7%
99.3%
Enterprises La
demand side
irm is a mono
nal cost. The
ecision to ex
he net profits
ution of SMEs
ce: Constructed
tribution of SM
ce: Constructed
of those expo
on average,
note that the
exporting firm
nding shows
xporting statu
firms exportin
20-3
13
8
Expo
Half a Millthan M
Ex
andscape in Eg
e, the agents
opolist for th
ere are also f
xport occurs
s generated fr
s by Exporting
d by the authors
MEs by Export
d by the authors
orts, Figure
43 percent o
higher the c
ms endowed
to what exten
us or even hel
ng status is re
4
3.3%
6.7%
orting Not E
lion - Less Million
Mi
3.1%
96.9%
xporting No
gypt: New Fact
are assumed
e variety it p
fixed costs a
after the firm
from its expor
Status and Nu
s using SMEs da
ting Status and
s using SMEs da
13 shows fi
of SMEs good
capital, the m
with a capita
nt boosting S
lp them to ser
elated to havi
35-50
19.8%
80.2%
Exporting
illion - Less than Millions
13.5%
86.5%
ot Exporting
ts from a New D
to have Dixi
roduces, it se
and variable
ms observe t
rts in a given
umber of Emp
ataset.
d Sales Turnov
ataset.
first that Ara
ds and servic
more a firm c
al of more tha
SMEs capital
rve several fo
ing access to
>50
28.4
71.6
20 20 Milliothan 50 M
Dataset
it-Stiglitz pre
ets the price o
costs associa
their product
n country are
loyees
ver
ab countries
ces are impor
an export to
an EGP 30 m
endowments
oreign market
financial ser
4%
6%
ons - Less Millions
34.4%
65.6%
eference over
of its product
ated with the
ivity. A firm
e sufficient to
are the first
rted by Arab
more than a
million export
s can increase
ts.
rvices. Figure
r
t
e
m
o
t
b
a
t
e
e
14 shows th
productivity
banking faci
5. Acc
From t
government
prefer to ex
finally, bank
it is less risk
records, hav
less stable, a
and are less
registration,
0%
20%
40%
60%
80%
100%
Small a
hat 91.5 perc
y and that is w
ilities are the
Figu
cess to Fina
the SMEs’ p
and internat
xtend credit t
ks are much m
ky to provide
ve structured
are more pro
s profitable.
license, and
%
%
%
%
%
%
Less tha250,000
55
1.18.
24
A
and Medium E
cent of expo
why only larg
most produc
Figure 13 D
Sourc
ure 14 Distri
Sourc
ance
point of view
tional develo
to large corp
more trust wo
e loans for lar
information,
ne to risk, do
They suffer
tax cards) an
an LE
250,000Less tMill
.6% 5
3%.5%
1
4.5% 3
Arab Countries
Other Countrie
0%20%
40%
60%
80%
100%
Enterprises La
orting firms d
ger firms hav
tive and there
Distribution of
ce: Constructed
bution of SME
ce: Constructed
w, it is more
opment comm
orate clients
orthy than obt
rger business
are easier to
on’t have ava
from some o
nd the reliabil
0 LE -than ion
Milliothan 5
51.1%
1.5%15.2%
32.2%
s Only
es Only
Exporting
91.5%
8.5%
Dealing with B
andscape in Eg
deal with ba
ving more em
efore are the
f SMEs by Cap
d by the authors
Es by Exportin
d by the authors
e difficult fo
munities are
and connect
taining it from
ses since they
o access, are
ailable record
other problem
ity of financi
on - Less Millions
5 MLes
M
46.0%
3.0%18.3%
32.7%
No
Banks Not D
gypt: New Fact
anks. Consequ
mployees, with
most likely to
pital and Impor
s using SMEs da
ng Status and D
s using SMEs da
r SMEs to o
focusing mo
ted individua
m other sourc
y are more sta
more profita
ds, have uncle
ms such as:
ial statements
Millions -ss than 15 Millions
1L
35.3%
2.9%19.7%
42.0%
African N
Two or m
ot Exporting
44.9%
55.1%
Dealing with B
ts from a New D
uently, all th
h a larger cap
o export.
rting Country
ataset.
Dealing with B
ataset.
obtain financ
ore on micro
als that are c
es. Yet, from
able, less pro
able. By cont
ear informati
lack of busi
s, as well as th
5 Millions -Less than 30
Millions
3
38.9%
1.1%12.6%
47.4%
Non-Arab Coun
more Destinatio
anks
Dataset
hose factors
pital and hav
anks
cing from ba
o businesses;
onsidered les
m the banks p
one to risk, ha
trast, small bu
ion, are diffic
ness docume
he “financial
30 Millions and More
31.9%
2.2%13.2%
52.7%
ntries Only
ns
153
affect SMEs
ing access to
anks, as: the
banks often
ss risky; and
point of view,
ave available
usinesses are
cult to access
ents (such as
performance
3
s
o
e
n
d
,
e
e
s
s
e”
154
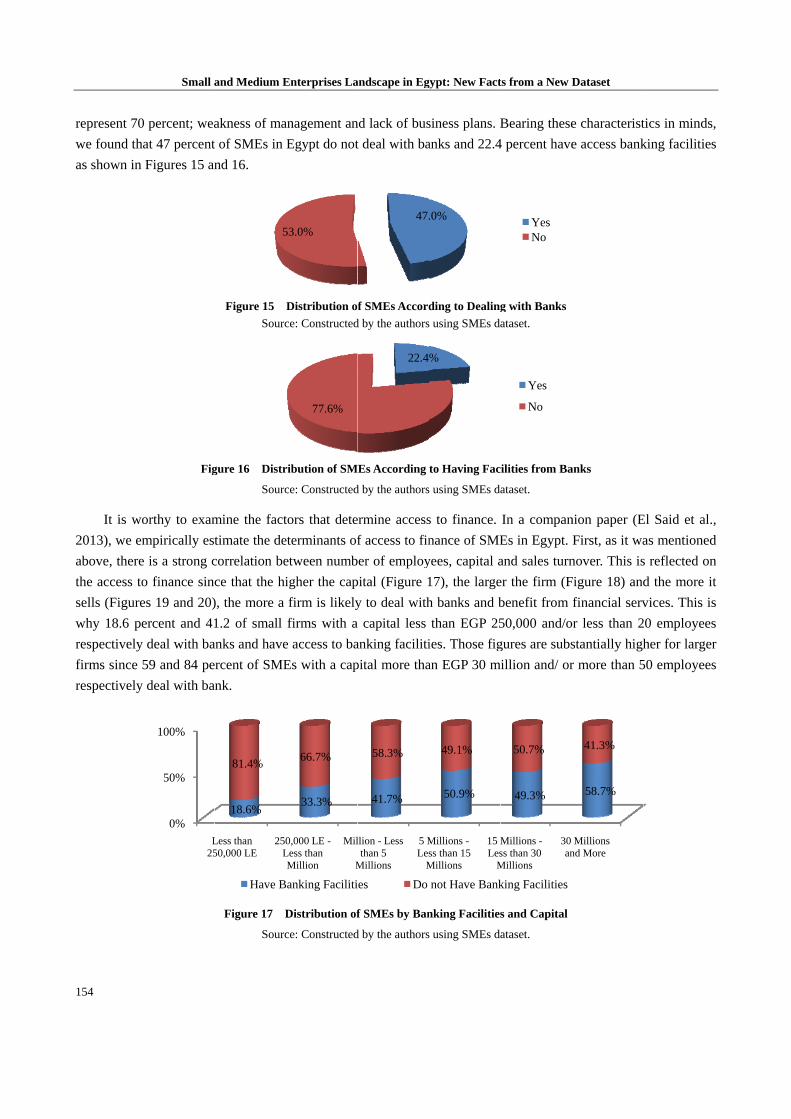
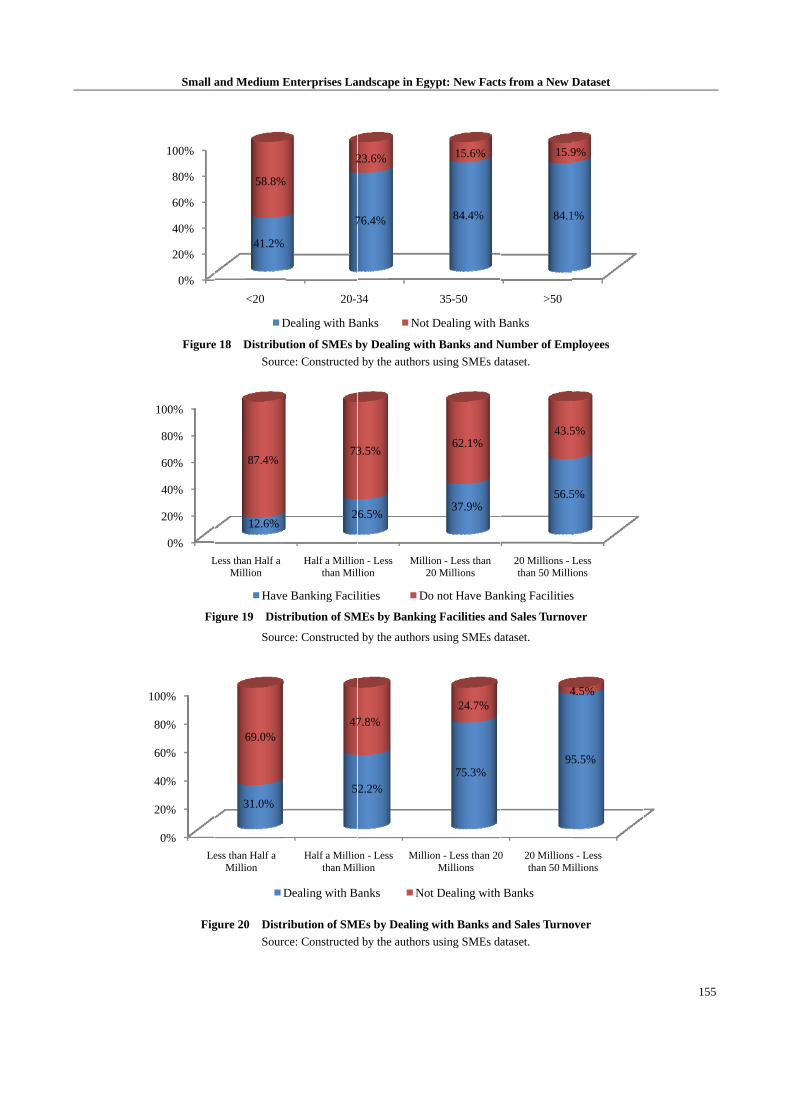
represent 70
we found th
as shown in
It is wo
2013), we em
above, there
the access to
sells (Figure
why 18.6 pe
respectively
firms since 5
respectively
Small a
0 percent; wea
at 47 percent
Figures 15 an
Fig
orthy to exam
mpirically est
e is a strong c
o finance sin
es 19 and 20)
ercent and 41
deal with ba
59 and 84 pe
deal with ba
0%
50%
100%
L25
and Medium E
akness of ma
t of SMEs in
nd 16.
Figure 15
Sourc
gure 16 Distr
Sourc
mine the fact
timate the de
correlation be
ce that the hi
), the more a
1.2 of small
anks and have
ercent of SME
ank.
Figure 17 D
Sourc
5
Less than 50,000 LE
250L
18.6%
81.4%
Have B
Enterprises La
anagement an
Egypt do not
Distribution o
ce: Constructed
ribution of SM
ce: Constructed
tors that dete
eterminants of
etween numb
igher the cap
firm is likely
firms with a
e access to ba
Es with a cap
Distribution of
ce: Constructed
53.0%
77.6%
0,000 LE -Less than Million
Mil
M
33.3%
66.7%
Banking Faciliti
andscape in Eg
nd lack of bus
t deal with ba
f SMEs Accord
d by the authors
MEs According
d by the authors
ermine access
f access to fin
ber of employ
pital (Figure 1
y to deal with
a capital less
anking faciliti
pital more tha
f SMEs by Ban
d by the authors
47.
22.4
llion - Less than 5
Millions
5 MLes
M
41.7%
58.3%
ies Do
gypt: New Fact
siness plans. B
anks and 22.4
ding to Dealing
s using SMEs da
to Having Fac
s using SMEs da
s to finance.
nance of SME
yees, capital a
17), the large
h banks and b
than EGP 25
ies. Those fig
an EGP 30 m
nking Facilities
s using SMEs da
.0%
%
Millions -ss than 15 Millions
15 MLes
M
50.9%
49.1%
not Have Bank
ts from a New D
Bearing these
4 percent have
g with Banks
ataset.
cilities from Ba
ataset.
In a compan
Es in Egypt.
and sales turn
er the firm (F
benefit from
50,000 and/o
gures are subs
million and/ or
s and Capital
ataset.
YesNo
Yes
No
Millions -ss than 30 Millions
30 an
49.3%
50.7%
king Facilities
Dataset
e characterist
e access bank
anks
nion paper (E
First, as it wa
nover. This is
Figure 18) and
financial serv
or less than 2
stantially high
r more than 5
Millions nd More
58.7%
41.3%
tics in minds,
king facilities
El Said et al.,
as mentioned
s reflected on
d the more it
vices. This is
20 employees
her for larger
50 employees
,
s
,
d
n
t
s
s
r
s
Small a
Figure
Fi
Fig
0%
20%
40%
60%
80%
100%
0%
20%
40%
60%
80%
100%
L
0%
20%
40%
60%
80%
100%
Le
and Medium E
e 18 Distribut
Sourc
igure 19 Dist
Sourc
gure 20 Distr
Sourc
<20
41.2%
58.8%
D
Less than Half a Million
12.6%
87.4%
Have
ess than Half a Million
31.0%
69.0%
D
Enterprises La
tion of SMEs b
ce: Constructed
ribution of SM
ce: Constructed
ribution of SM
ce: Constructed
20-3
7
2
Dealing with Ba
Half a Milliothan Mil
2
73
e Banking Facil
Half a Milliothan Mil
5
47
Dealing with B
andscape in Eg
by Dealing wit
d by the authors
MEs by Bankin
d by the authors
MEs by Dealing
d by the authors
34
76.4%
23.6%
anks Not
on - Less llion
Milli2
6.5%
3.5%
lities Do
on - Less llion
Milli
2.2%
7.8%
anks No
gypt: New Fact
h Banks and N
s using SMEs da
ng Facilities an
s using SMEs da
with Banks an
s using SMEs da
35-50
84.4%
15.6%
t Dealing with B
ion - Less than 20 Millions
37.9%
62.1%
o not Have Ban
ion - Less than 20Millions
75.3%
24.7%
ot Dealing with
ts from a New D
Number of Em
ataset.
d Sales Turnov
ataset.
nd Sales Turno
ataset.
>50
84.1
15.9
Banks
20 Millions -than 50 Milli
56.5
43.5
nking Facilities
0 20 Millionsthan 50 Mi
95
4
Banks
Dataset
ployees
ver
over
1%
9%
Less ions
5%
5%
s
s - Less illions
5.5%
4.5%
155
5
156
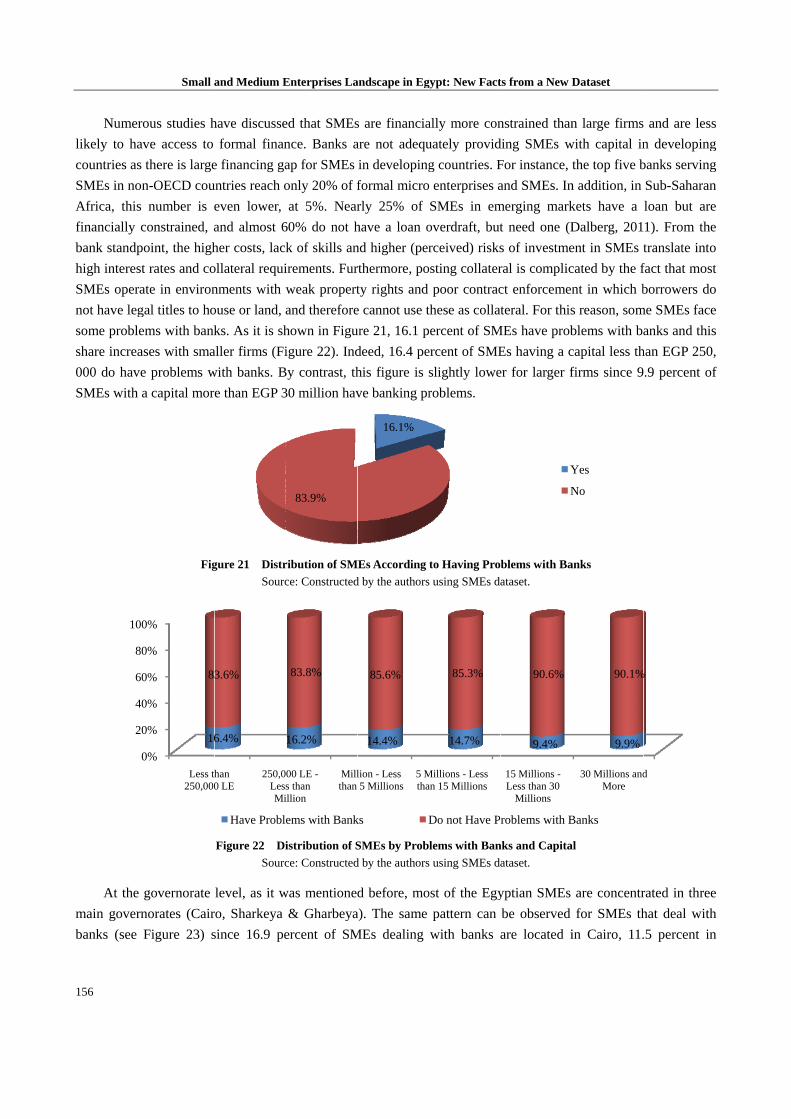
Numero
likely to hav
countries as
SMEs in non
Africa, this
financially c
bank standp
high interest
SMEs opera
not have leg
some proble
share increa
000 do have
SMEs with a
At the
main govern
banks (see
0
20
40
60
80
100
Small a
ous studies h
ve access to
there is large
n-OECD cou
number is e
constrained, a
oint, the high
t rates and co
ate in environ
gal titles to ho
ems with bank
ases with sma
e problems w
a capital mor
Fig
governorate
norates (Cair
Figure 23) s
0%
0%
0%
0%
0%
0%
Less th250,000
16
8
and Medium E
have discusse
formal finan
e financing ga
untries reach o
even lower,
and almost 6
her costs, lack
ollateral requi
nments with w
ouse or land, a
ks. As it is sh
aller firms (Fi
with banks. B
e than EGP 3
gure 21 Distr
Sourc
Figure 22 Di
Sourc
level, as it w
ro, Sharkeya
since 16.9 pe
han 0 LE
250,0LessMi
6.4%
3.6%
Have Proble
Enterprises La
ed that SMEs
nce. Banks a
ap for SMEs
only 20% of f
at 5%. Near
60% do not h
k of skills an
irements. Fur
weak propert
and therefore
hown in Figu
igure 22). Ind
By contrast, th
30 million hav
ribution of SM
ce: Constructed
istribution of S
ce: Constructed
was mentioned
& Gharbeya
ercent of SM
83.9%
00 LE -s than illion
Millthan
16.2%
83.8%
ems with Bank
andscape in Eg
s are financia
are not adequ
in developing
formal micro
rly 25% of
have a loan o
nd higher (per
rthermore, po
ty rights and
e cannot use t
ure 21, 16.1 p
deed, 16.4 pe
his figure is s
ve banking pr
MEs According
d by the authors
SMEs by Prob
d by the authors
d before, mo
a). The same
MEs dealing
16.1%
lion - Less 5 Millions
5 Mtha
14.4%
85.6%
ks D
gypt: New Fact
ally more con
uately provid
g countries. F
o enterprises a
SMEs in em
overdraft, but
rceived) risks
osting collater
poor contrac
these as collat
percent of SM
ercent of SME
slightly lowe
roblems.
to Having Pro
s using SMEs da
lems with Ban
s using SMEs da
ost of the Egy
pattern can
with banks a
Millions - Less an 15 Millions
14.7%
85.3%
Do not Have P
ts from a New D
nstrained than
ding SMEs w
For instance,
and SMEs. In
merging mark
t need one (D
s of investme
ral is complic
ct enforcemen
teral. For this
MEs have prob
Es having a c
er for larger f
blems with Ba
ataset.
nks and Capita
ataset.
yptian SMEs
be observed
are located i
Y
N
15 Millions -Less than 30
Millions
9.4%
90.6%
roblems with B
Dataset
n large firms
with capital in
the top five b
n addition, in
kets have a
Dalberg, 201
ent in SMEs t
cated by the f
nt in which b
s reason, som
blems with ba
capital less th
firms since 9
anks
al
are concentr
for SMEs th
in Cairo, 11.
Yes
No
30 Millions andMore
9.9%
90.1%
Banks
and are less
n developing
banks serving
Sub-Saharan
loan but are
1). From the
translate into
fact that most
borrowers do
me SMEs face
anks and this
han EGP 250,
.9 percent of
rated in three
hat deal with
.5 percent in
d
%
s
g
g
n
e
e
o
t
o
e
s
,
f
e
h
n
Small and Medium Enterprises Landscape in Egypt: New Facts from a New Dataset
157
Sharkeya and 9.5 in Gharbeya. Similarly, SMEs having banking facilities (see Figure 24) are chiefly concentrated
in the same governorates (22.6 percent in Cairo, 13.9 percent in Sharkeya and 8 percent in Gharbeya). Clearly,
there is a great potential of developing new SMEs in other governorates through an easier and more equitable
access to finance.
Figure 23 Distribution of SMEs Dealing with Banks by Governorates
Source: Constructed by the authors using SMEs dataset.
Figure 24 Distribution of SMEs Having Banking Facilities by Governorates
Source: Constructed by the authors using SMEs dataset.
Concerning economic activities, most of the firms that benefit from dealing with banks (see Figure 25) are
mostly concentrated in manufacturing (44.3 percent) and trade (43.8 percent). Yet, having a more detailed look on
each sector separately (Figure 26) shows that 86.8 percent of construction firms and 72 percent of food and
beverage ones deal with banks. This figure is lower for SMEs working in the manufacturing and trade sectors
since SMEs who deal with banks represent 40.7 and 50.9 percent respectively of firms operating in these two
sectors. Those findings are not contradictory since there is a frequency effect as almost 90 percent of SMEs are
concentrated in just the manufacturing sector (51.1 percent), followed by the wholesale trade (40.5 percent).
158
To put
larger firms
banking fac
among bank
effect; CBE
assistance to
discussing b
and lenders,
fostering ac
national cen
Small a
Figure
Figure 2
in a nutshel
with a grea
ilities. There
ks to provide
E’s relaxation
o banks and im
bottleneck iss
, which is par
cess to finan
nsus.
1.1%
46.3%
53.7%
and Medium E
e 25 Percent D
Sourc
6 Percent Di
So
ll, small firm
ater capital, m
efore, in orde
e full fledge
n of the 10%
mproving the
sues and brid
rticularly acu
nce for SMEs
44.3%
% 40.7%
% 59.3%
D
Enterprises La
Distribution of
ce: Constructed
istribution of S
urce: Construct
ms face seriou
more employ
er to resolve
of diversified
% banks’ rese
e communicat
dging the gap
ute in the “inf
s through NI
43.8%
50.9%
% 49.1%
Dealing with B
andscape in Eg
f SMEs Dealin
d by the authors
SMEs by Dealin
ted by the autho
us impedimen
yees and high
problems re
d products w
erve requirem
tion between
p; overcomin
formationally
LEX (Box 1
2.7%
72.0%
28.0%
Banks Not D
gypt: New Fact
ng with Banks b
s using SMEs da
ng with Banks
ors using SMEs
nts in what c
her sales turn
elated to acce
with lowest ch
ments on SM
the two sides
ng the asymm
y opaque” ma
), the establi
1.9%
65.5%
34.5%
Dealing with B
ts from a New D
by Economic A
ataset.
s and Economi
s dataset.
concerns acc
nover are mo
ess to finance
harges due to
MEs lending;
s of the SME
metric inform
arket for sma
ishments of t
2.9% 3
86.8%
13.2%
anks
Dataset
Activity
ic Activity
cess to financ
ore likely to
e, encourage
o the econom
; facilitation
Es’ lending ma
mation betwee
all business cr
the I-score (B
3.4%
61.0%
39.0%
ce given that
benefit from
e competition
mies of scale
of technical
arket through
en borrowers
redit through
Box 2) and a
t
m
n
e
l
h
s
h
a
Small and Medium Enterprises Landscape in Egypt: New Facts from a New Dataset
159
Box 2: Egyptian Credit Bureau “I-Score” The Egyptian Credit Bureau “I-Score” maintains a database of credit information for SMEs and consumers. The first credit bureau in Egypt, which demonstrates how a private credit bureau can be set up in a relatively short time when all stakeholder interests are aligned and the project has backing of the authorities. The Credit Bureau has been established under the name of the Egyptian Credit Bureau “Estealam”. The first general assembly meeting was held on September 5th, 2005. 25 banks in addition to the Social Fund for Development contributed in the company, with an issued capital of 30 million Egyptian pounds distributed to seven million and five hundred thousand shares, the value of each share of four pounds (all the shares in cash). The founders and subscribers have paid the 25% of the nominal value of the shares upon subscription and completed the paid up capital in February 2007. The purpose of the company is to provide information services and credit classification. It includes work in the following areas:
Gathering all information about customers, whether associated with credit companies and financial institutions, retailers and credit provided by banks or other views from all available sources of information.
Creating certified official records of that information with the company, analyzing the data and classifying it.
Creating indicators of credit quality for debtors whether individuals or institutions, making it possible for them to form a sound credit history.
Providing financial advice and practical solutions, all of the specialized counseling to individuals or institutions who want to improve the level of credit ratings, or those who want to improve the financial instrument or who want to build a credit history on a sound basis to start by a specific institution (with the exception of legal advice).
The sale of information services and products associated service and other new services to all beneficiaries in Egypt and in a manner that does not conflict with the provisions of secret bank accounts.
Carrying out the work of the agency in the field of information and credit classification of enterprises or companies linked to their work with the company subject to the provisions of laws, regulations and decisions applicable licensing condition for the exercise of such activities.
Impact of I-Score:
I-Score led the process of the creation of the borrower data bank with Unique ID (GT 5.7 Million).
Significant increase in number of credit facilities/loans data base size (GT 14.3 Million).
Catalyst for banks/lenders to improve their data quality, revision of internal lending policies/procedures leading to new avenues to grow credit/improved profitability and advanced skill sets.
Contribution to increased awareness among lenders on data quality in acquisition and management.
Catalyst for active credit growth with prudence and confidence by providing a unified and robust borrower database across the lending community
For more information, please check www.i-score.com.eg
Box 1: NILEX NILEX is the Egyptian Exchange’ market for growing medium and small companies, which offers an appropriate, secure, yet flexible regulatory framework, for both companies and investors, together with a streamlined admission process. It supports the capital raising activities of small and mid cap developing companies. Its advantage is not only limited to providing finance, but companies can access to long term capital for the expansion of their businesses. It supports promising sectors in the economy which suffers from finance obstacles; and it also provides opportunity for investors to diversify their portfolios by investing in high growth companies. NILEX Benefits can be summarized in the following:
Unlimited Long-term Finance
Cheap Financing cost
Relaxed Rules & Regulation
Dedicated Funds to ensure liquidity
Full Government Support
Lower Listing Fees (0.5 per thousand of the capital)
Local & Foreign investors’ Interest For more information, please check: www.nilex.egyptse.com/ar/
Small and Medium Enterprises Landscape in Egypt: New Facts from a New Dataset
160
6. Conclusion and Policy Implications
Small and medium sized enterprises (SMEs) have usually been perceived as a dynamic force for sustained
economic growth and job creation in developing countries. In Egypt, despite banking reforms that have been
launched in 2004, the ability of SMEs to more easily access suitable and sufficient means of finance has always
been considered a major obstacle facing many SMEs. For this reason, and in order to be able to extend the
financial services provided to this segment and increase the benefits of the banking reform, the Central Bank of
Egypt launched in December 2008 an initiative, as an integral part of the Second Phase of the Banking Sector
Reform Program (2008-2011), to enhance SMEs access to finance and banking services. In this paper, we present
a descriptive analysis of the SMEs landscape in Egypt relying on this extensive census. The main findings of the
census show that there is a high concentration of SMEs at different levels. First, the geographical distribution of
SMEs is significantly skewed since almost half of them are concentrated in three governorates (Cairo, Sharqiya &
Gharbeya). Second, they are chiefly operating in two economic activities, namely manufacturing and trade. Third,
a very few firms are exporting. Finally, financial services seem to be under-utilized by SMEs as only 50 percent
are dealing with banks and benefiting from an improved access to finance.
From a policy implication standpoint, there is a need for strategic economic reforms to bring Egypt’s
economic condition into vitality and promote investment, especially for SMEs through:
Improvements in the legislative infrastructure, several rules and regulations associated with bankruptcy,
creditor capacity to take fast possession of collateral in case of default. In addition, there is an urgent need to
speed up the process of establishing collateral registries which should aim at building electronic registers and
streamlining registration process.
Encouraging banks to build on their expertise in matchmaking their clients in different stages of value chain
(linkages)
A need for updating financial method for financial reporting (e.g., standardized template)
Changing the Mindset
Enhancing Entrepreneurship Education
It is worth to mention that this last point is crucial to improve SME performance in Egypt. Indeed, the role of
entrepreneurship has become increasingly apparent in economic and social development. Economically,
entrepreneurship stimulates markets. The formation of new business leads to job creation and has a multiplying
effect on the economy. Socially, entrepreneurship empowers citizens, generates innovation and changes mindsets.
These changes have the potential to integrate developing countries into the global economy. Thus,
entrepreneurship is described as a potential driver to support the economic growth, since it is important for
productivity, innovation and employment. Accordingly, it has been a policy goal of many developed countries to
develop a culture of entrepreneurial thinking. This can be done through providing appropriate enabling
environment via integrating entrepreneurship into education systems, learning process, technical assistance,
legislation and integration among all stakeholders.
Access to finance of small and medium enterprises is extremely important in promoting entrepreneurship and
innovation as well improving the state of the national economy in Egypt. Accordingly helping those who decide to
start their small enterprise in acquiring necessary entrepreneurial and managerial competencies is essential in
order to ensure their success. Being aware of the importance of entrepreneurship development, EBI SME unit is
Small and Medium Enterprises Landscape in Egypt: New Facts from a New Dataset
161
providing several training packages for Small and medium business owners who need to enhance their
understanding of dealing with and satisfying the requirements of banks.
References:
Central Bank of Egypt (2010). “Banking Reform in Egypt”, mimeo. Cinar E. M., Evcimen G. and Kaytaz M. (1987). “A case study on the growth potential of small scale manufacturing enterprises in
Bursa, Turkey”, METU Studies in Development, Vol. 24, No. 2, pp. 123-146. Cinar E. M., Evcimen G. and Kaytaz M. (1988). “The present day status of small scale industries (Sanatkar) in Bursa, Turkey”,
International Journal of Middle Eastern Studies, Vol. 20, pp. 287-301. Doing Business (2011). “Making a difference for entrepreneurs”, IFC and the World Bank, Washington D.C. Egyptian Banking Institute (2010). “A facilitating access to finance for SMEs”, mimeo, February. El-Hamidi F. and C. Baslevent (2010). “The gendered aspects of MSEs in MENA: Evidence from Egypt and Turkey”, Economic
Research Forum (ERF) Working Paper No. 535. El-Gamal M. A., El-Megharbel N. and Inanoglu H. (2001). “Beyond credit: A taxonomy of SMEs and financing methods for Arab
countries”, ECES Working Paper Series No. 57, Egypt, The Egyptian Center for Economic Studies (ECES), May. El-Hamidi F. (2011). “How do women entrepreneurs perform? Empirical evidence from Egypt”, Economic Research Forum (ERF)
Working Paper No. 621. El-Kabbani R. N. and Kalhoefer C. (2011). “Financing resources for Egyptian small and medium enterprises”, Working Papers 28,
The German University in Cairo, Faculty of Management Technology. El-Mahdi A. (2006). “The changing economic environment and the development of the micro and small enterprises in Egypt 2006”,
Economic Research Forum (ERF) Working Paper No. 0706. El-Said H., Al Said M. and Zaki C. (2013). “Access to Finance and Financial Problems of SMEs: Evidence from Egypt”
International Journal of Small Business and Entrepreneurship, Vol. 20, No. 3, pp. 286-309. El-Said H. (2006). “Access to finance: Forms of financing for SMEs in Egypt”, Centranl Bank of Egypt and the Egyptian Banking
Institute, mimeo. Erzan R. and Filiztekin A. (2005). “Does size matter in growth, productivity, employment, and vulnerability/flexibility in Turkish
manufacturing?”, Turkish Studies, Vol. 6, No. 1, pp. 113-126. Evcimen G., Kaytaz M. and Cinar E. M. (1991). “Subcontracting, growth and capital accumulation in small-scale firms in the textile
industry in Turkey”, The Journal of Development Studies, Vol. 28, No. 1, pp. 130-149. Hamdouch B. et al. (2004). “Dynamisme de la Micro et Petite Entreprise au Maroc”, ERF Research Report Series No. 0419. OECD (2011). “Entrepreneurship at a glance 2011”, OECD Publishing, available online at:
http://dx.doi.org/10.1787/9789264097711-en. Semsa Ozar (2004). “Micro and small enterprises in Turkey: Uneasy development”, Research Report Series No. 0420. The World Bank (2010). “Access to finance and economic growth in Egypt”, led by Sahar Nasr, Washington D.C..