Embed Size (px)
Citation preview
STATE OF COLORADO
Small Community Park & Recreation Planning Standards
2003
Prepared by:
With funding assistance from the Colorado Heritage Planning Grant program, Office of Smart Growth, Colorado Department of Local Affairs
Small Community Parks & Recreation Standards 2
Table of Contents
QUICK ANSWERS & PROJECT SUMMARY............................................................................................4
Introduction.......................................................................................................................................................6
Why small town parks standards are necessary ...........................................................................6
Quick Reference to Workbooks: ...............................................................................................................7
SECTION A Park Land Standards ............................................................................................................8
How Parks Standards are Used............................................................................................................8
Methodology....................................................................................................................................................8
What are small town parks planning standards? ........................................................................8
Why Small Community Planning Standards are Unique..........................................................9
How are small town parks planning standards established in this analysis?....................9
Citizen Demand for Parks and Recreation Facilities.....................................................................9
Current Recreation Trends .....................................................................................................................9
Demand for Field Sports in Colorado Small Towns ................................................................. 10
Demand for Other Activities Occurring in Community Parks.............................................. 11
Capacity of the Parks System.............................................................................................................. 12
Activity Session Capacities ................................................................................................................... 12
Total Users Capacities............................................................................................................................ 14
Small Town Parks Planning Standards ................................................................................................ 14
Park Land Standards .............................................................................................................................. 16
Recommended Park Land Dedication Standards ..................................................................... 17
Custom Park Land Dedication Standards ..................................................................................... 17
Open Space.................................................................................................................................................... 17
Statewide Municipal Open Space Inventories ............................................................................ 18
Example Park Dedication Worksheet ............................................................................................. 19
Legal issues & Colorado State Statutes................................................................................................ 19
Example Municipal Code and Comprehensive Plan Language......................................... 20
Example code language continued…… ......................................................................................... 21
SECTION B Parks System Budgeting.................................................................................................... 21
Introduction.................................................................................................................................................... 21
Land Costs.................................................................................................................................................. 21
Site Improvement Costs........................................................................................................................ 22
Park and Recreation Facility Pricing Assumptions ..................................................................... 22

Small Community Parks & Recreation Standards 3
Park Facility Pricing & Dimensions ........................................................................................................ 24
SECTION C Developing a Parks System.............................................................................................. 38
Understanding Parks System Needs.................................................................................................... 38
Sample community survey.................................................................................................................. 38
Developing a Parks Plan....................................................................................................................... 43
Financing Acquisitions.......................................................................................................................... 43
Fee-in-lieu ................................................................................................................................................... 43
Colorado Funding Sources for Parks Acquisition...................................................................... 43
Financing Operations & Maintenance .......................................................................................... 44
Impact Fees ............................................................................................................................................... 44
Appendix A -- Survey Results & Statistics ........................................................................................... 45
Appendix B – List of Sources for Capacity Studies ......................................................................... 47
Appendix C – Sports Field Capacity Study......................................................................................... 48
Appendix D – Facility Capacity Calculations .................................................................................... 50
Appendix E – Detailed Park Land Standards Table ....................................................................... 50
Appendix F – Skatepark Capacity Study............................................................................................. 51
Appendix G -- Existing (2003) Small Community Park Land Dedication Standards……….52
Small Community Parks & Recreation Standards 4
QUICK ANSWERS & PROJECT SUMMARY This project presents parks and recreation planning standards specifically for small communities in Colorado. Although the National Parks and Recreation Association (NPRA) developed planning standards over 20 years ago these were based on urban level models and in many cases neither recognized nor were usable by small communities. Moreover NRPA standards reflected only loosely defined park types rather than actual demand for parks and recreation facilities. This report corrects these issues and is based on an empirically sound methodology sanctioned by NRPA. For the purposes of this report, small communities are those that are roughly at, or less than, 10,000 in population.
This report provides answers to the following questions:
1. What types of parks and recreation facilities do small community Colorado residents use and desire the most?
2. How many of those parks and recreation facilities types does a community need given its population?
3. How many people can each parks and recreation facility serve? (e.g. how many residents can a baseball field accommodate)
4. How much does it cost to build those parks and recreation facilities?
5. How much does it cost to maintain those parks and recreation facilities?
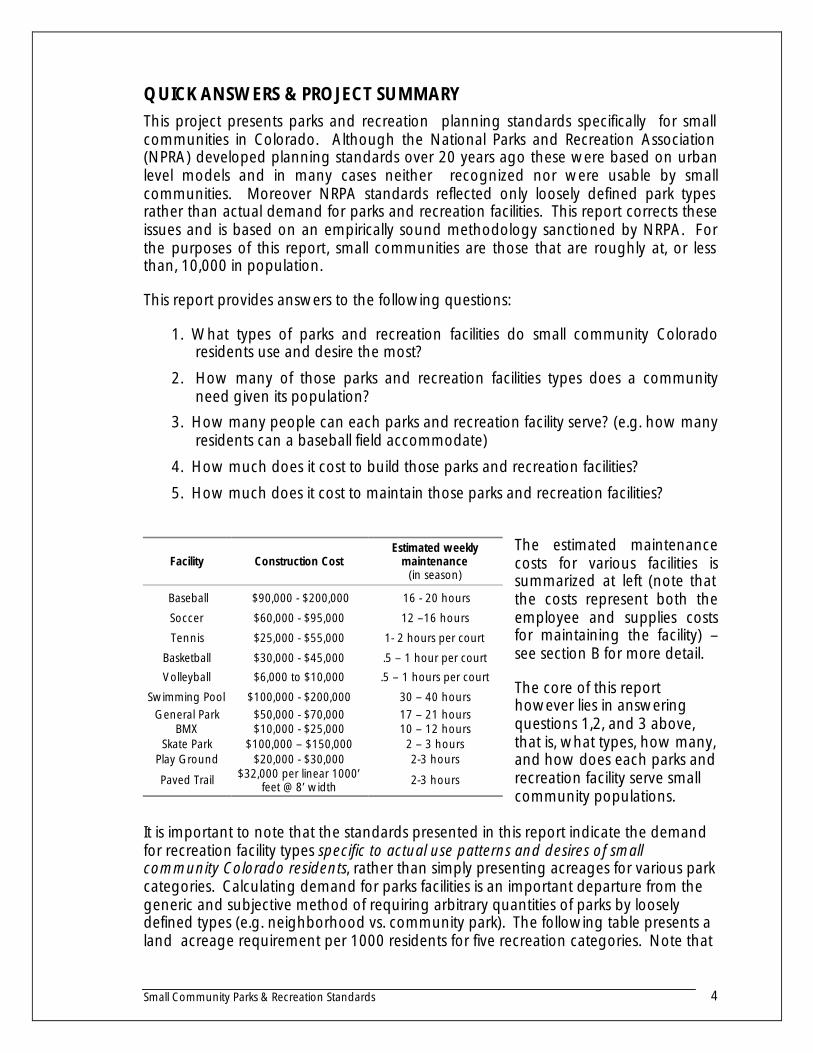
The estimated maintenance costs for various facilities is summarized at left (note that the costs represent both the employee and supplies costs for maintaining the facility) – see section B for more detail.
The core of this report however lies in answering questions 1,2, and 3 above, that is, what types, how many, and how does each parks and recreation facility serve small community populations.
It is important to note that the standards presented in this report indicate the demand for recreation facility types specific to actual use patterns and desires of small community Colorado residents, rather than simply presenting acreages for various park categories. Calculating demand for parks facilities is an important departure from the generic and subjective method of requiring arbitrary quantities of parks by loosely defined types (e.g. neighborhood vs. community park). The following table presents a land acreage requirement per 1000 residents for five recreation categories. Note that
Facility Construction Cost Estimated weekly
maintenance (in season)
Baseball $90,000 - $200,000 16 - 20 hours
Soccer $60,000 - $95,000 12 –16 hours
Tennis $25,000 - $55,000 1- 2 hours per court
Basketball $30,000 - $45,000 .5 – 1 hour per court
Volleyball $6,000 to $10,000 .5 – 1 hours per court
Swimming Pool $100,000 - $200,000 30 – 40 hours General Park $50,000 - $70,000 17 – 21 hours
BMX $10,000 - $25,000 10 – 12 hours Skate Park $100,000 – $150,000 2 – 3 hours
Play Ground $20,000 - $30,000 2-3 hours
Paved Trail $32,000 per linear 1000’ feet @ 8’ width 2-3 hours
Small Community Parks & Recreation Standards 5
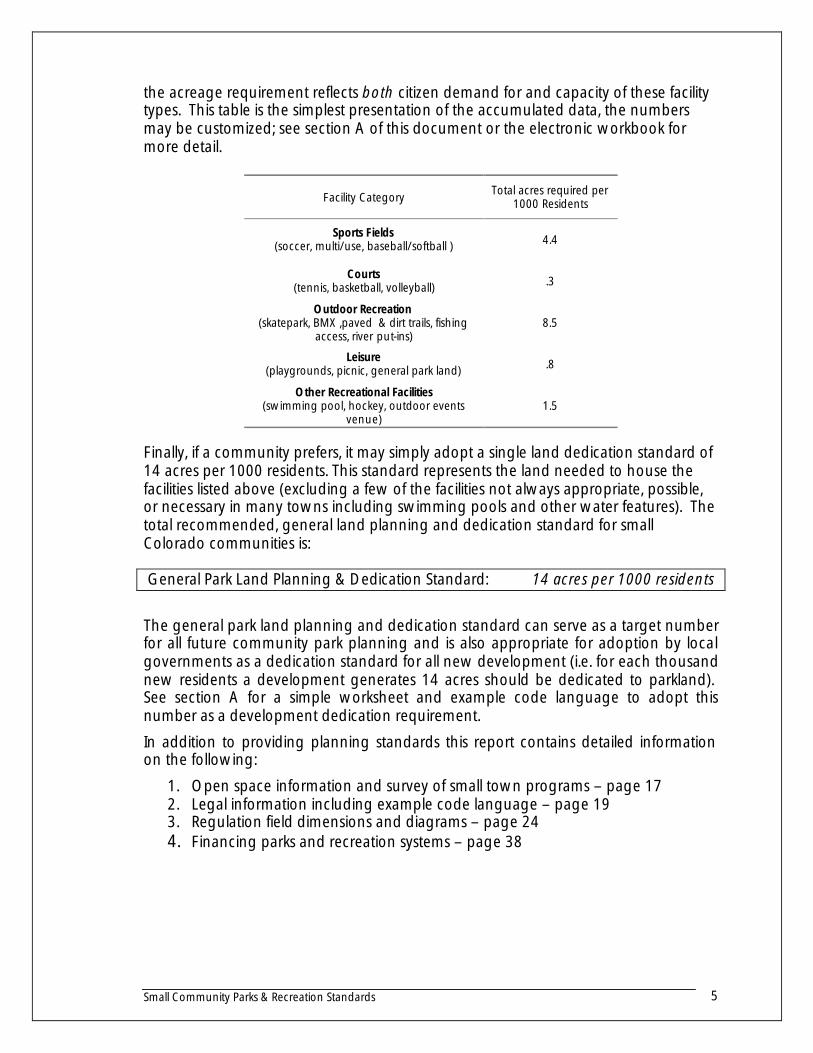
the acreage requirement reflects both citizen demand for and capacity of these facility types. This table is the simplest presentation of the accumulated data, the numbers may be customized; see section A of this document or the electronic workbook for more detail.
Facility Category Total acres required per 1000 Residents
Sports Fields (soccer, multi/use, baseball/softball ) 4.4
Courts (tennis, basketball, volleyball) .3
Outdoor Recreation (skatepark, BMX ,paved & dirt trails, fishing
access, river put-ins) 8.5
Leisure (playgrounds, picnic, general park land) .8
Other Recreational Facilities (swimming pool, hockey, outdoor events
venue) 1.5
Finally, if a community prefers, it may simply adopt a single land dedication standard of 14 acres per 1000 residents. This standard represents the land needed to house the facilities listed above (excluding a few of the facilities not always appropriate, possible, or necessary in many towns including swimming pools and other water features). The total recommended, general land planning and dedication standard for small Colorado communities is:
General Park Land Planning & Dedication Standard: 14 acres per 1000 residents
The general park land planning and dedication standard can serve as a target number for all future community park planning and is also appropriate for adoption by local governments as a dedication standard for all new development (i.e. for each thousand new residents a development generates 14 acres should be dedicated to parkland). See section A for a simple worksheet and example code language to adopt this number as a development dedication requirement.
In addition to providing planning standards this report contains detailed information on the following:
1. Open space information and survey of small town programs – page 17 2. Legal information including example code language – page 19 3. Regulation field dimensions and diagrams – page 24 4. Financing parks and recreation systems – page 38
Small Community Parks & Recreation Standards 6
Introduction
For the purposes of this document, a small community means any jurisdiction with roughly 10,000 residents or less. The vast majority of Colorado’s local governments fall into this category. While many larger jurisdictions have the resources to conduct expensive, yet important, parks studies many smaller localities do not. Moreover, this document is a recognition that small communities require analysis and standards fundamentally different than those typically used for urbanized and metropolitan areas. This product was developed from the ground up with a commitment to understanding the unique needs of small communities and all standards have been developed with this single purpose in mind.
Every jurisdiction should have confidence in the applicability, appropriateness, and defensibility of standards presented in this report but all communities should engage in at least minimal planning and community input prior to utilizing general park standards. The standards in this report have been uniquely calibrated to the parks and recreation demands of small community Colorado residents and extensive survey and other research work has been completed to provide the best numbers and analysis possible. Please see the appendices for detailed descriptions of the methodologies and research behind the numbers. Also note that an easy to use electronic interface accompanies this document to assist in determining the park planning standards appropriate for your jurisdiction.
In addition, this document contains extensive information on current costs (2003) for parks facilities and as well as best estimates for ongoing operations and maintenance expenses.
Why small town parks standards are necessary
As Colorado land costs become increasingly expensive, acquisition of parklands can become challenging, requiring not only that local governments have plans in place to keep up with new resident demands, but also that jurisdictions have funding mechanisms precisely related to desired service levels. Without quantitative definitions of service standards and goals, municipally provided parks and open space systems are typically only abstractly defined and revenue allotments can be arbitrary. Inevitably, un-regimented park planning often results in parks and open space service level deficits that are difficult to measure and expensive to recover from.
This project will allow small municipalities to:
1) Better understand parks/open space service level needs and citizen demand for park facilities
2) Establish fair and justifiable parks land dedications,
3) Improve comprehensive and parks master planning documents,
4) Assist in the establishment of level of service standards for impact fees,
5) Understand appropriate on-sight developments
Small Community Parks & Recreation Standards 7
6) Prepare budgets that will accommodate both the acquisition and ongoing maintenance of parks infrastructure, and
7) Strengthen grant applications for land acquisition
This project is unique in that it indicates appropriate levels of parks and recreation facilities based on citizen demand for those facilities. A statewide survey of small communities was undertaken to better understand what types of recreation facilities small community residents utilize and desire the most. This system possesses the dual benefits of facilitating the prioritization of parks expenditures and strengthening the justification for dedication standards. Again, these standards may be adopted into land use codes and utilized either for service level targeting or master planning.
Quick Reference to Workbooks:
A) Land dedication standards – GO TO SECTION A
B) Park system budgeting – GO TO SECTION B
C) Parks system planning – GO TO SECTION C
Small Community Parks & Recreation Standards 8
SECTION A
Park Land Standards
How Parks Standards are Used
While level of service standards exists for law enforcement, health care, roads, and administration, no widely applicable parks service levels standards currently exist, and certainly none that address the distinctive needs of small communities.
This project represents an empirically generated a set of planning standards for small communities based on direct citizen input that will:
1) Allow evaluation of your communities existing parks and recreation system
2) Add a firm and reliable quantitative planning element to parks systems development, and
3) Facilitate service level goal setting for Colorado’s small community parks departments.
Methodology
Understanding the methodology requires answering three questions:
° What are small town parks planning standards? ° Why are small community planning standards are unique? ° How are standards established in this analysis?
What are small town parks planning standards?
A parks planning standard is simply a ratio expressing the quantity of parks and recreation facilities compared to population. For example, how many acres of general parkland do we have per capita or how many soccer fields are needed per thousand citizens?
There is no essential difference between a planning standard and a level of service. It may be generally said that a standard is typically prescriptive where a LOS is descriptive. That is, when evaluating a level of service we are typically describing an existing condition (e.g. 1.2 police officers per 1,000 citizens) or a condition that is the minimal acceptable. We usually talk about maintaining levels of service whereas a standard describes a planning objective to be attained (although it is equally appropriate to speak of attaining minimal service levels). In parks planning these standards or goals are frequently based on “best practices”, best guesses, or determined by experts in the field. The planning standards in this report are singularly unique and represent a move forward in the progress of parks planning as they relate to the needs of smaller communities because the standards are based on actual citizen demand for services rather than abstractly defined concepts.
Small Community Parks & Recreation Standards 9
Why Small Community Planning Standards are Unique
The planning standards established presented in this report are closely tailored to the needs of smaller communities (those at or less than ~ 10,000 in population). Furthermore, the standards are based on actual measured small community citizen demand for various recreation facilities. That is, how much use are softball fields and skateparks receiving and how many of these facilities do we need to meet citizen demand? This empirical method of determining standards yields numerous benefits. City planners and elected officials can be assured that the standards adopted reflect actual citizen demand for parks systems, which in turn allows the prioritization of resources and confidence in the codification of land dedication standards. Finally, the survey methods utilized reveal the changing nature of parks system development and consequently how local governments might track and respond to changing demands over time.
The parks standards presented in this report are meant to replace (for small communities) those standards established by National Parks and Recreation Association (NPRA). NPRA standards are based on urban and metropolitan models and are largely inappropriate for smaller communities.
How are small town parks planning standards established in this analysis?
Parks and recreation standards for small communities are established through the following method. (Please see Appendix A for a detailed methodological discussion)
1) What is the citizen demand for various parks and recreation resources? That is, how much or how often are small community residents using softball fields, bike trails, playgrounds, etc?
2) What is the capacity for various recreation resources? That is, how many citizens can a softball field or playground accommodate? Or put another way, if there is demand for softball fields, how many will our community need to meet that demand?
3) Given demand and capacity for certain facilities, how much land will be needed to accommodate those facilities? This is typically expressed in acreage per capita. Or more specifically, acreage per 1000 residents.
Citizen Demand for Parks and Recreation Facilities
Citizen demand for recreation facilities is determined through extensive local survey work throughout Colorado’s small communities and combined with national and industry level trend data to reveal frequency of use and preferences regarding parks and recreation facilities.
Current Recreation Trends
Recreation participation is marked by the rise and fall of the popularity of various activities. Fortunately, American Sports Data Incorporated. has been tracking national scale recreation trends for more than 18 years and the annual Superstudy of Sports Participation measures and reveals important national trend data about interest in , and
Small Community Parks & Recreation Standards 10
demand for, parks and recreation activities. In particular this information gives us insight into the average frequencies of participation, that is, how often does the average baseball player or kayaker engage in that activity.
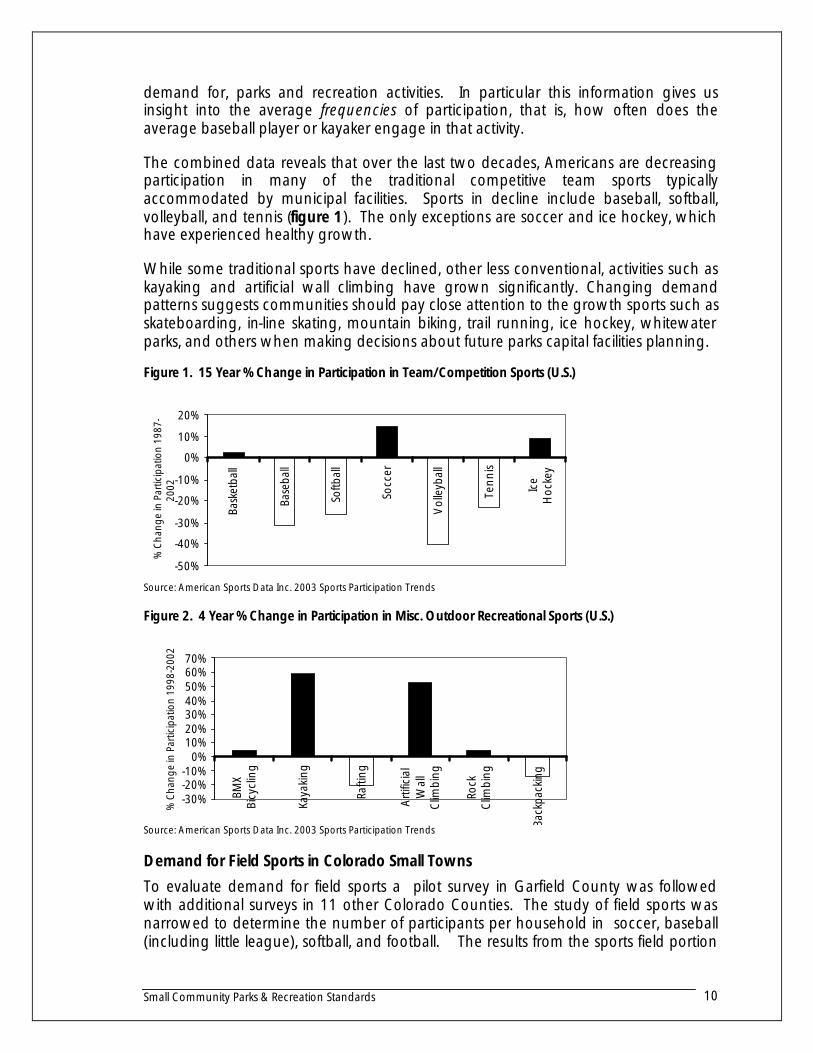
The combined data reveals that over the last two decades, Americans are decreasing participation in many of the traditional competitive team sports typically accommodated by municipal facilities. Sports in decline include baseball, softball, volleyball, and tennis (figure 1). The only exceptions are soccer and ice hockey, which have experienced healthy growth.
While some traditional sports have declined, other less conventional, activities such as kayaking and artificial wall climbing have grown significantly. Changing demand patterns suggests communities should pay close attention to the growth sports such as skateboarding, in-line skating, mountain biking, trail running, ice hockey, whitewater parks, and others when making decisions about future parks capital facilities planning.
Figure 1. 15 Year % Change in Participation in Team/Competition Sports (U.S.)
-50%
-40%
-30%
-20%
-10%
0%
10%
20%
Bask
etba
ll
Base
ball
Softb
all
Socc
er
Vol
leyb
all
Tenn
is
Ice
Hoc
key
% C
hang
e in
Par
ticip
atio
n 19
87-
2002
Source: American Sports Data Inc. 2003 Sports Participation Trends
Figure 2. 4 Year % Change in Participation in Misc. Outdoor Recreational Sports (U.S.)
-30%-20%-10%
0%10%20%30%40%50%60%70%
BMX
Bicy
clin
g
Kaya
king
Rafti
ng
Arti
ficia
lW
all
Clim
bing
Rock
Clim
bing
Back
pack
ing
% C
hang
e in
Par
ticip
atio
n 19
98-2
002
Source: American Sports Data Inc. 2003 Sports Participation Trends
Demand for Field Sports in Colorado Small Towns
To evaluate demand for field sports a pilot survey in Garfield County was followed with additional surveys in 11 other Colorado Counties. The study of field sports was narrowed to determine the number of participants per household in soccer, baseball (including little league), softball, and football. The results from the sports field portion
Small Community Parks & Recreation Standards 11
The median ages of softball & soccer players is 30 and 15 respectively 1
of the Colorado Small Town Parks Demand Survey (see appendix A for detailed results) are summarized below:
Figure 3. Demand for Field Sports
Field Sport Average Players per Household
Soccer 0.4 Football 0.2 Baseball/Softball/Little League 0.5 Baseball, softball, and little league have the highest participation rates with approximately one player for every two households. Higher participation rates for baseball and softball likely reflects the wide ranging age of players spanning from youth to retirees.
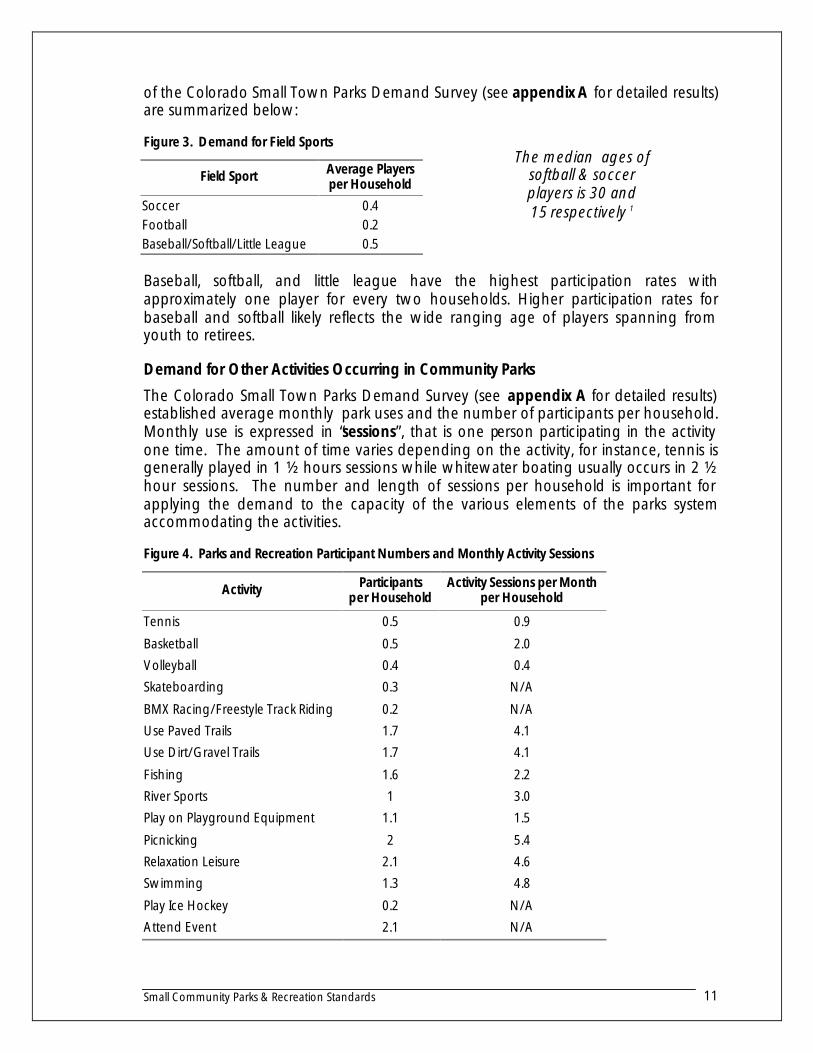
Demand for Other Activities Occurring in Community Parks
The Colorado Small Town Parks Demand Survey (see appendix A for detailed results) established average monthly park uses and the number of participants per household. Monthly use is expressed in “sessions”, that is one person participating in the activity one time. The amount of time varies depending on the activity, for instance, tennis is generally played in 1 ½ hours sessions while whitewater boating usually occurs in 2 ½ hour sessions. The number and length of sessions per household is important for applying the demand to the capacity of the various elements of the parks system accommodating the activities.
Figure 4. Parks and Recreation Participant Numbers and Monthly Activity Sessions
Activity Participants per Household
Activity Sessions per Month per Household
Tennis 0.5 0.9
Basketball 0.5 2.0
Volleyball 0.4 0.4
Skateboarding 0.3 N/A
BMX Racing/Freestyle Track Riding 0.2 N/A
Use Paved Trails 1.7 4.1
Use Dirt/Gravel Trails 1.7 4.1
Fishing 1.6 2.2
River Sports 1 3.0
Play on Playground Equipment 1.1 1.5
Picnicking 2 5.4
Relaxation Leisure 2.1 4.6
Swimming 1.3 4.8
Play Ice Hockey 0.2 N/A
Attend Event 2.1 N/A
Small Community Parks & Recreation Standards 12
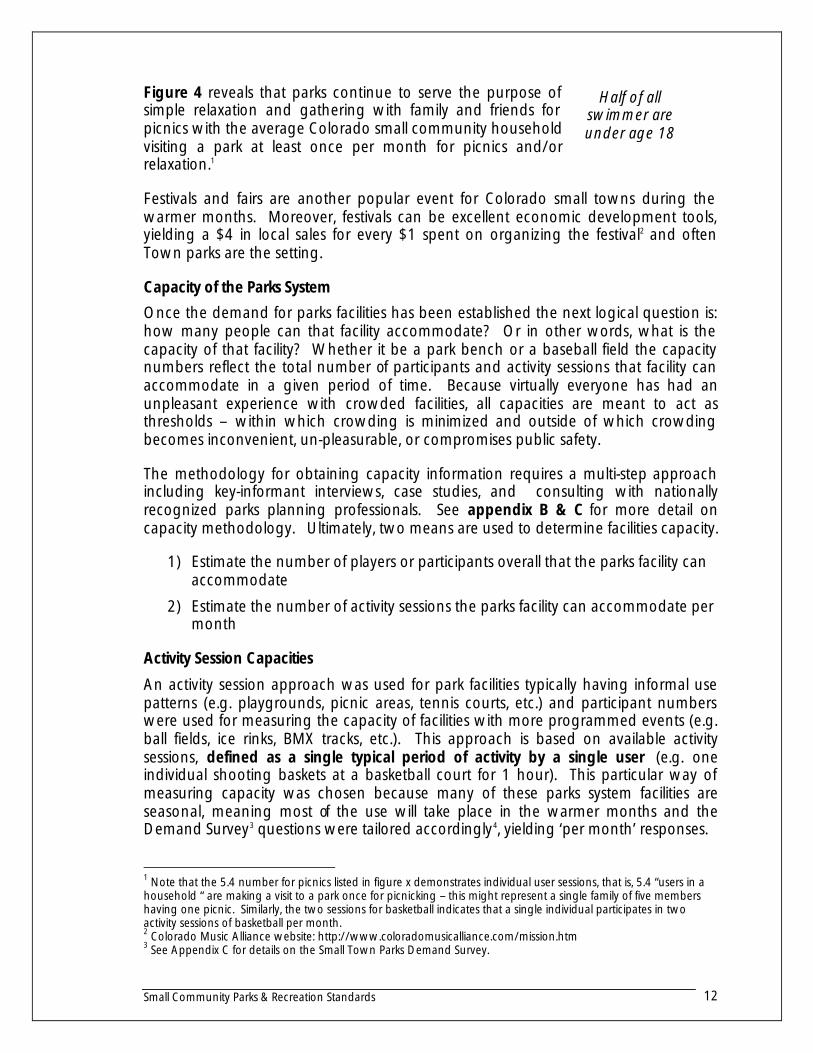
Figure 4 reveals that parks continue to serve the purpose of simple relaxation and gathering with family and friends for picnics with the average Colorado small community household visiting a park at least once per month for picnics and/or relaxation.1
Festivals and fairs are another popular event for Colorado small towns during the warmer months. Moreover, festivals can be excellent economic development tools, yielding a $4 in local sales for every $1 spent on organizing the festival2 and often Town parks are the setting.
Capacity of the Parks System
Once the demand for parks facilities has been established the next logical question is: how many people can that facility accommodate? Or in other words, what is the capacity of that facility? Whether it be a park bench or a baseball field the capacity numbers reflect the total number of participants and activity sessions that facility can accommodate in a given period of time. Because virtually everyone has had an unpleasant experience with crowded facilities, all capacities are meant to act as thresholds – within which crowding is minimized and outside of which crowding becomes inconvenient, un-pleasurable, or compromises public safety.
The methodology for obtaining capacity information requires a multi-step approach including key-informant interviews, case studies, and consulting with nationally recognized parks planning professionals. See appendix B & C for more detail on capacity methodology. Ultimately, two means are used to determine facilities capacity.
1) Estimate the number of players or participants overall that the parks facility can accommodate
2) Estimate the number of activity sessions the parks facility can accommodate per month
Activity Session Capacities
An activity session approach was used for park facilities typically having informal use patterns (e.g. playgrounds, picnic areas, tennis courts, etc.) and participant numbers were used for measuring the capacity of facilities with more programmed events (e.g. ball fields, ice rinks, BMX tracks, etc.). This approach is based on available activity sessions, defined as a single typical period of activity by a single user (e.g. one individual shooting baskets at a basketball court for 1 hour). This particular way of measuring capacity was chosen because many of these parks system facilities are seasonal, meaning most of the use will take place in the warmer months and the Demand Survey3 questions were tailored accordingly4, yielding ‘per month’ responses.
1 Note that the 5.4 number for picnics listed in figure x demonstrates individual user sessions, that is, 5.4 “users in a household “ are making a visit to a park once for picnicking – this might represent a single family of five members having one picnic. Similarly, the two sessions for basketball indicates that a single individual participates in two activity sessions of basketball per month. 2 Colorado Music Alliance website: http://www.coloradomusicalliance.com/mission.htm 3 See Appendix C for details on the Small Town Parks Demand Survey.
Half of all swimmer are under age 18
Small Community Parks & Recreation Standards 13
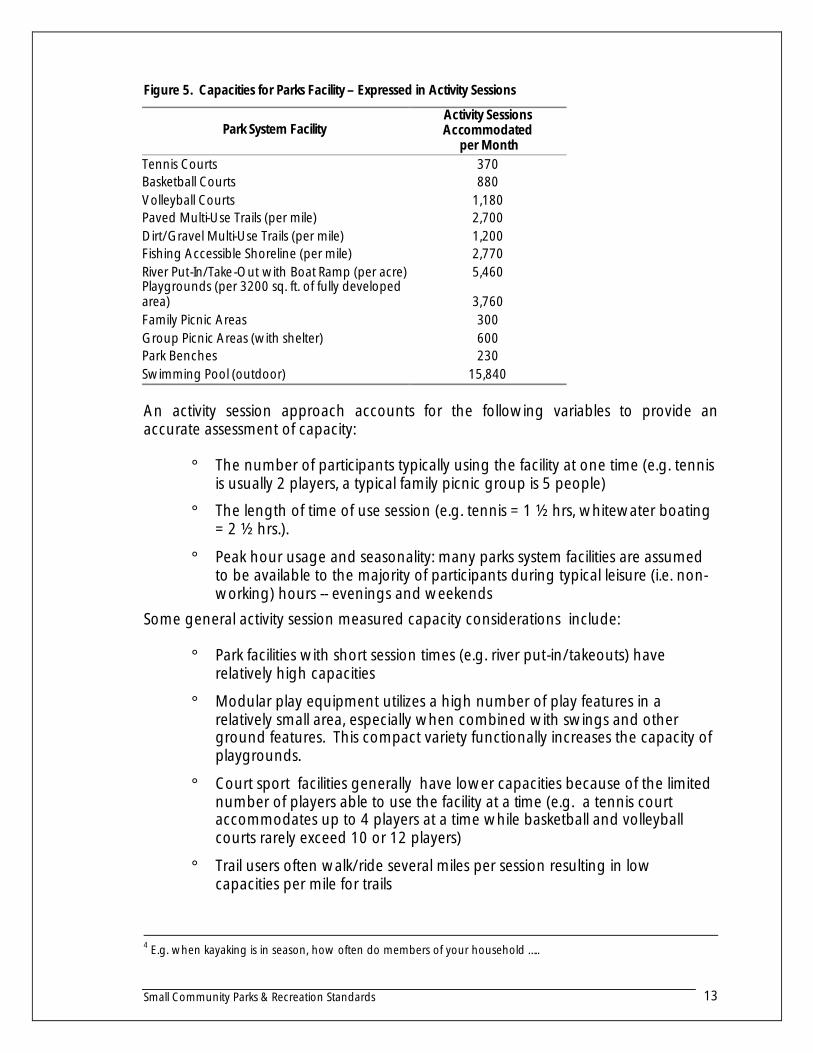
Figure 5. Capacities for Parks Facility – Expressed in Activity Sessions
Park System Facility Activity Sessions Accommodated
per Month Tennis Courts 370 Basketball Courts 880 Volleyball Courts 1,180 Paved Multi-Use Trails (per mile) 2,700 Dirt/Gravel Multi-Use Trails (per mile) 1,200 Fishing Accessible Shoreline (per mile) 2,770 River Put-In/Take-Out with Boat Ramp (per acre) 5,460 Playgrounds (per 3200 sq. ft. of fully developed area) 3,760 Family Picnic Areas 300 Group Picnic Areas (with shelter) 600 Park Benches 230 Swimming Pool (outdoor) 15,840 An activity session approach accounts for the following variables to provide an accurate assessment of capacity:
° The number of participants typically using the facility at one time (e.g. tennis is usually 2 players, a typical family picnic group is 5 people)
° The length of time of use session (e.g. tennis = 1 ½ hrs, whitewater boating = 2 ½ hrs.).
° Peak hour usage and seasonality: many parks system facilities are assumed to be available to the majority of participants during typical leisure (i.e. non-working) hours -- evenings and weekends
Some general activity session measured capacity considerations include:
° Park facilities with short session times (e.g. river put-in/takeouts) have relatively high capacities
° Modular play equipment utilizes a high number of play features in a relatively small area, especially when combined with swings and other ground features. This compact variety functionally increases the capacity of playgrounds.
° Court sport facilities generally have lower capacities because of the limited number of players able to use the facility at a time (e.g. a tennis court accommodates up to 4 players at a time while basketball and volleyball courts rarely exceed 10 or 12 players)
° Trail users often walk/ride several miles per session resulting in low capacities per mile for trails
4 E.g. when kayaking is in season, how often do members of your household …..
Small Community Parks & Recreation Standards 14
° Although picnic areas can hold many people at one time, their peak demand windows fall only during dinner and lunch hours, limiting overall capacity.
° Swimming pool facilities have large capacities to serve, due to the multiple use of both pool and deck area (e.g. up to 175 people for a 5000-6000 sq. ft. swimming pool).
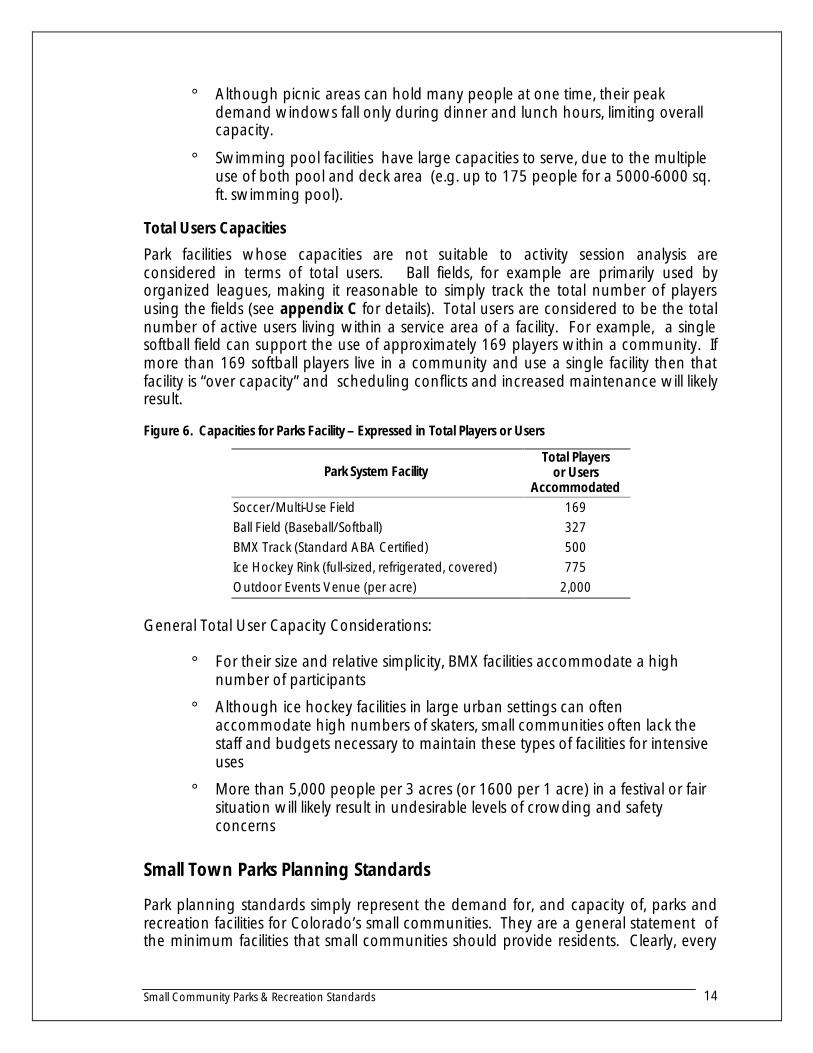
Total Users Capacities
Park facilities whose capacities are not suitable to activity session analysis are considered in terms of total users. Ball fields, for example are primarily used by organized leagues, making it reasonable to simply track the total number of players using the fields (see appendix C for details). Total users are considered to be the total number of active users living within a service area of a facility. For example, a single softball field can support the use of approximately 169 players within a community. If more than 169 softball players live in a community and use a single facility then that facility is “over capacity” and scheduling conflicts and increased maintenance will likely result.
Figure 6. Capacities for Parks Facility – Expressed in Total Players or Users
Park System Facility Total Players
or Users Accommodated
Soccer/Multi-Use Field 169 Ball Field (Baseball/Softball) 327 BMX Track (Standard ABA Certified) 500 Ice Hockey Rink (full-sized, refrigerated, covered) 775 Outdoor Events Venue (per acre) 2,000
General Total User Capacity Considerations:
° For their size and relative simplicity, BMX facilities accommodate a high number of participants
° Although ice hockey facilities in large urban settings can often accommodate high numbers of skaters, small communities often lack the staff and budgets necessary to maintain these types of facilities for intensive uses
° More than 5,000 people per 3 acres (or 1600 per 1 acre) in a festival or fair situation will likely result in undesirable levels of crowding and safety concerns
Small Town Parks Planning Standards
Park planning standards simply represent the demand for, and capacity of, parks and recreation facilities for Colorado’s small communities. They are a general statement of the minimum facilities that small communities should provide residents. Clearly, every
Small Community Parks & Recreation Standards 15
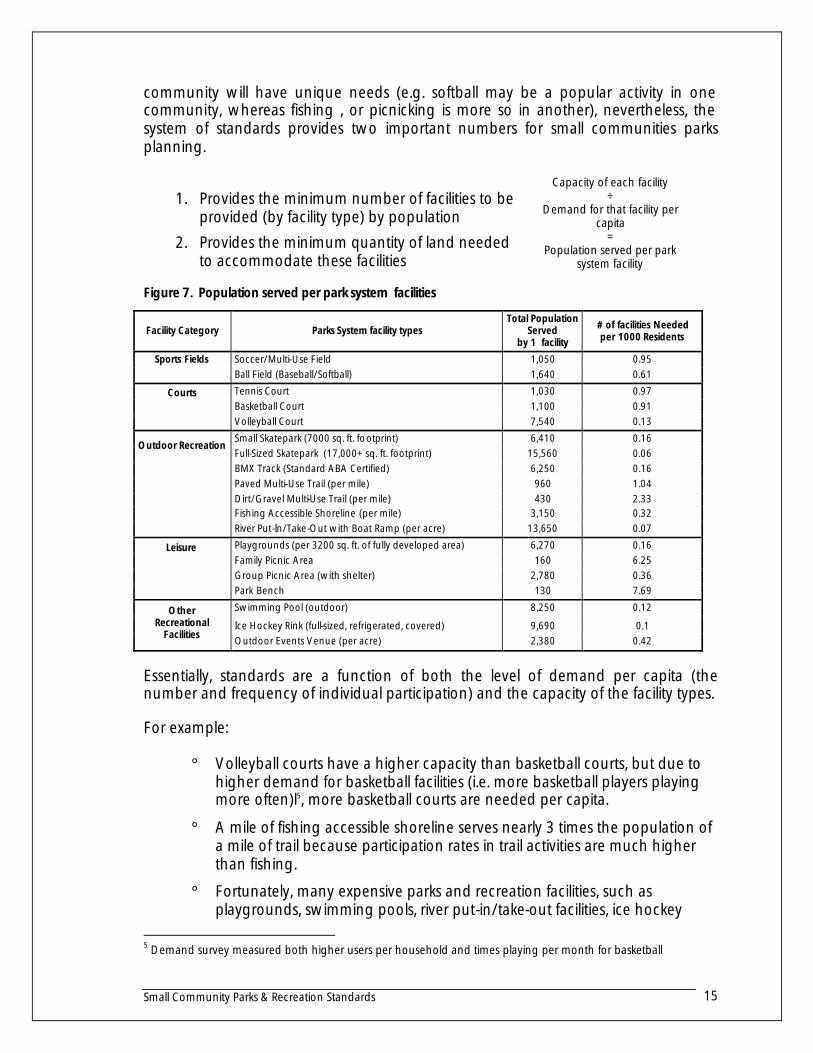
community will have unique needs (e.g. softball may be a popular activity in one community, whereas fishing , or picnicking is more so in another), nevertheless, the system of standards provides two important numbers for small communities parks planning.
1. Provides the minimum number of facilities to be
provided (by facility type) by population
2. Provides the minimum quantity of land needed to accommodate these facilities
Figure 7. Population served per park system facilities
Facility Category Parks System facility types Total Population
Served by 1 facility
# of facilities Needed per 1000 Residents
Soccer/Multi-Use Field 1,050 0.95 Sports Fields Ball Field (Baseball/Softball) 1,640 0.61
Tennis Court 1,030 0.97 Basketball Court 1,100 0.91
Courts Volleyball Court 7,540 0.13
Small Skatepark (7000 sq. ft. footprint) 6,410 0.16 Full-Sized Skatepark (17,000+ sq. ft. footprint) 15,560 0.06 BMX Track (Standard ABA Certified) 6,250 0.16 Paved Multi-Use Trail (per mile) 960 1.04 Dirt/Gravel Multi-Use Trail (per mile) 430 2.33 Fishing Accessible Shoreline (per mile) 3,150 0.32
Outdoor Recreation
River Put-In/Take-Out with Boat Ramp (per acre) 13,650 0.07
Playgrounds (per 3200 sq. ft. of fully developed area) 6,270 0.16 Family Picnic Area 160 6.25 Group Picnic Area (with shelter) 2,780 0.36
Leisure
Park Bench 130 7.69
Swimming Pool (outdoor) 8,250 0.12
Ice Hockey Rink (full-sized, refrigerated, covered) 9,690 0.1 Other
Recreational Facilities Outdoor Events Venue (per acre) 2,380 0.42
Essentially, standards are a function of both the level of demand per capita (the number and frequency of individual participation) and the capacity of the facility types.
For example:
° Volleyball courts have a higher capacity than basketball courts, but due to higher demand for basketball facilities (i.e. more basketball players playing more often)l5, more basketball courts are needed per capita.
° A mile of fishing accessible shoreline serves nearly 3 times the population of a mile of trail because participation rates in trail activities are much higher than fishing.
° Fortunately, many expensive parks and recreation facilities, such as playgrounds, swimming pools, river put-in/take-out facilities, ice hockey
5 Demand survey measured both higher users per household and times playing per month for basketball
Capacity of each facility ÷
Demand for that facility per capita
= Population served per park
system facility
Small Community Parks & Recreation Standards 16
rinks, and skateparks serve large blocks of population, in the 6,000-15,000 person range.
° Note that although group picnic areas can serve population up to 15 times more than the smaller family area, studies indicate that less than 10% of all household picnics require group sized areas6,.
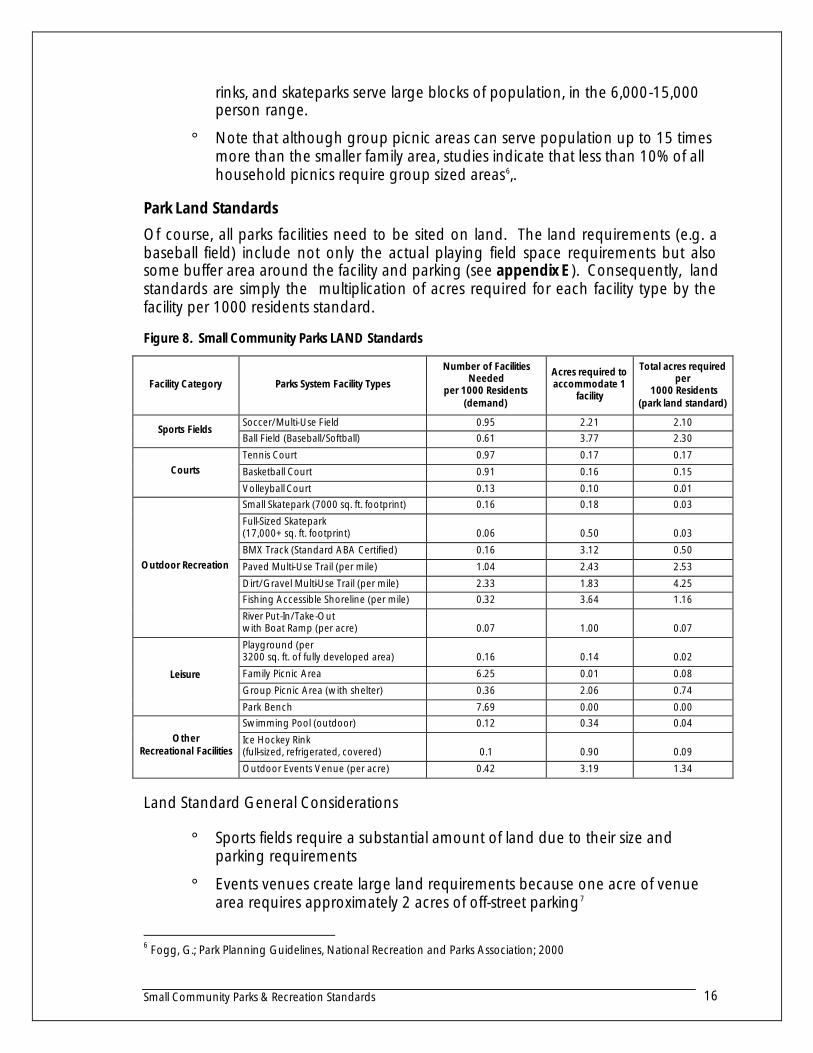
Park Land Standards
Of course, all parks facilities need to be sited on land. The land requirements (e.g. a baseball field) include not only the actual playing field space requirements but also some buffer area around the facility and parking (see appendix E ). Consequently, land standards are simply the multiplication of acres required for each facility type by the facility per 1000 residents standard.
Figure 8. Small Community Parks LAND Standards
Facility Category Parks System Facility Types
Number of Facilities Needed
per 1000 Residents (demand)
Acres required to accommodate 1
facility
Total acres required per
1000 Residents (park land standard)
Soccer/Multi-Use Field 0.95 2.21 2.10 Sports Fields
Ball Field (Baseball/Softball) 0.61 3.77 2.30
Tennis Court 0.97 0.17 0.17
Basketball Court 0.91 0.16 0.15 Courts
Volleyball Court 0.13 0.10 0.01 Small Skatepark (7000 sq. ft. footprint) 0.16 0.18 0.03
Full-Sized Skatepark (17,000+ sq. ft. footprint) 0.06 0.50 0.03
BMX Track (Standard ABA Certified) 0.16 3.12 0.50
Paved Multi-Use Trail (per mile) 1.04 2.43 2.53
Dirt/Gravel Multi-Use Trail (per mile) 2.33 1.83 4.25 Fishing Accessible Shoreline (per mile) 0.32 3.64 1.16
Outdoor Recreation
River Put-In/Take-Out with Boat Ramp (per acre) 0.07 1.00 0.07
Playground (per 3200 sq. ft. of fully developed area) 0.16 0.14 0.02
Family Picnic Area 6.25 0.01 0.08
Group Picnic Area (with shelter) 0.36 2.06 0.74 Leisure
Park Bench 7.69 0.00 0.00 Swimming Pool (outdoor) 0.12 0.34 0.04
Ice Hockey Rink (full-sized, refrigerated, covered) 0.1 0.90 0.09
Other Recreational Facilities
Outdoor Events Venue (per acre) 0.42 3.19 1.34
Land Standard General Considerations
° Sports fields require a substantial amount of land due to their size and parking requirements
° Events venues create large land requirements because one acre of venue area requires approximately 2 acres of off-street parking7
6 Fogg, G.; Park Planning Guidelines, National Recreation and Parks Association; 2000
Small Community Parks & Recreation Standards 17
° Trails and fishing access also requires a substantial land base, due to the length of trails (with 15-20 ft. buffers) and width of a standard fishing access (30 ft.)
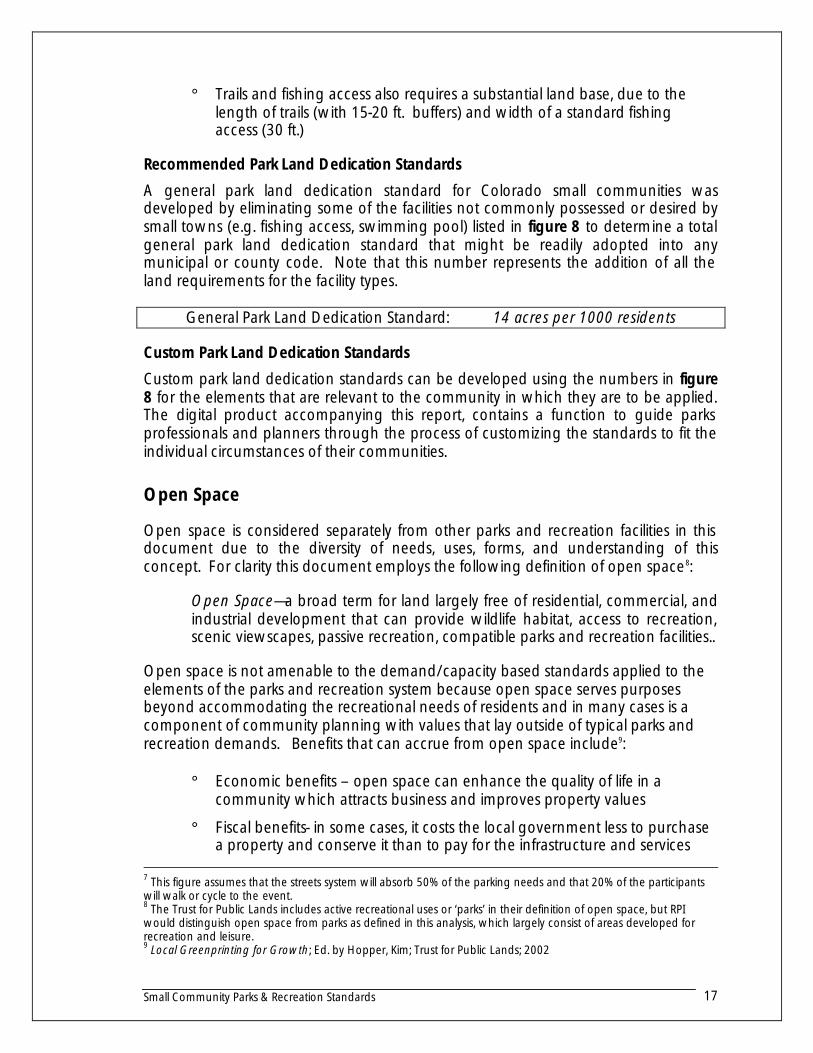
Recommended Park Land Dedication Standards
A general park land dedication standard for Colorado small communities was developed by eliminating some of the facilities not commonly possessed or desired by small towns (e.g. fishing access, swimming pool) listed in figure 8 to determine a total general park land dedication standard that might be readily adopted into any municipal or county code. Note that this number represents the addition of all the land requirements for the facility types.
General Park Land Dedication Standard: 14 acres per 1000 residents
Custom Park Land Dedication Standards
Custom park land dedication standards can be developed using the numbers in figure 8 for the elements that are relevant to the community in which they are to be applied. The digital product accompanying this report, contains a function to guide parks professionals and planners through the process of customizing the standards to fit the individual circumstances of their communities.
Open Space
Open space is considered separately from other parks and recreation facilities in this document due to the diversity of needs, uses, forms, and understanding of this concept. For clarity this document employs the following definition of open space8:
Open Space—a broad term for land largely free of residential, commercial, and industrial development that can provide wildlife habitat, access to recreation, scenic viewscapes, passive recreation, compatible parks and recreation facilities..
Open space is not amenable to the demand/capacity based standards applied to the elements of the parks and recreation system because open space serves purposes beyond accommodating the recreational needs of residents and in many cases is a component of community planning with values that lay outside of typical parks and recreation demands. Benefits that can accrue from open space include9:
° Economic benefits – open space can enhance the quality of life in a community which attracts business and improves property values
° Fiscal benefits- in some cases, it costs the local government less to purchase a property and conserve it than to pay for the infrastructure and services
7 This figure assumes that the streets system will absorb 50% of the parking needs and that 20% of the participants will walk or cycle to the event. 8 The Trust for Public Lands includes active recreational uses or ‘parks’ in their definition of open space, but RPI would distinguish open space from parks as defined in this analysis, which largely consist of areas developed for recreation and leisure. 9 Local Greenprinting for Growth; Ed. by Hopper, Kim; Trust for Public Lands; 2002
Small Community Parks & Recreation Standards 18
required for private development, similarly in some cases purchase of watersheds can lead to decreased treatment costs.
° Protected river corridors keeps construction from the floodplain, preventing costly damage to personal property
° Environmental and aesthetic benefits
Because open space can serve so many purposes, the quantity of open space a community needs to acquire can vary enormously depending on proximity to state and federally owned lands and the planned priorities of the community. Where one community needs to acquire narrow, linear pieces of property along a river corridor, others may want to purchase large agricultural or habitat holdings.
Ultimately, open space goals and priorities for small towns are best developed in a local planning process. Nonetheless, the following section provides information on open space programs among 45 small communities.
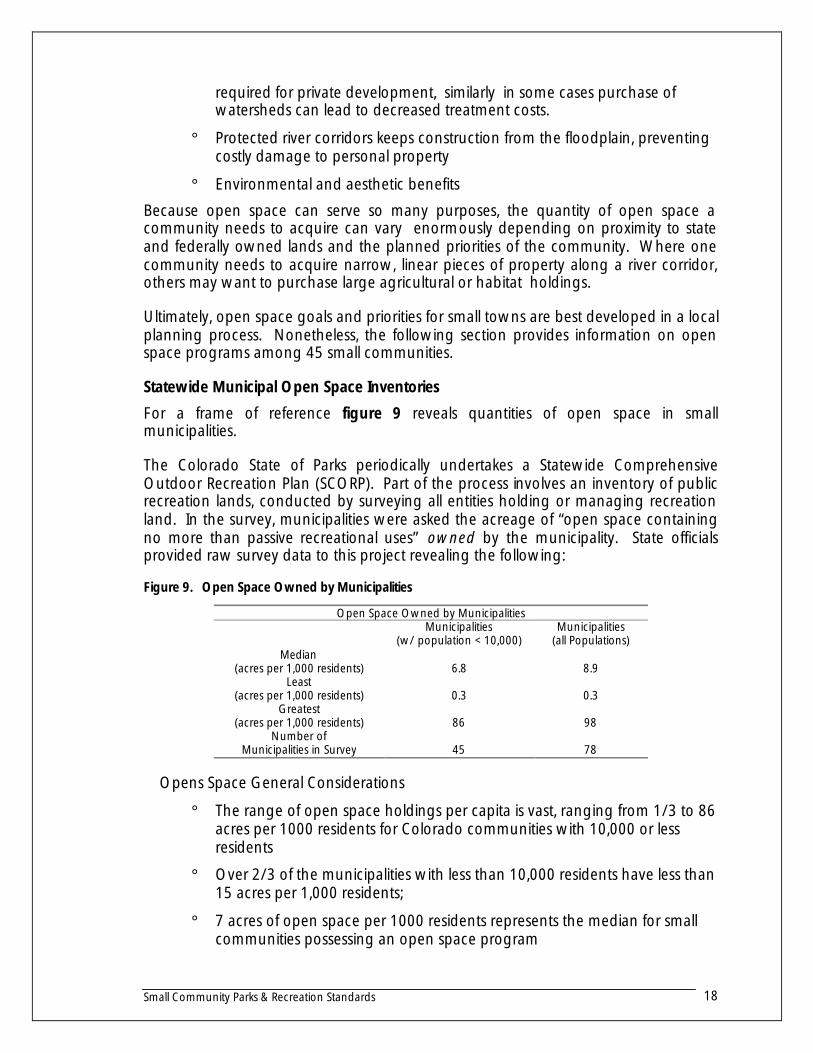
Statewide Municipal Open Space Inventories
For a frame of reference figure 9 reveals quantities of open space in small municipalities.
The Colorado State of Parks periodically undertakes a Statewide Comprehensive Outdoor Recreation Plan (SCORP). Part of the process involves an inventory of public recreation lands, conducted by surveying all entities holding or managing recreation land. In the survey, municipalities were asked the acreage of “open space containing no more than passive recreational uses” owned by the municipality. State officials provided raw survey data to this project revealing the following:
Figure 9. Open Space Owned by Municipalities
Open Space Owned by Municipalities
Municipalities
(w/ population < 10,000) Municipalities
(all Populations) Median
(acres per 1,000 residents) 6.8 8.9 Least
(acres per 1,000 residents) 0.3 0.3 Greatest
(acres per 1,000 residents) 86 98 Number of
Municipalities in Survey 45 78
Opens Space General Considerations
° The range of open space holdings per capita is vast, ranging from 1/3 to 86 acres per 1000 residents for Colorado communities with 10,000 or less residents
° Over 2/3 of the municipalities with less than 10,000 residents have less than 15 acres per 1,000 residents;
° 7 acres of open space per 1000 residents represents the median for small communities possessing an open space program
Small Community Parks & Recreation Standards 19
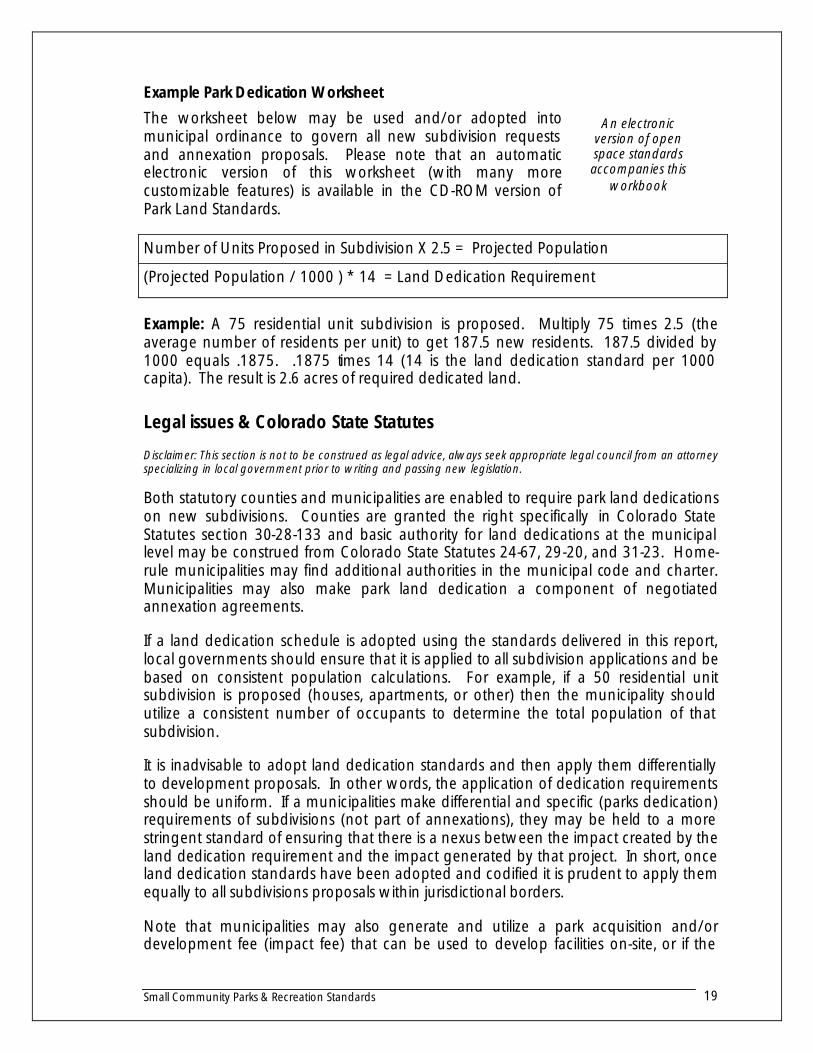
Example Park Dedication Worksheet
The worksheet below may be used and/or adopted into municipal ordinance to govern all new subdivision requests and annexation proposals. Please note that an automatic electronic version of this worksheet (with many more customizable features) is available in the CD-ROM version of Park Land Standards.
Number of Units Proposed in Subdivision X 2.5 = Projected Population
(Projected Population / 1000 ) * 14 = Land Dedication Requirement
Example: A 75 residential unit subdivision is proposed. Multiply 75 times 2.5 (the average number of residents per unit) to get 187.5 new residents. 187.5 divided by 1000 equals .1875. .1875 times 14 (14 is the land dedication standard per 1000 capita). The result is 2.6 acres of required dedicated land.
Legal issues & Colorado State Statutes
Disclaimer: This section is not to be construed as legal advice, always seek appropriate legal council from an attorney specializing in local government prior to writing and passing new legislation. Both statutory counties and municipalities are enabled to require park land dedications on new subdivisions. Counties are granted the right specifically in Colorado State Statutes section 30-28-133 and basic authority for land dedications at the municipal level may be construed from Colorado State Statutes 24-67, 29-20, and 31-23. Home-rule municipalities may find additional authorities in the municipal code and charter. Municipalities may also make park land dedication a component of negotiated annexation agreements.
If a land dedication schedule is adopted using the standards delivered in this report, local governments should ensure that it is applied to all subdivision applications and be based on consistent population calculations. For example, if a 50 residential unit subdivision is proposed (houses, apartments, or other) then the municipality should utilize a consistent number of occupants to determine the total population of that subdivision.
It is inadvisable to adopt land dedication standards and then apply them differentially to development proposals. In other words, the application of dedication requirements should be uniform. If a municipalities make differential and specific (parks dedication) requirements of subdivisions (not part of annexations), they may be held to a more stringent standard of ensuring that there is a nexus between the impact created by the land dedication requirement and the impact generated by that project. In short, once land dedication standards have been adopted and codified it is prudent to apply them equally to all subdivisions proposals within jurisdictional borders.
Note that municipalities may also generate and utilize a park acquisition and/or development fee (impact fee) that can be used to develop facilities on-site, or if the
An electronic version of open space standards accompanies this
workbook
Small Community Parks & Recreation Standards 20
community desires to apply a fee to all new building permits. This activity is beholden to other standards for calculation methodology and legal considerations. Please contact the Rural Planning Institute (RPI) at (970)-382-9153 for more information about these effective park facility planning and financing tools.
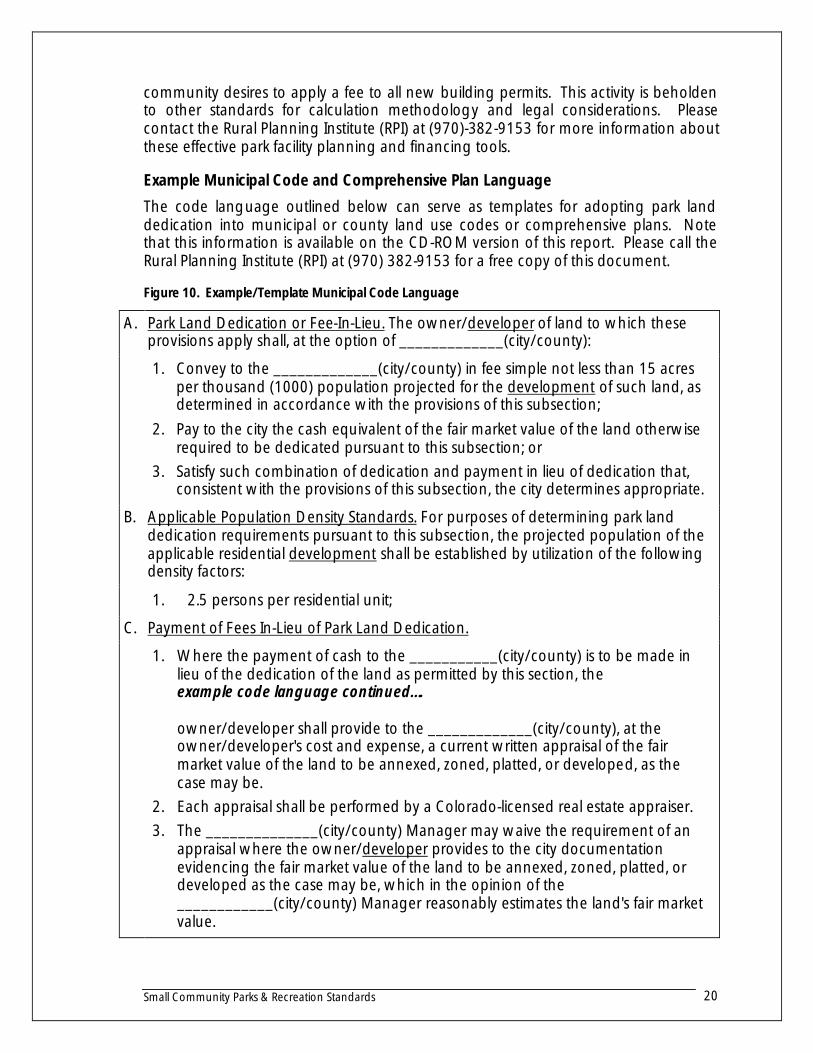
Example Municipal Code and Comprehensive Plan Language
The code language outlined below can serve as templates for adopting park land dedication into municipal or county land use codes or comprehensive plans. Note that this information is available on the CD-ROM version of this report. Please call the Rural Planning Institute (RPI) at (970) 382-9153 for a free copy of this document.
Figure 10. Example/Template Municipal Code Language
A. Park Land Dedication or Fee-In-Lieu. The owner/developer of land to which these provisions apply shall, at the option of _____________(city/county):
1. Convey to the _____________(city/county) in fee simple not less than 15 acres per thousand (1000) population projected for the development of such land, as determined in accordance with the provisions of this subsection;
2. Pay to the city the cash equivalent of the fair market value of the land otherwise required to be dedicated pursuant to this subsection; or
3. Satisfy such combination of dedication and payment in lieu of dedication that, consistent with the provisions of this subsection, the city determines appropriate.
B. Applicable Population Density Standards. For purposes of determining park land dedication requirements pursuant to this subsection, the projected population of the applicable residential development shall be established by utilization of the following density factors:
1. 2.5 persons per residential unit; C. Payment of Fees In-Lieu of Park Land Dedication. 1. Where the payment of cash to the ___________(city/county) is to be made in
lieu of the dedication of the land as permitted by this section, the example code language continued…. owner/developer shall provide to the _____________(city/county), at the owner/developer's cost and expense, a current written appraisal of the fair market value of the land to be annexed, zoned, platted, or developed, as the case may be.
2. Each appraisal shall be performed by a Colorado-licensed real estate appraiser. 3. The ______________(city/county) Manager may waive the requirement of an
appraisal where the owner/developer provides to the city documentation evidencing the fair market value of the land to be annexed, zoned, platted, or developed as the case may be, which in the opinion of the ____________(city/county) Manager reasonably estimates the land's fair market value.
Small Community Parks & Recreation Standards 21
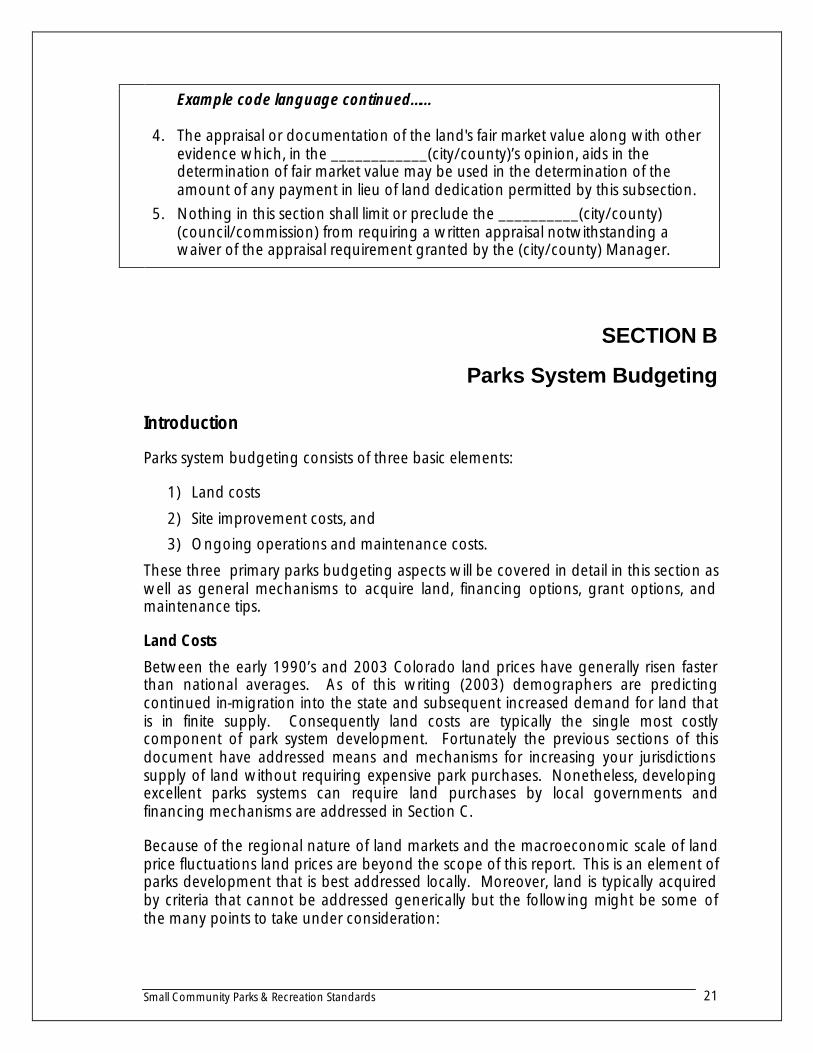
4.
Example code language continued…… The appraisal or documentation of the land's fair market value along with other evidence which, in the ____________(city/county)’s opinion, aids in the determination of fair market value may be used in the determination of the amount of any payment in lieu of land dedication permitted by this subsection.
5. Nothing in this section shall limit or preclude the __________(city/county) (council/commission) from requiring a written appraisal notwithstanding a waiver of the appraisal requirement granted by the (city/county) Manager.
SECTION B
Parks System Budgeting
Introduction
Parks system budgeting consists of three basic elements:
1) Land costs
2) Site improvement costs, and
3) Ongoing operations and maintenance costs.
These three primary parks budgeting aspects will be covered in detail in this section as well as general mechanisms to acquire land, financing options, grant options, and maintenance tips.
Land Costs
Between the early 1990’s and 2003 Colorado land prices have generally risen faster than national averages. As of this writing (2003) demographers are predicting continued in-migration into the state and subsequent increased demand for land that is in finite supply. Consequently land costs are typically the single most costly component of park system development. Fortunately the previous sections of this document have addressed means and mechanisms for increasing your jurisdictions supply of land without requiring expensive park purchases. Nonetheless, developing excellent parks systems can require land purchases by local governments and financing mechanisms are addressed in Section C.
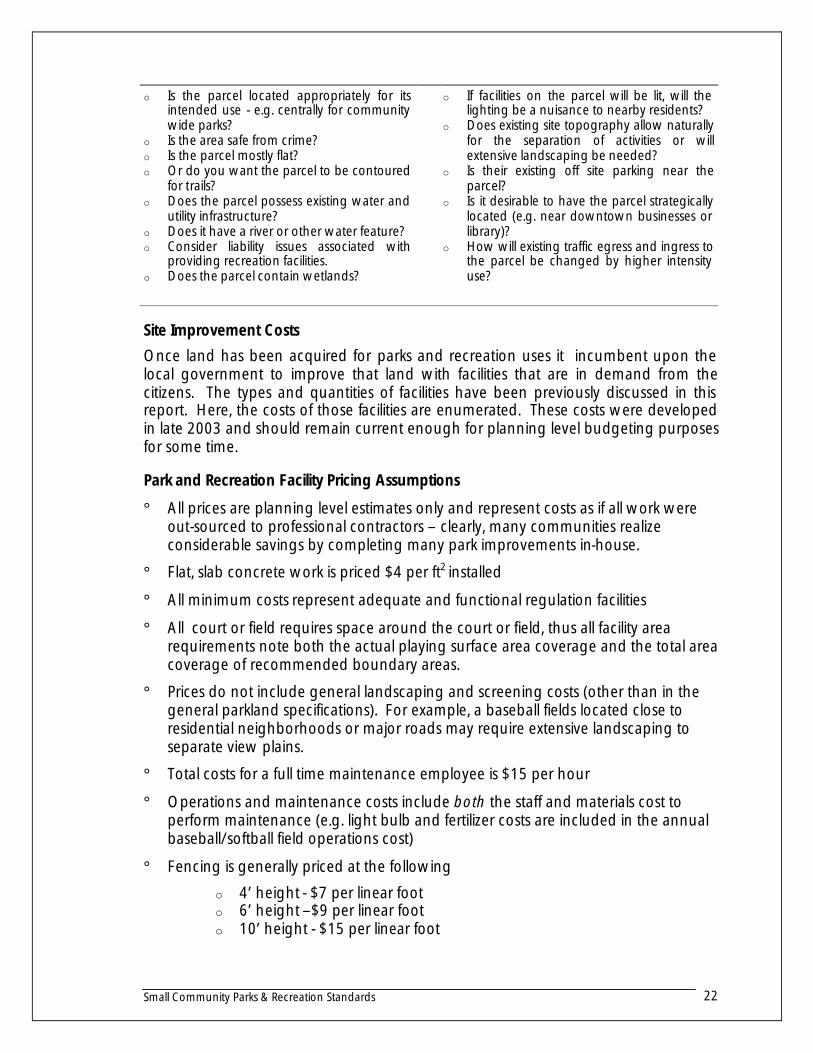
Because of the regional nature of land markets and the macroeconomic scale of land price fluctuations land prices are beyond the scope of this report. This is an element of parks development that is best addressed locally. Moreover, land is typically acquired by criteria that cannot be addressed generically but the following might be some of the many points to take under consideration:
Small Community Parks & Recreation Standards 22
o Is the parcel located appropriately for its intended use - e.g. centrally for community wide parks?
o Is the area safe from crime? o Is the parcel mostly flat? o Or do you want the parcel to be contoured
for trails? o Does the parcel possess existing water and
utility infrastructure? o Does it have a river or other water feature? o Consider liability issues associated with
providing recreation facilities. o Does the parcel contain wetlands?
o If facilities on the parcel will be lit, will the lighting be a nuisance to nearby residents?
o Does existing site topography allow naturally for the separation of activities or will extensive landscaping be needed?
o Is their existing off site parking near the parcel?
o Is it desirable to have the parcel strategically located (e.g. near downtown businesses or library)?
o How will existing traffic egress and ingress to the parcel be changed by higher intensity use?
Site Improvement Costs
Once land has been acquired for parks and recreation uses it incumbent upon the local government to improve that land with facilities that are in demand from the citizens. The types and quantities of facilities have been previously discussed in this report. Here, the costs of those facilities are enumerated. These costs were developed in late 2003 and should remain current enough for planning level budgeting purposes for some time.
Park and Recreation Facility Pricing Assumptions
° All prices are planning level estimates only and represent costs as if all work were out-sourced to professional contractors – clearly, many communities realize considerable savings by completing many park improvements in-house.
° Flat, slab concrete work is priced $4 per ft2 installed
° All minimum costs represent adequate and functional regulation facilities
° All court or field requires space around the court or field, thus all facility area requirements note both the actual playing surface area coverage and the total area coverage of recommended boundary areas.
° Prices do not include general landscaping and screening costs (other than in the general parkland specifications). For example, a baseball fields located close to residential neighborhoods or major roads may require extensive landscaping to separate view plains.
° Total costs for a full time maintenance employee is $15 per hour
° Operations and maintenance costs include both the staff and materials cost to perform maintenance (e.g. light bulb and fertilizer costs are included in the annual baseball/softball field operations cost)
° Fencing is generally priced at the following
o 4’ height - $7 per linear foot o 6’ height –$9 per linear foot o 10’ height - $15 per linear foot
Small Community Parks & Recreation Standards 23
° Sod is priced at $7 per square foot installed
° Lighting is priced at 30 candle feet per 1500 ft2 of area lighted for equipment and installation at $2,275 – note that this price can fluctuate enormously depending on materials, location, lighting codes etc.
° Spectator seating for 30 people may be added at $800 per bleacher unit (class B bleacher unit), and $2,000 per unit for 50 people (class A bleacher unit)
° FTE (full-time-employee) estimates are based on how many full time employees (based on 2080 total annual working hours) it will take annually to complete the maintenance on that particular facility. For example, it takes .3 FTE’s to maintain a single baseball field, if a community possessed three regulation baseball fields, it would likely require the hiring of a full time employee just to maintain those facilities through the season.
Small Community Parks & Recreation Standards 24
Park Facility Pricing & Dimensions
Baseball/Softball Fields
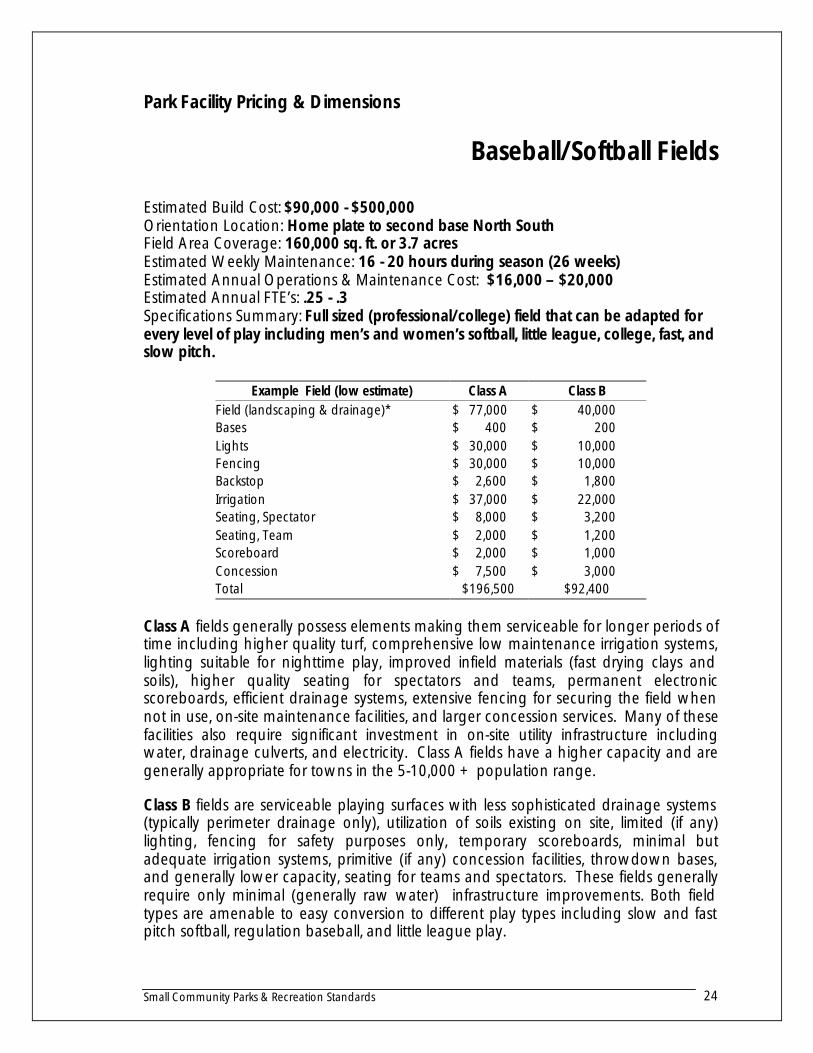
Estimated Build Cost: $90,000 - $500,000 Orientation Location: Home plate to second base North South Field Area Coverage: 160,000 sq. ft. or 3.7 acres Estimated Weekly Maintenance: 16 - 20 hours during season (26 weeks) Estimated Annual Operations & Maintenance Cost: $16,000 – $20,000 Estimated Annual FTE’s: .25 - .3 Specifications Summary: Full sized (professional/college) field that can be adapted for every level of play including men’s and women’s softball, little league, college, fast, and slow pitch.
Example Field (low estimate) Class A Class B Field (landscaping & drainage)* $ 77,000 $ 40,000 Bases $ 400 $ 200 Lights $ 30,000 $ 10,000 Fencing $ 30,000 $ 10,000 Backstop $ 2,600 $ 1,800 Irrigation $ 37,000 $ 22,000 Seating, Spectator $ 8,000 $ 3,200 Seating, Team $ 2,000 $ 1,200 Scoreboard $ 2,000 $ 1,000 Concession $ 7,500 $ 3,000 Total $196,500 $92,400
Class A fields generally possess elements making them serviceable for longer periods of time including higher quality turf, comprehensive low maintenance irrigation systems, lighting suitable for nighttime play, improved infield materials (fast drying clays and soils), higher quality seating for spectators and teams, permanent electronic scoreboards, efficient drainage systems, extensive fencing for securing the field when not in use, on-site maintenance facilities, and larger concession services. Many of these facilities also require significant investment in on-site utility infrastructure including water, drainage culverts, and electricity. Class A fields have a higher capacity and are generally appropriate for towns in the 5-10,000 + population range.
Class B fields are serviceable playing surfaces with less sophisticated drainage systems (typically perimeter drainage only), utilization of soils existing on site, limited (if any) lighting, fencing for safety purposes only, temporary scoreboards, minimal but adequate irrigation systems, primitive (if any) concession facilities, throwdown bases, and generally lower capacity, seating for teams and spectators. These fields generally require only minimal (generally raw water) infrastructure improvements. Both field types are amenable to easy conversion to different play types including slow and fast pitch softball, regulation baseball, and little league play.
Small Community Parks & Recreation Standards 25
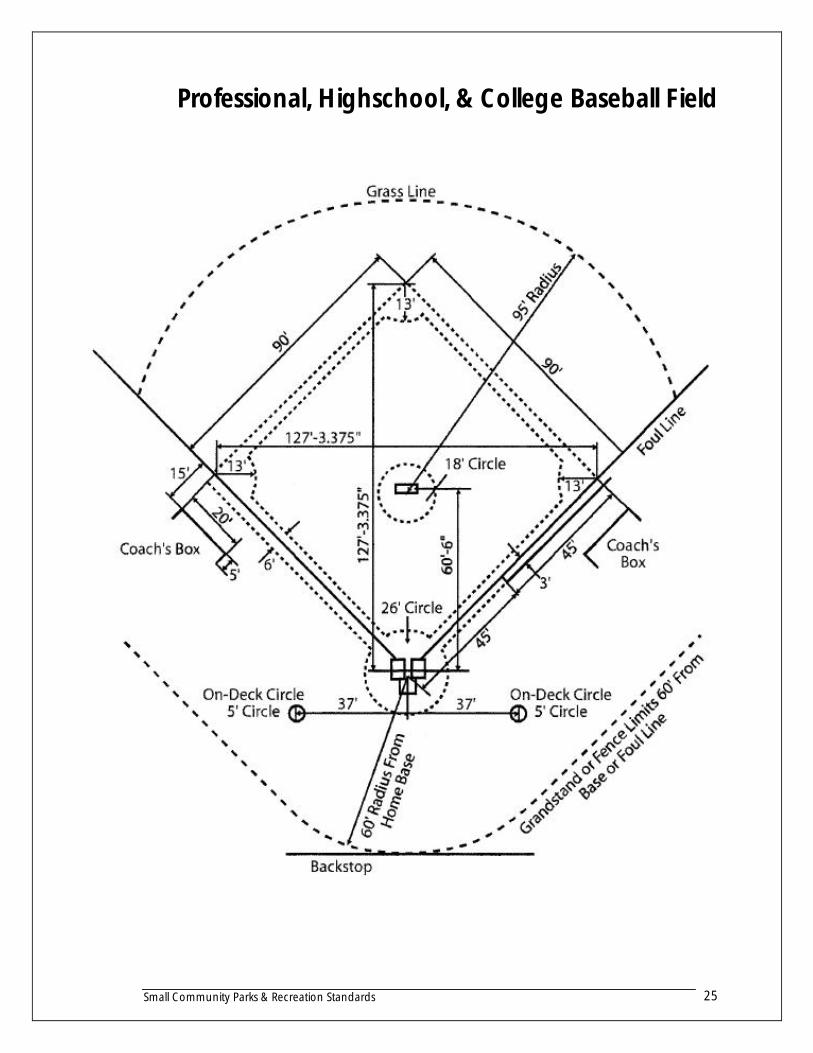
Professional, Highschool, & College Baseball Field
Small Community Parks & Recreation Standards 26
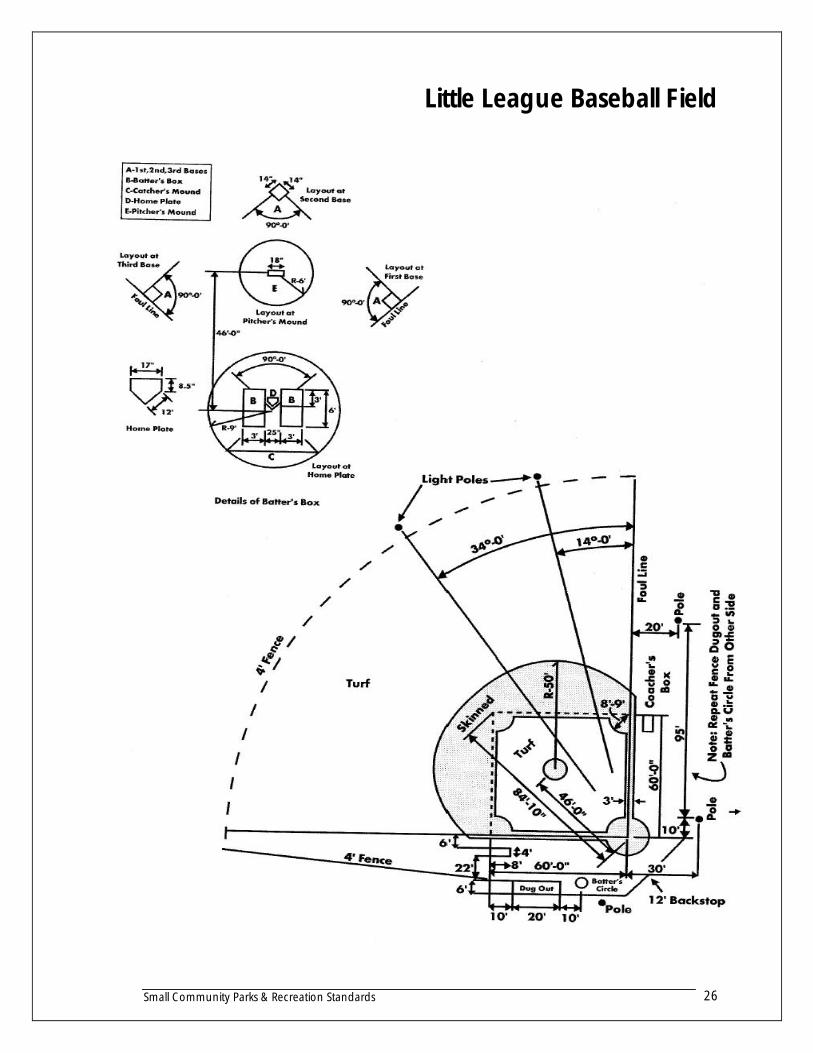
Little League Baseball Field
Small Community Parks & Recreation Standards 27
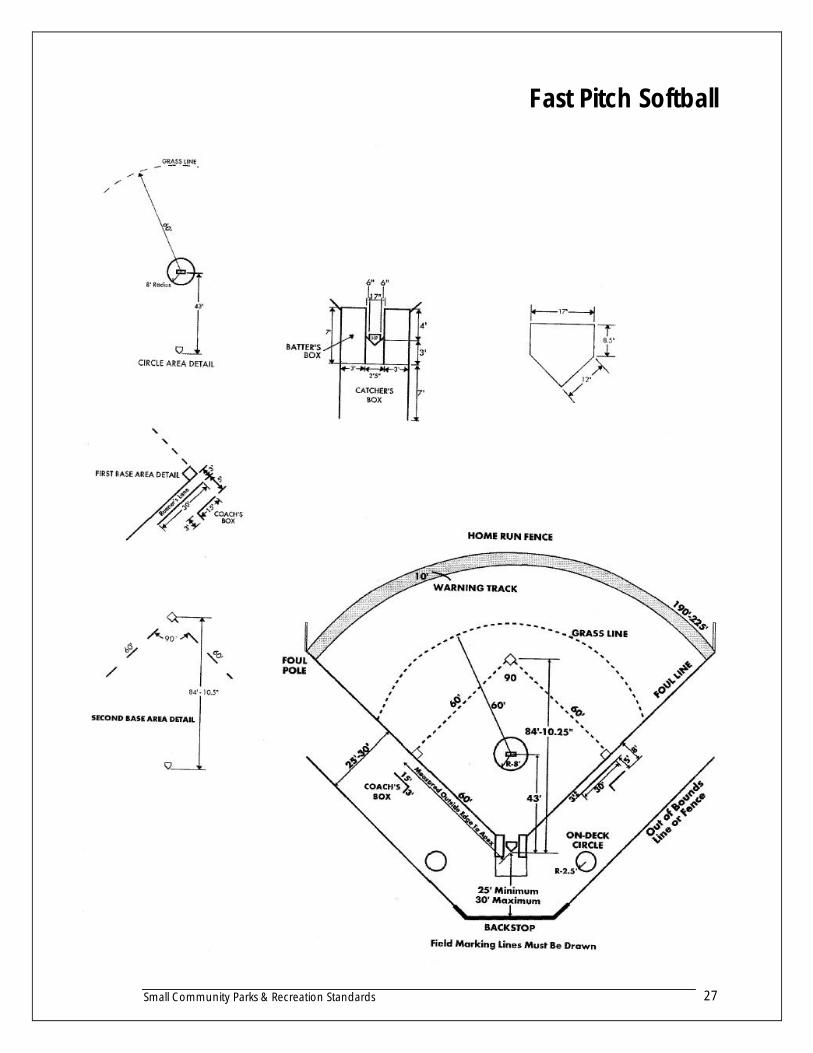
Fast Pitch Softball
Small Community Parks & Recreation Standards 28
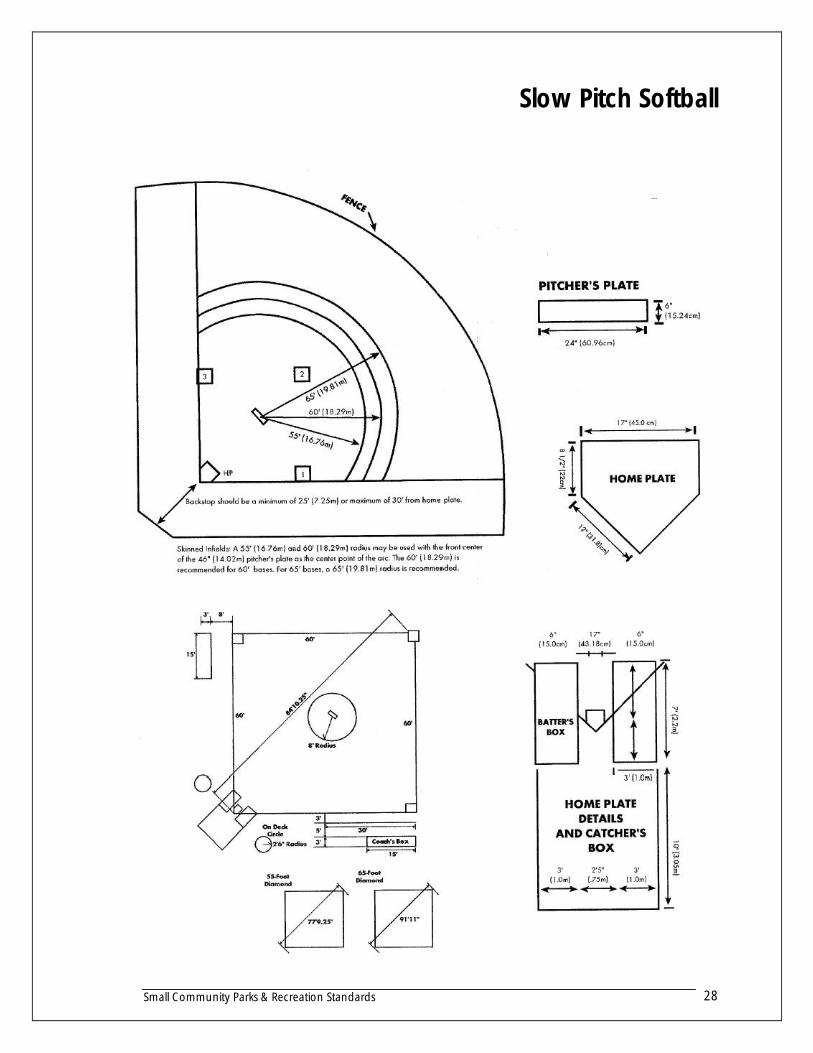
Slow Pitch Softball
Small Community Parks & Recreation Standards 29
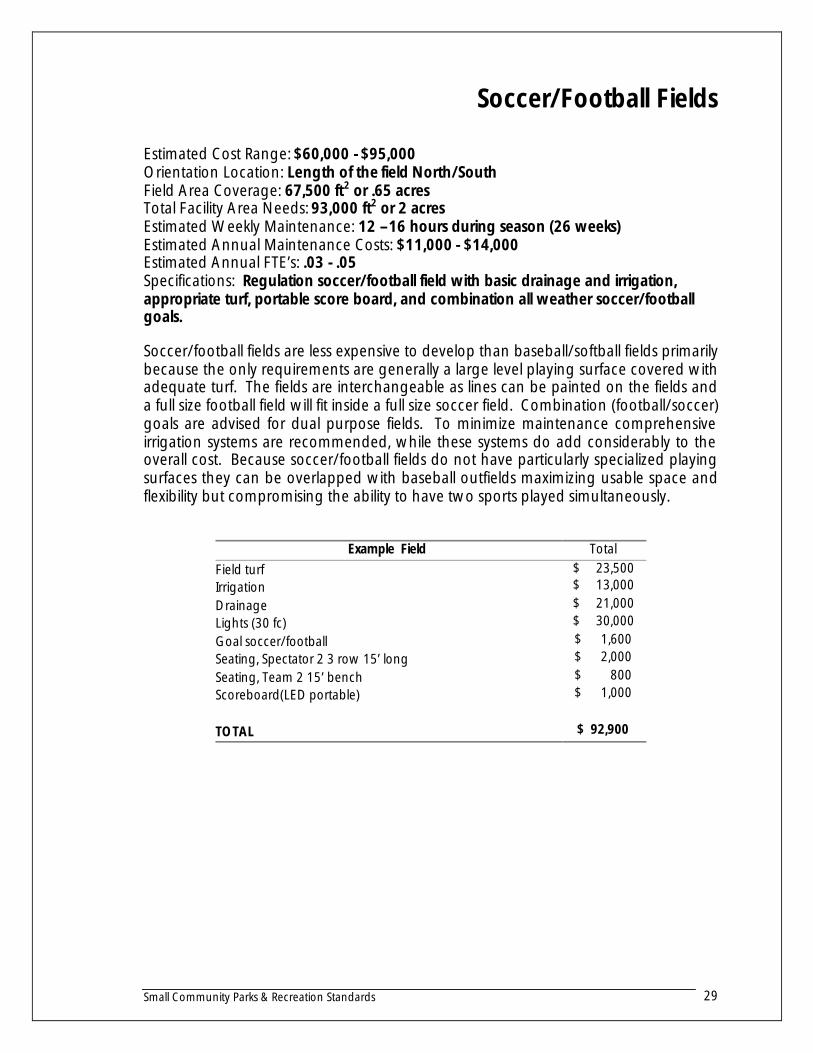
Soccer/Football Fields
Estimated Cost Range: $60,000 - $95,000 Orientation Location: Length of the field North/South Field Area Coverage: 67,500 ft2 or .65 acres Total Facility Area Needs: 93,000 ft2 or 2 acres Estimated Weekly Maintenance: 12 –16 hours during season (26 weeks) Estimated Annual Maintenance Costs: $11,000 - $14,000 Estimated Annual FTE’s: .03 - .05 Specifications: Regulation soccer/football field with basic drainage and irrigation, appropriate turf, portable score board, and combination all weather soccer/football goals.
Soccer/football fields are less expensive to develop than baseball/softball fields primarily because the only requirements are generally a large level playing surface covered with adequate turf. The fields are interchangeable as lines can be painted on the fields and a full size football field will fit inside a full size soccer field. Combination (football/soccer) goals are advised for dual purpose fields. To minimize maintenance comprehensive irrigation systems are recommended, while these systems do add considerably to the overall cost. Because soccer/football fields do not have particularly specialized playing surfaces they can be overlapped with baseball outfields maximizing usable space and flexibility but compromising the ability to have two sports played simultaneously.
Example Field Total
Field turf $ 23,500 Irrigation $ 13,000 Drainage $ 21,000 Lights (30 fc) $ 30,000 Goal soccer/football $ 1,600 Seating, Spectator 2 3 row 15’ long $ 2,000 Seating, Team 2 15’ bench $ 800 Scoreboard(LED portable) $ 1,000
TOTAL $ 92,900
Small Community Parks & Recreation Standards 30
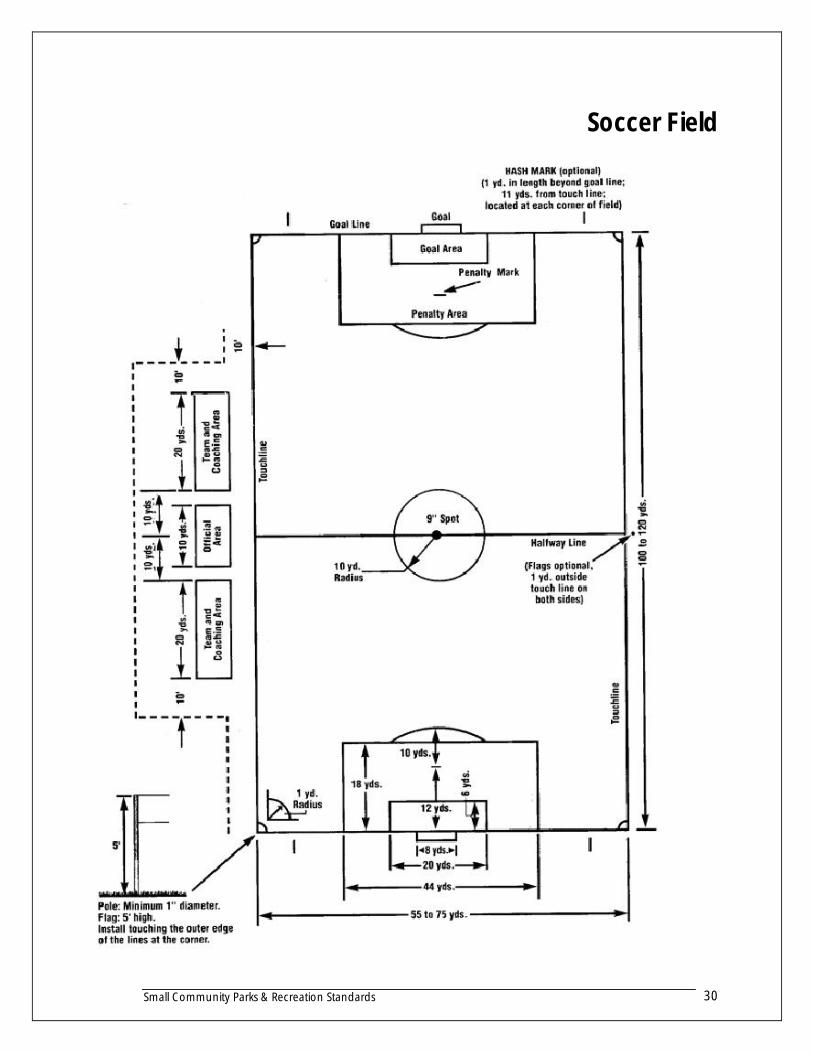
Soccer Field

Small Community Parks & Recreation Standards 31
College/Recreation Football Field
Small Community Parks & Recreation Standards 32
Tennis Courts
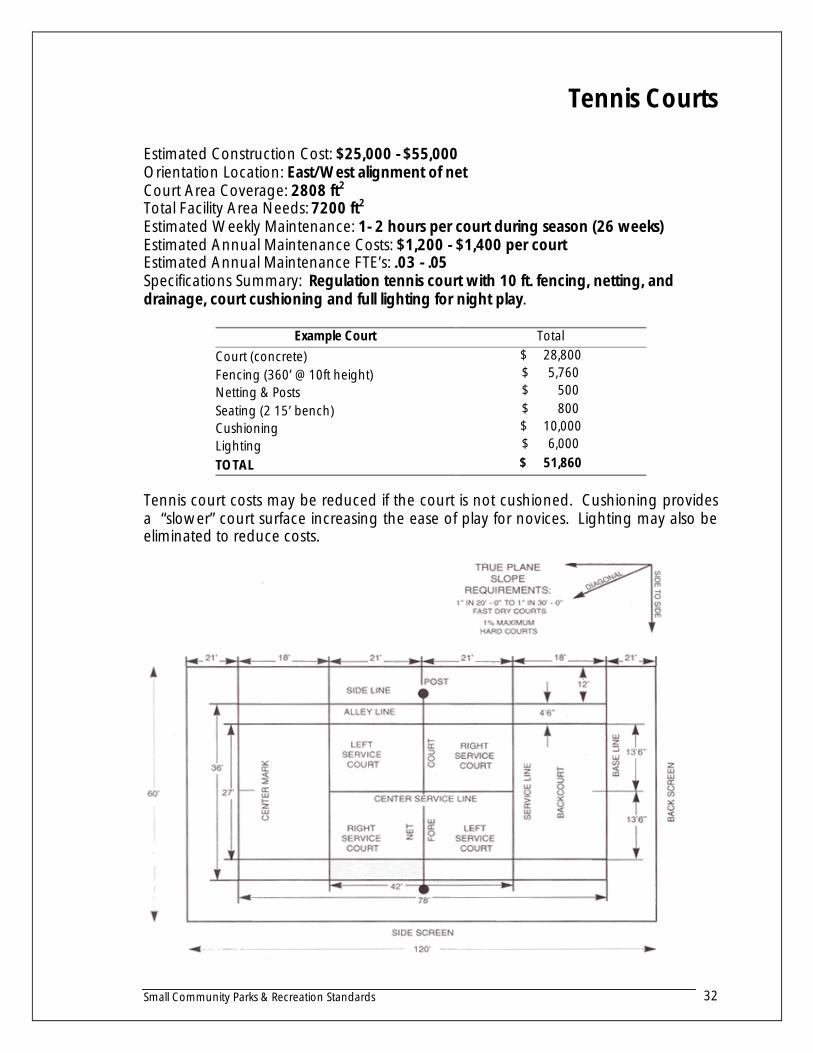
Estimated Construction Cost: $25,000 - $55,000 Orientation Location: East/West alignment of net Court Area Coverage: 2808 ft2
Total Facility Area Needs: 7200 ft2 Estimated Weekly Maintenance: 1- 2 hours per court during season (26 weeks) Estimated Annual Maintenance Costs: $1,200 - $1,400 per court Estimated Annual Maintenance FTE’s: .03 - .05 Specifications Summary: Regulation tennis court with 10 ft. fencing, netting, and drainage, court cushioning and full lighting for night play.
Example Court Total Court (concrete) $ 28,800 Fencing (360’ @ 10ft height) $ 5,760 Netting & Posts $ 500 Seating (2 15’ bench) $ 800 Cushioning $ 10,000 Lighting $ 6,000
TOTAL $ 51,860
Tennis court costs may be reduced if the court is not cushioned. Cushioning provides a “slower” court surface increasing the ease of play for novices. Lighting may also be eliminated to reduce costs.
Small Community Parks & Recreation Standards 33
Basketball Courts
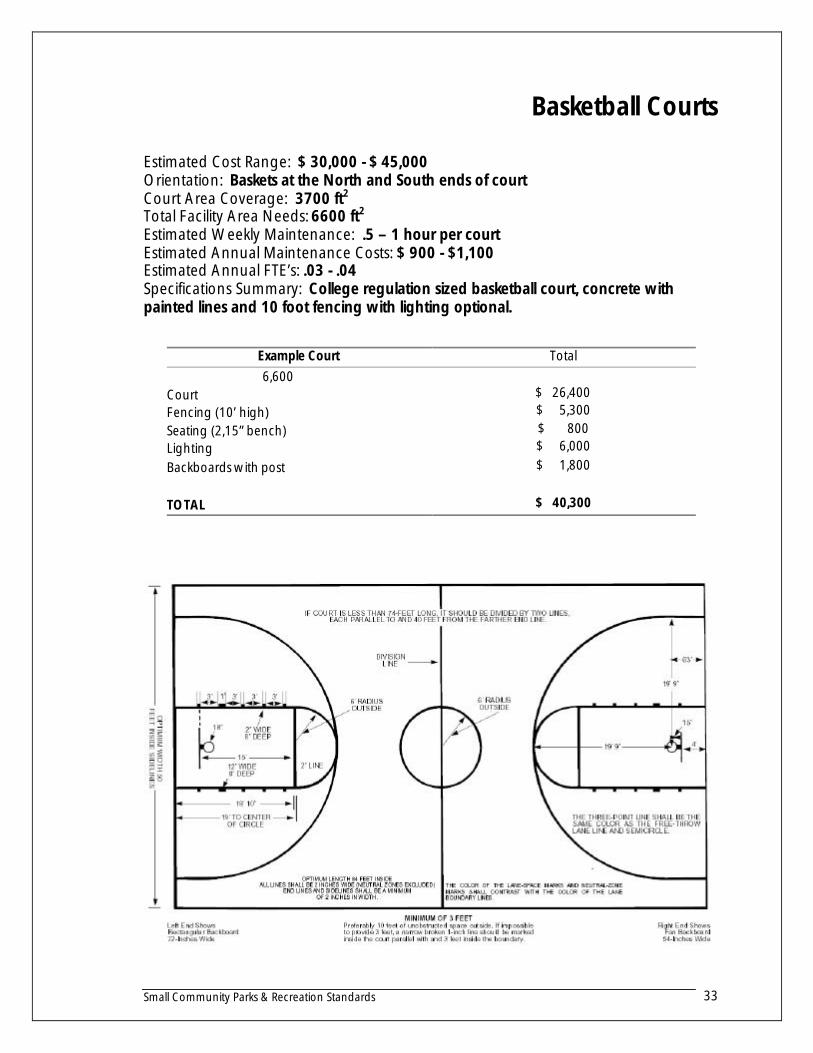
Estimated Cost Range: $ 30,000 - $ 45,000 Orientation: Baskets at the North and South ends of court Court Area Coverage: 3700 ft2 Total Facility Area Needs: 6600 ft2 Estimated Weekly Maintenance: .5 – 1 hour per court Estimated Annual Maintenance Costs: $ 900 - $1,100 Estimated Annual FTE’s: .03 - .04 Specifications Summary: College regulation sized basketball court, concrete with painted lines and 10 foot fencing with lighting optional.
Example Court Total 6,600 Court $ 26,400 Fencing (10’ high) $ 5,300 Seating (2,15” bench) $ 800 Lighting $ 6,000
Backboards with post $ 1,800
TOTAL $ 40,300
Small Community Parks & Recreation Standards 34
Volleyball Court - Sand
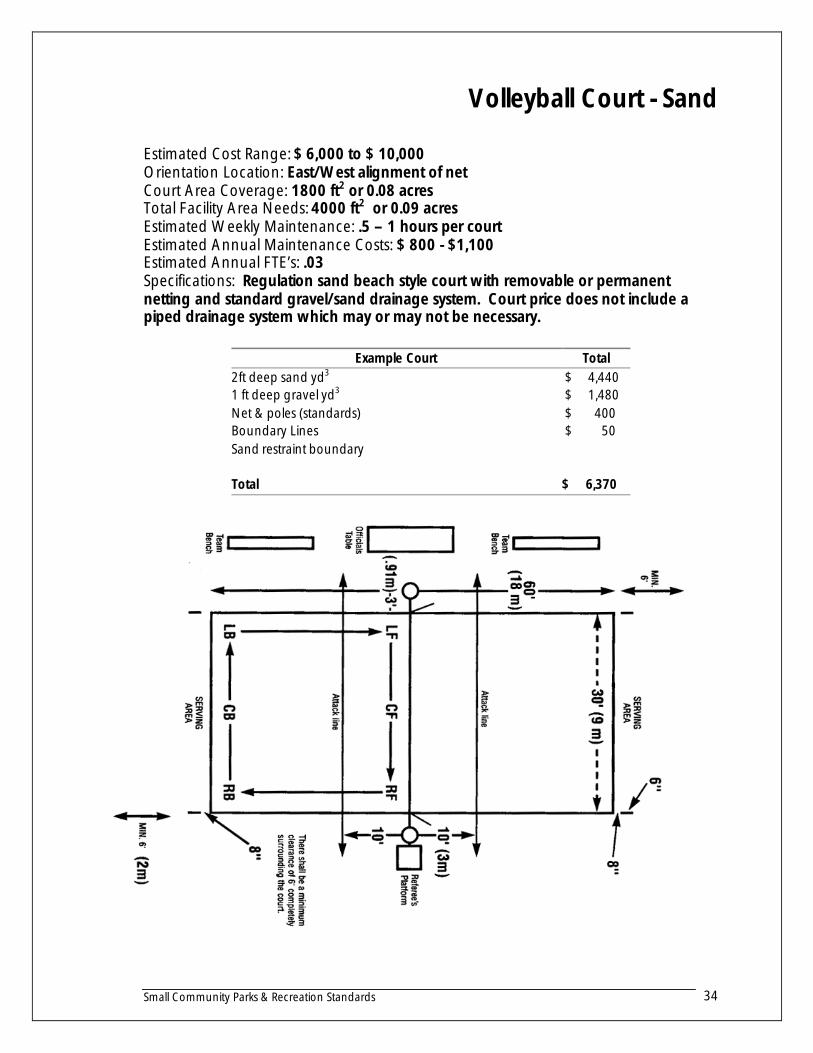
Estimated Cost Range: $ 6,000 to $ 10,000 Orientation Location: East/West alignment of net Court Area Coverage: 1800 ft2 or 0.08 acres Total Facility Area Needs: 4000 ft2 or 0.09 acres Estimated Weekly Maintenance: .5 – 1 hours per court Estimated Annual Maintenance Costs: $ 800 - $1,100 Estimated Annual FTE’s: .03 Specifications: Regulation sand beach style court with removable or permanent netting and standard gravel/sand drainage system. Court price does not include a piped drainage system which may or may not be necessary.
Example Court Total 2ft deep sand yd3 $ 4,440 1 ft deep gravel yd3 $ 1,480 Net & poles (standards) $ 400 Boundary Lines $ 50 Sand restraint boundary Total $ 6,370
Small Community Parks & Recreation Standards 35
Skateboard Park
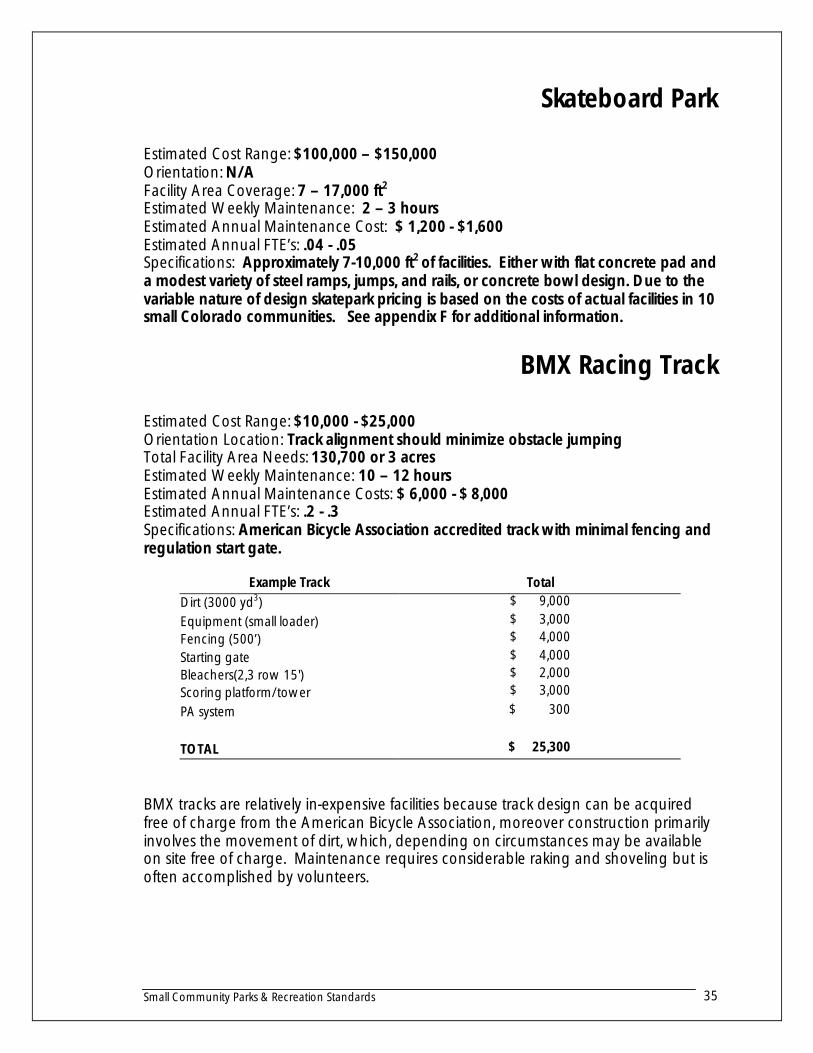
Estimated Cost Range: $100,000 – $150,000 Orientation: N/A Facility Area Coverage: 7 – 17,000 ft2
Estimated Weekly Maintenance: 2 – 3 hours Estimated Annual Maintenance Cost: $ 1,200 - $1,600 Estimated Annual FTE’s: .04 - .05 Specifications: Approximately 7-10,000 ft2 of facilities. Either with flat concrete pad and a modest variety of steel ramps, jumps, and rails, or concrete bowl design. Due to the variable nature of design skatepark pricing is based on the costs of actual facilities in 10 small Colorado communities. See appendix F for additional information.
BMX Racing Track
Estimated Cost Range: $10,000 - $25,000 Orientation Location: Track alignment should minimize obstacle jumping Total Facility Area Needs: 130,700 or 3 acres Estimated Weekly Maintenance: 10 – 12 hours Estimated Annual Maintenance Costs: $ 6,000 - $ 8,000 Estimated Annual FTE’s: .2 - .3 Specifications: American Bicycle Association accredited track with minimal fencing and regulation start gate.
Example Track Total Dirt (3000 yd3) $ 9,000 Equipment (small loader) $ 3,000 Fencing (500’) $ 4,000 Starting gate $ 4,000 Bleachers(2,3 row 15') $ 2,000 Scoring platform/tower $ 3,000
PA system $ 300
TOTAL $ 25,300
BMX tracks are relatively in-expensive facilities because track design can be acquired free of charge from the American Bicycle Association, moreover construction primarily involves the movement of dirt, which, depending on circumstances may be available on site free of charge. Maintenance requires considerable raking and shoveling but is often accomplished by volunteers.
Small Community Parks & Recreation Standards 36
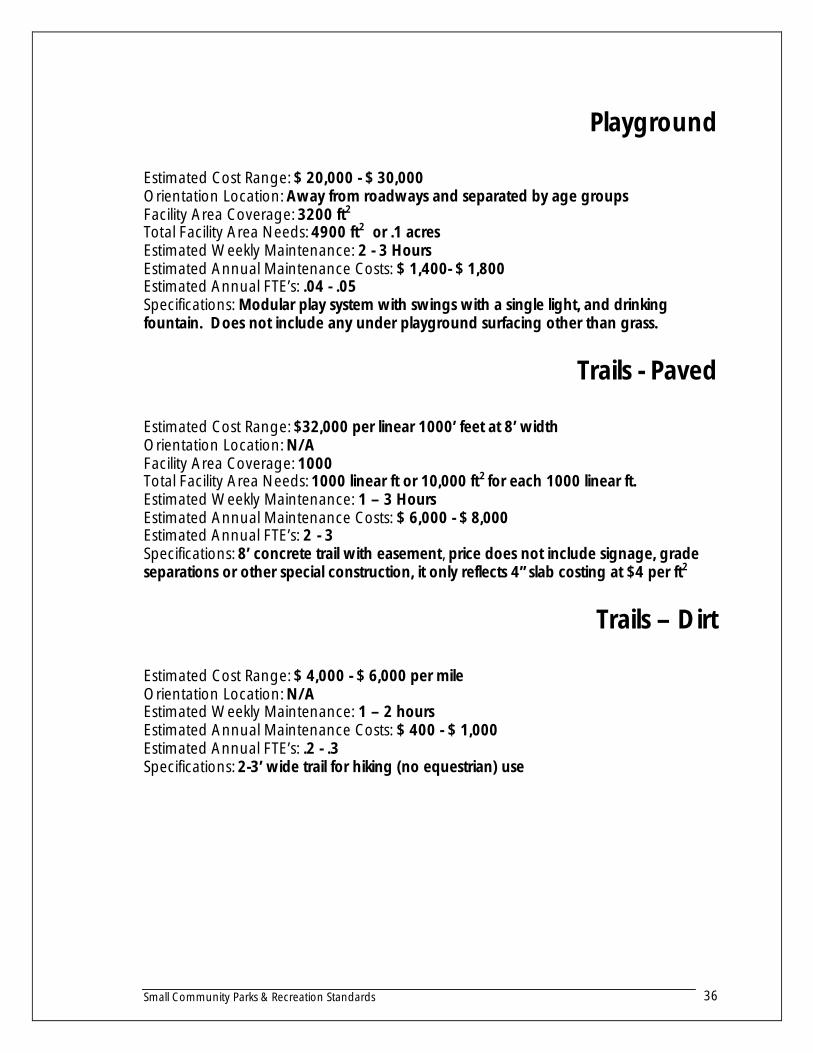
Playground
Estimated Cost Range: $ 20,000 - $ 30,000 Orientation Location: Away from roadways and separated by age groups Facility Area Coverage: 3200 ft2
Total Facility Area Needs: 4900 ft2 or .1 acres Estimated Weekly Maintenance: 2 - 3 Hours Estimated Annual Maintenance Costs: $ 1,400- $ 1,800 Estimated Annual FTE’s: .04 - .05 Specifications: Modular play system with swings with a single light, and drinking fountain. Does not include any under playground surfacing other than grass.
Trails - Paved
Estimated Cost Range: $32,000 per linear 1000’ feet at 8’ width Orientation Location: N/A Facility Area Coverage: 1000 Total Facility Area Needs: 1000 linear ft or 10,000 ft2 for each 1000 linear ft. Estimated Weekly Maintenance: 1 – 3 Hours Estimated Annual Maintenance Costs: $ 6,000 - $ 8,000 Estimated Annual FTE’s: 2 - 3 Specifications: 8’ concrete trail with easement, price does not include signage, grade separations or other special construction, it only reflects 4” slab costing at $4 per ft2
Trails – Dirt
Estimated Cost Range: $ 4,000 - $ 6,000 per mile Orientation Location: N/A Estimated Weekly Maintenance: 1 – 2 hours Estimated Annual Maintenance Costs: $ 400 - $ 1,000 Estimated Annual FTE’s: .2 - .3 Specifications: 2-3’ wide trail for hiking (no equestrian) use
Small Community Parks & Recreation Standards 37
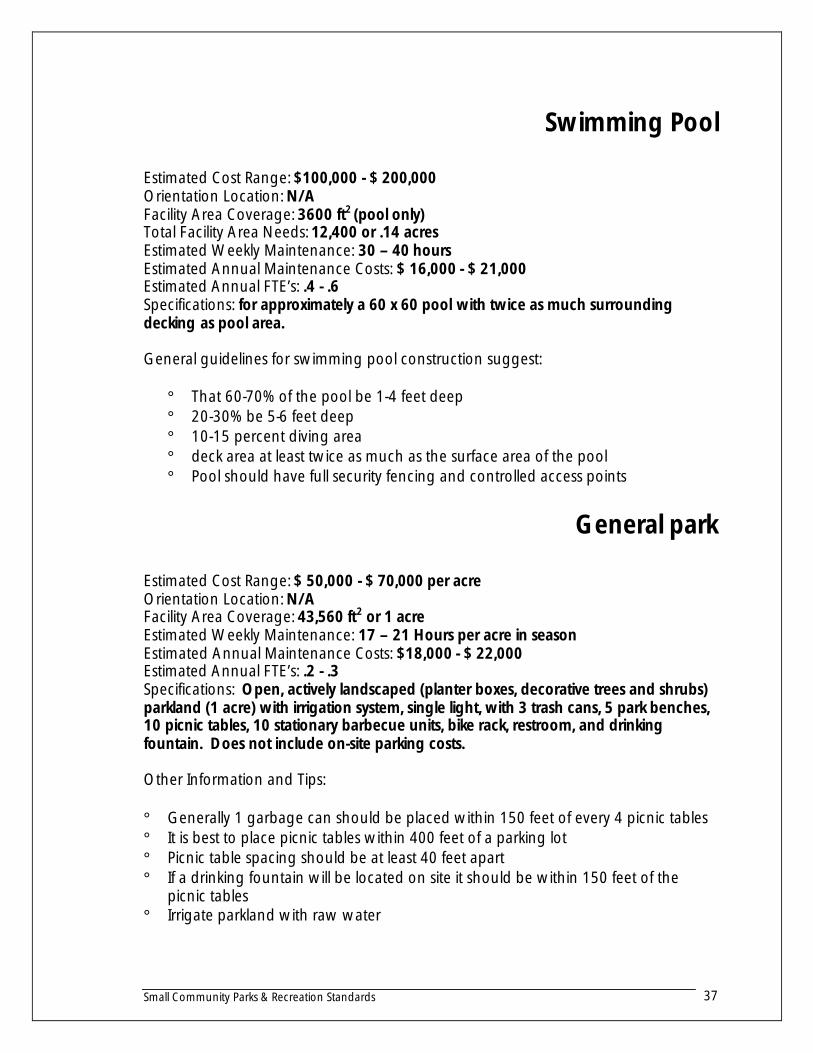
Swimming Pool
Estimated Cost Range: $100,000 - $ 200,000 Orientation Location: N/A Facility Area Coverage: 3600 ft2 (pool only) Total Facility Area Needs: 12,400 or .14 acres Estimated Weekly Maintenance: 30 – 40 hours Estimated Annual Maintenance Costs: $ 16,000 - $ 21,000 Estimated Annual FTE’s: .4 - .6 Specifications: for approximately a 60 x 60 pool with twice as much surrounding decking as pool area. General guidelines for swimming pool construction suggest:
° That 60-70% of the pool be 1-4 feet deep ° 20-30% be 5-6 feet deep ° 10-15 percent diving area ° deck area at least twice as much as the surface area of the pool ° Pool should have full security fencing and controlled access points
General park
Estimated Cost Range: $ 50,000 - $ 70,000 per acre Orientation Location: N/A Facility Area Coverage: 43,560 ft2 or 1 acre Estimated Weekly Maintenance: 17 – 21 Hours per acre in season Estimated Annual Maintenance Costs: $18,000 - $ 22,000 Estimated Annual FTE’s: .2 - .3 Specifications: Open, actively landscaped (planter boxes, decorative trees and shrubs) parkland (1 acre) with irrigation system, single light, with 3 trash cans, 5 park benches, 10 picnic tables, 10 stationary barbecue units, bike rack, restroom, and drinking fountain. Does not include on-site parking costs. Other Information and Tips: ° Generally 1 garbage can should be placed within 150 feet of every 4 picnic tables ° It is best to place picnic tables within 400 feet of a parking lot ° Picnic table spacing should be at least 40 feet apart ° If a drinking fountain will be located on site it should be within 150 feet of the
picnic tables ° Irrigate parkland with raw water
Small Community Parks & Recreation Standards 38
SECTION C
Developing a Parks System
Understanding Parks System Needs
Sample community survey
Although this document presents the statistically valid results of comprehensive state survey for small community park and recreation demand it may be worthwhile to conduct a simple local survey to confirm that local conditions validate statewide findings (e.g. does your community agree that they need more soccer fields than baseball fields?). While not necessary it does allow for minor variations to be accounted for and custom standards may be adopted for each community. Please see the electronic parks workbook that is highly customizable and accompanies this report.
A validation survey might be mailed out (can be expensive and labor intensive) or it can be placed on the web (easy and inexpensive if you have an experienced computer user). Alternately, a survey form may be located a public place or printed in the newspaper. Each community should utilize whatever seems appropriate, and is labor/cost effective. Scientific precision is not mandatory but you should attempt to get at least 20% or 400 of your citizens to respond (whichever is less).
Although each area will certainly want to add its own questions to the survey, try not to add many, as long surveys discourage participation.
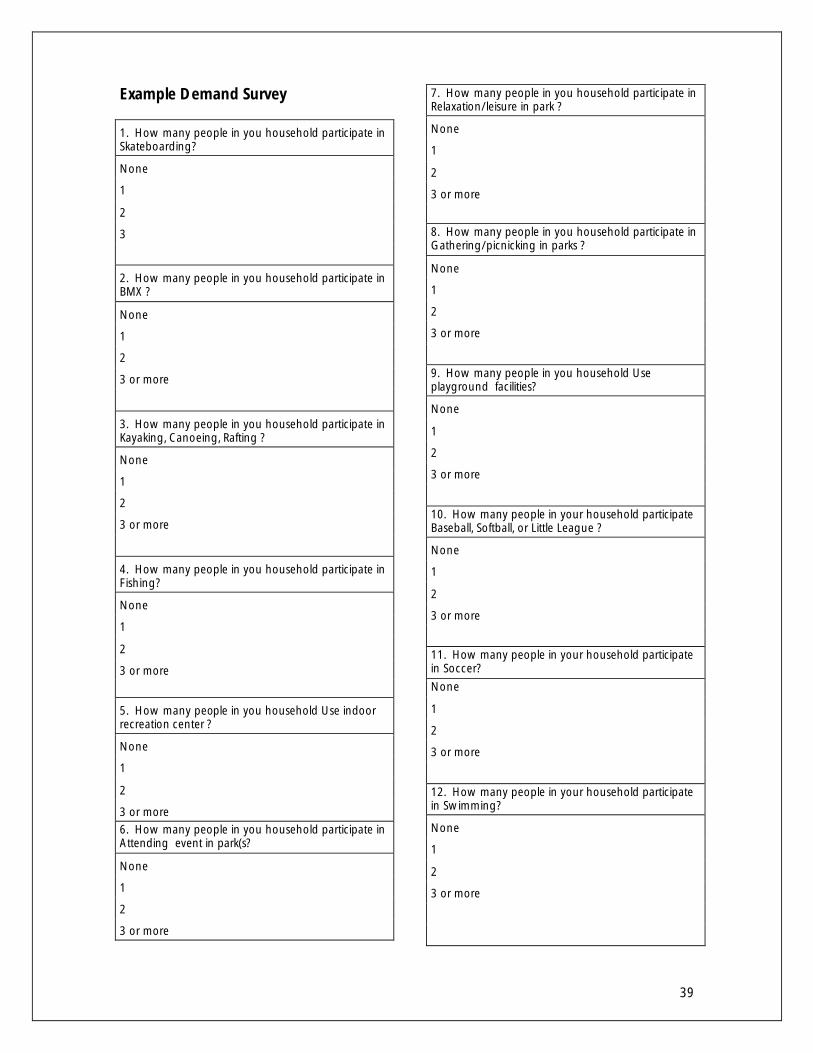
The following survey is intended to register demand for certain types of facilities. A community may also want to consider adding a satisfaction component to the survey. Satisfaction survey questions are used to determine current resident satisfaction with the existing service levels and can be of considerable help in determining budgeting priorities and unearthing the viability of existing service levels.
The sample survey should be used as a template and items that are inappropriate or nonsensical should be removed (e.g. questions about boat launches in communities where no water features exist) or other categories may be added (e.g. rock climbing).
Please call the Rural Planning Institute at 970-382-9153 with any questions you may have regarding conducting community survey’s or parks and recreation needs assessments.
39
Example Demand Survey
1. How many people in you household participate in Skateboarding?
None
1
2
3
2. How many people in you household participate in BMX ?
None
1
2
3 or more
3. How many people in you household participate in Kayaking, Canoeing, Rafting ?
None
1
2
3 or more
4. How many people in you household participate in Fishing?
None
1
2
3 or more
5. How many people in you household Use indoor recreation center ?
None
1
2
3 or more 6. How many people in you household participate in Attending event in park(s?
None
1
2
3 or more
7. How many people in you household participate in Relaxation/leisure in park ?
None
1
2
3 or more
8. How many people in you household participate in Gathering/picnicking in parks ?
None
1
2
3 or more
9. How many people in you household Use playground facilities?
None
1
2
3 or more
10. How many people in your household participate Baseball, Softball, or Little League ?
None
1
2
3 or more
11. How many people in your household participate in Soccer? None
1
2
3 or more
12. How many people in your household participate in Swimming?
None
1
2
3 or more
40
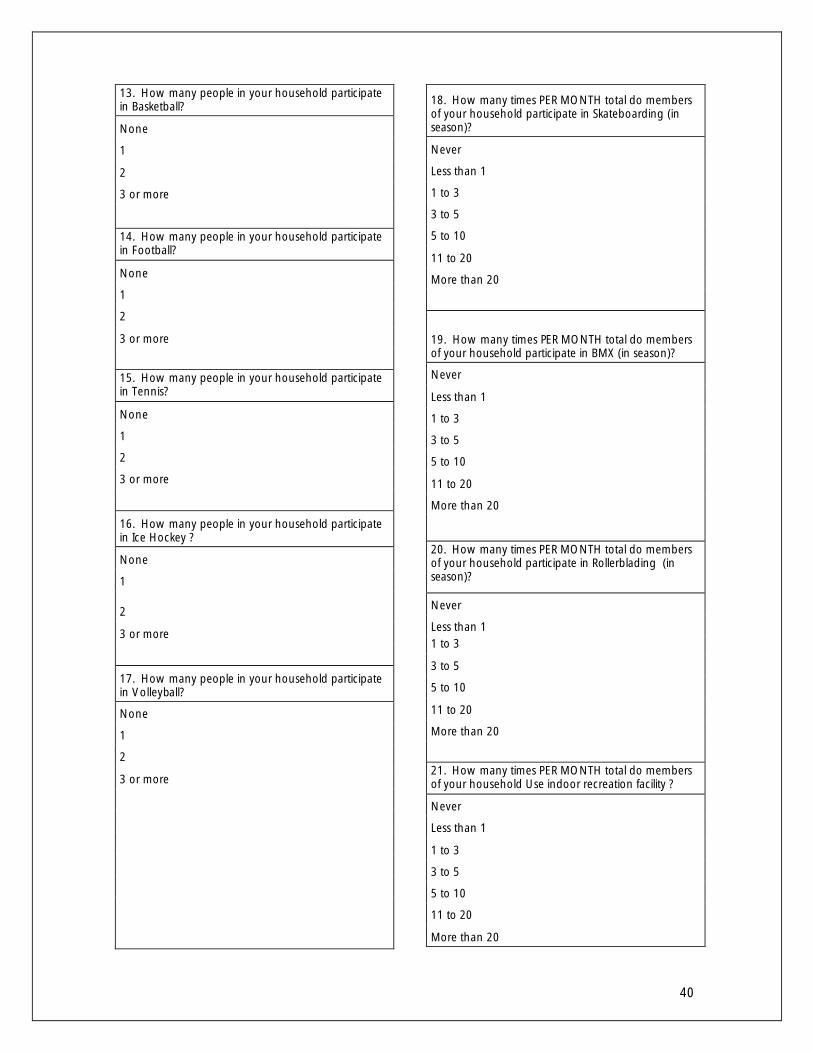
13. How many people in your household participate in Basketball?
None
1
2
3 or more
14. How many people in your household participate in Football?
None
1
2
3 or more
15. How many people in your household participate in Tennis?
None
1
2
3 or more
16. How many people in your household participate in Ice Hockey ?
None
1
2
3 or more
17. How many people in your household participate in Volleyball?
None
1
2
3 or more
18. How many times PER MONTH total do members of your household participate in Skateboarding (in season)?
Never
Less than 1
1 to 3
3 to 5
5 to 10
11 to 20
More than 20
19. How many times PER MONTH total do members of your household participate in BMX (in season)?
Never
Less than 1
1 to 3
3 to 5
5 to 10
11 to 20
More than 20
20. How many times PER MONTH total do members of your household participate in Rollerblading (in season)?
Never
Less than 1 1 to 3
3 to 5
5 to 10
11 to 20
More than 20
21. How many times PER MONTH total do members of your household Use indoor recreation facility ?
Never
Less than 1
1 to 3
3 to 5
5 to 10
11 to 20
More than 20
41
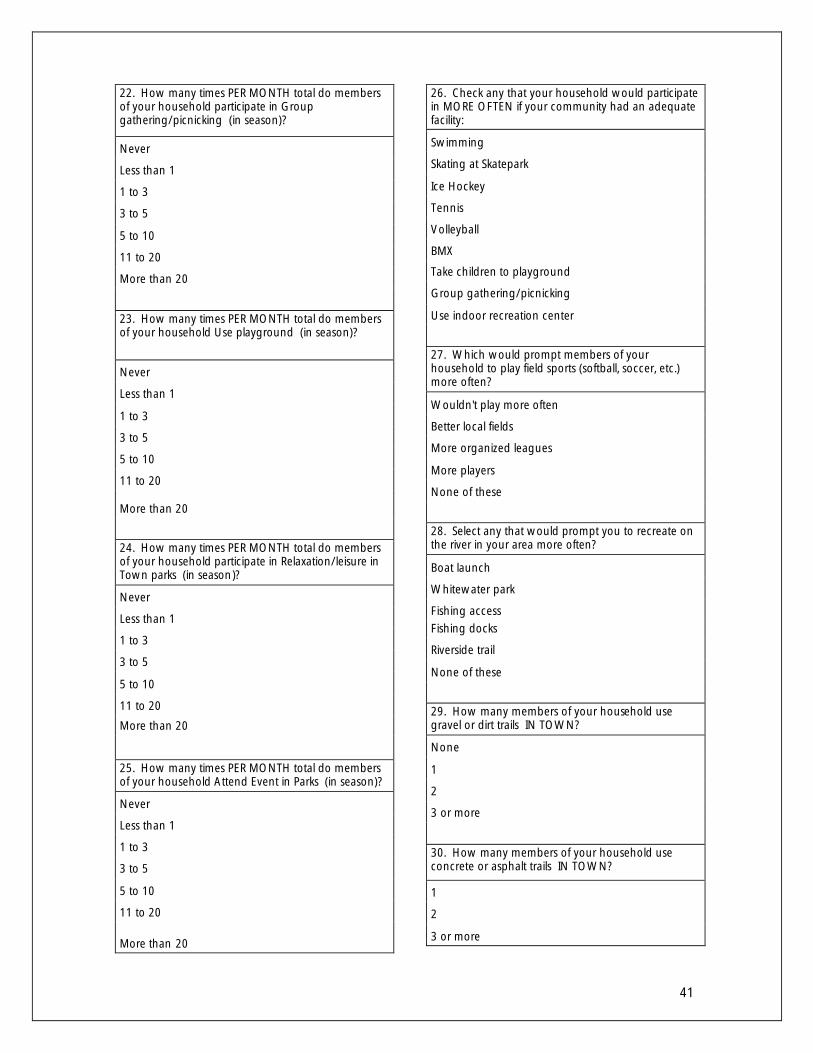
22. How many times PER MONTH total do members of your household participate in Group gathering/picnicking (in season)?
Never
Less than 1
1 to 3
3 to 5
5 to 10
11 to 20
More than 20
23. How many times PER MONTH total do members of your household Use playground (in season)?
Never
Less than 1
1 to 3
3 to 5
5 to 10
11 to 20
More than 20
24. How many times PER MONTH total do members of your household participate in Relaxation/leisure in Town parks (in season)?
Never
Less than 1
1 to 3
3 to 5
5 to 10
11 to 20
More than 20
25. How many times PER MONTH total do members of your household Attend Event in Parks (in season)?
Never
Less than 1
1 to 3
3 to 5
5 to 10
11 to 20
More than 20
26. Check any that your household would participate in MORE OFTEN if your community had an adequate facility:
Swimming
Skating at Skatepark
Ice Hockey
Tennis
Volleyball
BMX
Take children to playground
Group gathering/picnicking
Use indoor recreation center
27. Which would prompt members of your household to play field sports (softball, soccer, etc.) more often?
Wouldn't play more often
Better local fields
More organized leagues
More players
None of these
28. Select any that would prompt you to recreate on the river in your area more often?
Boat launch
Whitewater park
Fishing access Fishing docks
Riverside trail
None of these
29. How many members of your household use gravel or dirt trails IN TOWN?
None
1
2
3 or more
30. How many members of your household use concrete or asphalt trails IN TOWN?
1
2
3 or more
42
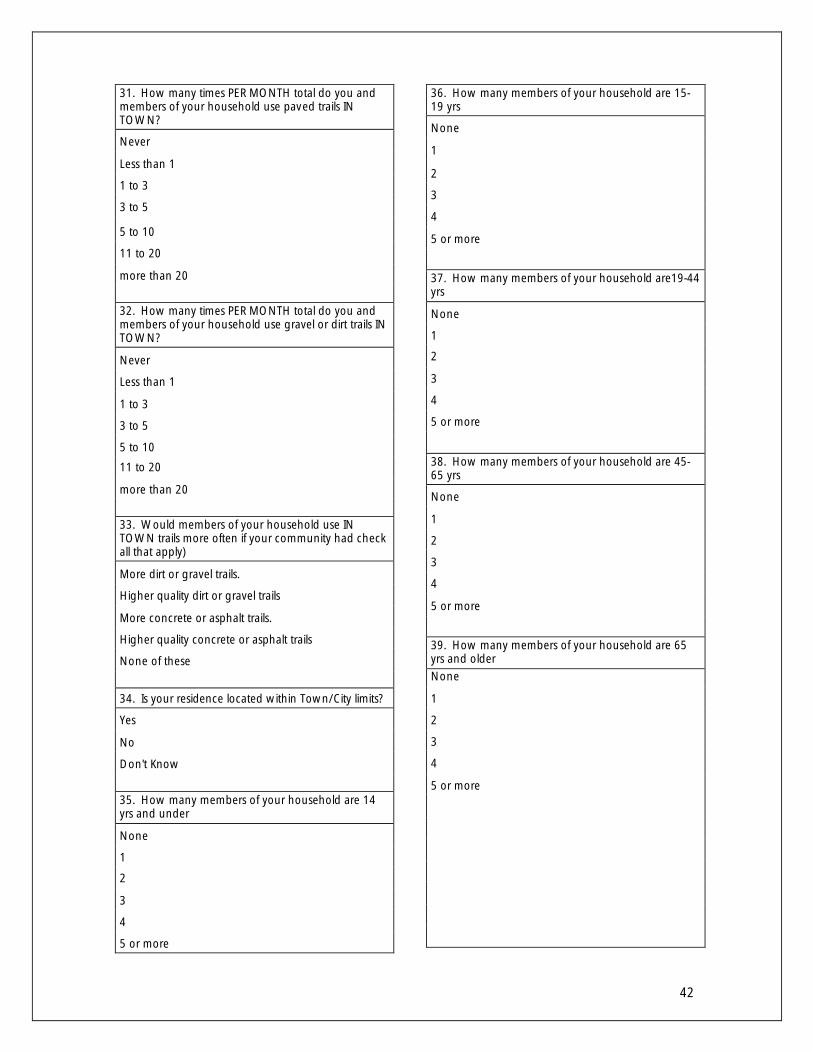
31. How many times PER MONTH total do you and members of your household use paved trails IN TOWN?
Never
Less than 1
1 to 3
3 to 5
5 to 10
11 to 20
more than 20 32. How many times PER MONTH total do you and members of your household use gravel or dirt trails IN TOWN?
Never
Less than 1
1 to 3
3 to 5
5 to 10
11 to 20
more than 20 33. Would members of your household use IN TOWN trails more often if your community had check all that apply)
More dirt or gravel trails.
Higher quality dirt or gravel trails
More concrete or asphalt trails.
Higher quality concrete or asphalt trails
None of these
34. Is your residence located within Town/City limits?
Yes
No
Don't Know 35. How many members of your household are 14 yrs and under
None
1
2
3
4
5 or more
36. How many members of your household are 15-19 yrs
None
1
2
3
4
5 or more
37. How many members of your household are19-44 yrs
None
1
2
3
4
5 or more
38. How many members of your household are 45-65 yrs
None
1
2
3
4
5 or more
39. How many members of your household are 65 yrs and older None
1
2
3
4
5 or more
43
Developing a Parks Plan
If you have confirmed demand either through the informal process of representative accession, polling, focus groups, or more formal surveying it is time to conduct some form of master planning. For many very small (less than 1000 in population) communities this is often done on a project by project basis. For larger communities full scale and comprehensive parks master planning is necessary so assets and capital projects are efficiently prioritized and allocated.
Although comprehensive planning processes are not the intent of this report, a number of products and books are widely available to facilitate this process. Additionally, there are a number of qualified consultants specializing in parks development in Colorado – contact the Colorado Department of Local Affairs or the Colorado Municipal League for contact information.
Financing Acquisitions
Because acquiring land is a major component of the parks development project. The focus of this report (section A) is how to set and maintain standards for parks service levels so that your town can establish a benchmark for service and not have that service degraded by new growth. That is, your park system should grow with the population.
Fee-in-lieu
Also note that a fee-in-lieu may be collected in place land dedications. A fee in lieu must be fairly and accurately calculated but has the advantage of adding to the flexibility of the parks land acquisition program because fees may be banked to purchase property in locations the community deems appropriate.
Colorado Funding Sources for Parks Acquisition
This is only a partial list of potential funding sources for park, trail, and open space planning and acquisition funds.
• Great Outdoors Colorado funds a wide variety of local government planning and parks acquisition projects including open space
• National Highway System funds may be used to construct bicycle transportation facilities and pedestrian walkways on land adjacent to any highway on the National Highway System (not including the interstate system).
• Surface Transportation Program (STP) funds may be used for either the construction of bicycle transportation facilities and pedestrian walkways or non-construction projects (such as brochures, public service announcements, and route maps) related to safe bicycle use. Ten percent of Surface Transportation Program funds are used for “Transportation Enhancements”, which includes a provision for bicycle and pedestrian facilities.
44
• Rivers Trails and Conservation Assistance Program Provides professional parks, river, and open space planning services. Managed by the National Parks Service Department of the Interior
• Scenic Byways Section may be used to construct facilities along designated scenic byways for pedestrians and bicyclists.
• Land and Water Conservation Fund is a federal fund managed by the Colorado Division of Parks and Outdoor Recreation. This fund provides for acquisition and development of public lands to meet the needs of all Americans for outdoor recreation and open space.
Financing Operations & Maintenance
Operations and maintenance costs are often overlooked during the parks systems planning stages. More than one community has written a successful grant, received donated land, and then developed an outstanding park facility only to watch the quality of that facility degrade over time as long-range operations and maintenance estimates were not accounted for. Moreover, operations and maintenance expenses are nearly impossible to cover with grant or donation funding. Consequently, when designing parks systems, municipalities should be careful to estimate and project long range long term operations costs while simultaneously preparing a funding mechanism(s) to allay these costs over time.
Two revenue mechanisms stand out as reliable sources of funds for parks operations and maintenance costs. First is general sales tax revenue, and earmarking a portion of a sales tax increase passed specifically to fund both parks acquisition and maintenance can be an especially effective and dependable mechanism. We recommend combing the two components into a single earmarked tax for parks with expenditure freedom between either acquisition or maintenance, so that over time different needs may be met.
User fees will rarely be capable of covering the entire cost (acquisition debt costs + operations & maintenance) of a publicly constructed and operated park facility. Moreover, they can be difficult collect and often require an additional level of administration (and its attendant costs). User fees are most appropriate when parks are used for: 1) special events, 2) entry controlled facilities such as recreation centers, skate parks, BMX tracks, swimming pools, etc., and 3) ball field facilities with centrally organized league play.
Impact Fees
Although impact fees are a relatively complex revenue mechanism they can be used to fund both acquisition of park land, and as such, may effectively free up general revenue funds (that otherwise might be spent on acquisitions) for operations and maintenance expenditures. Note that there are number of statutory requirements governing the calculation and imposition of impact fees. Please call the Rural Planning Institute (970) 382-9153 with any questions you have regarding this revenue mechanism.
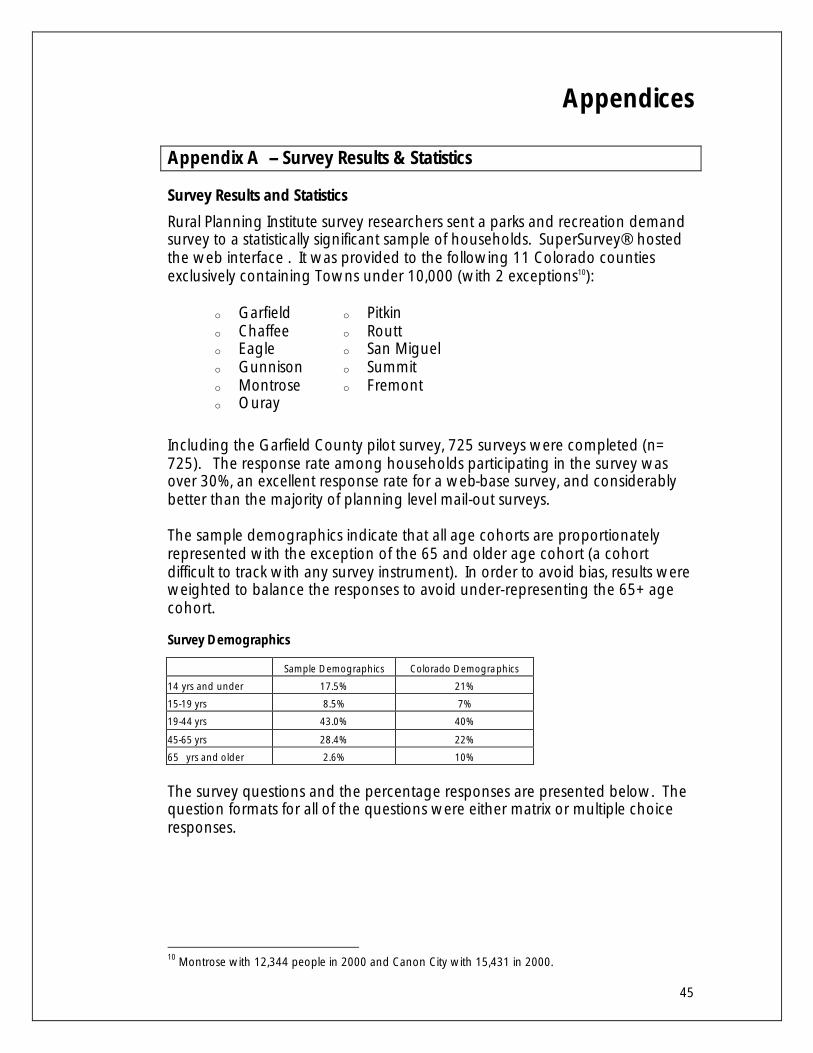
45
Appendices
Appendix A -- Survey Results & Statistics
Survey Results and Statistics
Rural Planning Institute survey researchers sent a parks and recreation demand survey to a statistically significant sample of households. SuperSurvey® hosted the web interface . It was provided to the following 11 Colorado counties exclusively containing Towns under 10,000 (with 2 exceptions10):
o Garfield o Chaffee o Eagle o Gunnison o Montrose o Ouray
o Pitkin o Routt o San Miguel o Summit o Fremont
Including the Garfield County pilot survey, 725 surveys were completed (n= 725). The response rate among households participating in the survey was over 30%, an excellent response rate for a web-base survey, and considerably better than the majority of planning level mail-out surveys. The sample demographics indicate that all age cohorts are proportionately represented with the exception of the 65 and older age cohort (a cohort difficult to track with any survey instrument). In order to avoid bias, results were weighted to balance the responses to avoid under-representing the 65+ age cohort.
Survey Demographics
Sample Demographics Colorado Demographics
14 yrs and under 17.5% 21%
15-19 yrs 8.5% 7%
19-44 yrs 43.0% 40%
45-65 yrs 28.4% 22%
65 yrs and older 2.6% 10%
The survey questions and the percentage responses are presented below. The question formats for all of the questions were either matrix or multiple choice responses.
10 Montrose with 12,344 people in 2000 and Canon City with 15,431 in 2000.
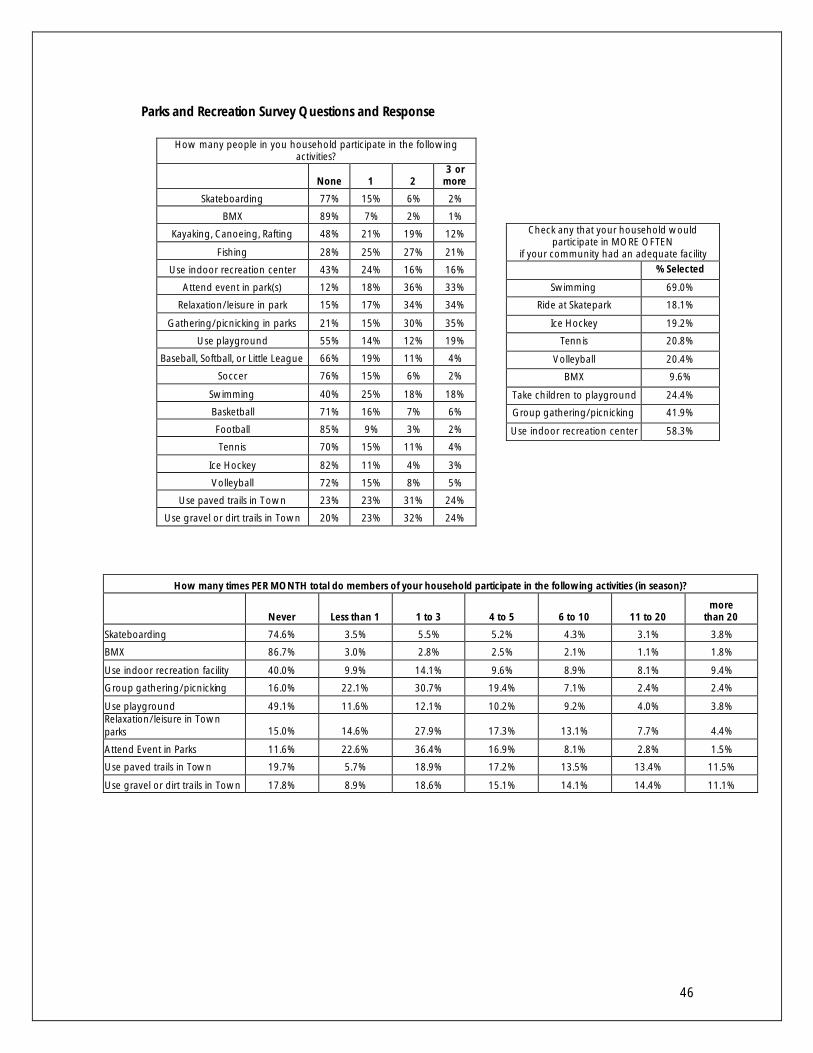
46
Parks and Recreation Survey Questions and Response
How many people in you household participate in the following activities?
None 1 2 3 or
more
Skateboarding 77% 15% 6% 2%
BMX 89% 7% 2% 1%
Kayaking, Canoeing, Rafting 48% 21% 19% 12%
Fishing 28% 25% 27% 21%
Use indoor recreation center 43% 24% 16% 16%
Attend event in park(s) 12% 18% 36% 33%
Relaxation/leisure in park 15% 17% 34% 34%
Gathering/picnicking in parks 21% 15% 30% 35%
Use playground 55% 14% 12% 19%
Baseball, Softball, or Little League 66% 19% 11% 4%
Soccer 76% 15% 6% 2%
Swimming 40% 25% 18% 18%
Basketball 71% 16% 7% 6%
Football 85% 9% 3% 2%
Tennis 70% 15% 11% 4%
Ice Hockey 82% 11% 4% 3%
Volleyball 72% 15% 8% 5%
Use paved trails in Town 23% 23% 31% 24%
Use gravel or dirt trails in Town 20% 23% 32% 24%
Check any that your household would participate in MORE OFTEN
if your community had an adequate facility % Selected
Swimming 69.0%
Ride at Skatepark 18.1%
Ice Hockey 19.2%
Tennis 20.8%
Volleyball 20.4%
BMX 9.6%
Take children to playground 24.4%
Group gathering/picnicking 41.9%
Use indoor recreation center 58.3%
How many times PER MONTH total do members of your household participate in the following activities (in season)?
Never Less than 1 1 to 3 4 to 5 6 to 10 11 to 20 more
than 20
Skateboarding 74.6% 3.5% 5.5% 5.2% 4.3% 3.1% 3.8%
BMX 86.7% 3.0% 2.8% 2.5% 2.1% 1.1% 1.8%
Use indoor recreation facility 40.0% 9.9% 14.1% 9.6% 8.9% 8.1% 9.4%
Group gathering/picnicking 16.0% 22.1% 30.7% 19.4% 7.1% 2.4% 2.4%
Use playground 49.1% 11.6% 12.1% 10.2% 9.2% 4.0% 3.8% Relaxation/leisure in Town parks 15.0% 14.6% 27.9% 17.3% 13.1% 7.7% 4.4%
Attend Event in Parks 11.6% 22.6% 36.4% 16.9% 8.1% 2.8% 1.5%
Use paved trails in Town 19.7% 5.7% 18.9% 17.2% 13.5% 13.4% 11.5%
Use gravel or dirt trails in Town 17.8% 8.9% 18.6% 15.1% 14.1% 14.4% 11.1%
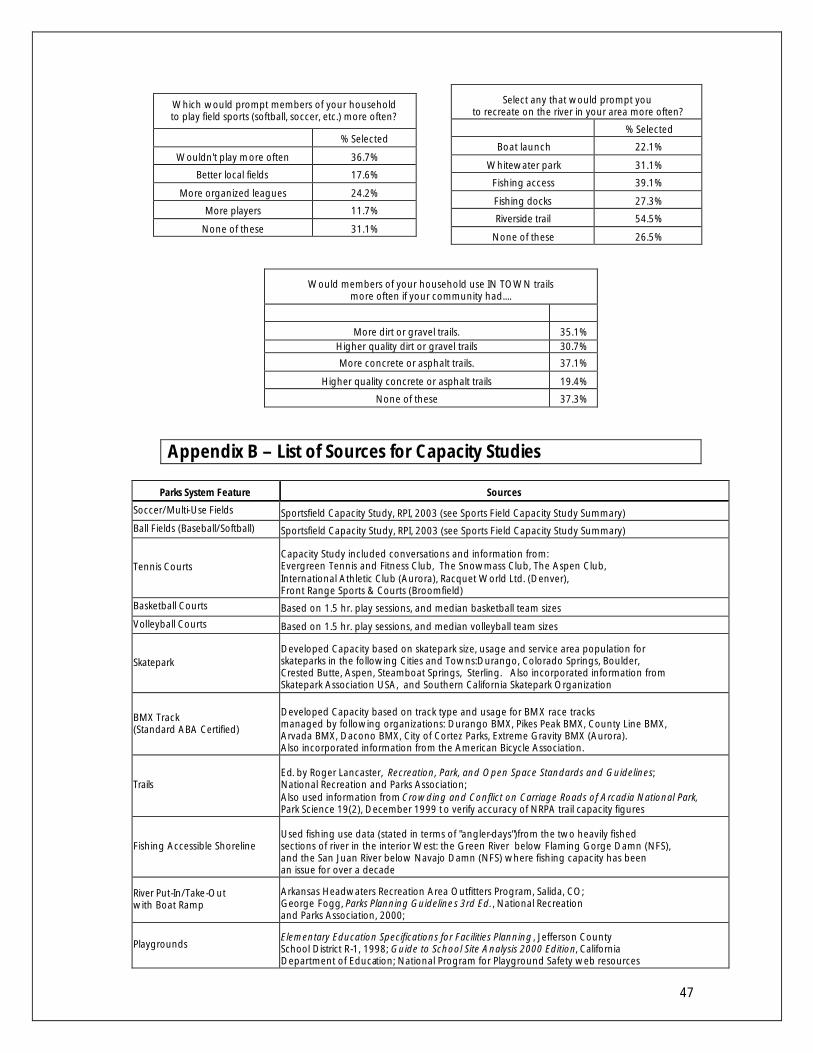
47
Which would prompt members of your household to play field sports (softball, soccer, etc.) more often?
% Selected
Wouldn't play more often 36.7%
Better local fields 17.6%
More organized leagues 24.2%
More players 11.7%
None of these 31.1%
Select any that would prompt you to recreate on the river in your area more often?
% Selected
Boat launch 22.1%
Whitewater park 31.1%
Fishing access 39.1%
Fishing docks 27.3%
Riverside trail 54.5%
None of these 26.5%
Would members of your household use IN TOWN trails more often if your community had....
More dirt or gravel trails. 35.1% Higher quality dirt or gravel trails 30.7%
More concrete or asphalt trails. 37.1%
Higher quality concrete or asphalt trails 19.4%
None of these 37.3%
Appendix B – List of Sources for Capacity Studies
Parks System Feature Sources
Soccer/Multi-Use Fields Sportsfield Capacity Study, RPI, 2003 (see Sports Field Capacity Study Summary) Ball Fields (Baseball/Softball) Sportsfield Capacity Study, RPI, 2003 (see Sports Field Capacity Study Summary)
Tennis Courts Capacity Study included conversations and information from: Evergreen Tennis and Fitness Club, The Snowmass Club, The Aspen Club, International Athletic Club (Aurora), Racquet World Ltd. (Denver), Front Range Sports & Courts (Broomfield)
Basketball Courts Based on 1.5 hr. play sessions, and median basketball team sizes Volleyball Courts Based on 1.5 hr. play sessions, and median volleyball team sizes
Skatepark Developed Capacity based on skatepark size, usage and service area population for skateparks in the following Cities and Towns:Durango, Colorado Springs, Boulder, Crested Butte, Aspen, Steamboat Springs, Sterling. Also incorporated information from Skatepark Association USA, and Southern California Skatepark Organization
BMX Track (Standard ABA Certified)
Developed Capacity based on track type and usage for BMX race tracks managed by following organizations: Durango BMX, Pikes Peak BMX, County Line BMX, Arvada BMX, Dacono BMX, City of Cortez Parks, Extreme Gravity BMX (Aurora). Also incorporated information from the American Bicycle Association.
Trails Ed. by Roger Lancaster, Recreation, Park, and Open Space Standards and Guidelines; National Recreation and Parks Association; Also used information from Crowding and Conflict on Carriage Roads of Arcadia National Park, Park Science 19(2), December 1999 t o verify accuracy of NRPA trail capacity figures
Fishing Accessible Shoreline Used fishing use data (stated in terms of "angler-days")from the two heavily fished sections of river in the interior West: the Green River below Flaming Gorge Damn (NFS), and the San Juan River below Navajo Damn (NFS) where fishing capacity has been an issue for over a decade
River Put-In/Take-Out with Boat Ramp
Arkansas Headwaters Recreation Area Outfitters Program, Salida, CO; George Fogg, Parks Planning Guidelines 3rd Ed. , National Recreation and Parks Association, 2000;
Playgrounds Elementary Education Specifications for Facilities Planning , Jefferson County School District R-1, 1998; Guide to School Site Analysis 2000 Edition, California Department of Education; National Program for Playground Safety web resources
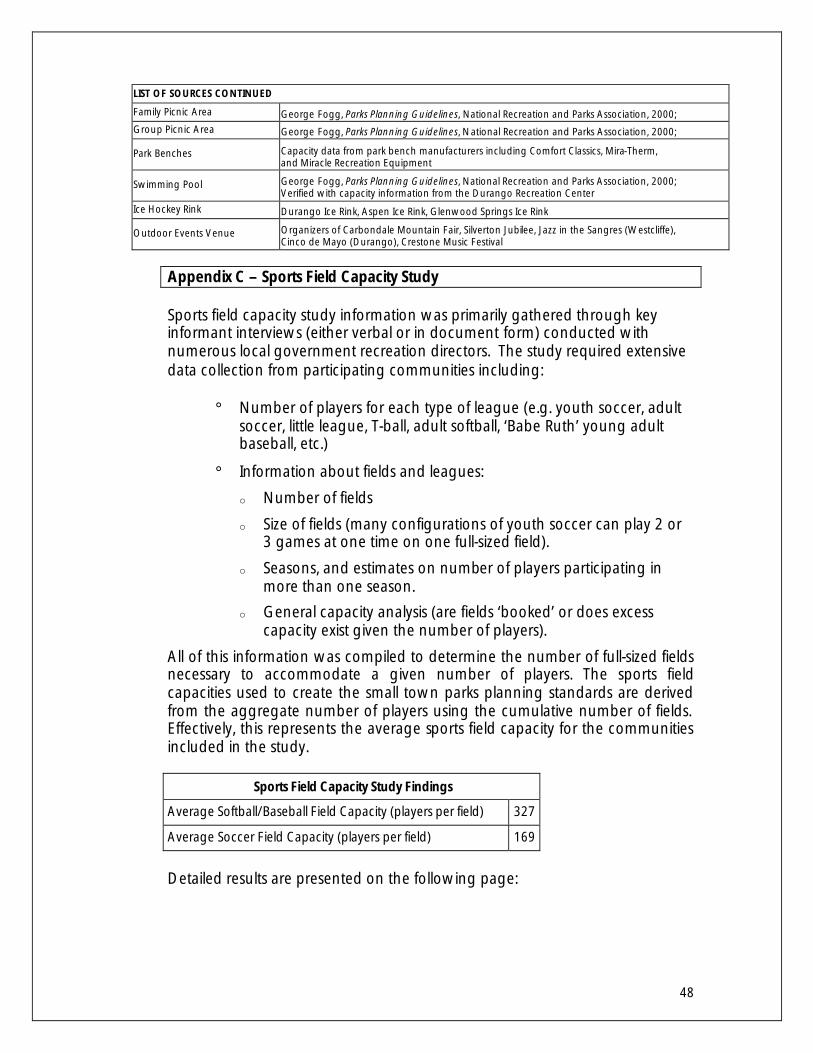
48
LIST OF SOURCES CONTINUED
Family Picnic Area George Fogg, Parks Planning Guidelines, National Recreation and Parks Association, 2000; Group Picnic Area George Fogg, Parks Planning Guidelines, National Recreation and Parks Association, 2000;
Park Benches Capacity data from park bench manufacturers including Comfort Classics, Mira-Therm, and Miracle Recreation Equipment
Swimming Pool George Fogg, Parks Planning Guidelines, National Recreation and Parks Association, 2000; Verified with capacity information from the Durango Recreation Center
Ice Hockey Rink Durango Ice Rink, Aspen Ice Rink, Glenwood Springs Ice Rink
Outdoor Events Venue Organizers of Carbondale Mountain Fair, Silverton Jubilee, Jazz in the Sangres (Westcliffe), Cinco de Mayo (Durango), Crestone Music Festival
Appendix C – Sports Field Capacity Study
Sports field capacity study information was primarily gathered through key informant interviews (either verbal or in document form) conducted with numerous local government recreation directors. The study required extensive data collection from participating communities including:
° Number of players for each type of league (e.g. youth soccer, adult soccer, little league, T-ball, adult softball, ‘Babe Ruth’ young adult baseball, etc.)
° Information about fields and leagues: o Number of fields o Size of fields (many configurations of youth soccer can play 2 or
3 games at one time on one full-sized field). o Seasons, and estimates on number of players participating in
more than one season. o General capacity analysis (are fields ‘booked’ or does excess
capacity exist given the number of players). All of this information was compiled to determine the number of full-sized fields necessary to accommodate a given number of players. The sports field capacities used to create the small town parks planning standards are derived from the aggregate number of players using the cumulative number of fields. Effectively, this represents the average sports field capacity for the communities included in the study.
Sports Field Capacity Study Findings
Average Softball/Baseball Field Capacity (players per field) 327
Average Soccer Field Capacity (players per field) 169
Detailed results are presented on the following page:
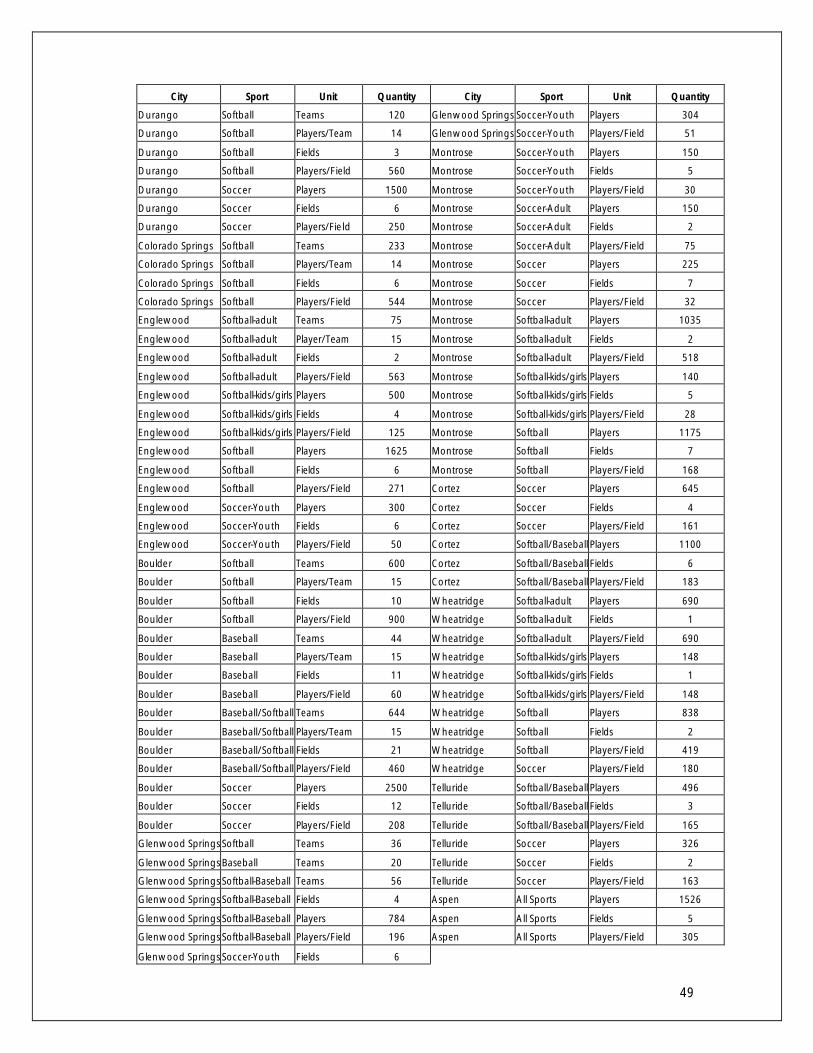
49
City Sport Unit Quantity City Sport Unit Quantity
Durango Softball Teams 120 Glenwood Springs Soccer-Youth Players 304
Durango Softball Players/Team 14 Glenwood Springs Soccer-Youth Players/Field 51
Durango Softball Fields 3 Montrose Soccer-Youth Players 150
Durango Softball Players/Field 560 Montrose Soccer-Youth Fields 5
Durango Soccer Players 1500 Montrose Soccer-Youth Players/Field 30
Durango Soccer Fields 6 Montrose Soccer-Adult Players 150
Durango Soccer Players/Field 250 Montrose Soccer-Adult Fields 2
Colorado Springs Softball Teams 233 Montrose Soccer-Adult Players/Field 75
Colorado Springs Softball Players/Team 14 Montrose Soccer Players 225
Colorado Springs Softball Fields 6 Montrose Soccer Fields 7
Colorado Springs Softball Players/Field 544 Montrose Soccer Players/Field 32
Englewood Softball-adult Teams 75 Montrose Softball-adult Players 1035
Englewood Softball-adult Player/Team 15 Montrose Softball-adult Fields 2
Englewood Softball-adult Fields 2 Montrose Softball-adult Players/Field 518
Englewood Softball-adult Players/Field 563 Montrose Softball-kids/girls Players 140
Englewood Softball-kids/girls Players 500 Montrose Softball-kids/girls Fields 5
Englewood Softball-kids/girls Fields 4 Montrose Softball-kids/girls Players/Field 28
Englewood Softball-kids/girls Players/Field 125 Montrose Softball Players 1175
Englewood Softball Players 1625 Montrose Softball Fields 7
Englewood Softball Fields 6 Montrose Softball Players/Field 168
Englewood Softball Players/Field 271 Cortez Soccer Players 645
Englewood Soccer-Youth Players 300 Cortez Soccer Fields 4
Englewood Soccer-Youth Fields 6 Cortez Soccer Players/Field 161
Englewood Soccer-Youth Players/Field 50 Cortez Softball/Baseball Players 1100
Boulder Softball Teams 600 Cortez Softball/Baseball Fields 6
Boulder Softball Players/Team 15 Cortez Softball/Baseball Players/Field 183
Boulder Softball Fields 10 Wheatridge Softball-adult Players 690
Boulder Softball Players/Field 900 Wheatridge Softball-adult Fields 1
Boulder Baseball Teams 44 Wheatridge Softball-adult Players/Field 690
Boulder Baseball Players/Team 15 Wheatridge Softball-kids/girls Players 148
Boulder Baseball Fields 11 Wheatridge Softball-kids/girls Fields 1
Boulder Baseball Players/Field 60 Wheatridge Softball-kids/girls Players/Field 148
Boulder Baseball/Softball Teams 644 Wheatridge Softball Players 838
Boulder Baseball/Softball Players/Team 15 Wheatridge Softball Fields 2
Boulder Baseball/Softball Fields 21 Wheatridge Softball Players/Field 419
Boulder Baseball/Softball Players/Field 460 Wheatridge Soccer Players/Field 180
Boulder Soccer Players 2500 Telluride Softball/Baseball Players 496
Boulder Soccer Fields 12 Telluride Softball/Baseball Fields 3
Boulder Soccer Players/Field 208 Telluride Softball/Baseball Players/Field 165
Glenwood Springs Softball Teams 36 Telluride Soccer Players 326
Glenwood Springs Baseball Teams 20 Telluride Soccer Fields 2
Glenwood Springs Softball-Baseball Teams 56 Telluride Soccer Players/Field 163
Glenwood Springs Softball-Baseball Fields 4 Aspen All Sports Players 1526
Glenwood Springs Softball-Baseball Players 784 Aspen All Sports Fields 5
Glenwood Springs Softball-Baseball Players/Field 196 Aspen All Sports Players/Field 305
Glenwood Springs Soccer-Youth Fields 6
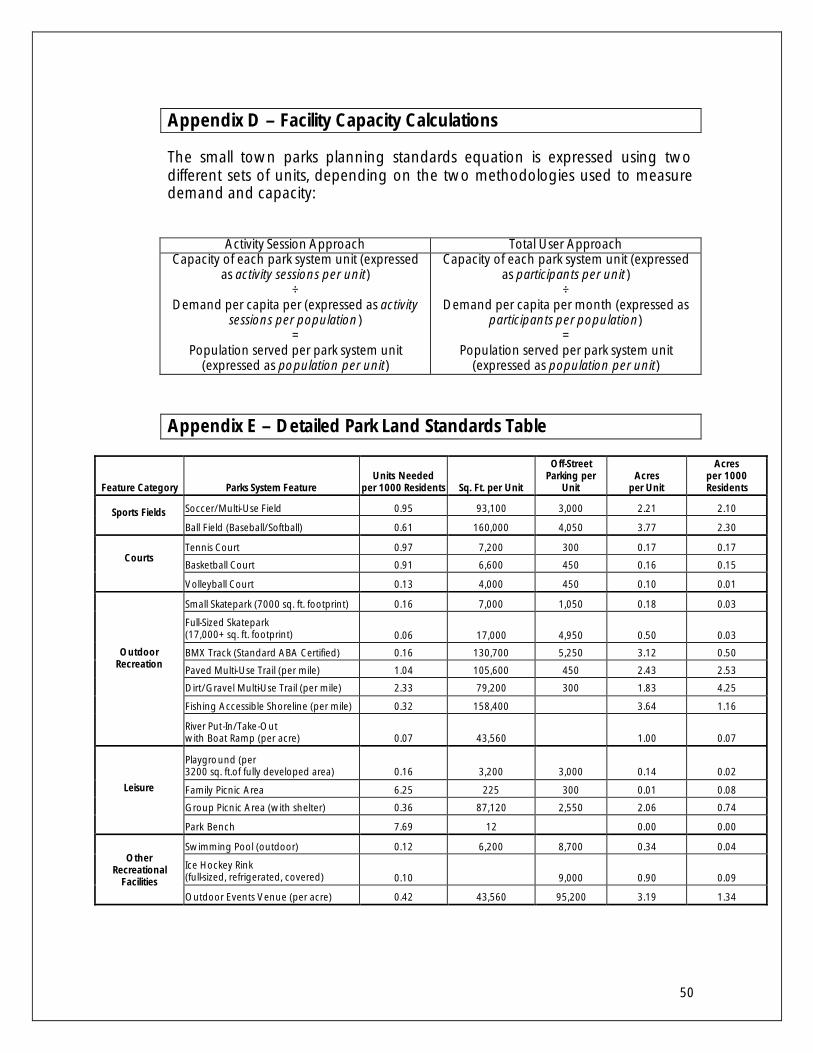
50
Appendix D – Facility Capacity Calculations
The small town parks planning standards equation is expressed using two different sets of units, depending on the two methodologies used to measure demand and capacity:
Activity Session Approach Total User Approach
Capacity of each park system unit (expressed as activity sessions per unit)
÷ Demand per capita per (expressed as activity
sessions per population) =
Population served per park system unit (expressed as population per unit)
Capacity of each park system unit (expressed as participants per unit )
÷ Demand per capita per month (expressed as
participants per population) =
Population served per park system unit (expressed as population per unit)
Appendix E – Detailed Park Land Standards Table
Feature Category Parks System Feature Units Needed
per 1000 Residents Sq. Ft. per Unit
Off-Street Parking per
Unit Acres
per Unit
Acres per 1000 Residents
Soccer/Multi-Use Field 0.95 93,100 3,000 2.21 2.10 Sports Fields Ball Field (Baseball/Softball) 0.61 160,000 4,050 3.77 2.30
Tennis Court 0.97 7,200 300 0.17 0.17
Basketball Court 0.91 6,600 450 0.16 0.15 Courts
Volleyball Court 0.13 4,000 450 0.10 0.01
Small Skatepark (7000 sq. ft. footprint) 0.16 7,000 1,050 0.18 0.03
Full-Sized Skatepark (17,000+ sq. ft. footprint) 0.06 17,000 4,950 0.50 0.03
BMX Track (Standard ABA Certified) 0.16 130,700 5,250 3.12 0.50
Paved Multi-Use Trail (per mile) 1.04 105,600 450 2.43 2.53
Dirt/Gravel Multi-Use Trail (per mile) 2.33 79,200 300 1.83 4.25
Fishing Accessible Shoreline (per mile) 0.32 158,400 3.64 1.16
Outdoor Recreation
River Put-In/Take-Out with Boat Ramp (per acre) 0.07 43,560 1.00 0.07
Playground (per 3200 sq. ft.of fully developed area) 0.16 3,200 3,000 0.14 0.02
Family Picnic Area 6.25 225 300 0.01 0.08
Group Picnic Area (with shelter) 0.36 87,120 2,550 2.06 0.74
Leisure Park Bench 7.69 12 0.00 0.00
Swimming Pool (outdoor) 0.12 6,200 8,700 0.34 0.04
Ice Hockey Rink (full-sized, refrigerated, covered) 0.10 9,000 0.90 0.09
Other Recreational
Facilities Outdoor Events Venue (per acre) 0.42 43,560 95,200 3.19 1.34
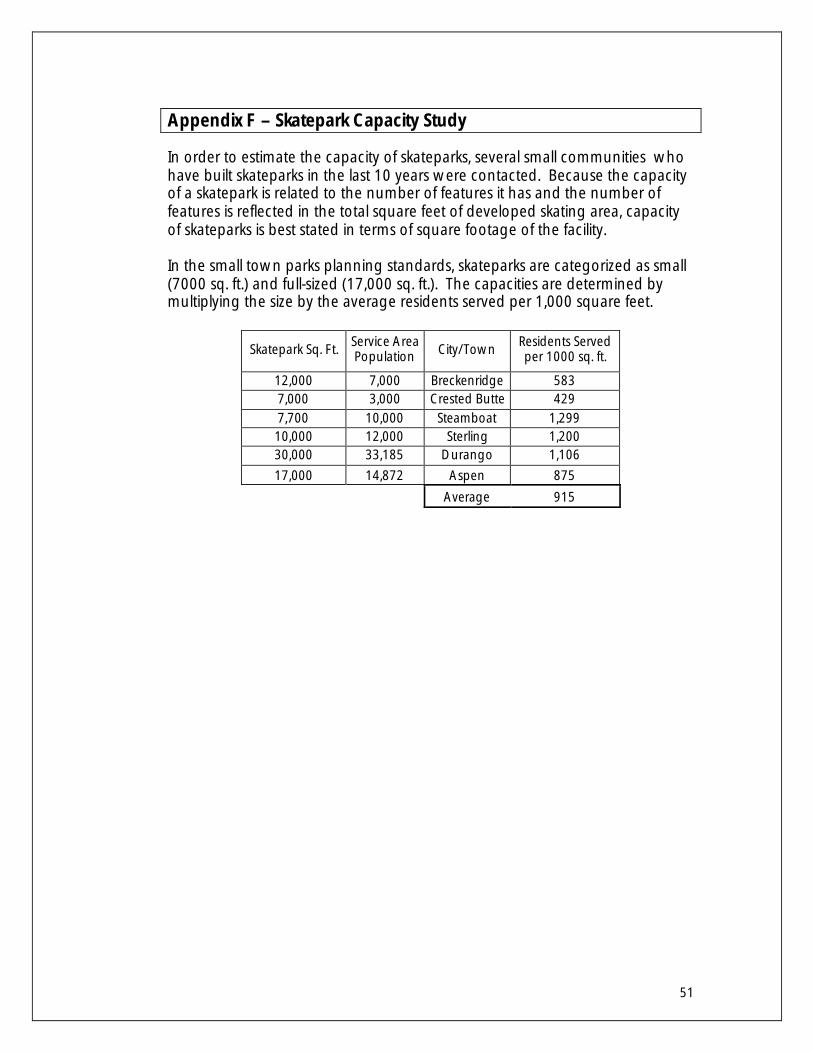
51
Appendix F – Skatepark Capacity Study
In order to estimate the capacity of skateparks, several small communities who have built skateparks in the last 10 years were contacted. Because the capacity of a skatepark is related to the number of features it has and the number of features is reflected in the total square feet of developed skating area, capacity of skateparks is best stated in terms of square footage of the facility. In the small town parks planning standards, skateparks are categorized as small (7000 sq. ft.) and full-sized (17,000 sq. ft.). The capacities are determined by multiplying the size by the average residents served per 1,000 square feet.
Skatepark Sq. Ft. Service Area Population City/Town Residents Served
per 1000 sq. ft.
12,000 7,000 Breckenridge 583 7,000 3,000 Crested Butte 429 7,700 10,000 Steamboat 1,299 10,000 12,000 Sterling 1,200 30,000 33,185 Durango 1,106 17,000 14,872 Aspen 875
Average 915
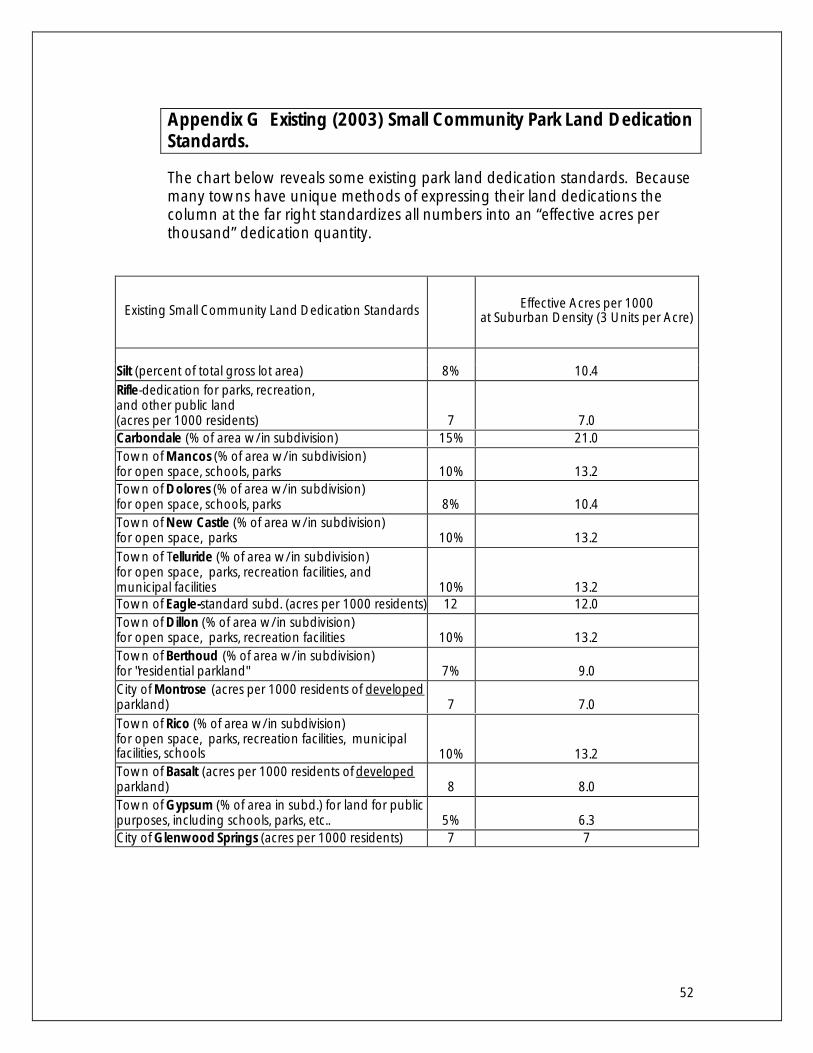
52
Appendix G Existing (2003) Small Community Park Land Dedication Standards.
The chart below reveals some existing park land dedication standards. Because many towns have unique methods of expressing their land dedications the column at the far right standardizes all numbers into an “effective acres per thousand” dedication quantity.
Existing Small Community Land Dedication Standards Effective Acres per 1000 at Suburban Density (3 Units per Acre)
Silt (percent of total gross lot area) 8% 10.4 Rifle-dedication for parks, recreation, and other public land (acres per 1000 residents) 7 7.0 Carbondale (% of area w/in subdivision) 15% 21.0 Town of Mancos (% of area w/in subdivision) for open space, schools, parks 10% 13.2 Town of Dolores (% of area w/in subdivision) for open space, schools, parks 8% 10.4 Town of New Castle (% of area w/in subdivision) for open space, parks 10% 13.2 Town of Telluride (% of area w/in subdivision) for open space, parks, recreation facilities, and municipal facilities 10% 13.2 Town of Eagle-standard subd. (acres per 1000 residents) 12 12.0 Town of Dillon (% of area w/in subdivision) for open space, parks, recreation facilities 10% 13.2 Town of Berthoud (% of area w/in subdivision) for "residential parkland" 7% 9.0 City of Montrose (acres per 1000 residents of developed parkland) 7 7.0 Town of Rico (% of area w/in subdivision) for open space, parks, recreation facilities, municipal facilities, schools 10% 13.2 Town of Basalt (acres per 1000 residents of developed parkland) 8 8.0 Town of Gypsum (% of area in subd.) for land for public purposes, including schools, parks, etc.. 5% 6.3 City of Glenwood Springs (acres per 1000 residents) 7 7