Embed Size (px)
Citation preview
Smart School BudgetingOther Smart School Budgeting
Resources
Richard Bedard
• Navigation and Resources
• Two Examples for Smart Budgeting
• MASBO Suffolk University Video
• Utility Budget
Smart School BudgetingNavigation and Resources
• Books for Purchase
• Research Papers
• Downloadable and Living Documents
• Surveys and Benchmarking Material
Samples Resources
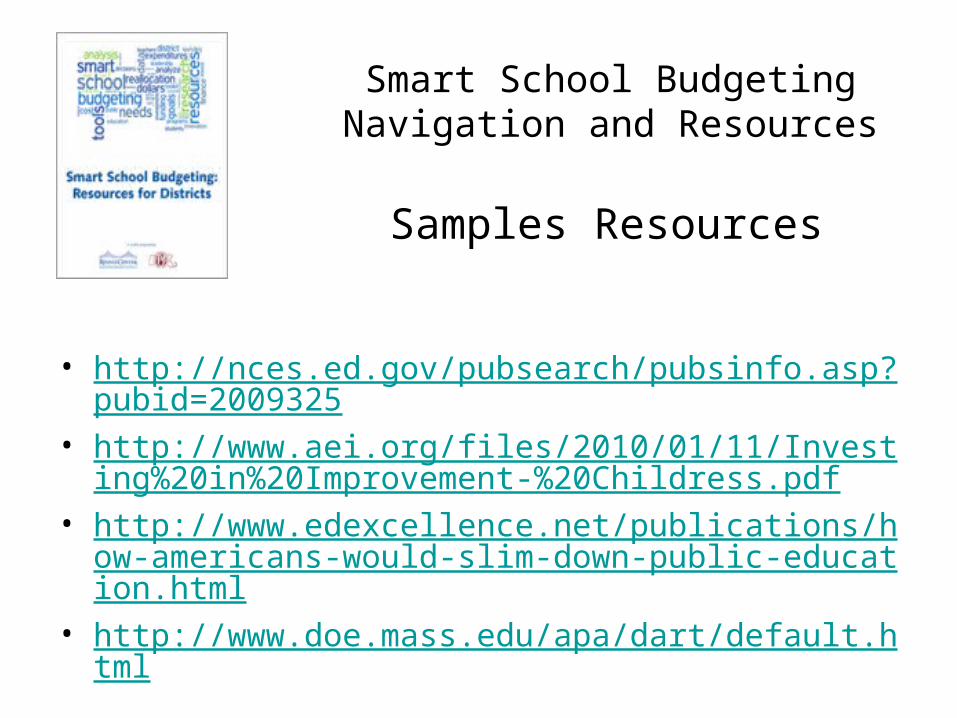
Smart School BudgetingNavigation and Resources
• http://nces.ed.gov/pubsearch/pubsinfo.asp?pubid=2009325
• http://www.aei.org/files/2010/01/11/Investing%20in%20Improvement-%20Childress.pdf
• http://www.edexcellence.net/publications/how-americans-would-slim-down-public-education.html
• http://www.doe.mass.edu/apa/dart/default.html
Samples Resources
Smart School BudgetingResources
• #1: How Americans Would Slim Down Public Education, Steve Farkas and Ann Duffett
Page 5 of the Smart Budgeting Toolkit• #2: Toward Effective Resource Use: Assessing
How Education Dollars are Spent, Jason Willis, Robert Durante and Paul GazzerroPage 11 of the Smart Budgeting Toolkit
Two Examples
Smart School BudgetingResources
• Shrink the Administration• Freeze Salaries to Save Jobs• Teacher Layoffs Based on Effectiveness• Larger Class Sizes• IRA’s instead of Pension Plans
How Americans Would Slim Down Public
Education
Smart School BudgetingResources
From 1986-2009• # of Students up by 24%• # of Teachers up by 43%• # of Instructional Support Staff up by
150%!
How Americans Would Slim Down Public
Education
Smart School BudgetingResources
Public Sentiment• Reducing Teacher Pay by 5% rather than laying off 5%
of staff• 76% believe too many SPED students mislabeled• Closing or merging small schools• 66% OPPOSE shortening the school year• 70% want to disapprove of reducing non-teaching staff
How Americans Would Slim Down Public
Education
Smart School BudgetingResources
Two Ways to Achieve Effective Resource Use in Education• Identify Resource Configurations to Help Raise Student
Achievement• Eliminate Inefficiencies, mainly Non-Instruction Spending
Toward Effective Resource Use: Assessing How
Education Dollars are Spent
Smart School BudgetingResources
• Public Pension Guarantees, i.e. Providence Public Schools unfunded liability problem
• Health Insurance Costs, ASBO survey said 58% was a big concern
• Fuel and Energy, 17% of transportation costs is fuel• Fuel and Energy, 25% of O and M budget is energy
Eliminating Inefficiencies
Smart School BudgetingResources
Barriers to Increasing Discretionary Funding for Education• Resistance by Local Taxpayers• Pressure for Student Academic Achievement: NCLB
Uneven State Support for Education
Eliminating Inefficiencies
Smart School BudgetingResources
Framework for the Continual Improvement Process• Principal #1 Identify• Principal #2: Solve• Principal #3 Communicate
Raising Student Achievement
Smart School BudgetingSchool Based Budgeting Story
• Cordell Place Investigation• School Based Budgeting Story• Presented by candidates in the MASBO Suffolk
University Program• http://www.youtube.com/watch?v=Pq5sXSKs4cs
&feature=youtu.be
MASBO’s Suffolk University Program
Video
Smart School Budgeting
• Utility Budget = Cost of Energy X Consumption• Cost of Energy = Supply + Distribution• Cost of Energy = Supply + Distribution – Solar
Credits• Projected Energy Cost: Supply• Projected Energy Cost: Distribution
Utility Budgeting
Smart School Budgeting
• Usage or Consumption• Historical Usage Amounts• Projected Usage Amounts• Previous Year’s Data• Previous 3 Years’ Date
Utility Budgeting
Smart School Budgeting
Utility Budget =
Projected Cost of EnergyX
Projected Consumption
Utility Budgeting
Smart School Budgeting
In most cases you know your
projected
supply and distribution costs.
Utility Budgeting
Smart School Budgeting
How do you project your
Usage or Consumption?
Utility Budgeting
Smart School Budgeting
Usage or Consumption
Utility Budgeting
Smart School Budgeting
Show Consumption DATA
Utility Budgeting
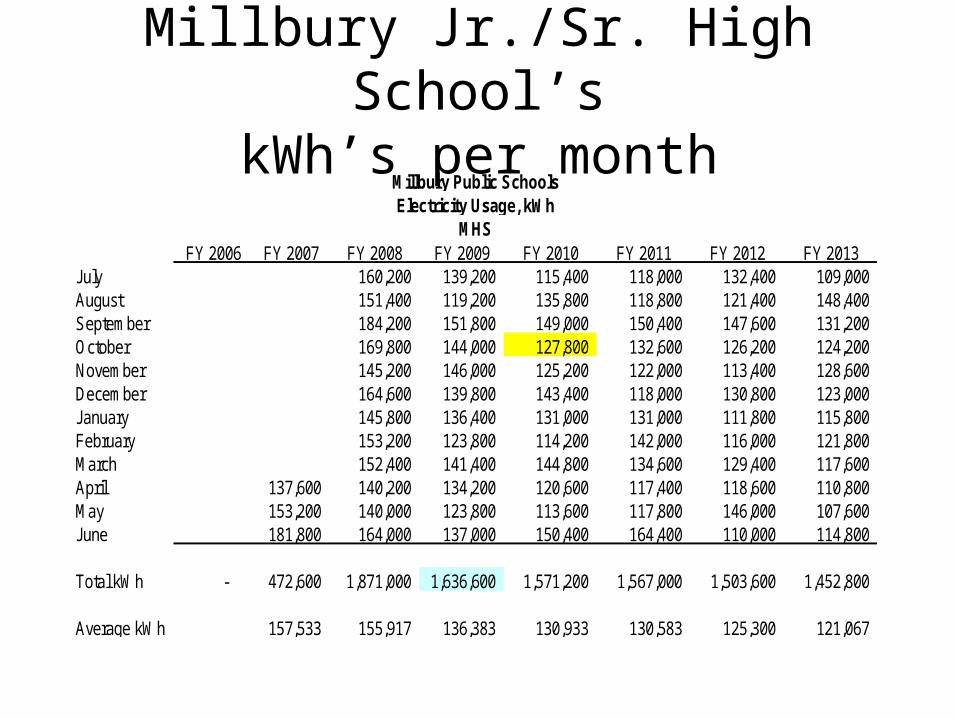
Millbury Jr./Sr. High School’skWh’s per month
FY 2006 FY 2007 FY 2008 FY 2009 FY 2010 FY 2011 FY 2012 FY 2013July 160,200 139,200 115,400 118,000 132,400 109,000 August 151,400 119,200 135,800 118,800 121,400 148,400 September 184,200 151,800 149,000 150,400 147,600 131,200 October 169,800 144,000 127,800 132,600 126,200 124,200 November 145,200 146,000 125,200 122,000 113,400 128,600 December 164,600 139,800 143,400 118,000 130,800 123,000 January 145,800 136,400 131,000 131,000 111,800 115,800 February 153,200 123,800 114,200 142,000 116,000 121,800 March 152,400 141,400 144,800 134,600 129,400 117,600 April 137,600 140,200 134,200 120,600 117,400 118,600 110,800 May 153,200 140,000 123,800 113,600 117,800 146,000 107,600 June 181,800 164,000 137,000 150,400 164,400 110,000 114,800
Total kWh - 472,600 1,871,000 1,636,600 1,571,200 1,567,000 1,503,600 1,452,800
Average kWh 157,533 155,917 136,383 130,933 130,583 125,300 121,067
Millbury Public SchoolsElectricity Usage, kWh
MHS
Smart School Budgeting
Something to Consider:
Using
Heating Degree Days
to assist with the Calculation.
Heating Degree Days
Smart School Budgeting
What is Heating Degree Days?Each Day’s Average Temperature’s Difference from the Base Temperature for Heating, usually
65 degrees.Example: If the Base is 65 degrees & today’s temperature was 45 degrees, today added 20
HDDs to the Heating Season Total.
Heating Degree Days
Smart School Budgeting
National Oceanic and Atmospheric Administration
National Weather Service
Climate Information
Heating Degree Days
Smart School Budgeting
Local NOAA Weather Stations1. Boston2. Hartford
3. Providence4. Worcester
Heating Degree Days
Smart School Budgeting
Other Sources for Tracking HDD1. Local Newspaper under “Weather” section
2. National Grid or other utility Websites3. Oil Supplier Websites
4. Weather Data Depot Website5. ClimateZONE.com Website
Heating Degree Days
Smart School Budgeting
Why UseHeating Degree Days?
Heating Degree Days
Smart School Budgeting
• Tracks Recent Climate Change• Tracks Trending Patterns• Takes into Account more than 1 Year• Helps you Determine the Average HDD• Add’l Data to Help Project Utility Budget
Heating Degree Days
Smart School Budgeting
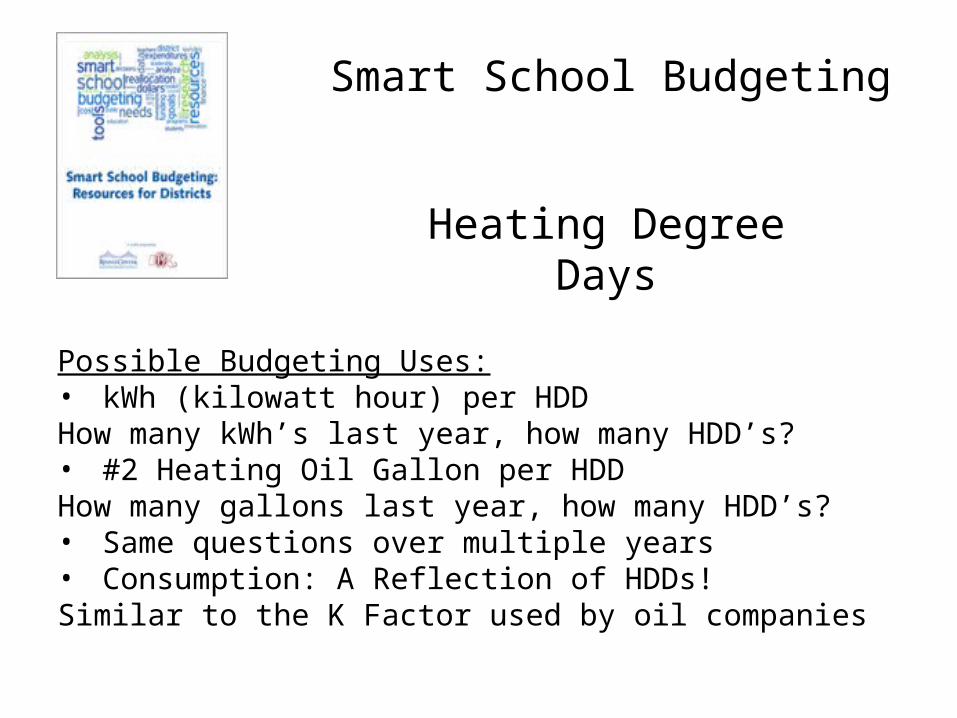
Possible Budgeting Uses:• kWh (kilowatt hour) per HDDHow many kWh’s last year, how many HDD’s?• #2 Heating Oil Gallon per HDDHow many gallons last year, how many HDD’s?• Same questions over multiple years• Consumption: A Reflection of HDDs!Similar to the K Factor used by oil companies
Heating Degree Days
Smart School Budgeting
Charting Heating Degree Days
Show DATA
Heating Degree Days
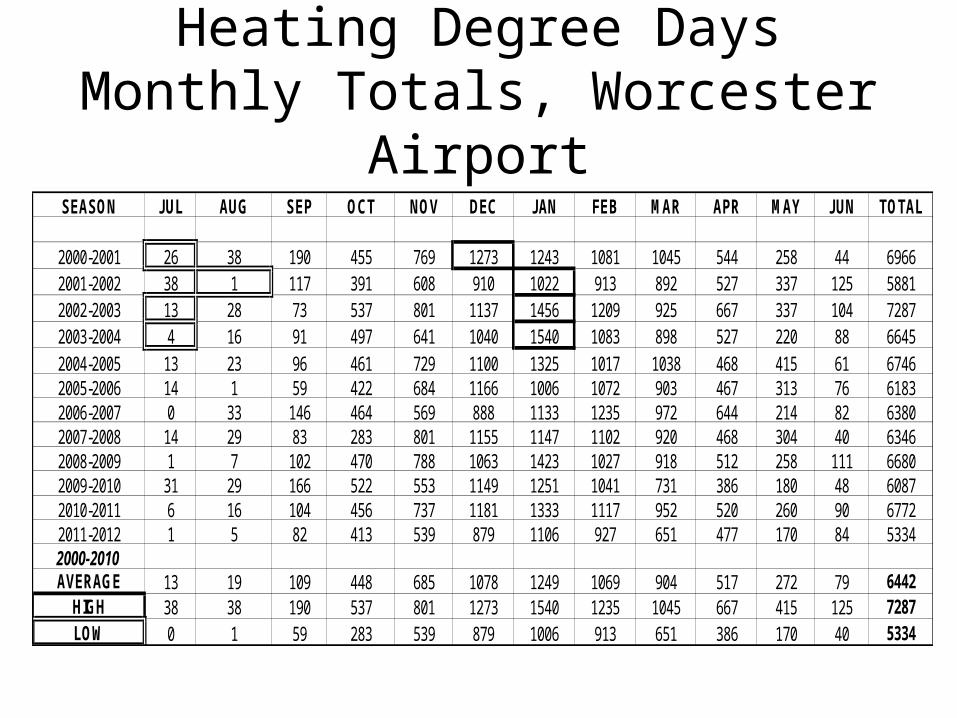
Heating Degree DaysMonthly Totals, Worcester Airport
SEASON JUL AUG SEP OCT NOV DEC JAN FEB MAR APR MAY JUN TOTAL
2000-2001 26 38 190 455 769 1273 1243 1081 1045 544 258 44 69662001-2002 38 1 117 391 608 910 1022 913 892 527 337 125 58812002-2003 13 28 73 537 801 1137 1456 1209 925 667 337 104 72872003-2004 4 16 91 497 641 1040 1540 1083 898 527 220 88 66452004-2005 13 23 96 461 729 1100 1325 1017 1038 468 415 61 67462005-2006 14 1 59 422 684 1166 1006 1072 903 467 313 76 61832006-2007 0 33 146 464 569 888 1133 1235 972 644 214 82 63802007-2008 14 29 83 283 801 1155 1147 1102 920 468 304 40 63462008-2009 1 7 102 470 788 1063 1423 1027 918 512 258 111 66802009-2010 31 29 166 522 553 1149 1251 1041 731 386 180 48 60872010-2011 6 16 104 456 737 1181 1333 1117 952 520 260 90 67722011-2012 1 5 82 413 539 879 1106 927 651 477 170 84 53342000-2010 AVERAGE 13 19 109 448 685 1078 1249 1069 904 517 272 79 6442
HIGH 38 38 190 537 801 1273 1540 1235 1045 667 415 125 7287LOW 0 1 59 283 539 879 1006 913 651 386 170 40 5334
Smart School Budgeting
Other Uses for Heating Degree Days:• Calculating How Much Utility Money will be Used during the current
Fiscal Year.• Calculating How Much Utility Money will be Saved during the
current Fiscal Year.• Calculating How Much Utility Money Over Expenditures you will
need to divert to Utilities during the Current Fiscal Year.• Calculating How Much Utility Money Savings you can divert to
other Expenditures during the Current Fiscal Year.• Preparing and Planning Earlier in the Year.
Heating Degree Days
Smart School Budgeting
Other Use for Heating Degree Days:
It’s January 15th the mid-point of the HDD season, on average, and this year’s
HDDs are 10% below average.
(Average Midpoint is between 1/15-1/21)
Heating Degree Days
Smart School Budgeting
Other Use for Heating Degree Days:
Or at any point in the season, checking the local newspaper for this year’s
HDDs vs. the average HDDs.
Heating Degree Days