Embed Size (px)
Citation preview
Smart swimming pool controller with intelligent sensors
by
Broadway Mazwi Dzapasi (16881338)
Report submitted in partial fulfilment of the requirements of the module Project (E) 448 for the degree Baccalaureus in Engineering in the Department of
Electrical and Electronic Engineering at the University of Stellenbosch
Study leader: Dr PJ Randewijk
3 November 2014

i
Acknowledgements
I would like to thank the following for their support during the course of the project.
Dr PJ Randewjik for his guidance , providing the variable speed drive and his technical wisdom that always came in handy at all times, through him I have greatly improved my approach in problem solving.
Trintel and MTN for supplying the Sierra wireless modems and for the extra funding towards the project.
Dr Booysen for organising the Trintel workshop and his help with setting up commands from the Trintel platform.
My family for their inspirational phone calls and trust they had in me.
George Blignault for helping me with the report and important advice.
Dickson Nhevera for encouraging me to work tirelessly on the project.
Hazel Sekeso for being a sister,a friend ,a source of inspiration and for believing in me all the way.
Hillary Chibaya for just being a positive brother and bringing the energy in me when a day at the labs was a nightmare.
Jason Samuels for always checking up on me and approving of my work, even when I thought I messed up.
Johan Arensde and Wynand van Eeden for all their technical support with soldering and PCB design respectively.
Above all the Lord almighty for granting this opportunity to learn and for surrounding me with all the support that I needed.

ii
Declaration
I, the undersigned, hereby declare that the work contained in this report is my own original work unless indicated otherwise.
Signature: ………………………………………….. MONTH YEAR……………………………..

iii
Abstract
The aim of the project was to develop a system that can monitor the swimming pool entities closely and keep the user updated all the time. The primary focus was the issue of energy saving which is one of the major concerns in South Africa and the world at large.
Various sensors were implemented to do the monitoring of the swimming pool and these include a temperature sensor, a motion sensor and an Energy meter to monitor the energy use patterns of the swimming pool pump. A microcontroller was used to process and then send the readings to Trintel’s Smart platform via a modem where the user could access the measured data. Altium PCB designer was used to assemble all the designed hardware for various parts of the project.
The system monitoring worked well and readings could be accessed remotely on the smart platform. Alert messages to the user, in case of emergency also worked perfectly. Commands to the physical system worked but at several occasions the commands delayed a bit. This then allowed for control of the swimming pool pump remotely. However ,measuring the power consumption of the pump did not work as expected due to problems with reading data from the power measuring Integrated circuit of choice.
iv
Opsomming
Die doel van die projek was om ‘n sisteem te ontwikkel wat swembad entiteite noukerig kan monitor en die gebruiker ter alle tye opgedateerd hou. Die primêre fokus was energie besparing wat een van Suid-Afrika en die res van die wêreld se hoof bekommernisse is.
Verskeie sensore was geïmplimenteer om die swembad te monitor en dit sluit in ‘n temperatuur sensor, bewegingsensor en ‘n energie meter wat die energie gebruik patrone van die swembadpomp kan monitor. ‘n Mikrobeheerder was gebruik om Trintel se Smart platform se lesings te verwerk en dan te stuur deur middel van ‘n modem sodat die gebruiker toegang tot die gemete data het. Altium PCB designer was gebruik om al die ontwerpte hardeware vir die verskeie gedeeltes van die projek saam te voeg.
Die sisteem moniteering het goed gewerk en lesings kon vanaf ‘n afstand op die Smart platform verkry word. Kennisgewing boodskappe na die gebruiker, in die geval van ‘n noodtoestand het ook perfek gewerk. Bevele na die fisiese sisteem het gewerk, maar op verskeie geleenthede was die bevele effens vertraag. Hierdie het dan toegelaat om ‘n swembadpomp vanaf ‘n afstand te beheer. Die meet van kraggebruik van die pomp het egter nie gewerk soos verwag nie weens probleme om data van die kragmeet geïntegreerde stroombaan te lees.

v
Opsomming .................................................................................................................................... iv
Chapter 1 Project motivation and description .......................................................................... 1
1.1 Introduction ...................................................................................................................... 1
1.2 Overview .......................................................................................................................... 1
1.3 Problem Statement .......................................................................................................... 1
1.4 Project objectives and Scope ........................................................................................... 2
1.5 Project planning and design process ................................................................................ 2
1.6 Project schematic ............................................................................................................. 3
Chapter 2 Considered features .................................................................................................. 4
2.1 Overview .......................................................................................................................... 4
2.2 PH Sensors ........................................................................................................................ 4
2.2.1 Acidic ......................................................................................................................... 4
2.2.2 Alkaline ...................................................................................................................... 4
2.3 Chlorine sensors ............................................................................................................... 4
2.4 Water level sensors .......................................................................................................... 5
2.7 Acoustic sensors .................................................................................................................... 5
Chapter 3 Considered hardware ................................................................................................ 6
3.1 Overview .......................................................................................................................... 6
3.2 The Beaglebone Black ...................................................................................................... 6
3.3 The Arduino Due .............................................................................................................. 6
3.4 Turbidity sensors .............................................................................................................. 7
3.5 pH Sensors ........................................................................................................................ 7
3.6 Water level sensors .......................................................................................................... 7
3.7 Vibration sensors .............................................................................................................. 7
3.8 Chlorine sensors ............................................................................................................... 7
3.9 Hydrophone ...................................................................................................................... 8
Chapter 4 Hardware Design ....................................................................................................... 9
4.1 Overview .......................................................................................................................... 9
4.2 Microprocessor................................................................................................................. 9
4.2.1 The Arduino Mega 2560............................................................................................ 9
4.3 Power measuring Circuitry ............................................................................................. 10
4.3.1 The ADE7763 from Analog devices ......................................................................... 10
4.3.2 Data transfer circuitry ............................................................................................. 15
vi
4.4 Sierra Wireless Airlink GL6100 ....................................................................................... 16
4.5 MAX3232 Logic shifting circuit ....................................................................................... 17
4.6 Single phase variable speed drive .................................................................................. 18
4.6.1 The EDS – A200 series ............................................................................................. 18
4.7 Temperature Sensors ...................................................................................................... 19
4.7.1 DS18B20 Digital temperature probe ....................................................................... 20
4.8 Pool Safety Alarms .......................................................................................................... 20
4.8.1 The passive Infrared Sensor(PIR) ............................................................................ 21
4.9 PCB design ...................................................................................................................... 22
Chapter 5 Software design ...................................................................................................... 23
5.1 Overview ........................................................................................................................ 23
5.2 Overall Communication System Overview ..................................................................... 23
5.3 Software design .............................................................................................................. 24
5.4 Energy meter .................................................................................................................. 24
5.4.1 ADE7763 Serial write operation .............................................................................. 25
5.4.2 ADE7763 Serial read operation ............................................................................... 26
5.4.3 Arduino SPI support ................................................................................................ 26
5.5 GSM Communication ..................................................................................................... 27
5.5.1 Machine to machine platform (M2M) .................................................................... 27
5.5.2 Trinity SMART Sight Platform .................................................................................. 28
5.5.3 Attention Commands (AT) ....................................................................................... 28
5.6 Temperature sensor Configuration ................................................................................ 29
5.6.1 One wire .................................................................................................................. 29
5.7 Motion Sensor ................................................................................................................ 29
5.8 Motor control ................................................................................................................. 29
Chapter 6 Testing measurements results and analysis ............................................................ 31
6.1 Overview ........................................................................................................................ 31
6.2 TTL to Rs232 Conversion ................................................................................................ 31
6.2.1 Test .......................................................................................................................... 31
6.2.2 Results ..................................................................................................................... 31
6.3 Serial interphase ............................................................................................................. 32
6.3.1 Test .......................................................................................................................... 32
6.3.2 Results ..................................................................................................................... 33
vii
6.3.3 Problems ................................................................................................................. 33
6.4 Platform Data and Events ............................................................................................... 34
6.4.1 Test .......................................................................................................................... 34
6.4.2 Results ..................................................................................................................... 34
6.5 Dashboard data .............................................................................................................. 35
6.6 Commands for motor control......................................................................................... 36
6.6.1 Test .......................................................................................................................... 36
6.6.2 Results ..................................................................................................................... 36
6.6.3 Results ..................................................................................................................... 37
6.6.4 Problems ................................................................................................................. 37
Chapter 7 Conclusion and Recommendations ........................................................................ 38
7.1 Overview ........................................................................................................................ 38
7.2 Conclusion ...................................................................................................................... 38
7.3 Recommendations ......................................................................................................... 39
Bibliography .................................................................................................................................. 40
viii
List of tables
Table 1: A list of all the abbreviations used in the project. .............................................................. x
Table 2 : Disadvantages of having an acidic or basic water environment. ..................................... 4
Table 3: SPI lines from Microcontroller. ........................................................................................ 26
Table 4: Function calls for SPI library. ............................................................................................ 27
Table 5: AT commands used in the project ................................................................................... 28
Table 6: Functions used to operate the motion sensor. ............................................................... 29
Table 7: The project planning and schedule. ................................................................................ 42
Table 8: Project ECSA exit outcomes. ............................................................................................ 44
ix
List of figures
Figure 1: Project Schematic. ........................................................................................................... 3
Figure 2: ADE7763 functional block diagram. [12] ....................................................................... 12
Figure 3: Shunt resistor connection .............................................................................................. 13
Figure 4 :Voltage differential input . ............................................................................................. 14
Figure 5: Power measuring chip to Arduino connection. ............................................................. 15
Figure 6: RS232 higher level signal (top) and TTL lower level signal (bottom). [16] .................... 17
Figure 7: TTL to RS232 conversion circuit. .................................................................................... 18
Figure 8: multi-step speed run. [18] ............................................................................................. 19
Figure 9: DS18B20 Arduino connections. [21] .............................................................................. 20
Figure 10: PIR sensing criteria. ...................................................................................................... 21
Figure 11: Communication flow diagram of the project. .............................................................. 23
Figure 12: Project flow diagram. ................................................................................................... 24
Figure 13: Data flow sequence. [12] ............................................................................................. 25
Figure 14: Write operation timing diagram. [12] .......................................................................... 25
Figure 15: Read operation timing diagram. [12] ........................................................................... 26
Figure 16: Command execution. ................................................................................................... 30
Figure 17: Setup of the Airvantage platform for data variables ................................................... 31
Figure 18: Smart platform results after data upload. ................................................................... 32
Figure 19: The Output measured when HEX 0x88 was sent via SPI. ............................................ 33
Figure 20: The output measured when a clock divider factor of 128 was used. .......................... 33
Figure 21: Smart platform events log screenshot. ........................................................................ 34
Figure 22: Serial monitor Temperature reading. ........................................................................... 35
Figure 23: Blackberry Z10 SMS log with messages in case of any emergency. ............................ 35
Figure 24: A screenshot of the dashboard. ................................................................................... 36
Figure 25: A screenshot of the operational portal when sending a command. ........................... 36
Figure 26: Job log screenshot........................................................................................................ 36
Figure 27: Motor control LED test. ................................................................................................ 37
Figure 28: features of the beaglebone black. [6] .......................................................................... 45
Figure 29: ADE7763 Pin input specifications. [12] ........................................................................ 46
Figure 30: Collector current (Ic)and collector emitter voltage(Vce). [28] ..................................... 47
Figure 31: EDS-A200 connections. [18] ......................................................................................... 48
Figure 32: SPI timing sequence for the ADE7763. ........................................................................ 49
Figure 33: Some of the registers in the ADE7763. ........................................................................ 50
Figure 34: Power measuring circuit schematic diagram. .............................................................. 51
Figure 35: Power measuring circuit PCB. ...................................................................................... 52
Figure 36: Whole system setup connections. ............................................................................... 53
x
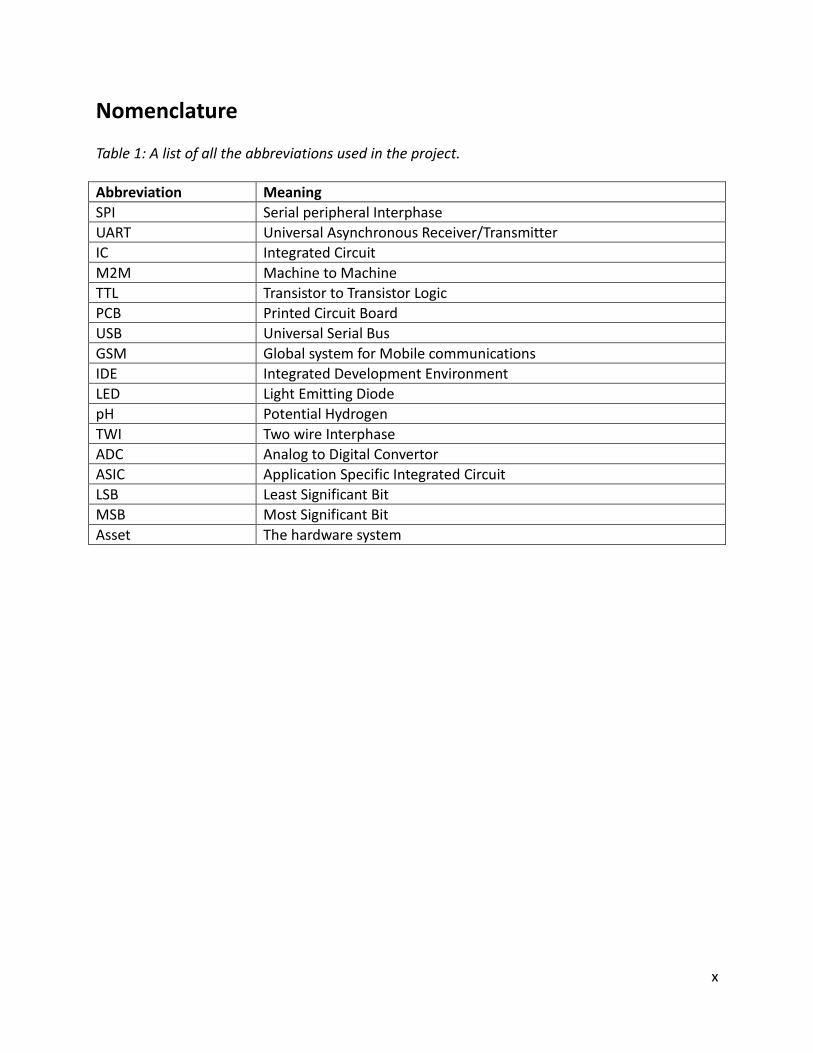
Nomenclature
Table 1: A list of all the abbreviations used in the project.
Abbreviation Meaning
SPI Serial peripheral Interphase
UART Universal Asynchronous Receiver/Transmitter
IC Integrated Circuit
M2M Machine to Machine
TTL Transistor to Transistor Logic
PCB Printed Circuit Board
USB Universal Serial Bus
GSM Global system for Mobile communications
IDE Integrated Development Environment
LED Light Emitting Diode
pH Potential Hydrogen
TWI Two wire Interphase
ADC Analog to Digital Convertor
ASIC Application Specific Integrated Circuit
LSB Least Significant Bit
MSB Most Significant Bit
Asset The hardware system

1
Chapter 1 Project motivation and description
1.1 Introduction
This Project is about the development of a smart swimming pool monitoring system, with the main aim of saving energy. A system that allows the user to access swimming pool information remotely is to be implemented where the user can access real time information about their swimming pool via the internet.
1.2 Overview
The chapter describes the problem to be solved by the particular project and the scope of the project. The following sub sections are included.
The problem statement – Describes the problems encountered through the use of unmonitored pool systems.
Objective and scope – Describes how the problem is going to be solved and the expected outcomes.
The project schematic - A schematic representation of the whole project in a nutshell.
Project initial planning – The intended plan before changes had to be made due to various reasons.
Implemented plan – This was the project that was executed due to uncertainties.
1.3 Problem Statement
The use of swimming pools is increasing daily, with numerous households using them as a means of leisure. Research shows that there are more than 500 000 swimming pools in South Africa. As a matter of fact these numbers are not going to go down, they will continue to rise more rapidly with the increase of demand by the growing population. This increased number will therefore imply an escalated number of problems by swimming pools uses daily. Some of the problems that are currently faced by swimming pool owners and the country at large are as follow huge power usage, drowning, and waterborne illness amongst others.
The use of swimming pools involves the use of water pumps to constantly pump water when it drops beyond a certain level and for purification purposes. This then involves wastage of power if the pumping is not closely monitored and controlled. Most of the filtering and pumping equipment of the swimming pools in the country are designed for the pre – 2008 era, In this time electricity consumption was a secondary considerations. With the rapid increase in demand, electricity saving has become one of the primary goals of any power supply company on the planet, in the case of South Africa Eskom. Since there are no existing guidelines for pump motor size or operating periods, the problem of power wastage still stands. [1] For every single utility safety is always one of the top prioritized considerations. Drowning is one the main concerns when it comes to swimming pool safety. Children and pets are the main victims of swimming pools, especially household pools. A very good example is the research from the

2
CPSC of the United States which shows that drowning deaths of children under the age of 15 averaged from 390 annually between 2008 and 2010. A lot of measures such cover nets, fencing and supervision have been put in place to try and minimize this tragic phenomenon but still thousands of children drown every single day. The other safety problems are the diseases waterborne diseases that are brought about by insufficient monitoring of pools. [2].Waterborne diseases are caused by pathogens; these pathogens cause diseases such as amebiasis, cholera, diarrhoea, typhoid and hepatitis. [3]
On a more luxury point of view, it is a very big inconvenience to want to use the swimming pool when it is not ready. This is because users are not constantly informed about their swimming pool information. For this and other reasons, there is need for a way to closely monitor all the swimming pool components to avoid each of the problems mentioned above.
1.4 Project objectives and Scope
The sole purpose of this project is to develop a system that allows the owner of any swimming to be able to view and optimize the energy consumption of a swimming pool. A number of other sensors that could help the user in better management of the pool were also considered and investigated in the process.
The primary objective of the project, as mentioned above is to create a system that saves energy by allowing the user to access all the information via the internet and at the same time be able to avoid energy over usage remotely. For these purposes energy measuring hardware will be implemented and the measurement will be sent to a microcontroller. The information is then sent to a modem via serial peripheral interphase. The modem then posts the information to a cloud network where it will be accessed by the user. The user will also be able to send commands to the swimming pool to perform various operations via the internet.
Apart from the energy considerations of the project, other sensors are also included for better swimming pool management. These include motion sensors, which detect if toddlers or pest enter the pool area without supervision. The user will be notified via SMS and email when such incidences happen. The temperature and the depth of the water are also closely monitored and posted on to the cloud where the user accesses them. The user is also to be able to control the speed at which the swimming pump is running wirelessly.
1.5 Project planning and design process
As indicated above, the project primary objective is to save as much energy as possible through the use of real time monitoring and control of the swimming’s power usage. In order to save as much power as possible a method to optimize the time and speed that a pump runs with the clarity of the water. Refer to section 3.4 on turbidity sensors for more information on how the sensors work. The basic working of the system was based on the clarity of the water. If the water was close to clear, then the pump would run for a much
3
shorter period optimizing the energy used per pumping period. An algorithm was to calculate the optimum operating point of the pool pump for each clarity level. The user could also select to start, stop and run the pump at different speeds it via the wireless network. Energy usage reports could be accessed via the trinity dashboard system. However the cost of the turbidity sensor that is required for such a design was too high and hence a compromise had to be made.
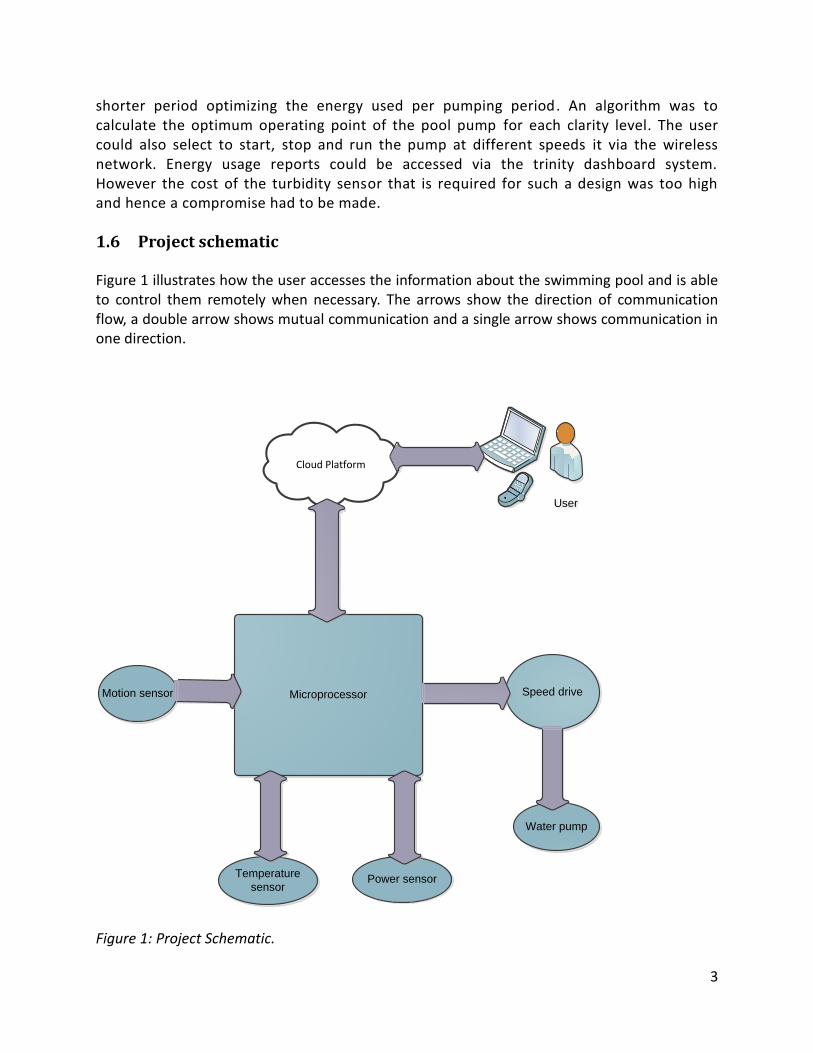
1.6 Project schematic
Figure 1 illustrates how the user accesses the information about the swimming pool and is able to control them remotely when necessary. The arrows show the direction of communication flow, a double arrow shows mutual communication and a single arrow shows communication in one direction.
Microprocessor
Temperature
sensorPower sensor
Water pump
Speed driveMotion sensor
Cloud Platform
UserUser
Figure 1: Project Schematic.

4
Chapter 2 Considered features
2.1 Overview
The section of the report covers the necessary information to a swimming pool user, which was not implemented due to budget constraints. The benefits and non-benefits of having the features were also discussed.
2.2 PH Sensors
PH is an important measure as it shows how acidic or basic the water is. This aspect affects a lot about the swimming pool’s water; chemical reactions are of huge concern since the pH of the water has a huge effect on how the chemicals added to the water react. PH is measured on a scale of zero to fourteen. Zero indicating very acidic and fourteen indicating a more alkaline water environment. Seven being the mediocre, is called the neutral level. Acidity levels around the neutral value but slightly in the alkaline level are ideal for pool operations, values might range from 7.2 to 7.4.
Table 2 below shows the general problems of having an acidic of more alkaline water environment.
Table 2 : Disadvantages of having an acidic or basic water environment.
2.2.1 Acidic 2.2.2 Alkaline
Acidic pool water The activity of the chlorine is low and inefficient
Eye irritations The water becomes cloudy
Corrosion of metal parts of the pool Swimming pool filters will work harder than normal
Staining of walls of the swimming pool Eye irritations
Chlorine residues dissipate very quickly Scaling and decolourisation of the pools walls
With all these factors being mentioned, there is real need to keep a close eye on the pH of the water in order to have a healthy swimming pool experience. Therefore there is a necessity of these pH sensors.
2.3 Chlorine sensors
Water sanitation is very important for swimming pools, as for this fact and the purposes the best sanitizer is required for the purposes of this project and for the pool industry at large. Chlorine is the best choice since it is capable of killing many disease causing pathogens, oxidising other contaminants that come from the environment and for killing algae.
Chlorine sensors are an important component of the swimming pool because to ensure that the right amounts of chlorine is available in the water all the time.

5
2.4 Water level sensors
The level of swimming pool water is a very important quantity for swimming pool owners to know all the time. This can be in the form of a pressure sensor which reports when the water pressure drops below a certain threshold value and then reports when the pool has been refilled. This can be the most important feature of the swimming pool as far as power saving is important. It is very important to know when to use the swimming pool pump and in doing so using as little power as possible, by controlling the pump’s speed and toque values.
2.7 Acoustic sensors
Suction swimming cleaners are one of the common pool cleaners available. This project will also investigate ways to reduce power wastage through controlling the behaviour of the suction cleaner. For these purposes acoustic sensors come in handy. This will be done by periodically monitoring the acoustics produced by the suction cleaner and from that data a control system can be improvised to use as low power as possible. [4]
6
Chapter 3 Considered hardware
3.1 Overview
This section describes all the components that were considered but not implemented in this project for various reasons. A variety of factors were considered for the choice of components used for the project. These factors include:
Cost
Availability
Efficiency
Durability
Size
Safety
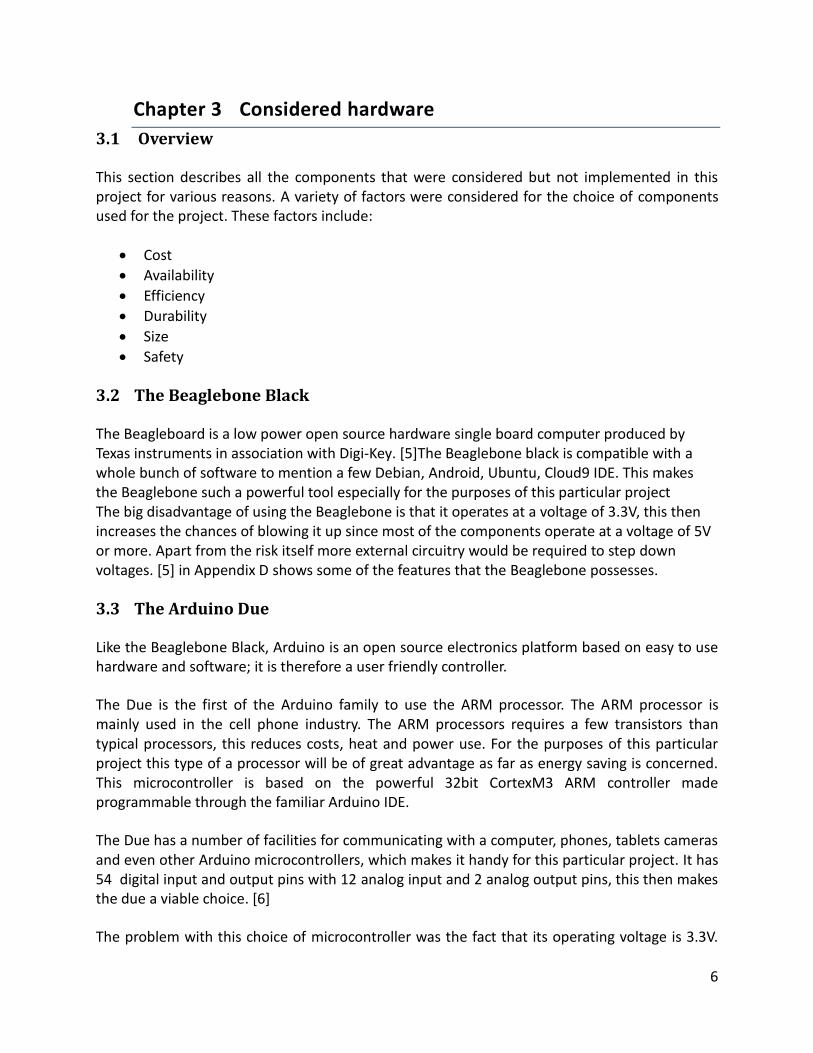
3.2 The Beaglebone Black
The Beagleboard is a low power open source hardware single board computer produced by Texas instruments in association with Digi-Key. [5]The Beaglebone black is compatible with a whole bunch of software to mention a few Debian, Android, Ubuntu, Cloud9 IDE. This makes the Beaglebone such a powerful tool especially for the purposes of this particular project The big disadvantage of using the Beaglebone is that it operates at a voltage of 3.3V, this then increases the chances of blowing it up since most of the components operate at a voltage of 5V or more. Apart from the risk itself more external circuitry would be required to step down voltages. [5] in Appendix D shows some of the features that the Beaglebone possesses.
3.3 The Arduino Due
Like the Beaglebone Black, Arduino is an open source electronics platform based on easy to use hardware and software; it is therefore a user friendly controller.
The Due is the first of the Arduino family to use the ARM processor. The ARM processor is mainly used in the cell phone industry. The ARM processors requires a few transistors than typical processors, this reduces costs, heat and power use. For the purposes of this particular project this type of a processor will be of great advantage as far as energy saving is concerned. This microcontroller is based on the powerful 32bit CortexM3 ARM controller made programmable through the familiar Arduino IDE.
The Due has a number of facilities for communicating with a computer, phones, tablets cameras and even other Arduino microcontrollers, which makes it handy for this particular project. It has 54 digital input and output pins with 12 analog input and 2 analog output pins, this then makes the due a viable choice. [6]
The problem with this choice of microcontroller was the fact that its operating voltage is 3.3V.

7
To reduce the chances of blowing up the microcontroller, this board would not be a good choice for the project.
3.4 Turbidity sensors
Turbidity is the haziness of a fluid caused by large numbers of individual particles that are generally invisible to the naked eye. For this reason this is a very good measure of the quality of water. Turbidity sensors would have been a very good feature for the project since they give a good indication of water quality. Unfortunately these sensors are costly and they were not implemented for the project.
3.5 pH Sensors
After all considerations the Analog Meter Kit V1.0 was found to be the better choice as a pH sensor. The Analog meter is specially designed for Arduino controllers. It has simple built in, convenient, practical connection, very suitable for online monitoring and has a long lifespan. The meter has an LED which works as the power indicator, a BNC connector and PH2.0 sensor interface. One of the best aspects about this particular sensor is its ability to work under a variety of pH measurements with fast response, good thermal stability, good reproducibility, difficulty to hydrolysis and its ability to eliminate alkali error. [7]
3.6 Water level sensors
The HC-SR04 Ultrasonic Sensor is the ultimate distance sensor for the project. The sensor will be used to detect when the water level is full so that the pump will stop pumping water in to the pool for the purposes of saving power. The Ultrasonic ranging module HC-SR04 provides measurement function, the ranging accuracy can reach to 3mm. The modules includes ultrasonic transmitters, receivers a control circuit. [8]
3.7 Vibration sensors
The Digital vibration sensor has a vibration switch module which can detect weak vibration signals which can be realized with the shock interaction with relevant works. It has vibration switch digital input module and is compatible with various sensor boards, including the Arduino. [9]. The module was to be used to detect the behaviour of the suction cleaner for energy saving purposes.
3.8 Chlorine sensors
The CLD 500 chlorine dioxide sensor utilizes amperometric technology for real time chlorine dioxide measurements. Applications include water treatment disinfection and chlorine dioxide generators. The sensor provides a fixed 4-20mA output which is temperature compensated. A power supply voltage of 12-24VDC is required. The CLD500 is designed for 0-2ppm measurements while the CLD510 features a measuring range of 0-10ppm. A durable membrane

8
is integrated into the cap for ease of replacement. [10] The price and unavailability of these sensors was a major concern therefor they were not implemented.
3.9 Hydrophone
Another good feature for the project would have been the hydrophone. From definition a hydrophone is a microphone that can be used underwater. For the purposes of this project these sensors would come in handy. As the sensors basically measure sound underwater, they can then be used to detect if the suctions cleaner is working or not. This would then help to control the functionality of the suction cleaner and be able to know if it is working, save energy in the process since the energy saving is of great concern. This information would also help the user to know if there is a fault with the cleaner.

9
Chapter 4 Hardware Design
4.1 Overview
This chapter describes all the hardware used for the project. All the design methodology used and calculated values and assumptions are included. Below are some of the important highlights of the chapter.
Microprocessor features and advantages
Power measuring Integrated circuit and its external circuitry design
Trinity modem features and general description
Logic level conversion circuitry
Variable speed drive
Temperature sensor
Motion sensor
Water level sensor
4.2 Microprocessor 4.2.1 The Arduino Mega 2560
The microprocessor of choice for the project was the Arduino Mega2560, unlike the previously mentioned Arduino Due and the beaglebone black, its operating voltage is 5V which is ideal for the project. The board has 54 digital input/output pins, 16 analog inputs, 4 UARTs, a 16MHZ crystal oscillator, a USB connection , a power jack and all the support needed to use the microcontroller. [11]
Power supply
The Mega can be powered via USB connection as well as with an external power supply. The external power adaptor is a 2.1mm center- positive plug which can be connected to the board’s power jack. External voltage supplies ranging from 6 to 20 volts can be applied to the board through the power jack. The board has on board power supplies of both 5V and 3.3V and ground generated by on board regulators. This support makes the board a viable option for the project since there is less worry for external power supplies. The Arduino can also be powered through the USB port, which is also used for serial communication with a computer. If an external power supply is used a minimum of 7V must be applied through the power jack otherwise the 5V output pins will supply less voltage than the rated.
Memory
The Mega 2560 has an on board flash memory for storing code of 256KB,8 KB of that is used for the boot loader. 8KB of SRAM and 8KB of EEROM which can be written and read from using the EEPROM library that is provided.

10
Pinning and Communication
The 54 digital pins of the Mega can be used as outputs or inputs using built in functions. The pins operate at 5V and they can receive and provide a maximum of 40mA with pull up resistors of 20-50kOhms already installed. Four serial TTL pins, 14 pulse width modulation pins, 16 analog input pins are also provided. The analog inputs provide 10 bits of resolution which bring about a great deal of accuracy.
The Mega provides a number of ways to communicate with another Arduino microcontrollers, computers even other microcontrollers. Four hardware UARTs for TTL(5V) serial communication are common ways. The Arduino software includes a serial monitor which allows simple textual data to be sent to and from the board. The board has transmit and receive light emitting diodes which will flash when data is being sent to and from the board. Both TWI and SPI communication are supported by the board and useful libraries are provided for both communication protocols.
The Arduino Mega is programmed with the Arduino software which can be downloaded on the platform. A pre burned boot loader is also provided for this particular board and this allows the upload of new code without an external hardware programmer. All communications are done using Atmel’s STK500 protocol. The Arduino platform provides all the necessary support for the programming of the microprocessor. Chapter 5 describes the various Arduino libraries used in the project.
Protection
The Arduino Mega2560 has a resettable polyfuse that protects the computer’s USB ports from overcurrent and shorts. If more than 500mA is applied to the USB port, the fuse will automatically break the connection until the short or overload is removed.
4.3 Power measuring Circuitry
Power measurements formed a big part of the project, and for these purposes a number of power measuring ICs where considered. Amongst others the CS5490 IC , 78M6613 and the ADE7763 single phase power measuring ICs where considered.
4.3.1 The ADE7763 from Analog devices
The ADE7763 has several features that make it favourable for this particular project. Amongst others the IC has analog to digital convertors and fixed function DSP for high accuracy. A second order 16 bit ∑ ∆ 𝐴𝐷𝐶𝑠, a digital integrator, reference circuitry ,a temperature sensor , and all signal processing needed to perform active and apparent energy measurements, line voltage period measurements, and rms calculation on the voltage and current channels.
Normal energy calculation formulae are used for the calculation of the rms values and this are
11
as follow.
𝑉𝑟𝑚𝑠 = √1
𝑇 × ∫ 𝑉2(𝑡) 𝑑𝑡
𝑇
0 𝑓𝑜𝑟 𝑐𝑜𝑛𝑡𝑖𝑛𝑢𝑜𝑢𝑠 𝑉(𝑡) 𝑠𝑖𝑔𝑛𝑎𝑙𝑠 Equation 1
𝑉𝑟𝑚𝑠 = √1
𝑁 × ∑ 𝑉2(𝑖)𝑁
𝑖=1 𝑓𝑜𝑟 𝑑𝑖𝑠𝑐𝑟𝑒𝑡𝑒 𝑉(𝑡) 𝑠𝑖𝑔𝑛𝑎𝑙𝑠 Equation 2
𝐼𝑟𝑚𝑠 = √1
𝑇 × ∫ 𝐼2(𝑡)𝑑𝑡
𝑇
0𝑓𝑜𝑟 𝑐𝑜𝑛𝑡𝑖𝑛𝑢𝑜𝑢𝑠 𝐼(𝑡) 𝑠𝑖𝑔𝑛𝑎𝑙𝑠 Equation 3
𝐼𝑟𝑚𝑠 = √1
𝑇 × ∑ 𝐼2(𝑖)𝑁
𝑖=1 𝑓𝑜𝑟 𝑑𝑖𝑠𝑐𝑟𝑒𝑡𝑒 𝐼(𝑡) 𝑠𝑖𝑔𝑛𝑎𝑙𝑠 Equation 4
The IC also has a digital integrator that provides direct interface to 𝑑𝑖 𝑑𝑡⁄ current sensors such as the Rogowski coils, eliminating the need for an external analog integrator thereby resulting in long term stability and precise phase matching between the current and voltage channels. The ADE7763 comes with serial interface to read data and a pulse output frequency that is proportional to active power, this makes it an easier option to use with a microprocessor.
12
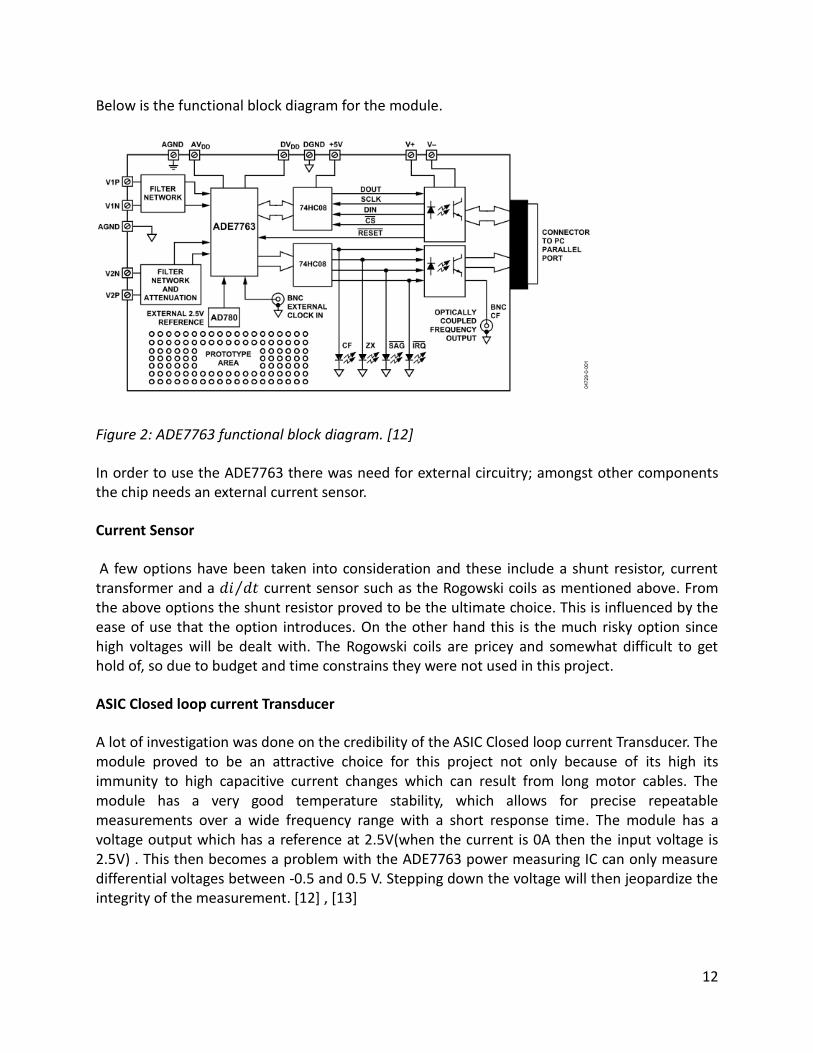
Below is the functional block diagram for the module.
Figure 2: ADE7763 functional block diagram. [12]
In order to use the ADE7763 there was need for external circuitry; amongst other components the chip needs an external current sensor.
Current Sensor
A few options have been taken into consideration and these include a shunt resistor, current transformer and a 𝑑𝑖 𝑑𝑡⁄ current sensor such as the Rogowski coils as mentioned above. From the above options the shunt resistor proved to be the ultimate choice. This is influenced by the ease of use that the option introduces. On the other hand this is the much risky option since high voltages will be dealt with. The Rogowski coils are pricey and somewhat difficult to get hold of, so due to budget and time constrains they were not used in this project.
ASIC Closed loop current Transducer
A lot of investigation was done on the credibility of the ASIC Closed loop current Transducer. The module proved to be an attractive choice for this project not only because of its high its immunity to high capacitive current changes which can result from long motor cables. The module has a very good temperature stability, which allows for precise repeatable measurements over a wide frequency range with a short response time. The module has a voltage output which has a reference at 2.5V(when the current is 0A then the input voltage is 2.5V) . This then becomes a problem with the ADE7763 power measuring IC can only measure differential voltages between -0.5 and 0.5 V. Stepping down the voltage will then jeopardize the integrity of the measurement. [12] , [13]
13
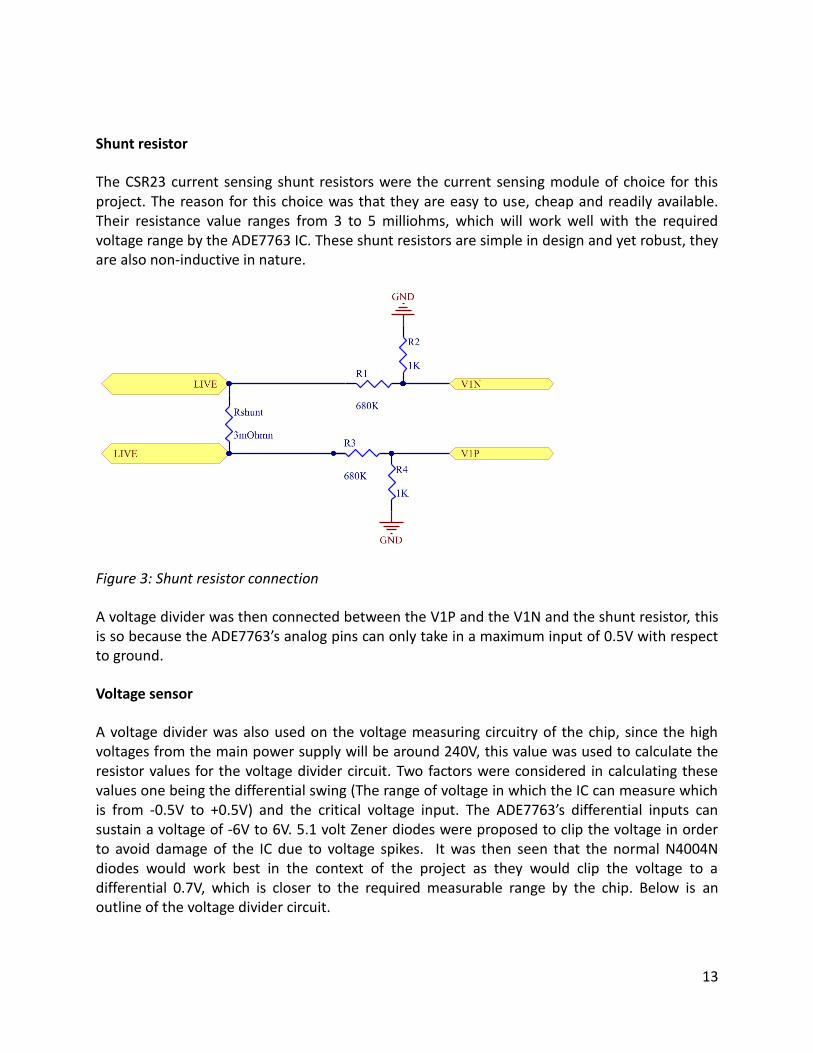
Shunt resistor
The CSR23 current sensing shunt resistors were the current sensing module of choice for this project. The reason for this choice was that they are easy to use, cheap and readily available. Their resistance value ranges from 3 to 5 milliohms, which will work well with the required voltage range by the ADE7763 IC. These shunt resistors are simple in design and yet robust, they are also non-inductive in nature.
Figure 3: Shunt resistor connection
A voltage divider was then connected between the V1P and the V1N and the shunt resistor, this is so because the ADE7763’s analog pins can only take in a maximum input of 0.5V with respect to ground.
Voltage sensor
A voltage divider was also used on the voltage measuring circuitry of the chip, since the high voltages from the main power supply will be around 240V, this value was used to calculate the resistor values for the voltage divider circuit. Two factors were considered in calculating these values one being the differential swing (The range of voltage in which the IC can measure which is from -0.5V to +0.5V) and the critical voltage input. The ADE7763’s differential inputs can sustain a voltage of -6V to 6V. 5.1 volt Zener diodes were proposed to clip the voltage in order to avoid damage of the IC due to voltage spikes. It was then seen that the normal N4004N diodes would work best in the context of the project as they would clip the voltage to a differential 0.7V, which is closer to the required measurable range by the chip. Below is an outline of the voltage divider circuit.

14
Figure 4 :Voltage differential input .
The values of R1 and R2 were calculated using the largest voltage input that can be applied through the terminals as reference. Using the above analogy the input voltage is taken to be 240V; R2 is estimated to be 1kOhmn and the intended terminal output voltage to be 0.35V. Using voltage divider principles the following calculation of R2 was conducted.
𝑅2 =1
0.35 × 240 ≈ 680𝐾 Equation 5
Figure 29 in Appendix D shows the section of the datasheet that shows the input pins voltage specifications.
Power Supply
The ADE7763 requires a power supply of 5V in order to operate. For these purposes the Arduino microprocessor and the miniature 1 Watt 3KV Isolated Unregulated DC/DC Convertor were used.
DCH010505SN7 DC to DC convertor
The DCH010505SN7 DC to DC convertor was used to power the circuit. The convertor takes in an input of 5V and gives an output of 5V as well. The input 5V was sourced from one of the 5V outputs of the Arduino Mega2560. The reason for the use of the convertor was the 1 Watt, 3kV isolation that it gives isolation between the Arduino and the power measuring circuitry itself. This choice reduces the chance of blowing up the microprocessor if any high voltage spikes could happen on the side of the power measuring circuit. The convertor requires minimal to none external components, reducing board space.
The convertor has and efficiency of up to 78%, which is bad considering its application for this particular project.

15
4.3.2 Data transfer circuitry
Four pins were used for serial communication with the Arduino microprocessor DIN, SCLK, DOUT and CS were used. The details of the functionalities of the pins will be discussed in the serial communications section in Chapter 5 of the project. As indicated in the above sections the isolation of the power measuring circuit and the microprocessor was vital. For the data transfer side optocouplers were used.
An optocoupler is a component that transfers signals through two electrically isolated media. Optocouplers are used to prevent high voltages from affecting a system that is receiving a signal. The primary side is a light emitting diode that emits light relative to the input voltage. The secondary side is a photodiode which senses the light from the primary side. This then determines if the transistor is on or off.
ACPL847 optocoupler
The ACPL847 optocoupler from Avago technologies was the optocoupler of choice. The isolator gives a maximum isolation of 5kV between the two entities. The timing of the optocoupler was also a very important factor in this choice. The response time for this particular one is 4𝜇𝑠.
The diagram shows the basic optocoupler circuit to connect the Arduino to the power measuring circuit.
Figure 5: Power measuring chip to Arduino connection.
The resistor values of R1, R2 were calculated as per the specifications of the ACPL-847 optocoupler ,the Arduino and the ADE7763 IC pin output currents and voltages.
For the calculation of the Series resistor R1 the maximum output current and voltage of the ADE7763 and the maximum forward voltage that the diode can handle were considered. From the optocoupler datasheet the diode can handle a voltage ranging from 1.2V to 1.4V and 1.3V was selected. Since the pin output current of the power sensor IC ranges from 0.8mA to 5mA, the value of 5mA was used for calculation of the resistor R and the following calculations were
16
made. [12]
𝑅 =4−1.3
5×10−3 = 540 𝑂ℎ𝑚𝑛 Equation 6
Figure 29 in Appendix D shows the differential pin in put voltage specifications used as guidelines for the above calculation.
Calculations were also made for the RL pull up resistor and for this; the optocoupler datasheet was the main reference. Figure 30 in Appendix D shows the relationships between various collector currents and collector emitter voltages. Using a collector current (Ic) of 2 mA and striving for a Vce (collector emitter voltage) of 0.2V and taking the voltage loop from Vcc to ground the following is acquired.
−𝑉𝑐𝑐 + 𝐼𝑐 ∗ 𝑅2 + 𝑉𝑐𝑒 = 0 Equation 7
𝑅 = 𝑉𝑐𝑐−𝑉𝑐𝑒
𝐼𝑐 Equation 8
𝑅 = 5−0.2
2×10−3 = 2400 ≈ 2.2𝐾𝑂ℎ𝑚𝑛 Equation 9
The value of the series resistor connecting the Arduino and the ADE7763 power measuring IC was also calculated as per the above mentioned considerations. The Arduino has a digital output current ranging from 40mA to 50mA and the value of 40mA was used for calculations. A voltage high on the Arduino is a 5V and a voltage low on the optocoupler is 1.2 as per design. From these values, the following calculations were made.
𝑉 = 𝐼 ∗ 𝑅 Equation 10
𝑅2 =𝑉𝑜𝑢𝑡ℎ𝑖𝑔ℎ(𝑎𝑟𝑑𝑢𝑖𝑛𝑜)−𝑉𝑜𝑢𝑡𝑙𝑜𝑤(𝐴𝐷𝐸7763)
𝐼(𝑎𝑟𝑑𝑢𝑖𝑛𝑜) Equation 11
𝑅2 = 5−1.3
20× 10−3 = 185 ≈ 220 𝑂ℎ𝑚𝑛. Equation 12
4.4 Sierra Wireless Airlink GL6100
The Sierra Wireless Airlink GL6100 was the modem used for this project and this was supplied by Trintel. The GL6100 is a Quad band GSM/GPRS programmable modem with UART host interphase, this is the smallest platform for connecting devices using for establishing powerful M2M (machine to machine) communications. [14]
The Airlink GL series features the Open AT application framework, which is a complete software package for developing embedded M2M applications in C\C++ programming languages.
The modem uses RS232 communication standards for communication and the Arduino operates
17
on TTL standards a conversion was therefore needed, section 4.5 below describes the circuitry used for the conversion.
4.5 MAX3232 Logic shifting circuit
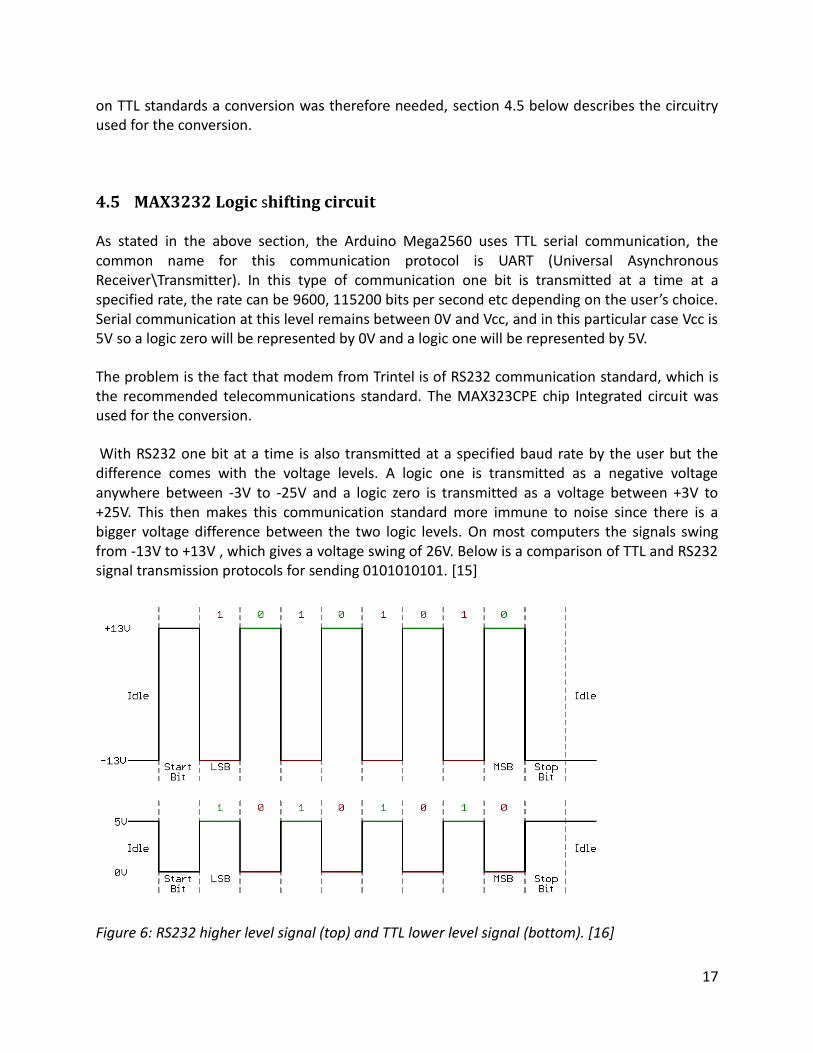
As stated in the above section, the Arduino Mega2560 uses TTL serial communication, the common name for this communication protocol is UART (Universal Asynchronous Receiver\Transmitter). In this type of communication one bit is transmitted at a time at a specified rate, the rate can be 9600, 115200 bits per second etc depending on the user’s choice. Serial communication at this level remains between 0V and Vcc, and in this particular case Vcc is 5V so a logic zero will be represented by 0V and a logic one will be represented by 5V.
The problem is the fact that modem from Trintel is of RS232 communication standard, which is the recommended telecommunications standard. The MAX323CPE chip Integrated circuit was used for the conversion.
With RS232 one bit at a time is also transmitted at a specified baud rate by the user but the difference comes with the voltage levels. A logic one is transmitted as a negative voltage anywhere between -3V to -25V and a logic zero is transmitted as a voltage between +3V to +25V. This then makes this communication standard more immune to noise since there is a bigger voltage difference between the two logic levels. On most computers the signals swing from -13V to +13V , which gives a voltage swing of 26V. Below is a comparison of TTL and RS232 signal transmission protocols for sending 0101010101. [15]
Figure 6: RS232 higher level signal (top) and TTL lower level signal (bottom). [16]
18
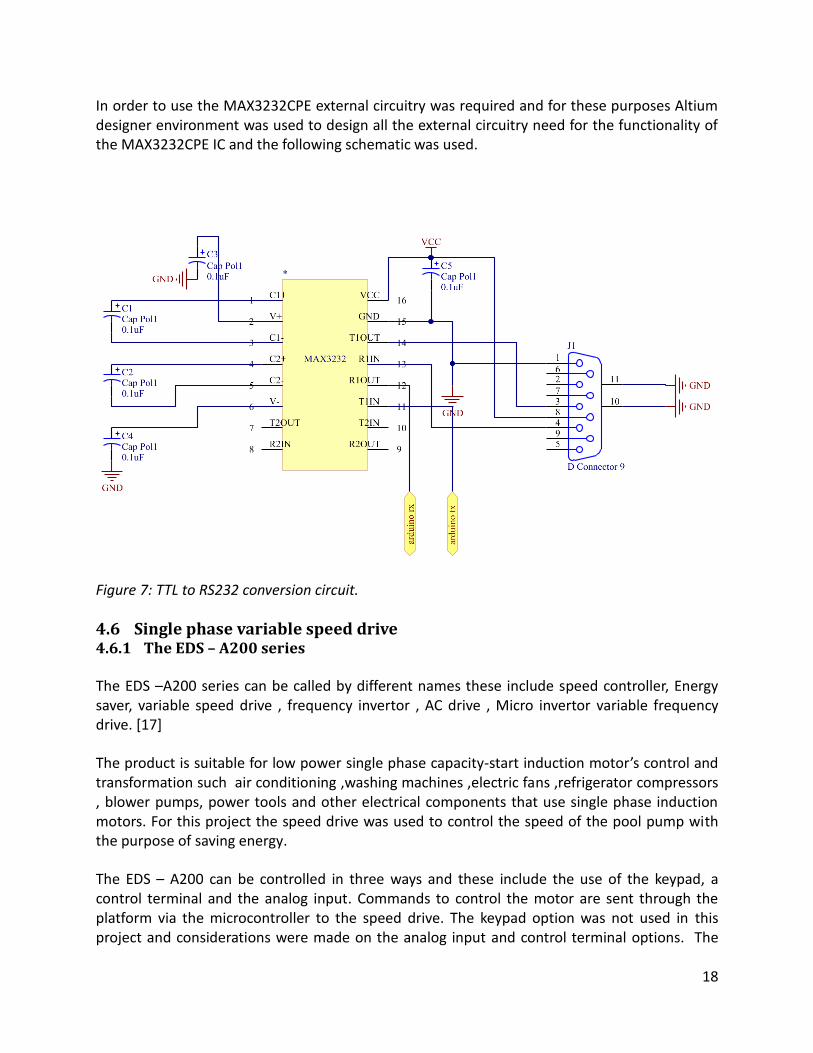
In order to use the MAX3232CPE external circuitry was required and for these purposes Altium designer environment was used to design all the external circuitry need for the functionality of the MAX3232CPE IC and the following schematic was used.
Figure 7: TTL to RS232 conversion circuit.
4.6 Single phase variable speed drive 4.6.1 The EDS – A200 series
The EDS –A200 series can be called by different names these include speed controller, Energy saver, variable speed drive , frequency invertor , AC drive , Micro invertor variable frequency drive. [17]
The product is suitable for low power single phase capacity-start induction motor’s control and transformation such air conditioning ,washing machines ,electric fans ,refrigerator compressors , blower pumps, power tools and other electrical components that use single phase induction motors. For this project the speed drive was used to control the speed of the pool pump with the purpose of saving energy.
The EDS – A200 can be controlled in three ways and these include the use of the keypad, a control terminal and the analog input. Commands to control the motor are sent through the platform via the microcontroller to the speed drive. The keypad option was not used in this project and considerations were made on the analog input and control terminal options. The
19
serial port uses the RS485 protocol for communication and the Arduino mega2560 uses the TTL protocol therefore a conversion circuit was required. The best option left was the use of the control terminal, which makes used of digital control through the digital I/O pins of the Arduino.
Figure 31 in Appendix D shows the connection layout of the speed drive.
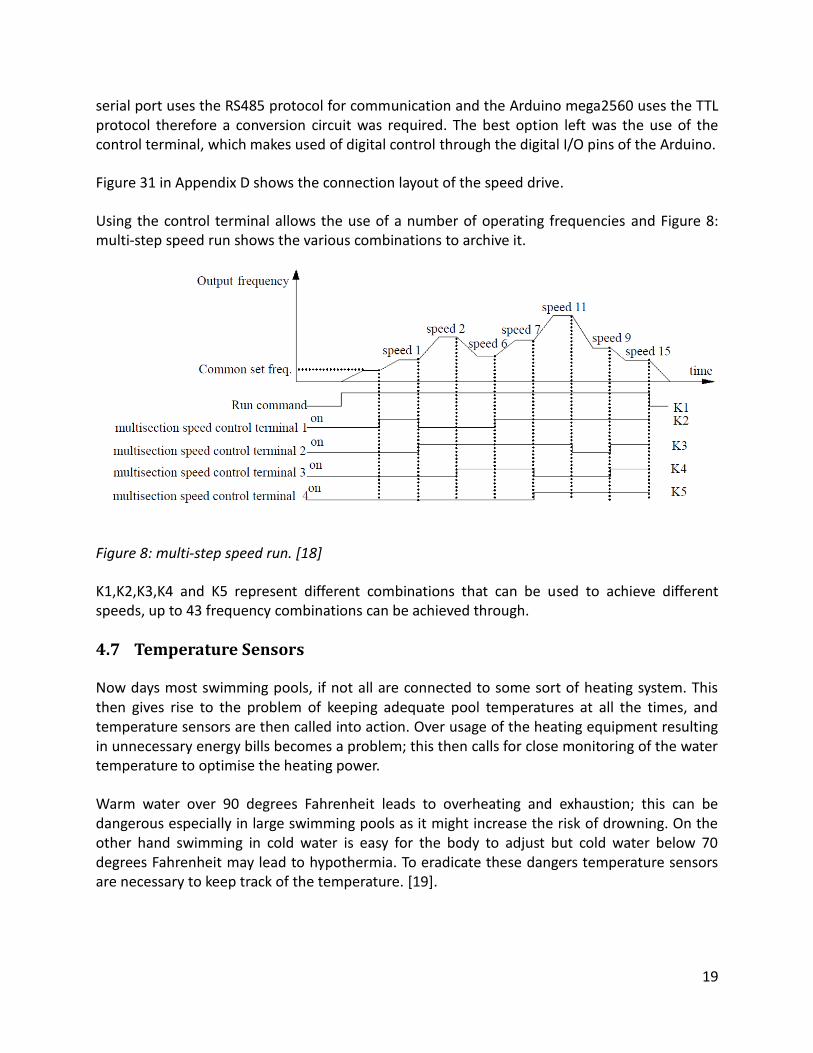
Using the control terminal allows the use of a number of operating frequencies and Figure 8: multi-step speed run shows the various combinations to archive it.
Figure 8: multi-step speed run. [18]
K1,K2,K3,K4 and K5 represent different combinations that can be used to achieve different speeds, up to 43 frequency combinations can be achieved through.
4.7 Temperature Sensors
Now days most swimming pools, if not all are connected to some sort of heating system. This then gives rise to the problem of keeping adequate pool temperatures at all the times, and temperature sensors are then called into action. Over usage of the heating equipment resulting in unnecessary energy bills becomes a problem; this then calls for close monitoring of the water temperature to optimise the heating power.
Warm water over 90 degrees Fahrenheit leads to overheating and exhaustion; this can be dangerous especially in large swimming pools as it might increase the risk of drowning. On the other hand swimming in cold water is easy for the body to adjust but cold water below 70 degrees Fahrenheit may lead to hypothermia. To eradicate these dangers temperature sensors are necessary to keep track of the temperature. [19].
20
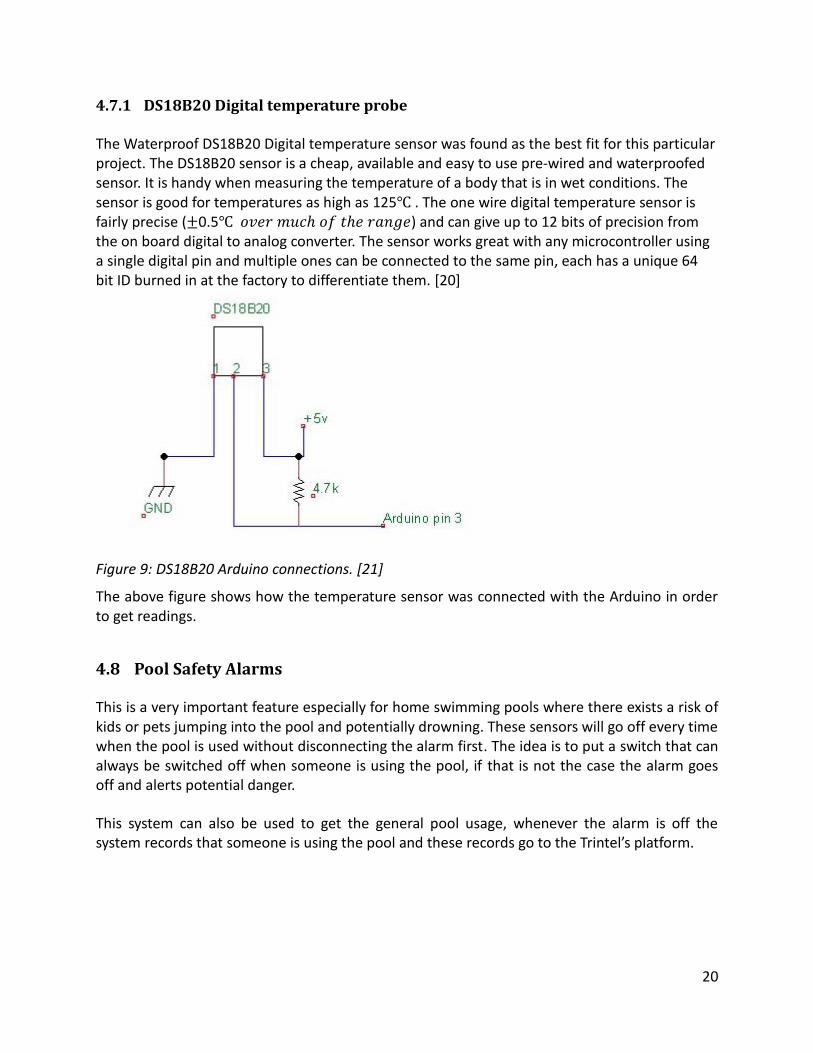
4.7.1 DS18B20 Digital temperature probe The Waterproof DS18B20 Digital temperature sensor was found as the best fit for this particular project. The DS18B20 sensor is a cheap, available and easy to use pre-wired and waterproofed sensor. It is handy when measuring the temperature of a body that is in wet conditions. The sensor is good for temperatures as high as 125℃ . The one wire digital temperature sensor is fairly precise (±0.5℃ 𝑜𝑣𝑒𝑟 𝑚𝑢𝑐ℎ 𝑜𝑓 𝑡ℎ𝑒 𝑟𝑎𝑛𝑔𝑒) and can give up to 12 bits of precision from the on board digital to analog converter. The sensor works great with any microcontroller using a single digital pin and multiple ones can be connected to the same pin, each has a unique 64 bit ID burned in at the factory to differentiate them. [20]
Figure 9: DS18B20 Arduino connections. [21]
The above figure shows how the temperature sensor was connected with the Arduino in order to get readings.
4.8 Pool Safety Alarms
This is a very important feature especially for home swimming pools where there exists a risk of kids or pets jumping into the pool and potentially drowning. These sensors will go off every time when the pool is used without disconnecting the alarm first. The idea is to put a switch that can always be switched off when someone is using the pool, if that is not the case the alarm goes off and alerts potential danger.
This system can also be used to get the general pool usage, whenever the alarm is off the system records that someone is using the pool and these records go to the Trintel’s platform.
21
4.8.1 The passive Infrared Sensor(PIR)
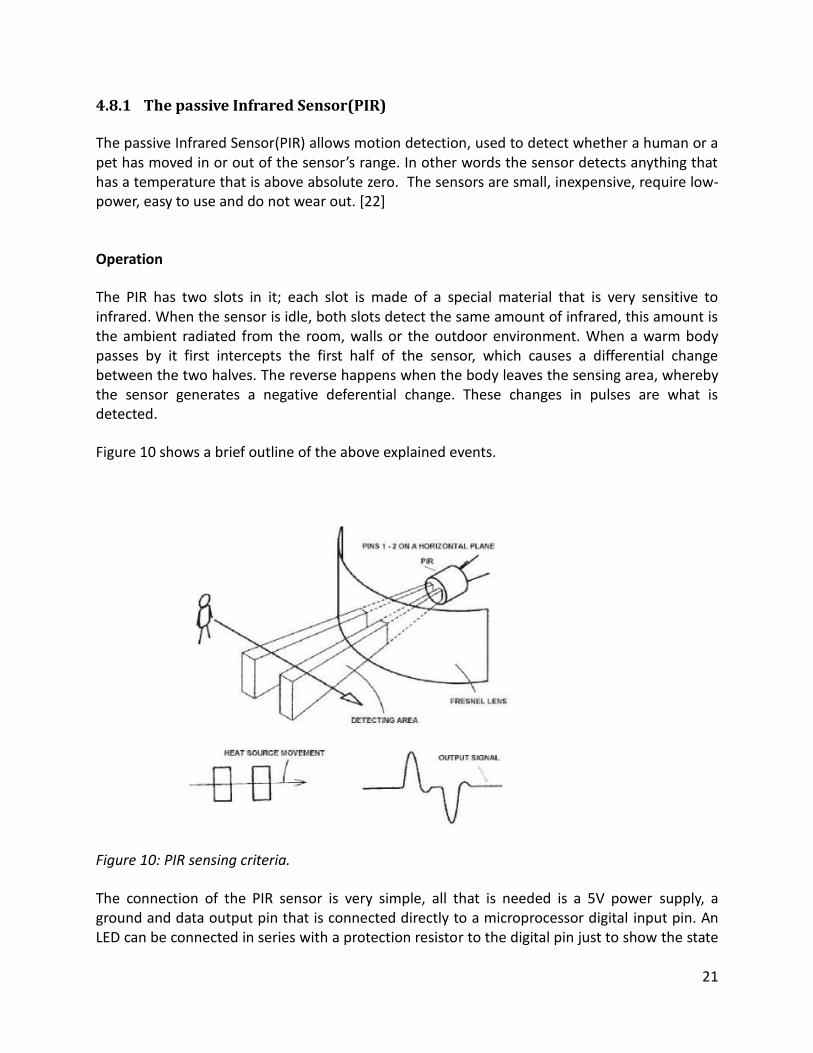
The passive Infrared Sensor(PIR) allows motion detection, used to detect whether a human or a pet has moved in or out of the sensor’s range. In other words the sensor detects anything that has a temperature that is above absolute zero. The sensors are small, inexpensive, require low-power, easy to use and do not wear out. [22]
Operation
The PIR has two slots in it; each slot is made of a special material that is very sensitive to infrared. When the sensor is idle, both slots detect the same amount of infrared, this amount is the ambient radiated from the room, walls or the outdoor environment. When a warm body passes by it first intercepts the first half of the sensor, which causes a differential change between the two halves. The reverse happens when the body leaves the sensing area, whereby the sensor generates a negative deferential change. These changes in pulses are what is detected.
Figure 10 shows a brief outline of the above explained events.
Figure 10: PIR sensing criteria.
The connection of the PIR sensor is very simple, all that is needed is a 5V power supply, a ground and data output pin that is connected directly to a microprocessor digital input pin. An LED can be connected in series with a protection resistor to the digital pin just to show the state

22
of the sensor if no microcontroller is used. [23]
4.9 PCB design To build all the external circuitry needed for the ADE7763 and the MAX3232CPE ICs, Altium designer environment was used. This took a vast amount of time in the project, The schematic and PCB files manufactured are in included in Appendix D. Also included in Appendix D is the system layout after all the connections were made.
23
Chapter 5 Software design
5.1 Overview
Software was used to interphase between the different pieces of hardware to integrate them into one working system. The communication between the hardware and the cloud network is covered in detail. A detailed description of the all the communication protocols between the different modules is also given. Below is just a highlight of the topics covered in the chapter.
Serial interphase between the Arduino and the ADE7763
Speed setup on the variable speed drive
Cloud network and trinity modem
Arduino programming environment
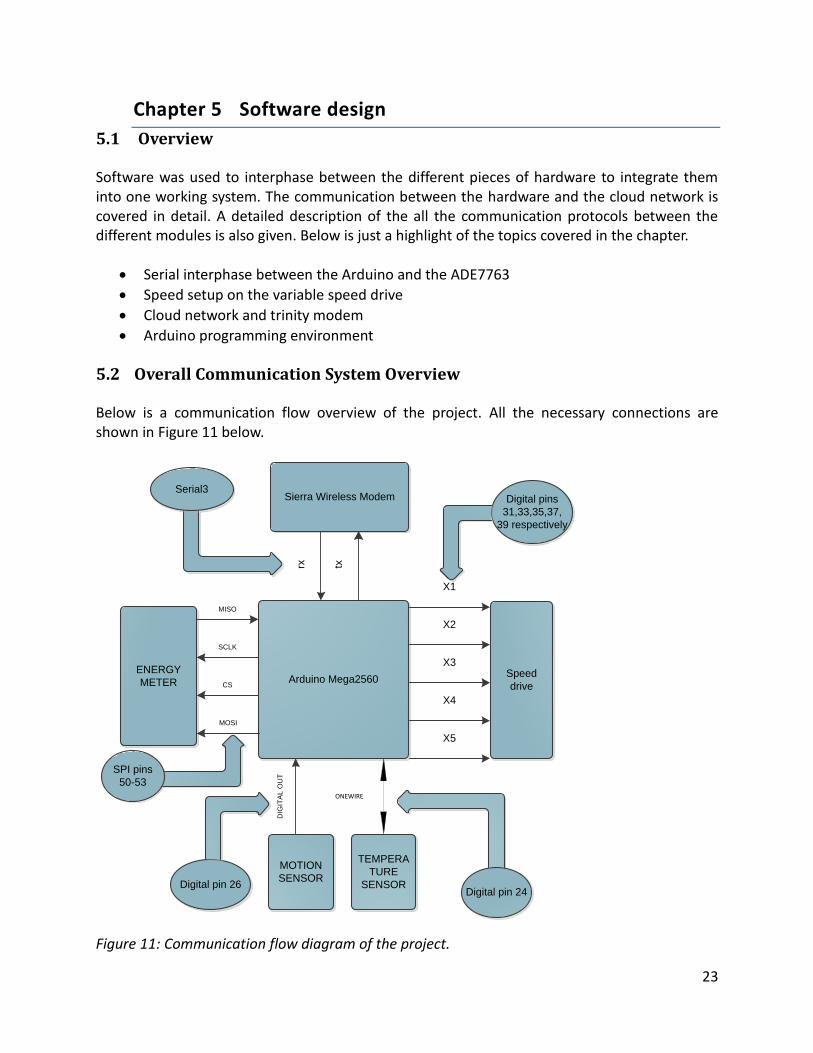
5.2 Overall Communication System Overview
Below is a communication flow overview of the project. All the necessary connections are shown in Figure 11 below.
Arduino Mega2560
Sierra Wireless Modem
MOTION
SENSOR
TEMPERA
TURE
SENSOR
Speed
drive
ENERGY
METER
rx
tx
X1
X3
X4
X5
X2
DIG
ITA
L O
UT
ONEWIRE
MISO
SCLK
CS
MOSI
Serial3
Digital pin 24Digital pin 26
Digital pins
31,33,35,37,
39 respectively
SPI pins
50-53
Figure 11: Communication flow diagram of the project.
24
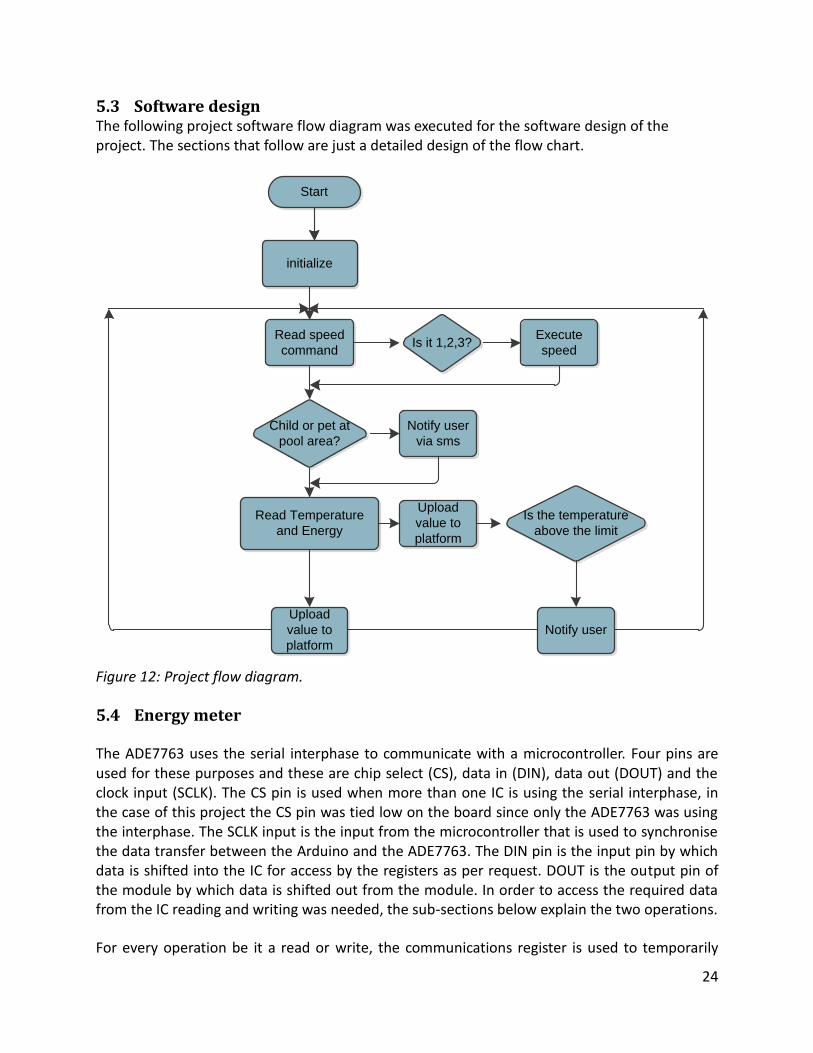
5.3 Software design The following project software flow diagram was executed for the software design of the project. The sections that follow are just a detailed design of the flow chart.
Start
initialize
Is it 1,2,3?Execute
speed
Child or pet at
pool area?
Notify user
via sms
Read Temperature
and Energy
Is the temperature
above the limit
Read speed
command
Upload
value to
platform
Notify user
Upload
value to
platform
Figure 12: Project flow diagram.
5.4 Energy meter
The ADE7763 uses the serial interphase to communicate with a microcontroller. Four pins are used for these purposes and these are chip select (CS), data in (DIN), data out (DOUT) and the clock input (SCLK). The CS pin is used when more than one IC is using the serial interphase, in the case of this project the CS pin was tied low on the board since only the ADE7763 was using the interphase. The SCLK input is the input from the microcontroller that is used to synchronise the data transfer between the Arduino and the ADE7763. The DIN pin is the input pin by which data is shifted into the IC for access by the registers as per request. DOUT is the output pin of the module by which data is shifted out from the module. In order to access the required data from the IC reading and writing was needed, the sub-sections below explain the two operations.
For every operation be it a read or write, the communications register is used to temporarily
25
store data before it is used. Figure 13 shows the data flow sequence for both read and write operations.
Figure 13: Data flow sequence. [12]
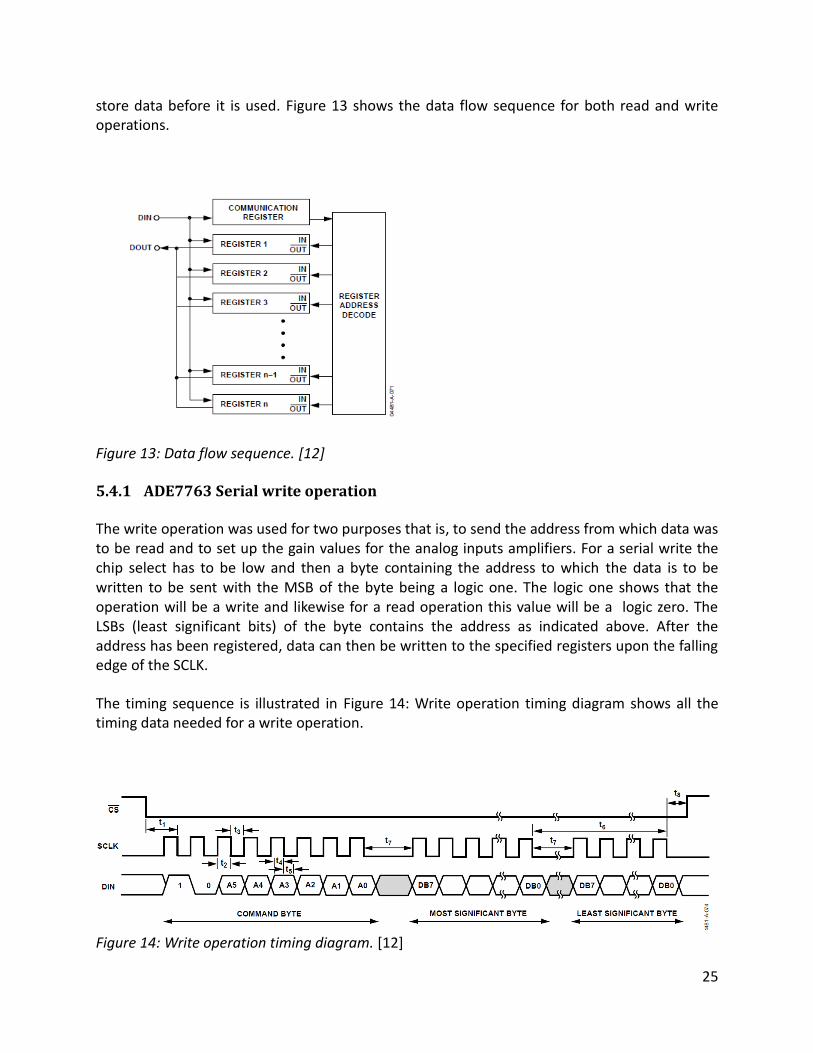
5.4.1 ADE7763 Serial write operation
The write operation was used for two purposes that is, to send the address from which data was to be read and to set up the gain values for the analog inputs amplifiers. For a serial write the chip select has to be low and then a byte containing the address to which the data is to be written to be sent with the MSB of the byte being a logic one. The logic one shows that the operation will be a write and likewise for a read operation this value will be a logic zero. The LSBs (least significant bits) of the byte contains the address as indicated above. After the address has been registered, data can then be written to the specified registers upon the falling edge of the SCLK.
The timing sequence is illustrated in Figure 14: Write operation timing diagram shows all the timing data needed for a write operation.
Figure 14: Write operation timing diagram. [12]
26
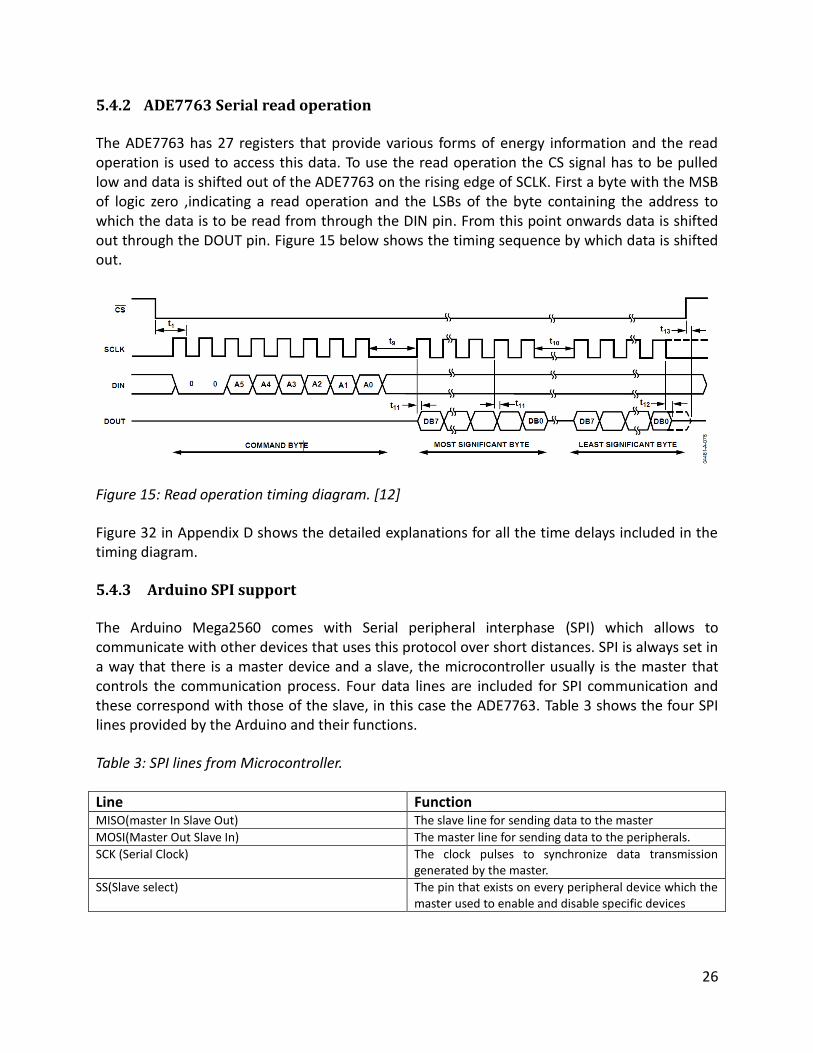
5.4.2 ADE7763 Serial read operation
The ADE7763 has 27 registers that provide various forms of energy information and the read operation is used to access this data. To use the read operation the CS signal has to be pulled low and data is shifted out of the ADE7763 on the rising edge of SCLK. First a byte with the MSB of logic zero ,indicating a read operation and the LSBs of the byte containing the address to which the data is to be read from through the DIN pin. From this point onwards data is shifted out through the DOUT pin. Figure 15 below shows the timing sequence by which data is shifted out.
Figure 15: Read operation timing diagram. [12]
Figure 32 in Appendix D shows the detailed explanations for all the time delays included in the timing diagram.
5.4.3 Arduino SPI support
The Arduino Mega2560 comes with Serial peripheral interphase (SPI) which allows to communicate with other devices that uses this protocol over short distances. SPI is always set in a way that there is a master device and a slave, the microcontroller usually is the master that controls the communication process. Four data lines are included for SPI communication and these correspond with those of the slave, in this case the ADE7763. Table 3 shows the four SPI lines provided by the Arduino and their functions.
Table 3: SPI lines from Microcontroller.
Line Function MISO(master In Slave Out) The slave line for sending data to the master
MOSI(Master Out Slave In) The master line for sending data to the peripherals.
SCK (Serial Clock) The clock pulses to synchronize data transmission generated by the master.
SS(Slave select) The pin that exists on every peripheral device which the master used to enable and disable specific devices
27
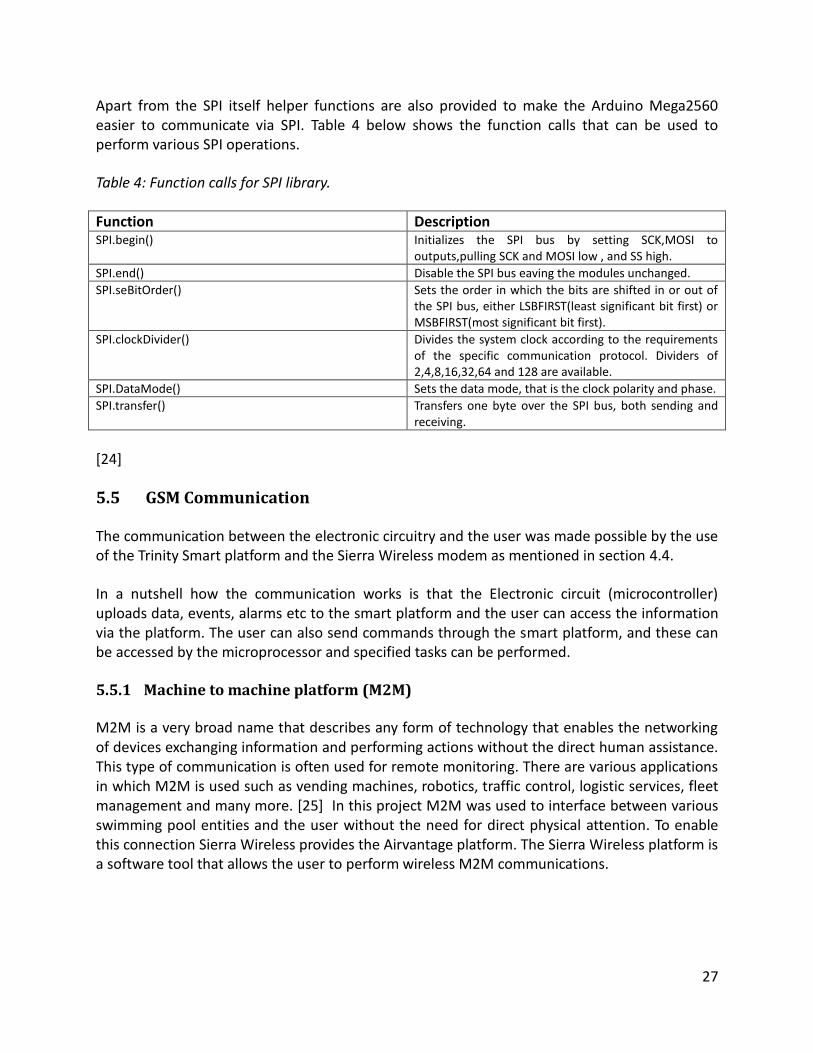
Apart from the SPI itself helper functions are also provided to make the Arduino Mega2560 easier to communicate via SPI. Table 4 below shows the function calls that can be used to perform various SPI operations.
Table 4: Function calls for SPI library.
Function Description SPI.begin() Initializes the SPI bus by setting SCK,MOSI to
outputs,pulling SCK and MOSI low , and SS high.
SPI.end() Disable the SPI bus eaving the modules unchanged.
SPI.seBitOrder() Sets the order in which the bits are shifted in or out of the SPI bus, either LSBFIRST(least significant bit first) or MSBFIRST(most significant bit first).
SPI.clockDivider() Divides the system clock according to the requirements of the specific communication protocol. Dividers of 2,4,8,16,32,64 and 128 are available.
SPI.DataMode() Sets the data mode, that is the clock polarity and phase.
SPI.transfer() Transfers one byte over the SPI bus, both sending and receiving.
[24]
5.5 GSM Communication
The communication between the electronic circuitry and the user was made possible by the use of the Trinity Smart platform and the Sierra Wireless modem as mentioned in section 4.4.
In a nutshell how the communication works is that the Electronic circuit (microcontroller) uploads data, events, alarms etc to the smart platform and the user can access the information via the platform. The user can also send commands through the smart platform, and these can be accessed by the microprocessor and specified tasks can be performed.
5.5.1 Machine to machine platform (M2M)
M2M is a very broad name that describes any form of technology that enables the networking of devices exchanging information and performing actions without the direct human assistance. This type of communication is often used for remote monitoring. There are various applications in which M2M is used such as vending machines, robotics, traffic control, logistic services, fleet management and many more. [25] In this project M2M was used to interface between various swimming pool entities and the user without the need for direct physical attention. To enable this connection Sierra Wireless provides the Airvantage platform. The Sierra Wireless platform is a software tool that allows the user to perform wireless M2M communications.
28
5.5.2 Trinity SMART Sight Platform
The platform is powered by Sierra Wireless and enables users to remotely monitor several devices. The user can design a dashboard that suits their specific need in order to accurately present the information they wish for. Apart from viewing data, the platform also allows the use to send tasks in the form of commands to the assets. [26]
5.5.3 Attention Commands (AT)
The Hayes AT command set is a command language used for communication between modems and an external entity via serial interface. History states that AT commands started in the early 1980’s by a company called Hayes when they first manufactured the Hayes Smart modem 1200 which had baud rate of only 1200bps. [27]
The acronym AT in this case means attention. This technology is used by millions of devices worldwide; it is well supported by a forum with an active M2M developer community. [25]
A command consists of a prefix, body and a terminator. The prefix is the “AT”, the body is a string of ASCII characters and the terminator is a carriage return.
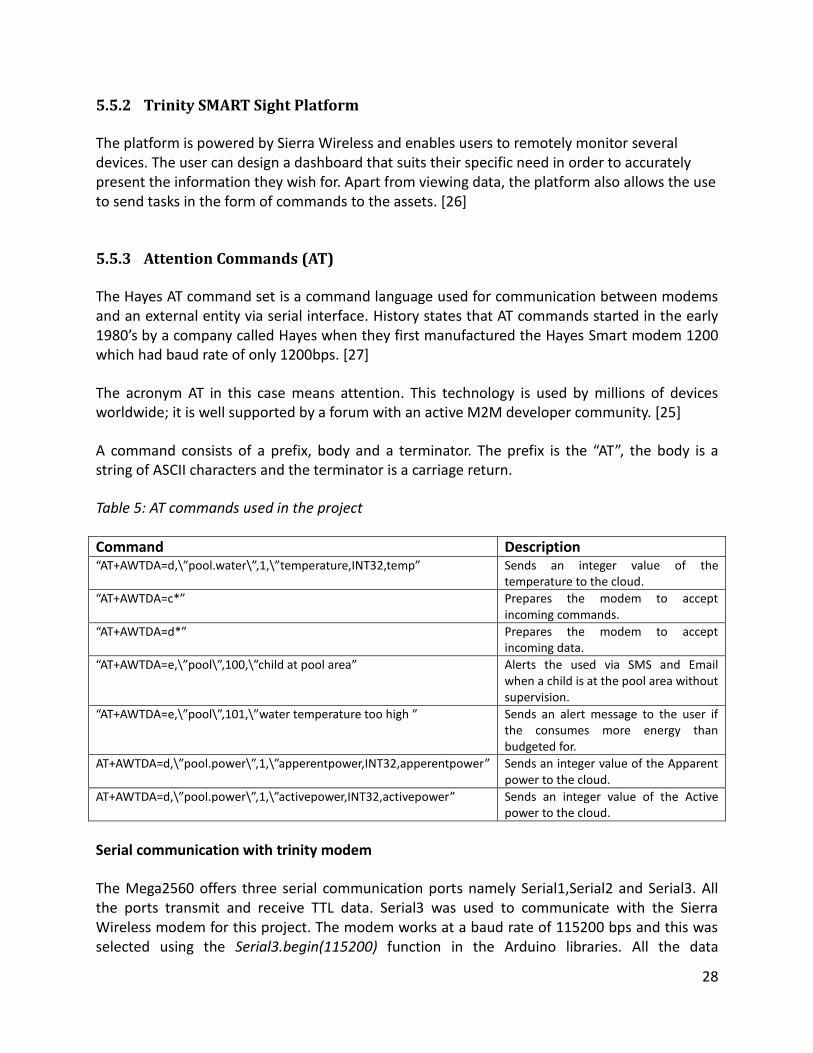
Table 5: AT commands used in the project
Command Description “AT+AWTDA=d,\”pool.water\”,1,\”temperature,INT32,temp” Sends an integer value of the
temperature to the cloud.
“AT+AWTDA=c*” Prepares the modem to accept incoming commands.
“AT+AWTDA=d*” Prepares the modem to accept incoming data.
“AT+AWTDA=e,\”pool\”,100,\”child at pool area” Alerts the used via SMS and Email when a child is at the pool area without supervision.
“AT+AWTDA=e,\”pool\”,101,\”water temperature too high ” Sends an alert message to the user if the consumes more energy than budgeted for.
AT+AWTDA=d,\”pool.power\”,1,\”apperentpower,INT32,apperentpower” Sends an integer value of the Apparent power to the cloud.
AT+AWTDA=d,\”pool.power\”,1,\”activepower,INT32,activepower” Sends an integer value of the Active power to the cloud.
Serial communication with trinity modem
The Mega2560 offers three serial communication ports namely Serial1,Serial2 and Serial3. All the ports transmit and receive TTL data. Serial3 was used to communicate with the Sierra Wireless modem for this project. The modem works at a baud rate of 115200 bps and this was selected using the Serial3.begin(115200) function in the Arduino libraries. All the data
29
transmitted to and from the microprocessor was sent through this serial port.
5.6 Temperature sensor Configuration 5.6.1 One wire
The DS18B20 temperature sensor from Dallas Semiconductor used in this project uses the one wire protocol to interphase with a microcontroller. This type of communication is based on one master device with one or more slave devices on the same data line. Each of these devices has a specific address and the microprocessor communicates to it via that address.
The Arduino mega2560 has full support for this communication protocol through the Dallas temperature and the One wire libraries. In addition since each one wire device has a distinct address; Dallas provides code to access the address for each device so the readings can be accessed.
5.7 Motion Sensor
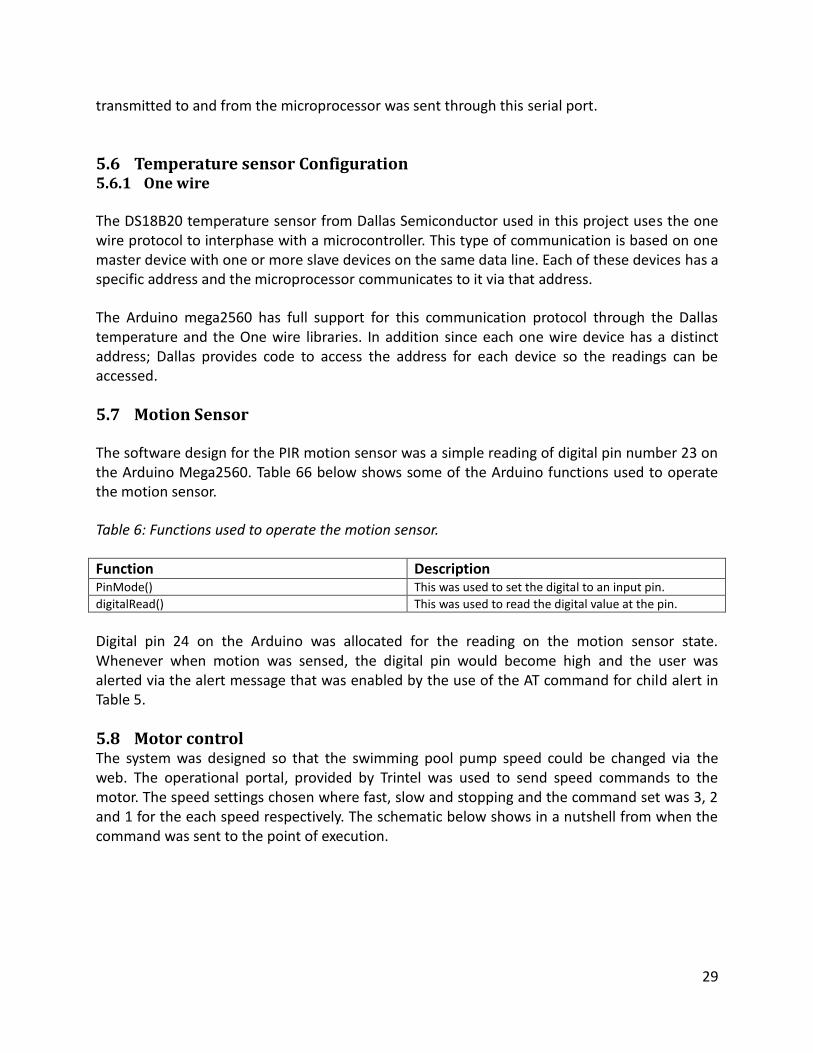
The software design for the PIR motion sensor was a simple reading of digital pin number 23 on the Arduino Mega2560. Table 66 below shows some of the Arduino functions used to operate the motion sensor.
Table 6: Functions used to operate the motion sensor.
Function Description PinMode() This was used to set the digital to an input pin.
digitalRead() This was used to read the digital value at the pin.
Digital pin 24 on the Arduino was allocated for the reading on the motion sensor state. Whenever when motion was sensed, the digital pin would become high and the user was alerted via the alert message that was enabled by the use of the AT command for child alert in Table 5.
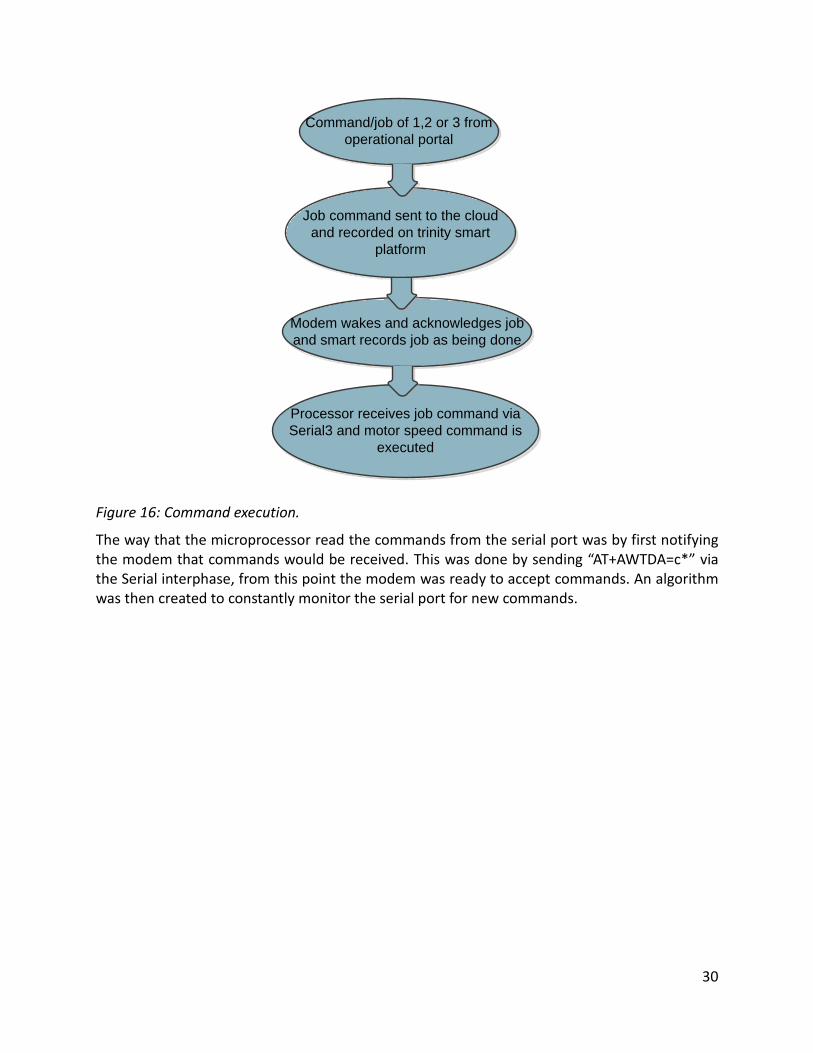
5.8 Motor control The system was designed so that the swimming pool pump speed could be changed via the web. The operational portal, provided by Trintel was used to send speed commands to the motor. The speed settings chosen where fast, slow and stopping and the command set was 3, 2 and 1 for the each speed respectively. The schematic below shows in a nutshell from when the command was sent to the point of execution.
30
Command/job of 1,2 or 3 from
operational portal
Job command sent to the cloud
and recorded on trinity smart
platform
Modem wakes and acknowledges job
and smart records job as being done
Processor receives job command via
Serial3 and motor speed command is
executed
Figure 16: Command execution.
The way that the microprocessor read the commands from the serial port was by first notifying the modem that commands would be received. This was done by sending “AT+AWTDA=c*” via the Serial interphase, from this point the modem was ready to accept commands. An algorithm was then created to constantly monitor the serial port for new commands.
31
Chapter 6 Testing measurements results and analysis
6.1 Overview This section covers the testing and methods for testing of the initial system specifications, as well as the analysis of the findings. The results are also shown in various sub sections when necessary. Practical problems encountered during the course of the project are also documented in this section.
6.2 TTL to Rs232 Conversion
6.2.1 Test The first test to be executed was the communication channel between the Arduino Mega2560 and the Sierra Wireless modem, which was linked by the MAX3232CPE as indicated in section 4.5 of the report. The way to test this link was to send data via the serial port. The following piece of C code was used to send data to the trinity platform
Serial3.write("at+awtda=d,\"pool.water\",1,\"temperature,INT32,");
Serial3.print(x);
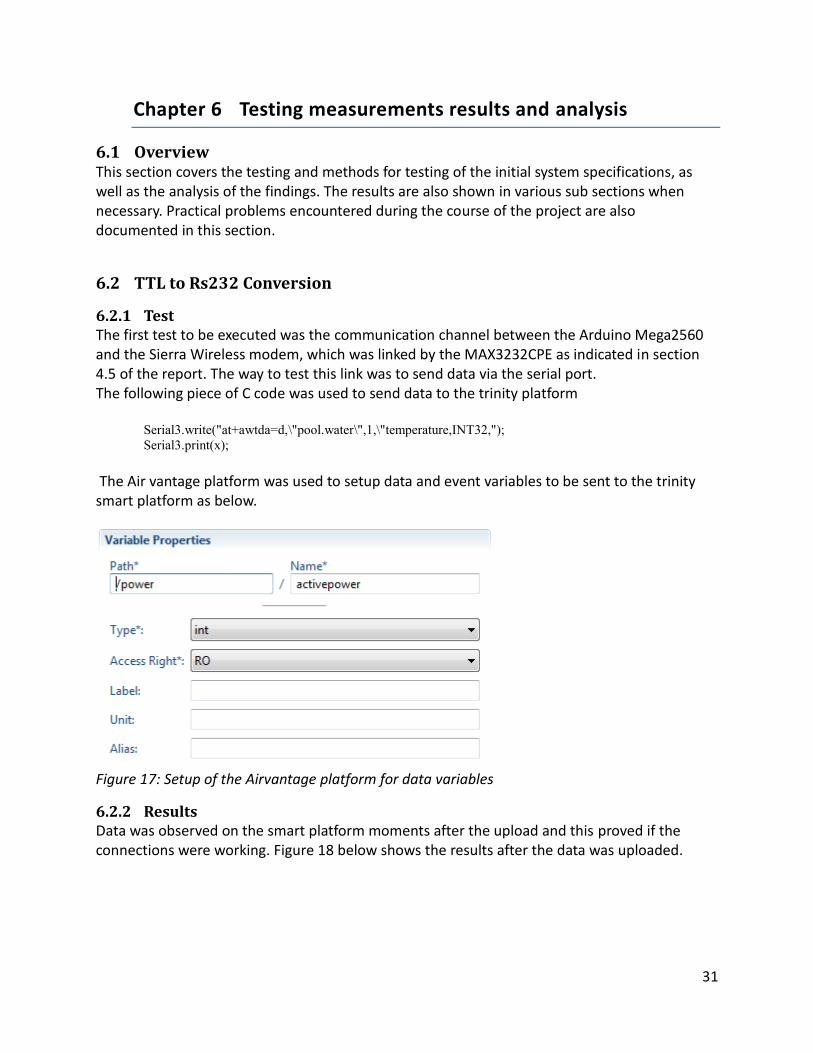
The Air vantage platform was used to setup data and event variables to be sent to the trinity smart platform as below.
Figure 17: Setup of the Airvantage platform for data variables
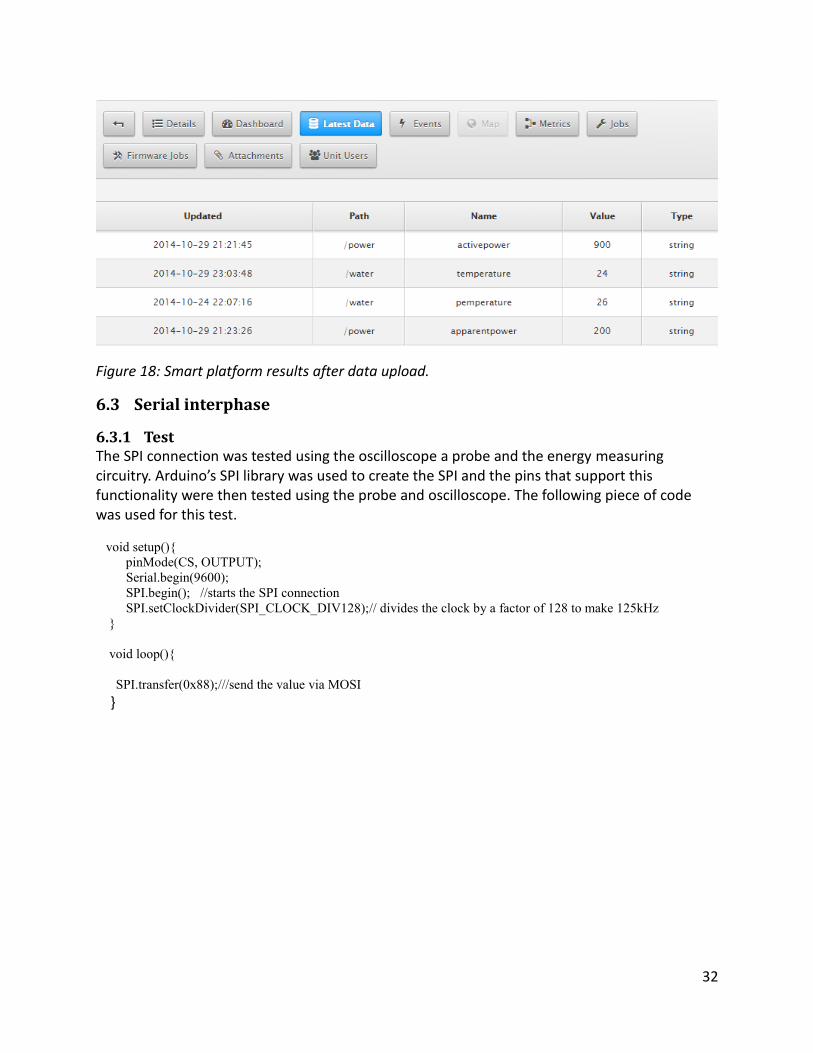
6.2.2 Results Data was observed on the smart platform moments after the upload and this proved if the connections were working. Figure 18 below shows the results after the data was uploaded.
32
Figure 18: Smart platform results after data upload.
6.3 Serial interphase
6.3.1 Test The SPI connection was tested using the oscilloscope a probe and the energy measuring circuitry. Arduino’s SPI library was used to create the SPI and the pins that support this functionality were then tested using the probe and oscilloscope. The following piece of code was used for this test.
void setup(){
pinMode(CS, OUTPUT);
Serial.begin(9600);
SPI.begin(); //starts the SPI connection
SPI.setClockDivider(SPI_CLOCK_DIV128);// divides the clock by a factor of 128 to make 125kHz
}
void loop(){
SPI.transfer(0x88);///send the value via MOSI
}
33
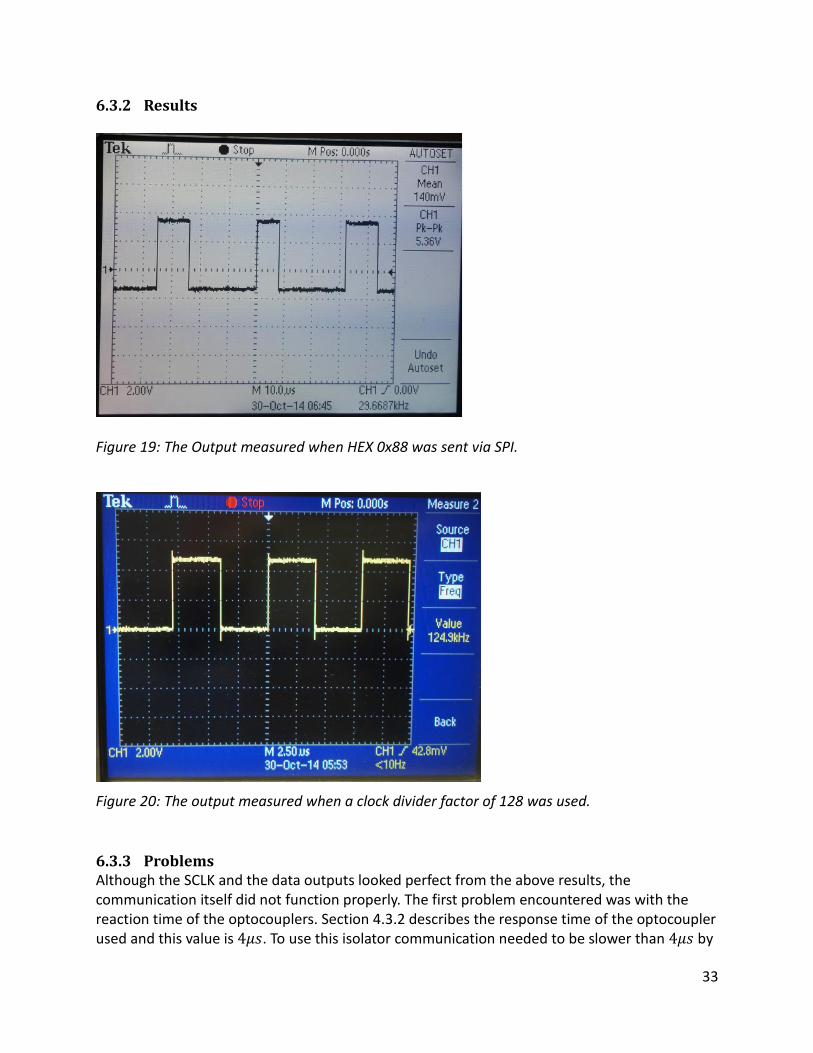
6.3.2 Results
Figure 19: The Output measured when HEX 0x88 was sent via SPI.
Figure 20: The output measured when a clock divider factor of 128 was used.
6.3.3 Problems Although the SCLK and the data outputs looked perfect from the above results, the communication itself did not function properly. The first problem encountered was with the reaction time of the optocouplers. Section 4.3.2 describes the response time of the optocoupler used and this value is 4𝜇𝑠. To use this isolator communication needed to be slower than 4𝜇𝑠 by
34
a fair margin preferably 4 times larger to ensure accurate sampling instances. The Mega2560 runs at a clock of 16MHz, the SPI library offers the setClockDivider() function which divides the clock, but only divides up to a factor of 128. Dividing the clock that factor gives an SCLK of 125KHz. This was a much faster rate for the isolators hence communication was not established. The isolators were then removed and still communication was not established, at this time in the project time did not allow for further tests to be done.
6.4 Platform Data and Events
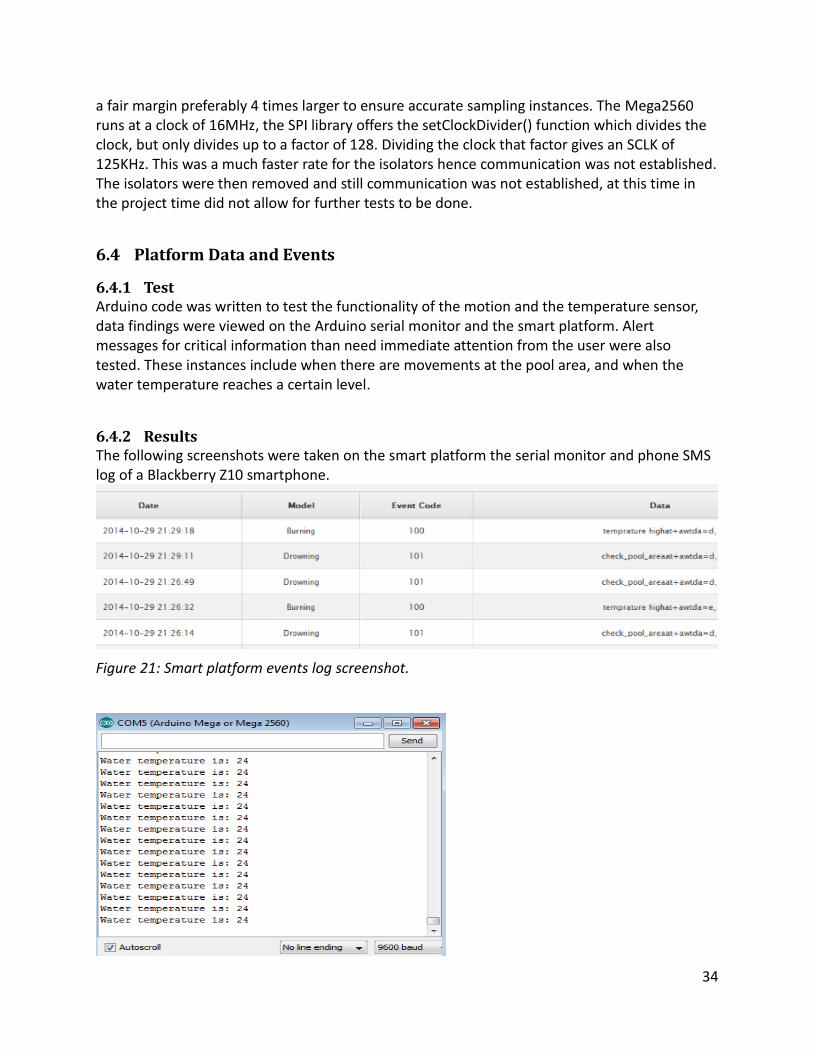
6.4.1 Test Arduino code was written to test the functionality of the motion and the temperature sensor, data findings were viewed on the Arduino serial monitor and the smart platform. Alert messages for critical information than need immediate attention from the user were also tested. These instances include when there are movements at the pool area, and when the water temperature reaches a certain level.
6.4.2 Results The following screenshots were taken on the smart platform the serial monitor and phone SMS log of a Blackberry Z10 smartphone.
Figure 21: Smart platform events log screenshot.
35
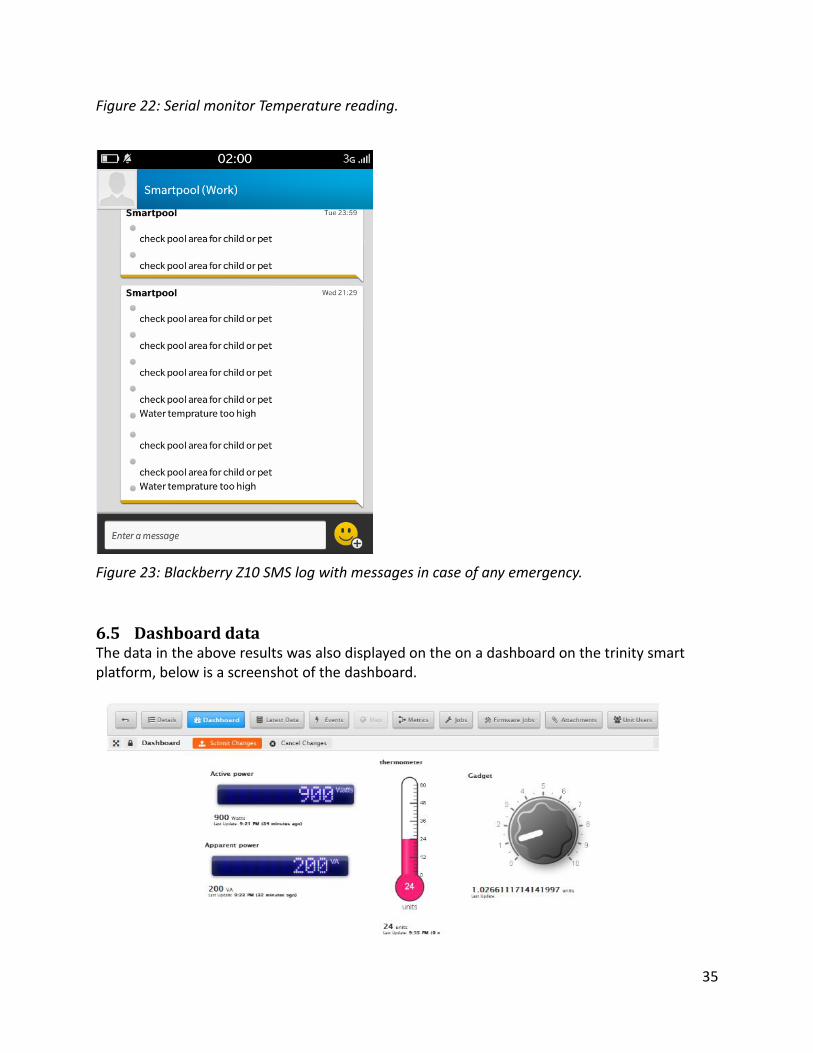
Figure 22: Serial monitor Temperature reading.
Figure 23: Blackberry Z10 SMS log with messages in case of any emergency.
6.5 Dashboard data The data in the above results was also displayed on the on a dashboard on the trinity smart platform, below is a screenshot of the dashboard.
36
Figure 24: A screenshot of the dashboard.
6.6 Commands for motor control
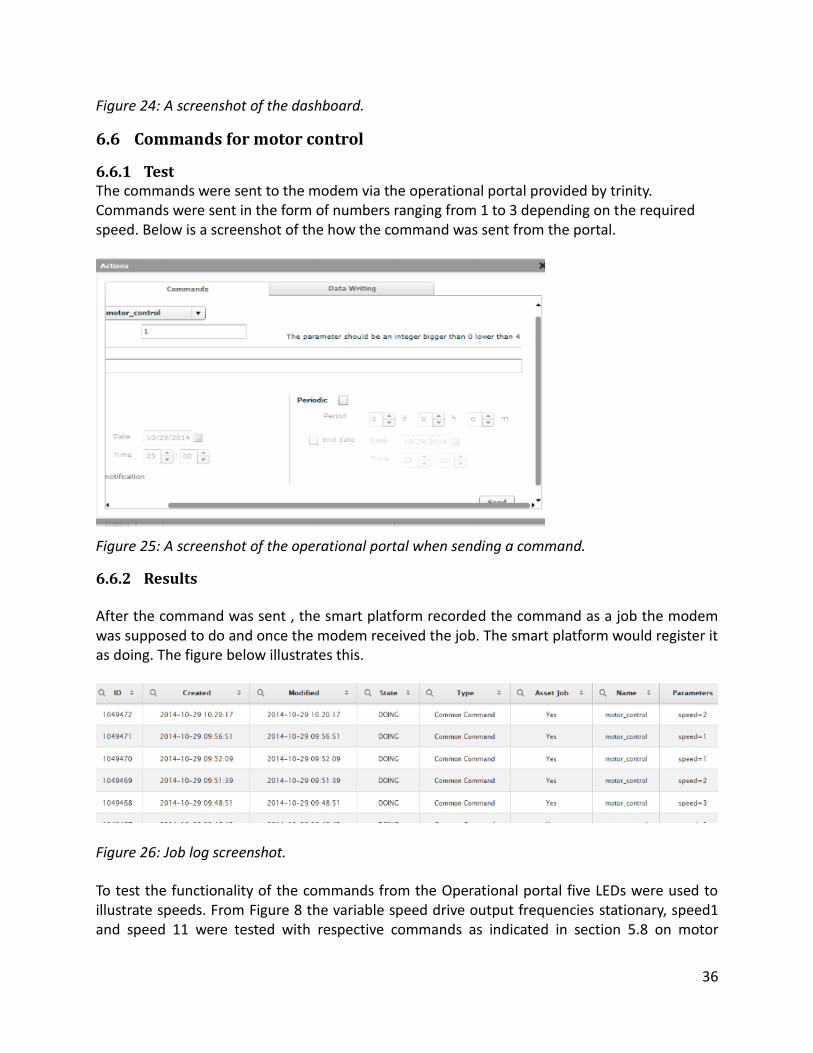
6.6.1 Test The commands were sent to the modem via the operational portal provided by trinity. Commands were sent in the form of numbers ranging from 1 to 3 depending on the required speed. Below is a screenshot of the how the command was sent from the portal.
Figure 25: A screenshot of the operational portal when sending a command.
6.6.2 Results
After the command was sent , the smart platform recorded the command as a job the modem was supposed to do and once the modem received the job. The smart platform would register it as doing. The figure below illustrates this.
Figure 26: Job log screenshot.
To test the functionality of the commands from the Operational portal five LEDs were used to illustrate speeds. From Figure 8 the variable speed drive output frequencies stationary, speed1 and speed 11 were tested with respective commands as indicated in section 5.8 on motor
37
control.
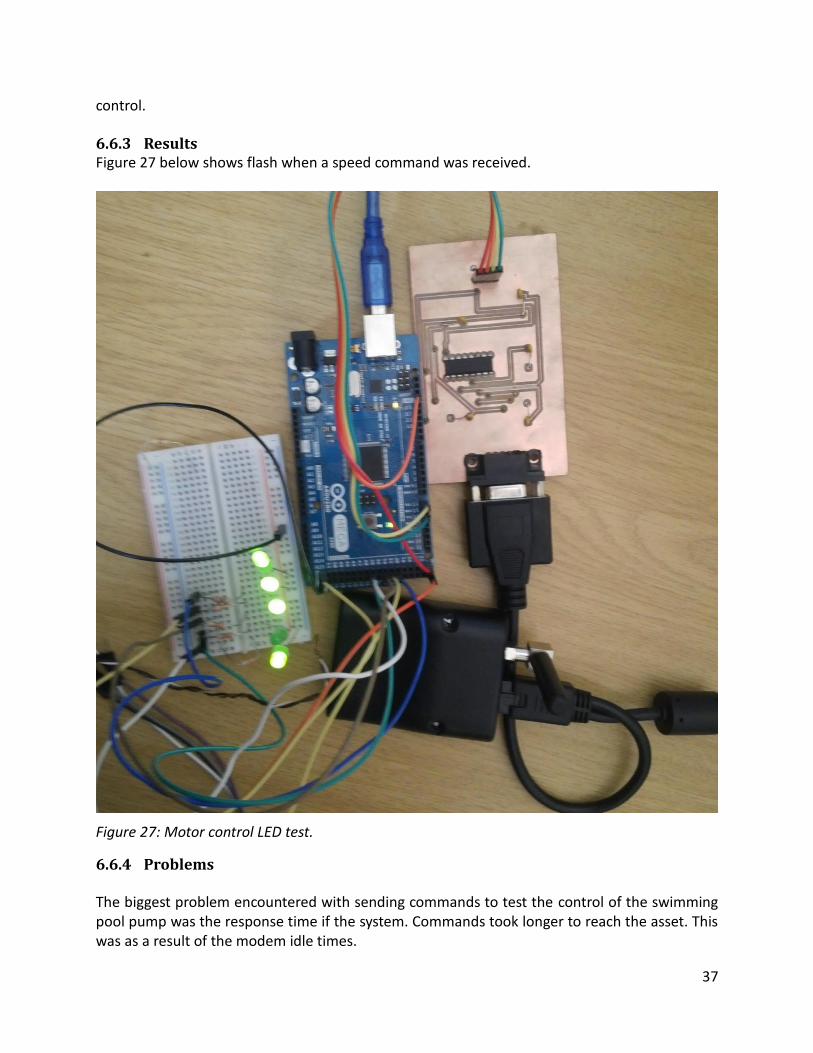
6.6.3 Results Figure 27 below shows flash when a speed command was received.
Figure 27: Motor control LED test.
6.6.4 Problems
The biggest problem encountered with sending commands to test the control of the swimming pool pump was the response time if the system. Commands took longer to reach the asset. This was as a result of the modem idle times.

38
Chapter 7 Conclusion and Recommendations
7.1 Overview The chapter covers the conclusions drawn from the project; recommendations for future work are also included.
7.2 Conclusion
The core of the project was to create a system that monitors and controls swimming pool variables without the physical interference of the user. Emphasis was on the energy saving and remote monitoring.
Another big part of the project was the interphase between the swimming pool entities and Trintel’s smart platform. This system worked perfectly, real time information on the swimming pool’s information could be accessed. Speed control of the swimming also worked, the only setback was that the commands sometimes took time to be recognised by the asset. Apart from data uploads to the platform and commands from the operational portal, critical events/notifications also worked perfectly SMS’s and emails could be received effectively when an unwanted event happened.
The Arduino Mega2560 proved to be an excellent choice for the project, its vast number of pins provided enough space for all the components that were required. The processing power of the microprocessor also proved to be a major positive offered by the use of the Mega. The flexibility and the support that comes with the Arduino made it an easier controller to use. The only problem that was encountered was through its high speed clock which was difficult to divide for use with other devices that required a slower clock reference for communication.
The DS18B20 temperature probe worked perfectly as the thermometer of choice, its response and accuracy was very impressive. The motion sensor was also very accurate in the measurement of motion in case of any children or pets use the pool area without supervision. This then offered enough security for children or pets used the pool area without supervision.
The ADE7763 single phase active and apparent power metering IC was used to measure the energy consumption of the swimming pool water pump. As indicated in the results section of the report, the measuring circuitry did not work as expected due to SPI communication problems. The ADE7763 proved to be a rather challenging energy meter to work with but considering its high accuracy and the amount of information it gives it would be a good choice for future purposes.

39
7.3 Recommendations Most of the energy used by the swimming pool is through the water pump during purification and refilling of the pool. With purification in mind it will be recommended to device a method to measure how much the pump should run to purify the water. Two variables that need to be measured in order to determine the speed and the time that the pump should run at are the clarity and the volume of the water.
Section 3.4 gives a brief overview of turbidity sensors, these could be used to acquire water clarity but they are pricey and therefore not a viable option. Using image processing would be a good alternative to sense the clarity of water. A waterproof camera can be inserted in the water and images are taken at various instances, clarity can therefore be determined with how images differ from the benchmark image.
Water level sensors are also recommended to closely monitor the level of the water. These can be in the form of a pressure sensor that is submerged at a fixed level and can detect the capacity of the water. Ultrasonic level sensors are also recommended for these purposes.
40
Bibliography
[1] I. T. VERSTER, “The Swimming Pool Pump,” Wattnow, no. Energy Consumption, pp. 34 - 37, 2012.
[2] P. Center, “pool center,” 14 July 2014. [Online]. Available: http://www.poolcenter.com/safety. [Accessed 14 july 2014].
[3] www.swimming_Pool_Care.Com, “waterborne illness,” 2008. [Online]. Available: http://www.swimming-pool-care.com/waterborne-illnesses.html. [Accessed 14 July 2014].
[4] Livestrong.com, “Livestrong,” 2014. [Online]. Available: http://www.livestrong.com/article/486936-the-effect-of-water-temperature-on-swimmers/. [Accessed 14 July 2014].
[5] r. components, “rs components,” 2014. [Online]. Available: http://za.rs-online.com/web/p/products/531-305/?origin=PSF_421246|QVTNS-LL. [Accessed 2014].
[6] beagleboard.org, “beagleboard.org,” 1 July 2014. [Online]. Available: beagleboard.org. [Accessed 14 July 2014].
[7] Arduino, “Arduino,” 2014. [Online]. Available: http://arduino.cc/en/Main/ArduinoBoardDue. [Accessed 22 July 2014].
[8] M. Robotics, “Micro Robotics,” [Online]. Available: https://www.robotics.org.za/index.php?route=product/product&product_id=669. [Accessed 1 July 2014].
[9] E. freeks, “Micropik,” 2014. [Online]. Available: http://www.micropik.com/PDF/HCSR04.pdf. [Accessed 14 July 2014].
[10] dfrobot, “dfrobot,” 29 march 2012. [Online]. Available: http://www.dfrobot.com/index.php?route=product/product&product_id=79&search=vibration+sensor&description=true. [Accessed 14 July 2014].
[11] Sensorex, “Sensorex,” 2014. [Online]. Available: http://www.sensorex.com/products/more/process_chlorine_dioxide_sensor. [Accessed 14 July 2014].
[12] Arduino, “Arduino,” July 2014. [Online]. Available: http://arduino.cc/en/Main/arduinoBoardMega2560.
[13] A. devices, Single phase active and apparent energy metering IC, Analog devices, 2013.
[14] E. components, ASIC Based Closed-Loop Transducers, geneva: Paul Van Iseghem, 2001.
[15] Acal, “Acal Bfi,” Acal bfi, 2012. [Online]. Available: http://www.acalbfi.com/se/M2M-and-Wireless/2G-3G-4G-LTE-Wireless-Gateways-and-Modems/p/GL6100--2G-GSM-GPRS-Programmable-Modem--UART-RS232/0000001UK8. [Accessed 2014].
[16] sparksfun, “sparksfun,” 2014. [Online]. Available: https://www.sparkfun.com/tutorials/215.
[17] sparksfun, “sparksfun,” 2014. [Online]. Available: https://www.sparkfun.com/tutorial/RS232vsTTL-BiteSize/ttl-timing.PNG.
41
[18] ENC, “ENC,” ENC, [Online]. Available: http://encomvera.en.made-in-china.com/product/SXcmIrpMbghW/China-Eds-A200-Series-1-Phase-Input-and-1-Phase-Output-Frequency-Inverter-AC-Drive.html. [Accessed 2014].
[19] ENC, EDS-A200, Shenzen: ENC, 2008.
[20] adafruit, “adafruit,” 2014. [Online]. Available: http://www.adafruit.com/products/381?gclid=CPTk6eWSmr8CFSvjwgodDFYAWg. [Accessed 14 July 2014].
[21] M. Robotics, “MIcro Robotics,” 2014. [Online]. Available: https://www.robotics.org.za/index.php?route=product/product&product_id=59&search=sensors&description=true&category_id=129. [Accessed 14 July 2014].
[22] Adafruit, “Adafruit learnimg system,” 28 01 2014. [Online]. Available: http://learn.adafruit.com/downloads/pdf/pir-passive-infrared-proximity-motion-sensor.pdf. [Accessed 2 10 2014].
[23] Arduino, “Arduino,” Arduino, 2014. [Online]. Available: http://arduino.cc/en/Reference/SPI. [Accessed 2014].
[24] WhatIs.com, “Machine to macine,” 2010. [Online]. Available: http://whatis.techtarget.com/definition/machine-to-machine-M2M. [Accessed 2014].
[25] Trinity, “Trinity,” 2014. [Online]. Available: http://trintel.co.za/. [Accessed 2014].
[26] F. Durda, “AT commands history,” Nemesis, 2004. [Online]. Available: http://nemesis.lonestar.org/reference/telecom/modems/at/history.html. [Accessed 25 09 2014].
[27] beagleboard, “elinux.org,” 9 July 2014. [Online]. Available: http://elinux.org/Beagleboard:BeagleBoneBlack#BeagleBone_Black_Features. [Accessed 14 July 2014].
[28] Dfrobot, “Dfrobot,” 24 June 2014. [Online]. Available: http://www.dfrobot.com/index.php?route=product/product&product_id=1110. [Accessed 14 July 2014].
[29] beaglebone, “beagleboard,” 12 July 2014. [Online]. Available: http://beagleboard.org/black. [Accessed 14 July 2014].
[30] A. architecture, “ARM,” 22 July 2014. [Online]. Available: http://www.arm.com/products/processors/instruction-set-architectures/index.php. [Accessed 22 July 2014].
[31] S. Wireless, “Sierra Wireless,” Sierra Wireless, 2014. [Online]. Available: http://www.sierrawireless.com/productsandservices/AirPrime_Wireless_Modules/Smart_Modules/Application_Framework.aspx. [Accessed 12 10 2014].

42
Appendix A : Project Planning and Scheduling
The project planning and schedule is tabulated in Table 7 below.
Table 7: The project planning and schedule.
Week Plan 1 Scoping, project definition and planning. Write about all proceedings.
2 Project research. Write about all proceedings.
3 Component research. Write about all proceedings.
4 Altium designer research. Write about all proceedings.
5 RS 232 to TTL design in Altium. Write about all proceedings.
6 Build RS232 to TTL conversion circuit and test it. Write about all proceedings.
7 Build energy measuring circuit in Altium. Write about all proceedings
9 Build and Test Energy Measuring circuit. Write about all proceedings.
10 Arduino research and test energy measurement circuit SPI connection with Arduino and make sure that the circuit works well. Write about all proceedings.
11 Research on Variable speed drives. Connect Temperature sensor, Motion sensor to Arduino and make sure they work. Write about all proceedings.
12 Research and test Trinity Platform connection. Upload data to platform and set up dashboards. Write about all proceedings.
13 Test commands to control the motor from the platform. Write about all proceedings.
14 Perfect report and send in for preview.
15 Polish up report on corrections and hand in report.
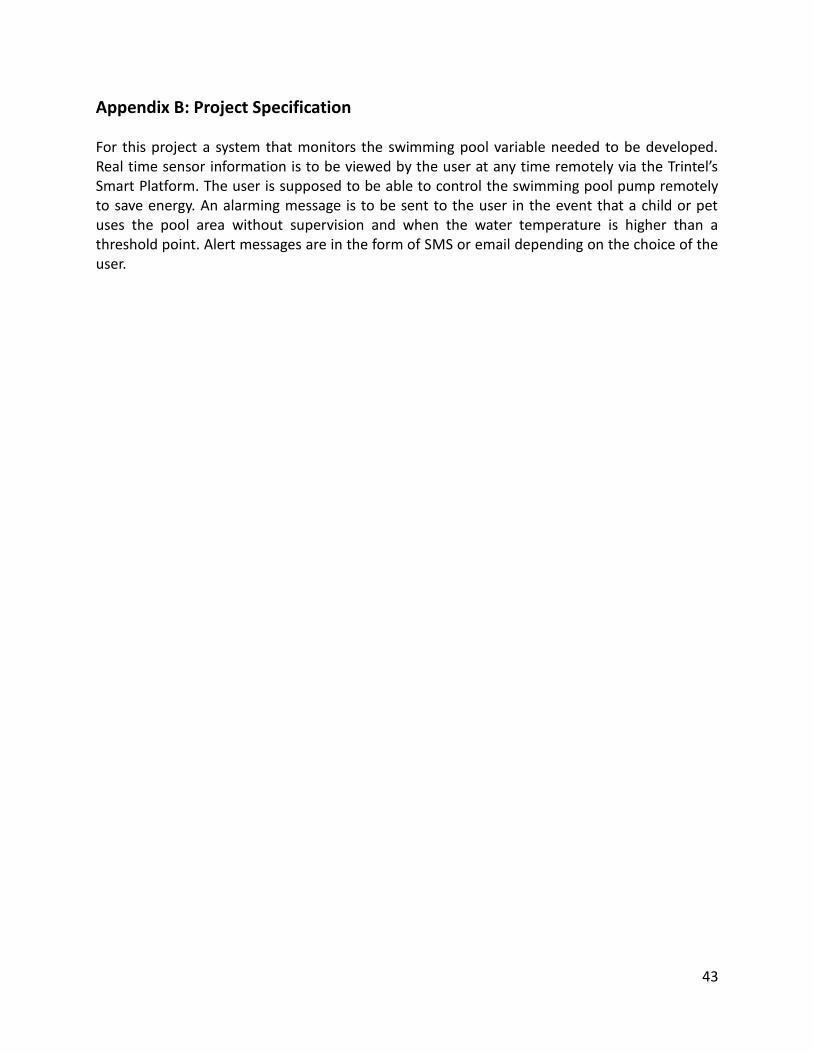
43
Appendix B: Project Specification
For this project a system that monitors the swimming pool variable needed to be developed. Real time sensor information is to be viewed by the user at any time remotely via the Trintel’s Smart Platform. The user is supposed to be able to control the swimming pool pump remotely to save energy. An alarming message is to be sent to the user in the event that a child or pet uses the pool area without supervision and when the water temperature is higher than a threshold point. Alert messages are in the form of SMS or email depending on the choice of the user.
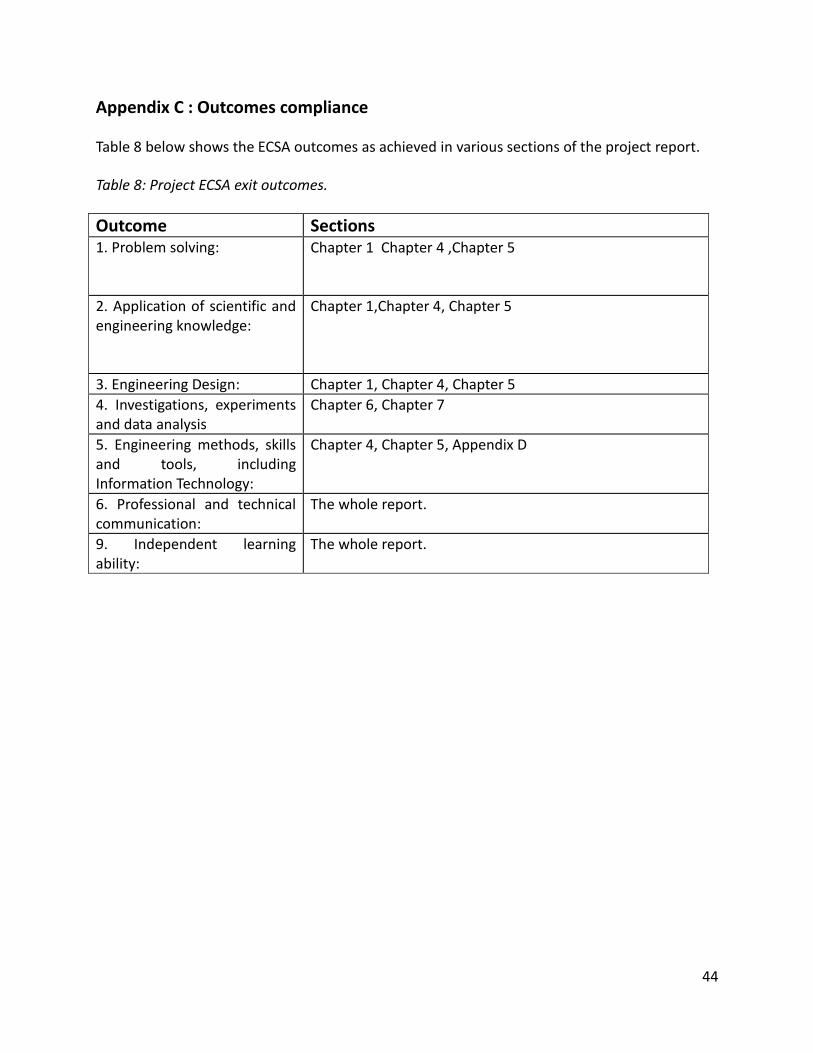
44
Appendix C : Outcomes compliance
Table 8 below shows the ECSA outcomes as achieved in various sections of the project report.
Table 8: Project ECSA exit outcomes.
Outcome Sections 1. Problem solving:
Chapter 1 Chapter 4 ,Chapter 5
2. Application of scientific and engineering knowledge:
Chapter 1,Chapter 4, Chapter 5
3. Engineering Design: Chapter 1, Chapter 4, Chapter 5
4. Investigations, experiments and data analysis
Chapter 6, Chapter 7
5. Engineering methods, skills and tools, including Information Technology:
Chapter 4, Chapter 5, Appendix D
6. Professional and technical communication:
The whole report.
9. Independent learning ability:
The whole report.
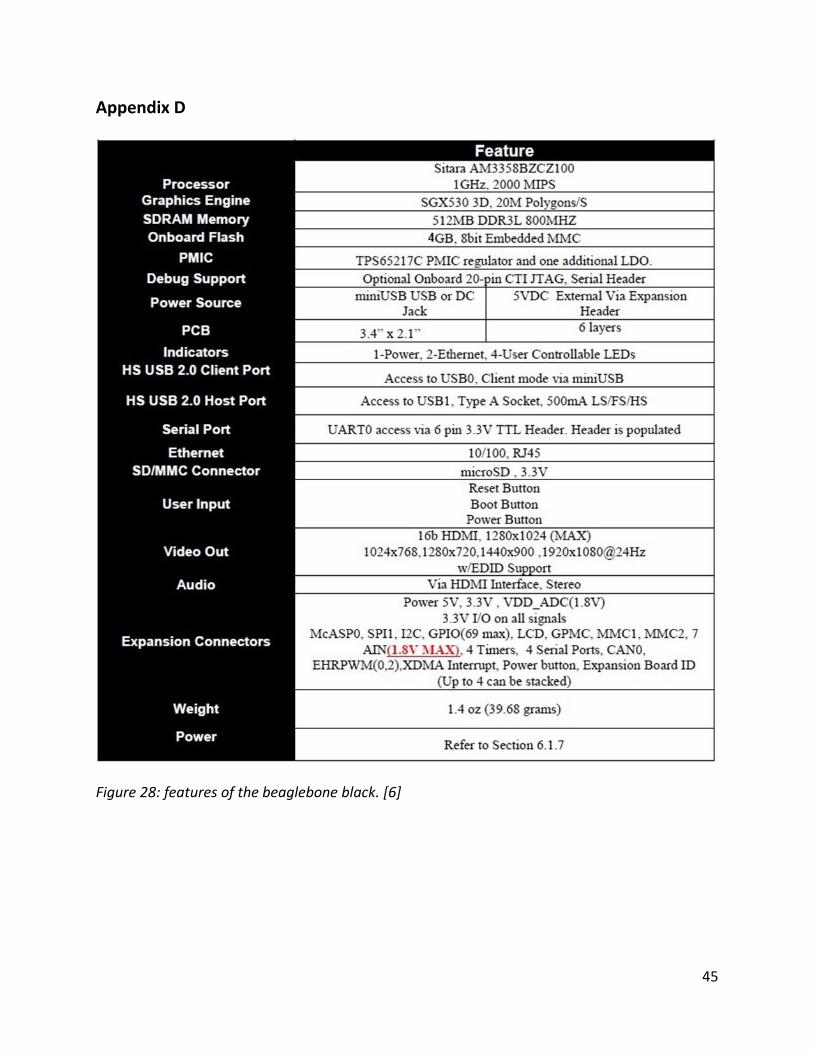
45
Appendix D
Figure 28: features of the beaglebone black. [6]
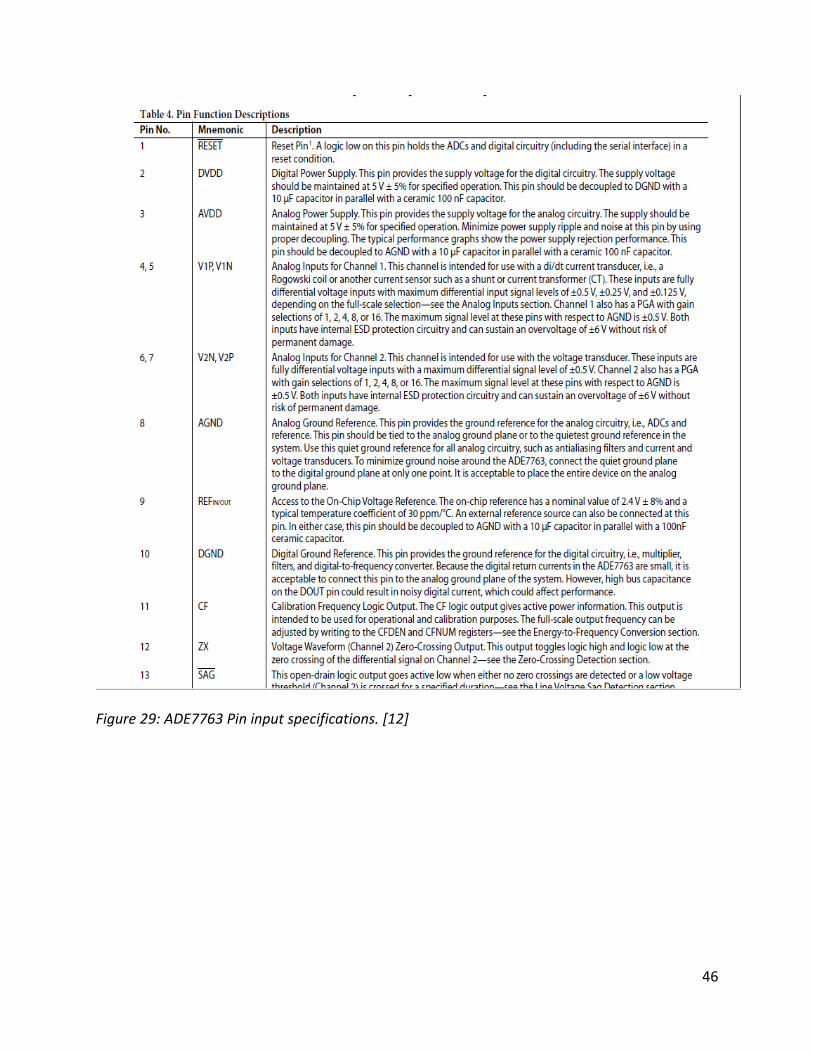
46
Figure 29: ADE7763 Pin input specifications. [12]
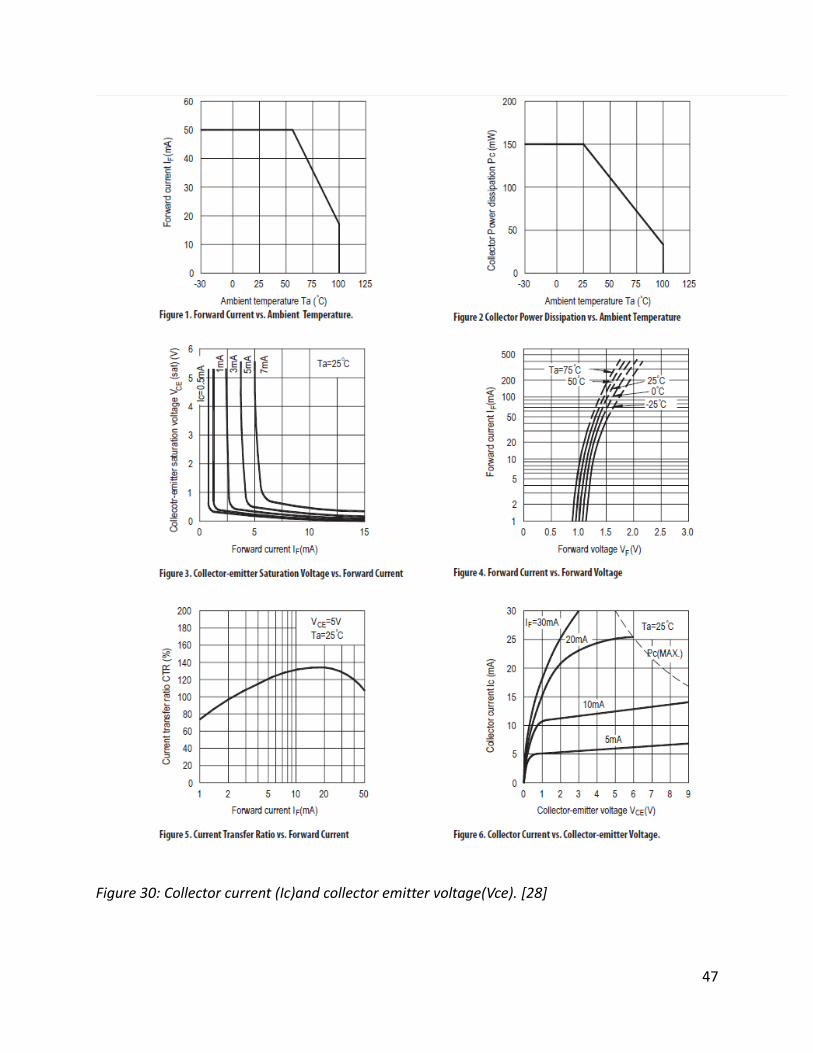
47
Figure 30: Collector current (Ic)and collector emitter voltage(Vce). [28]
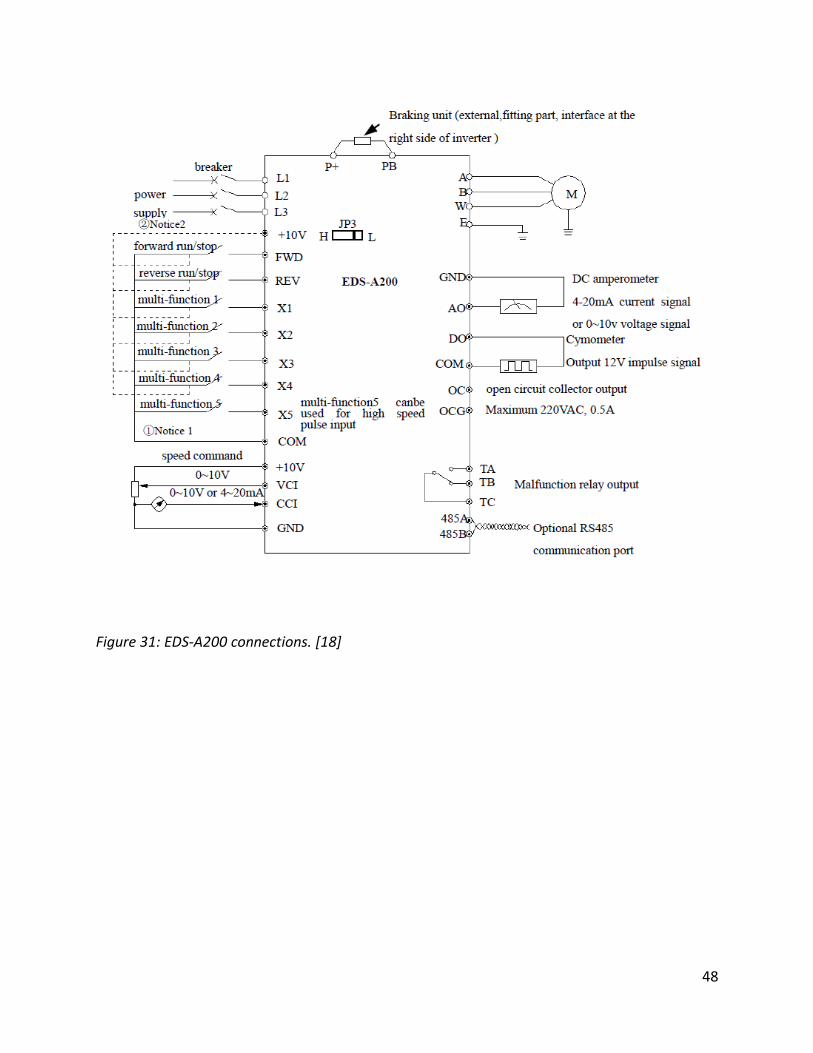
48
Figure 31: EDS-A200 connections. [18]
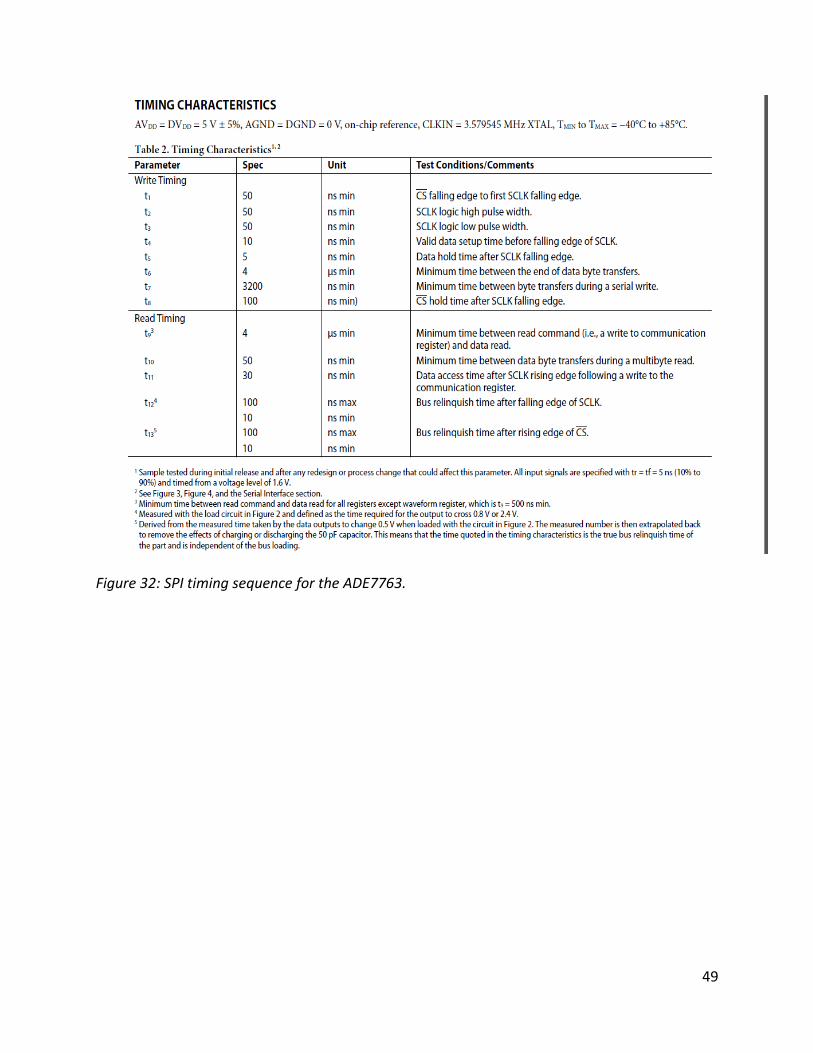
49
Figure 32: SPI timing sequence for the ADE7763.
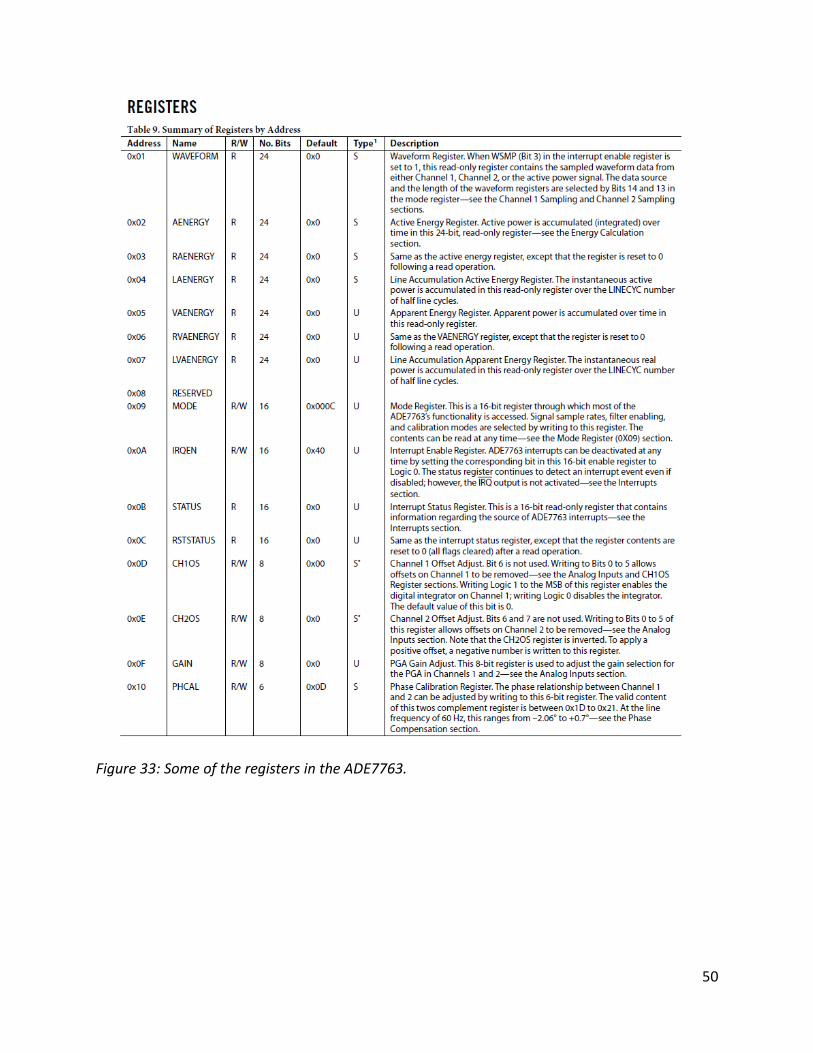
50
Figure 33: Some of the registers in the ADE7763.
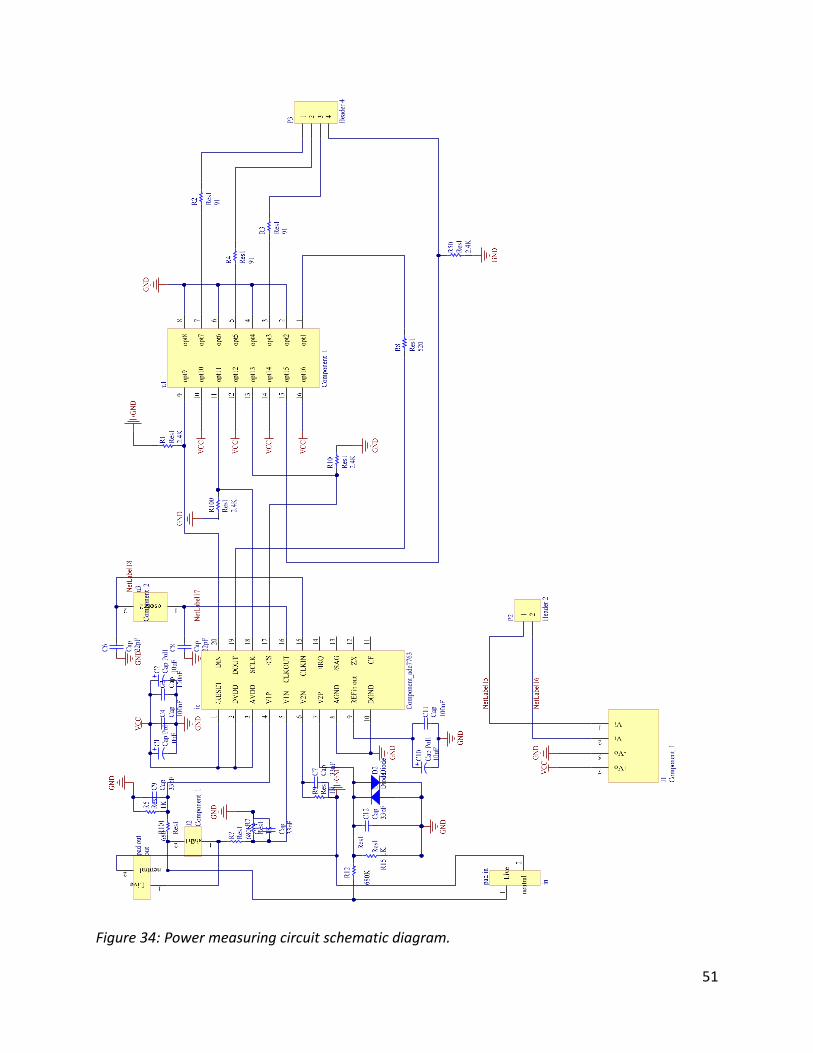
51
Figure 34: Power measuring circuit schematic diagram.
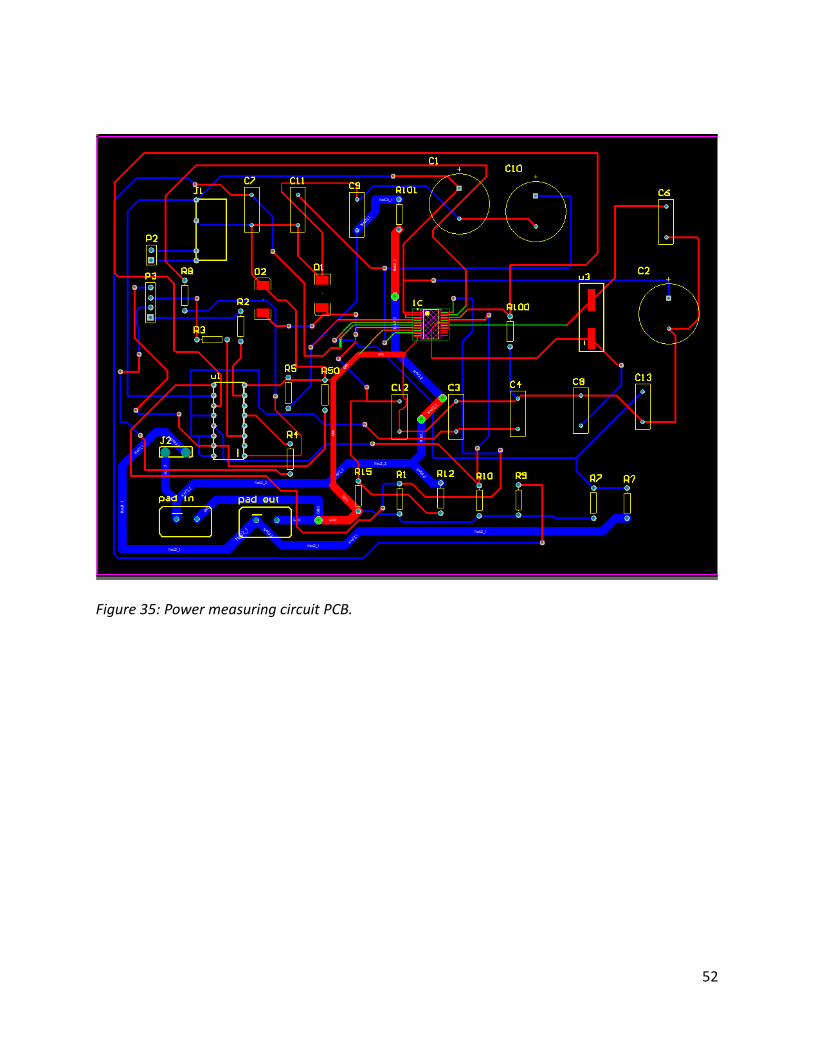
52
Figure 35: Power measuring circuit PCB.
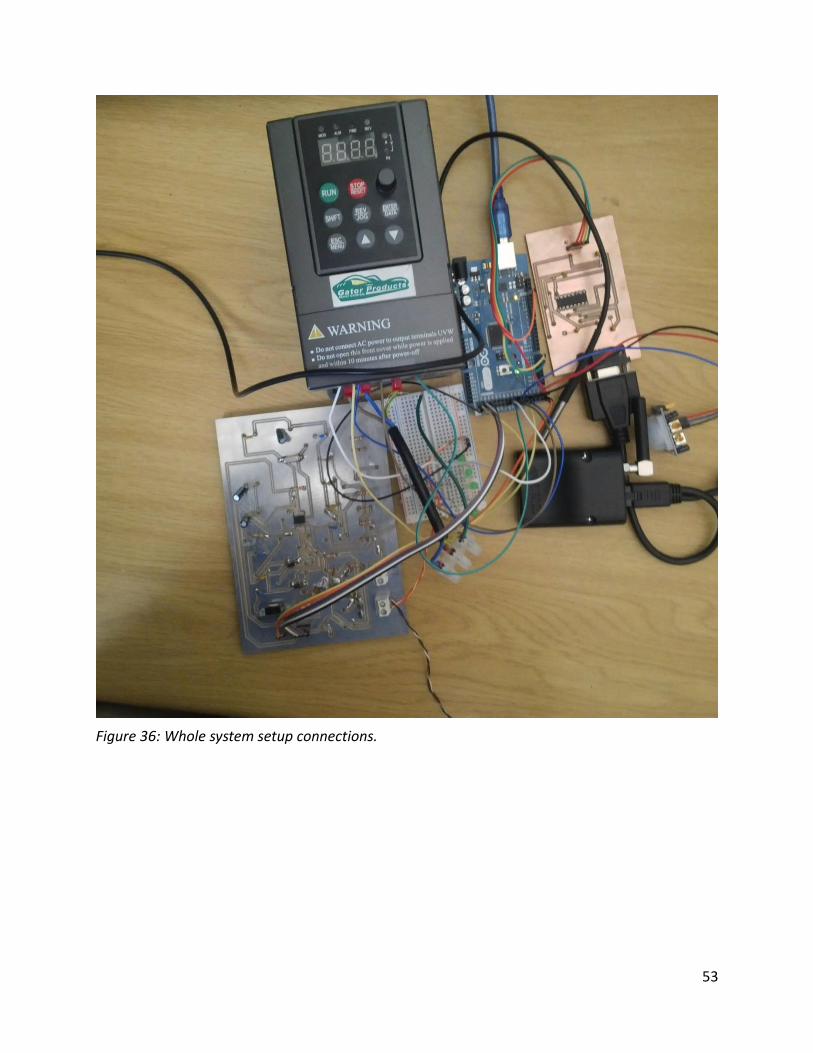
53
Figure 36: Whole system setup connections.