Embed Size (px)
Citation preview
Smart Technologies for Long-
Term Stress Monitoring at Work
Rafał Kocielnik
Natalia Sidorova
Fabrizio Maria Maggi
Martin Ouwerkerk
Joyce H.D.M. Westerink
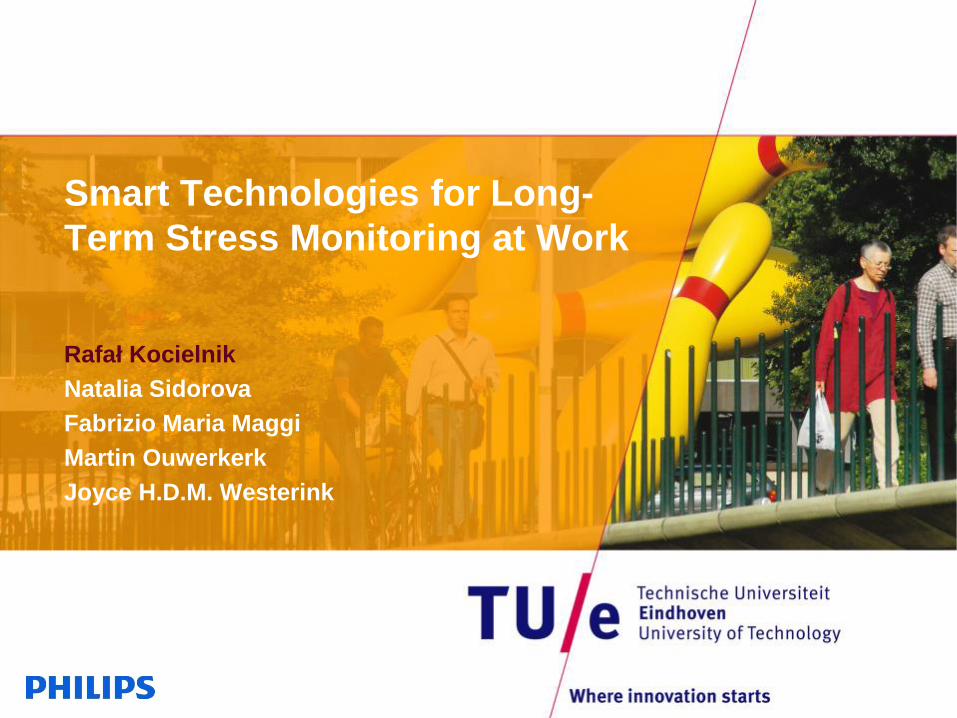
Motivation
/ Department of Mathematics & Computer Science PAGE 1 3-12-2013
Costs of stress - 4 billion € per year
1 out of 7 disabled because of stress (TNO, 2006)
By 2020 the top five diseases
will be stress related (WHO)
Health care expenditures 50%
greater for stressed workers (J Occup Environ Med, 40:843-854).
Netherlands
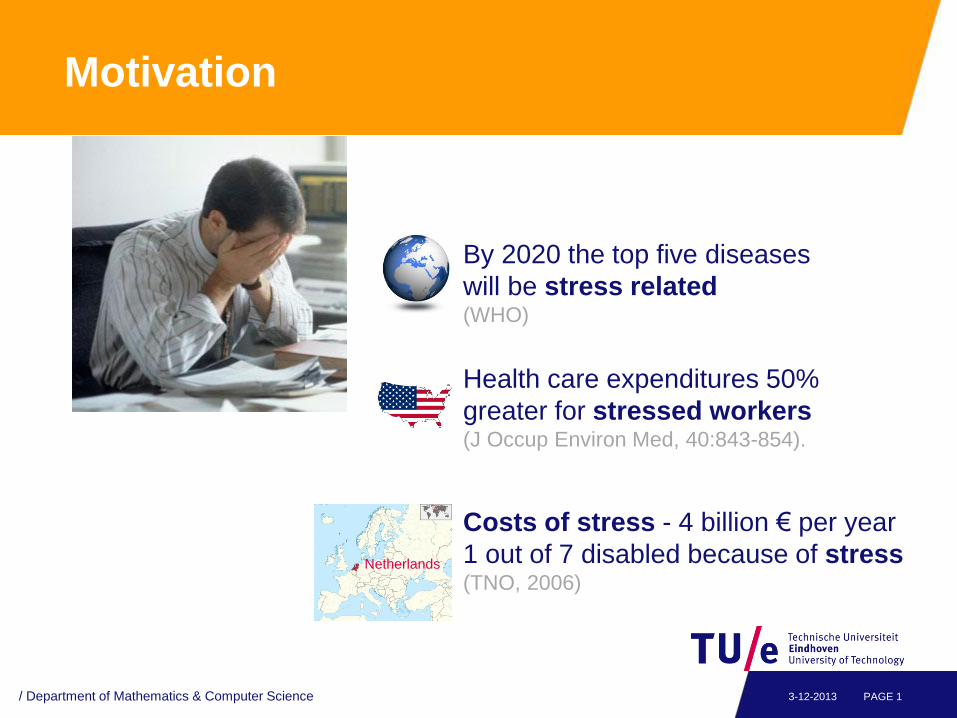
Research problem
PAGE 2 3-12-2013 / Department of Mathematics & Computer Science
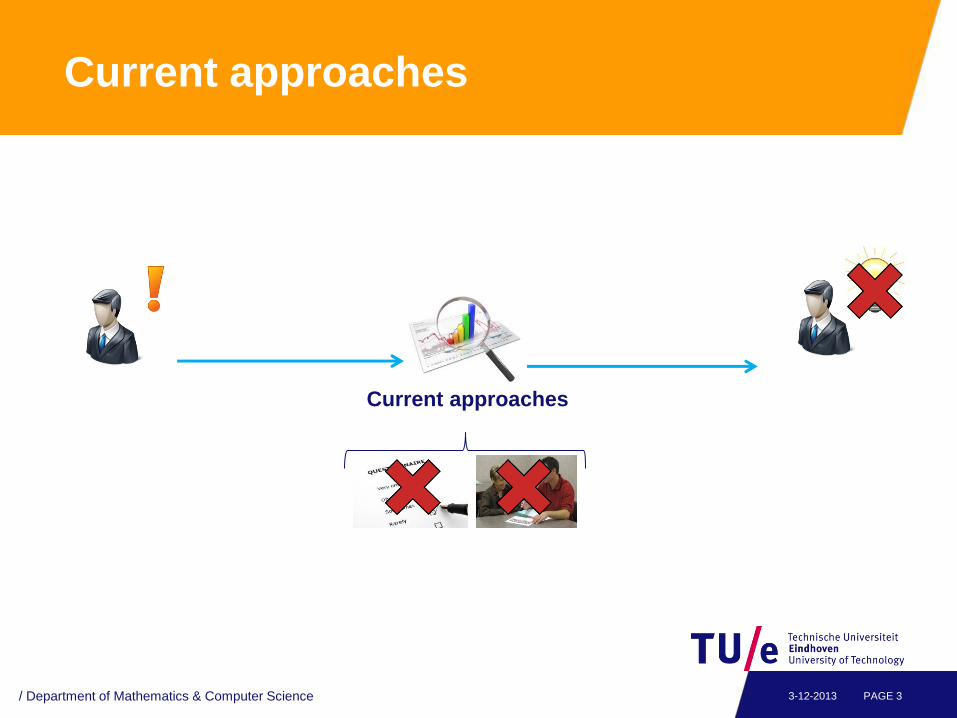
Current approaches
PAGE 3 3-12-2013
Current approaches
/ Department of Mathematics & Computer Science
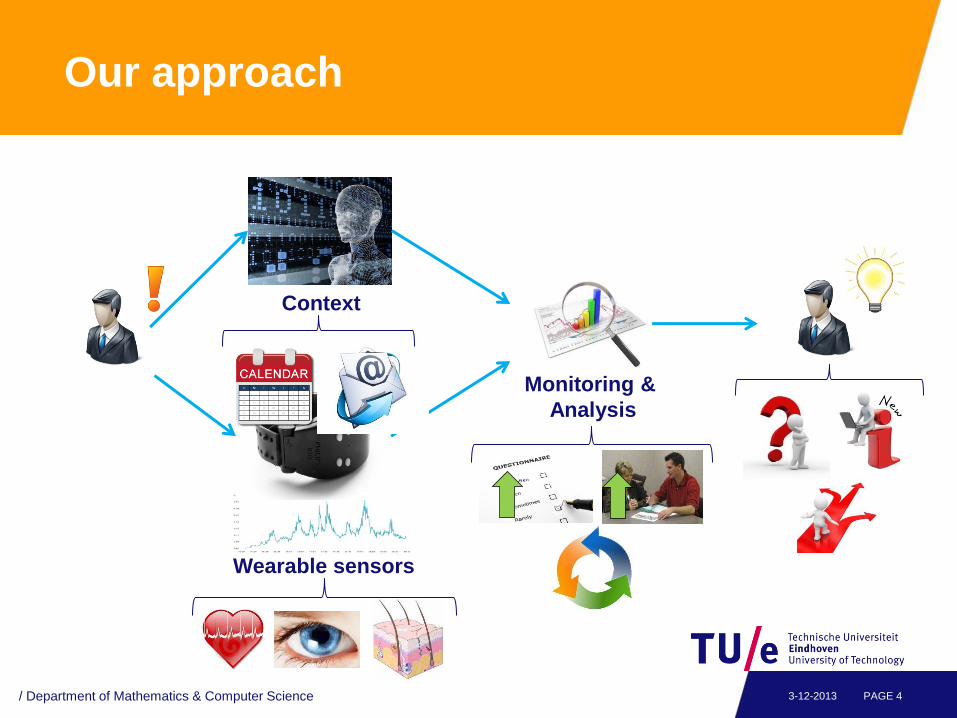
Our approach
PAGE 4 3-12-2013
Context
Wearable sensors
Monitoring &
Analysis
/ Department of Mathematics & Computer Science

Approach implementation
PAGE 5 3-12-2013 / Department of Mathematics & Computer Science
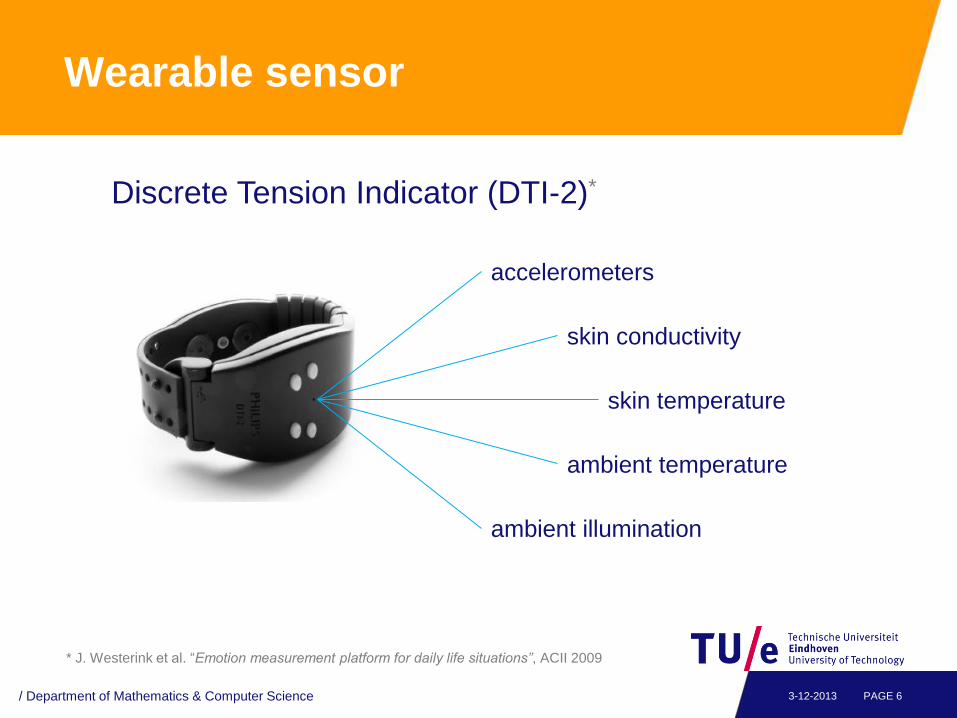
Wearable sensor
PAGE 6 3-12-2013
Discrete Tension Indicator (DTI-2)*
accelerometers
skin conductivity
skin temperature
ambient temperature
ambient illumination
* J. Westerink et al. “Emotion measurement platform for daily life situations”, ACII 2009
/ Department of Mathematics & Computer Science
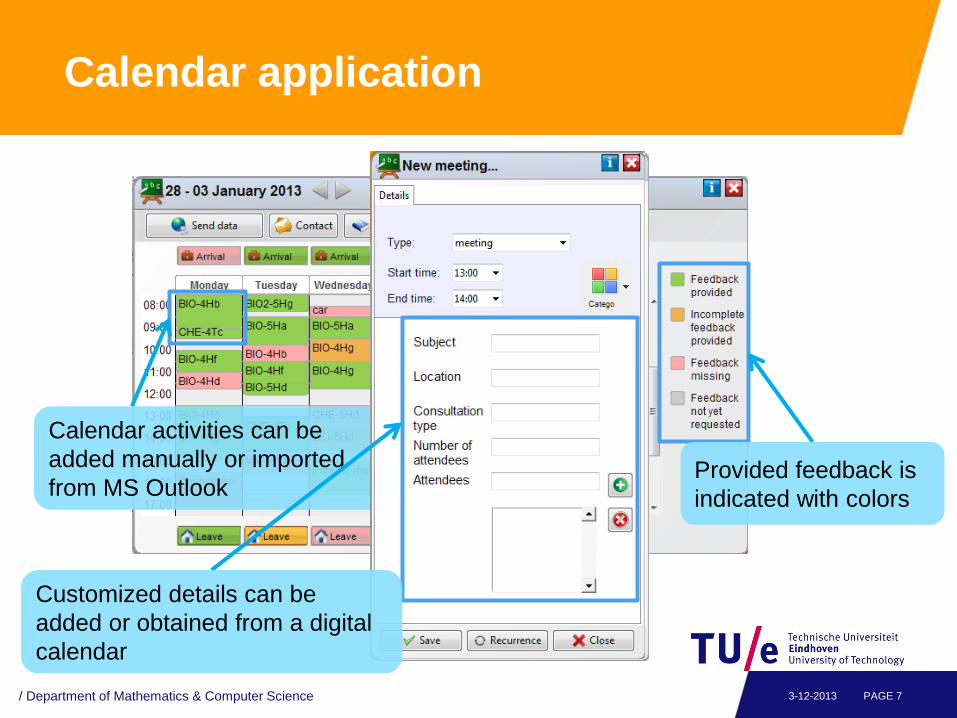
Calendar application
PAGE 7 3-12-2013
Calendar activities can be
added manually or imported
from MS Outlook
Customized details can be
added or obtained from a digital
calendar
Provided feedback is
indicated with colors
/ Department of Mathematics & Computer Science
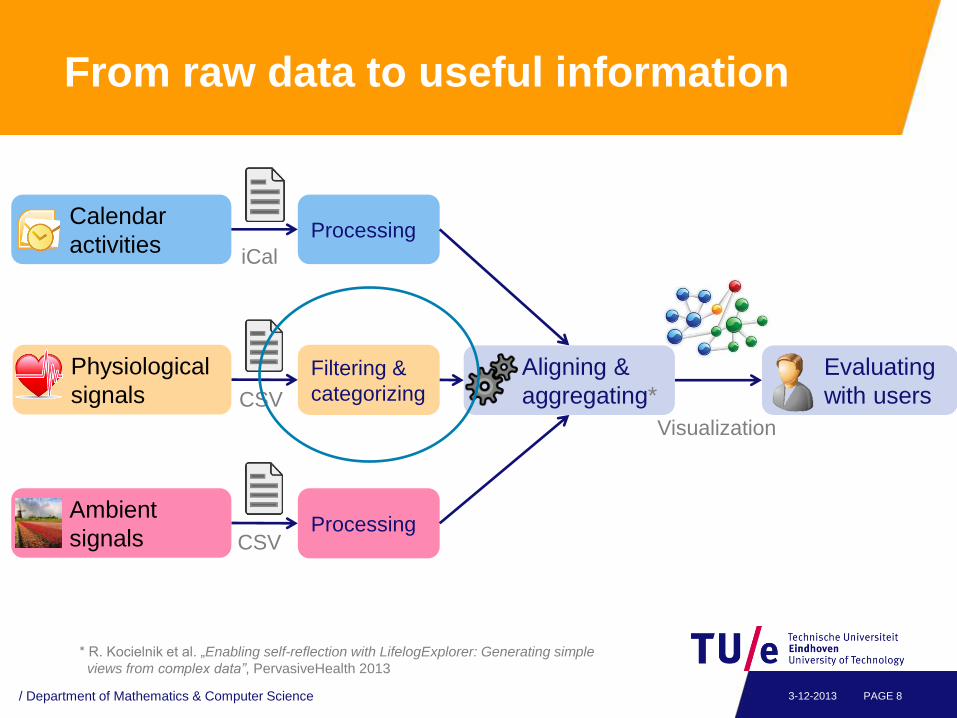
Visualization
From raw data to useful information
PAGE 8 3-12-2013
Calendar
activities Processing
Filtering &
categorizing
Evaluating
with users
iCal
CSV
CSV Processing
Physiological
signals
Ambient
signals
Aligning &
aggregating*
/ Department of Mathematics & Computer Science
* R. Kocielnik et al. „Enabling self-reflection with LifelogExplorer: Generating simple
views from complex data”, PervasiveHealth 2013
Data Analysis
PAGE 9 3-12-2013 / Department of Mathematics & Computer Science
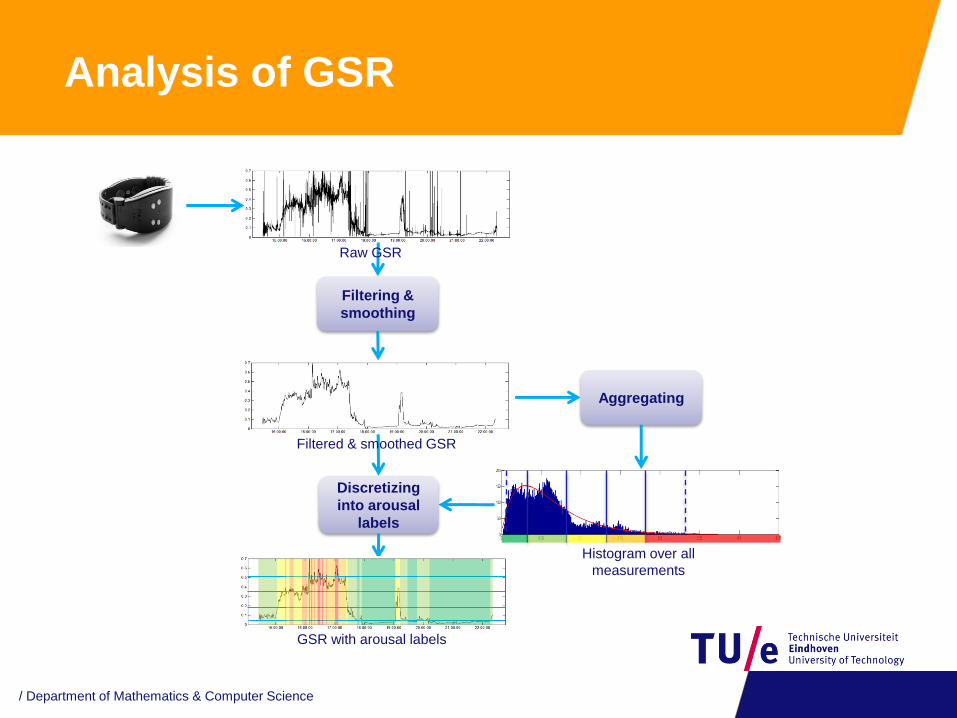
Analysis of GSR
PAGE 10 3-12-2013
Filtering &
smoothing
Aggregating
Discretizing
into arousal
labels
Histogram over all
measurements
Raw GSR
GSR with arousal labels
Filtered & smoothed GSR
/ Department of Mathematics & Computer Science

PAGE 11 3-12-2013
Filt
erin
g
Sm
oo
thin
g
Dis
cre
tizin
g
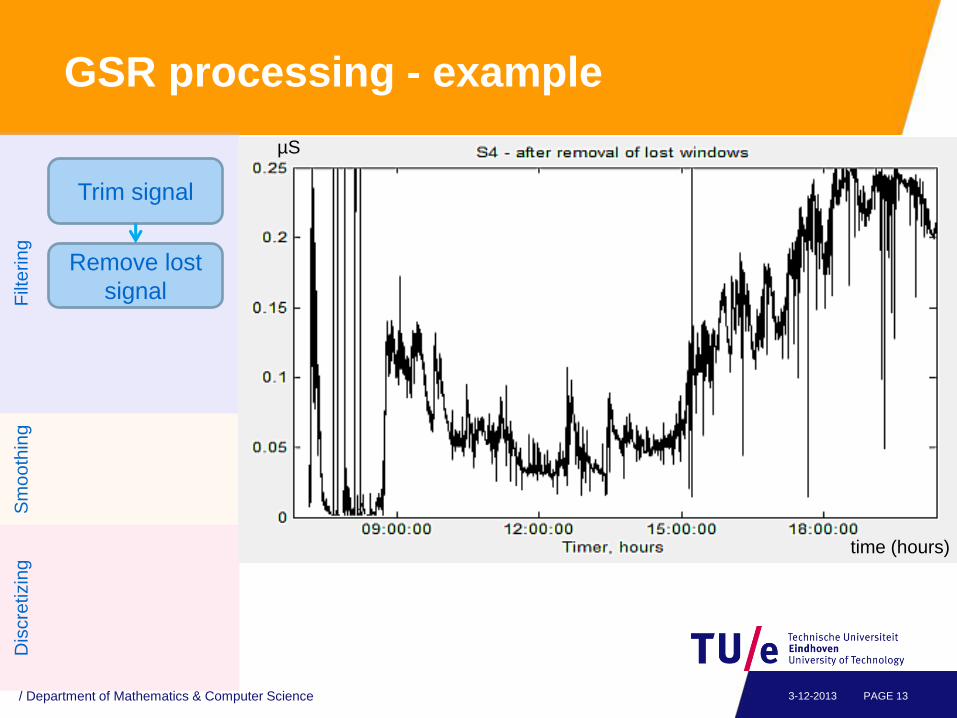
µS
time (hours)
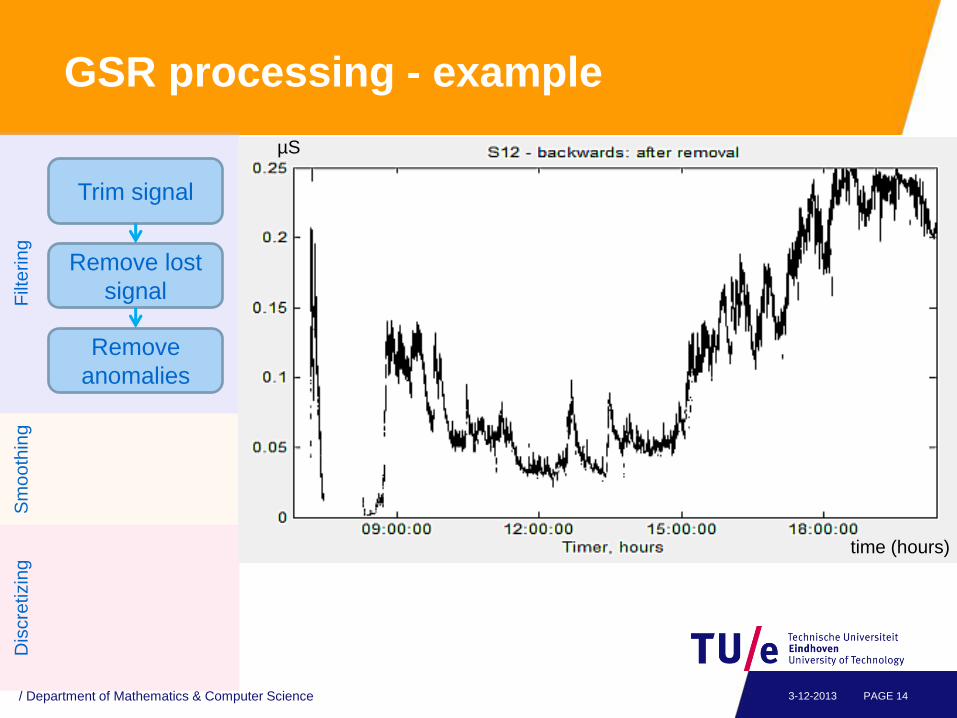
GSR processing - example
/ Department of Mathematics & Computer Science

PAGE 12 3-12-2013
Filt
erin
g
Sm
oo
thin
g
Dis
cre
tizin
g
Trim signal
µS
time (hours)
GSR processing - example
/ Department of Mathematics & Computer Science
PAGE 13 3-12-2013
Filt
erin
g
Sm
oo
thin
g
Dis
cre
tizin
g
Trim signal
Remove lost
signal
µS
time (hours)
GSR processing - example
/ Department of Mathematics & Computer Science
PAGE 14 3-12-2013
Filt
erin
g
Sm
oo
thin
g
Dis
cre
tizin
g
Trim signal
Remove lost
signal
Remove
anomalies
µS
time (hours)
GSR processing - example
/ Department of Mathematics & Computer Science
PAGE 15 3-12-2013
Filt
erin
g
Sm
oo
thin
g
Dis
cre
tizin
g
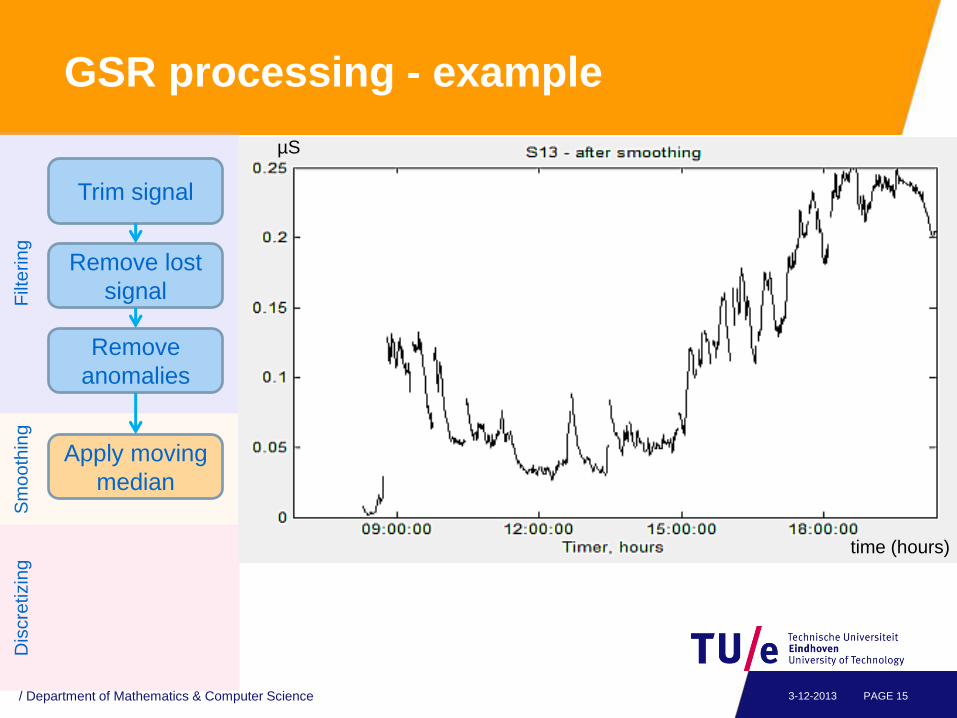
Trim signal
Remove lost
signal
Remove
anomalies
Apply moving
median
µS
time (hours)
GSR processing - example
/ Department of Mathematics & Computer Science

/ Department of Mathematics & Computer Science PAGE 16 3-12-2013
Filt
erin
g
Sm
oo
thin
g
Dis
cre
tizin
g
Trim signal
Remove lost
signal
Remove
anomalies
Apply moving
median
Define slicing
Categorize
µS
time (hours)
GSR processing - example
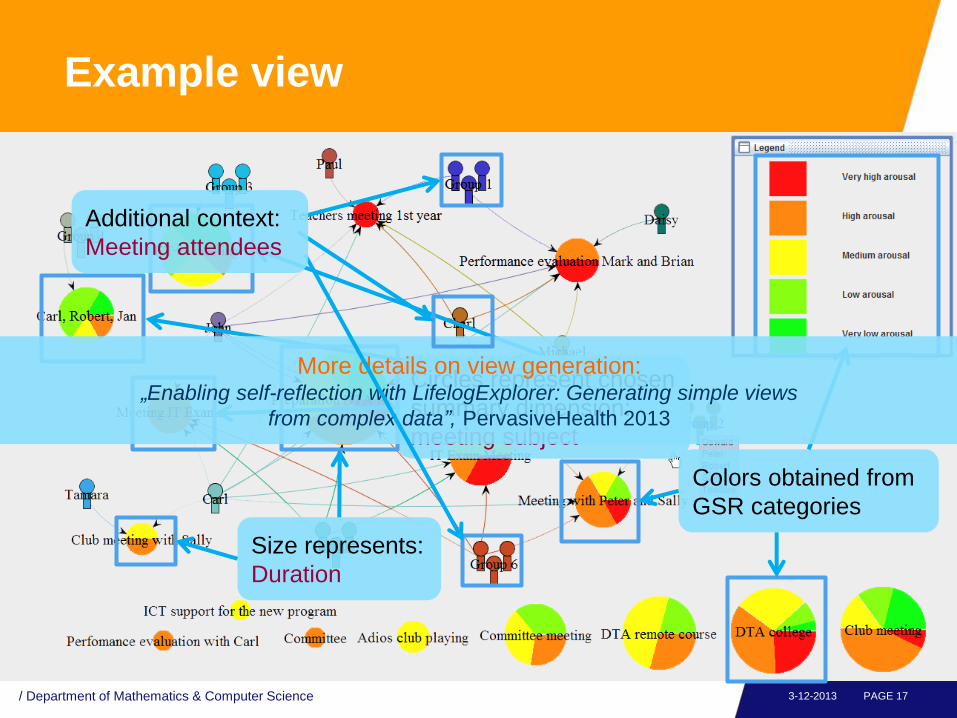
Example view
PAGE 17 3-12-2013
Circles represent chosen
summary dimension:
meeting subject
Size represents:
Duration
Colors obtained from
GSR categories
More details on view generation: „Enabling self-reflection with LifelogExplorer: Generating simple views
from complex data”, PervasiveHealth 2013
/ Department of Mathematics & Computer Science
Additional context:
Meeting attendees
Case study Evaluation
PAGE 18 3-12-2013 / Department of Mathematics & Computer Science
University staff members
PAGE 19 3-12-2013
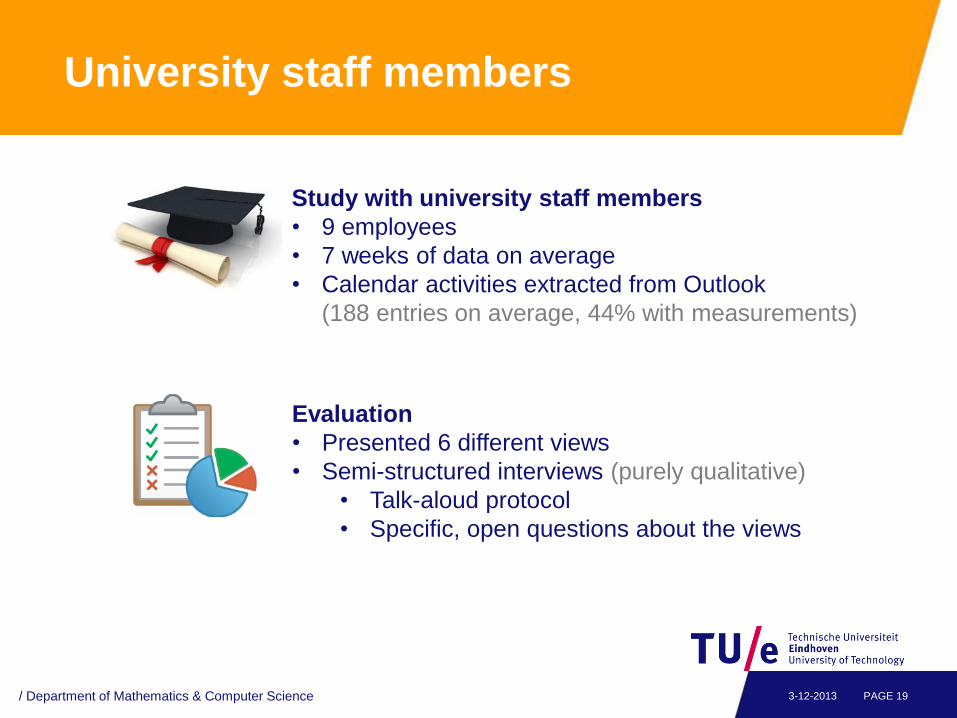
Study with university staff members
• 9 employees
• 7 weeks of data on average
• Calendar activities extracted from Outlook
(188 entries on average, 44% with measurements)
Evaluation
• Presented 6 different views
• Semi-structured interviews (purely qualitative)
• Talk-aloud protocol
• Specific, open questions about the views
/ Department of Mathematics & Computer Science
Results
PAGE 20 3-12-2013
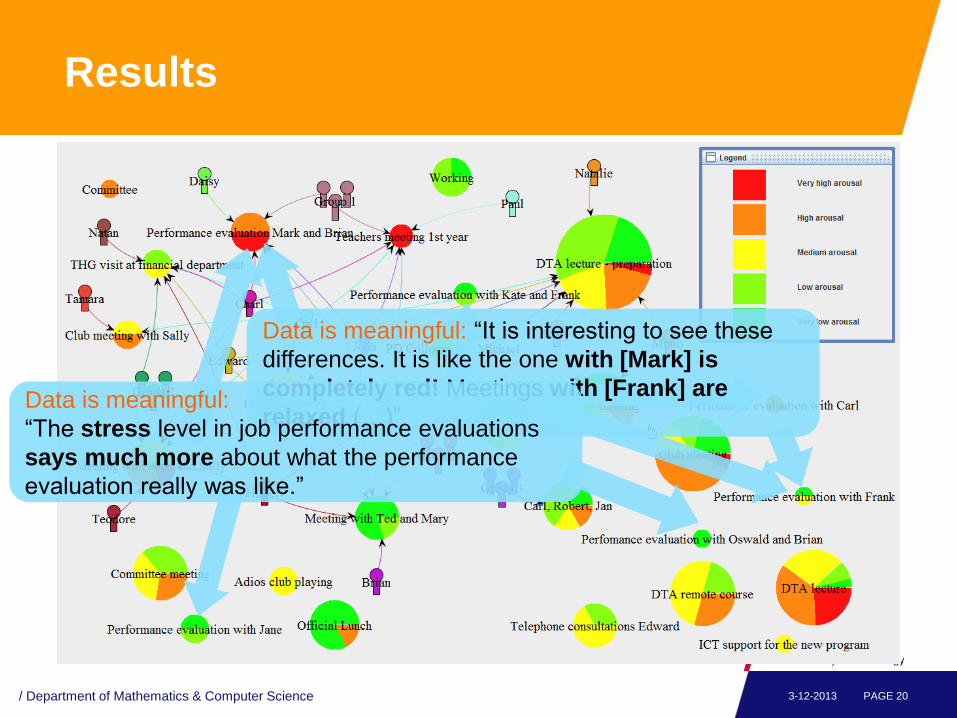
Data is meaningful: “It is interesting to see these
differences. It is like the one with [Mark] is
completely red! Meetings with [Frank] are
relaxed (…)” Data is meaningful:
“The stress level in job performance evaluations
says much more about what the performance
evaluation really was like.”
/ Department of Mathematics & Computer Science
Results
PAGE 21 3-12-2013
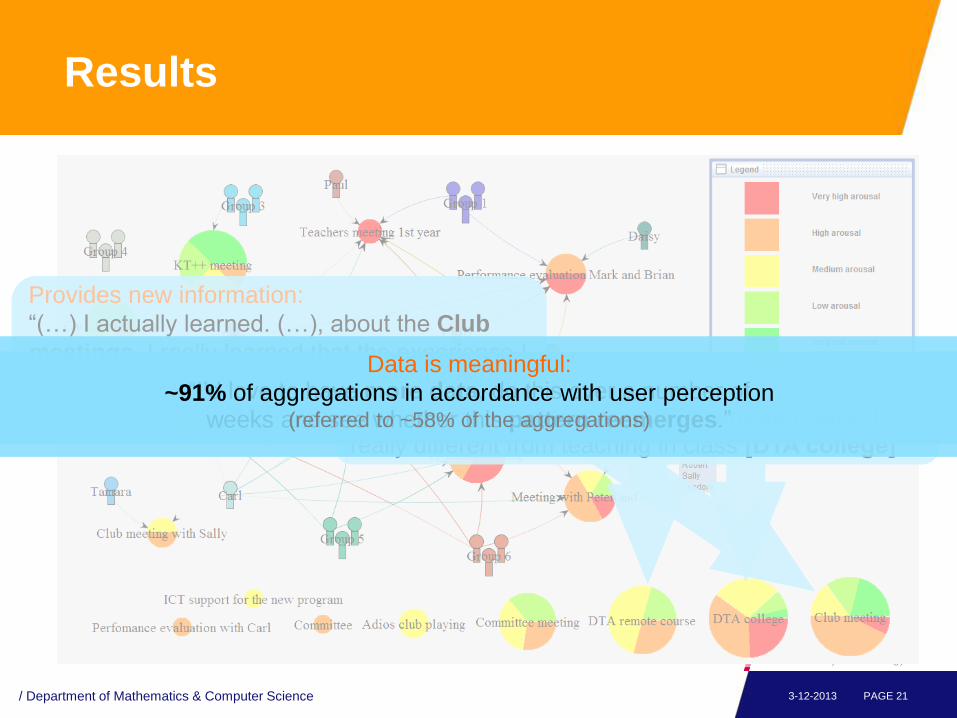
Provides new information:
“(…) I actually learned. (…), about the Club
meetings. I really learned that the experience I
have there is indeed reflected in the stress
levels. It is an eye opener for me.” Provides new information: “I learned that teaching
through video conferencing [DTA remote course] is
really different from teaching in class [DTA college]”
“I’d love to have more data, do this over a number of
weeks and see whether this pattern reemerges.”
Data is meaningful:
~91% of aggregations in accordance with user perception (referred to ~58% of the aggregations)
/ Department of Mathematics & Computer Science
Conclusions
PAGE 22 3-12-2013
Real time recording of bodily responses is feasible
in real life conditions
Arousal information with context:
• Is meaningful
• Provides new information
• Triggers actionable self-advices
The results of long-term monitoring:
• Can be used directly by the person
• Can serve as input for consultation with psychologist
/ Department of Mathematics & Computer Science

Future work
PAGE 23 3-12-2013
Measuring short-term and long-term effectiveness of coping
Suggestion of coping strategies based on measurements
Including other influence factors on GSR:
• temperature
• physical activity
Adding more context information:
• social media (sentiment analysis)
• e-mails
• GPS location
Improving analysis
Further use of the information
/ Department of Mathematics & Computer Science
Acknowledgements
PAGE 24 3-12-2013 / Department of Mathematics & Computer Science
Any questions? Thank you for listening
PAGE 25 3-12-2013 / Department of Mathematics & Computer Science