Embed Size (px)
Citation preview
Smart Water Application Technologies™
(SWAT)
Turfgrass and Landscape Irrigation System Smart Controllers
SOIL MOISTURE SENSOR-BASED CONTROLLERS
Laboratory and Operational Tests Version 3.0 August 2011
Phase 1: Laboratory Screening Tests (8th Draft Protocol—August 2009) Phase 2: Operational Test on a Virtual Landscape (4th Draft Protocol—October 2008)
Developed by
SWAT Committee 8280 Willow Oaks Corporate Drive, Suite 400
Fairfax, VA 22031 www.irrigation.org
© 2011 Irrigation Association
Soil Moisture Sensor-Based Controllers:, Laboratory and Operational Tests Version 3.0– August 2011 ©2011 Irrigation Association
TABLE OF CONTENTS Foreword………………………………………………………………………………………………..ii Introduction ......................................................................................................................... iii Phase 1: Laboratory Screening Tests ................................................................................... 1 1.0 Introduction ............................................................................................................... 1 2.0 Scope ........................................................................................................................ 1 3.0 Normative References ............................................................................................... 2 4.0 Terms and Definitions................................................................................................ 2 5.0 Symbols and Abbreviations ....................................................................................... 5 6.0 Test Specimen Selection ........................................................................................... 5 6.1 Sampling Test ........................................................................................................... 5 7.0 Test Method and Representation .............................................................................. 5 7.1 Soil Containment Box ................................................................................................ 6 7.2 Sensor Testing .......................................................................................................... 6 7.3 Temperature Response Test ..................................................................................... 8 7.4 Testing Procedure for Salinity Levels ......................................................................... 8 7.5 Test for Sensor Reading Variability ............................................................................ 8 7.6 Multiple Cycle Test .................................................................................................... 9 8.0 Results ...................................................................................................................... 9 Phase 2: Operational Test on a Virtual Landscape..……………………………………………10 9.0 Introduction ............................................................................................................. 10 10.0 Scope ...................................................................................................................... 10 11.0 Functional Tests ...................................................................................................... 11 11.1 General ................................................................................................................... 11 11.2 Sampling ................................................................................................................. 11 11.3 Test Adequacy, Efficiency and Runoff Potential ...................................................... 12 11.4 Test Report ............................................................................................................. 12 11.5 Test Duration ........................................................................................................... 13 11.6 Tables for Phase 2 .................................................................................................. 14 12.0 Bibliography ............................................................................................................ 16 13.0 Appendix ................................................................................................................. 17 13.1 Symbols and Definitions .......................................................................................... 17 13.2 Formulas ................................................................................................................. 18 13.3 Soil Containment Box .............................................................................................. 19 13.4 Block Diagram Depicting the Key Elements for Phase 2 Testing ............................. 20

Soil Moisture Sensor-Based Controllers:, Laboratory and Operational Tests Version 3.0– August 2011 ©2011 Irrigation Association
FOREWORD The Irrigation Association has established a Smart Water Application TechnologiesTM, or SWAT, committee to oversee the development of product testing protocols. This committee is assisted by a Technology Working Group (TWG) and project leaders. The protocol development process involves drafting the document followed by a public review and comment period. If required, the document is redrafted and another review process is initiated. Ultimately the SWAT committee votes on the acceptability of the last protocol. All protocols will be reviewed for possible revision every three years. The development of these testing protocols represents the first attempt by the Irrigation Association to develop product testing protocols. The actual product testing began in 2004 when the first climatologically based commercial controller was tested using the 5th Draft Testing Protocol dated May 3, 2004. The documents have no known predecessors. SWAT testing protocols are developed to test products designed for use with residential and similar light scale commercial and industrial properties. This protocol is not meant for testing of controllers that would be considered part of a central control system. These testing protocols consist of the following parts under the general title of “Turfgrass and Landscape Irrigation System Smart Controllers”: • Climatologically based controllers
• Soil moisture sensor-based controllers – Phase 1: Laboratory screening tests – Phase 2: Operational test on a virtual landscape
• Rainfall shutoff devices – Equipment functionality tests
ii i

Soil Moisture Sensor-Based Controllers:, Laboratory and Operational Tests Version 3.0– August 2011 ©2011 Irrigation Association
INTRODUCTION This protocol is designed to test the efficacy of a soil moisture sensor-based controller suitable for use with residential and light commercial irrigation systems. Conditions unique to this controller application are as follows:
• The system must function without human intervention.1 • The system must provide high levels of irrigation adequacy and scheduling efficiency. • The system must function over a wide range of field conditions including:
– climate – plant materials – topography – soils – water quality and quantity
• The system must be adjustable to reflect the homeowner’s preferences relative to vegetative quality.
Controlling the irrigation of turfgrass and landscape is a combination of scientific theory and subjective judgments. The attempt in developing this protocol is to use only generally recognized theory and to avoid judgments involving the art of irrigation. The protocol then recognizes that only the theory of irrigation is controllable by the skill of the controller manufacturer. The protocol will measure the ability of the controllers to provide adequate and efficient irrigation while minimizing potential runoff. The sensors provide feedback on root zone moisture status to the controller. The controller interprets the feedback and sets irrigation schedules accordingly. Soil moisture sensors are an important component of some sensor-based irrigation system controllers. With a time-based system controller, they act to provide closed-loop control feedback. They may also find application by closing the loop and providing feedback to climate-based system controllers. This is especially true in zones with higher water storage capacity. The objective of this protocol is to evaluate how well current commercial technology has integrated the scientific data into a practical system that meets the agronomic needs of the turfgrass and landscape vegetation. In general there are at least two types of standards. The first is a standard that defines the details of how a performance test is to be conducted and what data will be recorded. This SWAT testing protocol is that type of test. It does not result in a pass or fail evaluation. The second type of standard defines performance limits that must be met to quantify the capabilities of the product. The performance standards in this case are established by related considerations and organizations. To realize the full potential of the smart controller concept, the following issues must be addressed:
• The quality of the input data must be verified by a certified professional. • The controller must be set up and programmed by individuals familiar with the
technology. This includes the setting of control point thresholds in the installed location.
• The irrigation system must be properly designed and maintained. 1“Without human intervention” is limited to those stimuli that the sensor was designed to sense in the Phase 1 protocol. The protocol recognizes that the root zone environment can change dramatically (e.g., when water tables drop and irrigation water becomes more saline). With current state of the art, soil moisture sensors are not automatically compensated for this root zone environmental change. In this case, a periodic manual change in the threshold sensor setting is required.
iii i

Soil Moisture Sensor-Based Controllers:, Laboratory and Operational Tests Version 3.0– August 2011 ©2011 Irrigation Association
This testing protocol consists of two phases. Phase 1 results are then used in the phase two operational test. Phase 1: Laboratory screening tests are estimated to take approximately 6–8 months. Phase 2: An operational test on a virtual landscape takes at least one month or longer
until the required climatic conditions of 0.40 inches of gross rainfall and a minimum of 2.50 inches of ETO.
By their nature, soil moisture sensors operate in a responsive mode. The specifics of the mode are defined by the laboratory results (Phase 1) and site considerations including temperature, soil classification, planting materials, and water quality. Therefore, for a specific sensor the operating mode can be different for different zones. In any case, the manufacturer must specify the mode(s) before the Phase 2 test evaluation can be conducted. Representative modes include the following:
• When the soil moisture sensor reaches a lower threshold value – a fixed runtime application is made; or – a variable runtime application is made with irrigation terminated when an upper
threshold setting is reached. • Irrigations are scheduled on a time-framed basis (e.g. daily) for a given run time. If the
soil moisture sensor shows readings above a wetter threshold value, the irrigation is aborted. If the soil moisture is below the threshold value, the irrigation proceeds for a run time sufficient to reach at least the threshold value.
While not a part of this protocol, the dynamics of these control concepts need to be anticipated and managed. Specifically, the dynamics of the response time required for surface-supplied water (rainfall or irrigation) to be reflected in the sensor reading is not scientifically characterized. While an intuitive judgment characterizing their performance on coarse soils and shallow root zones is probably satisfactory, the same judgment on fine soils and deeper root zones would be misleading. This suggests that yesterday’s moisture status readings that have reached at least near equilibrium conditions are a better basis for making today’s irrigation decisions than to attempt a real-time-based program. Because of the fundamental dynamic of root zones, moisture gradients are always present. Soil moisture sensors are only one of a number of sensors that provide input data to a Smart controller. Phase 2 of this protocol measures the effectiveness of a controller that receives input data from selected weather sensors in addition to soil moisture sensors. The Smart controller must have the demonstrated ability to properly integrate the input from these sensors.
Soil Moisture Sensor-Based Controllers:, Laboratory and Operational Tests Version 3.0– August 2011 ©2011 Irrigation Association
Turfgrass and Landscape Irrigation Systems Smart Controllers — Soil Moisture Sensor-Based Controllers Laboratory and Operational Testing Phase 1: Laboratory Screening Tests 1.0 Introduction This section of the protocol is a series of laboratory tests that characterize the performance of the sensor when it is subjected to the following conditions:
• fine-, medium-, and coarse-textured soils • ambient temperatures of –5°C, 15°C, 25°C, and 35°C • water conductivity values of <0.5 dS/m, 2.5 ds/m, and 5.0 dS/m • base soil conductivity using saturated paste testing method: clay soils 1.0–2.0 dS/m and
all other soils <1.0 dS/m Note: All tests will be conducted under laboratory conditions that provide fixed temperature
control. This range of individual variables and parameters, if tested for at all possible combinations, leads to a prohibitively large number of tests. Standard conditions are defined as a medium soil at 25°C using water of conductivity of <0.5 dS/m. An important requirement of the sensors is their ability to maintain a stable calibration when subjected to repeated wet/dry cycles with moisture content values ranging from field capacity to permanent wilt point, with temperatures ranging from 15°C to 35°C, and with water quality of <0.5 to 5.0 dS/m salinity for wetting these boxes. Performance of individual sensors in this test provides an indication of the general capability of sensors commercially available. It is recognized that for a given sensor in an individual zone, an initial adjustment can be made to reflect the desired vegetative quality requirements and other unpredictable conditions such as product variability inherent in the manufacturing process and soil variability. 2.0 Scope This testing protocol standard is being established to verify the testing response accuracy of commercially available soil moisture sensors. This protocol characterizes the ability of the sensor to provide reliable results when comparing an individual unit’s performance during multiple wetting cycles. This protocol also tests the sensors over the range of conditions encountered in typical field installations. This includes a range of soil types, a range of soil temperatures (including freezing conditions), and a range of irrigation water salinity levels. Phase 1 focuses on the performance of the soil moisture sensor independent of how it is used in controlling irrigation. The objective of Phase 1 is to determine whether the sensor is stable in its response to varying root zone conditions. Phase 2 requires the sensor to supply soil moisture readings to a controller being tested for its ability to irrigate a virtual yard. Stability can be measured by a statistical analysis of sensor responses over prescribed ranges in the following variables:
Soil Moisture Sensor-Based Controllers:, Laboratory and Operational Tests Version 3.0– August 2011 ©2011 Irrigation Association
2
• soil water content • soil temperature • soil textural classifications • water electrical conductivity • repeated wet/dry cycles • freeze/thaw cycles
The protocol recognizes the availability of soil moisture sensors capable of estimating the “absolute soil moisture content” and those providing “relative soil moisture content.” Both sensor concepts will be held to the same standard of providing repeatable results under a range of controlled conditions. The protocol determines the testing response of the sensors under static laboratory conditions. The impact of such real world conditions as compaction, roots, and soil fauna have not been addressed. This protocol is not designed to establish criteria for determining the usefulness of the sensors as scientific instruments to gather research data. The purpose of the protocol is to determine the efficacy of soil moisture sensors to measure and monitor changes in soil moisture as required to provide useful information to the irrigation system controller. The sensor and controller are being evaluated as a functioning assembly. 3.0 Normative References 3.1 Soil Science Society of America “Glossary of Soil Science Terms” 3.2 Soil Textural Classifications: Soil textural classifications will correspond to the
U.S. Department of Agriculture definitions.
3.3 Evapotranspiration Calculation: Reference evapotranspiration will be calculated based on the standardized Penman-Monteith evapotranspiration equation as defined by Environmental and Water Resource Institute (EWRI) of the American Society of Civil Engineers study on the standardization of reference evapotranspiration (ETO) formulas. See http://www.kimberly.uidaho.edu/water/asceewri/
4.0 Terms and Definitions For the purpose of this testing protocol, the following terms and definitions apply. 4.1 Absolute soil moisture sensor — a soil moisture sensor that is sensitive to soil
moisture changes only and not affected by soil type, water conductivity, or temperature (Using moisture retention curves the sensor can then be used to set limits on root zone tension at values known to provide quality turf with efficient water use.)
4.2 Allowable surface accumulation [ASA] — freestanding water created on top of the soil surface by application rates that exceed soil intake rates that are generally restrained from running off by the combined effects of surface detention and the presence of the crop canopy, thatch layer, or accumulated vegetative waste
Soil Moisture Sensor-Based Controllers:, Laboratory and Operational Tests Version 3.0– August 2011 ©2011 Irrigation Association
3
4.3 Available water — the portion of water in a soil that can be readily absorbed by plant roots
4.4 Bulk density, soil — the mass (weight) of dry soil per unit bulk volume, kg/L
4.5 Crop (turf) coefficient [KC] — coefficients calculated for specific crops (e.g. warm and cool season turfgrasses) from the following formula:
Kc = ETC
ETO This provides a convenient method for calculating ETC when direct field data is not available. 4.6 De-ionized water — conductivity is < 0.5 dS/m
4.7 Design application [DA] — the net irrigation amount determined by taking the gross irrigation times irrigation system application efficiency
4.8 Effective precipitation — the amount of precipitation stored in the root zone after a
correction for an arbitrary loss of 20 percent to runoff and nonuniformity 4.9 Evapotranspiration [ET] — combination of water transpired from vegetation and evaporated from the soil and plant surfaces 4.8a Reference Crop Evapotranspiration [ETO] — Evapotranspiration
measured or calculated for a well-watered reference crop (pasture or turfgrass) 4.8b Crop evapotranspiration [ETC] — specific crop moisture requirements as
determined by lysimeter studies or calculated by formulas 4.10 Field capacity — the percentage of water remaining in the soil after the soil has
been saturated and free drainage has practically ceased. (The percentage may be expressed in terms of weight or volume.)
4.11 Gravimetric moisture content — the mass of water per unit mass of dry soil. It is
measured as the water lost from the soil upon oven drying to constant mass at 105°C (usually attained after 48 hours of drying in an oven at 105°C) (It is normally expressed as a decimal or percentage value, but the ideal SI units are kg per kg or other consistent mass units.)
4.12 (Irrigation) mode — instructions from the vendor that define the role of the sensor in supporting the controller (This information will be used to set run times. This runtime history will be logged and used in the performance analysis.)
4.13 Landscape coefficient [KL] — a functional equivalent of the crop coefficient for turf
that integrates the effects of species factor [ks], density factor [kd] and microclimate factor [kmc] for landscapes KL = (ks) (kd) (kmc) ETc = KL (ETO)
Soil Moisture Sensor-Based Controllers:, Laboratory and Operational Tests Version 3.0– August 2011 ©2011 Irrigation Association
4
4.14 Mass water content — the water content expressed as the weight of water in the soil divided by the oven-dried weight of soil 4.15 Mass water percentage — the mass water content times 100 4.16 Oven-dried soil — soil placed in an oven and dried at 105°C for 72 hours
4.17 Precipitation rate [PR] — the amount of irrigation water applied per unit of time
4.18 Permanent wilting point [PWP], permanent wilting percentage [PWP] — the soil wetness at which a plant wilts and can no longer recover its turgidity when placed in a saturated atmosphere for 12 hours
4.19 Relative soil moisture sensor — a sensor that is sensitive to soil moisture changes
and other factors including, for example, soil texture, water conductivity, and temperature. (With this sensor, control point thresholds are set in situ.)
4.20 Root zone working water storage [RZWWS] — a root zone water storage value that integrates the effects of actual root zone depth, soil moisture storage capacity, and allowable moisture depletion
4.21 Root zone working depth [RZWD] — a measure of the effective root zone depth for
purposes of calculating soil moisture storage
4.22 Run time [RT] — the time that a zone valve is opened to permit an irrigation event 4.23 Saturated paste extraction — soils tested for electrical conductivity utilizing
a saturated paste methodology 4.24 Smart controllers — estimate or measure depletion of available plant soil moisture in
order to operate an irrigation system, replenishing water as needed while minimizing excess water use. (A properly programmed smart controller requires initial site-specific set-up and will make irrigation schedule adjustments, including run times and required cycles throughout the irrigation season without human intervention.)
4.25 Soak time — the time required for a given application to infiltrate into the root zone
4.26 Soil texture — the relative proportions of the various soil size separates. (For
example, a fine-textured soil has a large percentage of silt and clay (protocol will use the USDA classification system).)
4.27 Soil water potential (pressure, head) — the amount of work that must be done per
unit of a specified quantity of pure water in order to transport reversibly and isothermally an infinitesimal quantity of water from a specified source to a specified destination • If the specified quantity is volume, the potential is referred to as pressure {Pa}. • If the specified quantity is weight, the potential is referred to as head {m}. • If the specified quantity is mass, the potential is expressed in J kg.
4.28 Volumetric water content [VWC] — the ratio of the volume of water in a soil to the total bulk volume of the soil (in decimal form)
Soil Moisture Sensor-Based Controllers:, Laboratory and Operational Tests Version 3.0– August 2011 ©2011 Irrigation Association
5
4.29 Volumetric water percentage — volume water ratio multiplied by 100 4.30 Water salinity level — an electrical conductance measurement characterizing the
level of soluble salts that can interfere with the growth of some crops
4.31 Zones — a portion of the system, which is connected to a common water supply and intended to be managed and operated as an individual unit
5.0 Symbols and Abbreviations Note: SI (metric units) will be used in the protocol as defined by American Society of
Agricultural and Biological Engineers Standard ASABE EP 285.7. See Appendix 13.1 for symbols and abbreviations used in this document. For other
definitions, symbols and units of measurement refer to the Irrigation Association glossary (see www.irrigation.org)
6.0 Test Specimen Selection 6.1 Sampling Test
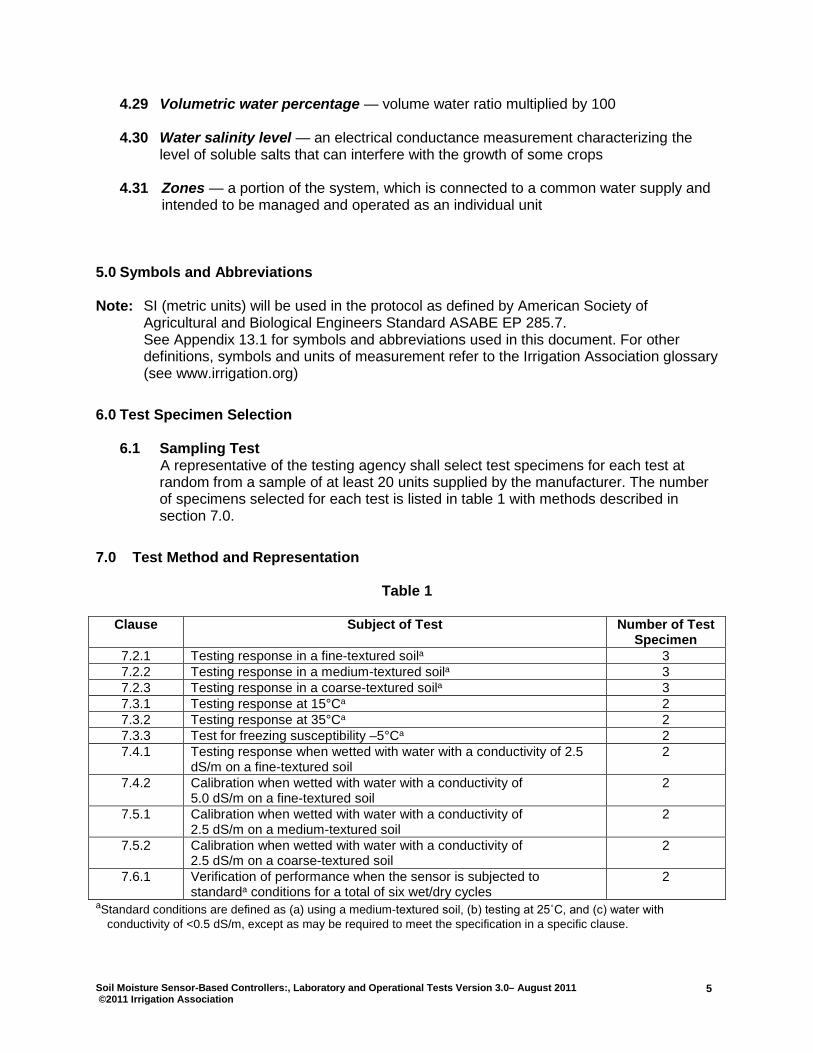
A representative of the testing agency shall select test specimens for each test at random from a sample of at least 20 units supplied by the manufacturer. The number of specimens selected for each test is listed in table 1 with methods described in section 7.0.
7.0 Test Method and Representation
Table 1
Clause Subject of Test Number of Test Specimen
7.2.1 Testing response in a fine-textured soila 3 7.2.2 Testing response in a medium-textured soila 3 7.2.3 Testing response in a coarse-textured soila 3 7.3.1 Testing response at 15°Ca 2 7.3.2 Testing response at 35°Ca 2 7.3.3 Test for freezing susceptibility –5°Ca 2 7.4.1 Testing response when wetted with water with a conductivity of 2.5
dS/m on a fine-textured soil 2
7.4.2 Calibration when wetted with water with a conductivity of 5.0 dS/m on a fine-textured soil
2
7.5.1 Calibration when wetted with water with a conductivity of 2.5 dS/m on a medium-textured soil
2
7.5.2 Calibration when wetted with water with a conductivity of 2.5 dS/m on a coarse-textured soil
2
7.6.1 Verification of performance when the sensor is subjected to standarda conditions for a total of six wet/dry cycles
2
aStandard conditions are defined as (a) using a medium-textured soil, (b) testing at 25˚C, and (c) water with conductivity of <0.5 dS/m, except as may be required to meet the specification in a specific clause.
Soil Moisture Sensor-Based Controllers:, Laboratory and Operational Tests Version 3.0– August 2011 ©2011 Irrigation Association
6
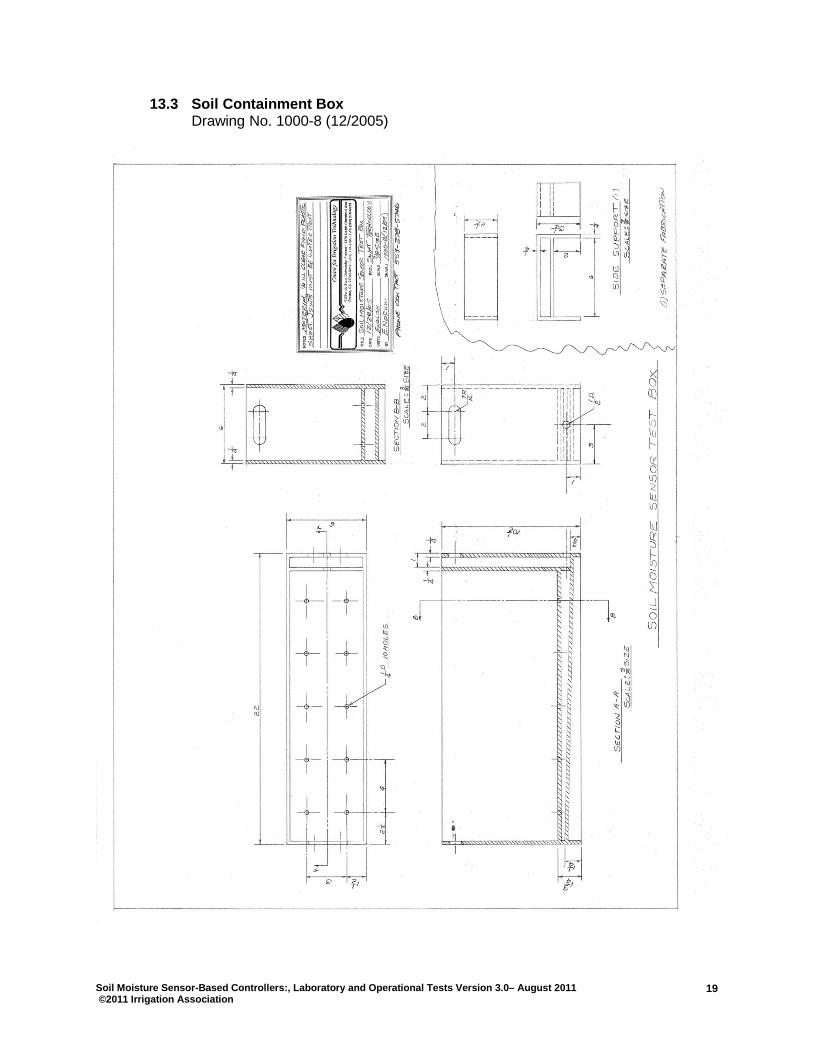
7.1 Soil Containment Box
Prepare the soil containment box [Ref. CIT Drawing No. 1000-8 (12/2005) copy in the appendix 13.3] and install the sensor. Note: This containment box is meant to be used with sensors of limited volumetric range. Other configurations may be required for sensors with larger volumetric range.
7.1.1 Sensor Installation Use a standardized box sitting on a flat surface capable of containing a fixed weight and volume of the representative soil type. The soil shall be saturated and drained through perforations in the bottom. The box shall allow for the determination of the net weight of water required to bring the soil sample to field capacity. The volume of soil shall be sufficient to permit the sensor to function without being materially affected by the box dimensions. The soil shall be oven dried and screened for ease of packing around the sensor. The soil shall be placed and tamped so as to result in the representative bulk density (range 1.2 to 1.4 kg/L). The sensor will be located in the center of the box at a cover depth of approximately 76 mm or as per manufacturer’s recommendation. Sensor reading and temperature measuring device output wiring shall be arranged to avoid interfering with the procedure for weighing the box. The weight of all components, except for the soil and water, shall be known.
The box is designed to represent a section of turfgrass root zone with a maximum depth of 152-178 mm. The actual depth of placement will be recorded. It is recognized that the combined effects of surface drying and drainage below the root zone will result in a moisture gradient within the box. This is meant to simulate a representative environment in which the sensor is designed to function
7.2 Sensor Testing
Test for the sensor’s ability to provide a consistent response between drying cycles and between individual sensors. Repeat the test for a range of textural classifications. Note: The sensor is to be installed and conditioned to the site as per the manufacturer’s written standard requirements.
7.2.1 Testing Procedure: (Fine Texture1)
Assemble three soil containment boxes complete with moisture and temperature sensors including provision for electrical hookup to registering and/or recording devices. Predetermine the weight and volume of the soil moisture sensing device. Place the oven-dried fine-textured soil in the box and tamp to achieve the desired bulk density. Include in this process the installation of the soil moisture sensor in the location recommended by the manufacturer. Obtain the weight of the box plus soil and the volume of the tamped soil and then calculate the actual bulk density. Place the box in the environmental chamber set at 25°C. By a process of adding a known amount of de-ionized (DI) water, fill the box until the soil is completely saturated. Note
1 See table 2 for a soil particle size specification.
Soil Moisture Sensor-Based Controllers:, Laboratory and Operational Tests Version 3.0– August 2011 ©2011 Irrigation Association
7
that water is introduced from the bottom up to avoid trapping air in the soil mass. Allow the box to drain until all free drainage ceases. Measure the amount of drainage water and calculate the net amount of water stored in the box. Alternatively, the box can be weighed before and after being saturated and drained to determine the net amount of water retained. In both methods the box will be covered to ensure the water loss is from drainage only. Read and record the soil temperature and sensor reading and weigh the box. This initiates the test run. Remove the box cover and let the soil dry in the environmental chamber taking periodic readings of temperature, sensor output, and box weights2. In any case, a minimum of one to two readings per day are required as the soil dries out over the total period of the test. Plot the results for each sensor from the three boxes. The analyst will plot the results and develop a best-fit functional relationship. Repeat the test by re-wetting the soils and taking readings as previously defined. The analyst will plot the results and develop a best-fit functional relationship. The required range of moisture content over which the sensor is to be tested is shown in table 3. This range is defined by the practical limits as needed to support the controller in its attempt to effectively manage root zone stored moisture.
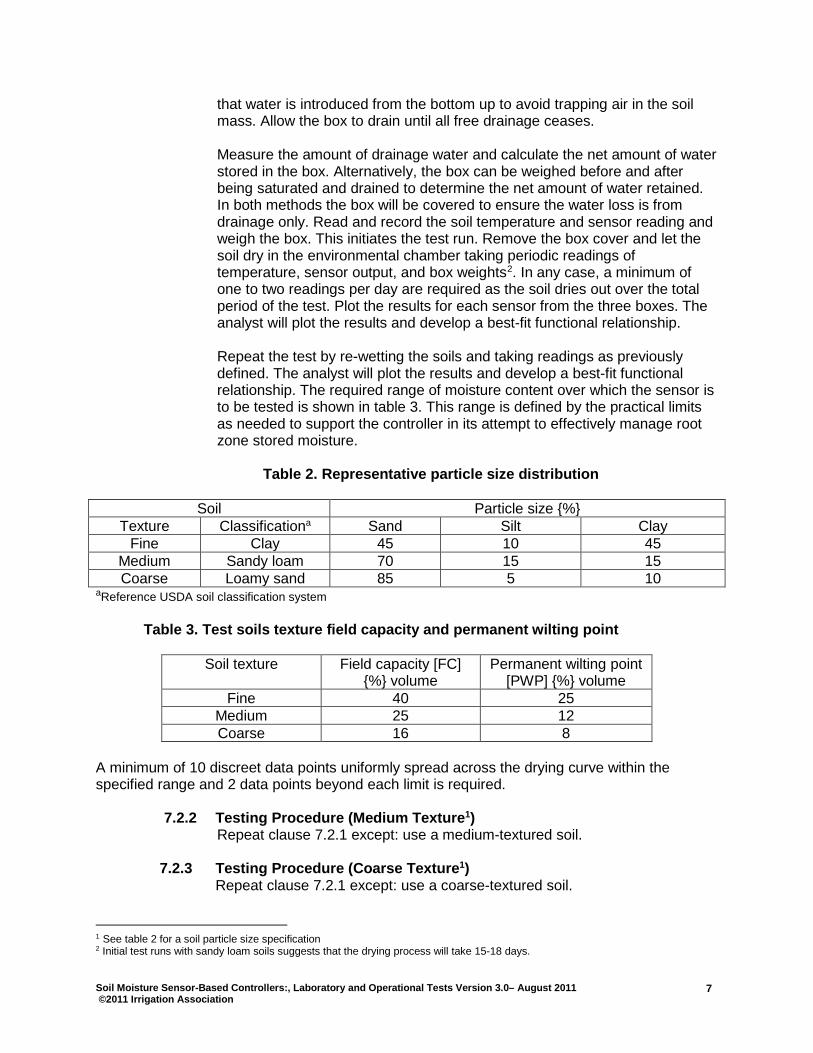
Table 2. Representative particle size distribution
Soil Particle size {%}
Texture Classificationa Sand Silt Clay Fine Clay 45 10 45
Medium Sandy loam 70 15 15 Coarse Loamy sand 85 5 10
aReference USDA soil classification system
Table 3. Test soils texture field capacity and permanent wilting point
Soil texture Field capacity [FC] {%} volume
Permanent wilting point [PWP] {%} volume
Fine 40 25 Medium 25 12 Coarse 16 8
A minimum of 10 discreet data points uniformly spread across the drying curve within the specified range and 2 data points beyond each limit is required. 7.2.2 Testing Procedure (Medium Texture1)
Repeat clause 7.2.1 except: use a medium-textured soil. 7.2.3 Testing Procedure (Coarse Texture1) Repeat clause 7.2.1 except: use a coarse-textured soil.
1 See table 2 for a soil particle size specification 2 Initial test runs with sandy loam soils suggests that the drying process will take 15-18 days.
Soil Moisture Sensor-Based Controllers:, Laboratory and Operational Tests Version 3.0– August 2011 ©2011 Irrigation Association
8
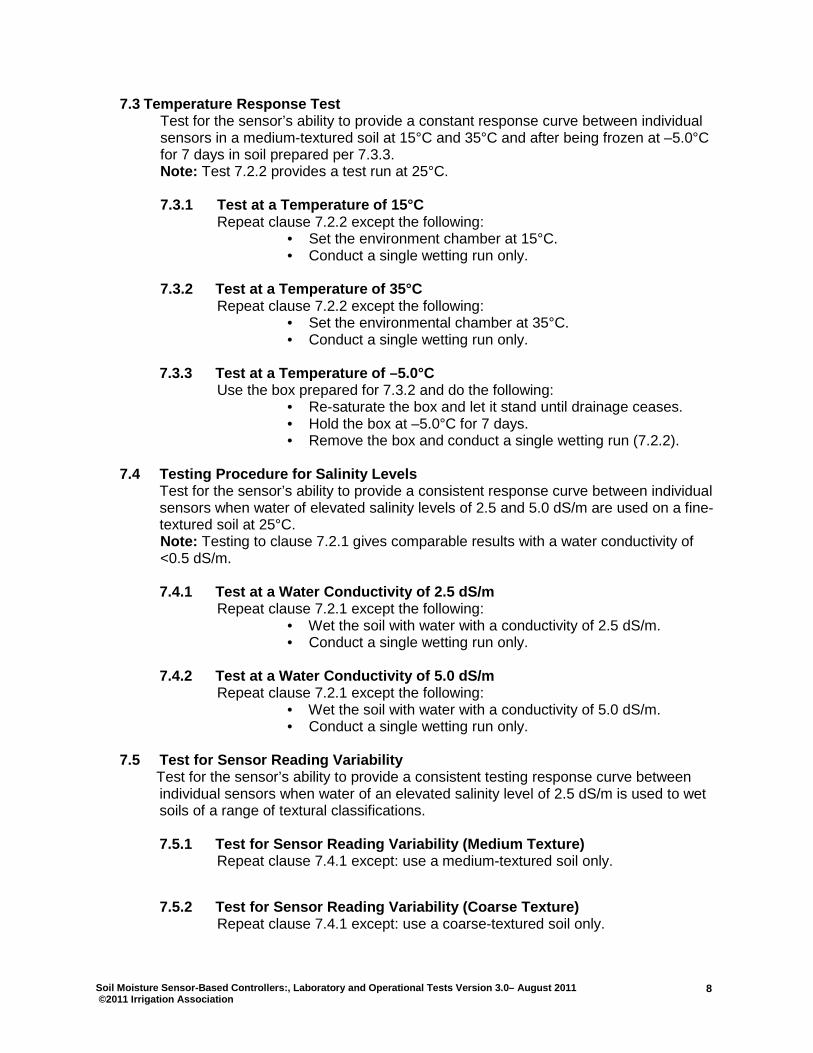
7.3 Temperature Response Test Test for the sensor’s ability to provide a constant response curve between individual sensors in a medium-textured soil at 15°C and 35°C and after being frozen at –5.0°C for 7 days in soil prepared per 7.3.3. Note: Test 7.2.2 provides a test run at 25°C.
7.3.1 Test at a Temperature of 15°C
Repeat clause 7.2.2 except the following: • Set the environment chamber at 15°C.
• Conduct a single wetting run only. 7.3.2 Test at a Temperature of 35°C
Repeat clause 7.2.2 except the following: • Set the environmental chamber at 35°C. • Conduct a single wetting run only. 7.3.3 Test at a Temperature of –5.0°C
Use the box prepared for 7.3.2 and do the following: • Re-saturate the box and let it stand until drainage ceases. • Hold the box at –5.0°C for 7 days. • Remove the box and conduct a single wetting run (7.2.2).
7.4 Testing Procedure for Salinity Levels
Test for the sensor’s ability to provide a consistent response curve between individual sensors when water of elevated salinity levels of 2.5 and 5.0 dS/m are used on a fine-textured soil at 25°C. Note: Testing to clause 7.2.1 gives comparable results with a water conductivity of <0.5 dS/m.
7.4.1 Test at a Water Conductivity of 2.5 dS/m
Repeat clause 7.2.1 except the following: • Wet the soil with water with a conductivity of 2.5 dS/m. • Conduct a single wetting run only. 7.4.2 Test at a Water Conductivity of 5.0 dS/m
Repeat clause 7.2.1 except the following: • Wet the soil with water with a conductivity of 5.0 dS/m. • Conduct a single wetting run only.
7.5 Test for Sensor Reading Variability Test for the sensor’s ability to provide a consistent testing response curve between individual sensors when water of an elevated salinity level of 2.5 dS/m is used to wet soils of a range of textural classifications.
7.5.1 Test for Sensor Reading Variability (Medium Texture)
Repeat clause 7.4.1 except: use a medium-textured soil only.
7.5.2 Test for Sensor Reading Variability (Coarse Texture)
Repeat clause 7.4.1 except: use a coarse-textured soil only.

Soil Moisture Sensor-Based Controllers:, Laboratory and Operational Tests Version 3.0– August 2011 ©2011 Irrigation Association
9
7.6 Multiple Cycle Test Verification of performance: by subjecting the sensor to standard conditions for a total of six wet/dry cycles. The “wet” point is defined as field capacity. The “dry” point is defined by the manufacturer as the driest value to be used in the Phase 2 test.
7.6.1 Medium Texture Test
Repeat clause 7.2.2 except the following: • Use a medium-textured soil only.
• Rerun the wet/dry cycling five times to develop and compare six separate results.
Note: Combine the results from clause 7.6.1 with clause 7.2.2 to meet the six cycle requirement.
8.0 Results of Phase 1 For the sensor to support the controller, its testing response must be stable for the root zone condition existing on-site. This protocol is an attempt to reasonably frame the range of conditions anticipated in locations where the concept of “soil moisture sensor-based controller” can be expected to apply. For each of the tests defined as clauses in table 1, the “Client’s Report” will show the response curve and correlation coefficient. These results on individual sensors will be reported in a tabular format. This data correlates sensor reading with volumetric water content of the test.
8.1 A correlation will be made for clauses 7.2.1, 7.2.2, and 7.2.3 both individually and in combination. This deals with soils of a range of textures.
8.2 A correlation will be made for clauses 7.2.2, 7.3.1, 7.3.2, and 7.3.3 both
individually and in combination. This deals with soil temperature.
8.3 A correlation will be made for clauses 7.2.1, 7.4.1, and 7.4.2 both individually and in combination. This analysis deals with a fine-textured soil subjected to a range of water conductivities.
8.4 A correlation will be made for clauses 7.2.2 and 7.5.1 both individually and in
combination. This analysis deals with a medium-textured soil subjected to a range of water conductivities.
8.5 A correlation will be made for clause 7.6.1 both individually and in
combination. This analysis deals with medium-textured soils subjected to multiple wet/dry cycles.
In addition, a summary report of the Phase 1 testing results will be posted on www.irrigation.org. This report will verify that the sensor has completed the Phase 1 testing and provide other descriptive information on the sensor’s capabilities.

Soil Moisture Sensor-Based Controllers:, Laboratory and Operational Tests Version 3.0– August 2011 ©2011 Irrigation Association
10
Phase 2: Operational Test on a Virtual Landscape 9.0 Overview of Operational Test This section of the protocol provides a procedure for characterizing the efficacy of irrigation system controllers that utilize soil moisture sensors as a basis for controlling irrigation. This evaluation concept requires the use of accepted formulas for calculating crop evapotranspiration [ETc]. A properly sited weather station with quality assurance data (like a CIMIS weather station) will be used to provide the moisture balance calculation required for this evaluation. This evaluation also makes use of the results of the “Phase 1: Laboratory Screening Tests.” The manufacturer is required to provide the controller and/or controller interface module and a data conversion device (described in 13.4 that will be unique to each manufacturer) that accepts moisture data from the testing facility computer and converts the same to a format readable by the manufacturer’s controller. The data conversion device is based upon their principles of operation and also scales the computer-generated moisture readings into the irrigation controller/controller interface in accordance with the measured sensor properties determined in Phase 1. Phase 2 of the protocol will measure the ability of the controllers to provide adequate and efficient irrigation while minimizing potential runoff. Allowance is made for the variability in soil properties and the inherent problems of trying to characterize them with scientific instruments. The objective of Phase 2 is to evaluate how well current soil moisture technology integrates into a practical control system that meets the agronomic needs of the turf and landscape plants. This is the first step in an evaluation procedure that must also eventually include other secondary considerations that affect market acceptance. 10.0 Scope of Operational Test This evaluation will be accomplished by creating a virtual landscape subjected to a representative climate and by evaluating the ability of soil moisture-based controllers to adequately and efficiently irrigate that landscape. The individual zones within the landscape will represent a range of exposures and agronomic conditions. Soil types will be as used in the Phase 1 laboratory evaluation. As a standard from which to judge the controller’s performance, a detailed moisture balance calculation will be made for each zone. The total accumulated moisture deficit over time will be a measure of the adequacy. The accumulated surplus of applied water over time will be a measure of system efficiency. Water applied beyond the soil’s ability to accept it will be characterized as runoff or deep percolation, further degrading the application efficiency. The study will use weather data from a representative weather station. The study is not meant to include individualized water management strategies aimed at producing special physiological effects. If the controller maintains root zone moistures at the levels specified, it is assumed that the crop growth and quality will be adequate. The soil moisture-based controller concept has the unique capability to measure actual root zone stresses which, in turn, affects the quality of vegetative growth. In practice through a period of system start-up threshold adjustments, the operator can then customize the system operation to meet his quality requirements. The operational concepts also assume that threshold adjustments can be made manually in response to seasonal changes in on-site conditions. For example, these changes could be
Soil Moisture Sensor-Based Controllers:, Laboratory and Operational Tests Version 3.0– August 2011 ©2011 Irrigation Association
11
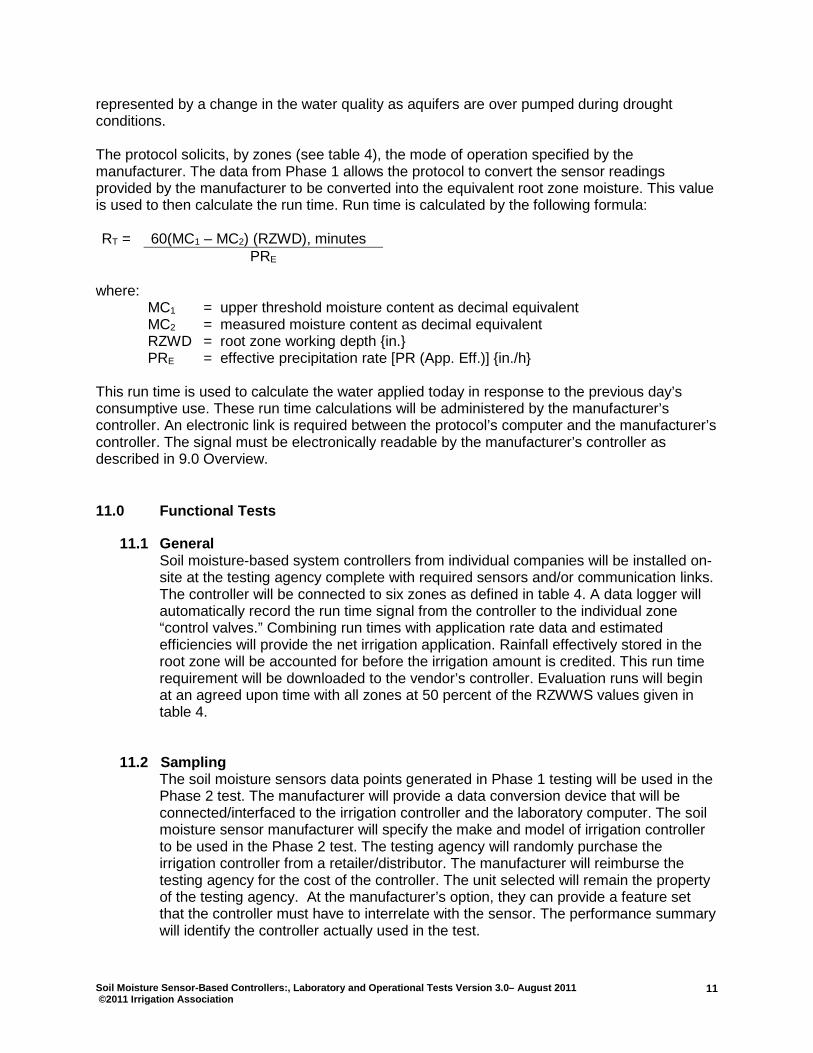
represented by a change in the water quality as aquifers are over pumped during drought conditions. The protocol solicits, by zones (see table 4), the mode of operation specified by the manufacturer. The data from Phase 1 allows the protocol to convert the sensor readings provided by the manufacturer to be converted into the equivalent root zone moisture. This value is used to then calculate the run time. Run time is calculated by the following formula: RT =
60(MC1 – MC2) (RZWD), minutes
PRE where: MC1 = upper threshold moisture content as decimal equivalent MC2 = measured moisture content as decimal equivalent RZWD = root zone working depth {in.} PRE = effective precipitation rate [PR (App. Eff.)] {in./h} This run time is used to calculate the water applied today in response to the previous day’s consumptive use. These run time calculations will be administered by the manufacturer’s controller. An electronic link is required between the protocol’s computer and the manufacturer’s controller. The signal must be electronically readable by the manufacturer’s controller as described in 9.0 Overview. 11.0 Functional Tests 11.1 General Soil moisture-based system controllers from individual companies will be installed on- site at the testing agency complete with required sensors and/or communication links. The controller will be connected to six zones as defined in table 4. A data logger will automatically record the run time signal from the controller to the individual zone “control valves.” Combining run times with application rate data and estimated efficiencies will provide the net irrigation application. Rainfall effectively stored in the root zone will be accounted for before the irrigation amount is credited. This run time requirement will be downloaded to the vendor’s controller. Evaluation runs will begin at an agreed upon time with all zones at 50 percent of the RZWWS values given in table 4.
11.2 Sampling The soil moisture sensors data points generated in Phase 1 testing will be used in the Phase 2 test. The manufacturer will provide a data conversion device that will be connected/interfaced to the irrigation controller and the laboratory computer. The soil moisture sensor manufacturer will specify the make and model of irrigation controller to be used in the Phase 2 test. The testing agency will randomly purchase the irrigation controller from a retailer/distributor. The manufacturer will reimburse the testing agency for the cost of the controller. The unit selected will remain the property of the testing agency. At the manufacturer’s option, they can provide a feature set that the controller must have to interrelate with the sensor. The performance summary will identify the controller actually used in the test.
Soil Moisture Sensor-Based Controllers:, Laboratory and Operational Tests Version 3.0– August 2011 ©2011 Irrigation Association
12
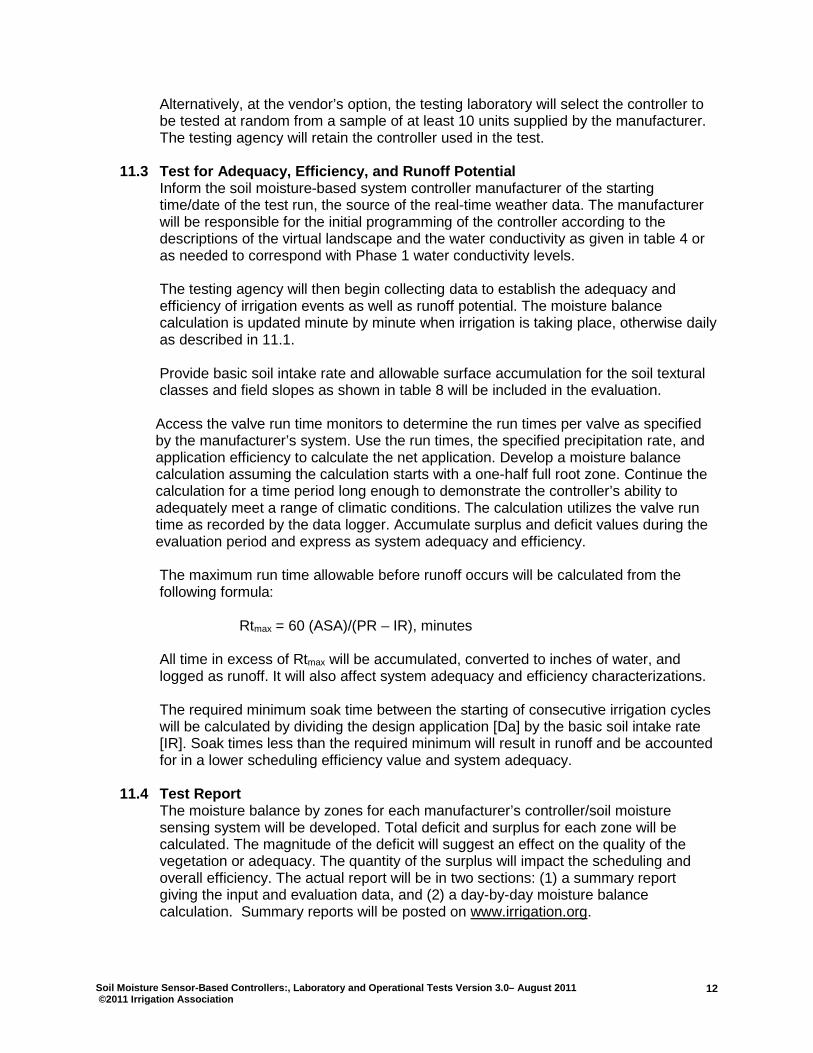
Alternatively, at the vendor’s option, the testing laboratory will select the controller to be tested at random from a sample of at least 10 units supplied by the manufacturer. The testing agency will retain the controller used in the test.
11.3 Test for Adequacy, Efficiency, and Runoff Potential Inform the soil moisture-based system controller manufacturer of the starting
time/date of the test run, the source of the real-time weather data. The manufacturer will be responsible for the initial programming of the controller according to the descriptions of the virtual landscape and the water conductivity as given in table 4 or as needed to correspond with Phase 1 water conductivity levels.
The testing agency will then begin collecting data to establish the adequacy and efficiency of irrigation events as well as runoff potential. The moisture balance calculation is updated minute by minute when irrigation is taking place, otherwise daily as described in 11.1. Provide basic soil intake rate and allowable surface accumulation for the soil textural classes and field slopes as shown in table 8 will be included in the evaluation. Access the valve run time monitors to determine the run times per valve as specified by the manufacturer’s system. Use the run times, the specified precipitation rate, and application efficiency to calculate the net application. Develop a moisture balance calculation assuming the calculation starts with a one-half full root zone. Continue the calculation for a time period long enough to demonstrate the controller’s ability to adequately meet a range of climatic conditions. The calculation utilizes the valve run time as recorded by the data logger. Accumulate surplus and deficit values during the evaluation period and express as system adequacy and efficiency.
The maximum run time allowable before runoff occurs will be calculated from the following formula: Rtmax = 60 (ASA)/(PR – IR), minutes All time in excess of Rtmax will be accumulated, converted to inches of water, and logged as runoff. It will also affect system adequacy and efficiency characterizations.
The required minimum soak time between the starting of consecutive irrigation cycles will be calculated by dividing the design application [Da] by the basic soil intake rate [IR]. Soak times less than the required minimum will result in runoff and be accounted for in a lower scheduling efficiency value and system adequacy.
11.4 Test Report
The moisture balance by zones for each manufacturer’s controller/soil moisture sensing system will be developed. Total deficit and surplus for each zone will be calculated. The magnitude of the deficit will suggest an effect on the quality of the vegetation or adequacy. The quantity of the surplus will impact the scheduling and overall efficiency. The actual report will be in two sections: (1) a summary report giving the input and evaluation data, and (2) a day-by-day moisture balance calculation. Summary reports will be posted on www.irrigation.org.

Soil Moisture Sensor-Based Controllers:, Laboratory and Operational Tests Version 3.0– August 2011 ©2011 Irrigation Association
13
11.5 Test Duration In addition to testing to the parameters given in table 4, performance results are only valid if the controller must make adjustments for varying weather conditions relative to evapotranspiration and rainfall. Valid performance data is from a consecutive 30-day period of testing exhibiting a minimum of 0.40 inches of gross rainfall and a minimum of 2.50 inches of ETO.
Soil Moisture Sensor-Based Controllers:, Laboratory and Operational Tests Version 3.0– August 2011 ©2011 Irrigation Association
14
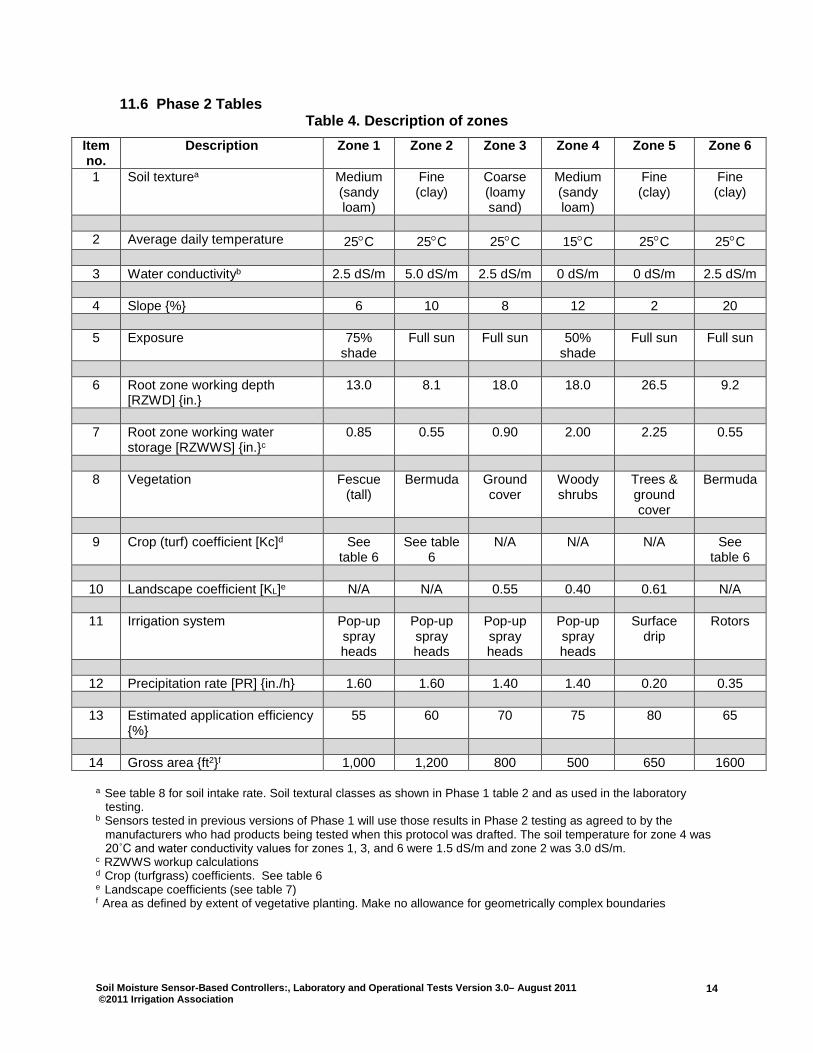
11.6 Phase 2 Tables Table 4. Description of zones
Item no.
Description Zone 1 Zone 2 Zone 3 Zone 4 Zone 5 Zone 6
1 Soil texturea Medium (sandy loam)
Fine (clay)
Coarse (loamy sand)
Medium (sandy loam)
Fine (clay)
Fine (clay)
2 Average daily temperature 25°C 25°C 25°C 15°C 25°C 25°C 3 Water conductivityb 2.5 dS/m 5.0 dS/m 2.5 dS/m 0 dS/m 0 dS/m 2.5 dS/m 4 Slope {%} 6 10 8 12 2 20 5 Exposure 75%
shade Full sun Full sun 50%
shade Full sun Full sun
6 Root zone working depth
[RZWD] {in.} 13.0 8.1 18.0 18.0 26.5 9.2
7 Root zone working water
storage [RZWWS] {in.}c 0.85 0.55 0.90 2.00 2.25 0.55
8 Vegetation Fescue
(tall) Bermuda Ground
cover Woody shrubs
Trees & ground cover
Bermuda
9 Crop (turf) coefficient [Kc]d See
table 6 See table
6 N/A N/A N/A See
table 6
10 Landscape coefficient [KL]e N/A N/A 0.55 0.40 0.61 N/A
11 Irrigation system Pop-up spray heads
Pop-up spray heads
Pop-up spray heads
Pop-up spray heads
Surface drip
Rotors
12 Precipitation rate [PR] {in./h} 1.60 1.60 1.40 1.40 0.20 0.35
13 Estimated application efficiency {%}
55 60 70 75 80 65
14 Gross area {ft2}f 1,000 1,200 800 500 650 1600
a See table 8 for soil intake rate. Soil textural classes as shown in Phase 1 table 2 and as used in the laboratory
testing. b Sensors tested in previous versions of Phase 1 will use those results in Phase 2 testing as agreed to by the
manufacturers who had products being tested when this protocol was drafted. The soil temperature for zone 4 was 20˚C and water conductivity values for zones 1, 3, and 6 were 1.5 dS/m and zone 2 was 3.0 dS/m.
c RZWWS workup calculations d Crop (turfgrass) coefficients. See table 6 e Landscape coefficients (see table 7) f Area as defined by extent of vegetative planting. Make no allowance for geometrically complex boundaries
Soil Moisture Sensor-Based Controllers:, Laboratory and Operational Tests Version 3.0– August 2011 ©2011 Irrigation Association
15
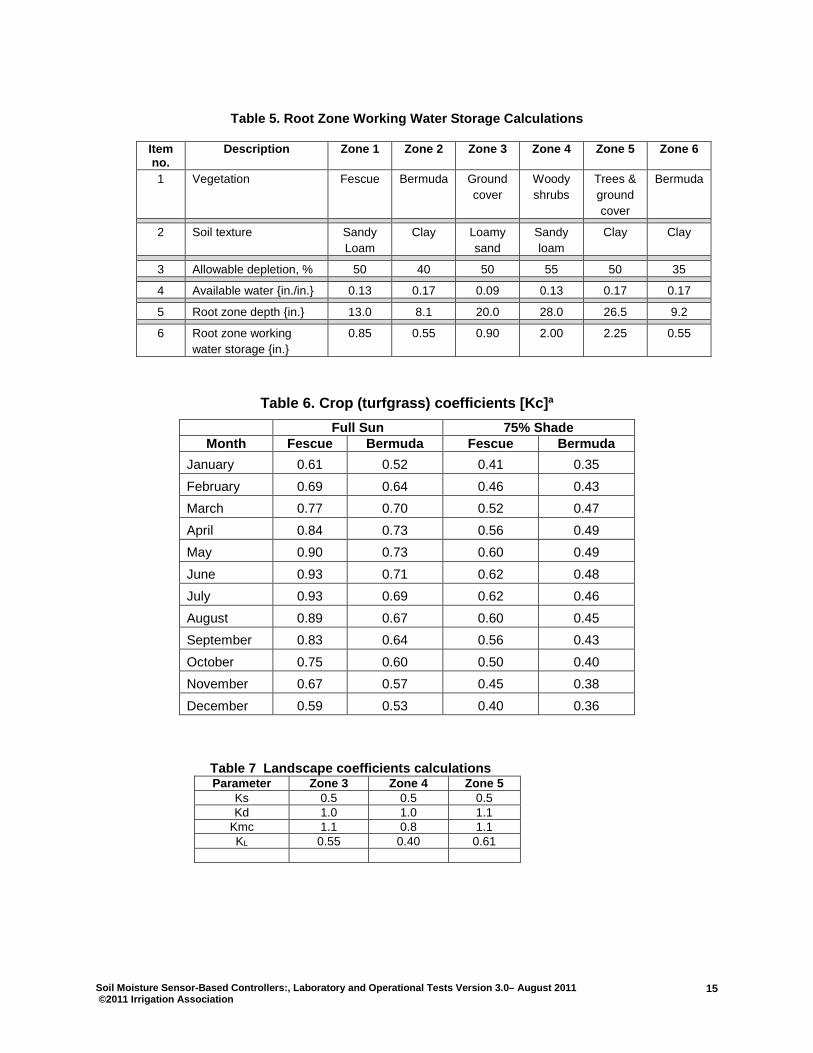
Table 5. Root Zone Working Water Storage Calculations
Item no.
Description Zone 1 Zone 2 Zone 3 Zone 4 Zone 5 Zone 6
1 Vegetation Fescue Bermuda Ground cover
Woody shrubs
Trees & ground cover
Bermuda
2 Soil texture Sandy
Loam Clay Loamy
sand Sandy loam
Clay Clay
3 Allowable depletion, % 50 40 50 55 50 35 4 Available water {in./in.} 0.13 0.17 0.09 0.13 0.17 0.17 5 Root zone depth {in.} 13.0 8.1 20.0 28.0 26.5 9.2 6 Root zone working
water storage {in.} 0.85 0.55 0.90 2.00 2.25 0.55
Table 6. Crop (turfgrass) coefficients [Kc]a Full Sun 75% Shade
Month Fescue Bermuda Fescue Bermuda January 0.61 0.52 0.41 0.35 February 0.69 0.64 0.46 0.43 March 0.77 0.70 0.52 0.47 April 0.84 0.73 0.56 0.49 May 0.90 0.73 0.60 0.49 June 0.93 0.71 0.62 0.48 July 0.93 0.69 0.62 0.46 August 0.89 0.67 0.60 0.45 September 0.83 0.64 0.56 0.43 October 0.75 0.60 0.50 0.40 November 0.67 0.57 0.45 0.38 December 0.59 0.53 0.40 0.36
Table 7 Landscape coefficients calculations
Parameter Zone 3 Zone 4 Zone 5 Ks 0.5 0.5 0.5 Kd 1.0 1.0 1.1
Kmc 1.1 0.8 1.1 KL 0.55 0.40 0.61
Soil Moisture Sensor-Based Controllers:, Laboratory and Operational Tests Version 3.0– August 2011 ©2011 Irrigation Association
16
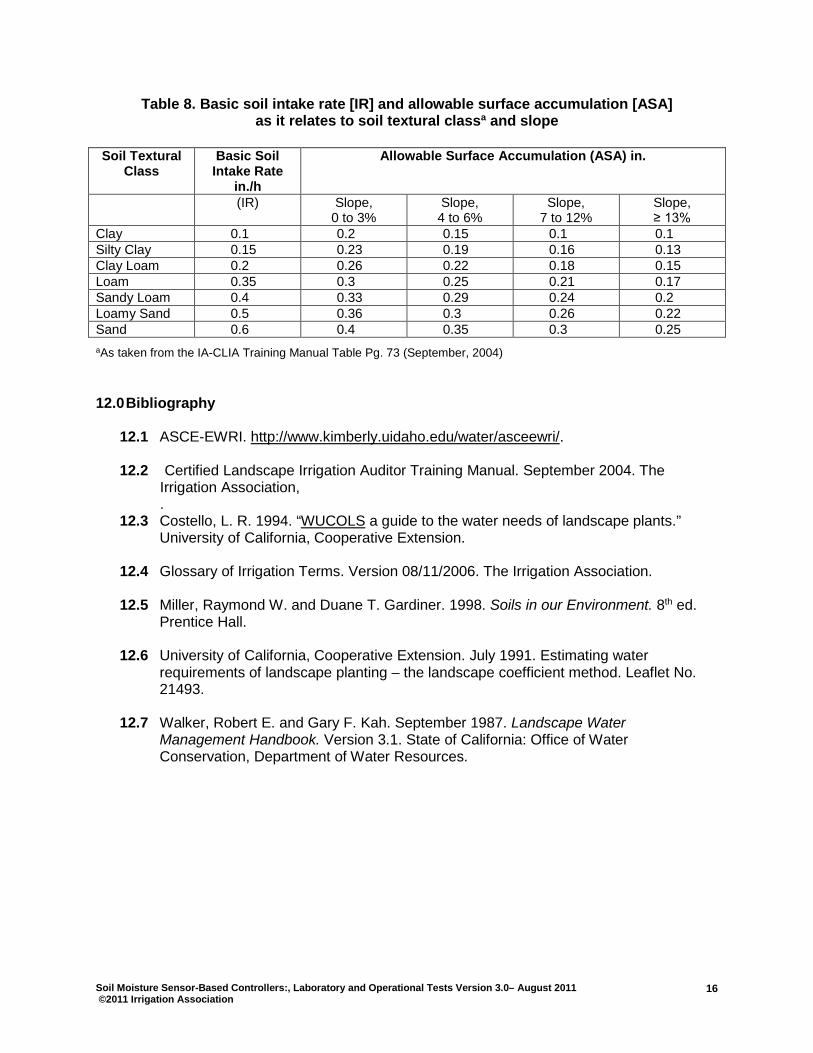
Table 8. Basic soil intake rate [IR] and allowable surface accumulation [ASA] as it relates to soil textural classa and slope
Soil Textural
Class Basic Soil Intake Rate
in./h
Allowable Surface Accumulation (ASA) in.
(IR) Slope, 0 to 3%
Slope, 4 to 6%
Slope, 7 to 12%
Slope, ≥ 13%
Clay 0.1 0.2 0.15 0.1 0.1 Silty Clay 0.15 0.23 0.19 0.16 0.13 Clay Loam 0.2 0.26 0.22 0.18 0.15 Loam 0.35 0.3 0.25 0.21 0.17 Sandy Loam 0.4 0.33 0.29 0.24 0.2 Loamy Sand 0.5 0.36 0.3 0.26 0.22 Sand 0.6 0.4 0.35 0.3 0.25 aAs taken from the IA-CLIA Training Manual Table Pg. 73 (September, 2004)
12.0 Bibliography 12.1 ASCE-EWRI. http://www.kimberly.uidaho.edu/water/asceewri/.
12.2 Certified Landscape Irrigation Auditor Training Manual. September 2004. The Irrigation Association, .
12.3 Costello, L. R. 1994. “WUCOLS a guide to the water needs of landscape plants.” University of California, Cooperative Extension. 12.4 Glossary of Irrigation Terms. Version 08/11/2006. The Irrigation Association.
12.5 Miller, Raymond W. and Duane T. Gardiner. 1998. Soils in our Environment. 8th ed. Prentice Hall.
12.6 University of California, Cooperative Extension. July 1991. Estimating water
requirements of landscape planting – the landscape coefficient method. Leaflet No. 21493.
12.7 Walker, Robert E. and Gary F. Kah. September 1987. Landscape Water
Management Handbook. Version 3.1. State of California: Office of Water Conservation, Department of Water Resources.
Soil Moisture Sensor-Based Controllers:, Laboratory and Operational Tests Version 3.0– August 2011 ©2011 Irrigation Association
17
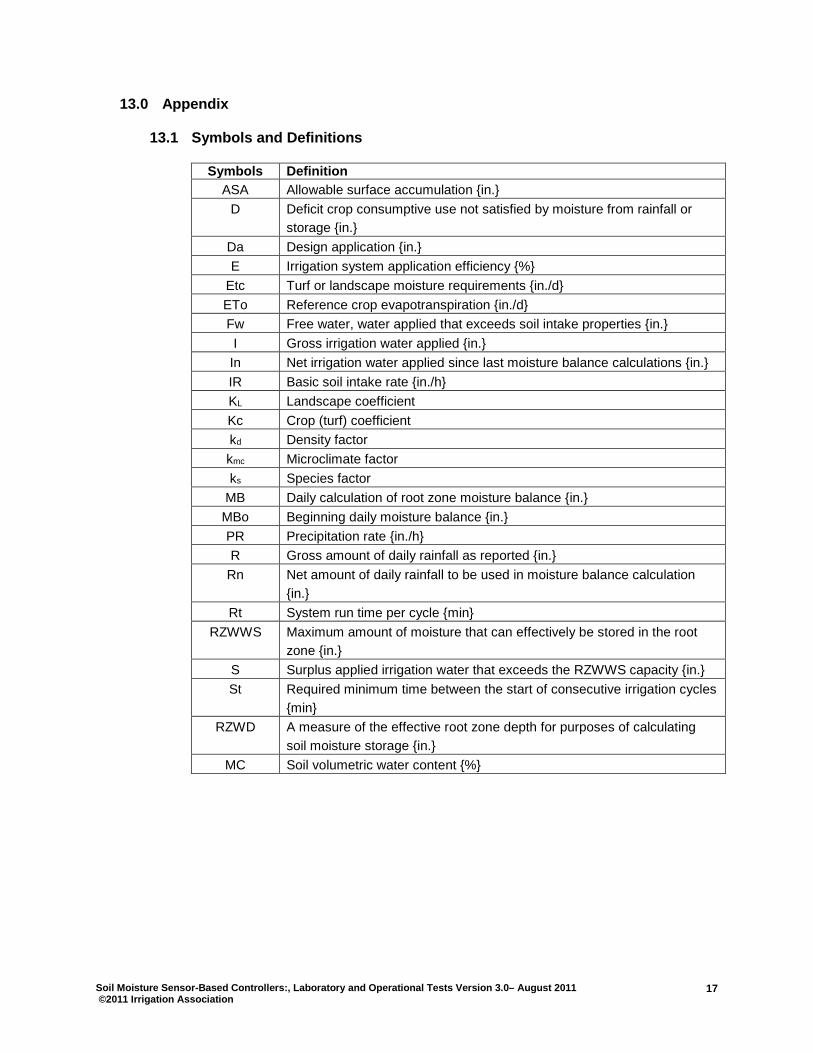
13.0 Appendix 13.1 Symbols and Definitions
Symbols Definition ASA Allowable surface accumulation {in.}
D Deficit crop consumptive use not satisfied by moisture from rainfall or storage {in.}
Da Design application {in.} E Irrigation system application efficiency {%}
Etc Turf or landscape moisture requirements {in./d} ETo Reference crop evapotranspiration {in./d} Fw Free water, water applied that exceeds soil intake properties {in.} I Gross irrigation water applied {in.} In Net irrigation water applied since last moisture balance calculations {in.} IR Basic soil intake rate {in./h} KL Landscape coefficient Kc Crop (turf) coefficient kd Density factor kmc Microclimate factor ks Species factor
MB Daily calculation of root zone moisture balance {in.} MBo Beginning daily moisture balance {in.} PR Precipitation rate {in./h} R Gross amount of daily rainfall as reported {in.}
Rn Net amount of daily rainfall to be used in moisture balance calculation {in.}
Rt System run time per cycle {min} RZWWS Maximum amount of moisture that can effectively be stored in the root
zone {in.} S Surplus applied irrigation water that exceeds the RZWWS capacity {in.} St Required minimum time between the start of consecutive irrigation cycles
{min} RZWD A measure of the effective root zone depth for purposes of calculating
soil moisture storage {in.} MC Soil volumetric water content {%}
Soil Moisture Sensor-Based Controllers:, Laboratory and Operational Tests Version 3.0– August 2011 ©2011 Irrigation Association
18
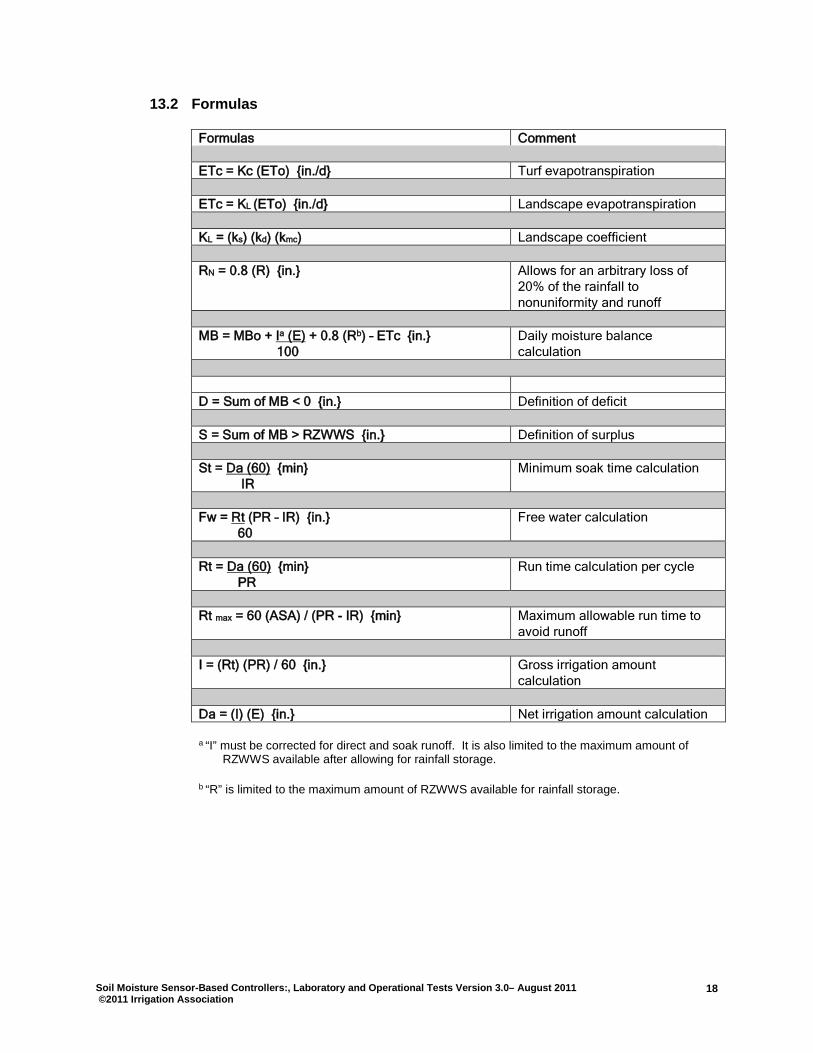
13.2 Formulas
Formulas Comment ETc = Kc (ETo) {in./d} Turf evapotranspiration ETc = KL (ETo) {in./d} Landscape evapotranspiration KL = (ks) (kd) (kmc) Landscape coefficient RN = 0.8 (R) {in.} Allows for an arbitrary loss of
20% of the rainfall to nonuniformity and runoff
MB = MBo + Ia (E) + 0.8 (Rb) – ETc {in.} 100
Daily moisture balance calculation
D = Sum of MB < 0 {in.} Definition of deficit S = Sum of MB > RZWWS {in.} Definition of surplus St = Da (60) {min} IR
Minimum soak time calculation
Fw = Rt (PR – IR) {in.} 60
Free water calculation
Rt = Da (60) {min} PR
Run time calculation per cycle
Rt max = 60 (ASA) / (PR - IR) {min} Maximum allowable run time to
avoid runoff I = (Rt) (PR) / 60 {in.} Gross irrigation amount
calculation Da = (I) (E) {in.} Net irrigation amount calculation a “I” must be corrected for direct and soak runoff. It is also limited to the maximum amount of RZWWS available after allowing for rainfall storage. b “R” is limited to the maximum amount of RZWWS available for rainfall storage.
Soil Moisture Sensor-Based Controllers:, Laboratory and Operational Tests Version 3.0– August 2011 ©2011 Irrigation Association
19
13.3 Soil Containment Box Drawing No. 1000-8 (12/2005)
Soil Moisture Sensor-Based Controllers:, Laboratory and Operational Tests Version 3.0– August 2011 ©2011 Irrigation Association
20
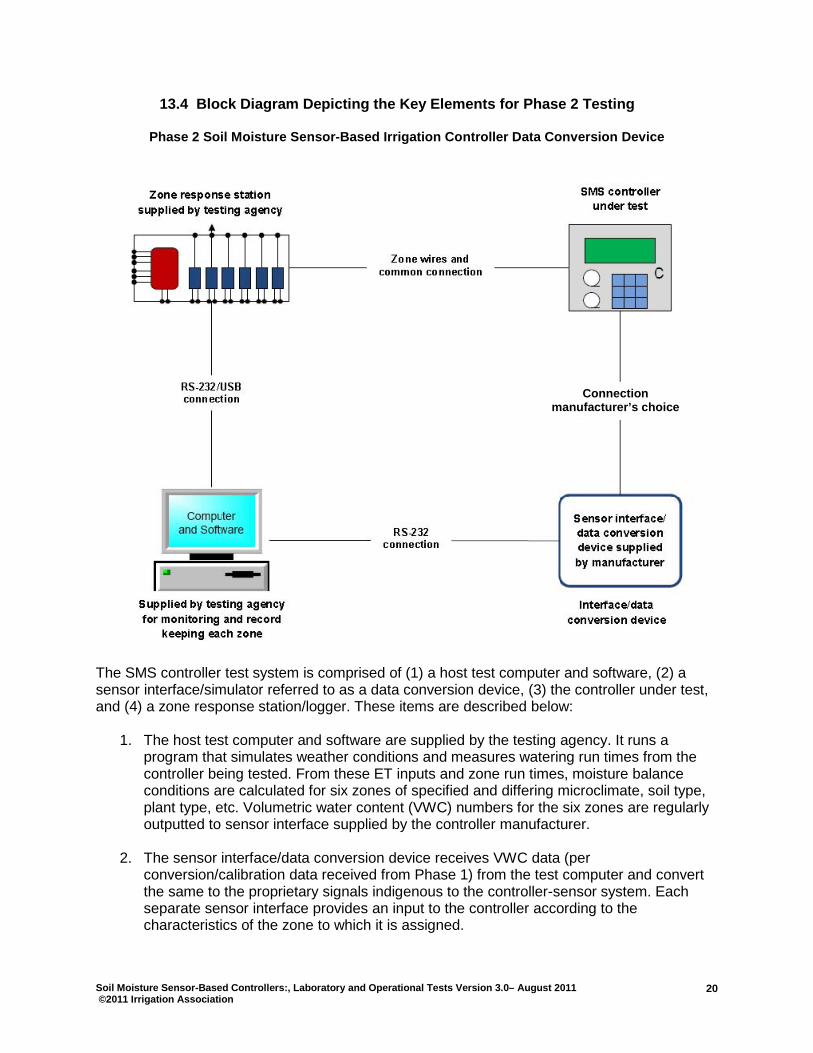
13.4 Block Diagram Depicting the Key Elements for Phase 2 Testing
Phase 2 Soil Moisture Sensor-Based Irrigation Controller Data Conversion Device
The SMS controller test system is comprised of (1) a host test computer and software, (2) a sensor interface/simulator referred to as a data conversion device, (3) the controller under test, and (4) a zone response station/logger. These items are described below:
1. The host test computer and software are supplied by the testing agency. It runs a program that simulates weather conditions and measures watering run times from the controller being tested. From these ET inputs and zone run times, moisture balance conditions are calculated for six zones of specified and differing microclimate, soil type, plant type, etc. Volumetric water content (VWC) numbers for the six zones are regularly outputted to sensor interface supplied by the controller manufacturer.
2. The sensor interface/data conversion device receives VWC data (per
conversion/calibration data received from Phase 1) from the test computer and convert the same to the proprietary signals indigenous to the controller-sensor system. Each separate sensor interface provides an input to the controller according to the characteristics of the zone to which it is assigned.
Connection manufacturer’s choice
Soil Moisture Sensor-Based Controllers:, Laboratory and Operational Tests Version 3.0– August 2011 ©2011 Irrigation Association
21
3. The controller under test receives signals from its sensors or sensor and makes its own proprietary decisions regarding zone irrigation start and run times. It applies 24 volts ac to the zone solenoid valves in accordance to those determinations.
4. The zone response station/logger consisting of relays for each zone and a logger
provide the start and run time data for each zone and pass the same to the test computer. From that timing information and the specified precipitation rate and infiltration rate for each zone, the test computer determines the amount of water applied to the root zone of each zone and the amount that would have been lost through runoff.
To provide a standard for manufacturers to follow in connecting to the test setup, the following communications and hardware conventions are proposed:
• connection from the tested controller to the valve sense transducers
Seven wires from the transducer set connect into the terminals of the controller. These wires are multicolored with white used as the common wire. The wire size is 18 gauge. The wire bundle from the transducer is 1 meter long.
• connection from the test computer to the sensor emulators
RS-232 Serial Cable from the test computer to the sensor interface The interface end of the cable is terminated in a male DB-9 connector — requiring a female DB-9 connector on the sensor emulator.
The communications protocol is as follows: 9600 baud, 8-bit ascii data, no parity, no handshake, one stop bit The format of the data sent to the sensor interface from the test computer is as follows: AMMM.M<cr> where:
A and M are ASCII characters with A representing the sensor number or address and M representing the VWC content of the soil expressed as percent. The VWC field contains up to four ASCII digits and a decimal point. The transmission is terminated by an ASCII carriage return.
Upon receipt of the moisture data the interface returns the data back to the test computer exactly as it received it. That provides an acknowledgement that the data was received. For controllers supporting only one sensor, “1” is the address. For controllers supporting multiple sensors the address ranges from 1 to 6. In this case, the interface must be designed as a multiple channel device accepting multiple moisture readings from the test computer over a common RS232 interface and forwarding multiple emulated signals to the controller under test.