Embed Size (px)
Citation preview
Smarter Balanced Adaptive
Item Selection Algorithm
Design Report
Preview Release 16 May 2014
Jon Cohen and Larry Albright
American Institutes for Research
Produced for Smarter Balanced by the American
Institutes for Research
This work is licensed under a Creative Commons
Attribution-NoDerivatives 4.0 International License.
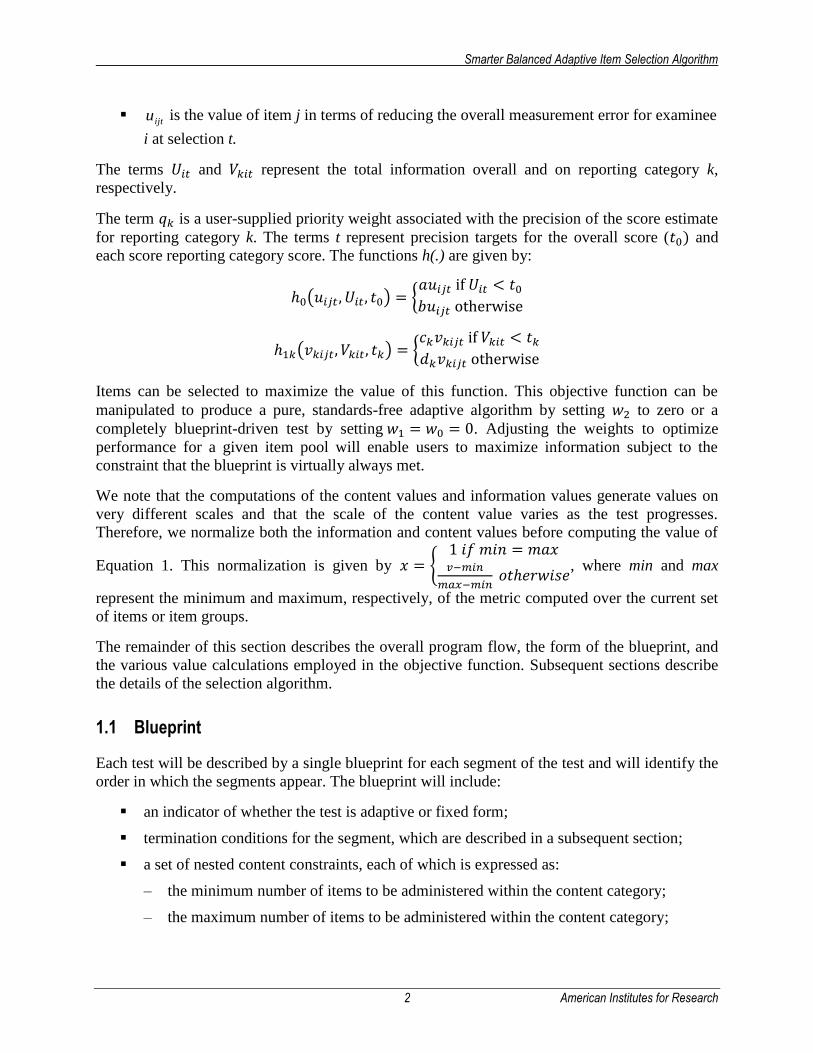
Smarter Balanced Adaptive Item Selection Algorithm
i American Institutes for Research
TABLE OF CONTENTS
1. INTRODUCTION, BACKGROUND, AND DEFINITIONS...................................................1
1.1 Blueprint ..............................................................................................................................2
1.2 Content Value ......................................................................................................................3 1.2.1 Content Value for Single Items................................................................................3 1.2.2 Content Value for Sets of Items ...............................................................................4
1.3 Information Value ................................................................................................................6 1.3.1 Individual Information Value ..................................................................................6 1.3.2 Binary Items .............................................................................................................6 1.3.3 Polytomous Items.....................................................................................................6
1.3.4 Item Group Information Value ................................................................................9
2. ENTRY AND INITIALIZATION .............................................................................................9
2.1 Item Pool Selection ..............................................................................................................9
2.2 Adjust Segment Length........................................................................................................9
2.3 Initialization of Starting Theta Estimates ..........................................................................10
2.4 Insertion of Embedded Field-Test Items............................................................................10
3. ITEM SELECTION .................................................................................................................11
3.1 Trimming the Custom Item Pool .......................................................................................12
3.2 Recycling Algorithm ..........................................................................................................13
3.3 Adaptive Item Selection .....................................................................................................13
3.4 Selection of the Initial Item................................................................................................14
3.5 Exposure Control………………………………………………………………………...12
4. TERMINATION ......................................................................................................................14
A1. DEFINITIONS OF USER-SETTABLE PARAMETERS ......................................................15
A2. API ..........................................................................................................................................16
A3. SUPPORTING DATA STRUCTURES .................................................................................16

Smarter Balanced Adaptive Item Selection Algorithm
1 American Institutes for Research
SMARTER BALANCED ADAPTIVE ITEM SELECTION ALGORITHM
1. INTRODUCTION, BACKGROUND, AND DEFINITIONS
This document describes the Smarter Balanced adaptive item selection algorithm. The item
selection algorithm is designed to cover a standards-based blueprint, which may include content,
cognitive complexity, and item type constraints. The item selection algorithm will also include:
the ability to customize an item pool based on access constraints and screen items that
have been previously viewed or may not be accessible for a given individual;
a mechanism for inserting embedded field-test items; and
a mechanism for delivering “segmented” tests in which separate parts of the test are
administered in a fixed order.
This document describes the algorithm and the design for its implementation for the Smarter
Balanced Test Delivery System. The implementation builds extensively on the algorithm
implemented in AIR’s Test Delivery System. The implementation described is released under a
Creative Commons Attribution, No Derivatives license.
The general approach described here is based on a highly parameterized multiple-objective
utility function. The objective function includes:
a measure of content match to the blueprint;
a measure of overall test information; and
measures of test information for each reporting category on the test.
We define an objective function that measures an item’s contribution to each of these objectives,
weighting them to achieve the desired balance among them. Equation 1 sketches this objective
function for a single item.
),,(),,(1
000
1
11
1
1
2 tUuhwtVvhqwdps
d
wf itijt
K
k
kkitkijtkk
R
r
rjrritR
r
rj
ijt
(1)
where the terms w represent user-supplied weights that assign relative importance to meeting
each of the objectives, rjd indicates whether item j has the blueprint-specified feature r, and 𝑝𝑟 is
the user-supplied priority weight for feature r. The term 𝑠𝑟𝑖𝑡 is an adaptive control parameter that
is described below. In general, 𝑠𝑟𝑖𝑡 increases for features that have not met their designated
minimum as the end of the test approaches.
The remainder of the terms represents an item’s contribution to measurement precision:
kijtv is the value of item j toward reducing the measurement error for reporting category k
for examinee i at selection t; and
Smarter Balanced Adaptive Item Selection Algorithm
2 American Institutes for Research
ijtu is the value of item j in terms of reducing the overall measurement error for examinee
i at selection t.
The terms 𝑈𝑖𝑡 and 𝑉𝑘𝑖𝑡 represent the total information overall and on reporting category k,
respectively.
The term 𝑞𝑘 is a user-supplied priority weight associated with the precision of the score estimate
for reporting category k. The terms t represent precision targets for the overall score (𝑡0) and
each score reporting category score. The functions h(.) are given by:
ℎ0(𝑢𝑖𝑗𝑡 , 𝑈𝑖𝑡, 𝑡0) = {𝑎𝑢𝑖𝑗𝑡 if 𝑈𝑖𝑡 < 𝑡0
𝑏𝑢𝑖𝑗𝑡 otherwise
ℎ1𝑘(𝑣𝑘𝑖𝑗𝑡, 𝑉𝑘𝑖𝑡, 𝑡𝑘) = {𝑐𝑘𝑣𝑘𝑖𝑗𝑡 if 𝑉𝑘𝑖𝑡 < 𝑡𝑘
𝑑𝑘𝑣𝑘𝑖𝑗𝑡 otherwise
Items can be selected to maximize the value of this function. This objective function can be
manipulated to produce a pure, standards-free adaptive algorithm by setting 𝑤2 to zero or a
completely blueprint-driven test by setting 𝑤1 = 𝑤0 = 0. Adjusting the weights to optimize
performance for a given item pool will enable users to maximize information subject to the
constraint that the blueprint is virtually always met.
We note that the computations of the content values and information values generate values on
very different scales and that the scale of the content value varies as the test progresses.
Therefore, we normalize both the information and content values before computing the value of
Equation 1. This normalization is given by 𝑥 = {1 𝑖𝑓 𝑚𝑖𝑛 = 𝑚𝑎𝑥𝑣−𝑚𝑖𝑛
𝑚𝑎𝑥−𝑚𝑖𝑛 𝑜𝑡ℎ𝑒𝑟𝑤𝑖𝑠𝑒
, where min and max
represent the minimum and maximum, respectively, of the metric computed over the current set
of items or item groups.
The remainder of this section describes the overall program flow, the form of the blueprint, and
the various value calculations employed in the objective function. Subsequent sections describe
the details of the selection algorithm.
1.1 Blueprint
Each test will be described by a single blueprint for each segment of the test and will identify the
order in which the segments appear. The blueprint will include:
an indicator of whether the test is adaptive or fixed form;
termination conditions for the segment, which are described in a subsequent section;
a set of nested content constraints, each of which is expressed as:
– the minimum number of items to be administered within the content category;
– the maximum number of items to be administered within the content category;
Smarter Balanced Adaptive Item Selection Algorithm
3 American Institutes for Research
– an indication of whether the maximum should be deterministically enforced (a
“strict” maximum);
– a priority weight for the content category 𝑝𝑟;
– an explicit indicator as to whether this content category is a reporting category; and
– an explicit precision-priority weight (𝑞𝑘) for each group identified as a reporting
category.
a set of non-nested content constraints, which are represented as:
– a name for the collection of items meeting the constraint;
– the minimum number of items to be administered from this group of items;
– the maximum number of items to be administered from this group of items;
– an indication of whether the maximum should be deterministically enforced (a
“strict” maximum);
– a priority weight for the group of items 𝑝𝑟;
– an explicit indicator as to whether this named group will make up a reporting
category; and
– an explicit precision-priority weight (𝑞𝑘) for each group identified as a reporting
category.
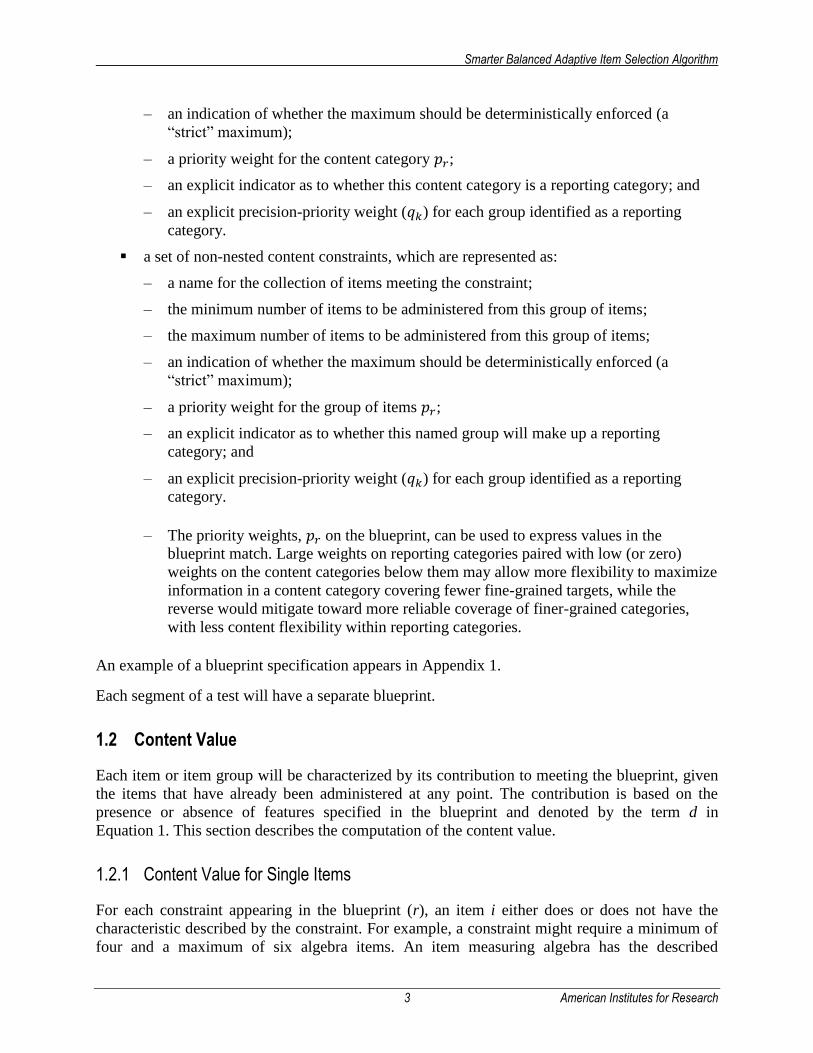
– The priority weights, 𝑝𝑟 on the blueprint, can be used to express values in the
blueprint match. Large weights on reporting categories paired with low (or zero)
weights on the content categories below them may allow more flexibility to maximize
information in a content category covering fewer fine-grained targets, while the
reverse would mitigate toward more reliable coverage of finer-grained categories,
with less content flexibility within reporting categories.
An example of a blueprint specification appears in Appendix 1.
Each segment of a test will have a separate blueprint.
1.2 Content Value
Each item or item group will be characterized by its contribution to meeting the blueprint, given
the items that have already been administered at any point. The contribution is based on the
presence or absence of features specified in the blueprint and denoted by the term d in
Equation 1. This section describes the computation of the content value.
1.2.1 Content Value for Single Items
For each constraint appearing in the blueprint (r), an item i either does or does not have the
characteristic described by the constraint. For example, a constraint might require a minimum of
four and a maximum of six algebra items. An item measuring algebra has the described

Smarter Balanced Adaptive Item Selection Algorithm
4 American Institutes for Research
characteristic, and an item measuring geometry but algebra does not. To capture this constraint,
we define the following:
𝑑𝑖 is a feature vector in which the elements are 𝑑𝑖𝑟, summarizing item i’s contribution to
meeting the blueprint. This feature vector includes content categories such as claims and
targets as well as other features of the blueprint, such as Depth of Knowledge and item
type.
𝑆𝑖𝑡 is a diagonal matrix, the diagonal elements of which are the adaptive control
parameters 𝑠𝑟𝑖𝑡.
𝑝 is the vector containing the user-supplied priority weights 𝑝𝑟.
The scalar content value for an item is given by 𝐶𝑖𝑗𝑡 = 𝑑𝑖
′𝑆𝑖𝑡𝑝.
Letting 𝑧𝑟𝑖𝑡 represent the number of items with feature r administered to student i by iteration t,
the value of the adaptive control parameters is:
ritrritr
rritr
rr
rrit
rr
r
ritit
rit
zMaxifzMax
MaxzMinifMinMax
Minz
MinzifMin
zm
s
1
1
2
The blueprint defines the minimum (𝑀𝑖𝑛𝑟) and maximum (𝑀𝑎𝑥𝑟) number of items to be
administered with each characteristic (r).
The term tT
Tmit
where T is the total test length. This has the effect of increasing the
algorithm’s preference for items that have not yet met their minimums as the end of the test nears
and the opportunities to meet the minimum diminish.
This increases the likelihood of selecting items for content that has not met its minimum as the
opportunities to do so are used up. The value s is highest for items with content that has not met
its minimum, declines for items representing content for which the minimum number of items
has been reached but the maximum has not, and turns negative for items representing content
that has met the maximum.
1.2.2 Content Value for Sets of Items
Calculation of the content value of sets of items is complicated by two factors:
1. The desire to allow more items to be developed for each set and to have the most
advantageous set of items administered
Smarter Balanced Adaptive Item Selection Algorithm
5 American Institutes for Research
2. The design objective of characterizing the information contribution of a set of items as
the expected information over the working theta distribution for the examinee
The former objective is believed to enhance the ability to satisfy highly constrained blueprints
while still adapting to obtain good measurement for a broad range of students. The latter arises
from the recognition that ELA tests will select one set of items at a time, without an opportunity
to adapt once the passage has been selected.
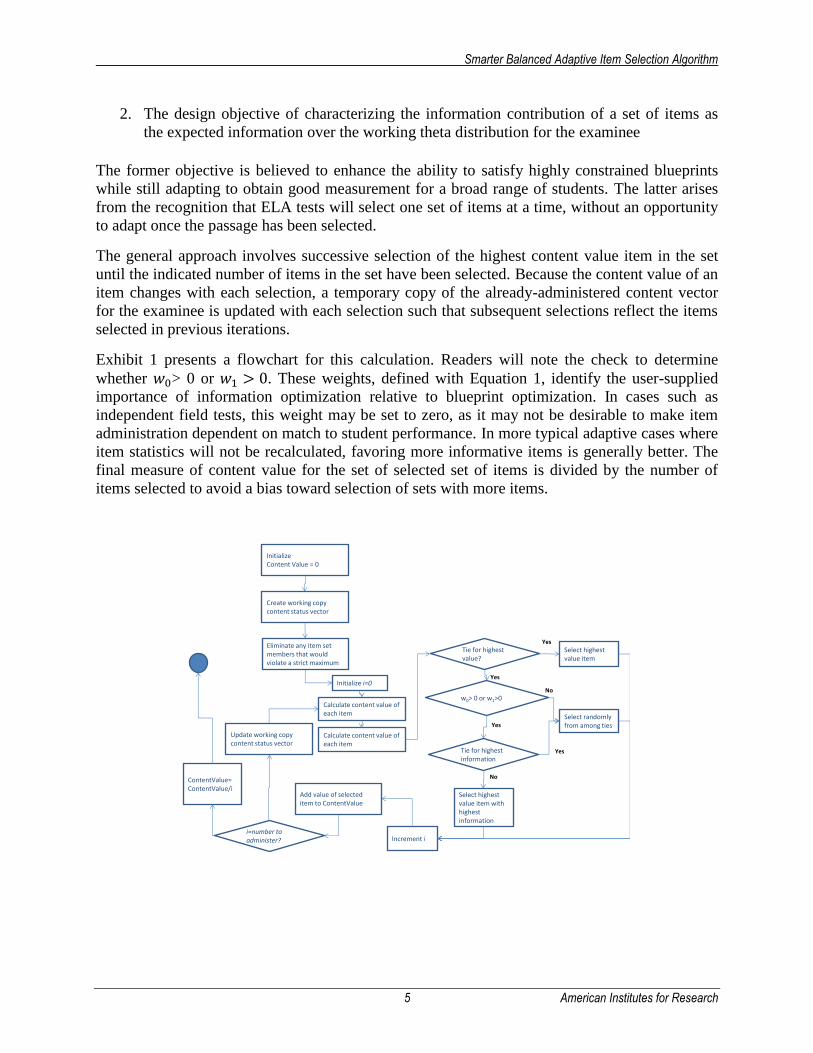
The general approach involves successive selection of the highest content value item in the set
until the indicated number of items in the set have been selected. Because the content value of an
item changes with each selection, a temporary copy of the already-administered content vector
for the examinee is updated with each selection such that subsequent selections reflect the items
selected in previous iterations.
Exhibit 1 presents a flowchart for this calculation. Readers will note the check to determine
whether 𝑤0> 0 or 𝑤1 > 0. These weights, defined with Equation 1, identify the user-supplied
importance of information optimization relative to blueprint optimization. In cases such as
independent field tests, this weight may be set to zero, as it may not be desirable to make item
administration dependent on match to student performance. In more typical adaptive cases where
item statistics will not be recalculated, favoring more informative items is generally better. The
final measure of content value for the set of selected set of items is divided by the number of
items selected to avoid a bias toward selection of sets with more items.
ContentValue= ContentValue/i
Initialize Content Value = 0
Add value of selected item to ContentValue
Calculate content value of each item
Eliminate any item set members that would violate a strict maximum
Initialize i=0
Create working copy content status vector
Calculate content value of each item
Tie for highest value?
Tie for highest information
Increment i
Select highest value item
Select highest value item with highest information
Select randomly from among ties
i=number to administer?
Update working copy content status vector
Yes
Now0> 0 or w1>0
Yes
Yes
Yes
No
Smarter Balanced Adaptive Item Selection Algorithm
6 American Institutes for Research
Exhibit 1. Content Value Calculation for Item Sets
1.3 Information Value
Each item or item group also has value in terms of maximizing information, both overall and on
reporting categories.
1.3.1 Individual Information Value
The information value associated with an item will be an approximation of information. The
system will be designed to use generalized IRT models; however, it will treat all items as though
they offer equal measurement precision. This is the assumption made by the Rasch model, but in
more general models, items known to offer better measurement are given preference by many
algorithms. Subsequent algorithms are then required to control the exposure of the items that
measure best. Ignoring the differences in slopes serves to eliminate this bias and help equalize
exposure.
1.3.2 Binary Items
The approximate information value of a binary item will be characterized as 𝐼𝑗(𝜃) = 𝑝𝑗(𝜃)(1 −
𝑝𝑗(𝜃)), where the slope parameters are artificially replaced with a constant.
1.3.3 Polytomous Items
In terms of information, the best polytomous item in the pool is the one that maximizes the
expected information, 𝐼𝑗(𝜃). Formally, 𝐼𝑗(𝜃) > 𝐼𝑘(𝜃) for all items 𝑘 ≠ 𝑗. The true value 𝜃,
however, remains unknown and is accessed only through an estimate, 𝜃~𝑁(�̅�, 𝜎𝜃). By definition
of an expectation, the expected information 𝐼𝑗(𝜃) = ∫ 𝐼𝑗(𝑡)𝑓(𝑡|�̅�, 𝜎𝜃)𝑑𝑡.
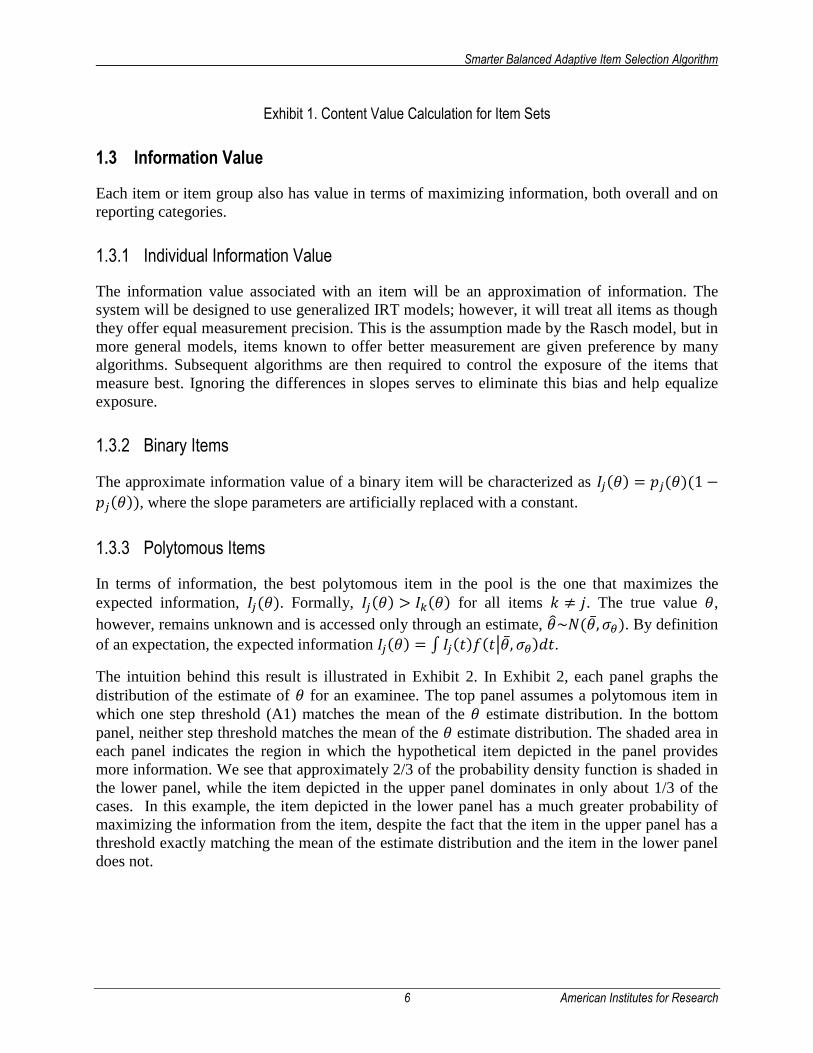
The intuition behind this result is illustrated in Exhibit 2. In Exhibit 2, each panel graphs the
distribution of the estimate of 𝜃 for an examinee. The top panel assumes a polytomous item in
which one step threshold (A1) matches the mean of the 𝜃 estimate distribution. In the bottom
panel, neither step threshold matches the mean of the 𝜃 estimate distribution. The shaded area in
each panel indicates the region in which the hypothetical item depicted in the panel provides
more information. We see that approximately 2/3 of the probability density function is shaded in
the lower panel, while the item depicted in the upper panel dominates in only about 1/3 of the
cases. In this example, the item depicted in the lower panel has a much greater probability of
maximizing the information from the item, despite the fact that the item in the upper panel has a
threshold exactly matching the mean of the estimate distribution and the item in the lower panel
does not.
Smarter Balanced Adaptive Item Selection Algorithm
7 American Institutes for Research
Exhibit 2. Two example items, with the shaded region showing the probability that the item maximizes information for the examinee depicted.
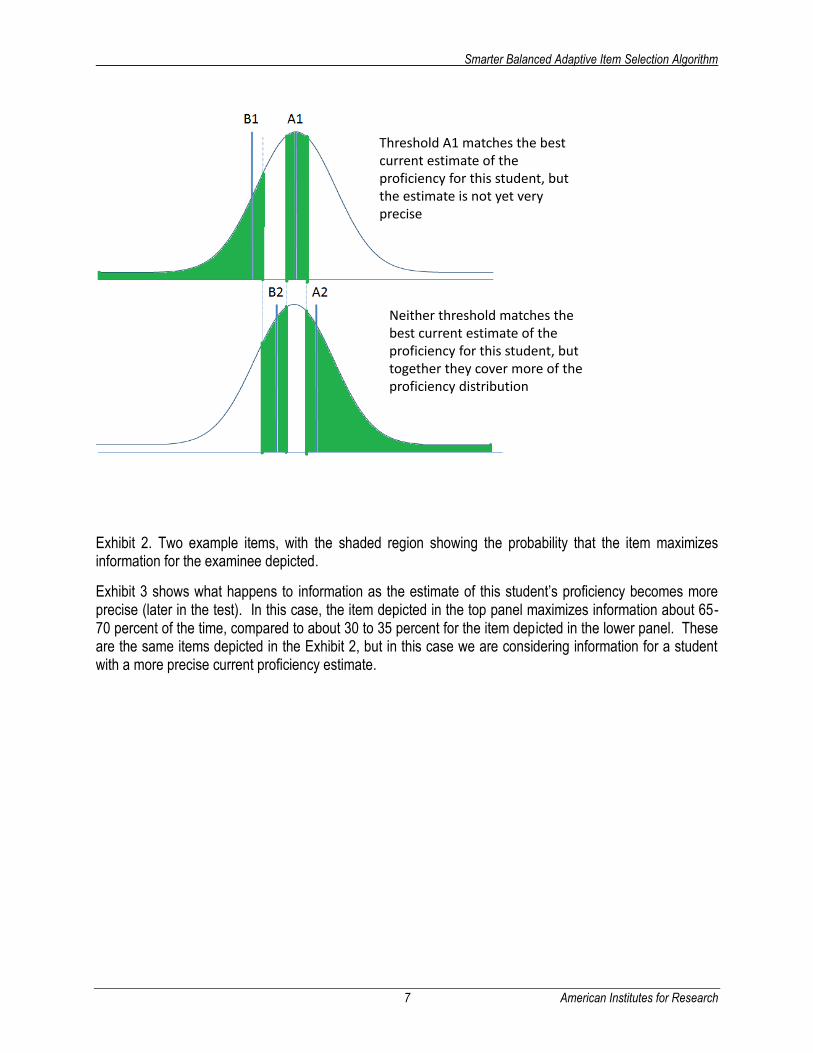
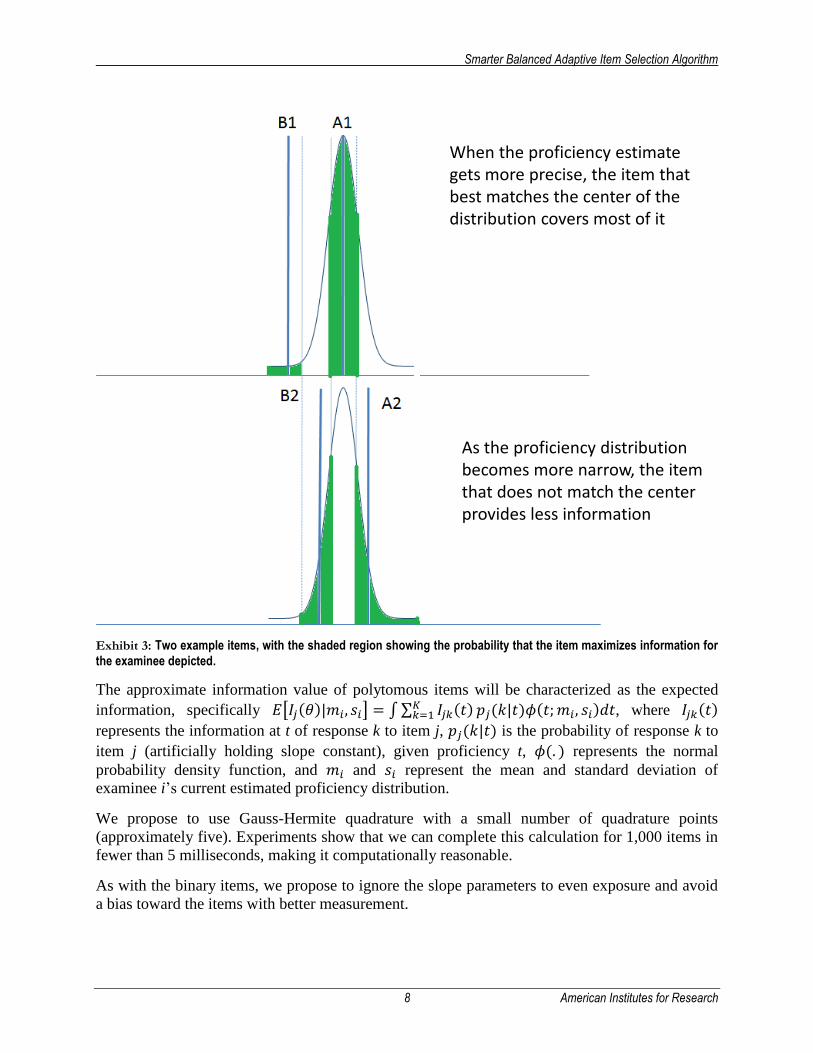
Exhibit 3 shows what happens to information as the estimate of this student’s proficiency becomes more precise (later in the test). In this case, the item depicted in the top panel maximizes information about 65-70 percent of the time, compared to about 30 to 35 percent for the item depicted in the lower panel. These are the same items depicted in the Exhibit 2, but in this case we are considering information for a student with a more precise current proficiency estimate.
Threshold A1 matches the best current estimate of the proficiency for this student, but the estimate is not yet very precise
Neither threshold matches the best current estimate of the proficiency for this student, but together they cover more of the proficiency distribution
Smarter Balanced Adaptive Item Selection Algorithm
8 American Institutes for Research
Exhibit 3: Two example items, with the shaded region showing the probability that the item maximizes information for
the examinee depicted.
The approximate information value of polytomous items will be characterized as the expected
information, specifically 𝐸[𝐼𝑗(𝜃)|𝑚𝑖, 𝑠𝑖] = ∫ ∑ 𝐼𝑗𝑘(𝑡)𝐾𝑘=1 𝑝𝑗(𝑘|𝑡)𝜙(𝑡; 𝑚𝑖, 𝑠𝑖)𝑑𝑡, where 𝐼𝑗𝑘(𝑡)
represents the information at t of response k to item j, 𝑝𝑗(𝑘|𝑡) is the probability of response k to
item j (artificially holding slope constant), given proficiency t, 𝜙(. ) represents the normal
probability density function, and 𝑚𝑖 and 𝑠𝑖 represent the mean and standard deviation of
examinee i’s current estimated proficiency distribution.
We propose to use Gauss-Hermite quadrature with a small number of quadrature points
(approximately five). Experiments show that we can complete this calculation for 1,000 items in
fewer than 5 milliseconds, making it computationally reasonable.
As with the binary items, we propose to ignore the slope parameters to even exposure and avoid
a bias toward the items with better measurement.
When the proficiency estimate gets more precise, the item that best matches the center of the distribution covers most of it
As the proficiency distribution becomes more narrow, the item that does not match the center provides less information
Smarter Balanced Adaptive Item Selection Algorithm
9 American Institutes for Research
1.3.4 Item Group Information Value
Item groups differ from individual items in that a set of items will be selected for administration.
Therefore, the goal is to maximize information across the working theta distribution. As with the
polytomous items, we propose to use Gauss-Hermite quadrature to estimate the expected
information of the item group.
In the case of multiple-item groups
𝐸[𝐼𝑔(𝜃)|𝑚𝑖, 𝑠𝑖] =1
𝐽𝑔∫ ∑ 𝐼𝑔(𝑗)(𝑡)
𝐽𝑔
𝑗=1
𝜙(𝑡; 𝑚𝑖 , 𝑠𝑖)𝑑𝑡
Where 𝐼𝑔(. ) is the information from item group g, 𝐼𝑔(𝑗) is the information associated with
item𝑗 ∈ 𝑔, for the 𝐽𝑔 items in set g. In the case of polytomous items, we use the expected
information, as described above.
2. ENTRY AND INITIALIZATION
At startup, the system will
create a custom item pool;
initialize theta estimates for the overall score and each score point; and
insert embedded field-test items.
2.1 Item Pool
At test startup the system will generate a custom item pool, a string of item IDs for which the
student is eligible. This item pool will include all items that
are active in the system at test startup; and
are not flagged as “access limited” for attributes associated with this student.
The list will be stored in ascending order of ID.
2.2 Adjust Segment Length
Custom item pools run the risk of being unable to meet segment blueprint minimums. To address
this special case, the algorithm will adjust the blueprint to be consistent with the custom item
pool. This capability becomes necessary when an accommodated item pool systematically
excludes some content.
Let
S be the set of top-level content constraints in the hierarchical set of constraints, each
consisting of the tuple (name, min, max, n);
Smarter Balanced Adaptive Item Selection Algorithm
10 American Institutes for Research
C be the custom item pool, each element consisting of a set of content constraints B;
f, p integers represent item shortfall and pool count, respectively; and
t be the minimum required items on the segment.
For each s in S, compute n as the sum of active operational items in C classified on the
constraint.
f = summation over S (min – n)
p = summation over S (n)
if t – f < p, then t = t – f
2.3 Initialization of Starting Theta Estimates
The user will supply five pieces of information in the test configuration:
1. A default starting value if no other information is available
2. An indication whether prior scores on the same test should be used, if available
3. Optionally, the test ID of another test that can supply a starting value, along with
4. Slope and intercept parameters to adjust the scale of the value to transform it to the scale
of the target test
5. A constant prior variance for use in calculation of working EAP scores
2.4 Insertion of Embedded Field-Test Items
Each blueprint will specify
the number of field-test items to be administered on each test;
the first item position into which a field-test item may be inserted; and
the last item position into which a field-test item may be inserted.
Upon startup, select randomly from among the field-test items or item sets until the system has
selected the specified number of field-test items. If the items are in sets, the sets will be
administered as a complete set, and this may lead to more than the specified number of items
administered.
The probability of selection will be given by 𝑝𝑗 =∑ 𝐾𝑗
𝐾𝑗=1
∑ 𝑎𝑗𝐾𝑗𝐾𝑗=1
𝑎𝑗𝐾𝑗𝑚
𝑁𝐽, where
𝑝𝑗 represents the probability of selecting the item;
𝑚 is the targeted number of field-test items;
Smarter Balanced Adaptive Item Selection Algorithm
11 American Institutes for Research
𝑁𝑗 is the total number of active items in the field-test pool;
𝐾𝑗 is the number of items in item set j; and
𝑎𝑗 is a user-supplied weight associated with each item (or item set) to adjust the relative
probability of selection.
The 𝑎𝑗 variables are included to allow for operational cases in which some items must complete
field-testing sooner, or enter field-testing later. While using this parameter presents some
statistical risk, not doing so poses operational risks.
For each item set, generate a uniform random number 𝑟𝑗 on the interval {0,1}. Sort the items in
ascending order by 𝑟𝑗
𝑝𝑗. Sequentially select items, summing the number of items in the set. Stop
the selection of field-test items once 𝐹𝑇𝑁𝑀𝑖𝑛 ≤ 𝑚 ≤ 𝐹𝑇𝑁𝑀𝑎𝑥 = ∑ 𝐾𝑗𝑗=0 .
Next, each item is assigned to a position on the test. To do so, select a starting position within
𝑓 − 𝐹𝑇𝑀𝑎𝑥 − 𝐹𝑇𝑀𝑖𝑛 positions from FTMin, where FTMax is the maximum allowable position
for field-test items and FTMin is the minimum allowable position for field-test items. FTNMin
and FTNMax refer to the minimum and maximum number of field-test items, respectively.
Distribute the items evenly within these positions.
3. ITEM SELECTION
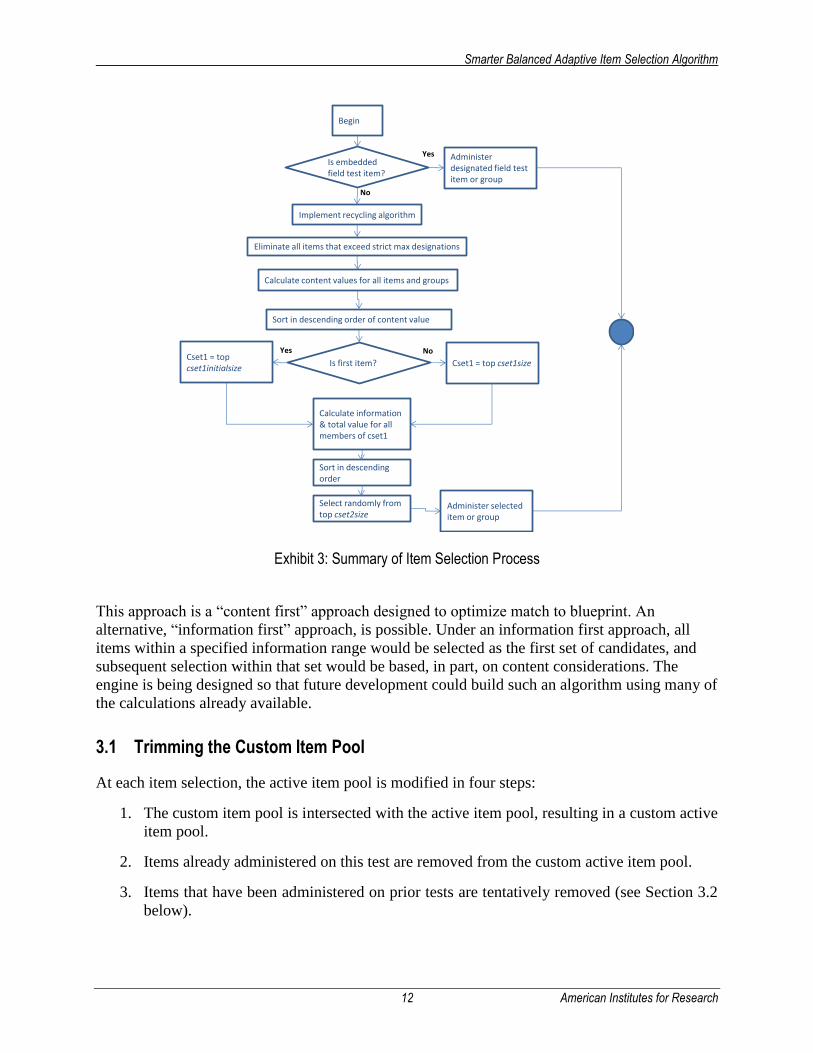
Exhibit 3 summarizes the item selection process. If the item position has been designated for a
field-test item, administer that item. Otherwise, the adaptive algorithm kicks in.
Smarter Balanced Adaptive Item Selection Algorithm
12 American Institutes for Research
Exhibit 3: Summary of Item Selection Process
This approach is a “content first” approach designed to optimize match to blueprint. An
alternative, “information first” approach, is possible. Under an information first approach, all
items within a specified information range would be selected as the first set of candidates, and
subsequent selection within that set would be based, in part, on content considerations. The
engine is being designed so that future development could build such an algorithm using many of
the calculations already available.
3.1 Trimming the Custom Item Pool
At each item selection, the active item pool is modified in four steps:
1. The custom item pool is intersected with the active item pool, resulting in a custom active
item pool.
2. Items already administered on this test are removed from the custom active item pool.
3. Items that have been administered on prior tests are tentatively removed (see Section 3.2
below).
Begin
Is embedded field test item?
Yes
No
Is first item?
Calculate content values for all items and groups
Administer designated field test item or group
Sort in descending order of content value
Cset1 = top cset1initialsize
Cset1 = top cset1size
Calculate information & total value for all members of cset1
Sort in descending order
Select randomly from top cset2size
Administer selected item or group
NoYes
Eliminate all items that exceed strict max designations
Implement recycling algorithm
Smarter Balanced Adaptive Item Selection Algorithm
13 American Institutes for Research
4. Items that measure content that has already exceeded a strict maximum are tentatively
removed from the pool, removing entire sets containing items that meet this criterion.
3.2 Recycling Algorithm
When students are offered multiple opportunities to test, or when prior tests have been started
and invalidated, students will have seen some of the items in the pool. The trimming of the item
pool eliminates these items from the pool. It is possible that in such situations, the pool may no
longer contain enough items to meet the blueprint.
Hence, items that have been seen on previous administrations may be returned to the pool. If
there are not enough items remaining in the pool, the algorithm will recycle items (or item
groups) with the required characteristic that is found in insufficient numbers. Working from the
least recently administered group, items (or item groups) are reintroduced into the pool until the
number of items with the required characteristics meets the minimum requirement. When item
groups are recycled, the entire group is recycled rather than an individual item. Items
administered on the current test are never recycled.
3.3 Adaptive Item Selection
Selection of items will follow a common logic, whether the selection is for a single item or an
item group. Item selection will proceed in the following three steps:
1. Select Candidate Set 1 (cset1).
a. Calculate the content value of each item or item group.
b. Sort the item groups in descending order of content value.
c. Select the top cset1size, a user-supplied value that may vary by test.
2. Select Candidate Set 2 (cset2).
a. Calculate the information values for each item group in cset1.
b. Calculate the overall value of each item group in cset1 as defined in Equation 1.
c. Sort cset2 in descending order of value.
d. Select the top cset2size item groups, where cset2size is a user-supplied value that may
vary by test.
3. Select the item or item group to be administered.
a. Select randomly from cset2 with uniform probability.
Note that a “pure adaptive” test, without regard to content constraints, can be achieved by setting
cset1size to the size of the item pool and 𝑤2, the weight associated meeting content constraints in
Equation 1, to zero. Similarly, linear-on-the-fly tests can be constructed by setting 𝑤0 and 𝑤1 to
zero.
Smarter Balanced Adaptive Item Selection Algorithm
14 American Institutes for Research
3.4 Selection of the Initial Item
Selection of the initial item can affect item exposure. At the start of the test, all tests have no
content already administered, so the items and item groups have the same content value for all
examinees. In general, it is a good idea to spread the initial item selection over a wider range of
content values. Therefore, we define an additional user-settable value, cset1initialsize, which is
the size of Candidate Set 1 on the first item only. Similarly, we define cset2initialisize.
3.5 Exposure Control
This algorithm uses randomization to control exposure and offers several parameters that can be
adjusted to control the tradeoff between optimal item allocation and exposure control. The
primary mechanism for controlling exposure is the random selection from CSET2, the set of
items or item groups that best meet the content and information criteria. These represent the “top
k” items, where k can be set. Larger values of k provide more exposure control at the expense of
optional selection.
In addition to this mechanism, we avoid a bias toward items with higher measurement precision
by treating all items as though they measured with equal precision by ignoring variation in the
slope parameter. This has the effect of randomizing over items with differing slope parameters.
Without this step, it would be necessary to have other post hoc explicit controls to avoid the
overexposure of items with higher slope parameters, an approach that could lead to different test
characteristics over the course of the testing window.
4. TERMINATION
The algorithm will have configurable termination conditions. These may include
administering a minimum number of items in each reporting category and overall;
achieving a target level of precision on the overall test score;
achieving a target level of precision on all reporting categories.
We will define four user-defined flags indicating whether each of these is to be considered in the
termination conditions (TermCount, TermOverall, TermReporting,TermTooClose). A fifth user-
supplied value will indicate whether these are taken in conjunction or if satisfaction of any one of
them will suffice (TermAnd). Reaching the minimum number of items is always a necessary
condition for termination.
In addition, two conditions will each individually and independently cause termination of the
test:
1. Administering the maximum number of items specified in the blueprint
2. Having no items in the pool left to administer
Smarter Balanced Adaptive Item Selection Algorithm
15 American Institutes for Research
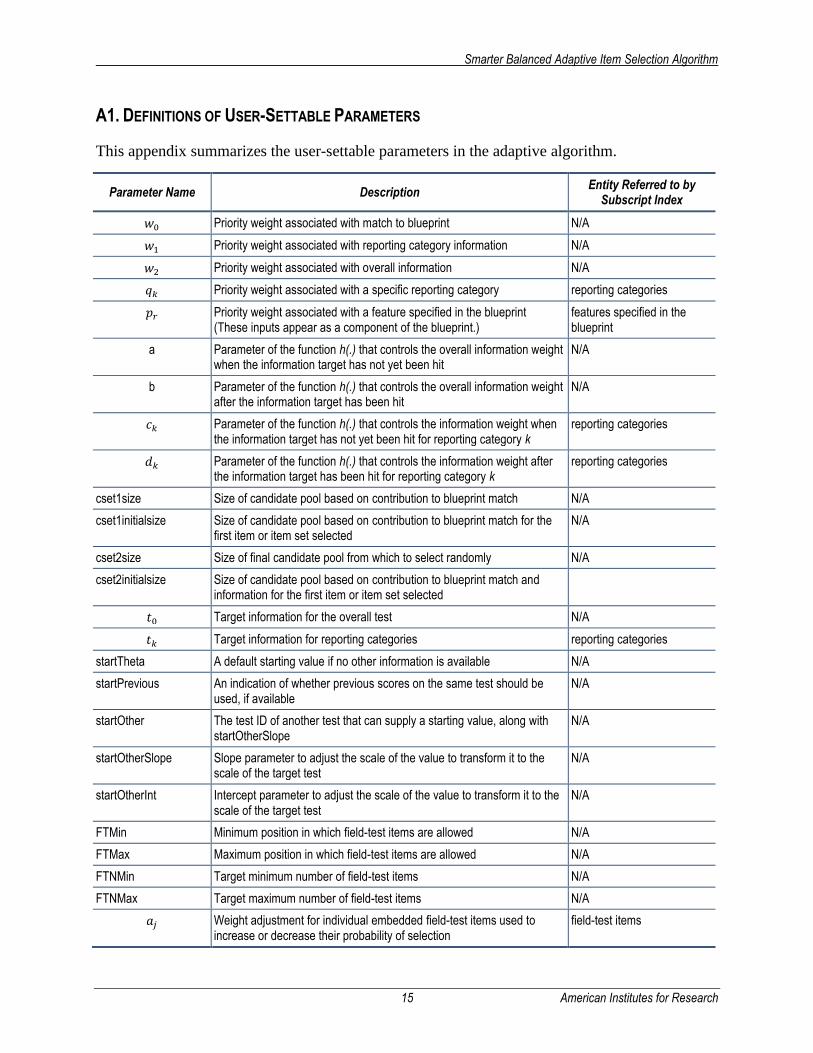
A1. DEFINITIONS OF USER-SETTABLE PARAMETERS
This appendix summarizes the user-settable parameters in the adaptive algorithm.
Parameter Name Description Entity Referred to by
Subscript Index
𝑤0 Priority weight associated with match to blueprint N/A
𝑤1 Priority weight associated with reporting category information N/A
𝑤2 Priority weight associated with overall information N/A
𝑞𝑘 Priority weight associated with a specific reporting category reporting categories
𝑝𝑟 Priority weight associated with a feature specified in the blueprint (These inputs appear as a component of the blueprint.)
features specified in the blueprint
a Parameter of the function h(.) that controls the overall information weight when the information target has not yet been hit
N/A
b Parameter of the function h(.) that controls the overall information weight after the information target has been hit
N/A
𝑐𝑘 Parameter of the function h(.) that controls the information weight when the information target has not yet been hit for reporting category k
reporting categories
𝑑𝑘 Parameter of the function h(.) that controls the information weight after the information target has been hit for reporting category k
reporting categories
cset1size Size of candidate pool based on contribution to blueprint match N/A
cset1initialsize Size of candidate pool based on contribution to blueprint match for the first item or item set selected
N/A
cset2size Size of final candidate pool from which to select randomly N/A
cset2initialsize Size of candidate pool based on contribution to blueprint match and information for the first item or item set selected
𝑡0 Target information for the overall test N/A
𝑡𝑘 Target information for reporting categories reporting categories
startTheta A default starting value if no other information is available N/A
startPrevious An indication of whether previous scores on the same test should be used, if available
N/A
startOther The test ID of another test that can supply a starting value, along with startOtherSlope
N/A
startOtherSlope Slope parameter to adjust the scale of the value to transform it to the scale of the target test
N/A
startOtherInt Intercept parameter to adjust the scale of the value to transform it to the scale of the target test
N/A
FTMin Minimum position in which field-test items are allowed N/A
FTMax Maximum position in which field-test items are allowed N/A
FTNMin Target minimum number of field-test items N/A
FTNMax Target maximum number of field-test items N/A
𝑎𝑗 Weight adjustment for individual embedded field-test items used to increase or decrease their probability of selection
field-test items
Smarter Balanced Adaptive Item Selection Algorithm
16 American Institutes for Research
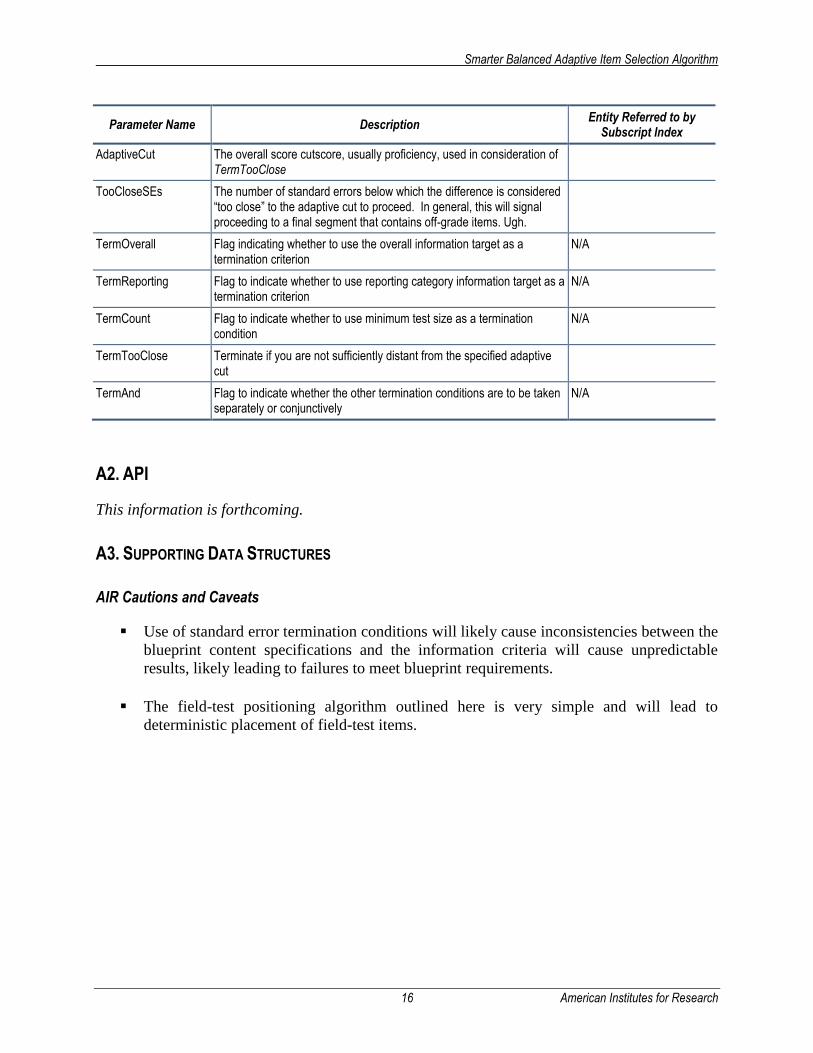
Parameter Name Description Entity Referred to by
Subscript Index
AdaptiveCut The overall score cutscore, usually proficiency, used in consideration of TermTooClose
TooCloseSEs The number of standard errors below which the difference is considered “too close” to the adaptive cut to proceed. In general, this will signal proceeding to a final segment that contains off-grade items. Ugh.
TermOverall Flag indicating whether to use the overall information target as a termination criterion
N/A
TermReporting Flag to indicate whether to use reporting category information target as a termination criterion
N/A
TermCount Flag to indicate whether to use minimum test size as a termination condition
N/A
TermTooClose Terminate if you are not sufficiently distant from the specified adaptive cut
TermAnd Flag to indicate whether the other termination conditions are to be taken separately or conjunctively
N/A
A2. API
This information is forthcoming.
A3. SUPPORTING DATA STRUCTURES
AIR Cautions and Caveats
Use of standard error termination conditions will likely cause inconsistencies between the
blueprint content specifications and the information criteria will cause unpredictable
results, likely leading to failures to meet blueprint requirements.
The field-test positioning algorithm outlined here is very simple and will lead to
deterministic placement of field-test items.