Embed Size (px)
Citation preview
SmartGPA: How Smartphones Can Assess and PredictAcademic Performance of College Students
Rui Wang, Gabriella Harari†Peilin Hao, Xia Zhou, and Andrew T. Campbell
Dartmouth College, The University of Texas at Austin†,{ruiwang, hao, xia, campbell}@cs.dartmouth.edu,
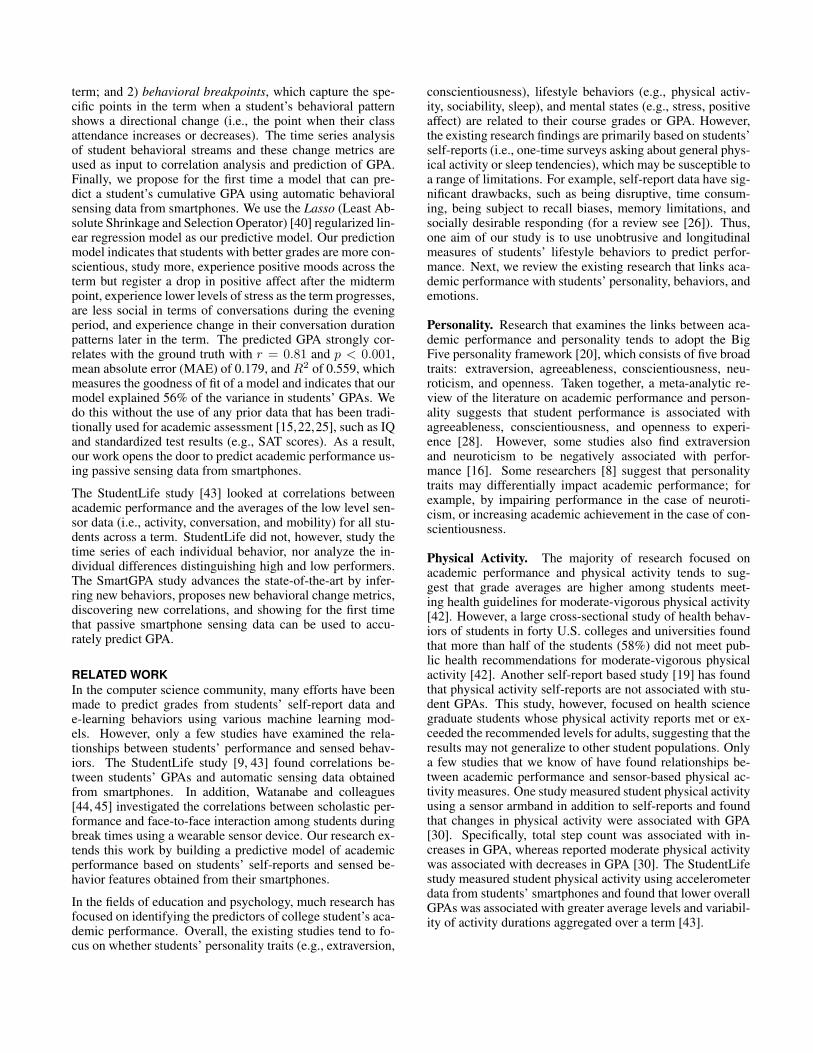
ABSTRACTMany cognitive, behavioral, and environmental factors im-pact student learning during college. The SmartGPA studyuses passive sensing data and self-reports from students’smartphones to understand individual behavioral differencesbetween high and low performers during a single 10-weekterm. We propose new methods for better understandingstudy (e.g., study duration) and social (e.g., partying) behav-ior of a group of undergraduates. We show that there area number of important behavioral factors automatically in-ferred from smartphones that significantly correlate with termand cumulative GPA, including time series analysis of ac-tivity, conversational interaction, mobility, class attendance,studying, and partying. We propose a simple model basedon linear regression with lasso regularization that can accu-rately predict cumulative GPA. The predicted GPA stronglycorrelates with the ground truth from students’ transcripts(r = 0.81 and p < 0.001) and predicts GPA within ±0.179of the reported grades. Our results open the way for novelinterventions to improve academic performance.
Author KeywordsSmartphone sensing; data analysis; academic performance;behavioral trends
ACM Classification KeywordsH.1.2 User/Machine Systems; I.5 Pattern Recognition
General TermsAlgorithms, Experimentation.
INTRODUCTIONCollege life is complex. Students have to balance going toclasses and performing well academically with competing de-mands for their time and energy, such as extracurricular activ-ities, busy social lives, working because of financial concerns,being members of under-represented minorities, fitting in oncampus (e.g., first-generation college students), dealing with
Permission to make digital or hard copies of all or part of this work for personal orclassroom use is granted without fee provided that copies are not made or distributedfor profit or commercial advantage and that copies bear this notice and the full cita-tion on the first page. Copyrights for components of this work owned by others thanACM must be honored. Abstracting with credit is permitted. To copy otherwise, or re-publish, to post on servers or to redistribute to lists, requires prior specific permissionand/or a fee. Request permissions from [email protected] ’15, September 07-11, 2015, Osaka, Japanc© 2015 ACM. ISBN 978-1-4503-3574-4/15/09. . . $15.00
DOI: http://dx.doi.org/10.1145/2750858.2804251
friends and families, and trying to stay active and physicallyand mentally healthy during the ebb and flow of the term’sworkload and commitments. As a result, succeeding in a de-manding educational environment is challenging.
When we think of “academic performance” we usually as-sociate it with educational outcomes best represented by astudent’s cumulative GPA. This measure typically captures acontinuous assessment of a student’s academic achievementin terms of results from assignments, quizzes, tests, midterms,and final examinations as they move through their collegeyears. Academic performance is linked to a student’s intel-lectual curiosity and ability (e.g., as measured by IQ), theirdrive and motivation, the educational environment, health,prior test results (e.g., SATs), and personality traits (e.g., con-scientiousness). There is no general agreement, however, onwhy students with similar academic capability at the same in-stitution do better or worse than one another. It seems likelythat students’ everyday behavioral patterns (e.g., study habits,class attendance, time management, sleep patterns, partyingbehavior) significantly contribute to individual differences inacademic performance among students. This raises severalquestions. Are there distinct differences in the behavioralpatterns of high (e.g., GPA ≥ 3.5) and low performers (e.g.,GPA ≤ 3) at the same college? If such behavioral differencesexist could we use these correlations as a basis for predict-ing academic performance? How do different psychologicalcharacteristics, such as personality, mental health, affect, andstress collectively contribute to GPA?
This paper makes the following contributions. First, we pro-pose new methods to automatically infer study (i.e., studyduration and focus) and social (i.e., partying) behaviors us-ing passive sensing from smartphones. Next, we use timeseries analysis of these and other behavioral states derivedfrom the StudentLife dataset [43], a longitudinal study ofcollege students, to find what behaviors significantly impactterm and cumulative GPA. We use this behavioral analysis asinput to model the individual differences between high andlow performers in a population of undergraduate students atDartmouth College. Third, in order to understand changesin behavior students experience across the term we proposetwo new behavioral metrics: 1) behavioral slope, which cap-tures the direction of behavioral change (i.e., increases or de-creases in class attendance) and magnitude of the behavioralchange (e.g., steep or gradual changes in attendance) overthe complete term, as well as the first and second half of the
term; and 2) behavioral breakpoints, which capture the spe-cific points in the term when a student’s behavioral patternshows a directional change (i.e., the point when their classattendance increases or decreases). The time series analysisof student behavioral streams and these change metrics areused as input to correlation analysis and prediction of GPA.Finally, we propose for the first time a model that can pre-dict a student’s cumulative GPA using automatic behavioralsensing data from smartphones. We use the Lasso (Least Ab-solute Shrinkage and Selection Operator) [40] regularized lin-ear regression model as our predictive model. Our predictionmodel indicates that students with better grades are more con-scientious, study more, experience positive moods across theterm but register a drop in positive affect after the midtermpoint, experience lower levels of stress as the term progresses,are less social in terms of conversations during the eveningperiod, and experience change in their conversation durationpatterns later in the term. The predicted GPA strongly cor-relates with the ground truth with r = 0.81 and p < 0.001,mean absolute error (MAE) of 0.179, and R2 of 0.559, whichmeasures the goodness of fit of a model and indicates that ourmodel explained 56% of the variance in students’ GPAs. Wedo this without the use of any prior data that has been tradi-tionally used for academic assessment [15,22,25], such as IQand standardized test results (e.g., SAT scores). As a result,our work opens the door to predict academic performance us-ing passive sensing data from smartphones.
The StudentLife study [43] looked at correlations betweenacademic performance and the averages of the low level sen-sor data (i.e., activity, conversation, and mobility) for all stu-dents across a term. StudentLife did not, however, study thetime series of each individual behavior, nor analyze the in-dividual differences distinguishing high and low performers.The SmartGPA study advances the state-of-the-art by infer-ring new behaviors, proposes new behavioral change metrics,discovering new correlations, and showing for the first timethat passive smartphone sensing data can be used to accu-rately predict GPA.
RELATED WORKIn the computer science community, many efforts have beenmade to predict grades from students’ self-report data ande-learning behaviors using various machine learning mod-els. However, only a few studies have examined the rela-tionships between students’ performance and sensed behav-iors. The StudentLife study [9, 43] found correlations be-tween students’ GPAs and automatic sensing data obtainedfrom smartphones. In addition, Watanabe and colleagues[44, 45] investigated the correlations between scholastic per-formance and face-to-face interaction among students duringbreak times using a wearable sensor device. Our research ex-tends this work by building a predictive model of academicperformance based on students’ self-reports and sensed be-havior features obtained from their smartphones.
In the fields of education and psychology, much research hasfocused on identifying the predictors of college student’s aca-demic performance. Overall, the existing studies tend to fo-cus on whether students’ personality traits (e.g., extraversion,
conscientiousness), lifestyle behaviors (e.g., physical activ-ity, sociability, sleep), and mental states (e.g., stress, positiveaffect) are related to their course grades or GPA. However,the existing research findings are primarily based on students’self-reports (i.e., one-time surveys asking about general phys-ical activity or sleep tendencies), which may be susceptible toa range of limitations. For example, self-report data have sig-nificant drawbacks, such as being disruptive, time consum-ing, being subject to recall biases, memory limitations, andsocially desirable responding (for a review see [26]). Thus,one aim of our study is to use unobtrusive and longitudinalmeasures of students’ lifestyle behaviors to predict perfor-mance. Next, we review the existing research that links aca-demic performance with students’ personality, behaviors, andemotions.
Personality. Research that examines the links between aca-demic performance and personality tends to adopt the BigFive personality framework [20], which consists of five broadtraits: extraversion, agreeableness, conscientiousness, neu-roticism, and openness. Taken together, a meta-analytic re-view of the literature on academic performance and person-ality suggests that student performance is associated withagreeableness, conscientiousness, and openness to experi-ence [28]. However, some studies also find extraversionand neuroticism to be negatively associated with perfor-mance [16]. Some researchers [8] suggest that personalitytraits may differentially impact academic performance; forexample, by impairing performance in the case of neuroti-cism, or increasing academic achievement in the case of con-scientiousness.
Physical Activity. The majority of research focused onacademic performance and physical activity tends to sug-gest that grade averages are higher among students meet-ing health guidelines for moderate-vigorous physical activity[42]. However, a large cross-sectional study of health behav-iors of students in forty U.S. colleges and universities foundthat more than half of the students (58%) did not meet pub-lic health recommendations for moderate-vigorous physicalactivity [42]. Another self-report based study [19] has foundthat physical activity self-reports are not associated with stu-dent GPAs. This study, however, focused on health sciencegraduate students whose physical activity reports met or ex-ceeded the recommended levels for adults, suggesting that theresults may not generalize to other student populations. Onlya few studies that we know of have found relationships be-tween academic performance and sensor-based physical ac-tivity measures. One study measured student physical activityusing a sensor armband in addition to self-reports and foundthat changes in physical activity were associated with GPA[30]. Specifically, total step count was associated with in-creases in GPA, whereas reported moderate physical activitywas associated with decreases in GPA [30]. The StudentLifestudy measured student physical activity using accelerometerdata from students’ smartphones and found that lower overallGPAs was associated with greater average levels and variabil-ity of activity durations aggregated over a term [43].
Sociability. Behaviors related to sociability (e.g., duration orfrequency of engaging in conversation, partying, and spend-ing time alone or with others) have been difficult to study,which has led to differences in the way sociability is opera-tionalized. For instance, a meta-analysis of predictors of col-lege performance found that social involvement (e.g., socialintegration, involvement in campus activities) was associatedwith higher GPAs among college students [31]. However,night outings (i.e., social events such as partying, movies)have been associated with poorer performance [18]. In ad-dition, social support has been linked to higher academicperformance among college freshmen [13]. The StudentLifestudy measures sociability using conversation data inferredfrom the audio collected by smartphone’s microphone [43].It shows that greater conversation durations aggregated overa term was associated with higher spring term GPAs.
Sleep. The majority of research focused on academic per-formance and sleep patterns tends to suggest that grade aver-ages are higher among students meeting guidelines for goodsleep habits [42]. However, a large cross-sectional study ofhealth behaviors of students in forty U.S. colleges and uni-versities found that only a quarter of students (24%) actu-ally met public sleep recommendations [42]. In addition,some studies that examine the relationship between perfor-mance and sleep duration find a negative relationship betweenself-reported number of hours slept and students’ GPA [17].However, other studies have found a quadratic relationshipbetween performance (i.e., cumulative GPA) and total sleepduration, such that too little or too much sleep is associatedwith poorer performance [39]. Other research studies havefound that wake-up and bed times are important for perfor-mance, such that later bed and wake-up times are associatedwith poorer performance [39, 41]. In addition, variability insleep behaviors (e.g., bed times, wake times, total sleep dura-tion) has been linked to performance, such that greater vari-ability it associated with poorer performance [39].
Class Attendance and Studying. In general, a meta-analyticreview of college performance found that academic-relatedskills (e.g., study skills and habits) were associated withhigher GPAs among college students [31]. Research that ex-amines academic behaviors has also found that absenteeismand class attendance predict academic performance, suchthat students who attend class more often performed bet-ter than those who missed class [8, 11, 18]. For example,a meta-analysis of studies that examine the relationship be-tween class attendance and performance found attendance tobe strongly related to class grades and GPA among collegestudents [12]. However, the StudentLife study [43] foundno correlation between class attendance and academic per-formance.
Emotions. Relatively few studies have examined the re-lationship between academic performance and positive af-fect. Those studies that have focused on affect found thatpositive affect was associated with higher grades and GPAs,while negative affect during the second half of the semesterwas associated with lower grades and GPAs [32] . On the
contrary, the relationship between academic performance andstudents’ stress has received more attention. In general, col-lege students tend to report more stressful daily hassles [34].The existing research tends to show that moderate stress isassociated with decreases in students’ GPAs [30], and thatperceived stress during the end of the semester is associatedwith lower GPAs [29]. Previous research tends to find a curvi-linear relationship between stress and performance, such thattoo little or too much stress is associated with poorer perfor-mance [39].
Performance Prediction. Previous research [15] aimed atpredicting performance has used a neural network model topredict student’s grades from their placement test scores. Var-ious data collected from entering students are used in [25] topredict student academic success using discriminant functionanalysis. [22] proposes a regression model to predict the stu-dent’s performance from their demographic information andtutor’s records. [33] applies web usage mining in e-learningsystems to predict students’ grades in the final exam of acourse. In [48], the authors propose an approach based onmultiple instance learning to predict student’s performancein an e-learning environment. Recent work [38] showed thatthey can predict a student is at risk of getting poor assessmentperformance using longitudinal data such as previous test per-formance and course history. To the best of our knowledgethere is no work on using passive sensor data from smart-phones as a predictor on academic success.
ACADEMIC PERFORMANCE DATASETIn this paper, we use a subset of the StudentLife dataset toanalyze and predict academic peformance. The StudentLifedataset is a large, longitudinal dataset that is publicly avail-able [43]. The dataset is collected from 30 undergrads and 18graduate students over a 10-week term in spring 2013. Eachstudent takes three classes during a term at Dartmouth Col-lege. The dataset includes over 53 GB of continuous sens-ing data from smartphones, including: 1) objective sensingdata: sleep (bedtime, duration, wake up), face-to-face con-servation duration, face-to-face conversation frequency andphysical activity (stationary, walk, run); 2) location-baseddata: location, co-location, indoor/outdoor mobility, and dis-tance covered; 3) other phone data: light, Bluetooth, audio,Wi-Fi, screen lock/unlock, phone charge, and app usage. Thedataset also comprises 32,000 daily self-reports covering af-fect (PAM [27]), stress, exercise, mood, loneliness, social andstudy spaces; and pre-post surveys including PHQ9 depres-sion scale [23, 24, 37] , UCLA loneliness scale [35], posi-tive and negative affect schedule (PANAS) [46], perceivedstress scale (PSS) [10], big five personality [20], flourishingscale [14], and the Pittsburgh sleep quality index [6]. Fi-nally, the dataset includes academic assessment data, suchas, class information, deadlines, academic performance (i.e.,grades, term GPA, cumulative GPA), class attendance rates(from phone location data), Piazza usage data [4], and stu-dent dinning history including time, location, and cost.
In this paper, we only use undergraduate students’ (N=30)data because only undergraduates have GPAs. In contrast,
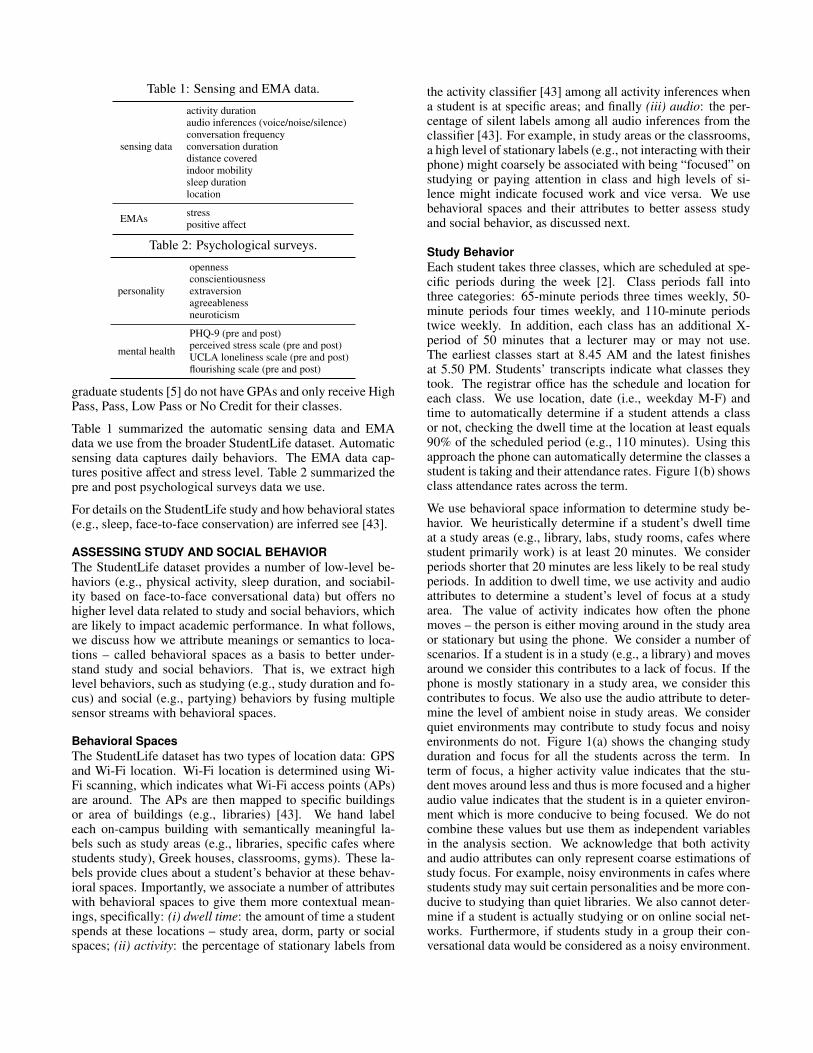
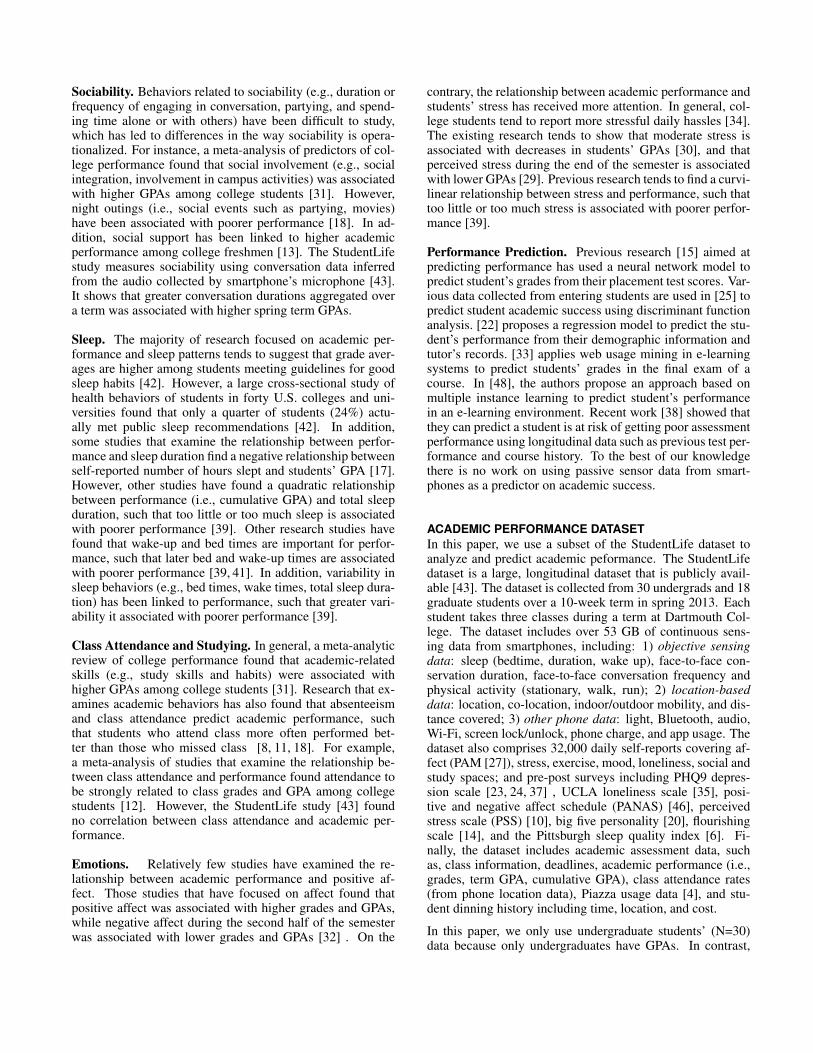
Table 1: Sensing and EMA data.
sensing data
activity durationaudio inferences (voice/noise/silence)conversation frequencyconversation durationdistance coveredindoor mobilitysleep durationlocation
EMAs stresspositive affect
Table 2: Psychological surveys.
personality
opennessconscientiousnessextraversionagreeablenessneuroticism
mental health
PHQ-9 (pre and post)perceived stress scale (pre and post)UCLA loneliness scale (pre and post)flourishing scale (pre and post)
graduate students [5] do not have GPAs and only receive HighPass, Pass, Low Pass or No Credit for their classes.
Table 1 summarized the automatic sensing data and EMAdata we use from the broader StudentLife dataset. Automaticsensing data captures daily behaviors. The EMA data cap-tures positive affect and stress level. Table 2 summarized thepre and post psychological surveys data we use.
For details on the StudentLife study and how behavioral states(e.g., sleep, face-to-face conservation) are inferred see [43].
ASSESSING STUDY AND SOCIAL BEHAVIORThe StudentLife dataset provides a number of low-level be-haviors (e.g., physical activity, sleep duration, and sociabil-ity based on face-to-face conversational data) but offers nohigher level data related to study and social behaviors, whichare likely to impact academic performance. In what follows,we discuss how we attribute meanings or semantics to loca-tions – called behavioral spaces as a basis to better under-stand study and social behaviors. That is, we extract highlevel behaviors, such as studying (e.g., study duration and fo-cus) and social (e.g., partying) behaviors by fusing multiplesensor streams with behavioral spaces.
Behavioral SpacesThe StudentLife dataset has two types of location data: GPSand Wi-Fi location. Wi-Fi location is determined using Wi-Fi scanning, which indicates what Wi-Fi access points (APs)are around. The APs are then mapped to specific buildingsor area of buildings (e.g., libraries) [43]. We hand labeleach on-campus building with semantically meaningful la-bels such as study areas (e.g., libraries, specific cafes wherestudents study), Greek houses, classrooms, gyms). These la-bels provide clues about a student’s behavior at these behav-ioral spaces. Importantly, we associate a number of attributeswith behavioral spaces to give them more contextual mean-ings, specifically: (i) dwell time: the amount of time a studentspends at these locations – study area, dorm, party or socialspaces; (ii) activity: the percentage of stationary labels from
the activity classifier [43] among all activity inferences whena student is at specific areas; and finally (iii) audio: the per-centage of silent labels among all audio inferences from theclassifier [43]. For example, in study areas or the classrooms,a high level of stationary labels (e.g., not interacting with theirphone) might coarsely be associated with being “focused” onstudying or paying attention in class and high levels of si-lence might indicate focused work and vice versa. We usebehavioral spaces and their attributes to better assess studyand social behavior, as discussed next.
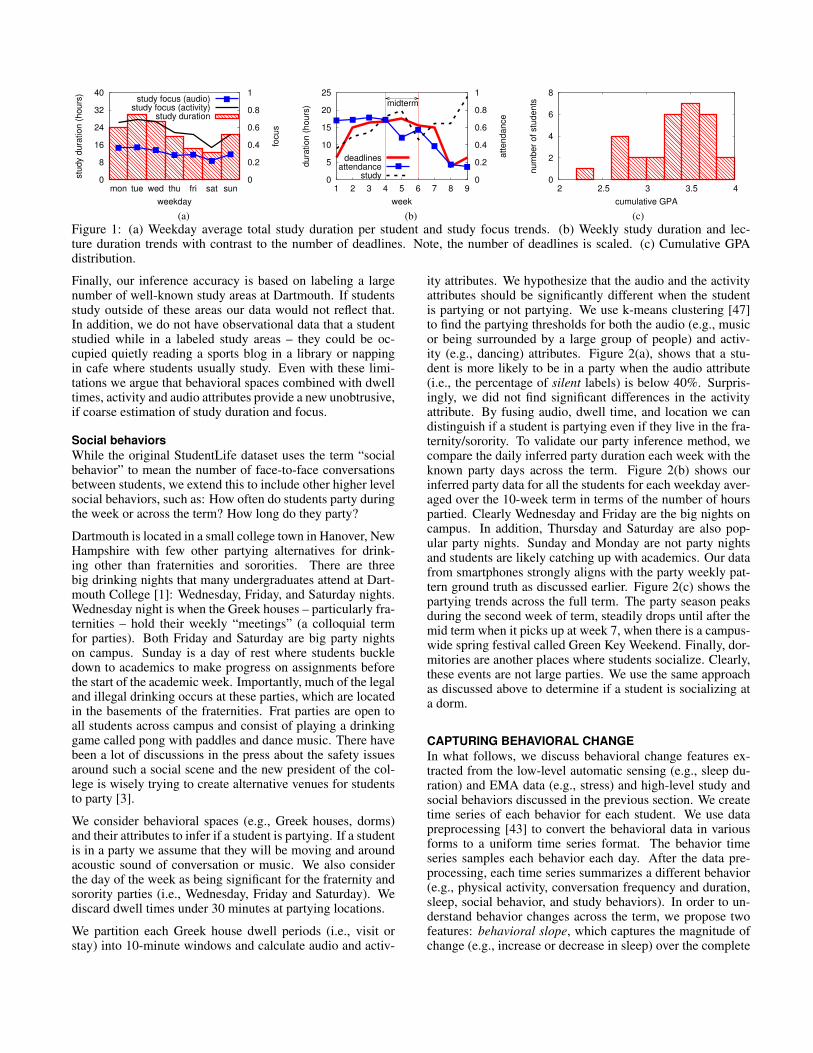
Study BehaviorEach student takes three classes, which are scheduled at spe-cific periods during the week [2]. Class periods fall intothree categories: 65-minute periods three times weekly, 50-minute periods four times weekly, and 110-minute periodstwice weekly. In addition, each class has an additional X-period of 50 minutes that a lecturer may or may not use.The earliest classes start at 8.45 AM and the latest finishesat 5.50 PM. Students’ transcripts indicate what classes theytook. The registrar office has the schedule and location foreach class. We use location, date (i.e., weekday M-F) andtime to automatically determine if a student attends a classor not, checking the dwell time at the location at least equals90% of the scheduled period (e.g., 110 minutes). Using thisapproach the phone can automatically determine the classes astudent is taking and their attendance rates. Figure 1(b) showsclass attendance rates across the term.
We use behavioral space information to determine study be-havior. We heuristically determine if a student’s dwell timeat a study areas (e.g., library, labs, study rooms, cafes wherestudent primarily work) is at least 20 minutes. We considerperiods shorter that 20 minutes are less likely to be real studyperiods. In addition to dwell time, we use activity and audioattributes to determine a student’s level of focus at a studyarea. The value of activity indicates how often the phonemoves – the person is either moving around in the study areaor stationary but using the phone. We consider a number ofscenarios. If a student is in a study (e.g., a library) and movesaround we consider this contributes to a lack of focus. If thephone is mostly stationary in a study area, we consider thiscontributes to focus. We also use the audio attribute to deter-mine the level of ambient noise in study areas. We considerquiet environments may contribute to study focus and noisyenvironments do not. Figure 1(a) shows the changing studyduration and focus for all the students across the term. Interm of focus, a higher activity value indicates that the stu-dent moves around less and thus is more focused and a higheraudio value indicates that the student is in a quieter environ-ment which is more conducive to being focused. We do notcombine these values but use them as independent variablesin the analysis section. We acknowledge that both activityand audio attributes can only represent coarse estimations ofstudy focus. For example, noisy environments in cafes wherestudents study may suit certain personalities and be more con-ducive to studying than quiet libraries. We also cannot deter-mine if a student is actually studying or on online social net-works. Furthermore, if students study in a group their con-versational data would be considered as a noisy environment.
0
8
16
24
32
40
mon tue wed thu fri sat sun 0
0.2
0.4
0.6
0.8
1
stu
dy d
ura
tion (
hours
)
focus
weekday
study durationstudy focus (activity)
study focus (audio)
(a)
0
5
10
15
20
25
1 2 3 4 5 6 7 8 9 0
0.2
0.4
0.6
0.8
1
midterm
dura
tion (
hours
)
attendance
week
deadlinesattendance
study
(b)
0
2
4
6
8
2 2.5 3 3.5 4
num
ber
of stu
dents
cumulative GPA
(c)Figure 1: (a) Weekday average total study duration per student and study focus trends. (b) Weekly study duration and lec-ture duration trends with contrast to the number of deadlines. Note, the number of deadlines is scaled. (c) Cumulative GPAdistribution.
Finally, our inference accuracy is based on labeling a largenumber of well-known study areas at Dartmouth. If studentsstudy outside of these areas our data would not reflect that.In addition, we do not have observational data that a studentstudied while in a labeled study areas – they could be oc-cupied quietly reading a sports blog in a library or nappingin cafe where students usually study. Even with these limi-tations we argue that behavioral spaces combined with dwelltimes, activity and audio attributes provide a new unobtrusive,if coarse estimation of study duration and focus.
Social behaviorsWhile the original StudentLife dataset uses the term “socialbehavior” to mean the number of face-to-face conversationsbetween students, we extend this to include other higher levelsocial behaviors, such as: How often do students party duringthe week or across the term? How long do they party?
Dartmouth is located in a small college town in Hanover, NewHampshire with few other partying alternatives for drink-ing other than fraternities and sororities. There are threebig drinking nights that many undergraduates attend at Dart-mouth College [1]: Wednesday, Friday, and Saturday nights.Wednesday night is when the Greek houses – particularly fra-ternities – hold their weekly “meetings” (a colloquial termfor parties). Both Friday and Saturday are big party nightson campus. Sunday is a day of rest where students buckledown to academics to make progress on assignments beforethe start of the academic week. Importantly, much of the legaland illegal drinking occurs at these parties, which are locatedin the basements of the fraternities. Frat parties are open toall students across campus and consist of playing a drinkinggame called pong with paddles and dance music. There havebeen a lot of discussions in the press about the safety issuesaround such a social scene and the new president of the col-lege is wisely trying to create alternative venues for studentsto party [3].
We consider behavioral spaces (e.g., Greek houses, dorms)and their attributes to infer if a student is partying. If a studentis in a party we assume that they will be moving and aroundacoustic sound of conversation or music. We also considerthe day of the week as being significant for the fraternity andsorority parties (i.e., Wednesday, Friday and Saturday). Wediscard dwell times under 30 minutes at partying locations.
We partition each Greek house dwell periods (i.e., visit orstay) into 10-minute windows and calculate audio and activ-
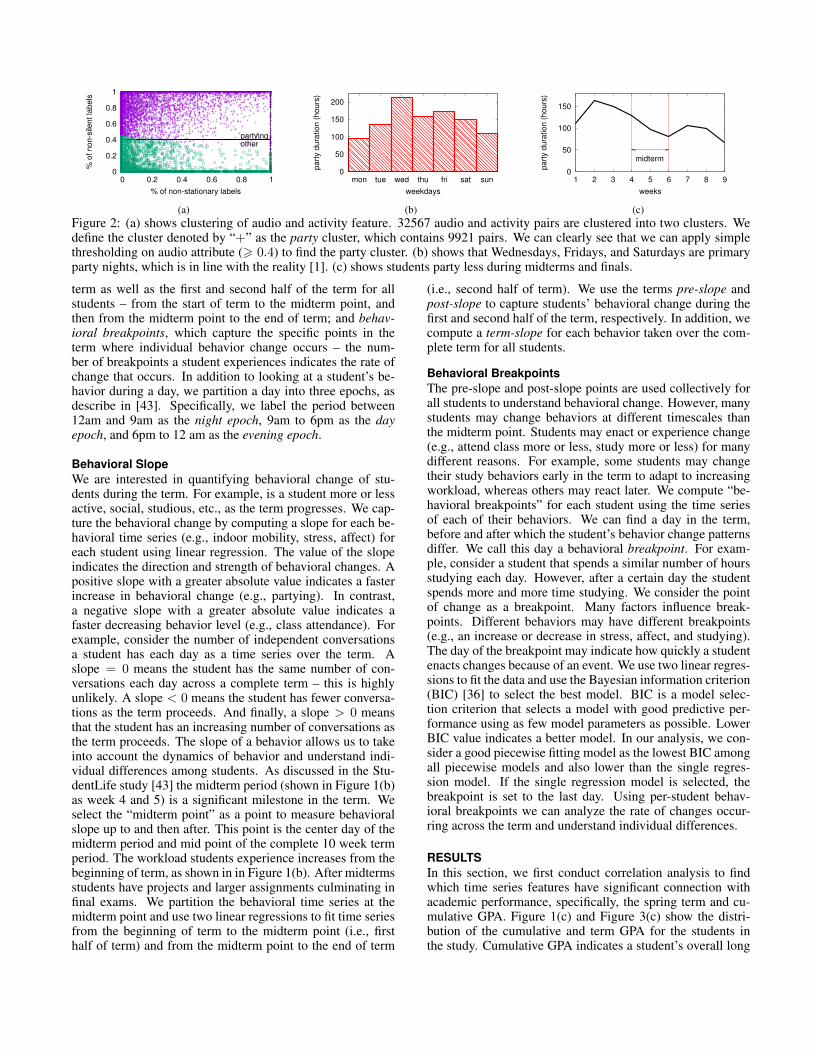
ity attributes. We hypothesize that the audio and the activityattributes should be significantly different when the studentis partying or not partying. We use k-means clustering [47]to find the partying thresholds for both the audio (e.g., musicor being surrounded by a large group of people) and activ-ity (e.g., dancing) attributes. Figure 2(a), shows that a stu-dent is more likely to be in a party when the audio attribute(i.e., the percentage of silent labels) is below 40%. Surpris-ingly, we did not find significant differences in the activityattribute. By fusing audio, dwell time, and location we candistinguish if a student is partying even if they live in the fra-ternity/sorority. To validate our party inference method, wecompare the daily inferred party duration each week with theknown party days across the term. Figure 2(b) shows ourinferred party data for all the students for each weekday aver-aged over the 10-week term in terms of the number of hourspartied. Clearly Wednesday and Friday are the big nights oncampus. In addition, Thursday and Saturday are also pop-ular party nights. Sunday and Monday are not party nightsand students are likely catching up with academics. Our datafrom smartphones strongly aligns with the party weekly pat-tern ground truth as discussed earlier. Figure 2(c) shows thepartying trends across the full term. The party season peaksduring the second week of term, steadily drops until after themid term when it picks up at week 7, when there is a campus-wide spring festival called Green Key Weekend. Finally, dor-mitories are another places where students socialize. Clearly,these events are not large parties. We use the same approachas discussed above to determine if a student is socializing ata dorm.
CAPTURING BEHAVIORAL CHANGEIn what follows, we discuss behavioral change features ex-tracted from the low-level automatic sensing (e.g., sleep du-ration) and EMA data (e.g., stress) and high-level study andsocial behaviors discussed in the previous section. We createtime series of each behavior for each student. We use datapreprocessing [43] to convert the behavioral data in variousforms to a uniform time series format. The behavior timeseries samples each behavior each day. After the data pre-processing, each time series summarizes a different behavior(e.g., physical activity, conversation frequency and duration,sleep, social behavior, and study behaviors). In order to un-derstand behavior changes across the term, we propose twofeatures: behavioral slope, which captures the magnitude ofchange (e.g., increase or decrease in sleep) over the complete
0
0.2
0.4
0.6
0.8
1
0 0.2 0.4 0.6 0.8 1
partyingother
% o
f non-s
ilent la
bels
% of non-stationary labels
(a)
0
50
100
150
200
mon tue wed thu fri sat sun
part
y d
ura
tion (
hours
)
weekdays
(b)
0
50
100
150
1 2 3 4 5 6 7 8 9
midterm
part
y d
ura
tion (
hours
)
weeks
(c)Figure 2: (a) shows clustering of audio and activity feature. 32567 audio and activity pairs are clustered into two clusters. Wedefine the cluster denoted by “+” as the party cluster, which contains 9921 pairs. We can clearly see that we can apply simplethresholding on audio attribute (> 0.4) to find the party cluster. (b) shows that Wednesdays, Fridays, and Saturdays are primaryparty nights, which is in line with the reality [1]. (c) shows students party less during midterms and finals.
term as well as the first and second half of the term for allstudents – from the start of term to the midterm point, andthen from the midterm point to the end of term; and behav-ioral breakpoints, which capture the specific points in theterm where individual behavior change occurs – the num-ber of breakpoints a student experiences indicates the rate ofchange that occurs. In addition to looking at a student’s be-havior during a day, we partition a day into three epochs, asdescribe in [43]. Specifically, we label the period between12am and 9am as the night epoch, 9am to 6pm as the dayepoch, and 6pm to 12 am as the evening epoch.
Behavioral SlopeWe are interested in quantifying behavioral change of stu-dents during the term. For example, is a student more or lessactive, social, studious, etc., as the term progresses. We cap-ture the behavioral change by computing a slope for each be-havioral time series (e.g., indoor mobility, stress, affect) foreach student using linear regression. The value of the slopeindicates the direction and strength of behavioral changes. Apositive slope with a greater absolute value indicates a fasterincrease in behavioral change (e.g., partying). In contrast,a negative slope with a greater absolute value indicates afaster decreasing behavior level (e.g., class attendance). Forexample, consider the number of independent conversationsa student has each day as a time series over the term. Aslope = 0 means the student has the same number of con-versations each day across a complete term – this is highlyunlikely. A slope < 0 means the student has fewer conversa-tions as the term proceeds. And finally, a slope > 0 meansthat the student has an increasing number of conversations asthe term proceeds. The slope of a behavior allows us to takeinto account the dynamics of behavior and understand indi-vidual differences among students. As discussed in the Stu-dentLife study [43] the midterm period (shown in Figure 1(b)as week 4 and 5) is a significant milestone in the term. Weselect the “midterm point” as a point to measure behavioralslope up to and then after. This point is the center day of themidterm period and mid point of the complete 10 week termperiod. The workload students experience increases from thebeginning of term, as shown in in Figure 1(b). After midtermsstudents have projects and larger assignments culminating infinal exams. We partition the behavioral time series at themidterm point and use two linear regressions to fit time seriesfrom the beginning of term to the midterm point (i.e., firsthalf of term) and from the midterm point to the end of term
(i.e., second half of term). We use the terms pre-slope andpost-slope to capture students’ behavioral change during thefirst and second half of the term, respectively. In addition, wecompute a term-slope for each behavior taken over the com-plete term for all students.
Behavioral BreakpointsThe pre-slope and post-slope points are used collectively forall students to understand behavioral change. However, manystudents may change behaviors at different timescales thanthe midterm point. Students may enact or experience change(e.g., attend class more or less, study more or less) for manydifferent reasons. For example, some students may changetheir study behaviors early in the term to adapt to increasingworkload, whereas others may react later. We compute “be-havioral breakpoints” for each student using the time seriesof each of their behaviors. We can find a day in the term,before and after which the student’s behavior change patternsdiffer. We call this day a behavioral breakpoint. For exam-ple, consider a student that spends a similar number of hoursstudying each day. However, after a certain day the studentspends more and more time studying. We consider the pointof change as a breakpoint. Many factors influence break-points. Different behaviors may have different breakpoints(e.g., an increase or decrease in stress, affect, and studying).The day of the breakpoint may indicate how quickly a studentenacts changes because of an event. We use two linear regres-sions to fit the data and use the Bayesian information criterion(BIC) [36] to select the best model. BIC is a model selec-tion criterion that selects a model with good predictive per-formance using as few model parameters as possible. LowerBIC value indicates a better model. In our analysis, we con-sider a good piecewise fitting model as the lowest BIC amongall piecewise models and also lower than the single regres-sion model. If the single regression model is selected, thebreakpoint is set to the last day. Using per-student behav-ioral breakpoints we can analyze the rate of changes occur-ring across the term and understand individual differences.
RESULTSIn this section, we first conduct correlation analysis to findwhich time series features have significant connection withacademic performance, specifically, the spring term and cu-mulative GPA. Figure 1(c) and Figure 3(c) show the distri-bution of the cumulative and term GPA for the students inthe study. Cumulative GPA indicates a student’s overall long
term academic performance. The spring term GPA captureshow a student performs in a single 10-week term. After cor-relation analysis we discuss our model for predicting cumu-lative GPA.
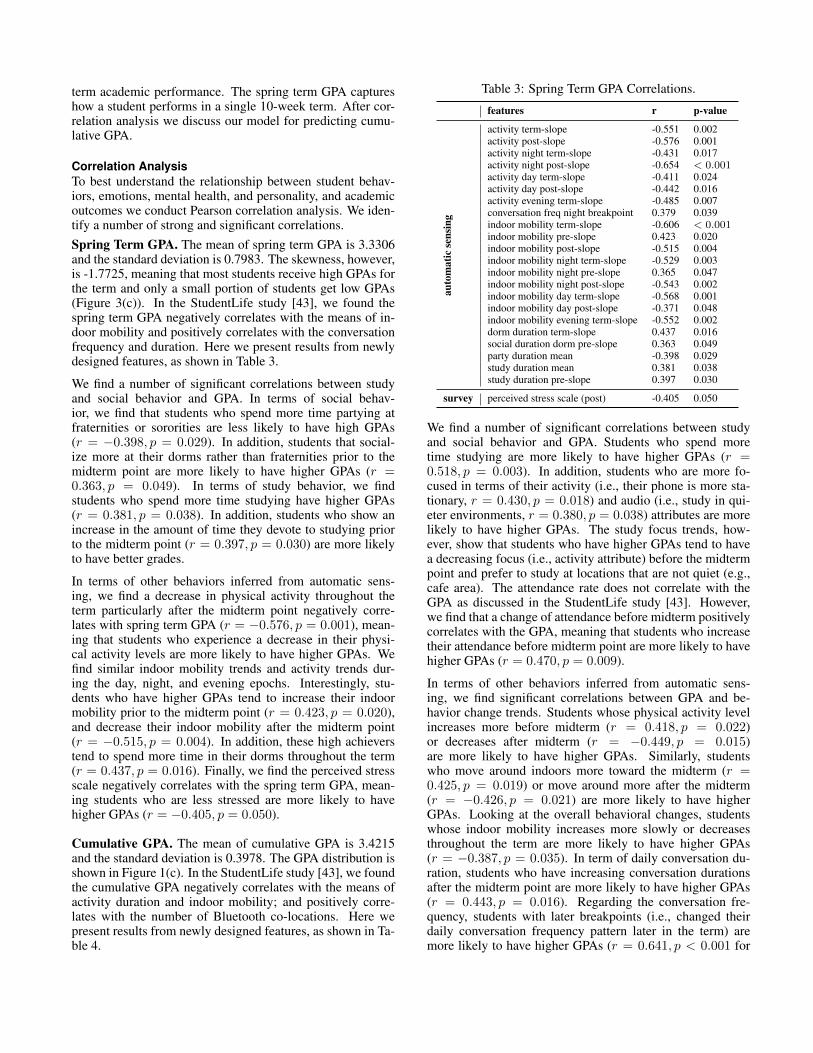
Correlation AnalysisTo best understand the relationship between student behav-iors, emotions, mental health, and personality, and academicoutcomes we conduct Pearson correlation analysis. We iden-tify a number of strong and significant correlations.Spring Term GPA. The mean of spring term GPA is 3.3306and the standard deviation is 0.7983. The skewness, however,is -1.7725, meaning that most students receive high GPAs forthe term and only a small portion of students get low GPAs(Figure 3(c)). In the StudentLife study [43], we found thespring term GPA negatively correlates with the means of in-door mobility and positively correlates with the conversationfrequency and duration. Here we present results from newlydesigned features, as shown in Table 3.
We find a number of significant correlations between studyand social behavior and GPA. In terms of social behav-ior, we find that students who spend more time partying atfraternities or sororities are less likely to have high GPAs(r = −0.398, p = 0.029). In addition, students that social-ize more at their dorms rather than fraternities prior to themidterm point are more likely to have higher GPAs (r =0.363, p = 0.049). In terms of study behavior, we findstudents who spend more time studying have higher GPAs(r = 0.381, p = 0.038). In addition, students who show anincrease in the amount of time they devote to studying priorto the midterm point (r = 0.397, p = 0.030) are more likelyto have better grades.
In terms of other behaviors inferred from automatic sens-ing, we find a decrease in physical activity throughout theterm particularly after the midterm point negatively corre-lates with spring term GPA (r = −0.576, p = 0.001), mean-ing that students who experience a decrease in their physi-cal activity levels are more likely to have higher GPAs. Wefind similar indoor mobility trends and activity trends dur-ing the day, night, and evening epochs. Interestingly, stu-dents who have higher GPAs tend to increase their indoormobility prior to the midterm point (r = 0.423, p = 0.020),and decrease their indoor mobility after the midterm point(r = −0.515, p = 0.004). In addition, these high achieverstend to spend more time in their dorms throughout the term(r = 0.437, p = 0.016). Finally, we find the perceived stressscale negatively correlates with the spring term GPA, mean-ing students who are less stressed are more likely to havehigher GPAs (r = −0.405, p = 0.050).
Cumulative GPA. The mean of cumulative GPA is 3.4215and the standard deviation is 0.3978. The GPA distribution isshown in Figure 1(c). In the StudentLife study [43], we foundthe cumulative GPA negatively correlates with the means ofactivity duration and indoor mobility; and positively corre-lates with the number of Bluetooth co-locations. Here wepresent results from newly designed features, as shown in Ta-ble 4.
Table 3: Spring Term GPA Correlations.
features r p-value
auto
mat
icse
nsin
g
activity term-slope -0.551 0.002activity post-slope -0.576 0.001activity night term-slope -0.431 0.017activity night post-slope -0.654 < 0.001activity day term-slope -0.411 0.024activity day post-slope -0.442 0.016activity evening term-slope -0.485 0.007conversation freq night breakpoint 0.379 0.039indoor mobility term-slope -0.606 < 0.001indoor mobility pre-slope 0.423 0.020indoor mobility post-slope -0.515 0.004indoor mobility night term-slope -0.529 0.003indoor mobility night pre-slope 0.365 0.047indoor mobility night post-slope -0.543 0.002indoor mobility day term-slope -0.568 0.001indoor mobility day post-slope -0.371 0.048indoor mobility evening term-slope -0.552 0.002dorm duration term-slope 0.437 0.016social duration dorm pre-slope 0.363 0.049party duration mean -0.398 0.029study duration mean 0.381 0.038study duration pre-slope 0.397 0.030
survey perceived stress scale (post) -0.405 0.050
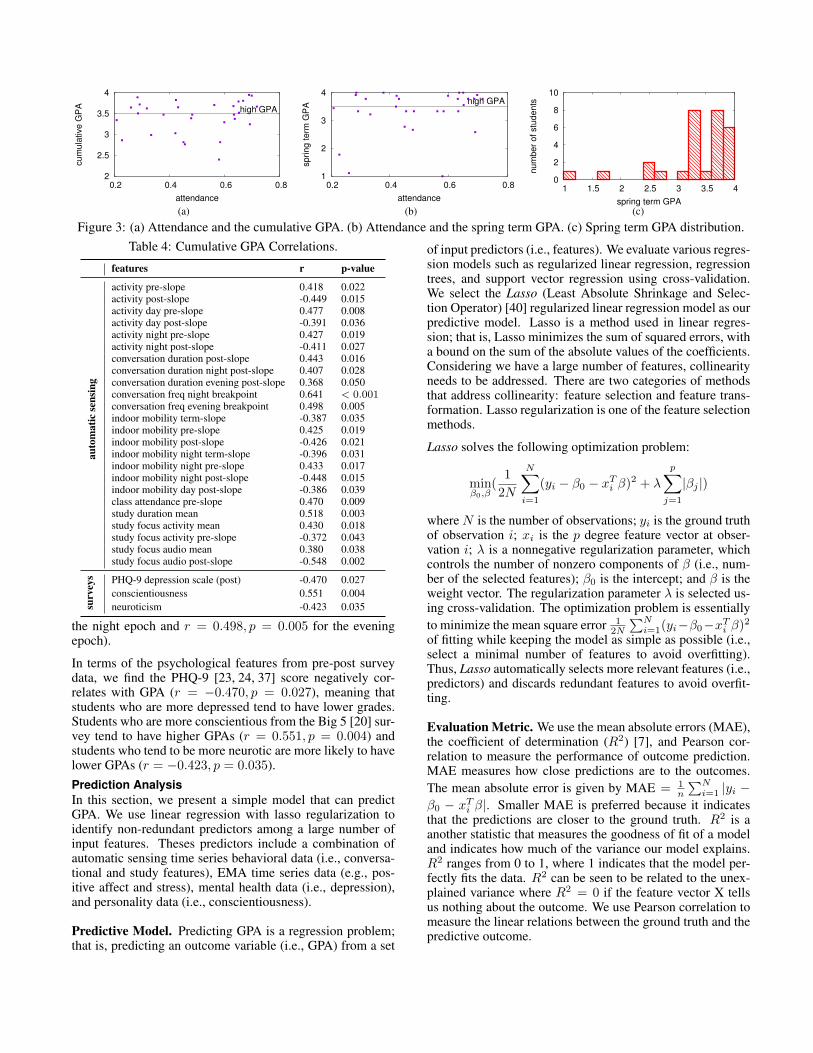
We find a number of significant correlations between studyand social behavior and GPA. Students who spend moretime studying are more likely to have higher GPAs (r =0.518, p = 0.003). In addition, students who are more fo-cused in terms of their activity (i.e., their phone is more sta-tionary, r = 0.430, p = 0.018) and audio (i.e., study in qui-eter environments, r = 0.380, p = 0.038) attributes are morelikely to have higher GPAs. The study focus trends, how-ever, show that students who have higher GPAs tend to havea decreasing focus (i.e., activity attribute) before the midtermpoint and prefer to study at locations that are not quiet (e.g.,cafe area). The attendance rate does not correlate with theGPA as discussed in the StudentLife study [43]. However,we find that a change of attendance before midterm positivelycorrelates with the GPA, meaning that students who increasetheir attendance before midterm point are more likely to havehigher GPAs (r = 0.470, p = 0.009).
In terms of other behaviors inferred from automatic sens-ing, we find significant correlations between GPA and be-havior change trends. Students whose physical activity levelincreases more before midterm (r = 0.418, p = 0.022)or decreases after midterm (r = −0.449, p = 0.015)are more likely to have higher GPAs. Similarly, studentswho move around indoors more toward the midterm (r =0.425, p = 0.019) or move around more after the midterm(r = −0.426, p = 0.021) are more likely to have higherGPAs. Looking at the overall behavioral changes, studentswhose indoor mobility increases more slowly or decreasesthroughout the term are more likely to have higher GPAs(r = −0.387, p = 0.035). In term of daily conversation du-ration, students who have increasing conversation durationsafter the midterm point are more likely to have higher GPAs(r = 0.443, p = 0.016). Regarding the conversation fre-quency, students with later breakpoints (i.e., changed theirdaily conversation frequency pattern later in the term) aremore likely to have higher GPAs (r = 0.641, p < 0.001 for
2
2.5
3
3.5
4
0.2 0.4 0.6 0.8
high GPA
cum
ula
tive G
PA
attendance
(a)
1
2
3
4
0.2 0.4 0.6 0.8
high GPA
spring term
GP
A
attendance
(b)
0
2
4
6
8
10
1 1.5 2 2.5 3 3.5 4
num
ber
of stu
dents
spring term GPA(c)
Figure 3: (a) Attendance and the cumulative GPA. (b) Attendance and the spring term GPA. (c) Spring term GPA distribution.Table 4: Cumulative GPA Correlations.
features r p-value
auto
mat
icse
nsin
g
activity pre-slope 0.418 0.022activity post-slope -0.449 0.015activity day pre-slope 0.477 0.008activity day post-slope -0.391 0.036activity night pre-slope 0.427 0.019activity night post-slope -0.411 0.027conversation duration post-slope 0.443 0.016conversation duration night post-slope 0.407 0.028conversation duration evening post-slope 0.368 0.050conversation freq night breakpoint 0.641 < 0.001conversation freq evening breakpoint 0.498 0.005indoor mobility term-slope -0.387 0.035indoor mobility pre-slope 0.425 0.019indoor mobility post-slope -0.426 0.021indoor mobility night term-slope -0.396 0.031indoor mobility night pre-slope 0.433 0.017indoor mobility night post-slope -0.448 0.015indoor mobility day post-slope -0.386 0.039class attendance pre-slope 0.470 0.009study duration mean 0.518 0.003study focus activity mean 0.430 0.018study focus activity pre-slope -0.372 0.043study focus audio mean 0.380 0.038study focus audio post-slope -0.548 0.002
surv
eys PHQ-9 depression scale (post) -0.470 0.027
conscientiousness 0.551 0.004neuroticism -0.423 0.035
the night epoch and r = 0.498, p = 0.005 for the eveningepoch).
In terms of the psychological features from pre-post surveydata, we find the PHQ-9 [23, 24, 37] score negatively cor-relates with GPA (r = −0.470, p = 0.027), meaning thatstudents who are more depressed tend to have lower grades.Students who are more conscientious from the Big 5 [20] sur-vey tend to have higher GPAs (r = 0.551, p = 0.004) andstudents who tend to be more neurotic are more likely to havelower GPAs (r = −0.423, p = 0.035).Prediction AnalysisIn this section, we present a simple model that can predictGPA. We use linear regression with lasso regularization toidentify non-redundant predictors among a large number ofinput features. Theses predictors include a combination ofautomatic sensing time series behavioral data (i.e., conversa-tional and study features), EMA time series data (e.g., pos-itive affect and stress), mental health data (i.e., depression),and personality data (i.e., conscientiousness).
Predictive Model. Predicting GPA is a regression problem;that is, predicting an outcome variable (i.e., GPA) from a set
of input predictors (i.e., features). We evaluate various regres-sion models such as regularized linear regression, regressiontrees, and support vector regression using cross-validation.We select the Lasso (Least Absolute Shrinkage and Selec-tion Operator) [40] regularized linear regression model as ourpredictive model. Lasso is a method used in linear regres-sion; that is, Lasso minimizes the sum of squared errors, witha bound on the sum of the absolute values of the coefficients.Considering we have a large number of features, collinearityneeds to be addressed. There are two categories of methodsthat address collinearity: feature selection and feature trans-formation. Lasso regularization is one of the feature selectionmethods.
Lasso solves the following optimization problem:
minβ0,β
(1
2N
N∑i=1
(yi − β0 − xTi β)2 + λ
p∑j=1
|βj |)
where N is the number of observations; yi is the ground truthof observation i; xi is the p degree feature vector at obser-vation i; λ is a nonnegative regularization parameter, whichcontrols the number of nonzero components of β (i.e., num-ber of the selected features); β0 is the intercept; and β is theweight vector. The regularization parameter λ is selected us-ing cross-validation. The optimization problem is essentiallyto minimize the mean square error 1
2N
∑Ni=1(yi−β0−xTi β)2
of fitting while keeping the model as simple as possible (i.e.,select a minimal number of features to avoid overfitting).Thus, Lasso automatically selects more relevant features (i.e.,predictors) and discards redundant features to avoid overfit-ting.
Evaluation Metric. We use the mean absolute errors (MAE),the coefficient of determination (R2) [7], and Pearson cor-relation to measure the performance of outcome prediction.MAE measures how close predictions are to the outcomes.The mean absolute error is given by MAE = 1
n
∑Ni=1 |yi −
β0 − xTi β|. Smaller MAE is preferred because it indicatesthat the predictions are closer to the ground truth. R2 is aanother statistic that measures the goodness of fit of a modeland indicates how much of the variance our model explains.R2 ranges from 0 to 1, where 1 indicates that the model per-fectly fits the data. R2 can be seen to be related to the unex-plained variance where R2 = 0 if the feature vector X tellsus nothing about the outcome. We use Pearson correlation tomeasure the linear relations between the ground truth and thepredictive outcome.
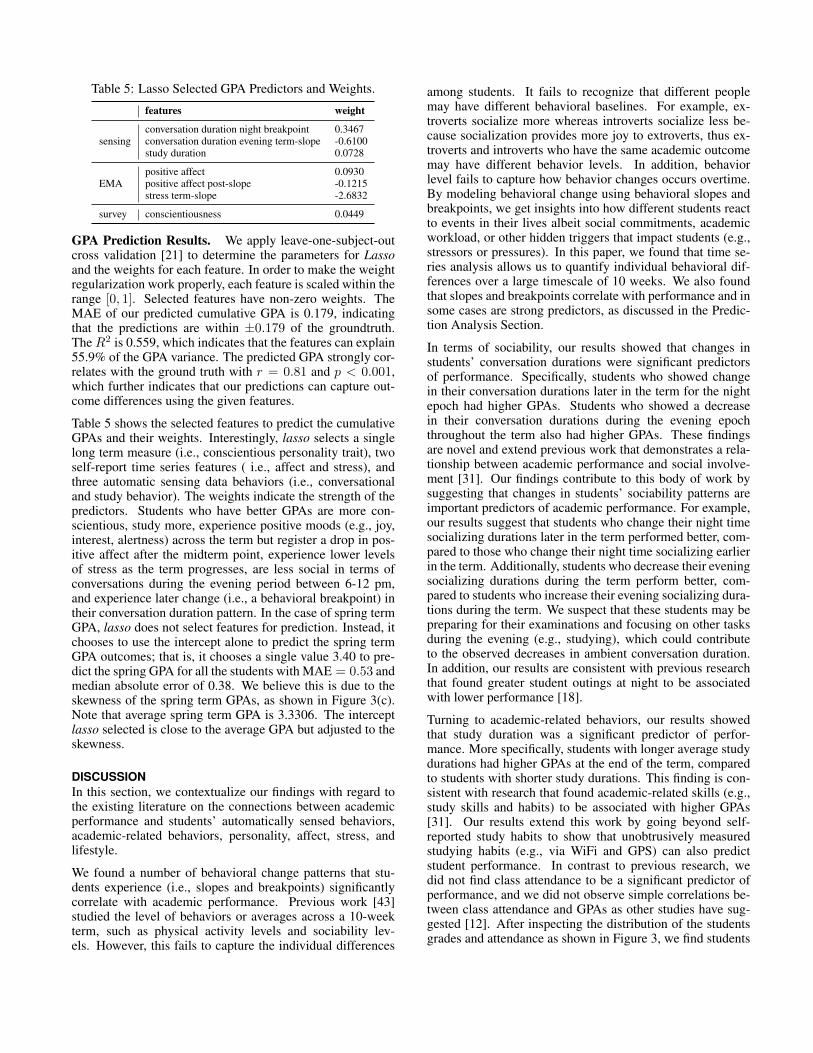
Table 5: Lasso Selected GPA Predictors and Weights.
features weight
sensingconversation duration night breakpoint 0.3467conversation duration evening term-slope -0.6100study duration 0.0728
EMApositive affect 0.0930positive affect post-slope -0.1215stress term-slope -2.6832
survey conscientiousness 0.0449
GPA Prediction Results. We apply leave-one-subject-outcross validation [21] to determine the parameters for Lassoand the weights for each feature. In order to make the weightregularization work properly, each feature is scaled within therange [0, 1]. Selected features have non-zero weights. TheMAE of our predicted cumulative GPA is 0.179, indicatingthat the predictions are within ±0.179 of the groundtruth.TheR2 is 0.559, which indicates that the features can explain55.9% of the GPA variance. The predicted GPA strongly cor-relates with the ground truth with r = 0.81 and p < 0.001,which further indicates that our predictions can capture out-come differences using the given features.
Table 5 shows the selected features to predict the cumulativeGPAs and their weights. Interestingly, lasso selects a singlelong term measure (i.e., conscientious personality trait), twoself-report time series features ( i.e., affect and stress), andthree automatic sensing data behaviors (i.e., conversationaland study behavior). The weights indicate the strength of thepredictors. Students who have better GPAs are more con-scientious, study more, experience positive moods (e.g., joy,interest, alertness) across the term but register a drop in pos-itive affect after the midterm point, experience lower levelsof stress as the term progresses, are less social in terms ofconversations during the evening period between 6-12 pm,and experience later change (i.e., a behavioral breakpoint) intheir conversation duration pattern. In the case of spring termGPA, lasso does not select features for prediction. Instead, itchooses to use the intercept alone to predict the spring termGPA outcomes; that is, it chooses a single value 3.40 to pre-dict the spring GPA for all the students with MAE = 0.53 andmedian absolute error of 0.38. We believe this is due to theskewness of the spring term GPAs, as shown in Figure 3(c).Note that average spring term GPA is 3.3306. The interceptlasso selected is close to the average GPA but adjusted to theskewness.
DISCUSSIONIn this section, we contextualize our findings with regard tothe existing literature on the connections between academicperformance and students’ automatically sensed behaviors,academic-related behaviors, personality, affect, stress, andlifestyle.
We found a number of behavioral change patterns that stu-dents experience (i.e., slopes and breakpoints) significantlycorrelate with academic performance. Previous work [43]studied the level of behaviors or averages across a 10-weekterm, such as physical activity levels and sociability lev-els. However, this fails to capture the individual differences
among students. It fails to recognize that different peoplemay have different behavioral baselines. For example, ex-troverts socialize more whereas introverts socialize less be-cause socialization provides more joy to extroverts, thus ex-troverts and introverts who have the same academic outcomemay have different behavior levels. In addition, behaviorlevel fails to capture how behavior changes occurs overtime.By modeling behavioral change using behavioral slopes andbreakpoints, we get insights into how different students reactto events in their lives albeit social commitments, academicworkload, or other hidden triggers that impact students (e.g.,stressors or pressures). In this paper, we found that time se-ries analysis allows us to quantify individual behavioral dif-ferences over a large timescale of 10 weeks. We also foundthat slopes and breakpoints correlate with performance and insome cases are strong predictors, as discussed in the Predic-tion Analysis Section.
In terms of sociability, our results showed that changes instudents’ conversation durations were significant predictorsof performance. Specifically, students who showed changein their conversation durations later in the term for the nightepoch had higher GPAs. Students who showed a decreasein their conversation durations during the evening epochthroughout the term also had higher GPAs. These findingsare novel and extend previous work that demonstrates a rela-tionship between academic performance and social involve-ment [31]. Our findings contribute to this body of work bysuggesting that changes in students’ sociability patterns areimportant predictors of academic performance. For example,our results suggest that students who change their night timesocializing durations later in the term performed better, com-pared to those who change their night time socializing earlierin the term. Additionally, students who decrease their eveningsocializing durations during the term perform better, com-pared to students who increase their evening socializing dura-tions during the term. We suspect that these students may bepreparing for their examinations and focusing on other tasksduring the evening (e.g., studying), which could contributeto the observed decreases in ambient conversation duration.In addition, our results are consistent with previous researchthat found greater student outings at night to be associatedwith lower performance [18].
Turning to academic-related behaviors, our results showedthat study duration was a significant predictor of perfor-mance. More specifically, students with longer average studydurations had higher GPAs at the end of the term, comparedto students with shorter study durations. This finding is con-sistent with research that found academic-related skills (e.g.,study skills and habits) to be associated with higher GPAs[31]. Our results extend this work by going beyond self-reported study habits to show that unobtrusively measuredstudying habits (e.g., via WiFi and GPS) can also predictstudent performance. In contrast to previous research, wedid not find class attendance to be a significant predictor ofperformance, and we did not observe simple correlations be-tween class attendance and GPAs as other studies have sug-gested [12]. After inspecting the distribution of the studentsgrades and attendance as shown in Figure 3, we find students
who have higher GPAs have either a high or low attendancerate, whereas students who have medium to lower GPAs havea medium attendance rate. The data shows for some high aca-demic performers, attending lectures or not does not affecttheir grades. We believe students’ attendance is determinedby the classes they take. Since all of them take at least oneprogramming class, high achievers may not need to attendlectures to perform well.
In terms of personality, our results showed that conscientious-ness was a significant predictor of performance, such thatstudents higher in conscientiousness had higher GPAs com-pared to students lower in conscientiousness. This findingis consistent with psychological research that examines therelationship between self-reported personality traits and aca-demic performance of college students [28]. Although neu-roticism was not a significant predictor of students’ GPAs, anexamination of the simple correlations between the traits andGPAs shows that neuroticism was negatively associated withcumulative GPA performance (r = −0.42), suggesting thatstudents who are higher in neuroticism have lower GPAs.
In terms of affect, our results showed that positive affect lev-els and change were significant predictors of performance.Specifically, students with higher average levels of positiveaffect had higher GPAs at the end of the term, compared tostudents with lower average levels. Students with decreasingpositive affect after the midterm point also had higher GPAs,compared to students with increasing positive affect. Thesefindings are consistent with previous studies that demon-strate a relationship between greater positive affect and highergrades and GPAs [32]. Interestingly, previous studies havefound that increase in negative affect during the second halfof a semester is associated with lower grades and GPAs [32].However, we found that decreases in positive affect during thesecond half of the term were associated with higher GPAs.We suspect that students who focused on their academic-related tasks and performance during the second half of theterm are less likely to report feeling great positive affect (e.g.,excited, enthusiastic), compared to students who did not .
In terms of stress, our results showed that the change in stressduring the term was a significant predictor of performance,such that students with decreases in stress levels throughoutthe term had higher GPAs at the end of the term. This find-ing is consistent with previous research that finds a negativerelationship between student stress and GPAs (e.g., [30]). Wesuspect that students who performed well in their classes be-came less stressed as the semester progressed, compared tostudents who performed poorly in their classes. This is con-sistent with previous research that found greater stress duringthe end of the semester to be associated with lower GPAs [29].
We are the first to the best of our knowledge that has used au-tomatic sensing data from smartphones and time series EMAsto predict GPA. The predicted GPA strongly correlates withthe groundtruth with r = 0.81 and p < 0.001, MAE is 0.179,R2 is 0.559. We predict GPA without using any priors such asSAT, IQ test results, or knowing students’ grades during theterm. While a student in day-to-day life would likely mea-sure their success via assignment grades and midterm per-
formance, our results show that there are a number of otherpredictors of academic success to consider. Our predictionmodel indicates that students getting better grades are moreconscientious, study more, experiences positive moods acrossthe term but register a drop in positive affect after the midtermpoint, experience lower levels of stress as the term progresses,are less social in terms of conversations during the evening,and experience change in their conversation duration patternlater in the term. The correlations and prediction model dis-cussed in this paper naturally lead to a consideration of po-tential interventions to improve academic performance. Wehypothesize that our work could serve as a catalyst for newforms of real-time interventions to help under-performingstudents improve their academic performance.
We also recognize the limitations of our work. Although thedataset [43] is large, rich, and deep, the number of studentsin the study is small (N=30). Such a small dataset is limitingbecause we cannot use more sophisticated predictive modelsor features because it may lead to overfitting. We see from thepredictive results that Lasso selects only 7 features from 193features despite that we found many more correlations. Next,Dartmouth is an Ivy league liberal arts college. Its undergrad-uates are among the top high school performers. Therefore,our sample is skewed to high performers with good GPAs. Fi-nally, while the students in the sample were not all computerscience majors they all took one class in common [43]: An-droid programming. The samples therefore could be biasedto science students and do not represent the larger cross sec-tion of students found in liberal arts, for example. We believethat a larger scale study with more diverse college studentsacross different universities would present better samples forour study. Such a large scale, cross institutional study wouldoffer more diverse and representative samples allowing us torefine and revalidate our predictive model accordingly.
CONCLUSIONThe SmartGPA study has shown that there a number of sig-nificant correlations between GPA and a number of behav-iors automatically inferred from smartphone sensing data. Wealso presented a number of novel automatic sensing methodsfor assessing the study and social behavior of students, in-cluding, partying instances and duration, and study durationand focus. In our previous StudentLife study [43], we usedsimple averages of all student behaviors over the term andpresented a number of correlations with performance. TheSmartGPA study goes much deeper in our analysis of aca-demic performance and proposes time series analysis of eachstudent’s data streams to best understand individuals’ differ-ences between high and low performers. As part of the anal-ysis we proposed novel methods to assess behavioral changesexperienced by students over the 10-week term – that is, weproposed behavioral slopes and breakpoints to capture chang-ing behaviors. Furthermore, we proposed a simple predictivemodel that use linear regression with lasso regularization ona number of performance predictors. The predicted GPAs arewithin ±0.179 of the groundtruth. Our results open the wayfor novel interventions to improve academic performance.
REFERENCES1. Dartmouth bans hard liquor in effort to end high-risk
and harmful behavior. http://college.usatoday.com/2015/01/31/dartmouth-bans-hard-liquor-in-effort-to-end-high-risk-and-harmful-behavior/.
2. Dartmouth College Weekly Schedule Diagram.http://oracle-www.dartmouth.edu/dart/groucho/timetabl.diagram.
3. Moving dartmouth forward. http://www.dartmouth.edu/~president/forward/.
4. Piazza. https://piazza.com/.
5. Regulations for Graduate Study.http://www.dartmouth.edu/~regarchive/catalog/regulations04/grad.html/.
6. BUYSSE, D. J., REYNOLDS III, C. F., MONK, T. H.,BERMAN, S. R., AND KUPFER, D. J. The pittsburghsleep quality index: a new instrument for psychiatricpractice and research. Psychiatry research 28, 2 (1989),193–213.
7. CAMERON, A. C., AND WINDMEIJER, F. A. R-squaredmeasures for count data regression models withapplications to health-care utilization. Journal ofBusiness & Economic Statistics 14, 2 (1996), 209–220.
8. CHAMORRO-PREMUZIC, T., AND FURNHAM, A.Personality predicts academic performance: Evidencefrom two longitudinal university samples. Journal ofResearch in Personality 37, 4 (2003), 319 – 338.
9. CHEN, F., WANG, R., ZHOU, X., AND CAMPBELL,A. T. My smartphone knows i am hungry. InProceedings of the 2014 Workshop on Physical Analytics(New York, NY, USA, 2014), WPA ’14, ACM, pp. 9–14.
10. COHEN, S., KAMARCK, T., AND MERMELSTEIN, R.A global measure of perceived stress. Journal of healthand social behavior (1983), 385–396.
11. CONARD, M. A. Aptitude is not enough: Howpersonality and behavior predict academic performance.Journal of Research in Personality 40, 3 (2006), 339 –346.
12. CREDÉ, M., ROCH, S. G., AND KIESZCZYNKA, U. M.Class attendance in college a meta-analytic review of therelationship of class attendance with grades and studentcharacteristics. Review of Educational Research 80, 2(2010), 272–295.
13. DEBERARD, M. S., SPIELMANS, G., AND JULKA, D.Predictors of academic achievement and retentionamong college freshmen: A longitudinal study. Collegestudent journal 38, 1 (2004), 66–80.
14. DIENER, E., WIRTZ, D., TOV, W., KIM-PRIETO, C.,CHOI, D.-W., OISHI, S., AND BISWAS-DIENER, R.New well-being measures: Short scales to assessflourishing and positive and negative feelings. SocialIndicators Research 97, 2 (2010), 143–156.
15. FAUSETT, L., AND ELWASIF, W. Predictingperformance from test scores using backpropagation andcounterpropagation. In Neural Networks, 1994. IEEEWorld Congress on Computational Intelligence., 1994IEEE International Conference on (Jun 1994), vol. 5,pp. 3398–3402 vol.5.
16. FURNHAM, A., CHAMORRO-PREMUZIC, T., ANDMCDOUGALL, F. Personality, cognitive ability, andbeliefs about intelligence as predictors of academicperformance. Learning and Individual Differences 14, 1(2002), 47 – 64.
17. GILBERT, S. P., AND WEAVER, C. C. Sleep quality andacademic performance in university students: Awake-up call for college psychologists. Journal ofCollege Student Psychotherapy 24, 4 (2010), 295–306.
18. GOMES, A. A., TAVARES, J., AND DE AZEVEDO, M.H. P. Sleep and academic performance inundergraduates: a multi-measure, multi-predictorapproach. Chronobiology International 28, 9 (2011),786–801.
19. GONZALEZ, E. C., HERNANDEZ, E. C., COLTRANE,A. K., AND MANCERA, J. M. The correlation betweenphysical activity and grade point average for healthscience graduate students. OTJR: occupation,participation and health 34, 3 (2004), 160–167.
20. JOHN, O. P., AND SRIVASTAVA, S. The big five traittaxonomy: History, measurement, and theoreticalperspectives. Handbook of personality: Theory andresearch 2 (1999), 102–138.
21. KOHAVI, R., ET AL. A study of cross-validation andbootstrap for accuracy estimation and model selection.In Ijcai (1995), vol. 14, pp. 1137–1145.
22. KOTSIANTIS, S., AND PINTELAS, P. Predictingstudents marks in hellenic open university. In AdvancedLearning Technologies, 2005. ICALT 2005. Fifth IEEEInternational Conference on (July 2005), pp. 664–668.
23. KROENKE, K., AND SPITZER, R. L. The phq-9: a newdepression diagnostic and severity measure. PsychiatricAnnals 32, 9 (2002), 509–515.
24. KROENKE, K., SPITZER, R. L., AND WILLIAMS, J. B.The phq-9. Journal of general internal medicine 16, 9(2001), 606–613.
25. MARTINEZ, D. Predicting student outcomes usingdiscriminant function analysis.
26. PAULHUS, D. L., AND VAZIRE, S. The self-reportmethod. Handbook of research methods in personalitypsychology (2007), 224–239.
27. POLLAK, J. P., ADAMS, P., AND GAY, G. PAM: aphotographic affect meter for frequent, in situmeasurement of affect. In Proc. of SIGCHI (2011).
28. POROPAT, A. E. A meta-analysis of the five-factormodel of personality and academic performance.Psychological bulletin 135, 2 (2009), 322.
29. RAFIDAH, K., AZIZAH, A., NORZAIDI, M. D.,CHONG, S. C., SALWANI, M. I., AND NORAINI, I.Stress and academic performance: Empirical evidencefrom university students. Academy of EducationalLeadership Journal 13, 1 (2009), 37.
30. RETTINGER, V. W. The relationship between physicalactivity, stress, and academic performance. Doctoraldissertation.
31. ROBBINS, S. B., LAUVER, K., LE, H., DAVIS, D.,LANGLEY, R., AND CARLSTROM, A. Do psychosocialand study skill factors predict college outcomes? ameta-analysis. Psychological bulletin 130, 2 (2004),261.
32. ROGATEN, J., MONETA, G., AND SPADA, M.Academic performance as a function of approaches tostudying and affect in studying. Journal of HappinessStudies 14, 6 (2013), 1751–1763.
33. ROMERO, C., ESPEJO, P. G., ZAFRA, A., ROMERO,J. R., AND VENTURA, S. Web usage mining forpredicting final marks of students that use moodlecourses. Computer Applications in EngineeringEducation 21, 1 (2013), 135–146.
34. ROSS, S. E., NIEBLING, B. C., AND HECKERT, T. M.Sources of stress among college students. Socialpsychology 61, 5 (1999), 841–846.
35. RUSSELL, D. W. UCLA loneliness scale (version 3):Reliability, validity, and factor structure. Journal ofpersonality assessment 66, 1 (1996), 20–40.
36. SCHWARZ, G., ET AL. Estimating the dimension of amodel. The annals of statistics 6, 2 (1978), 461–464.
37. SPITZER, R. L., KROENKE, K., WILLIAMS, J. B.,GROUP, P. H. Q. P. C. S., ET AL. Validation and utilityof a self-report version of prime-md: the phq primarycare study. Jama 282, 18 (1999), 1737–1744.
38. TAMHANE, A., IKBAL, S., SENGUPTA, B.,DUGGIRALA, M., AND APPLETON, J. Predictingstudent risks through longitudinal analysis. InProceedings of the 20th ACM SIGKDD InternationalConference on Knowledge Discovery and Data Mining(New York, NY, USA, 2014), KDD ’14, ACM,pp. 1544–1552.
39. TAYLOR, D. J., VATTHAUER, K. E., BRAMOWETH,A. D., RUGGERO, C., AND ROANE, B. The role ofsleep in predicting college academic performance: Is it aunique predictor? Behavioral sleep medicine 11, 3(2013), 159–172.
40. TIBSHIRANI, R. Regression shrinkage and selection viathe lasso. Journal of the Royal Statistical Society. SeriesB (Methodological) 58, 1 (1996), pp. 267–288.
41. TROCKEL, M. T., BARNES, M. D., AND EGGET, D. L.Health-related variables and academic performanceamong first-year college students: implications for sleepand other behaviors. Journal of American college health49, 3 (2000), 125–131.
42. WALD, A., MUENNIG, P. A., O’CONNELL, K. A.,AND GARBER, C. E. Associations between healthylifestyle behaviors and academic performance in usundergraduates: a secondary analysis of the americancollege health association’s national college healthassessment ii. American Journal of Health Promotion28, 5 (2014), 298–305.
43. WANG, R., CHEN, F., CHEN, Z., LI, T., HARARI, G.,TIGNOR, S., ZHOU, X., BEN-ZEEV, D., ANDCAMPBELL, A. T. Studentlife: Assessing mental health,academic performance and behavioral trends of collegestudents using smartphones. In Proceedings of the 2014ACM International Joint Conference on Pervasive andUbiquitous Computing (New York, NY, USA, 2014),UbiComp ’14, ACM, pp. 3–14.
44. WATANABE, J.-I., MATSUDA, S., AND YANO, K.Using wearable sensor badges to improve scholasticperformance. In Proceedings of the 2013 ACMconference on Pervasive and ubiquitous computingadjunct publication (2013), ACM, pp. 139–142.
45. WATANABE, J.-I., YANO, K., AND MATSUDA, S.Relationship between physical behaviors of students andtheir scholastic performance. In Ubiquitous Intelligenceand Computing, 2013 IEEE 10th InternationalConference on and 10th International Conference onAutonomic and Trusted Computing (UIC/ATC) (2013),IEEE, pp. 170–177.
46. WATSON, D., CLARK, L. A., AND TELLEGEN, A.Development and validation of brief measures ofpositive and negative affect: the panas scales. Journal ofpersonality and social psychology 54, 6 (1988), 1063.
47. XU, R., WUNSCH, D., ET AL. Survey of clusteringalgorithms. Neural Networks, IEEE Transactions on 16,3 (2005), 645–678.
48. ZAFRA, A., ROMERO, C., AND VENTURA, S. Multipleinstance learning for classifying students in learningmanagement systems. Expert Systems with Applications38, 12 (2011), 15020 – 15031.