Embed Size (px)
Citation preview

Policy Research Working Paper 7018
SME Finance in AfricaThorsten Beck Robert Cull
Development Research GroupFinance and Private Sector Development TeamSeptember 2014
WPS7018P
ublic
Dis
clos
ure
Aut
horiz
edP
ublic
Dis
clos
ure
Aut
horiz
edP
ublic
Dis
clos
ure
Aut
horiz
edP
ublic
Dis
clos
ure
Aut
horiz
ed

Produced by the Research Support Team
Abstract
The Policy Research Working Paper Series disseminates the findings of work in progress to encourage the exchange of ideas about development issues. An objective of the series is to get the findings out quickly, even if the presentations are less than fully polished. The papers carry the names of the authors and should be cited accordingly. The findings, interpretations, and conclusions expressed in this paper are entirely those of the authors. They do not necessarily represent the views of the International Bank for Reconstruction and Development/World Bank and its affiliated organizations, or those of the Executive Directors of the World Bank or the governments they represent.
Policy Research Working Paper 7018
This paper is a product of the Finance and Private Sector Development Team, Development Research Group. It is part of a larger effort by the World Bank to provide open access to its research and make a contribution to development policy discussions around the world. Policy Research Working Papers are also posted on the Web at http://econ.worldbank.org. The authors may be contacted at [email protected].
This paper uses cross-country firm-level surveys to gauge access to financial services and the importance of financing constraints for African enterprises. The paper compares access to finance in Africa and other developing regions of the world,
within Africa across countries, and across different groups of firms. It relates firms’ access to finance to firm and bank-ing system characteristics and discusses policy challenges.

SME Finance in Africa
Thorsten Beck and Robert Cull1
JEL Codes: G2; G3; O55 Keywords: Sub-Saharan Africa; Banking; Small- and Medium-Sized Enterprises
1 Beck: Cass Business School; Tilburg University; and CEPR, Cull: World Bank. We would like to thank Ippei Nishida for outstanding research assistance and two anonymous reviewers for useful comments and suggestions.

1. Introduction
The vast majority of firms around the world fall into the category of micro, small or
medium-sized enterprises (SMEs). In terms of enterprises, more than 95% fall into this
category; but even in terms of employment in low and lower-middle income countries, more
than 50% of employees work in companies with fewer than 100 employees (Ayyagari,
Demirguc-Kunt and Maksimovic, 2011a). While SMEs thus constitute an important
component of the private sector in the developing world, they report significantly higher
obstacles to their operation and growth than large enterprises (Beck et al., 2006a). Among
these obstacles, the lack of access to appropriate financial services, especially lending
services, looms large.
Africa’s financial systems are small, shallow and costly, with limited outreach. This is
not just reflected in aggregate financial development indicators but also in firm- and
household data gauging the use of formal financial services (Beck and Cull, 2014). However,
financial systems in Africa have also seen dramatic changes over the past two decades, in
market structure and stability. And there are enormous differences across the region, ranging
from well-developed financial systems in middle-income countries, such as Mauritius and
South Africa, to shallow banking systems offering only the most rudimentary financial
services in impoverished countries like Central African Republic and South Sudan.
This paper surveys the state of SME Finance in Sub-Saharan Africa. We use
Enterprise Survey data from the World Bank to explore cross-country and cross-firm
variation in the use of financial services. We document lower use of financial services by
firms inside than outside Africa and by smaller and younger firms. We use regression
analysis to relate firms’ access to finance to an array of firm and country characteristics and
gauge whether these relationships are different inside and outside Africa. We also discuss
several persistent and new challenges for SME finance in Africa.
2

While a large literature has established a positive impact of financial deepening on
economic growth and poverty alleviation, especially and foremost in developing countries
(Levine, 2005), recent evidence using firm-level data has pointed to SME finance as an
important channel. The literature has identified different channels through which financial
development affects firm and, ultimately, aggregate growth. First, the availability of external
finance is positively associated with the number of start-ups—an important indicator of
entrepreneurship—as well as with firm dynamism and innovation (e.g., Aghion, Fally and
Scarpetta, 2007; Ayyagari, Demirgüç-Kunt and Maksimovic, 2011b). Second, finance allows
existing firms to exploit growth and investment opportunities, and to achieve larger
equilibrium size (e.g., Beck, Demirgüç-Kunt and Maksimovic, 2006b). Finally, firms can
safely acquire a more efficient productive asset portfolio where the infrastructure of finance
is in place, and they are also able to choose more efficient organizational forms such as
incorporation (e.g., Demirgüç-Kunt, Love and Maksimovic, 2006).
This paper also relates to a large literature on firms’ financing obstacles. Following a
seminal paper by Fazzari, Hubbard and Petersen (1988), a large body of empirical literature
has emerged to estimate financing constraints of firms.2 A firm is typically defined to be
financially constrained if a windfall increase in the supply of internal funds results in a higher
level of investment spending. This literature has mostly employed balance sheet data. Beck
et al. (2006a), on the other hand, use firm-level survey data and find that older, larger, and
foreign-owned firms report fewer financing obstacles. A growing literature has been using
firm-survey data to explore country covariates of access to credit and firms’ financing
constraints, focusing, among others, on foreign bank entry (Clarke, Cull and Martinez Peria,
2006), legal system efficiency (Beck, Demirguc-Kunt and Levine, 2005) and regulatory
frameworks (Beck, Demirguc-Kunt and Levine, 2006c).
2 See Schiantarelli (1995) and Hubbard (1998) for surveys.
3

The remainder of this paper is structured as follows. Section 2 provides descriptive
evidence on firms’ access to financial services inside and outside Africa, the size gap in
corporate finance and the importance of financing constraints. Section 3 presents regression
analysis to gauge firm and country covariates of access to credit and differential effects inside
and outside Africa. Section 4 discusses policy challenges for SME finance in Africa and
section 5 concludes.
2. Enterprise access to finance in international comparison
The Enterprise Surveys of the World Bank Group allow a detailed exploration of
variation in the use of financial services across firms with different characteristics. These
surveys have been conducted over the past 10 years in over 100 countries with standardized
survey instruments and a uniform sampling methodology. 3 The surveys try to capture
business perceptions of the most important obstacles to enterprise operation and growth, but
also include detailed information on companies’ management and financing arrangements.
Sample sizes vary between 250 and 1,500 companies per country and data are collected using
either simple random or randomly stratified sampling. The sample includes formal
enterprises of all sizes, different age groups, and different ownership types in manufacturing,
construction, services, and transportation. Firms from different locations, such as the capital
city, major cities, and small towns, are included.
Figure 1 shows that the use of bank loans in Sub-Saharan Africa is lower than in other
developing regions of the world. 4 Across all three size groups (defined by the number of
employees), enterprises within Africa are less likely to have a loan than those outside Africa,
3 See www.enterprisesurveys.org for more details. Similar surveys were previously conducted under the leadership of the World Bank and other IFIs in Africa (Regional Project on Enterprise Development), the Central and Eastern European transition economies (Business Environment and Enterprise Performance Surveys) in the 1990s, and world-wide in 2000 (World Business Environment Survey). 4 Please note that in the following, we will use the expressions Africa and Sub-Saharan African interchangeably. We do not include North African countries in our analysis.
4

with large firms in Africa even less likely to have a loan than mid-sized firms outside Africa.
In terms of having access to checking or saving account facilities, on the other hand, there is
no significant difference between enterprises inside and outside Africa and only a small gap
between small, mid-sized and large enterprises.
Figure 1: Use of formal account and loan services across firm size groups in
international comparison
This graph shows the share of firms with a bank loan and a bank account across three size groups: small (fewer than 20 employees), medium (20 to 99 employees) and large enterprises (100 and more employees). Source: authors’ calculations based on Enterprise Surveys (www.enterprisesurveys.org)
There is not only a gap in the use of lending services across firms of different sizes
but also across firms of different ages, as illustrated in Figure 2. Older firms, defined as firms
with more than 15 years of operation, are more likely to have a loan than firms with between
6 and 15 years of operation, which are in turn more likely to have a loan than enterprises with
five or less years of operation. While these comparisons between African and non-African
countries are illustrative, they do not control for other factors varying across countries. We
will provide a more rigorous analysis in the next section.
0%
10%
20%
30%
40%
50%
60%
70%
80%
90%
100%
loan (non-SSA)
account(non-SSA)
loan (SSA) account(SSA)
small(<20 employees)
medium(20-99)
large(100 and over)
5
Figure 2: Use of formal account and loan services across firm age groups in
international comparison
This graph shows the share of firms with a bank loan and a bank account across three age groups: young firms (five years or less since establishment), medium (6 to 15 years since establishment) and old (over 15 years since establishment). Source: authors’ calculations based on Enterprise Surveys (www.enterprisesurveys.org)
While these two figures suggest an Africa factor in the access to external finance by
enterprises, there is also a large within-regional variation across countries. While only 3
percent of enterprises in Guinea-Bissau have a formal loan, 53 percent do so in Mauritius.
Many of the financially more developed economies also have a larger share of enterprises
with a loan, although the relationship is not linear and there are many outliers. For example,
in South Africa, often seen as one of, if not the, most developed financial systems on the
continent, 34 percent of enterprises have a formal bank loan, while in Burundi, with a
rudimentary banking system and a history of civil conflict, 35 percent have a formal bank
loan. While the difference between the share of large and the share of small enterprises with
a formal bank loan is 64 percent in Angola, it is close to zero in Eritrea. It is interesting to
note that there is no significant correlation between the large-small enterprise gap and the
overall share of enterprises with a formal bank loan across African countries.
0%
10%
20%
30%
40%
50%
60%
70%
80%
90%
100%
Non-SSA SSA
loan account loan account
five years or younger
6 to 15 years
over 15 years
6

Given the limited access to bank loans in Africa, it is not surprising that African
enterprises are more likely to rate access to finance as the most important constraint on their
operation and growth than enterprises outside Africa (Figure 3). More than 25 percent of
firms in Africa rate availability and cost of finance as the most important obstacle, almost
twice as many as outside Africa. Finance is also the most cited obstacle. As shown in
previous work, access to finance is not only a self-reported obstacle, but turns into a growth
constraint, especially for smaller firms and in more shallow financial markets (Beck,
Demirguc-Kunt and Maksimovic, 2005) and is more binding than other constraints
(Ayyagari, Demirguc-Kunt and Maksimovic, 2008).
Figure 3: Obstacles to firms’ operation and growth in international comparison
This graph shows the growth obstacle noted as the most important one by firms in countries in Sub-Saharan Africa and outside Sub-Saharan Africa. Source: authors’ calculations based on Enterprise Surveys (www.enterprisesurveys.org)
Enterprise survey data also allow an exploration of the reasons why enterprises do not
have loans with formal financial institutions. Specifically, enterprises are asked for the
0%
5%
10%
15%
20%
25%
30%
Sub-Saharan Africa
Rest of the World
7

reason that they did not apply for a loan with a formal financial institution over the past year.
Table 1 shows that the share of enterprises that quote lack of demand is significantly lower in
Africa (43%) than in other developing countries (62%), suggesting that lack of demand is a
less important factor in Africa than elsewhere. High interest rates were also mentioned as a
reason for not applying for loans (14% in Africa vs. 10% in other developing countries),
which can have two interpretations. On the one hand, the return on investment projects could
be too low in Africa. On the other hand, and as noted by many observers of African finance,
the high cost of credit might impede the use of bank finance. As discussed above, interest rate
spreads and thus lending rates are significantly higher in Africa than in non-African
developing countries, which suggests that high costs are indeed a valid explanation for why
credit is limited in Sub-Saharan Africa. Those high costs of credit can also be explained not
only by the lack of competition noted above, but also by monetary and socio-political
instability resulting in high risk premia.
The importance of monetary and socio-political stability can be appreciated when
considering that the share of non-applicants due to high interest rates is especially high in
DRC and Zimbabwe. Even more striking is the difference in the share of respondents
indicating that application procedures are the reason for not applying: 16% of non-applicant
enterprises in Africa as opposed to 7% in other developing countries. Collateral requirements
also seem to be more of an impediment in Africa than in other regions of the developing
world (9% vs. 4%), as is the need for bribes (4% vs. 2%). These data point to a large array of
barriers both on the macroeconomic but also on the bank-specific level for enterprises in
Africa to access formal sources of external finance.
8

Table 1: Why do firms not apply for loans?
This table reports the share of firms in low- and lower-middle income countries in and outside Africa (i) that indicate they have a loan; in case they do not if (ii) they applied for a loan over the past year; and if they did not, (iii) the reason of why they did not. Source: authors’ calculations based on Enterprise Surveys (www.enterprisesurveys.org)
How does the limited access of SMEs in Africa relate to the shallow financial markets
documented in the literature (e.g., Beck et al., 2011; Beck and Cull, 2014)? Figure 4 plots the
share of small firms with a formal bank loan against the total bank lending to the private
sector relative to GDP, a standard indicator from the finance and growth literature. African
countries are noted with their respective country codes. Figure 4 shows that while there is a
positive correlation between financial depth and the share of small firms with a formal bank
loan, almost all countries in Sub-Saharan Africa are below the regression line. That is, there
are fewer small African firms with a formal loan than would be predicted by aggregate credit
numbers.
9

Figure 4: Financial Depth vs. Outreach across the World
This graph shows the correlation between the Bank Credit to GDP and the share of small firms with a bank credit across countries. Source: authors’ calculations based on Enterprise Surveys (www.enterprisesurveys.org) and the World Bank’s Global Financial Development Indicators.
3. What explains access to finance by SMEs in Africa and elsewhere?
This section explores the covariates of the likelihood of having a loan from a formal
financial institution. While the graphs in the previous section have shown that larger and
older firms are more likely to have a formal loan and have provided evidence for an African
gap in the use of finance by SMEs, firm size and age might be correlated with other firm
characteristics and the “Africa gap” in corporate finance might reflect the variation in the
composition of the firm population. The following regression analysis will allow us to isolate
the firm characteristics that can explain the use of formal bank loans, gauge the existence of
AGO
BEN
BFA
BWA
CIV
CMR
COG
CPV
GAB
LBR
LSO
MDGMLI
MUS
MWI
NERSLE
TCDTGO
0.00
20.00
40.00
60.00
80.00
(mea
n) s
mal
lfirm
0.00 20.00 40.00 60.00 80.00 100.00(mean) bankcredit
OtherssaFitted values
10

an African gap and assess whether the relationship between firm characteristics and access to
bank loans varies across firms inside and outside Africa.
A. Data and Methodology
We use an enterprise-level dummy variable from the Enterprise Surveys indicating whether a
firm has a loan as the dependent variable in probit regressions that include an array of firm
characteristics as well as country- and sector-specific variables. Specifically, we use the
following probit regression, reporting marginal effects to gauge not only the statistical but
also economic significance:
Loani,j = α + β1 FIRMi + β2 SECTORi + β3 BANKINGj + β4 COUNTRYj + εij (1)
where Loan is the aforementioned dummy variable and FIRM represents a set of variables
that capture enterprise characteristics including size (small, medium, large), age, and
ownership type (foreign, government, or private domestic). In line with the existing literature
and the figures in the previous section, we expect that larger and older firms are more likely
to report that they have a loan. In the regressions that follow, large firm size is the omitted
category and so we expect the coefficients for small and medium-sized firms to be negative
and significant. We have less strong priors about the ownership variables. Government-
owned firms might have greater access to loans in countries with state-dominated financial
systems, but private domestic firms might have better investment projects and thus greater
need for credit. Foreign firms might rely more heavily on alternative sources of funding, such
as from their parent company, than on credit. Private domestic ownership is the omitted
category in the regressions that follow. Again, we lack strong expectations about the sign of
the coefficients for foreign and government ownership.
The firm-level characteristics also include a dummy variable indicating whether the
principal owner of the enterprise is female, which we expect to have a negative coefficient
11

based on the literature (Demirguc-Kunt, Klapper, and Singer, 2013). We also include dummy
variables describing each firm’s organizational type (sole proprietorship, partnership,
privately owned but not a sole proprietorship or partnership, and publicly traded). We expect
that simpler organizational forms, such as sole proprietorships, might find it more difficult to
establish credit histories and amass collateral that would enable them to borrow from external
sources. However, publicly traded firms have access to capital markets, and thus might rely
less on external credit despite greater organizational complexity than other ownership forms.
The omitted organizational form is a category called “other” for firms that were not classified
into one of the four types described above.
For models that include only firm-level characteristics as explanatory variables, we
include country- and sector- fixed effects. We also cluster error terms at the country level to
allow for correlation of error terms within but not across countries. In a second set of
regressions, we replace country dummies with a dummy variable for countries in Sub-
Saharan Africa to gauge whether there is a systematic difference in firms’ access to external
finance in- and outside the region. In a third step we include two country characteristics - the
log of GNI per capita and population density – as explanatory variables. Richer economies
typically have more developed financial systems and Allen et al. (2012) show the importance
of low population density in explaining shallow financial markets in Africa. Finally, we
interact the firm-level characteristics with a dummy for countries in Sub-Saharan Africa to
gauge whether there are differences in the extent to which firm characteristics co-vary with
the use of formal lending services in Sub-Saharan Africa relative to other developing regions.
In this last set of regressions, we also include the dummy variable for Sub-Saharan Africa by
itself.
A second part of the analysis incorporates banking sector characteristics as regressors
to test whether specific features of African banking systems can account for the low levels of
12

credit usage. Where reliable credit histories and collateral registries are underdeveloped, as in
much of Africa, banks must rely on alternative methods to manage credit risk and ensure
repayment, and some types of banking systems may be better at this than others. For
example, where credit registries do not exist, information about existing borrowers is
exchanged informally among bank executives, which is, obviously, only feasible in small and
concentrated banking systems with old-boys networks that in turn strengthen the oligopolistic
nature of such banking systems. There is also a tendency towards personal and bank
guarantees where real estate and mobile assets cannot serve as collateral. Long relationships
between a financial institution, or even a specific loan officer, and the borrower can help
overcome problems of information asymmetry and thus risk (Berger and Udell, 1995).
Recently, a more nuanced view has been put forward that large and foreign banks could have
an advantage relative to other institutions in financing SMEs through arms-length lending
technologies, such as asset-based lending, factoring, leasing, fixed-asset lending, credit
scoring, and centralized organizational structures (see Berger and Udell, 2006 and De la
Torre, Martinez Peria and Schmukler, 2010).
The debate on relationship vs. transaction-based lending techniques also has
implications for which institutions can cater cost-effectively to SMEs. Relationship lending
might be better done by small, community based financial institutions, while transaction-
based lending is more cost-effectively done by large financial institutions that can exploit the
necessary scale economies that investment in technology implies. In many developing
countries, this debate has an additional dimension, as smaller banks are often owned by
domestic shareholders, while large financial institutions are often foreign-owned. Using data
for 91 banks across 45 countries, Beck, Demirguc-Kunt and Martinez Peria (2011) find that
foreign banks are more likely to use transaction-based lending techniques and more
centralized business models than domestic banks. However, they also show that foreign
13

banks do not tend to lend less to SMEs than other banks. Beck, Ioannidou and Schäfer (2012)
show for Bolivia that foreign and domestic banks do indeed cater partly to the same clientele,
but with different lending techniques; foreign banks’ lending depends, however, on the
existence of credit registries and effective collateral protection, an observation confirmed
using cross-country analysis (Claessens and van Horen, 2014). It thus seems that both
relationship and transaction-based lending techniques can be appropriate for SME lending
and that both domestic and foreign-owned banks can cater to SMEs.
We therefore include in the regressions six banking sector variables that proxy for the
prevalence of the alternative lending methods used by different types of banks. First, we
include branch penetration per capita to capture the geographic outreach of the banking
system, a pre-condition for relationship-based lending.5 Next, we include two variables that
measure the shares of banking sector assets held by majority-foreign and majority-
government owned banks, respectively. The omitted category in these regressions is therefore
the share of banking assets held by private domestically owned banks. If the transaction-
based lending techniques favored by foreign banks have expanded access to credit, we would
expect a positive coefficient for the foreign bank asset share variable. At the same time,
despite strong foreign bank presence in Africa, it seems more likely to us that the relationship
lending methods practiced by private domestic banks remain more prevalent than the
transaction-based methods, in which case foreign-owned bank share would have a negative
coefficient. There is, in fact, some cross-country evidence supportive of a negative
relationship between foreign bank presence and credit usage (Detragiache, Tressel, and
Gupta, 2008). For the share of assets held by government banks, it has been argued that state-
owned banks can promote wider access to credit, though supporting empirical evidence is
difficult to come by (Cull and Martinez Peria, 2010). Moreover, after the wave of divestiture
5 We also considered alternative outreach indicators, including the number of loan accounts, but most of those had limited cross-country coverage.
14

by African governments in the 1990s and early 2000s, fewer large state-owned banks exist,
and thus we would expect no strong relationship between government banks’ asset shares and
usage of credit.
A fourth banking sector variable is the share of assets held by the three largest banks
in each country. We use this as a proxy for the prevalence of large banks that can potentially
exploit the necessary scale economies to undertake transaction-based lending. At the same
time, sector concentration could merely reflect a less competitive lending environment, and
the extent to which large banks are currently pursuing transaction lending to previously
underserved market segments is unknown, and so the coefficient for this variable could be
either negative or positive. Finally, we include two variables that measure banking sector
efficiency: the ratio of overhead costs to total banking assets and the net interest margin.
Relationship lending is typically more costly per dollar lent than transaction-based
approaches, which is reflected in higher interest margins. These variables can therefore be
seen as proxies for the prevalence of relationship lending. Depending on whether relationship
or transactions-based approaches are more effective at expanding credit usage, the
coefficients for these variables could be positive or negative. At the same time, within Africa,
it could be that relationship lending is far less efficiently pursued than in other regions, and
that transaction-based approaches have been slow to take off. A negative coefficient for the
overheads and interest margins variables would therefore be interpreted as a reflection of low
credit usage stemming from an inefficient banking system.
The models that include country-level banking variables are similar to those that
include only firm-level characteristics as explanatory variables in many respects. Both
include sector fixed effects and error terms are clustered at the country level to allow for
correlation of error terms across firms within a country. We also interact the firm-level
characteristics with a dummy for countries in Sub-Saharan Africa to gauge whether there are
15

differences in the extent to which those variables co-vary with the use of formal lending
services in Sub-Saharan Africa relative to other developing regions. One key difference,
however, is that the models that incorporate banking variables cannot include country fixed
effects because those variables tend to be time-invariant.
In a final set of regressions, we interact the banking variables with firm characteristics
to test whether specific features of banking systems are associated with reduced credit usage
for certain types of firms. For example, concentrated financial systems might imply less
credit usage among informationally opaque small firms. We conclude by allowing those
interactions to have different coefficients for Africa than for the rest of the developing world.
This enables us to test whether relationships between banking characteristics, firm
characteristics, and credit usage are less (or more) pronounced in Africa.
B. Regression Results
The results in Table 2 indicate that smaller firms are around 30 percent and medium-
size firms 13 to 14 percent less likely to have a formal loan than large firms. We also find that
foreign-owned firms are about eight percent less likely to have a formal loan, presumably
because they have access to internal funding within the multinational enterprise.
Government-owned firms are also less likely to use formal lending than other firms. Older
firms are more likely to have a formal loan. There is also some evidence that firms organized
as partnerships and sole proprietorships, the simplest organizational forms, are less likely to
have a formal loan. All of these results for the firm characteristics variables are in line with
the literature and our hypotheses. All columns include sectoral dummies, with error terms
clustered at the country level to control for omitted variables leading to correlation among
error terms. While column 1 contains country fixed effects, we replace them in column 2
16

with a dummy for Sub-Saharan Africa, which enters negatively and significantly at the 1
percent level. The coefficient estimate indicates that even after controlling for firm
characteristics, African firms are 19 percent less likely to have a bank loan.
In column 3, we include dummy variables for all six World Bank regions as well as
two time-variant country variables, the log of GNI per capita and population density. We
find that firms in more densely populated countries are more likely to have a bank loan, while
the income level is not significantly associated with the likelihood of having a loan. We also
find that compared to the Latin America and Caribbean region (the omitted region), firms in
South Asia, North Africa and the Middle East, and Europe and Central Asia are less likely to
have a bank loan, with the effect even stronger for North Africa and the Middle East than for
Sub-Saharan Africa.
The results in column 4 of Table 2 indicate that some of the firm characteristics are
related to firms’ access to finance in a different manner within Africa than outside. Here, we
interact the firm characteristics with the dummy variable for Sub-Saharan Africa to test
whether those characteristics relate to formal credit usage differently in Africa than in other
developing regions. Coefficients for most of the firm characteristics, which now summarize
relationships outside Africa, are similar to those in models 1 and 2. Small-, and medium-
sized, and foreign- and government-owned firms are significantly less likely to have loans.
The interactions for the age and firm size variables with the Africa dummy variable are
insignificant, indicating that the same relationships hold in Africa as elsewhere. The
interaction between the Africa dummy and foreign ownership is positive and significant, and
of similar size as the negative coefficient for the foreign ownership variable. This suggests
that foreign ownership reduces the likelihood of having a formal loan, though this effect is
not significant in Africa as indicated by the p-value for the sum of the two coefficients at the
bottom of the table. While privately owned firms (that are not sole proprietors or
17
partnerships) are more likely to have access to external finance outside Africa, they are less
likely to have access to external finance in Africa as the sum of the positive level and
negative interaction effects is negative (though insignificant). Sole proprietorships are less
likely to have access to external finance in- and outside Africa, with the effect being stronger
in Africa, as indicated by the negative and significant interaction term.
While the female manager dummy does not enter significantly by itself, its interaction
with the Africa dummy enters positively and significantly. P-values at the bottom of the
table show that the sum of the female manager coefficient and its interaction with Africa is
significantly greater than zero, indicating that female-managed firms are also more likely to
have credit than male-managed firms in Sub-Saharan Africa. These findings are somewhat
consistent with results documented by Aterido, Beck and Iacovone (2013) using the same
data source for African countries, who did not find any significant relationship between
female ownership or management and access to credit. They explain their findings with
differences in key characteristics and a potential selection bias – enterprises with female
ownership participation are smaller and younger, and female entrepreneurs are less likely to
run sole proprietorships than men. Furthermore, such firms are more likely to innovate and
more prevalent in sectors that tend to rely less on access to external finance.
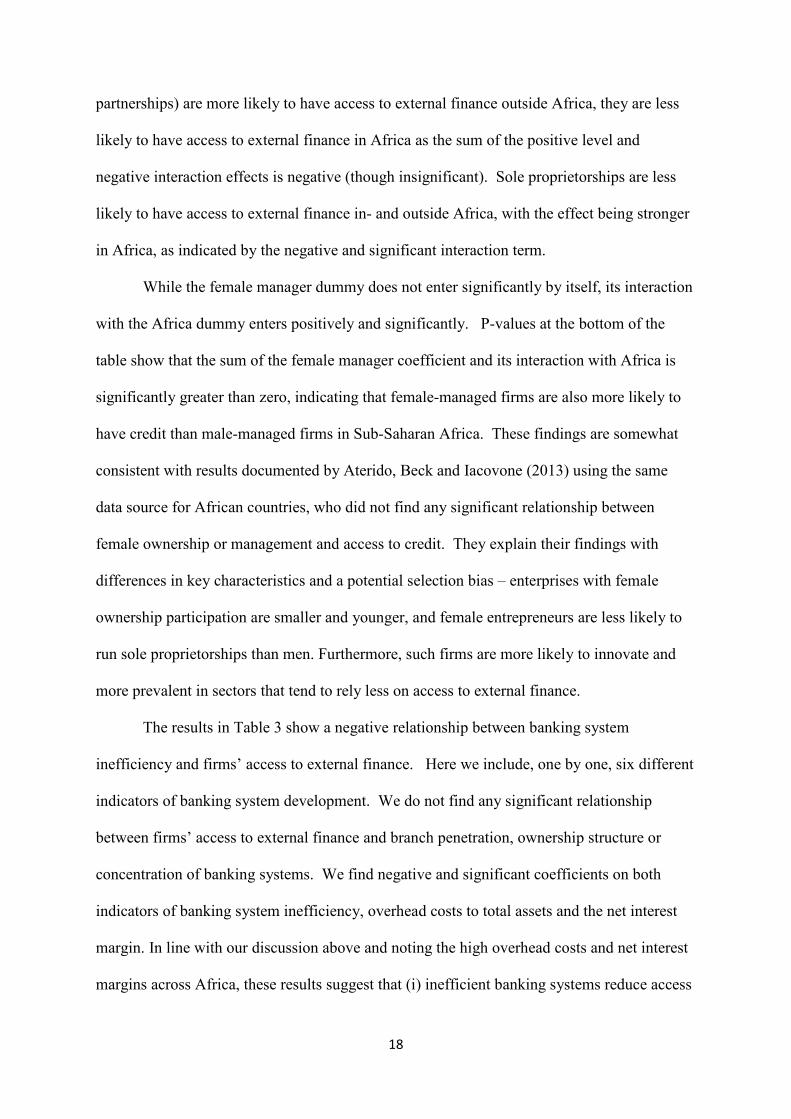
The results in Table 3 show a negative relationship between banking system
inefficiency and firms’ access to external finance. Here we include, one by one, six different
indicators of banking system development. We do not find any significant relationship
between firms’ access to external finance and branch penetration, ownership structure or
concentration of banking systems. We find negative and significant coefficients on both
indicators of banking system inefficiency, overhead costs to total assets and the net interest
margin. In line with our discussion above and noting the high overhead costs and net interest
margins across Africa, these results suggest that (i) inefficient banking systems reduce access
18

of African firms to external finance and (ii) relationship lending is still used across most of
Africa and the resulting high costs are related to limited access to external finance by
enterprises. Our previous findings on firm characteristics and their interaction with the
Africa dummy and the two other country characteristics (average income level and
population density) are confirmed in Table 3.
In our final set of regressions in Table 4, we include interactions between banking
variables and firm size and we allow their effects to differ for African firms. This enables us
to examine whether specific banking sector characteristics have differential relationships with
the credit usage of small and medium-sized firms in Africa. All models in Table 4 control
for the same firm characteristics (and their interactions with the Africa dummy variable) as in
Tables 2 and 3, though we do not show all of those coefficients to conserve space. As only
overhead costs to total assets and the net interest margin entered significantly in Table 3, we
focus on these two variables. The negative coefficients for small- and medium-sized firms
are very stable in both models, as is the negative coefficient on the Africa dummy. While the
net interest margin enters negatively and significantly, the overhead cost variable does not
enter significantly by itself. However, we find significant and negative interaction terms
between the small and medium-sized firm dummies and overhead costs, indicating that bank
inefficiency is negatively associated with SMEs’ access to external finance. None of the
other double interaction terms enters significantly nor the triple interaction terms between
firm size dummies, the Africa dummy and overhead costs. In the case of net interest margin,
we find a positive and significant interaction term between the Africa dummy and the net
interest margin, which is of similar size to the negative and significant coefficient on net
interest margin. This suggests that in the case of Sub-Saharan Africa, there is no significant
relationship between net interest margins and firms’ access to external finance, unlike in
other developing regions of the world.
19

In all, the regressions in this section suggest that while many of the same firm
characteristics are associated with having formal loans in Africa as in other parts of the
developing world, such as firm age and size, other relationships differ. Most notably, African
female-managed firms appear to fare better in formal credit markets than both firms managed
by females in other developing regions and those managed by African males. This could be
because so few African firms are managed by women and those that survive are of high
quality and because of the other selection biases described above. Firms organized as sole
proprietorships and partnerships also appear to fare worse in Africa in formal credit markets
than in other developing regions. On the other hand, there is no significant evidence that
banking sector characteristics are more or less significant factors in explaining the lack of
African firms’ access to external finance than firms in non-African developing countries.
4. SME finance in Africa – quo vadis?
The previous section provided a snapshot of firm and country characteristics that can
explain access to bank finance by firms in Africa. Some of these findings relate directly to
several on-going policy debates in the SME space. We will briefly review some of these
recent developments and debates in this section.
A first important area, already referred to above, is the lending techniques by banks in
combination with the ownership structure of banking systems. While we did not find any
significant relationship between foreign bank penetration and access to credit within Africa, a
more granular view is needed. While the share of foreign-owned banks has further increased
over the past twenty years, the composition of the foreign bank population has changed
significantly, with a higher share of banks from other emerging markets, including from
within Africa (Beck et al., 2011). These banks can bring expertise from similar markets with
20

them, while having the advantage of less organizational and hierarchical distance to their
parent banks (Mian, 2006).
There are also specific transaction- and asset-based lending techniques that can be
useful for catering to smaller and informationally more opaque companies. Leasing can be a
prominent instrument for SME financing, especially for Africa. First, collateral requirements
have been well documented as one of the main impediments that prevent African SMEs from
accessing traditional forms of financing needed to acquire machinery and equipment. Leasing
is asset-backed and its applications are often assessed based on the project’s capacity to
service lease payments. Accordingly, businesses and entrepreneurs that are denied traditional
banking and commercial credit due to their lack of credit history and inability to provide
sufficient guarantees can find a new financing alternative in the leasing market. This can also
bring more businesses into the formal sector. Second, unlike bank credit, leasing directly
provides the asset instead of financial resources needed to acquire it, which reduces the
possibility to divert funds from their intended purposes. Leasing contracts involve less
paperwork and more relaxed credit requirements as well, which leads to shorter waiting
periods than for bank loans.
Similarly, factoring, the discounting of sales receivables, is attractive for small
suppliers of large credit-worthy buyers, as it does not rely on information about the
“borrower”, but rather on the obligor (Klapper, 2006). Under a factoring contract, the factor
purchases the seller's accounts receivable, with or without recourse, and assumes the
responsibility to collect repayments. Originally limited to domestic contracts, international
factoring has become popular as it eases the credit and collection burden created by
international sales for exporters. Like leasing companies, factoring companies can only
function with a legal framework governing these transactions, but they rely to a lesser extent
21

on the contractual framework of a country, so that they can help push a financial system
towards the frontier of SME lending, even if this frontier is low.
A second important area is financial innovation, which includes new players and new
products. While financial innovation has obtained a bad reputation in many developed
financial systems, Africa critically depends on innovative activity by existing and new
financial institutions. Transaction-based lending to SMEs can be seen as one such innovation.
Other innovations include psychometric assessments as a viable low-cost, automated
screening tool to identify high-potential entrepreneurs and evaluate risk and future potential,
which have proven very successful in initial pilots in South Africa and other countries.
Complementing credit services with other “extension-type” services, such as business
development or entrepreneurial training can also be helpful. In general, taking a page from
the microfinance lending manual might prove helpful in approaching smaller firms, which
face not only financing but an array of other business constraints.
It is important to note that financial innovation does not arise by itself, but is a
consequence of a competitive financial system with regulation that is not overly burdensome.
It requires an open and flexible regulatory and supervisory approach that balances the need
for financial innovation with the need to watch for fragility emerging in new forms. Such an
approach has to take into account the unexpectedness of innovation, in terms of needs,
technical possibilities and origin.
Throughout most of the paper, we have focused on bank financing, as Africa’s
financial systems are heavily bank-based, in line with its level of economic and financial
development and the small size of most financial systems on the continent. However, new
providers, techniques and products might as well come from outside the banking system and
bring competitive pressures on incumbent banks. Leasing and factoring, two financing
techniques mentioned above, can be offered by banks, but also by specialized non-bank
22

financial institutions. Further, one important constraint on bank finance is the lack of equity
in enterprises. High leverage can prevent enterprises from pursuing more debt, so that lack of
equity rather than lack of debt is the binding constraint. On a more general level, equity can
be a potentially beneficial financing source for enterprises in their early years and for
enterprises with a high risk profile. On the other hand, there are few if any instruments and
vehicles for equity finance available in most African countries. Increasingly, there are some
equity funds across Africa that specialize in SMEs. Business Partners International (BPI)
Kenya SME Fund is a private fixed-life fund established in 2006, which invests in equity,
quasi-equity and debt of Kenyan SMEs and has been very successful, ultimately attracting
external financing from donors and private sources. There are several Aureos Capital Funds,
focusing on East, West and South Africa, respectively, set up with support from donors.
A fourth important topic concerns a more granular analysis of SMEs. It is important to
distinguish between segments within this group of enterprises that have different financing
needs and profiles. A large share of enterprises in Africa consists of informal
microenterprises whose establishment is often the result of a lack of alternative economic
opportunities. Not being able to produce formal financial accounts or formal guarantees, it is
hard to see this segment of the enterprise population becoming bankable over the medium- to
long-term, at least not for credit services. They seem a natural target group for microcredit
institutions and rely more heavily than other enterprises on informal finance providers. A
second segment is medium-sized enterprises, often well established and often export-oriented
companies. In most cases they have access to bank finance, but struggle to get access to
equity finance, including through financial markets. Finally, there are small formal
enterprises, some of which might have high growth potential. These firms – often also
referred to as the missing middle – are usually too big for microfinance institutions, but not
23

formal or established enough for banks. It is especially this last segment that seems to be
affected by shallow financial markets.
Another important distinction, partly overlapping with the size distinction is that
between subsistence or lifestyle entrepreneurs and transformational entrepreneurs. Many of
the subsistence or lifestyle enterprises are set up out of lack of alternative employment
options for the owner in the formal sector. They rely almost exclusively on the owner, maybe
with support from family members and/or friends. Very different from these subsistence
entrepreneurs are transformational entrepreneurs, who are often leading larger enterprises that
create jobs, while microfinance clients are only rarely of the transformational kind. For long-
term effects on aggregate growth and job creation, a stronger focus on transformational
enterprises is therefore needed. 6
The distinction between subsistence and transformational entrepreneurs is also
important when assessing the impact of policy reforms. Bruhn (2013), for example, finds that
easing the process of business registration in Mexico led to an increase of business
registration among entrepreneurial types, but a decrease among wage earner type
entrepreneurs who were rather more likely to become wage earners after the reform.7
Similarly, Aterido, Hallward-Driemeier and Pages (2009) show that the distinction between
small and micro-enterprises can be a very important one. Using enterprise survey data across
90 countries, they show that small firms with more than 10 employees are negatively affected
by an adverse business environment to a larger extent than micro-enterprises with fewer than
10 employees.
6 Among transformational enterprises, there is often a further emphasis on “gazelles”, enterprises with exceptionally high growth rates over longer periods. 7 These differential effects are similar to recent work in the area of microfinance, where different effects of access to credit have been documented depending on the characteristics of the borrower (entrepreneurial type or not). See, for example, Banerjee et al. (2009).
24

5. Conclusions and looking forward
This paper documented firm and country covariates of SMEs’ access to finance across
Africa. We showed that enterprises in Africa are less likely to have a loan than in other
developing regions of the world. While many of the firm and country covariates explaining
access to bank financing are similar inside and outside Africa, we also find some interesting
differences.
We also pointed to continuing and new challenges in the SME financing space in
Africa. In this concluding section, we discuss the implications for research. Over the past
decade, an array of new data sources has enabled more rigorous research into SMEs’
operational and growth obstacles. In addition to aggregate financial sector indicators, the
Enterprise Survey Data we have drawn on heavily in this paper have enabled a more granular
look by allowing for differentiation between firms of different size, age, ownership and
geographic location. More recently, these surveys have also been undertaken as panels, i.e.
with the same firms being surveyed in subsequent waves, rather than as repeated cross-
sectional surveys, which provides additional insights and allows additional hypothesis testing.
Country-specific surveys of SMEs undertaken in, among others, South Africa and Kenya that
focus on financing issues can provide additional insights. As in other regions, bank-level
surveys that provide insights into banks’ operating constraints in specific markets and their
lending techniques are becoming more popular and can provide additional important
information, as for example reported by Berg and Fuchs (2013).8 As credit registries are
being established and collecting an increasing amount of information on borrowers and loans,
this information can be a critical input into research, as is being done for other low- and
middle-income countries. These additional, micro-level databases will thus provide an
8 This is similar to a cross-country survey undertaken by Beck, Demirguc-Kunt and Martinez Peria (2011), country-specific surveys as reported in De la Torre, Martinez Peria and Schmukler (2010), and the EBRD’s Bank Environment and Performance Survey (BEPS) for the former transition economies.
25

important impetus for further research. They can enable assessments of different lending
techniques, delivery channels and organizational structures conducive to small business
lending. They can also be used to gauge the impact of specific interventions or policy
reforms.
A second important area is that of entrepreneurship. Behind the growth of firms are
individuals with different levels of motivation, education and management skills.
Understanding the characteristics of successful entrepreneurs, and the effects of social
networks and education, is important. The gender issue has also become an increasing focus,
with research moving beyond simple gender comparisons to exploring different socio-
economic and psychological characteristics of female and male entrepreneurs, e.g. risk
aversion, and their effects on access to and use of financial services and entrepreneurial
performance. Another important area, connected to entrepreneurship, relates directly to
behavioral economics. Experimental economics can give important insights into issues such
as cooperation between entrepreneurs and network building.
26
References
Aghion, Philippe, Thibault Fally and Stefano Scarpetta. 2007. Credit Constraints as a Barrier to the Entry and Post-Entry Growth of Firms. Economic Policy 22, 731-79. Allen, Franklin, Elena Carletti, Robert Cull, Jun Qian, Lemma Senbet, and Patricio Valenzuela. April 2012b. “Resolving the African Financial Development Gap: Cross-country Comparisons and a Within-country Study of Kenya,” National Bureau of Economic Research Working Paper 18013, Cambridge, MA. Aterido, Reyes, Thorsten Beck and Leonardo Iacovone , 2013, “Access to Finance in Sub-Saharan Africa: Is There a Gender Gap?”, World Development 47, 102-120. Aterido, Reyes, MaryHallward-Driemeier, and Carmen Pages 2009. Big Constraints on Small Firms’ Growth. World Bank Policy Research Working Paper 5032. Ayyagari, Meghana, Asli Demirguc-Kunt and Vojislav Maksimovic, 2008. How Important Are Financing Constraints? The Role of Finance in the Business Environment. World Bank Economic Review 22, 483-516. Ayyagari, Meghana, Asli Demirguc-Kunt and Vojislav Maksimovic, 2011a. Firm Innovation in Emerging Markets: The Role of Finance, Governance, and Competition. Journal of Financial and Quantitative Analysis 46, 1545-80. Ayyagari, Meghana, Asli Demirguc-Kunt and Vojislav Maksimovic, 2011b. Small vs. Young Firms Across the World: Contribution to Employment, Job Creation, and Growth. World Bank Policy Research Working Paper 5631. Banerjee, Abhijit, Esther Duflo, Rachel Glennerster and Cynthia Kinnan. 2009. The Miracle of Microfinance? Evidence from a Randomized Evaluation. MIT Mimeo. Beck,Thorsten and Robert Cull. 2014. Banking in Africa. In: Berger, Allen, Phil Molyneux and John Wilson (Eds.): Oxford Handbook of Banking, 2nd edition. Beck, Thorsten, Asli Demirgüç-Kunt, and Ross Levine. 2005. “Law and Firms’ Access to Finance.” American Law and Economics Review 7, 211–252. Beck, Thorsten, Aslı Demirgüç-Kunt, Luc Laeven and Vojislav Maksimovic. 2006a. The Determinants of Financing Obstacles. Journal of International Money and Finance 25, 932-52. Beck, Thorsten, Asli Demirgüç-Kunt, and Ross Levine. 2006c. “Bank Supervision and Corruption in Lending.” Journal of Monetary Economics 53, 2131–2163.
27

Beck, Thorsten, Aslı Demirgüç-Kunt, and Vojislav Maksimovic. 2006b. The Influence of Financial and Legal Institutions and Firm Size. Journal of Banking and Finance 30, 2995-3015. Beck, Thorsten, Aslı Demirgüç-Kunt, and Vojislav Maksimovic. 2005. Financial and Legal Constraints to Firm Growth: Does Firm Size Matter? Journal of Finance 60, 137-177. Beck, Thorsten, Aslı Demirgüç-Kunt, and Maria Soledad Martinez Peria. 2011. Banking Financing for SMEs: Evidence Across Countries and Bank Ownership Types, Journal of Financial Services Research 39, 35-54. Beck, Thorsten, Vasso Ioannidou and Larissa Schäfer. 2012. Foreigners vs. Natives: Bank Lending Technologies and Loan Pricing, mimeo. Beck, Thorsten, Samuel Munzele Maimbo, Issa Faye and Thouraya Triki. 2011. Financing Africa: Through the Crisis and Beyond. Washington DC. Berg, Gunhild and Michael Fuchs. 2013. Bank Financing of SMEs in Five Sub-Saharan African Countries: The Role of Competition, Innovation and the Government. World Bank Policy Research Working Paper 6563. Berger, Allen N. and Gregory F. Udell. 1995. Relationship Lending and Lines of Credit in Small Firm Finance. The Journal of Business 68, 351-81. Berger, Allen N. and Gregory F. Udell. 1998. The Economics of Small Business Finance: The Roles of Private Equity and Debt Markets in the Financial Growth Cycle. Journal of Banking and Finance 22, 613-673. Berger, Allen N. and Gregory F. Udell. 2006. A More Complete Conceptual Framework for SME Finance. Journal of Banking and Finance 30, 2945-66. Bruhn, Miriam, 2013. A Tale of Two Species: Revisiting the Effect of Registration Reform on Informal Business Owners in Mexico. Journal of Development Economics 103, 275-83. Claessens, Stijn and Neeltje van Horen. 2014. Foreign Banks: Trends and Impact. Journal of Money, Credit and Banking, forthcoming. Clarke, George, Robert Cull and Maria Soledad Martinez Peria, 2006. Foreign Bank Participation and Access to Credit Across Firms in Developing Countries. Journal of Comparative Economics 34, 774-795. Cull, Robert, and Maria Soledad Martínez Peria, 2010. “Foreign Bank Participation in Developing Countries: What Do We Know about the Drivers and Consequences of This Phenomenon?” World Bank, Policy Research Working Paper 5398. De la Torre, Augusto, Maria Soledad Martinez Peria, and Sergio Schmukler, 2010. Bank Involvement with SMEs: Beyond Relationship Lending. Journal of Banking and Finance 34, 2280-93.
28

Demirgüç-Kunt, Aslı, Inessa Love, and Vojislav Maksimovic. 2006. Business Environment and the Incorporation Decision. Journal of Banking and Finance 30, 2967-93. Demirgüç-Kunt, Aslı, Leora Klapper and Dorothe Singer. 2013. Financial Inclusion and Legal Discrimination Against Women: Evidence from Developing Countries. World Bank Policy Research Working Paper 6416. Detragiache, Enrica, Thierry Tressel, and Poonam Gupta, 2008, “Foreign Banks in Poor Countries: Theory and Evidence.” Journal of Finance, Vol. 63, No. 5, pp. 2123-60. Fazzari, S., Hubbard G., Petersen B., 1988. Financing constraints and corporate investment. Brookings Papers on Economic Activity 1, 141-95. Hubbard, G., 1998. Capital market imperfections and investment. Journal of Economic Literature 36(3), 193-225. Klapper, Leora. 2006. The Role of “Reverse Factoring” in Supplier Financing of Small and Medium Sized Enterprises. Journal of Banking and Finance 30, 3111-30. Levine, Ross, 2005, Finance and Growth: Theory and Evidence. In: Aghion, P and Durlauf, S. (eds.), Handbook of Economic Growth. Elsevier Science. The Netherlands. Mian, Atif. 2006. Distance Constraints: the Limits of Foreign Lending in Poor Economies. Journal of Finance 61, 1465-1505. Schiantarelli, F., 1995. Financial constraints and investment: a critical review of methodological issues and international evidence. In: Peek J., Rosengren E. (Eds.), Is Bank Lending Important for the Transmission of Monetary Policy? Federal Reserve Bank of Boston, Boston, MA.
29

Table 2 The dependent variable is a dummy variable indicating whether the firm has a bank loan. P-values are in brackets. *, **, *** represent statistical significance at the 10%, 5%, and 1% level respectively. All models are estimated via Probit model (reporting marginal effects). All models include Sector 1-15 control dummies (model 1 includes country dummies as well) although we do not present them to conserve space. Standards errors allow for clustering at the country level. In regional dummies, we are omitting Latin America and the Caribbean category. Foreign- and government-owned are dummy variables indicating foreign or government participation in ownership. Log of age is log of years since establishment. Small and medium size are dummies indicating firms with fewer than 20 and between 20 and 99 employees, respectively. Female manager indicates that the main manager of the firm is female. Partnership, Private (but not partnership or sole proprietorship), Sole (proprietorship) and Public (listed) are dummy variables indicating the legal status of the firm. The log of Gross National Income (GNI) per capita is measured in USD and population density is midyear population divided by land area in square kilometres.
Dependent variable Loan
Basic No country FE
Add Africa dummy
No country FE Add Africa
dummy, regional
dummies, and country
features
No country FE Add Africa
dummy, regional
dummies, and country features and interactions
(1) (2) (3) (4)
Firm
Foreign owned -0.0848*** -0.0619*** -0.0806*** -0.1057***
[0.000] [0.001] [0.000] [0.000] Government owned -0.0345* -0.0781*** -0.0726* -0.0809**
[0.100] [0.006] [0.081] [0.042] Log of Age 0.0159*** 0.0369*** 0.0195** 0.014
[0.000] [0.000] [0.021] [0.182] Small size -0.3073*** -0.2986*** -0.2929*** -0.2968***
[0.000] [0.000] [0.000] [0.000] Medium size -0.1388*** -0.1317*** -0.1267*** -0.1281***
[0.000] [0.000] [0.000] [0.000] Female manager -0.015 -0.017 -0.0075 -0.0221
[0.162] [0.509] [0.647] [0.200] Partnership -0.014 -0.0875* -0.0576* -0.0428
[0.585] [0.052] [0.077] [0.287] Private 0.0275 0.0039 0.0233 0.0478*
[0.214] [0.902] [0.323] [0.067] Sole -0.0305 -0.1072*** -0.0829*** -0.0306
[0.203] [0.002] [0.006] [0.365] Public -0.0148 -0.0889*** -0.0674** -0.0481
[0.634] [0.003] [0.044] [0.196]
Regional dummies
Africa -0.1898*** -0.2257*** -0.1742*
[0.000] [0.000] [0.056] East Asia and Pacific -0.082 -0.0911
[0.170] [0.130] Europe and Central Asia -0.0822* -0.0834*
[0.080] [0.082] Middle East and North Africa -0.3068*** -0.3154***
[0.000] [0.000] South Asia -0.1838** -0.1940**
[0.049] [0.030]
Country features
Log of GNI per capita 0.0294 0.028
[0.134] [0.152] Population density 0.0003** 0.0003** [0.037] [0.019]
Interactions (Firm*Africa)
Foreign owned * Africa 0.0765**
[0.011] Government owned * Africa 0.0884
[0.156] Log of Age * Africa 0.0125
[0.410] Small size * Africa 0.0099
[0.771] Medium size * Africa -0.004
[0.904] Female manager * Africa 0.1095***
[0.005] Partnership * Africa -0.0737
[0.275] Private * Africa -0.0874*
[0.088] Sole * Africa -0.1639***
[0.004] Public * Africa -0.0272 [0.685]
Observations 63222 63222 58871 58871 Pseudo R-squared 0.187 0.112 0.136 0.138
Number of countries 109 109 109 109 Number of African countries 41 41 41 41
Country Fixed Effects Yes No No No Sector Fixed Effects Yes Yes Yes Yes
30

Banking sector variable im the regression Basic
No country FE Add Africa
dummy
No country FE Add Africa
dummy, regional
dummies, and country
features
No country FE Add Africa
dummy, regional
dummies, and country features and interactions
Testing the coefficients of H0s listed below (1) (2) (3) (4) Foreign owned + Foreign*Africa
=0 [0.129]
Government owned + Govt*Africa =0 [0.957]
Log of Age + Log of Age*Africa =0 [0.022]
Small size + Small*Africa =0 [0.000] Medium size + Medium*Africa =0 [0.000] Female manager + Female*Africa
=0 [0.013]
Partnership + Partnership*Africa =0 [0.032]
Private + Private*Africa =0 [0.355] Sole + Sole*Africa =0 [0.000]
Public + Public*Africa =0 [0.164]
31

Table 3 The dependent variable is a dummy variable indicating whether the firm has a bank loan. P-values are in brackets. *, **, *** represent statistical significance at the 10%, 5%, and 1% level respectively. All models are estimated via Probit model (reporting marginal effects). All models include Sector 1-15 control dummies although we do not present them to conserve space. Standards errors allow for clustering at the country level. In regional dummies, we are omitting Latin America and the Caribbean category. Foreign- and government-owned are dummy variables indicating foreign or government participation in ownership. Log of age is log of years since establishment. Small and medium size are dummies indicating firms with fewer than 20 and between 20 and 99 employees, respectively. Female manager indicates that the main manager of the firm is female. Partnership, Private (but not partnership or sole proprietorship), Sole (proprietorship) and Public (listed) are dummy variables indicating the legal status of the firm. The log of Gross National Income (GNI) per capita is measured in USD and population density is midyear population divided by land area in square kilometres. Branches commercial banks (per 100,000 adults) is the most recent available value, and % of Foreign owned banks and % of Government owned banks are ) are the nearest available values to the year of the respective enterprise survey. Bank concentration is the assets of three largest banks as a share of assets of all commercial banks. Overhead costs is the average of overhead costs relative to total assets of all banks in a country and net interest margin is measured relative to total earning assets.
Dependent variable Loan
Banking sector variable
Branches, commercial banks (per
100,000 adults )
% of Foreign owned banks
% of Government owned banks
Concentration Overhead costs / Assets ratio
Net Interest Margin
(1) (2) (3) (4) (5) (6)
Firm
Foreign owned -0.1005*** -0.0956*** -0.0983*** -0.1095*** -0.1074*** -0.1071***
[0.000] [0.000] [0.000] [0.000] [0.000] [0.000] Government owned -0.0258 -0.0988** -0.0911* -0.0669** -0.0830** -0.0667*
[0.593] [0.037] [0.063] [0.045] [0.034] [0.064] Log of Age 0.0226 0.0137 0.0146 0.0134 0.0128 0.0099
[0.102] [0.219] [0.178] [0.194] [0.232] [0.240] Small size -0.3019*** -0.2981*** -0.2994*** -0.2983*** -0.2999*** -0.2980***
[0.000] [0.000] [0.000] [0.000] [0.000] [0.000] Medium size -0.1289*** -0.1264*** -0.1266*** -0.1302*** -0.1296*** -0.1299***
[0.000] [0.000] [0.000] [0.000] [0.000] [0.000] Female manager -0.0061 -0.0410*** -0.0357** -0.0206 -0.0235 -0.0269*
[0.745] [0.006] [0.035] [0.221] [0.161] [0.066] Partnership -0.0228 -0.0727 -0.0765 -0.0514 -0.0432 -0.0257
[0.649] [0.122] [0.115] [0.239] [0.294] [0.552] Private 0.0642** 0.0374 0.0394 0.0537** 0.0519* 0.0518*
[0.042] [0.213] [0.181] [0.035] [0.051] [0.057] Sole -0.0468 -0.0098 -0.0138 -0.0376 -0.0231 -0.0137
[0.169] [0.800] [0.727] [0.276] [0.504] [0.685] Public -0.0054 -0.0548 -0.0547 -0.0469 -0.041 -0.0461
[0.875] [0.207] [0.203] [0.218] [0.300] [0.249]
Regional dummies
Africa -0.0773 -0.1484 -0.1528 -0.1702* -0.1747* -0.2278***
[0.566] [0.154] [0.130] [0.060] [0.057] [0.004] East Asia and Pacific -0.0416 -0.1406** -0.1273** -0.1045* -0.0867 -0.1416***
[0.634] [0.013] [0.013] [0.099] [0.174] [0.008] Europe and Central Asia -0.0622 -0.0601 -0.0638 -0.0709 -0.0717 -0.0990**
[0.386] [0.270] [0.221] [0.141] [0.147] [0.015] Middle East and North Africa -0.2847*** -0.3197*** -0.3196*** -0.3406***
[0.000] [0.000] [0.000] [0.000] South Asia -0.3081*** -0.1438 -0.1169 -0.2199** -0.1953** -0.2337***
[0.000] [0.110] [0.262] [0.011] [0.029] [0.006]
Country features
Log of GNI per capita 0.0409* 0.0315 0.032 0.0222 0.0278 0.0054
[0.094] [0.133] [0.194] [0.264] [0.160] [0.820] Population density 0.0003** 0.0002 0.0002 0.0004*** 0.0003** 0.0003** [0.030] [0.242] [0.318] [0.001] [0.037] [0.016]
Interactions (Firm*Africa)
Foreign owned * Africa 0.0317 0.0791** 0.0710** 0.0794*** 0.0779** 0.0838***
[0.272] [0.010] [0.031] [0.009] [0.010] [0.003] Government owned * Africa 0.0191 0.122 0.1145 0.054 0.0931 0.0832
[0.789] [0.127] [0.163] [0.380] [0.134] [0.148] Log of Age * Africa 0.0138 0.0083 0.0064 0.0137 0.014 0.0188
[0.434] [0.635] [0.710] [0.380] [0.363] [0.140] Small size * Africa 0.0355 0.0101 0.0025 0.0087 0.0139 0.0186
[0.454] [0.782] [0.949] [0.803] [0.687] [0.590] Medium size * Africa -0.0032 -0.0097 -0.0158 -0.0049 -0.0041 -0.0019
[0.946] [0.796] [0.685] [0.887] [0.901] [0.953] Female manager * Africa 0.0625 0.1375*** 0.1302*** 0.1073*** 0.1132*** 0.1099***
[0.104] [0.002] [0.007] [0.009] [0.004] [0.004] Partnership * Africa -0.0597 -0.0635 -0.0511 -0.0761 -0.0742 -0.0535
[0.537] [0.425] [0.537] [0.284] [0.279] [0.446] Private * Africa -0.0965 -0.0839 -0.0828 -0.1037** -0.0912* -0.069
[0.286] [0.165] [0.175] [0.044] [0.077] [0.205] Sole * Africa -0.1302 -0.2028*** -0.1891*** -0.1709*** -0.1701*** -0.1599***
[0.128] [0.001] [0.005] [0.003] [0.003] [0.007] Public * Africa -0.0957 -0.0597 -0.0546 -0.0341 -0.0345 0.0019 [0.229] [0.427] [0.473] [0.617] [0.614] [0.978]
Banking sector variables
Branches (per 100,000 adults ) 0.0018
[0.258] % of Foreign owned banks (%) -0.0006 [0.514] % of Government owned banks (%) -0.0007 [0.496] Concentration (%) 0.0011 [0.284] Overhead costs / Assets ratio (%) -0.0013** [0.014] Net Interest Margin (%) -0.0194**
[0.046] Observations 36588 47975 47861 54700 57756 57756
Pseudo R-squared 0.134 0.131 0.131 0.139 0.138 0.144
32
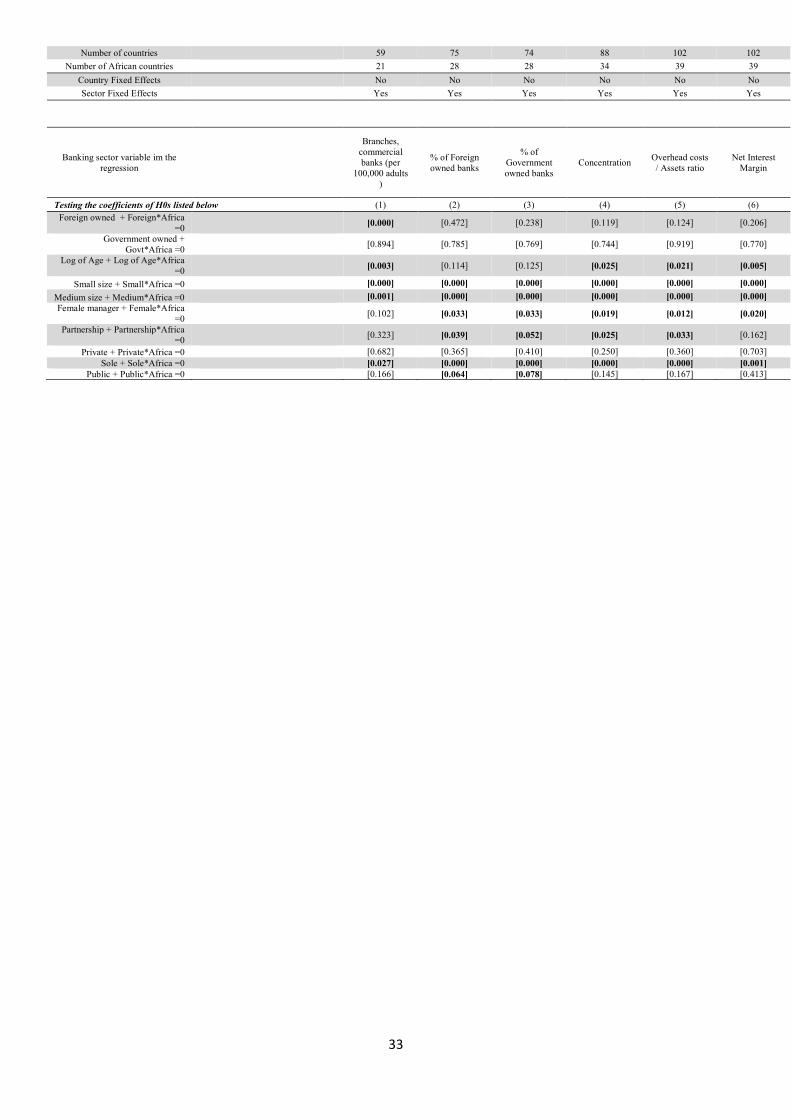
Number of countries 59 75 74 88 102 102 Number of African countries 21 28 28 34 39 39
Country Fixed Effects No No No No No No Sector Fixed Effects Yes Yes Yes Yes Yes Yes
Banking sector variable im the regression
Branches, commercial banks (per
100,000 adults )
% of Foreign owned banks
% of Government owned banks
Concentration Overhead costs / Assets ratio
Net Interest Margin
Testing the coefficients of H0s listed below (1) (2) (3) (4) (5) (6) Foreign owned + Foreign*Africa
=0 [0.000] [0.472] [0.238] [0.119] [0.124] [0.206]
Government owned + Govt*Africa =0 [0.894] [0.785] [0.769] [0.744] [0.919] [0.770]
Log of Age + Log of Age*Africa =0 [0.003] [0.114] [0.125] [0.025] [0.021] [0.005]
Small size + Small*Africa =0 [0.000] [0.000] [0.000] [0.000] [0.000] [0.000] Medium size + Medium*Africa =0 [0.001] [0.000] [0.000] [0.000] [0.000] [0.000] Female manager + Female*Africa
=0 [0.102] [0.033] [0.033] [0.019] [0.012] [0.020]
Partnership + Partnership*Africa =0 [0.323] [0.039] [0.052] [0.025] [0.033] [0.162]
Private + Private*Africa =0 [0.682] [0.365] [0.410] [0.250] [0.360] [0.703] Sole + Sole*Africa =0 [0.027] [0.000] [0.000] [0.000] [0.000] [0.001]
Public + Public*Africa =0 [0.166] [0.064] [0.078] [0.145] [0.167] [0.413]
33
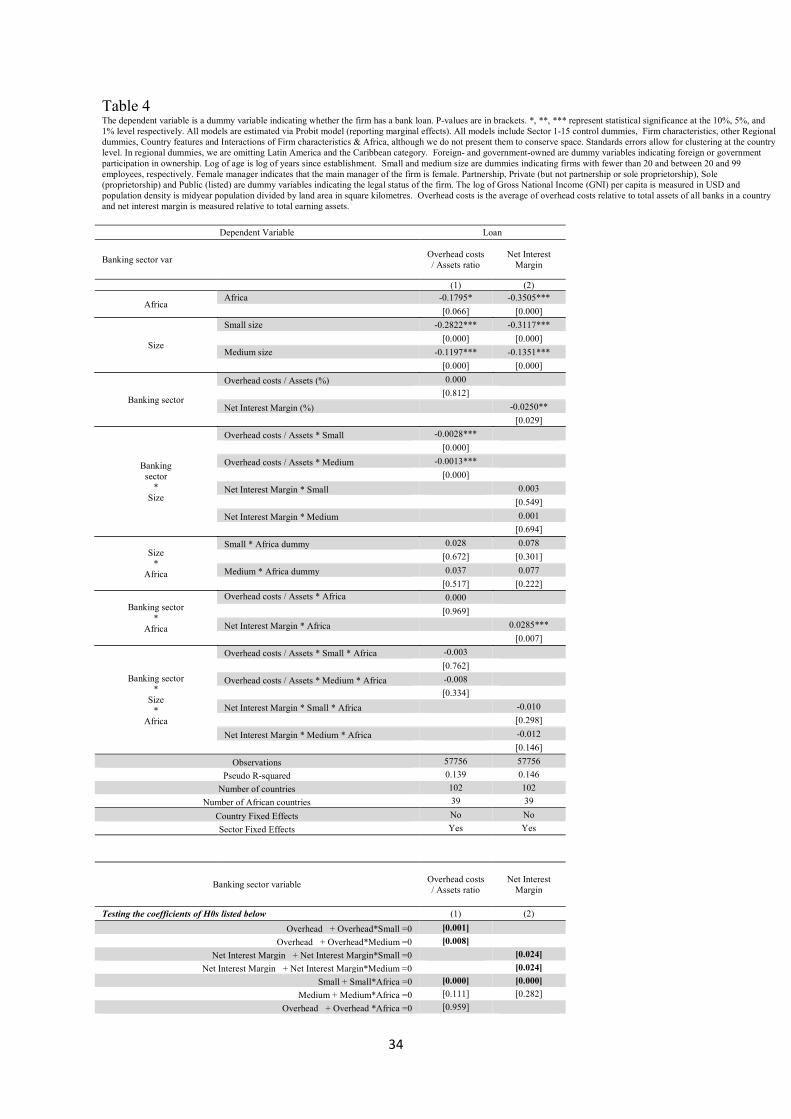
Table 4
The dependent variable is a dummy variable indicating whether the firm has a bank loan. P-values are in brackets. *, **, *** represent statistical significance at the 10%, 5%, and 1% level respectively. All models are estimated via Probit model (reporting marginal effects). All models include Sector 1-15 control dummies, Firm characteristics, other Regional dummies, Country features and Interactions of Firm characteristics & Africa, although we do not present them to conserve space. Standards errors allow for clustering at the country level. In regional dummies, we are omitting Latin America and the Caribbean category. Foreign- and government-owned are dummy variables indicating foreign or government participation in ownership. Log of age is log of years since establishment. Small and medium size are dummies indicating firms with fewer than 20 and between 20 and 99 employees, respectively. Female manager indicates that the main manager of the firm is female. Partnership, Private (but not partnership or sole proprietorship), Sole (proprietorship) and Public (listed) are dummy variables indicating the legal status of the firm. The log of Gross National Income (GNI) per capita is measured in USD and population density is midyear population divided by land area in square kilometres. Overhead costs is the average of overhead costs relative to total assets of all banks in a country and net interest margin is measured relative to total earning assets.
Dependent Variable Loan
Banking sector var Overhead costs / Assets ratio
Net Interest Margin
(1) (2)
Africa Africa -0.1795* -0.3505***
[0.066] [0.000]
Size
Small size -0.2822*** -0.3117***
[0.000] [0.000]
Medium size -0.1197*** -0.1351***
[0.000] [0.000]
Banking sector
Overhead costs / Assets (%) 0.000
[0.812]
Net Interest Margin (%) -0.0250**
[0.029]
Banking sector
* Size
Overhead costs / Assets * Small -0.0028***
[0.000]
Overhead costs / Assets * Medium -0.0013***
[0.000]
Net Interest Margin * Small 0.003
[0.549]
Net Interest Margin * Medium 0.001
[0.694]
Size *
Africa
Small * Africa dummy 0.028 0.078
[0.672] [0.301]
Medium * Africa dummy 0.037 0.077
[0.517] [0.222]
Banking sector *
Africa
Overhead costs / Assets * Africa 0.000
[0.969]
Net Interest Margin * Africa 0.0285***
[0.007]
Banking sector *
Size *
Africa
Overhead costs / Assets * Small * Africa -0.003
[0.762]
Overhead costs / Assets * Medium * Africa -0.008
[0.334]
Net Interest Margin * Small * Africa -0.010
[0.298]
Net Interest Margin * Medium * Africa -0.012
[0.146]
Observations 57756 57756
Pseudo R-squared 0.139 0.146
Number of countries 102 102
Number of African countries 39 39
Country Fixed Effects No No
Sector Fixed Effects Yes Yes
Banking sector variable Overhead costs / Assets ratio
Net Interest Margin
Testing the coefficients of H0s listed below (1) (2)
Overhead + Overhead*Small =0 [0.001]
Overhead + Overhead*Medium =0 [0.008]
Net Interest Margin + Net Interest Margin*Small =0 [0.024]
Net Interest Margin + Net Interest Margin*Medium =0 [0.024]
Small + Small*Africa =0 [0.000] [0.000]
Medium + Medium*Africa =0 [0.111] [0.282]
Overhead + Overhead *Africa =0 [0.959]
34

Net Interest Margin + Net Interest Margin *Africa =0 [0.636]
Overhead *Small + Overhead*Small*Africa =0 [0.543]
Overhead *Medium + Overhead*Medium*Africa =0 [0.259]
Net Interest Margin *Small + Net Interest Margin*Small*Africa =0 [0.394]
Net Interest Margin *Medium + Net Interest Margin*Medium*Africa =0 [0.159]
35