Embed Size (px)
Citation preview

SSMMNNAA AASSSSOOCCIIAATTEESS VVAALLUUAATTIIOONN AANNDD AANNAALLYYSSIISS
VVAALLUUAATTIIOONN OOFF AAMMRR CCOORRPP.. ((AAMMEERRIICCAANN AAIIRRLLIINNEESS)) DDEECCEEMMBBEERR 66,, 22000044
LLAANNDDOONN AADDKKIINNSS CCLLIINNTTOONN JJ.. MMOORRGGAANN
TTRRIISSHHAA NNIIEEMMUUTTHH MMAATTTTHHEEWW SSAANNDDEERRSS
SMNA Associates Valuation and Analysis
nInvestment Recommendation- MARKET PERFORMER
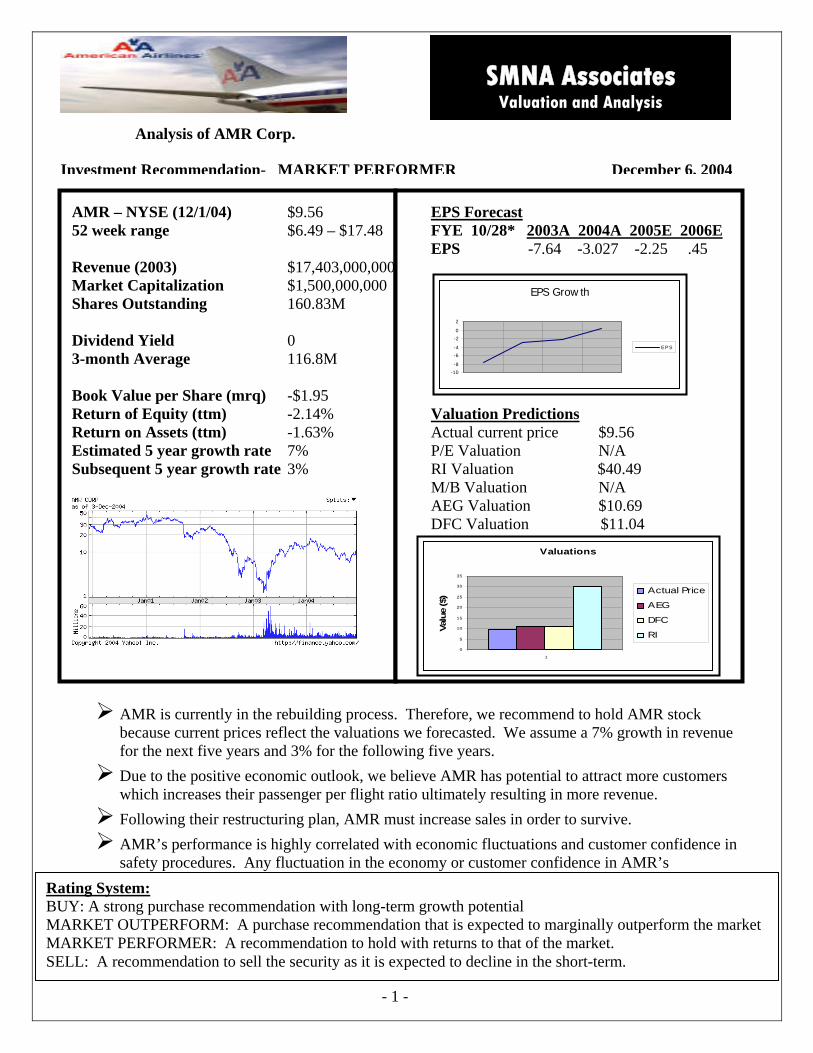
AMR – NYSE (12/1/04) $9.56 EPS Forecast 52 week range $6.49 – $17.48 FYE 10/28* 2003A 2004A 2005E 2006E EPS -7.64 -3.027 -2.25 .45
EPS Grow th
-10-8
-6-4
-20
2
E P S
Revenue (2003) $17,403,000,000 Market Capitalization $1,500,000,000 Shares Outstanding 160.83M Dividend Yield 0 3-month Average 116.8M Book Value per Share (mrq) -$1.95 Return of Equity (ttm) -2.14% Valuation Predictions Return on Assets (ttm) -1.63% Actual current price $9.56 Estimated 5 year growth rate 7% P/E Valuation N/A Subsequent 5 year growth rate 3% RI Valuation $40.49 M/B Valuation N/A
Valuations
1
0
5
10
15
20
25
30
35
Valu
e ($
) Actual Price
AEG
DFC
RI
DFC Valuation $11.04
AEG Valuation $10.69
AMR is currently in the rebuilding process. Therefore, we recommend to hold AMR stock because current prices reflect the valuations we forecasted. We assume a 7% growth in revenue for the next five years and 3% for the following five years. Due to the positive economic outlook, we believe AMR has potential to attract more customers which increases their passenger per flight ratio ultimately resulting in more revenue. Following their restructuring plan, AMR must increase sales in order to survive. AMR’s performance is highly correlated with economic fluctuations and customer confidence in safety procedures. Any fluctuation in the economy or customer confidence in AMR’s
- 1 -
Analysis of AMR Corp.
December 6, 2004
Rating System: BUY: A strong purchase recommendation with long-term growth potential MARKET OUTPERFORM: A purchase recommendation that is expected to marginally outperform the market MARKET PERFORMER: A recommendation to hold with returns to that of the market. SELL: A recommendation to sell the security as it is expected to decline in the short-term.

Executive Summary This paper provides a detailed analysis of American Airlines (AMR) as well as an
overall analysis of four other airline companies: Southwest Airlines, US Airways,
Continental Airlines, and Northwest. In order to make an accurate assessment of the
overall industry, we focused on the dominant economic characteristics, value chain,
competitive analysis, driving forces, and key success factors. We then related each of the
previous assessments to AMR and their current market position.
The competition analysis demonstrates the bargaining power between suppliers,
buyers, substitutes, new entrants, and rivalries. Based upon our analysis the bargaining
power for rivalries is fierce, while the barriers to new entrants are moderately weak.
Substitutes have moderate bargaining power and suppliers have moderately strong
bargaining power, while buyers are a weak competitive force.
The second part of our valuation consisted of identifying and correcting any/all
accounting distortions. Overall, our analysis could not find any major distortions. We
believe that due to the industry being under such intense scrutiny, AMR has very little
leverage to manipulate their accounting numbers or policies. Furthermore, the
company’s annual reports tend to explain every change in full detail, which leaves us
with very little reason to question their practices.
- 2 -
Next, we analyzed and compared the liquidity, profitability, and capital structure
ratios for AMR and four of their competitors concerning financials from 1999 – 2003,
given the impact of September 11th, 2001. From these ratios, we were able to project
future growth in revenue of 7% from 2005-2009, and 3% from 2010-2014.

Finally, we assessed AMR’s current share value by using a combination of various
valuation models. The goal of the valuation section is to be able to put an exact value on
AMR, and determine whether the stock is undervalued, overvalued, or fairly priced. We
used methods such as the method of comparables within the airline industry, discounted
free cash flows, discounted residual income, and the abnormal earnings growth method.
Each model allowed us to compute values per share that are somewhat close to the actual
value per share that was given as $9.23. However, when the WACC, cost of equity, and
the growth rates were adjusted we were able to compute values per share that were
comparable to the actual price. The majority of our calculations using these valuation
models provided us with a value per share of more than the $9.23, indicating that AMR’s
stocks were slightly under priced, although not significantly in most cases. Since AMR
does not pay dividends to its shareholders, we were unable to use the Dividend Discount
Model, and the Abnormal Earnings Growth Model was difficult to manage. Furthermore,
the usefulness of the forecasted financial statements again falls victim to the outlook of
the airline industry in general. The difficulty to predict the volatility of this particular
industry makes it extremely challenging to forecast future business operations, decisions,
and strategies.
- 3 -
Therefore, our recommendations relate directly to the future state of the economy. In
order for AMR to survive, they must follow through with their restructuring plan of
cutting costs in addition to increasing revenues in every possible way. Because the
current airline industry is in such a bad position, AMR has a lot of potential to capitalize
on the growing demand for airline service and to finally give Southwest Airlines some
worthy competition.

Company Overview: American Airlines, the main operating subsidiary of AMR Corporation, is the
largest scheduled passenger air transport company in the world, carrying more than 80
million people across the world each year (www.cbronline.com). AMR’s business
operations can be divided into two main units: passenger flights and cargo services.
AMR offers passenger flight services to 172 cities in 40 countries around the world and
has formed important alliances and partnerships with other major airlines to extend its
reach to more than 135 countries (www.cbronline.com). These partnerships and alliances
have helped AMR increase its presence on a worldwide basis by developing the
OneWorld Alliance which, with help from other carriers such as British Airways and
Cathay Pacific, makes any destination in the world less than 24 hours away. On a typical
day, AMR will receive more than 329,000 reservation calls, handle more than 293,000
pieces of luggage, and fly well over 2,600 flights. In the United States alone, AMR
operates over 1,400 flights connecting to132 cities (www.aa.com).
AMR also handles extensive cargo carrier operations in cooperation with their
worldwide partners of Japan Airlines, British Airways, and Canadian Airlines
(www.cbronline.com). AMR also provides limited cargo services on almost every
scheduled passenger flight all day every day, which translates into roughly 2,800 flights
every 24 hours (www.aa.com).
- 4 -
AMR was established in 1929 when a company called The Aviation Corporation
was created for the sole purpose of acquiring small, privately owned aviation companies.
All of these small companies were eventually incorporated into American Airways, and

later named American Airlines, Inc. AMR became the country’s largest airline and the
top air carrier in terms of revenue passenger miles (www.aa.com).
Industry Overview
Rivalry: Intense
- 5 -
Rivalry in the airline industry is very fierce due to most major airlines being
comparable in size, having basically the same resources and capabilities, and competing
on a relatively level playing field. Each airline’s costs are largely fixed, thus leading
them to compete mainly on price and customer service. Customers in the market have
very low switching costs, meaning that if an airline cannot distinguish itself from other
airlines, then the only thing that makes any difference to a customer is the price of the
ticket. Airlines, though, often set their prices to those of their competitors in order to
force customers to pay the asking price. Airlines try to make themselves more appealing
to customers by offering more flights in more locations. They also try to gain a good
reputation by consistently arriving on time. In addition airlines are evaluated on things
such as how well trained their pilots and flight attendants are, the amount of benefits
offered by the airline (e.g. Frequent Flier Miles), and passenger comfort during the flight,
including things like extra leg room and internet access.
Since the airline industry is fairly saturated, the room for growth and
differentiation is limited. This causes airlines to compete against one another on things
like brand recognition and customer loyalty. Because of the highly competitive nature of
the airline industry, the companies involved are forced to compete mainly on price. This
results in airlines earning lower returns and it causes the industry to be very vulnerable to
fluctuations in the economy.
Threat of new entrants: Relatively Low
- 6 -
At first glance, it would appear that it would be extremely difficult for new
companies to enter the airline industry. Factors such as limited gate space at airports,
large economies of scale, and customer loyalty related to frequent flier programs
compound the complexity of entry into the airline industry. One of the main factors in
entering the industry is the amount of capital that is required. The accessibility to bank
loans and other credit must be taken into consideration. If interest rates are low, then the
threat of new entrants will obviously be higher.

The airline industry is already pretty saturated; therefore it becomes very difficult
for a new airline to buy gate space at major airports. Most of these major airports are
predominately serviced by only a few airlines, and this creates a huge barrier to entry for
a new airline. The lack of gate space prevents much needed exposure and business that a
new airline would need in order to survive.
Brand reputation and recognition is also a barrier to entry. The larger airlines
have well established brand names and recognition that contribute to customer retention
and loyalty. An airline with a strong brand name and several incentives can lure
customers, even if its prices are higher. However, a new airline would not likely have the
resources it takes to offer comparable benefits or have the ability to gain a strong enough
brand name to be any real threat to large airlines already in the market.
Threat of substitutes: Moderate
Obviously, the airline industry competes daily with all other forms of
transportation. Cars, trains, and buses are all major forms of transportation. Automobiles
are the largest of all forms of transportation, mostly because they are cheaper and more
efficient for making short trips. For example, 75% of airline trips exceed 1000 miles,
compared to only 13% of automobile trips. Gas prices are the largest determinants in
how likely people are to choose to travel on the road rather than in the air. As gas prices
continue to climb, consumers are more likely to choose air travel as a more cost-effective
and convenient alternative.
- 7 -
As mentioned before, trains and buses are also other forms of transportation that
can attract customers away from the airline industry. The average distance traveled by
Amtrak train customers is 280 miles and the average bus trip is 140 miles. This still

allows the airlines to dominate the long distance travel market. These shorter forms of
transportation can pose a larger threat to smaller regional airlines, as they specialize in
shorter flights. As for this report, we are focusing on the larger airlines that specialize in
long distance and international travel, so trains and buses pose very little threat to these
major airlines.
Basically, there are various forms of transportation that serve various types of
travel. Each has its different qualities and can meet people’s needs in different ways. It
really boils down to the preference of the consumer and how much they value the time
that can be saved by flying rather than driving or taking a train.
Bargaining power of the suppliers: Manufactures, strong; Airports, strong; fuel
companies, strong
Two companies, Boeing and Airbus, are the dominant suppliers in the airline
industry. Because they are the only two suppliers in the airplane manufacturing industry,
competition is not a major issue. This makes it nearly impossible for airlines to have any
leverage in bargaining for the lowest price. If an airline is going to buy an aircraft, then
they have no choice but to buy from one of these two companies.
Other suppliers to airlines are the actual airports that provide them space in order
to operate. The bargaining power the airlines have with the airports is very weak. An
airport simply supplies the airline with a hub to fly in and out of. If one airline is not
willing to pay the asking price for space at their airport, it is not a problem for an airport
to find another airline willing to pay the price to use that space.
- 8 -
Fuel suppliers are also major suppliers in the airline industry. Airlines have very
little bargaining power when it comes to fuel costs. Fuel is obviously a necessity in the

industry and will be bought regardless of the costs. However, airlines do use “hedging”
to form contracts with fuel companies to guarantee a set fuel price for a given period of
time.
Bargaining power of the buyers: Moderate
Buyers of airline services include business travelers, leisure travelers, and cargo
and mail carriers. The bargaining power for buyers is mainly determined by price-
competition among the different airlines. Because of higher switching costs, the volume
of purchases, quality of service, and brand recognition, an airline can charge a slight
premium if it has an advantage in one of these areas. For example, if an airline is well-
known and provides excellent service, they are going to have greater bargaining power in
setting their prices than one who solely competes on price.
Five Forces Model Conclusion:
- 9 -
Not all of the factors discussed will play an equal role in the airline industry.
However, in assessing the attractiveness of the industry, it is imperative that we consider
each of the five factors. We see that it is possible to gain entry into the airline industry,
but it is extremely difficult for a new firm to survive. The highly competitive nature of
the market makes it extremely difficult to gain any kind of large returns. Furthermore,
each airline must be aware of the key success factors that will help them gain and
maintain a competitive advantage in the industry. For example, technology plays a huge
role in operating efficiently and profitably from flying new aircrafts to offering the latest
techno-savvy equipment for passengers. With aircrafts, the newer the plane the more
efficient it is to fly. It wastes less fuel, holds more passengers, and travels at higher
speeds than older planes. Technological innovations concerning boarding and check-in

have also changed the way airlines are doing business. The more options an airline can
offer its customers dealing with accessibility and convenience, the more successful it will
be in the industry. For example, online ticket purchasing and computer check-in. In
addition to cutting costs, these options allow the airline to provide service at the
customer’s own convenience.
Also, airlines must have strong distribution capabilities via the Internet. Whether
it is creating its own web site for customers to purchase tickets or forming a network such
as Orbitz, Travelocity, or Expedia with other airlines, an airline must utilize e-commerce.
E-commerce not only helps with reaching customers, it also reduces distribution costs
altogether. By using e-commerce, airlines are able to cut out expenses that would
otherwise be spent on travel agents and paper shuffling. Superior information systems
are a strong key success factor in succeeding in the industry because it allows an airline
to operate, communicate, and distribute at lower costs. Organizational capability requires
the ability to respond quickly to shifting market conditions, such as the economic status.
In the airline industry, the status of the economy tends to set the pace for business; the
better the economy, the more people travel. Therefore, the industry must be able to react
to sudden economic downturns or upturns. A prime example is the terrorist attacks on
September 11. After the crisis, the economy took a huge dive into a recession. In order
to survive, airlines were forced to slash prices in order to fill the seats. Their ability to
utilize e-commerce and information systems was essential in order to conduct business.
- 10 -
An individual firm’s performance of these factors is the difference between
profits and loses, as well as success or failure. In addition, the better each firm can
perfect their performance of these factors, the better their competitive advantage.

Competitive Advantages:
AMR has developed from a conglomeration of about 82 small airline companies.
Their number one competitive advantage over all the other airlines is that they are the
largest passenger airline in the world. They are also one of the largest freight carriers in
the world. AMR’ size gives them a name known not only in America, but
internationally. (PWC: Item 1. Business; American Airlines Dictionary)
A strong image is a great advantage. In December 2003, the Superbrands Council,
an independent panel of marketing and branding experts, gave AMR business Superbrand
status. This prestigious award in brand recognition was presented to AMR after being
identified as one of the exceptional brands across the globe. "In a highly competitive
aviation market a strong brand is essential to both winning and retaining customers. In
terms of brand strength AMR can feel confident about its position," said Stephen
Cheliotis, Brand Director of Superbrands (www.aa.com).
- 11 -
As with any industry, customer service is extremely important. Throughout
AMR’s years of operation, they continue to gain an advantage over their competitors in
customer service through technological innovation. In 1962, along with IBM, they
developed the SABRE (Semi-Automated Booking and Reservation Environment). This
was the world’s first online air reservation system. With the SABRE system and the
development of extensive customer databases, AMR differentiated itself from other
airlines. Following these technological advances, AMR pioneered the AAdvantage
customer loyalty program which further developed its competitive advantage by helping
to individualize customer experiences. The internet is a natural extension for AMR's
focus on customer service. It has allowed AMR to stay ahead of its competitors and
focus on providing exceptional service and customized products to its customers
(AA.com gets personal, SABRE encyclopedia).
Customer service has lost the importance it once held in the recent price-
competitive market of the airline industry. In order for AMR to capitalize upon their
greatest advantage of customer service through technological dominance over other
airlines, they must convince their customers that AMR is focused on them and that their
customer service is worth paying a premium for. To accomplish this, AMR is currently
running a campaign to underscore their focus on customers and their understanding of
why their customers fly. Because of the economy, AMR was forced to shift along with
the rest of the industry to price-focused competition. This campaign is a step away from
that. Dan Garton, AMR's executive VP of marketing stated, "At American Airlines,
while we're very focused on offering competitive prices, we also believe it is important to
understand why travelers fly in the first place. With that understanding, we're fiercely
committed to offering products, features and customer service that our customers value,
while still remaining very competitive on price" (Newcomb).
- 12 -
Many experts believe that AMR should focus on international flights to increase
the profitability of their business. They have an advantage in international travel for a
couple of reasons. First, many foreign governments limit U.S. air carriers’ rights to carry
passengers beyond designated gateway cities in foreign countries. AMR has been able to
build numerous marketing relationships with foreign airlines and rail companies.
Second, AMR is also a founding member of the OneWorld alliance which links the
networks of the member carriers to enhance customer service and smooth connections to
the destinations served by the alliance (Some doubt AMR strength, PWC Item 1.
business).
Fuel is the commodity that is every airlines largest expense. AMR noticed that
fuel was cheaper in different parts of the country. However, carrying extra fuel also cost
a considerable amount. To balance this and ultimately gain a competitive advantage over
the other airlines, AMR utilized their information systems to capitalize on the low fuel
costs. AMR uses a flight plan system that takes into account the payload on the flight
and calculates if they can carry fuel as cargo, which allows them to project a cost savings
in fuel ferrying of $50 million in 2004 (www.aiada.org).
All in all, AMR is in a strong position to become a very successful airline. If they
utilize the key success factors they have a competitive advantage in, such as developing
technological advances and capitalizing on their distribution and information systems,
AMR could not only cut costs but begin to increase their revenues.
Now we will begin to review AMR’s financial statements and analyze their
accounting policies to get a better feel for the numbers presented on these statements.
Identifying Key Accounting Policies
On April 9, 2001, AMR purchased substantially all of the assets and assumed
certain liabilities of Trans World Airlines, Inc. In the 2003 consolidated financial
statements, all significant inter-company transactions were eliminated and certain
amounts were reclassified.
- 13 -
AMR holds restricted cash and short-term investments to support projected
workers compensation and various other obligations. Inventory related to flight
equipment are carried at average acquisition cost and are expensed when used in
operations. Allowances for spare parts that are currently identified as excess or obsolete
are provided over the estimated useful life of the related aircraft and engines.
“Maintenance and repair costs for owned and leased flight equipment are charged
to operating expense as incurred, except costs incurred for maintenance and repair under
flight hour maintenance contract agreements, which are accrued based on contractual
terms.” (PWC 10k)
Airport operating and gate lease rights are being amortized on a straight-line base
over 25 years to a zero residual value. Estimated employee accruals are the amount of
potential retroactive pay expected to be provided upon finalization of a labor agreement.
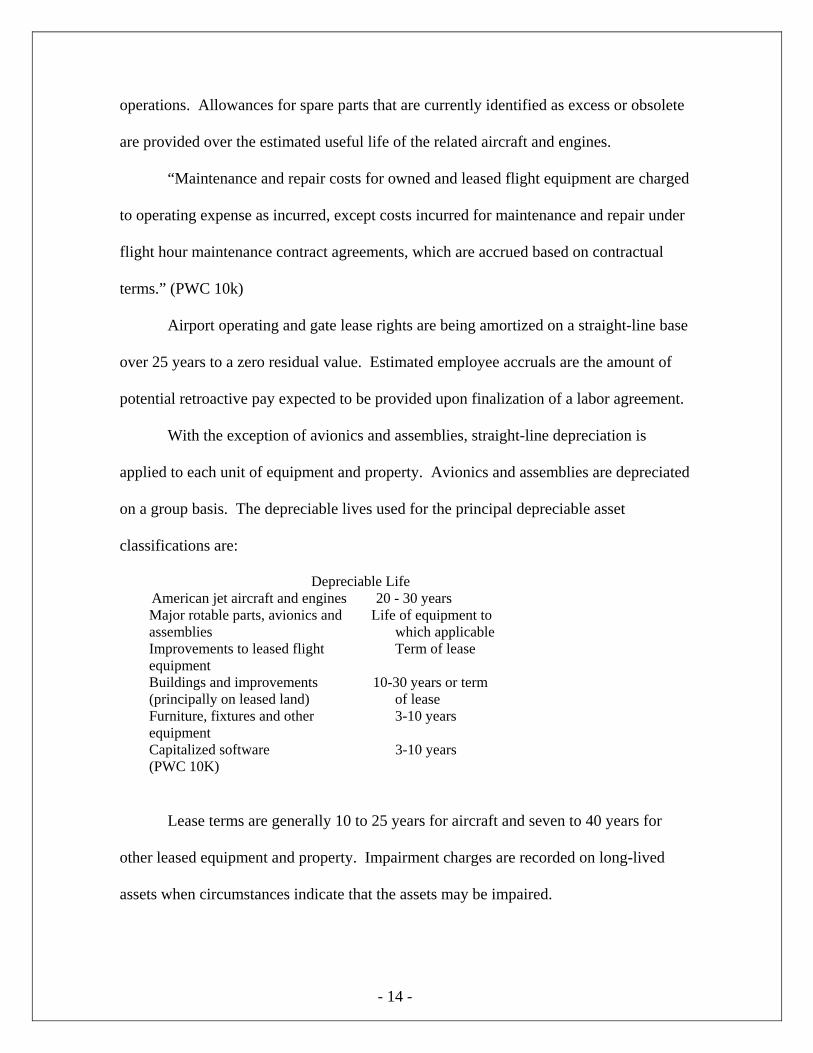
With the exception of avionics and assemblies, straight-line depreciation is
applied to each unit of equipment and property. Avionics and assemblies are depreciated
on a group basis. The depreciable lives used for the principal depreciable asset
classifications are:
Depreciable Life American jet aircraft and engines 20 - 30 years Major rotable parts, avionics and Life of equipment to assemblies which applicable Improvements to leased flight Term of lease equipment Buildings and improvements 10-30 years or term (principally on leased land) of lease Furniture, fixtures and other 3-10 years equipment Capitalized software 3-10 years (PWC 10K)
- 14 -
Lease terms are generally 10 to 25 years for aircraft and seven to 40 years for
other leased equipment and property. Impairment charges are recorded on long-lived
assets when circumstances indicate that the assets may be impaired.

Passenger ticket sales are initially recorded as a component of Air traffic liability
and then recognized at the time service is provided. “However, due to various factors,
including the complex pricing structure and interline agreements throughout the industry,
certain amounts are recognized in revenue using estimates regarding both the timing of
the revenue recognition and the amount of revenue to be recognized, including breakage.
These estimates are generally based upon the evaluation of historical trends, including the
use of regression analysis and other methods to model the outcome of future events based
on the Company s historical experience, and are generally recorded at the time of sale.”
(PWC 10K)
Estimated incremental cost of providing free travel awards is accrued when such
award levels are reached. To finance this operation, AMR sells mileage credits and
related services to participating companies. This portion of the revenue is valued at
current market rates and is deferred and amortized over 28 months (approximate period
in which credits are used).
AMR has reserves for taxes and associated interest that may become payable as a
result of a tax audit. AMR believes that taxing authorities may challenge previous tax
reports resulting in additional liabilities for taxes and interest. Advertising costs are
expensed as they are incurred.
- 15 -
No compensation expense is recognized for stock option grants if the exercise
price is at or above the fair market value of the underlying stock on the date of grant.
AMR has adopted the pro forma disclosure; meaning, information regarding net loss is
determined as if AMR accounted for its employee stock options and awards granted
using the fair value method.
Accounting Flexibility
The issue of accounting flexibility is an extremely firm-specific issue, and many
corporations have problems identifying and dealing with this concept. The airline
industry is a perfect example of how much of a problem this really is. For many, many
years the airline industry has tried to develop easy, efficient ways of accounting for the
enormous costs associated with passenger reservations while at the same time trying
desperately to minimize costs. Every year, AMR’s department of Passenger Revenue
Accounting has to process and report on their financial statements the issuance of more
than 125 million passenger tickets and related documents. This number of tickets
amounts to well over $15 billion (www.tgc.com/dsstar).
The costs associated with this process can be incredible. In efforts to make this
process more efficient, the Passenger Revenue Accounting Department began to operate
a new data warehousing solution, designed and provided by the database manufacturer
Sybase, to help process and report this enormous amount of data (www.tgc.com/dsstar).
This new program, called the Revenue Accounting Data Access Resource (RADAR), can
search for and implement revenue enhancement opportunities by detecting and fixing
problems, such as different types of fraud, and by substantially reducing the operating
costs associated with this type of activity. In fact, in the first week this system was
working, it had already helped to eliminate over $60,000 of costs associated with missing
vouchers (www.tgs.com/dsstar).
- 16 -

Since this system has proven itself to be extremely effective, many other
departments throughout AMR have decided to reap the benefits of RADAR’s
capabilities. This is an example of the accounting flexibility that AMR is pursuing in
order to cut costs and make the whole process of running and organizing a commercial
airline as efficiently as possible.
Evaluation of Accounting Strategy
Due to the nature of GAAP, managers are left with a large amount of flexibility in
the way they account for different business transactions. It is necessary to look at a
firm’s accounting strategy and determine if the managers are using this flexibility to paint
a true picture of the firm’s economic activities, or if they are using the flexibility to
distort accounting numbers and hide the true picture of the firm.
- 17 -
AMR has many key accounting policies such as how inventories are accounted
for and expensed, how they account for goodwill and other intangible assets, and how
they account and write down for their long-lived assets such as property and equipment.
These were discussed in detail earlier in the first step of the evaluation process. For this
reason, the details won’t be discussed in this step of the evaluation procedure. The
footnotes in the yearly reports for Delta, Southwest, and United Airlines were used to
compare accounting policies within the industry. After review, it looks as though all of
these firms appear to be very similar in their main accounting policies. AMR’s policies
on items such as the measurement of asset impairments, accounting for passenger
revenues, accounting for their frequent flier programs, employee accruals, and the
accounting of other intangible assets seem to be pretty standard policies in the airline
industry. The other three firms mentioned before account for these things in basically the
same way. However, AMR keeps a tax contingency reserve account to offset potential
future tax liabilities. They state that this account is just in case their accounting position
is questioned by taxing authorities, and they end up being forced to pay additional taxes
in the future. This does not appear to be standard practice in the airline industry, and is
something that raises some suspicion. Why would AMR be worried about taxing
authorities questioning their accounting policies if they were following the rules? Except
for the tax contingency accounting, AMR’s accounting policies, compared to Delta,
Southwest, and United, look very similar.
- 18 -
It also appears that managers at AMR will face incentives to use their accounting
knowledge to avoid violating debt and liquidity covenants. AMR does have a liquidity
covenant with a bank credit facility that will expire at the end of 2004. This also includes
an EBITDAR (earnings before interest, taxes, depreciation, amortization, and rentals) to
fixed charges ratio covenant. The required EBITDAR to fixed charges ratio is 1.1 to 1.0
for the three-month period ending March 31, 2004, and increase on a quarterly basis up to
1.5 to 1.0 for each four consecutive quarters ending December 31, 2004 (AMR 10K-
2003). The liquidity covenant requires AMR to maintain a minimum level of $1.0 billion
of unrestricted cash and short-term investments. Failure to comply with either of these
covenants will result in default under the bank credit facility and a significant amount of
AMR’s other debt (AMR 10K-2003). This is something to keep an eye on, because it
would be very tempting for AMR’s managers to manipulate accounting numbers in order
to stay in compliance with these covenants. Officers and key employees of AMR are also
eligible for stock options and many other stock based incentives and awards, including
cash bonuses. This also increases the temptation for officers to mess with accounting
numbers in order to obtain these bonuses and stock rewards.
It does not appear that AMR’s accounting policies and estimates have been
deemed unreasonable in the past. They were recently forced to convert many operating
leases to capital leases, and a few capital leases were converted to operating leases.
These changes though, were not that significant as stated on the firm’s balance sheet.
There does not appear to be any major changes in accounting numbers between the
quarterly reports and the audited 10K yearly report that would indicate unreasonable
estimates or accounting policies in the past.
Overall, AMR’s financial statements and policies do not seem to be much
different than those of their competitors. Theses debt and liquidity covenants could
create some distortion in their accounting numbers presently and in the near future and
should be something that is watched closely, but AMR’s policies appear to be pretty
standard in the airline industry as of the end of 2003.
Evaluation of Quality of Disclosure
AMR’s annual reports display a maximum disclosure quality that very much
represents its company outlook. While reading through the 2003 annual reports, AMR
explains every detail to the fullest in order to present the most reasonable and accurate
depiction of their company.
- 19 -
For example, the first part of the report contains pages upon pages of explanations
about fuel prices, the economy, labor costs, and their operating expenses. Each subject is
explained in some full detail and offers specific reasons as to why AMR has seen such
poor returns in the past couple of years. It furthermore explains their strategy as to how
they plan on lower costs by implementing the “Turnaround Plan.” In addition, there
seems to be little puffery done in order to hide the company’s financial situation. It
seems to be pretty cut dry in the sense that the problems are recognized and then they
propose their solutions.
The company’s footnotes also adequately explain their accounting assumptions
and policies. For instance, when looking at the financial statements, each questionable
item is further explained in the footnotes; such as the explanation of special grants,
charges, and pension liability adjustments. Furthermore, with each footnote comes the
direction of further discussion that can be found later in the report.
The Management Discussion and Analysis section of the annual report is very
strong. It again is very detailed about where the company is going and why. It
acknowledges several factors that affect the company’s performance and further explains
how the company plans to deal with each one. After reading the section, it is extremely
clear to understand the reason why the firm is performing at the level it is. Due to the
effects of the September 11th attacks, fuel prices, and operating expenses, each factor is
related to the company’s poor performance. One specific example is their recognition of
increasing operating expenses due to labor and administrative costs. They documented
the problem and stated their solution.
- 20 -
The report also provides sufficient measurements of the firm’s key success
factors. The Management Discussion highlights how certain outlays such as customer
service and employee cooperation are being managed and performed. For example,
AMR disclosed their plan to acquire the financial funds needed to secure their future.
Through their explanations, one can conclude their progress and can somewhat predict
their future cash flows if their plan is followed.
Again, one of the strong factors of AMR’s annual reports is the fact that they
recognize and explain bad news. All major legal battles are documented in the annual
reports, the economic situation they are/will be facing, as well as the reasons for their
bankruptcy filing and decrease in revenues.
Overall, in evaluating the quality of disclosure AMR, it is reasonable to say that
the management opts to provide a maximum level of disclosure in the annual reports.
Any news concerning the company, whether it is good or bad, is included and thoroughly
explained.
Identification of Potential Red Flags
One potential red flag found in AMR’s annual report is an increasing gap between
their reported income and their tax income. For example, AMR holds a reserve set aside
for tax contingencies. AMR claims that “although the company believes that the
positions taken on previously filed tax returns are appropriate, it nevertheless has
established tax and interest reserves in recognition that various taxing authorities may
challenge the positions taken by the company resulting in additional liabilities for taxes
and interest”(PWC 10K). From an analysis standpoint, it seems a bit suspicious that they
would have to hold a large reserve for tax contingencies unless there was a reason to do
so.
- 21 -
Another red flag is simply the fact that the overall industry is not completely
stable. With this instability comes the possibility of Chapter 11 Bankruptcy. After the
terrorist attacks in 2001, the industry suffered a huge loss which caused many airline
companies to file for bankruptcy. AMR has filed once, and if they can not continue to
operate at their current cost level and work on increasing revenues, they will be forced to
file for a second time.
Undoing Accounting Distortions
In conclusion, our analysis could not find any major distortions. We believe that
due to the industry being under such intense scrutiny, AMR has very little leverage to
manipulate their accounting numbers or policies. Furthermore, the company’s annual
reports tend to explain every change in full detail, which leaves us with very little reason
to question their practices.
Now that we have evaluated the clarity of AMR’s financials, it is possible for us
begin to understand their position in the market and get important financial ratios that
will help us to create accurate forecasts for AMR through the year 2014.
Financial Ratios and Forecasting Financial Statements
The purpose of this section is to get a strong understanding of AMR’s position in
the current market as well as their future position. Through forecasting and valuation, we
are able to analyze and summarize AMR’s business, accounting, and financial strategies
as well as be able to relate them to their performance in the industry.
- 22 -
Our conclusions, therefore, are such. First, after taking into consideration the
effects 9/11 had on AMR, we believe that the firm can only improve. Since AMR has
proposed a plan to decrease costs to the bare minimum, the only way to stay alive is if
they can increase revenues. Within the airline industry, revenues often reflect the current
economic situation, and since 9/11, there has been a recession, which in effect has hurt
the industry’s performance. Following 9/11, airlines have paid tremendous costs as a
result of the general population’s fear of flying. However, three years have passed, and
the economy is showing signs of improvement. Therefore, our prediction for AMR is
that not only will they continue to keep costs low; they will also be able to maintain a 3%
growth rate.
This prediction of an increased growth rate can further be supported by the idea
that as the economy improves, people have more money to spend, which increases travel
and money spent on airfare. Furthermore, as the years pass, Americans will become
more comfortable with flying and the fear of terrorism will decline, which also increases
money spent on airfare.
So, as our further analysis will demonstrate, we believe AMR has growth
potential as well as the opportunity to increase revenues in the future.
Financial Ratio Analysis
- 23 -
First, we utilized the liquidity, profitability, and capital structure ratios in order to
evaluate the financial position of the firm. These ratios then allowed us to compare the
past five years of actual numbers in order to predict the ten-year forecasted numbers. We
compared these numbers to the Industry Average and to four of AMR’s competitors:
Northwest Airlines, US Airways, Continental Airlines, and Southwest Airlines. By doing
so, we were able to compare and contrast AMR’s position to that of its competitors,
which further allowed us to more accurately predict AMR’s future position in the
industry.
Trend Analysis
As you can see in Appendix D1-6 we have computed the financial ratios from
1999 to 2003 for each of the individual airlines and the overall industry average
excluding AMR.
These numbers illustrate the dramatic affect 9/11 had on AMR’s overall liquidity
and profitability. Many ratios have a negative relationship after 2001. Perhaps the most
accurate ratio representing the effects of 9/11 would be the debt to equity ratio. This ratio
grew approximately 400% in less than 3 years.
These ratios will be used to compute future ratios. However, the effects of 9/11
will be taken into consideration and will be adjusted accordingly. 2004 has proven to be
a turn-around year for AMR. Our forecast will reflect the growth made in 2004
compared to that of 2001-2003. The numbers from 2001-2003 will be used to weigh and
account for the lingering fear caused by 9/11.
Cross Sectional Analysis
In Appendix D6, there is a ratio analysis of AMR’s major competitors over the
last five years as well as the Industry Average.
As shown in the current ratio chart, Appendix E, AMR’s ratio of current assets to
current liabilities was leading the industry. A dramatic decline is illustrated through the
years 2000-2002. Through the year 2002-2003 however, AMR has begun to make a slow
but steady comeback.
- 24 -
Southwest, on the other hand, increased its ratio of current assets to current
liabilities from 2000-2002. Their airline was one of the least effected by 9/11. AMR’s

numbers illustrate that they can compare to Southwest current ratio if they can return to
an industry where 9/11 has very little effect on the customer’s flight decisions.
As shown in the working capital chart Appendix F, AMR has managed to return
relatively close to the industry average over the past two years. Southwest again, excels
in this area.
Then, according to the sustainable growth rate chart found in Appendix G, AMR
has made significant progress over the first three quarters of 2004. While each of AMR’s
competitors growth rate is declining to zero and below, AMR is dramatically improving.
AMR was forced to take dramatic action in cutting costs between 2001 and 2002.
Financial Statement Forecasting Methodology
In order to forecast for the 4th quarter of this year, we will resume the upward
trend that AMR must follow to once again become a profitable airline. This trend will be
adjusted according to the industry average as well as one airline in particular, Southwest
Airlines. Southwest is one of the most profitable airlines in America. We believe that
the business structure of AMR is similar to that of Southwest and will eventually reach
similar ratios. Our target date for AMR to reach the goal we have set will be 2010 for
most of the ratios and 2014 for the remaining ones.
- 25 -
In addition, it is important to note that in order to forecast the future, certain
assumptions must be made for the airlines industry. First, we are assuming that the
economy is going to pick up; affecting the amount of disposable income and the demand
for airfare. Next, we assume that the fear of terrorism will decline. With this, the
comfort level of flying will increase, further affecting the demand for airfare. In addition,
the assumption that the increased security currently in place will be seen as less of an
inconvenience by potential passengers leads us to believe that passengers will begin to
travel more often. All of these assumptions are very important to the airline industry
because they have a large impact on business.
Our forecast also assumes that there will be no catastrophic events in the next 15
years. We have very heavily adjusted the numbers during 2001-2003 because of 9/11.
We realize that these numbers do not accurately reflect the normal airline industry so we
have forecasted numbers for an airline industry that is no longer significantly affected by
9/11. Southwest Airlines is the benchmark for AMR. Of the major airlines, they were
least affected by 9/11. We believe that there ratios represent the benchmark for a
profitable airline.
While trying to actually project future numbers for AMR, which can be seen in
Appendix H3-4, we reference the previously mentioned liquidity, profitability, and
capital structure ratios in an attempt to forecast realistic numbers. We did have to adjust
some of these ratios simply because of the unstable nature of the airline industry in recent
years. For example, fuel costs. We basically assume that fuel costs will fluctuate
significantly over the next ten years, but we expect the average cost of fuel to stay
relatively stable. AMR appears to do a very good job of hedging against higher fuel
prices, and they also save large quantities of money by ferrying fuel onboard with their
previously mentioned flight system.
- 26 -
Our forecast is definitely limited by the unforeseen future. Even though we do
not account for unforeseen events, they inevitably will occur. We are also limited by the
fact that we do not have every bit of information regarding the airline industry and the
economy.
The most obvious weakness in our forecast is that we are working with numbers
that were greatly affected by 9/11. To say that these numbers are part of a normal trend
is ludicrous. Also, we were forced to use numbers from a few competitors who were
either bought out or bankrupt sometime in the last 5 years.
One strength of our forecast is that it does accurately reflect reasonable growth for
an airline industry in a strong economy.
Forecasting Summary
In order to make accurate forecasts, we analyzed and compared the liquidity,
profitability, and capital structure ratios for AMR and four of their competitors from
1999-2003. Taking into account the effects of 9/11 and the effects it had on each
airline’s ratios, we were able to forecast future ratios and financial statements for AMR.
From these ratios, we were able to project future growth and increased revenue for AMR
through 2014.
Now that we have forecasted AMR’s financial statements as accurately as
possible, we can begin to use these financials along with various valuation models to
obtain an intrinsic stock price for AMR.
Introduction to Valuation
- 27 -
The goal of the valuation section is to be able to put an exact value on AMR, and
determine whether the stock is undervalued, overvalued, or fairly priced. We will use
many different methods, such as the method of comparables within the airline industry,
discounted free cash flows, discounted residual income, and the abnormal earnings
growth method. To employ these methods we will begin by estimating factors such as
long term growth rates, AMR’s cost of equity, their cost of debt, and the company’s beta

value as well as their credit score. As you know, all of these factors can greatly influence
the ending value that we give AMR. For this reason, we will explain in detail later in the
section how we estimate these values, and we will adjust these values throughout the
valuation process to better reflect AMR’s business strategy and the airline industry as a
whole.
Method of Comparables Valuation
In this section, we look at the airline industry as a whole, and use AMR’s
competitors to get benchmark ratios such as P/E, P/B, and D/P. With this approach,
single measures of current performance, such as the earnings per share, the book value
per share, the current market price per share, and the amount of dividends paid per share,
are changed into a value by using a specific multiple computed from the performance of
other comparable firms.
Current
Company Trailing
EPS EPS BPS DPS PPS (11/10/2004) AMR (American Airlines) -0.753 -3.03 -1.95 N/A 8.93 Southwest Airlines 0.103 0.35 7.06 N/A 16.17 Delta -6.45 -22.96 -24.59 N/A 6.15 Continental -0.415 -1.71 10.31 N/A 10.63 United Airlines -3.13 -14.97 -56.99 N/A 1.03
We will get the industry average for these ratios and then compare them with AMR’s to
attempt to get an accurate valuation for their stock.
- 28 -
As you can see in the table above, it is not possible to run many of these ratios
within the airline industry. Because of the negative earnings for most of the firms, it is
impossible to compute an industry average P/E ratio. Also, none of these companies pay
dividends of any kind, so there is no D/P ratio for any of these firms either. Although

there are a couple of firms with positive book value per share numbers, this is not enough
to obtain an industry average P/B ratio. Southwest Airlines is the only competitor we can
run all of these ratios for to use as an industry benchmark. However, this would not be a
wise decision because Southwest seems to be the exception in the airline industry, not the
rule. For some reason, Southwest has managed to maintain itself as a powerful and
somewhat profitable competitor to AMR and to all other regional and national airlines.
All of the other firms appear to be in as bad, if not worse, shape financially than AMR
currently is. We also felt that there was no need to attempt to run these ratios for
previous years, because many of these numbers (EPS, BPS, and DPS) were negative then
also. Although the method of comparables can be a useful method in evaluating a
company’s performance and obtaining stock price value using industry benchmarks, it is
obviously not rational for us to attempt to value AMR’s stock using this method.
Estimated Values
- 29 -
The first number we wanted to get was AMR’s estimated cost of equity (Ke). To
get this cost of equity we use the Capital Asset Pricing Model. To compute cost of equity
we first need to get an appropriate risk free rate, the company’s beta, and a market risk
premium. We first got a published beta for AMR on Yahoo! Finance of 2.867. We then
ran a beta regression analysis to find our own beta value for AMR. In this regression, we
used treasury yields, AMR’s monthly returns, and value weighted returns from January
1999 through December 2003 to get a 60-month time series. As seen in the table below,
when we got the slope of both the market returns and our firm’s returns, we get a beta of
3.2 with an R squared of .37. We feel that this number is very accurate because of the
low R squared, and because it is very similar to their published beta. We will be using
the beta we found through out the valuation process simply because we know how we
reached this number, while we have no idea where Yahoo! Finance got their number.
We obtained the risk free rate of 3% by using 7-year Treasury bond yields, and
we estimated the market risk premium to be about 4%. When we plugged in all of these
numbers (Ke = .03 + 3.2(.04)), we got an estimated cost of equity of 16.02%. We found
AMR’s cost of debt (Kd) by using their financial statements and finding the weighted
costs of their notes payable, then adding the commercial paper rate. We estimate AMR’s
cost of debt to be approximately 8%.
Finally, the last number that we need in order to continue our valuations is
AMR’s Weighted Average Cost of Capital (WACC). Because of the length and
tediousness of the WACC formula, we will not go into detail in demonstrating the
formula. Basically, we are taking the weight of AMR’s debt and multiplying it by their
after-tax cost of debt, and then taking the weight of their equity and multiplying it by
their estimated cost of equity. We computed their WACC to be approximately 5.72%.
- 30 -
In addition, we used Altman’s Z-Score Model to determine the creditworthiness
of the company. Using this particular model, we calculated AMR’s Z-score to be .28,
which is well below what would be considered a “safe-zone” in terms of bankruptcy risk.
According to the Altman Model, any company with a Z-score of less than 1.8 should be
considered in danger of going bankrupt. Obviously, AMR is in a tough situation, and our
calculations indicate that investing in the airline industry in general and AMR in
particular would not be a wise decision at this point in time due to the extremely high
degree of risk. However, investors are obviously feeling somewhat good about the future

prospects of the company because the cost of debt, which was previously discussed, is
not too terribly high and the market value of the airline’s stock continues to slowly grow.
Now that we have made some assumptions and estimated AMR’s WACC, cost of
debt, cost of equity, and Z-score figures, we are now ready to move on to our valuation
models.
Residual Income Model (Appendix A)
In the residual income model we used AMR’s book value of equity and their
earnings per share in order to forecast ending book values through 2013. We this derive
a “normal income” by multiplying AMR’s cost of equity by the beginning BV of equity
for that year. This number is then subtracted from the ending BV of equity to get a
residual income for each year. We then take the present value for all of these residual
incomes and add this number to their terminal value (past 2013) and their BV of equity in
the current year to get a stock price valuation of $40.49. As you see, the stock price we
got is not even remotely close to the actual stock price on November 10, which was
$9.23.
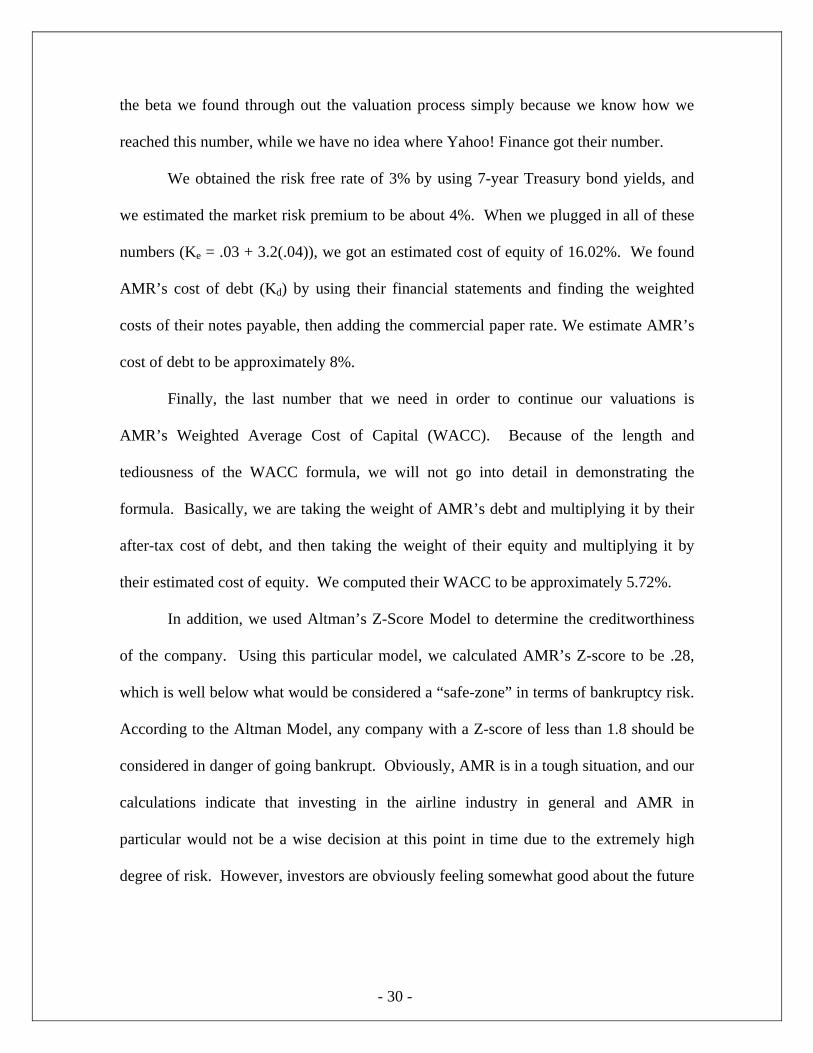
Sensitivity of the RI Model
Since we were unable to come close to the market’s stock price for AMR using
our estimated cost of equity and terminal growth rate, we began to adjust these two
variables in order to obtain a more reasonable valuation for AMR’s stock.
- 31 -
As you can see in the above chart, there is a large difference in the current stock
price and the value we got from this model. It would be unreasonable for us to assume
that our cost of equity and growth rate estimates were this far off. According to the
Residual Income Valuation Model, AMR’s stock appears to be severely undervalued at
$9.23.
Long Run Residual Income Model
The long run residual income valuation model could not be used on this particular
company because the return on equity (ROE) and the book value of equity (BVE) for
AMR is negative. Having an ROE with a negative value would cause the price of the
company’s stock to be negative. Therefore, using this model would not be very
beneficial in determining the estimated price per share because the end values would be
severely different from what is expected.
Discounted Dividend Model
AMR does not pay dividends on their stock, so unfortunately we are unable to run
the discounted dividend valuation.
- 32 -
Growth 3% 2% 1%
14.20% $40.49 $37.65 $35.23
Ke 18% $22.31 $21.11 $20.05
20% $16.53 $15.72 $15.00
23% $10.52 $10.06 $9.63

Discounted Free Cash Flows (Appendix B)
Based on our estimates of AMR’s cash flows from operation and their cash flows
used by investing activities, we have found that the Discounted Cash Flow model does a
fairly good job of reaching a realistic value AMR’s stock. According to this model, we
have initially estimated the value of AMR’s stock to be $11.04. Although our estimated
value per share is still higher than the actual price, the difference here is not very large.
Assuming that our figures and estimates for their WACC and cash flows are accurate, the
company’s stock still appears to be undervalued at a price of $9.23.
Sensitivity Analysis of DCF Model
It is not unreasonable, though, to assume that our estimated WACC and cash
flows aren’t completely accurate. In other words, a slight increase in our WACC to
6.08% from 5.63% is within the realm of reason. Therefore, we conclude that the
Discounted Cash Flow Model is highly sensitive to changes in the WACC.
Debt
8% 10% 12%
5.63% $11.04 $10.40 $9.82
WACC 7% $6.36 $5.72 $5.14
9% $2.37 $1.73 $1.15
11% $0.05 ($0.59) ($1.17)
Abnormal Earnings Growth Model (Appendix C)
- 33 -
Based upon our calculations and some of the requirements of the AEG Model, we
have concluded that since AMR declines to issue dividend payments, this model is
probably not the best to use for valuation purposes. In fact, it makes this model very

similar to the Residual Income Valuation. Because of the lack of a dividend payment,
this model fails to take into account any dividend re-investments or cumulative dividend
earnings. However, the model did produce a fairly reasonable value per share of $10.69,
as opposed to the actual value of $9.23. As you can see, our estimated value for AMR’s
stock is still larger than the actual price, but the gap appears to be lessening. This model
appears to be the most accurate, although still indicating a slightly higher value, in terms
of our valuation of the company’s stock and the actual stock price on November 10, 2004.
Therefore, this model also indicates that the company’s stock was undervalued.
Sensitivity of AEG Model
When examining the AEG Model for sensitivity, we found that this model is also
highly sensitive to changes in the cost of equity (Ke) and the growth rate (g). As you can
see in the above chart, using a cost of equity of 14.2% and a growth rate of 1%, we were
able to compute a value per share of $9.94, which was very similar to the actual price of
$9.23.
- 34 -
Growth
3% 2% 1%
14.20% $10.69 $10.29 $9.94
Ke 18% $6.98 $6.81 $6.66
20% $5.70 $5.59 $5.50
23% $4.29 $4.23 $4.18
Discussion and Summary of Overall Results
The valuation models previously discussed appear to be working fairly well.
Each model, with the exception of the Residual Income Valuation Model, allows us to
compute values per share that are somewhat close to the actual value per share that was
calculated as $9.23. However, when the WACC, cost of equity, and the growth rates
were adjusted we were able to compute values per share that were comparable to the
actual price. The majority of our calculations using these valuation models provided us
with a value per share of more than $9.23, indicating that AMR’s stocks were slightly
under priced, although not significantly.
Again, the Residual Income Valuation Model indicates that the stock was severely
undervalued. This seems to suggest that this model would be the least appropriate for
valuation purposes. Since AMR does not pay dividends to its shareholders, we were
unable to use the Dividend Discount Model, and the Abnormal Earnings Growth Model
was difficult to manage, but did resemble the Residual Income Model. This causes some
fairly significant limitations as to exactly which model provides the best estimates.
Although the models indicate the share values were undervalued, most of the differences
were not unfounded. In this regard, we feel that our valuations are suitable. If the
company were to publish numbers such as their cost of debt and cost of equity, the
valuations almost certainly would have been more accurate.
- 35 -
Also, the valuation process would be much easier if the nature of the airline
industry was more promising than it is right now. Taking into consideration the threat of
future terrorist attacks and the continued deterioration of popularity of air travel among

- 36 -
the general public, the airline industry appears to be stuck in a rut. This, though, we
believe is about to change for the better. The usefulness of the forecasted financial
statements again falls victim to the outlook of the airline industry in general. The
difficulty to predict the volatility of this particular industry makes it extremely
challenging to forecast future business operations, decisions, and strategies.

- 37 -
1 2 3 4 5 6 7 8 9
Appendix: A
Valuation of AMR using the Residual Income Model Shares Outstanding = 160,830,000
growth = 0.03 Assume a cost of Equity = 16.02% and residual income growth of 3% after 2013 Ke = 0.142 All data is stated in Per Share amounts. We are valuing AMR at Nov. 10, 2004 Forecast Years 2004 2005 2006 2007 2008 2009 2010 2011 2012 2013 Beginning BVE (per share) (1.95) (4.20) (3.75) (2.15) 0.76 3.52 6.12 8.54 10.77 EPS (2.25) 0.45 1.60 2.91 2.76 2.60 2.42 2.23 2.02 DPS 0.00 0.00 0.00 0.00 0.00 0.00 0.00 0.00 0.00 Ending BVE (per share) (1.95) (4.20) (3.75) (2.15) 0.76 3.52 6.12 8.54 10.77 12.78 "Normal" Income (0.31) (0.67) (0.60) (0.34) 0.12 0.56 0.98 1.37 1.72 Residual Income (RI) (3.89) (3.08) (1.55) 1.10 3.40 5.55 7.56 9.40 11.06 PV Factors 0.8619 0.7429 0.6403 0.5519 0.4757 0.4100 0.3534 0.3046 0.2625 Present Value of RI 6.31 BV Equity (per share) 2004 (1.95) Total PV of RI (end 2004) 6.31 Termin al = Continuation (Terminal) Value 84.93 PV of Terminal Value (end 2004) $25.87
Estimated Value Per Share (2004) $40.49 Actual Share Price @ Nov. 10, 2004 $9.23

- 38 -
dix: B
Discounted Free Cash Flow Model
Shares Outstanding 160.83 WACC 5.63% Debt 8% American Airlines
(Amounts in millions of dollars except per share data) 2004 2005 2006 2007 2008 2009 2010 2011
Cash Flow from Operations $803 $845 $873 $892 $911 $917 $921 $924Cash Provided (Used) by Investing Activities ($900) ($758) ($653) ($645) ($654) ($659) ($665Free Cash Flow (to firm) (55) 115 239 266 263 262 259
1 2 3 4 5 6 7Present Value of Free Cash Flows -52 103 203 214 200 189 177Total Present Value of Annual Cash Flows 1,497 Continuing (Terminal) Value (assuming no growth) 4,440 Present Value of Continuing (Terminal) Value 2,568 Value of the Firm (end of 1987) 4,065 Book Value of Debt and Preferred Stock 2,290 Value of Equity (end of 1987) 1,775 Estimated Value per Share 11.04
Actual Dividends per share Actual Price per share 9.23

- 39 -
dix: C
R Ke= 0.142 g = 0.03
ted in Per Share amounts. 1 2 3 4 5 6 7 8 9 Forecast Years
2004 2005 2006 2007 2008 2009 2010 2011 2012 2013 ($7.73) ($2.25) $0.45 $1.60 $2.91 $2.76 $2.60 $2.42 $2.23 $2.02
0.00 0.00 0.00 0.00 0.00 0.00 0.00 0.00 0.00 at 12% 0 0 0 0 0 0 0 0 0
d Earnings ($2.25) $0.45 $1.60 $2.91 $2.76 $2.60 $2.42 $2.23 $2.02 ngs ($0.32) $0.06 $0.23 $0.41 $0.39 $0.37 $0.34 $0.32 $0.29 rning Growth
($1.93) $0.38 $1.38 $2.49 $2.37 $2.23 $2.08 $1.91 $1.73 0.875657 0.766775 0.671431 0.587943 0.514837 0.45082 0.394764 0.345678 0.302695 0. ($1.69) $0.29 $0.92 $1.47 $1.22 $1.01 $0.82 $0.66 $0.52
EG $5.71 erminal) Value 16.46 terminal= al Value 4.98 EG $10.69 Rate
0.03
are $10.69
Price 11/9 $9.23

dix: D-1
American Airlines 1999 2000 2001 2002 2003 Liquidity Ratios
Current Ratio 0.92 0.65 0.90 0.68 0.72 Quick Asset Ratio 0.23 0.20 0.17 0.14 0.14 Inventory Turnover n/a n/a n/a n/a n/a Days supply of Inventory n/a n/a n/a n/a n/a Receivables Turnover 14.54 14.59 15.24 18.60 22.90 Days supply of Receivables 25.11 25.02 23.96 19.63 15.94 Working Capital Turnover -38.08 -7.65 -25.61 -7.27 -9.94 *-working capital turnover cannot be negative, therefore the values derived in years 1999 - 2003 are n/a.
Profitability Ratios Gross Profit Margin n/a n/a n/a n/a n/a Operating Expense Ratio n/a n/a n/a n/a n/a Net Profit Margin 0.04 0.04 -0.09 -0.22 -0.08 Asset Turnover 0.75 0.08 0.57 0.58 0.66 Return on Assets 0.03 0.03 -0.05 -0.13 -0.05 Return on Equity 0.09 0.12 -0.29 -3.69 -3.82
Capital Ratios Debt to equity ratio 2.04 2.60 4.56 28.20 75.73 Times Interest Earned 75.99 64.47 46.15 30.69 33.21 Debt Service Margin n/a n/a n/a n/a n/a Dividend Payout Ratio n/a n/a n/a n/a n/a Sustainable Growth Rate 0.09 0.12 -0.29 -3.69 -3.82 *-sustainable growth rate cannot be negative, therefore the values derived in years 2001 - 2003 are n/a.
- 40 -

dix: D-2
Continental Airlines 1999 2000 2001 2002 2003
Liquidity Ratios Current Ratio 0.94 0.83 0.73 0.78 0.90 Quick Asset Ratio 0.61 0.63 0.52 0.47 0.49 Inventory Turnover n/a n/a n/a n/a n/a Days supply of Inventory n/a n/a n/a n/a n/a Receivables Turnover 17.07 20.00 22.20 22.23 n/a Days supply of Receivables 21.38 18.25 16.44 16.42 n/a Working Capital Turnover -2.15 -1.77 -1.38 -1.11 n/a *-working capital turnover cannot be negative, therefore the values derived in years 1999 - 2002 are n/a.
Profitability Ratios Gross Profit Margin n/a n/a n/a n/a n/a Operating Expense Ratio n/a n/a n/a n/a n/a Net Profit Margin 0.05 0.03 -0.01 -0.05 n/a Asset Turnover 1.05 1.08 0.92 0.79 n/a Return on Assets 0.06 0.04 -0.01 -0.04 n/a Return on Equity 0.29 0.29 -0.08 -0.59 n/a
Capital Ratios Debt to equity ratio 4.16 6.93 7.43 12.87 12.45 Times Interest Earned 37.08 39.44 30.40 23.60 n/a Debt Service Margin n/a n/a n/a n/a n/a Dividend Payout Ratio n/a n/a n/a n/a n/a Sustainable Growth Rate 0.29 0.29 -0.08 -0.59 n/a *-sustainable growth rate cannot be negative, therefore the values derived in years 2001 - 2002 are n/a.
- 41 -

dix: D-3
Northwest Airlines 1999 2000 2001 2002 2003
Liquidity Ratios Current Ratio 0.58 0.57 0.92 0.82 0.70 Quick Asset Ratio 0.36 0.35 0.73 0.65 0.49 Inventory Turnover n/a n/a n/a n/a n/a Days supply of Inventory n/a n/a n/a n/a n/a Receivables Turnover 19.45 21.05 18.62 14.31 19.90 Days supply of Receivables 18.77 17.34 19.60 25.50 18.35 Working Capital Turnover -6.69 -7.47 -29.48 -12.45 -32.02 *-working capital turnover cannot be negative, therefore the values derived in years 1999 - 2003 are n/a.
Profitability Ratios Gross Profit Margin n/a n/a n/a n/a n/a Operating Expense Ratio n/a n/a n/a n/a n/a Net Profit Margin 0.03 0.02 -0.04 -0.08 0.03 Asset Turnover 0.96 1.03 0.76 0.71 0.67 Return on Assets 0.03 0.02 -0.03 -0.06 0.02 Return on Equity -5.77 1.11 0.98 0.35 -0.12
Capital Ratios Debt to equity ratio -204.54 46.09 -31.10 -6.87 -8.04 Times Interest Earned 26.74 32.11 26.84 22.22 20.02 Debt Service Margin n/a n/a n/a n/a n/a Dividend Payout Ratio n/a n/a n/a n/a n/a Sustainable Growth Rate -5.77 1.11 0.98 0.35 -0.12 *-sustainable growth rate cannot be negative, therefore the values derived in years 1999 and 2003 are n/a.
- 42 -

dix: D-4
Southwest Airlines 1999 2000 2001 2002 2003
Liquidity Ratios Current Ratio 0.66 0.64 1.13 1.56 1.34 Quick Asset Ratio 0.51 0.40 1.02 1.39 1.16 Inventory Turnover n/a n/a n/a n/a n/a Days supply of Inventory n/a n/a n/a n/a n/a Receivables Turnover 64.48 40.92 77.93 31.55 44.98 Days supply of Receivables 5.66 8.92 4.68 11.57 8.12 Working Capital Turnover -14.37 -12.10 19.77 6.92 10.06 *-working capital turnover cannot be negative, therefore the values derived in years 1999 - 2000 are n/a.
Profitability Ratios Gross Profit Margin n/a n/a n/a n/a n/a Operating Expense Ratio n/a n/a n/a n/a n/a Net Profit Margin 0.10 0.11 0.09 0.04 0.07 Asset Turnover 0.84 0.85 0.62 0.62 0.60 Return on Assets 0.08 0.09 0.06 0.03 0.04 Return on Equity 0.17 0.17 0.13 0.05 0.09
Capital Ratios Debt to equity ratio 0.99 0.93 1.24 1.02 0.96 Times Interest Earned 87.46 80.84 79.56 52.08 65.24 Debt Service Margin n/a n/a n/a n/a n/a Dividend Payout Ratio n/a n/a n/a n/a n/a Sustainable Growth Rate 0.17 0.17 0.13 0.05 0.09
- 43 -

dix: D-5
US Airway 1999 2000 2001 2002 2003
Liquidity Ratios Current Ratio 0.84 0.89 0.59 0.58 0.80 Quick Asset Ratio 0.17 0.13 0.29 0.36 0.46 Inventory Turnover n/a n/a n/a n/a n/a Days supply of Inventory n/a n/a n/a n/a n/a Receivables Turnover 22.21 28.00 29.49 30.60 n/a Days supply of Receivables 16.43 13.03 12.38 11.93 n/a Working Capital Turnover -21.22 -28.43 -6.63 -7.41 n/a
*-working capital turnover cannot be negative, therefore the values derived in years 1999 - 2003 are n/a.
Profitability Ratios
Gross Profit Margin n/a n/a n/a n/a n/a Operating Expense Ratio n/a n/a n/a n/a n/a Net Profit Margin 0.04 -0.03 -0.26 -0.24 n/a Asset Turnover 1.12 1.02 1.03 1.07 n/a Return on Assets 0.04 -0.03 -0.26 -0.25 n/a Return on Equity -2.95 0.75 0.81 0.33 n/a
Capital Ratios Debt to equity ratio -66.68 -26.49 -4.07 -2.33 48.74 Times Interest Earned 44.53 36.93 29.71 22.15 n/a Debt Service Margin n/a n/a n/a n/a n/a Dividend Payout Ratio n/a n/a n/a n/a n/a Sustainable Growth Rate -2.95 0.75 0.81 0.33 n/a *-sustainable growth rate cannot be negative, therefore the value derived in year 1999 is n/a.
- 44 -

dix: D-6
INDUSTRY AVERAGE 1999 2000 2001 2002 2003
Liquidity Ratios Current Ratio 0.75 0.73 0.84 0.93 0.94 Quick Asset Ratio 0.41 0.38 0.64 0.72 0.65 Inventory Turnover n/a n/a n/a n/a n/a Days supply of Inventory n/a n/a n/a n/a n/a Receivables Turnover 30.80 27.49 37.06 24.67 n/a Days supply of Receivables 15.56 14.39 13.28 16.35 n/a Working Capital Turnover -11.11 -12.45 -4.43 -3.51 n/a *-working capital turnover cannot be negative, therefore the values derived in years 1999 - 2003 are n/a.
Profitability Ratios Gross Profit Margin n/a n/a n/a n/a n/a Operating Expense Ratio n/a n/a n/a n/a n/a Net Profit Margin 0.06 0.03 -0.05 -0.08 0.03 Asset Turnover 0.99 0.99 0.83 0.80 0.32 Return on Assets 0.05 0.03 -0.06 -0.08 0.02 Return on Equity -2.07 0.58 0.46 0.04 -0.01
Capital Ratios Debt to equity ratio -66.52 6.86 -6.62 1.17 13.53 Times Interest Earned 48.95 47.33 41.63 30.01 21.32 Debt Service Margin n/a n/a n/a n/a n/a Dividend Payout Ratio n/a n/a n/a n/a n/a Sustainable Growth Rate -2.07 0.58 0.46 0.04 -0.01 *-sustainable growth rate cannot be negative, therefore the values derived in years 1999 and 2003
- 45 -

dix: E
Current Ratio
1999 2000 2001 2002 2003
Year
0.00
0.20
0.40
0.60
0.80
1.00
1.20
1.40
1.60
1.80
American NorthwestUS AirwaySouthwestContinentalIndustry Average
- 46 -

dix: F
Working Capital
1999 2000 2001 2002 2003
Year
AmericanNorthwestUS AirwaySouthwestContinentalIndustry Average
- 47 -

dix: G
Sustainable Growth Rate
1999
2000
2001
2002
2003
Year-7.00
-6.00
-5.00
-4.00
-3.00
-2.00
-1.00
0.00
1.00
2.00
AmericanNorthwestUS AirwaySouthwestContinentaIndustry A
- 48 -
dix: H-1
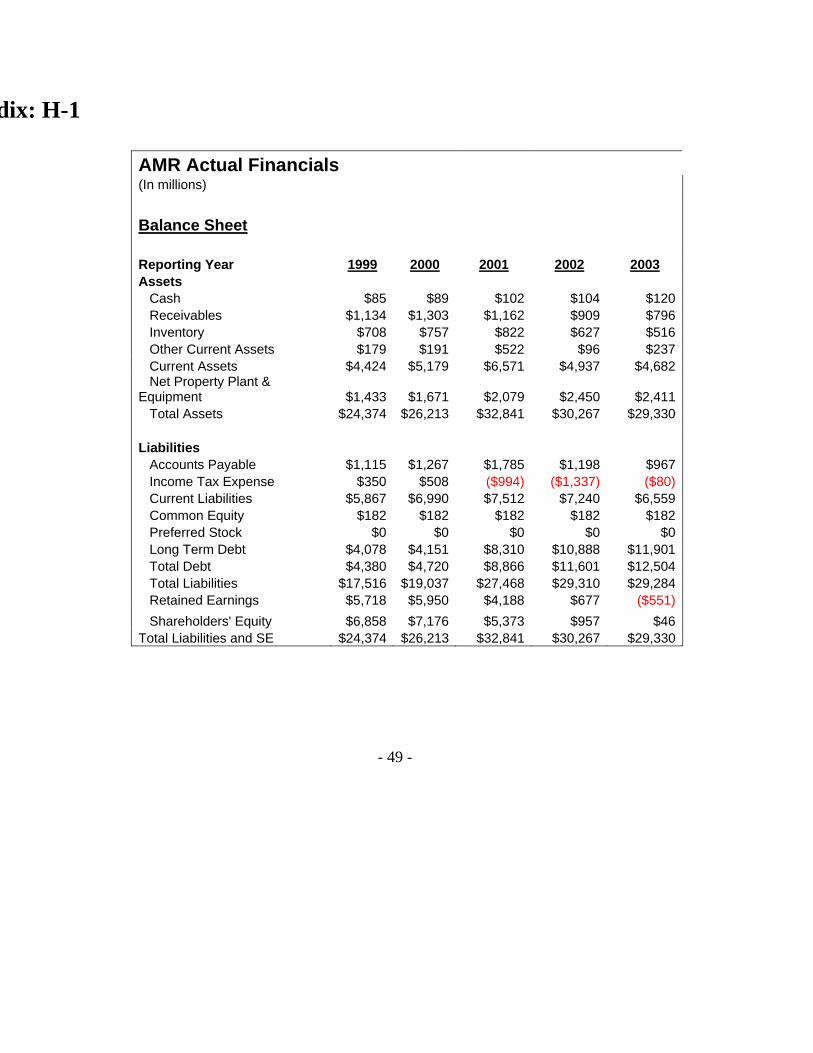
AMR Actual Financials (In millions) Balance Sheet Reporting Year 1999 2000 2001 2002 2003 Assets Cash $85 $89 $102 $104 $120 Receivables $1,134 $1,303 $1,162 $909 $796 Inventory $708 $757 $822 $627 $516 Other Current Assets $179 $191 $522 $96 $237 Current Assets $4,424 $5,179 $6,571 $4,937 $4,682 Net Property Plant & Equipment $1,433 $1,671 $2,079 $2,450 $2,411 Total Assets $24,374 $26,213 $32,841 $30,267 $29,330 Liabilities Accounts Payable $1,115 $1,267 $1,785 $1,198 $967 Income Tax Expense $350 $508 ($994) ($1,337) ($80) Current Liabilities $5,867 $6,990 $7,512 $7,240 $6,559 Common Equity $182 $182 $182 $182 $182 Preferred Stock $0 $0 $0 $0 $0 Long Term Debt $4,078 $4,151 $8,310 $10,888 $11,901 Total Debt $4,380 $4,720 $8,866 $11,601 $12,504 Total Liabilities $17,516 $19,037 $27,468 $29,310 $29,284 Retained Earnings $5,718 $5,950 $4,188 $677 ($551) Shareholders' Equity $6,858 $7,176 $5,373 $957 $46 Total Liabilities and SE $24,374 $26,213 $32,841 $30,267 $29,330
- 49 -
- 50 -
dix: H-2
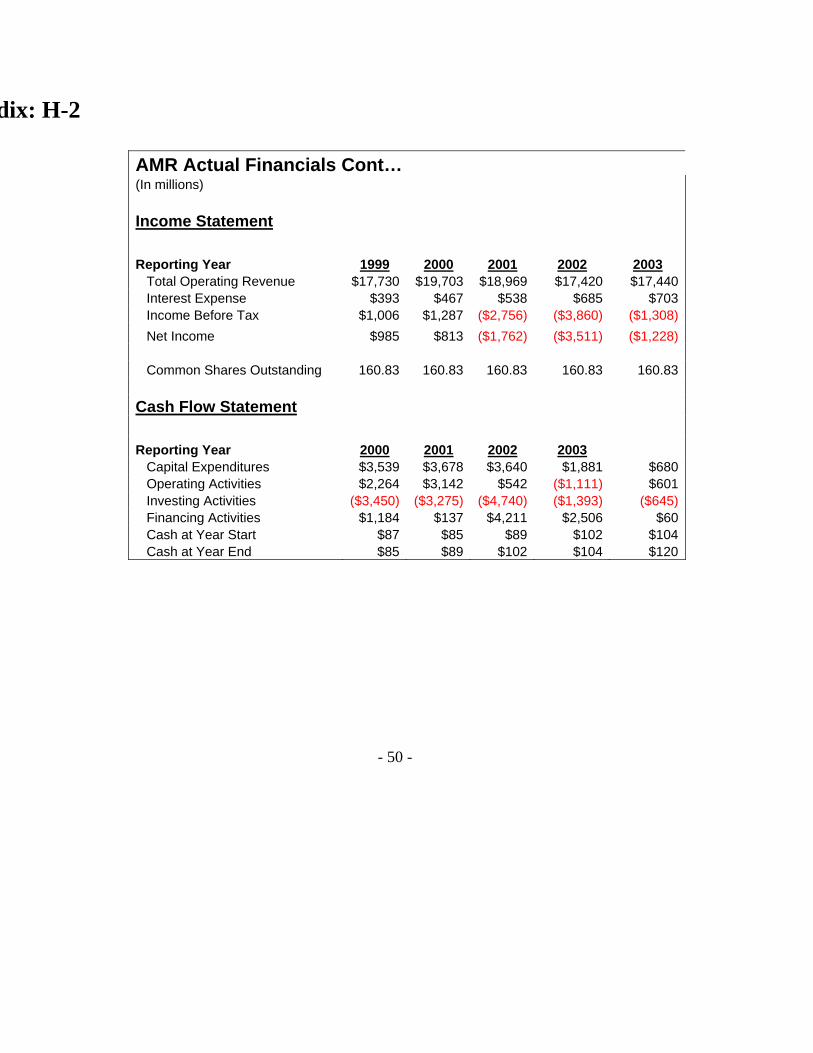
AMR Actual Financials Cont… (In millions) Income Statement Reporting Year 1999 2000 2001 2002 2003 Total Operating Revenue $17,730 $19,703 $18,969 $17,420 $17,440 Interest Expense $393 $467 $538 $685 $703 Income Before Tax $1,006 $1,287 ($2,756) ($3,860) ($1,308) Net Income $985 $813 ($1,762) ($3,511) ($1,228) Common Shares Outstanding 160.83 160.83 160.83 160.83 160.83 Cash Flow Statement Reporting Year 2000 2001 2002 2003 Capital Expenditures $3,539 $3,678 $3,640 $1,881 $680 Operating Activities $2,264 $3,142 $542 ($1,111) $601 Investing Activities ($3,450) ($3,275) ($4,740) ($1,393) ($645) Financing Activities $1,184 $137 $4,211 $2,506 $60 Cash at Year Start $87 $85 $89 $102 $104 Cash at Year End $85 $89 $102 $104 $120
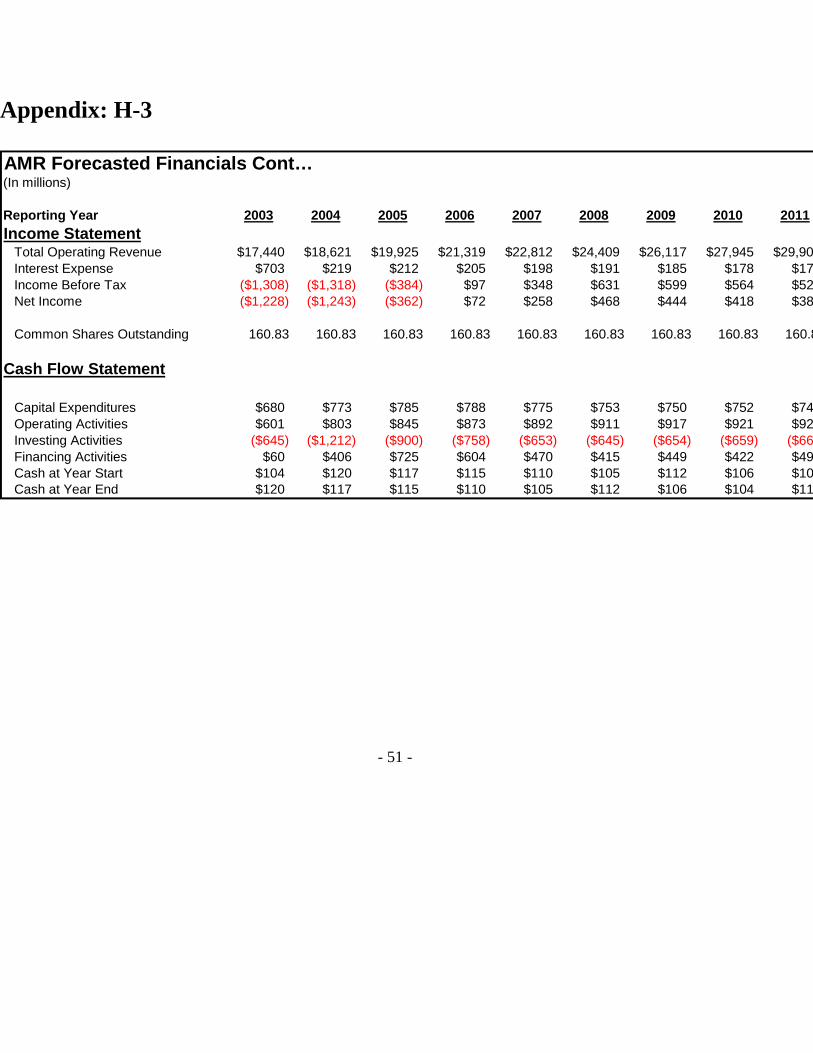
Appendix: H-3
- 51 -
(In millions)
Reporting Year 2003 2004 2005 2006 2007 2008 2009 2010 2011Income Statement Total Operatin Interest Expen Income Befo $97 $348 $631 $599 $564 $52 Net Income $72 $258 $468 $444 $418 $38
Common Shares Outstanding 160.83 160.83 160.83 160.83 160.83 160.83 160.83 160.83 160.
g Revenue $17,440 $18,621 $19,925 $21,319 $22,812 $24,409 $26,117 $27,945 $29,90se $703 $219 $212 $205 $198 $191 $185 $178 $17
re Tax ($1,308) ($1,318) ($384)($1,228) ($1,243) ($362)
8
Cash Flow Statement
Capital Expenditures $680 $773 $785 $788 $775 $753 $750 $752 $74 Operating Activities $601 $803 $845 $873 $892 $911 $917 $921 $924 Investing Activities Financing Activities $60 $406 $725 $604 $470 $415 $449 $422 $49 Cash at Year Start $104 $120 $117 $115 $110 $105 $112 $106 $10
($645) ($1,212) ($900) ($758) ($653) ($645) ($654) ($659) ($66
4 Cash at Year End $120 $117 $115 $110 $105 $112 $106 $104 $11
AMR Forecasted Financials Cont…

Appendix: H-4
- 52 -
(In millions)
Reporting Year 2003 2004 2005 2006 2007 2008 2009 2010 2011 2012 2013 2014Income Statement Total Operating Reven Interest Expense Income Before Tax $97 $348 $631 $599 $564 $526 $484 $438 $466 Net Income $72 $258 $468 $444 $418 $389 $358 $324 $345
Common Shares Outstanding 160.83 160.83 160.83 160.83 160.83 160.83 160.83 160.83 160.83 160.83 160.83 160.83
Cash Flow Statement
ue $17,440 $18,621 $19,925 $21,319 $22,812 $24,409 $26,117 $27,945 $29,902 $31,995 $34,234 $36,631$703 $219 $212 $205 $198 $191 $185 $178 $171 $164 $157 $150
($1,308) ($1,318) ($384)($1,228) ($1,243) ($362)
Capital Expenditures $680 $773 $785 $788 $775 $753 $750 $752 $748 $756 $758 $753 Operating Activities $601 $803 $845 $873 $892 $911 $917 $921 $924 $927 $930 $933 Investing Activities Financing Activities $60 $406 $725 $604 $470 $415 $449 $422 $498 $398 $370 $326 Cash at Year Start $104 $120 $117 $115 $110 $105 $112 $106 $104 $110 $108 $105 Cash at Year End $120 $117 $115 $110 $105 $112 $106 $104 $110 $108 $105 $110
AMR Forecasted Financials Cont…
($645) ($1,212) ($900) ($758) ($653) ($645) ($654) ($659) ($665) ($671) ($676) ($683)

Works Cited “American Airlines.” Company Profile. 2004. Computer Business Review Online. 16 Sept. 2004 <http://www.cbronline.com/companyprofile.asp?guid>. "American Airlines." TheFreeDictionary.com Retrieved 17 Sept. 2004
<http://encyclopedia.thefreedictionary.com/American+Airlines>. “American Airlines, Inc.” Company Details. 2004. Price Waterhouse Coopers. 4 Dec. 2004 <http://edgarscan.pwcglobal.com/servlets/getCompanyDetail?Name=. "American Airlines becomes a Superbrand." AA.com. Updated Dec. 2003. Retrieved 18 Sept.
2004 <http://www.aa.com/content/uk/travelInformation/SuperBrand.jhtml>. "American Airlines Says Cost of Fuel Thwarts Turnaround." Updated 27 Aug. 2004. Retrieved
17 Sept. 2004 <http://www.aiada.org/article.asp?id=21742>. “American Airlines Data Warehouse Uncovers Hidden Revenue Opportunities, Lowers Costs.” DSSTAR. 2004. TGC.com. 3 Oct. 2004 <http://www.tgc.com/ Dsstar/98/0414/100154.html>. “Facts.” AMR Corporation – American’s Parent Company. 2004. AA.com. 16 Sept. 2004 <http://www.aa.com/content/amrcorp/corporate Information/facts/amr.jhtml>. “Form 10Q.” American Airlines, Inc. Extracted Financial Data. 2004. Price Waterhouse Coopers. 3 Dec. 2004 <http://edgarscan.pwcglobal.com/ >. “History.” American Airlines History. 2004. AA.com. 16 Sept. 2004 <http://www.aa.com/content/amrcorp/corporateInformation/facts/history.jhtml>. Koenig, David. "Some Doubt American Airlines' Strength." Updated 25 Jul. 2004. Retrieved 18
Sept. 2004 <http://www.phillyburbs.com/pb-dyn/news/24-07252004-337202.html>. Matthew, Elizabeth, and Allan Walters. "American Airlines' AA.com Gets Personal."
cci.mcombs.utexas.edu Updated Apr. 1999. Retrieved 17 Sept. 2004 <http://cci.mccombs.utexas.edu/research/case/aa.htm>.
Newcomb, Kevin. "American Airlines Boasts of Understanding Customers in Online Brand
Effort." Updated 10 Sept. 2004. Retrieved 17 Sept. 2004 <http://www.clickz.com/news/article.php/3406441>.
- 53 -
"Sabre Airline Reservations System." TheFreeDictionary.com Retrieved 17 Sept. 2004 <http://encyclopedia.thefreedictionary.com/Sabre+Airline+Reservations+System>.

- 54 -