Embed Size (px)
Citation preview
1
SMSAAM Corporate Presentation
1
2 2
Disclaimer
This presentation provides general information about Sociedad Matriz SAAM S.A. (“SM SAAM”) and related companies. It is summarized information and does not claim, in any way, to be complete. It is not intended to be considered as an advice to potential investors. No representations or warranties, implicit or explicit, are made with respect to the accuracy, impartiality or integrity of the information presented or contained in this presentation. Neither SM SAAM nor any of its related companies, advisors or representatives, assumes any responsibility whatsoever for any loss or damage that may arise from any information presented or contained in this presentation and it will not be mandatory for them to update it after the date in which it is issued. Each investor must perform and trust its own evaluation at the time of making an investment decision, as this presentation does not constitute, in any way whatsoever, a legal, tax or investment advice. This presentation does not constitute an offer or invitation or request of an offer, to subscribe or purchase shares. Neither this presentation nor anything contained in it shall constitute the basis of any eventual contract or commitment whatsoever.
3
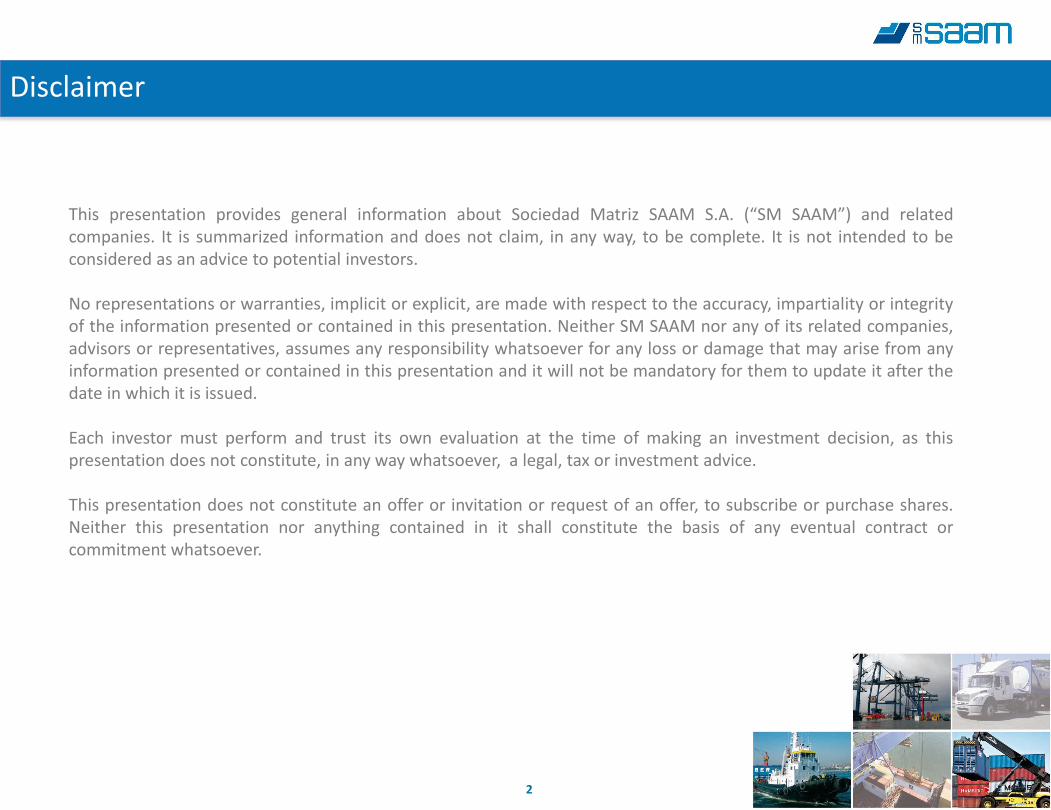
Leader in Latin America
41%
Port Terminals Logistics Tugboats
10.697 Workers
30.6 millones Tons transferred in 2014
191 (1) 10 Tugboats Port Terminals
+350 ha. Support Areas and
Warehouses
The Company provides comprehensive cargo transfer services for clients in the export and import business,
and to shipping and airline companies present in the most important Latin American markets
Founded in 1961.
Profitable investments and substantial
synergies among its business
segments.
Low indebtedness and available cash.
Wide coverage in America, present in 13
countries.
Fourth global tugboat operator
Major port operator in Latin America
(long-term concessions)
Exploration of new markets jointly with
local partners.
(1) 11 tugboats under construction, included SST.
4 4
• Strengthening of our competitive positions in America :
• Two new markets: Canada and Panama, where we are leaders
• 2nd Tugboat operator in Brazil
• Replacements in top management teams aimed at structural strengthening
• Reversal of the effects caused by the port strike that affected Chilean ports in January 2014
• Commencement of the development of Contract Logistics
• Progress in Investment Plan to maintain the standards required by our clients and the market
• Beginning of BICE, Penta and Credicorp coverage with recommendation to PURCHASE
Milestones achieved in 2014
5 5
Tugboats : • Beginning of SAAM & SMIT joint tugboat service operation in four American countries.
‐ Under the new name of SAAM SMIT Towage, the new company operates a fleet of 111 tugboats in over 30 terminals in Brazil, Panama, Mexico and Canada
• In Mexico, progress was made in contract renewals • Renewal of contracts in Honduras and Brazil Port Terminals : • New services in Guayaquil (TPG) and Iquique (ITI) for 62,000 box/year • Replacement of General Managers in SVTI, ATI, ITI, STI and TMAZ • Restructuring of the business segment, creation of Projects and Operational Efficiency Areas. • ATI Concession extension approved for a further 10 years. • Request for extension of FIT concession was sent to Port Everglades authorities. • Progress made in investment plan in Iquique (ITI), Antofagasta (ATI), San Vicente (SVTI), San
Antonio (STI) Logistics : • Logistics Division Manager was replaced, as well as Logistica Chile Manager. • Development of Contract Logistics business commenced in Chile • Development of Intermodal Terminals in Arica and Iquique • Uruguay: Celulosa Montes del Plata plant began operations
Recent Events
6
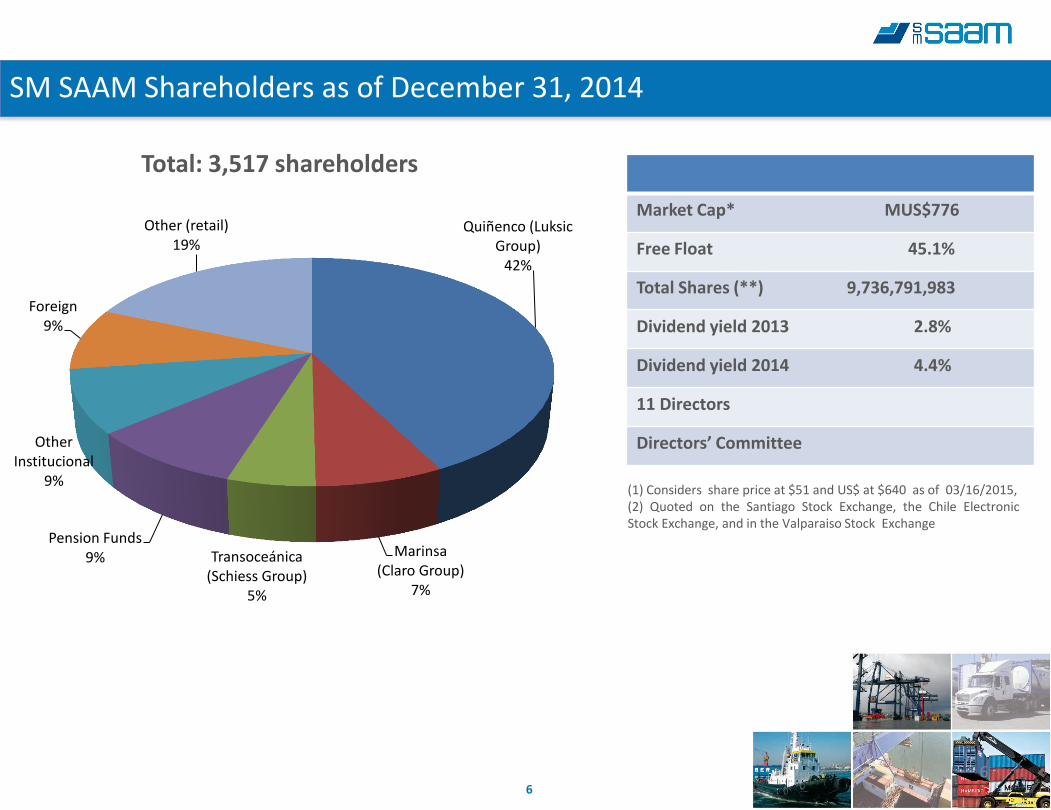
SM SAAM Shareholders as of December 31, 2014
Total: 3,517 shareholders
6
Market Cap* MUS$776
Free Float 45.1%
Total Shares (**) 9,736,791,983
Dividend yield 2013 2.8%
Dividend yield 2014 4.4%
11 Directors
Directors’ Committee
(1) Considers share price at $51 and US$ at $640 as of 03/16/2015, (2) Quoted on the Santiago Stock Exchange, the Chile Electronic Stock Exchange, and in the Valparaiso Stock Exchange
Quiñenco (Luksic Group)
42%
Marinsa (Claro Group)
7%
Transoceánica (Schiess Group)
5%
Pension Funds 9%
Other Institucional
9%
Foreign 9%
Other (retail) 19%
7 7
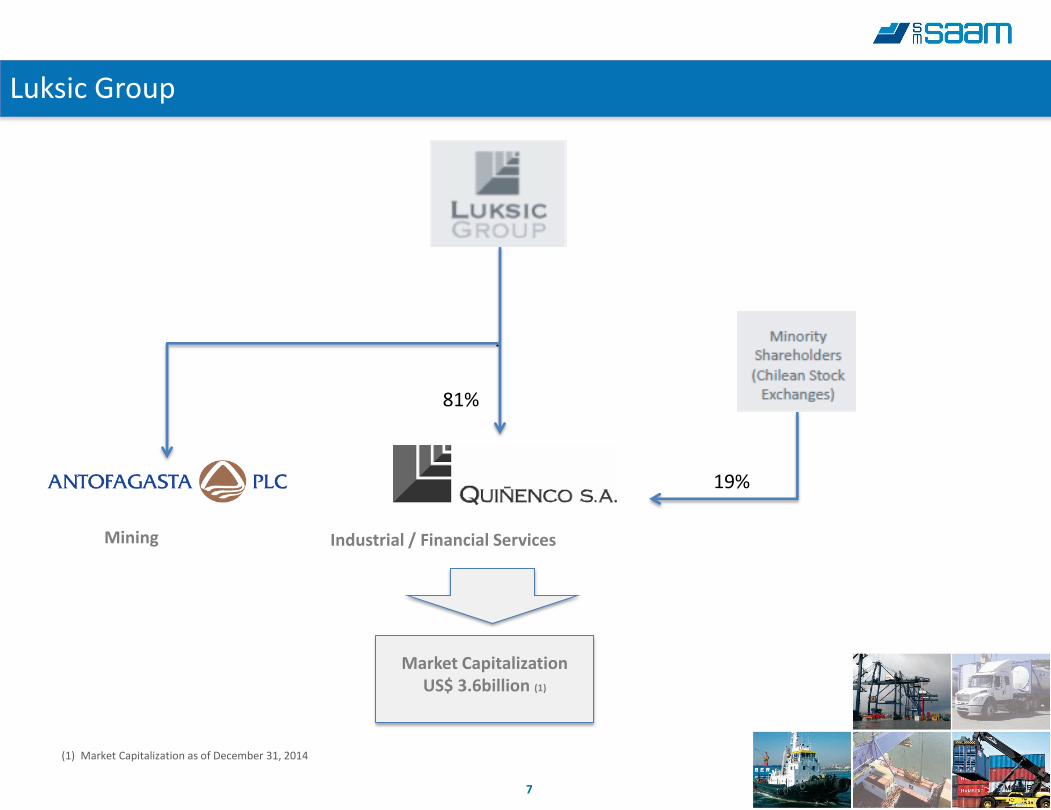
Luksic
Group
81%
(1) Market Capitalization as of December 31, 2014
Luksic Group
Mining Industrial / Financial Services
Market Capitalization US$ 3.6billion (1)
19%
8
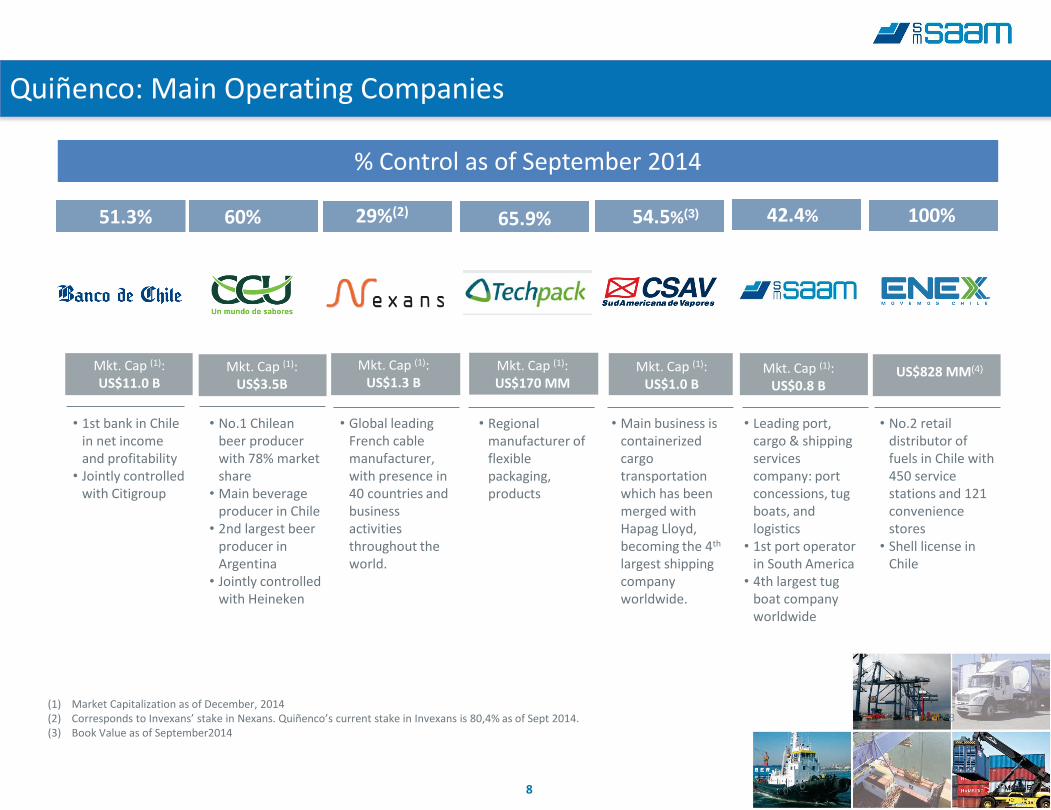
51.3%
8
% Control as of September 2014
Quiñenco: Main Operating Companies
8
60% 29%(2) 65.9% 54.5%(3) 100% 42.4%
• 1st bank in Chile in net income and profitability
• Jointly controlled with Citigroup
• No.1 Chilean beer producer with 78% market share
• Main beverage producer in Chile
• 2nd largest beer producer in Argentina
• Jointly controlled with Heineken
• Global leading French cable manufacturer, with presence in 40 countries and business activities throughout the world.
• Main business is containerized cargo transportation which has been merged with Hapag Lloyd, becoming the 4th largest shipping company worldwide.
• Leading port, cargo & shipping services company: port concessions, tug boats, and logistics
• 1st port operator in South America
• 4th largest tug boat company worldwide
• No.2 retail distributor of fuels in Chile with 450 service stations and 121 convenience stores
• Shell license in Chile
Mkt. Cap (1): US$11.0 B
Mkt. Cap (1): US$3.5B
Mkt. Cap (1): US$1.3 B
Mkt. Cap (1): US$1.0 B
Mkt. Cap (1): US$0.8 B
US$828 MM(4) Mkt. Cap (1): US$170 MM
• Regional manufacturer of flexible packaging, products
(1) Market Capitalization as of December, 2014 (2) Corresponds to Invexans’ stake in Nexans. Quiñenco’s current stake in Invexans is 80,4% as of Sept 2014. (3) Book Value as of September2014
9
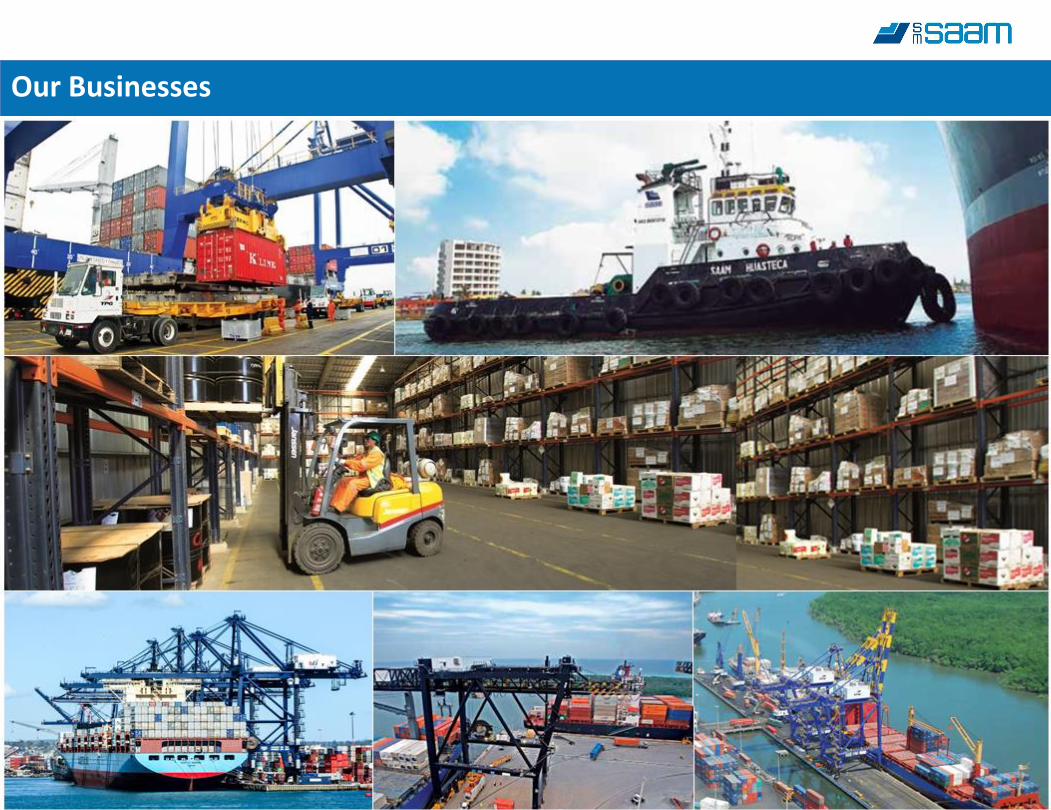
Our Businesses
10
TMAZ
10
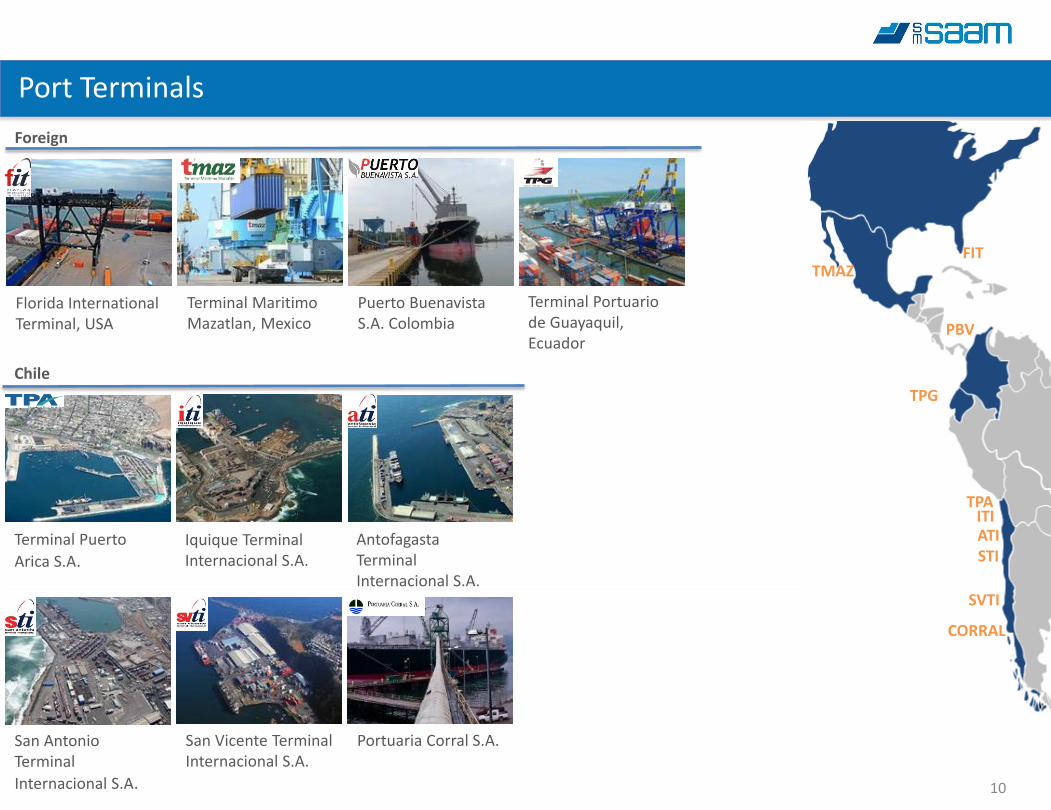
Port Terminals
Foreign
Terminal Puerto
Arica S.A.
San Vicente Terminal Internacional S.A.
Chile
Antofagasta Terminal Internacional S.A.
Iquique Terminal Internacional S.A.
San Antonio Terminal
Internacional S.A.
Portuaria Corral S.A.
Florida International Terminal, USA
Terminal Maritimo Mazatlan, Mexico
Terminal Portuario de Guayaquil, Ecuador
Puerto Buenavista S.A. Colombia
FIT
PBV
TPG
TPA ITI ATI STI
SVTI
CORRAL
11
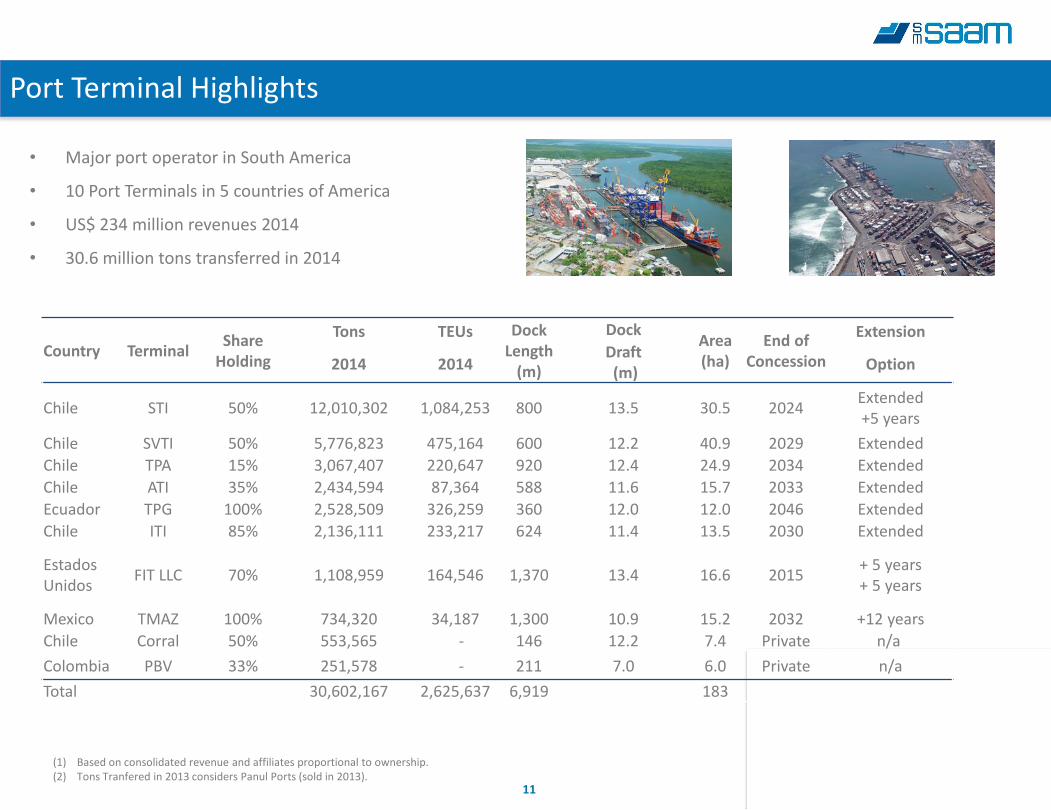
Port Terminal Highlights
• Major port operator in South America
• 10 Port Terminals in 5 countries of America
• US$ 234 million revenues 2014
• 30.6 million tons transferred in 2014
(1) Based on consolidated revenue and affiliates proportional to ownership. (2) Tons Tranfered in 2013 considers Panul Ports (sold in 2013).
Country Terminal Share
Holding
Tons TEUs Dock Length
(m)
Dock Area (ha)
End of Concession
Extension Draft (m) 2014 2014 Option
Chile STI 50% 12,010,302 1,084,253 800 13.5 30.5 2024 Extended +5 years
Chile SVTI 50% 5,776,823 475,164 600 12.2 40.9 2029 Extended
Chile TPA 15% 3,067,407 220,647 920 12.4 24.9 2034 Extended
Chile ATI 35% 2,434,594 87,364 588 11.6 15.7 2033 Extended
Ecuador TPG 100% 2,528,509 326,259 360 12.0 12.0 2046 Extended
Chile ITI 85% 2,136,111 233,217 624 11.4 13.5 2030 Extended
Estados Unidos
FIT LLC 70% 1,108,959 164,546 1,370 13.4 16.6 2015 + 5 years + 5 years
Mexico TMAZ 100% 734,320 34,187 1,300 10.9 15.2 2032 +12 years
Chile Corral 50% 553,565 - 146 12.2 7.4 Private n/a
Colombia PBV 33% 251,578 - 211 7.0 6.0 Private n/a
Total 30,602,167 2,625,637 6,919 183
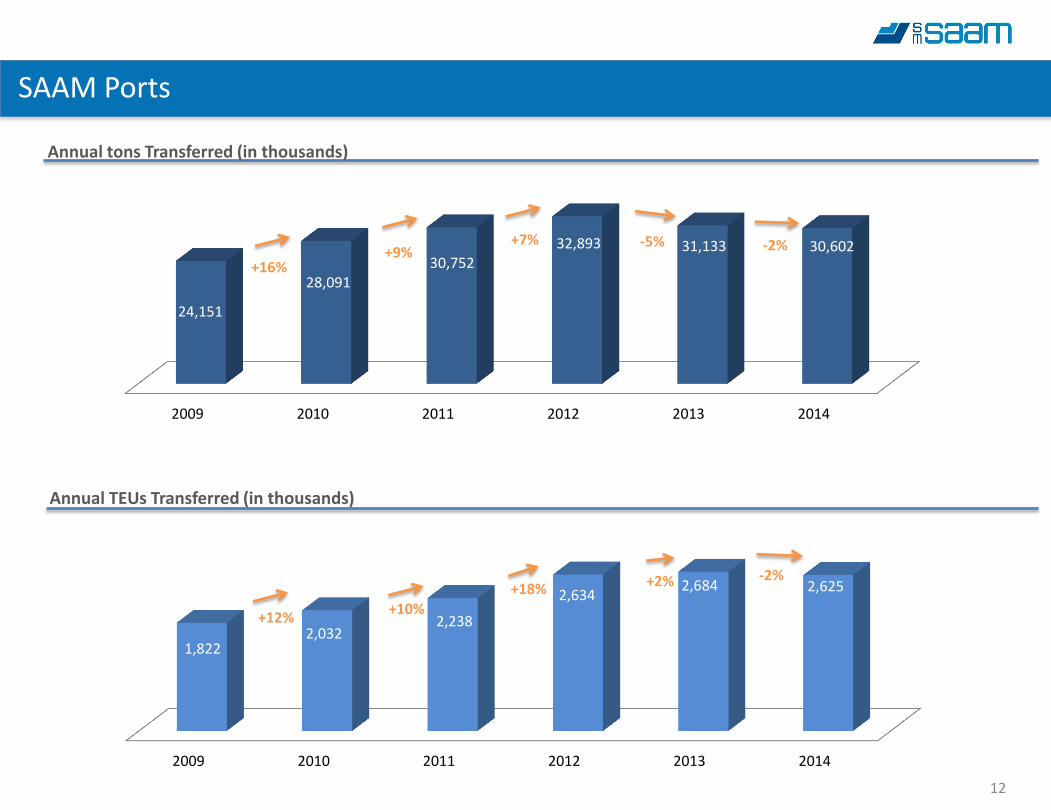
12 12
SAAM Ports
Annual tons Transferred (in thousands)
Annual TEUs Transferred (in thousands)
2009 2010 2011 2012 2013 2014
24,151
28,091 30,752
32,893 31,133 30,602 -2% -5% +7% +9%
+16%
2009 2010 2011 2012 2013 2014
1,822 2,032
2,238
2,634 2,684 2,625
-2% +2% +18% +10%
+12%
13
Chile Uruguay
Brasil
Mexico
Canadá
Honduras
Ecuador
Peru
Guatemala Costa Rica
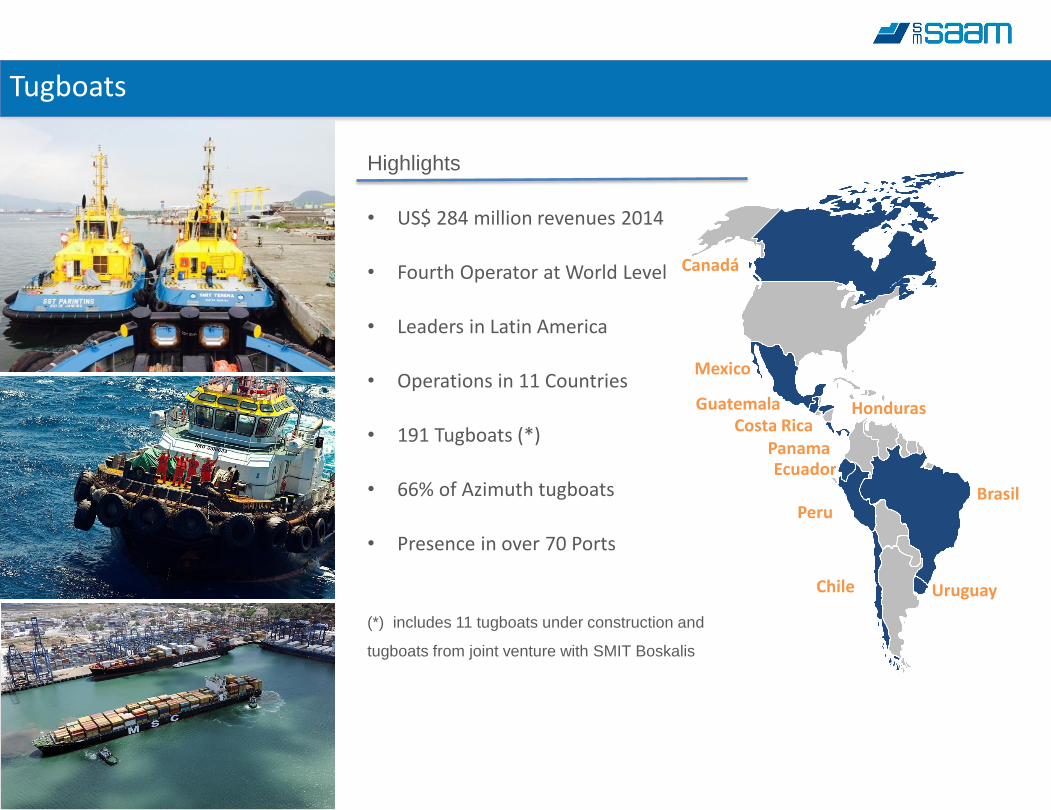
Tugboats
Panama
Highlights
• US$ 284 million revenues 2014
• Fourth Operator at World Level
• Leaders in Latin America
• Operations in 11 Countries
• 191 Tugboats (*)
• 66% of Azimuth tugboats
• Presence in over 70 Ports
(*) includes 11 tugboats under construction and
tugboats from joint venture with SMIT Boskalis
14
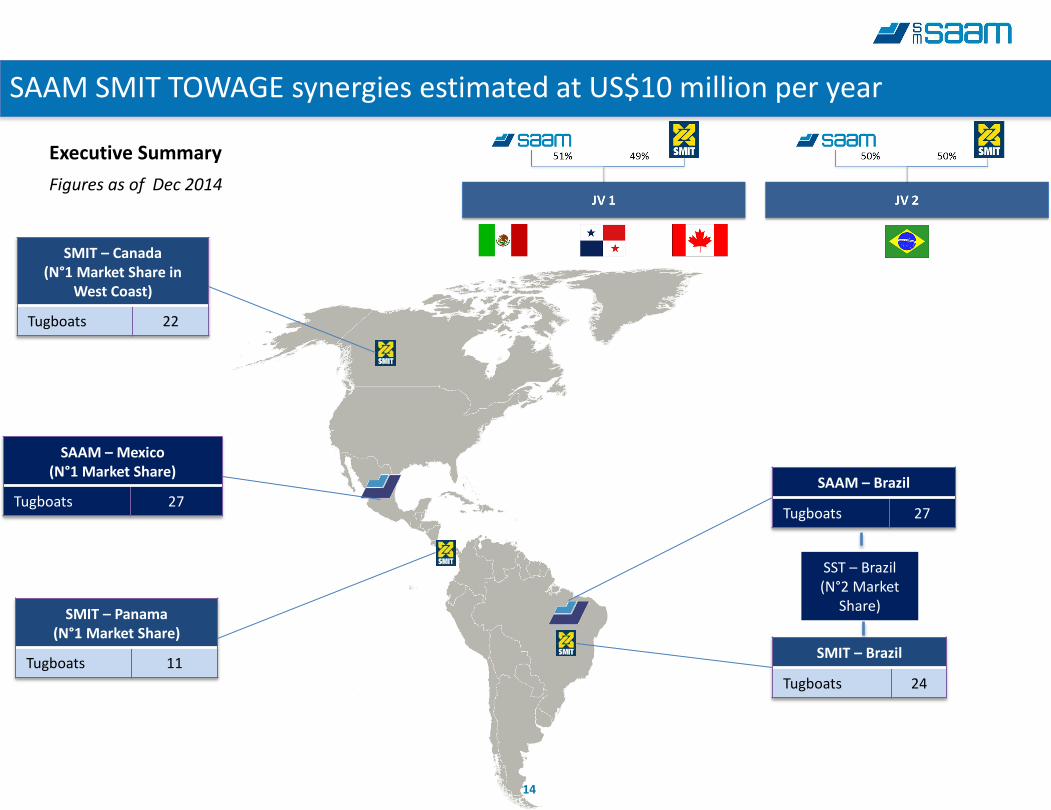
Executive Summary
Figures as of Dec 2014
SMIT – Canada (N°1 Market Share in
West Coast)
Tugboats 22
SMIT – Panama (N°1 Market Share)
Tugboats 11 SMIT – Brazil
Tugboats 24
SAAM – Mexico (N°1 Market Share)
Tugboats 27 SAAM – Brazil
Tugboats 27
SAAM SMIT TOWAGE synergies estimated at US$10 million per year
SST – Brazil (N°2 Market
Share)
15
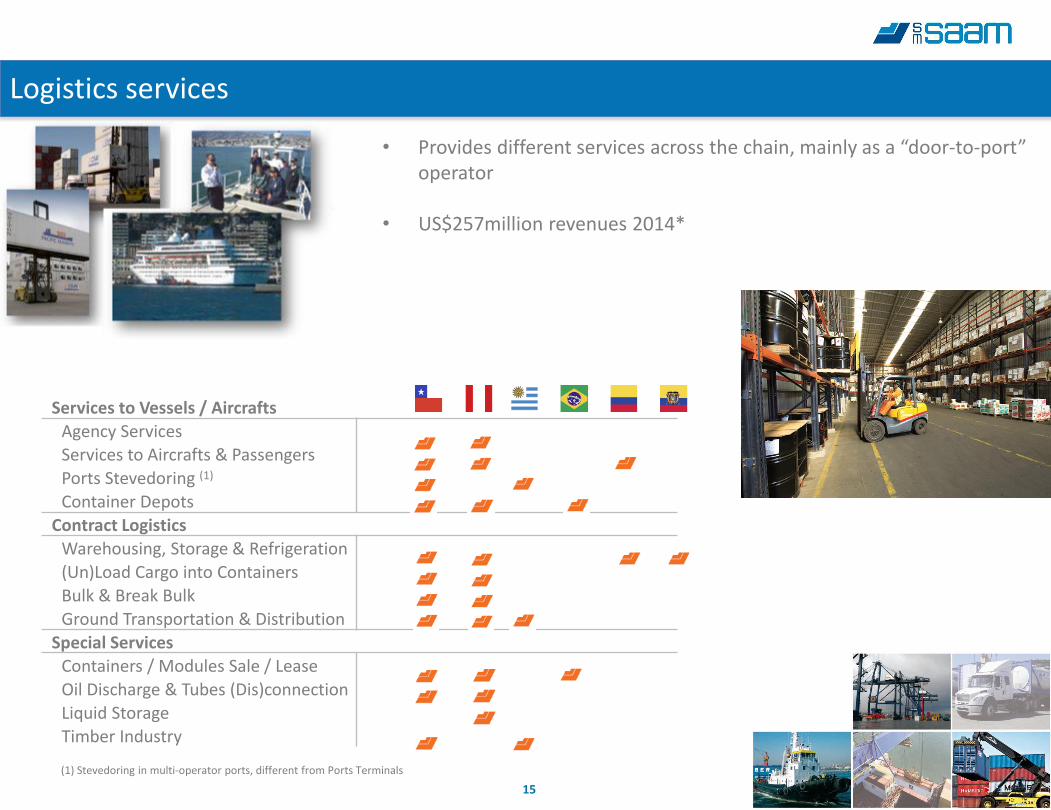
Services to Vessels / Aircrafts
Agency Services
Services to Aircrafts & Passengers
Ports Stevedoring (1)
Container Depots
Contract Logistics
Warehousing, Storage & Refrigeration
(Un)Load Cargo into Containers
Bulk & Break Bulk
Ground Transportation & Distribution
Special Services
Containers / Modules Sale / Lease
Oil Discharge & Tubes (Dis)connection
Liquid Storage
Timber Industry
(1) Stevedoring in multi-operator ports, different from Ports Terminals
Logistics services
• Provides different services across the chain, mainly as a “door-to-port” operator
• US$257million revenues 2014*
(1) Stevedoring in multi-operator ports, different from Ports Terminals
16
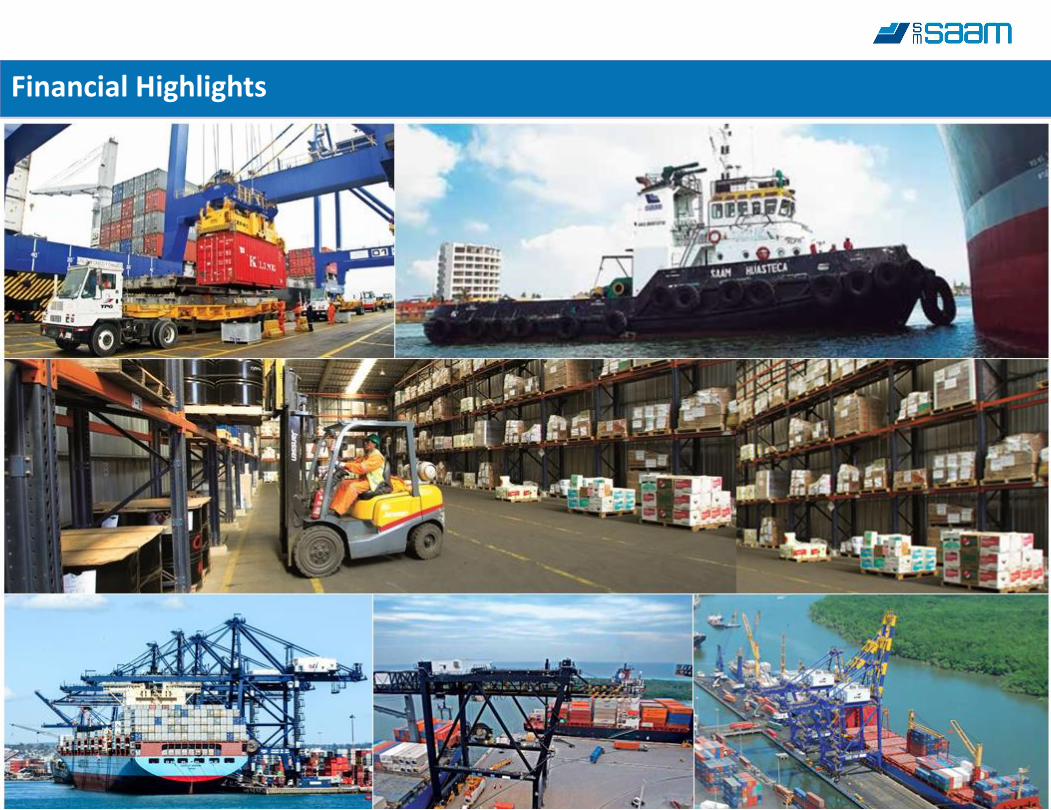
Financial Highlights
17 17
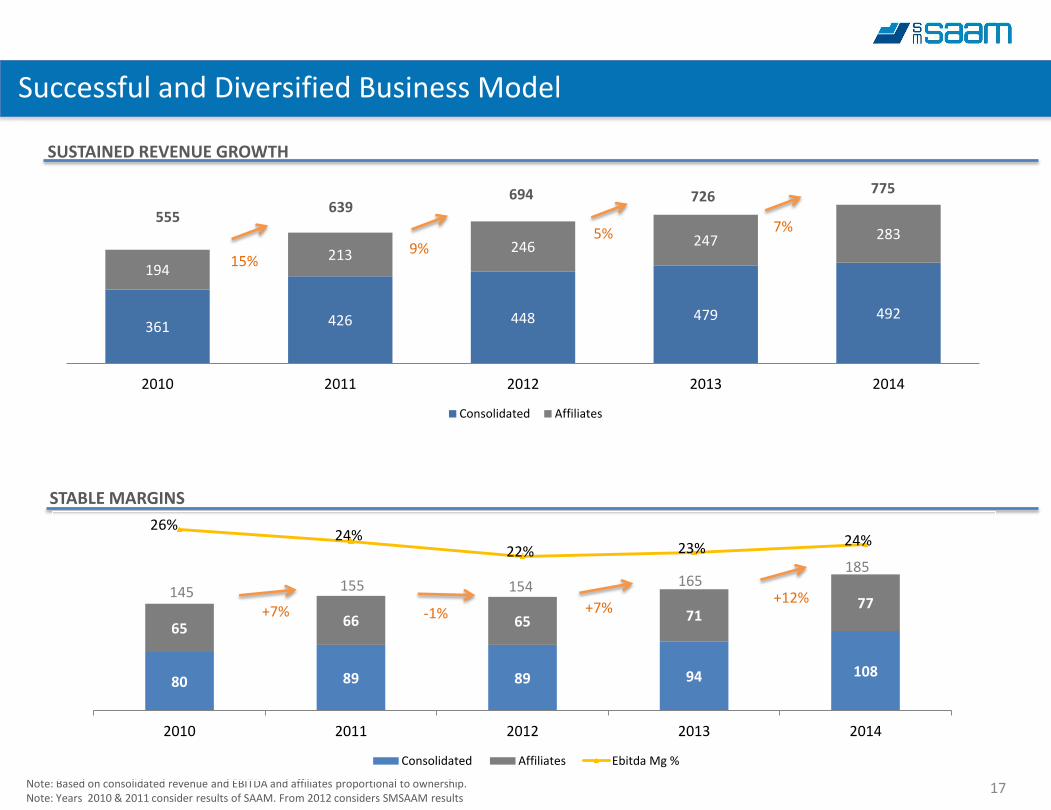
Successful and Diversified Business Model :
SUSTAINED REVENUE GROWTH
STABLE MARGINS
Note: Based on consolidated revenue and EBITDA and affiliates proportional to ownership. Note: Years 2010 & 2011 consider results of SAAM. From 2012 considers SMSAAM results
361 426 448 479 492
194 213 246 247 283
2010 2011 2012 2013 2014
Consolidated Affiliates
555 639
694 726 775
15%
7% 5% 9%
80 89 89 94 108
65 66 65 71 77
26% 24%
22% 23% 24%
0%
5%
10%
15%
20%
25%
0
50
100
150
200
250
2010 2011 2012 2013 2014
Consolidated Affiliates Ebitda Mg %
185 165 154 155 145 +12%
+7% -1% +7%
18 18
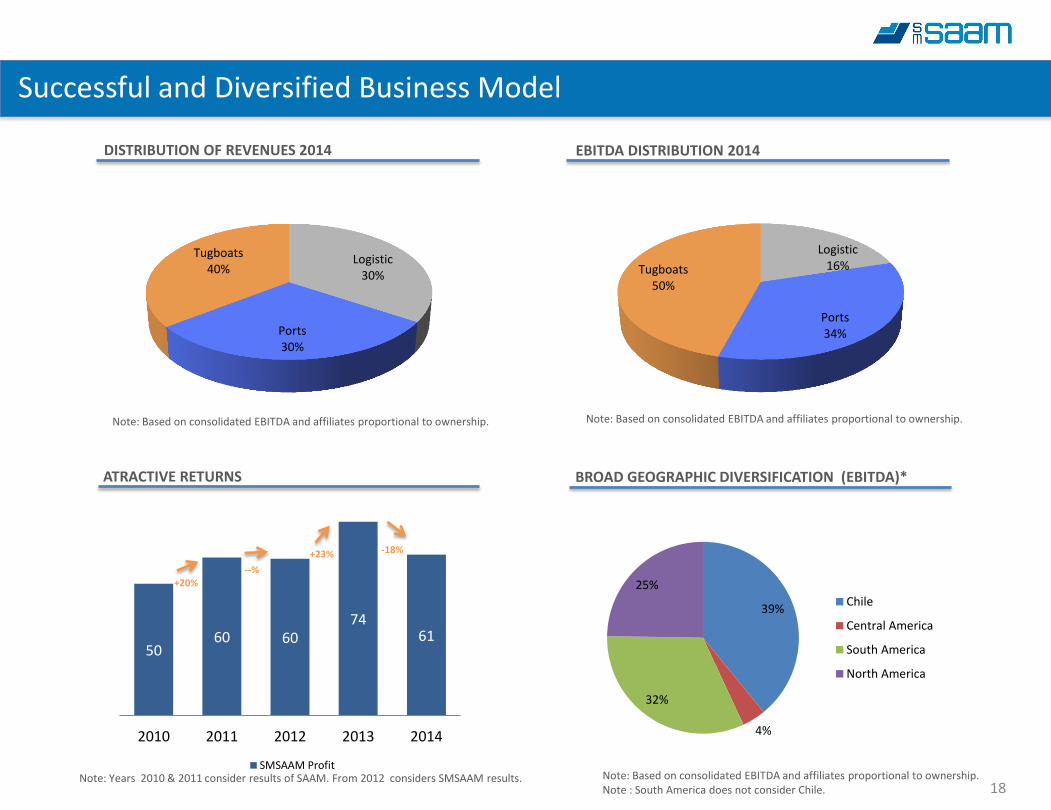
Successful and Diversified Business Model
DISTRIBUTION OF REVENUES 2014
ATRACTIVE RETURNS
EBITDA DISTRIBUTION 2014
BROAD GEOGRAPHIC DIVERSIFICATION (EBITDA)*
Logistic 30%
Ports 30%
Tugboats 40%
Logistic 16%
Ports 34%
Tugboats 50%
50 60 60
74 61
2010 2011 2012 2013 2014
SMSAAM Profit
-18% +23%
--% +20%
39%
4%
32%
25%
Chile
Central America
South America
North America
Note: Years 2010 & 2011 consider results of SAAM. From 2012 considers SMSAAM results. Note: Based on consolidated EBITDA and affiliates proportional to ownership. Note : South America does not consider Chile.
Note: Based on consolidated EBITDA and affiliates proportional to ownership. Note: Based on consolidated EBITDA and affiliates proportional to ownership.
19 19
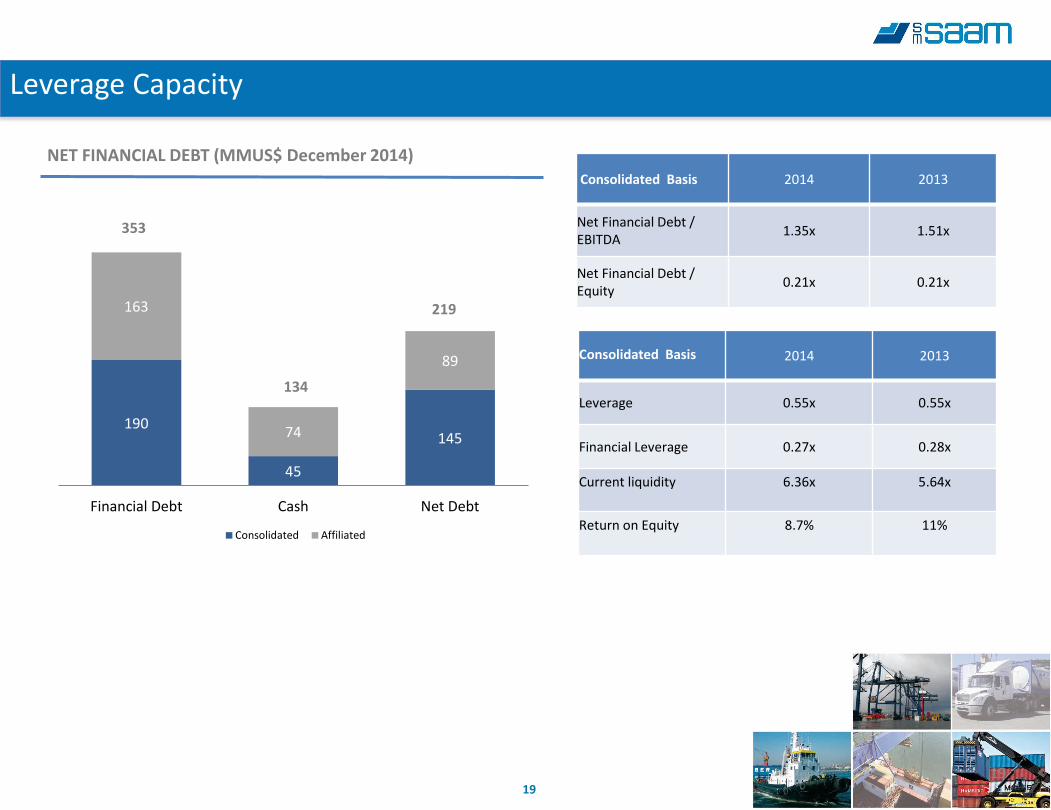
NET FINANCIAL DEBT (MMUS$ December 2014)
Leverage Capacity
Consolidated Basis 2014 2013
Net Financial Debt / EBITDA
1.35x 1.51x
Net Financial Debt / Equity
0.21x 0.21x
Consolidated Basis
2014 2013
Leverage 0.55x 0.55x
Financial Leverage 0.27x 0.28x
Current liquidity
6.36x
5.64x
Return on Equity
8.7%
11%
190
45
145
163
74
89
Financial Debt Cash Net Debt
Consolidated Affiliated
353
219
134
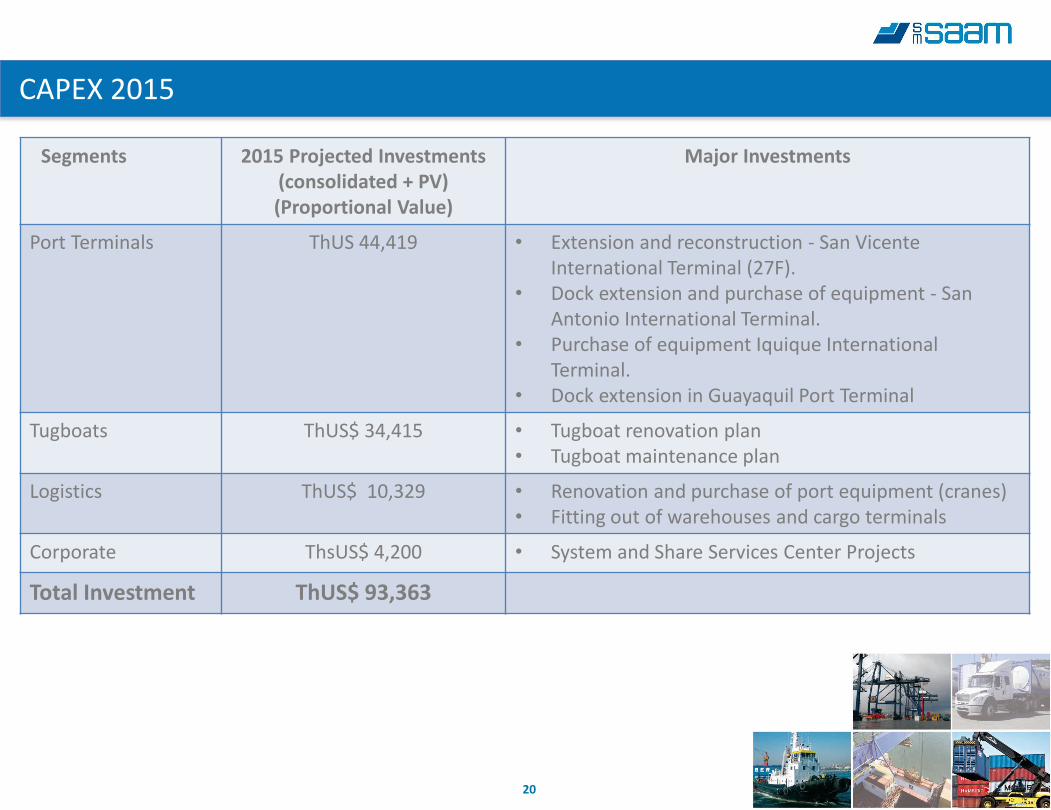
20
Segments 2015 Projected Investments (consolidated + PV) (Proportional Value)
Major Investments
Port Terminals ThUS 44,419 • Extension and reconstruction - San Vicente International Terminal (27F).
• Dock extension and purchase of equipment - San Antonio International Terminal.
• Purchase of equipment Iquique International Terminal.
• Dock extension in Guayaquil Port Terminal
Tugboats ThUS$ 34,415 • Tugboat renovation plan • Tugboat maintenance plan
Logistics ThUS$ 10,329 • Renovation and purchase of port equipment (cranes) • Fitting out of warehouses and cargo terminals
Corporate ThsUS$ 4,200 • System and Share Services Center Projects
Total Investment ThUS$ 93,363
CAPEX 2015
21
Paula Raventos
Head of Investor Relations
Sociedad Matriz SAAM S.A.
Hendaya 60, 8th Floor, Santiago, Chile
(56-2) 2731-8240
www.smsaam.com
Contact

22
SMSAAM
Corporate Presentation
22