Embed Size (px)
Citation preview

SNF REPORT NO 07/00
Entry Barriers and Concentration
in Chemicals Shipping
by
Trygve Stene
SNF project no 1650“Strategisk atferd i noen utvalgte shippingsegmenter”
(Strategic behaviour in some selected shipping segments)
The project is financed by the Norwegian Shipowners Association
SIØS - Centre for International Economics and Shipping
FOUNDATION FOR RESEARCH IN ECONOMICS AND BUSINESS ADMINISTRATION
BERGEN, FEBUARY 2000
© Dette eksemplar er fremstilt etter avtalemed KOPINOR, Stenergate 1, 0050 Oslo.Ytterligere eksemplarfremstilling uten avtaleog i strid med åndsverkloven er straffbartog kan medføre erstatningsansvar.

ii
ISBN 82-491-0034-4ISSN 0803-4036
SIØS - CENTRE FOR INTERNATIONAL ECONOMICS AND SHIPPINGSIØS – Centre for international economics and shipping – is a joint centre for TheNorwegian School of Economics and Business Administration (NHH) and Foundationfor Research in Economics and Business Administration (SNF). The centre isresponsible for research and teaching within the fields of international trade and shipping.
International TradeThe centre works with all types of issues related to international trade and shipping, andhas particular expertise in the areas of international real economics (trade, factormobility, economic integration and industrial policy), international macro economics andinternational tax policy. Research at the centre has in general been dominated by projectsaiming to provide increased insight into global, structural issues and the effect of regionaleconomic integration. However, the researchers at the centre also participate actively inprojects relating to public economics, industrial policy and competition policy.
International TransportInternational transport is another central area of research at the centre. Within this field,studies of the competition between different modes of transport in Europe and thepossibilities of increasing sea transport with a view to easing the pressure on the landbased transport network on the Continent have been central.
Maritime ResearchOne of the main tasks of the centre is to act as a link between the maritime industry andthe research environment at SNF and NHH. A series of projects that are financed by theNorwegian Shipowners Association and aimed directly at shipowning firms and othermaritime companies have been conducted at the centre. These projects include studies ofNorwegian shipowners' multinational activities, shipbuilding in Northern Europe and thecompetition in the ferry markets.
Human ResourcesThe centre’s human resources include researchers at SNF and affiliated professors atNHH as well as leading international economists who are affiliated to the centre throughlong-term relations. During the last few years the centre has produced five PhDs withininternational economics and shipping.
NetworksThe centre is involved in several major EU projects and collaborates with central researchand educational institutions all over Europe. There is particularly close contact withLondon School of Economics, University of Glasgow, The Graduate Institute ofInternational Studies in Geneva and The Research Institute of Industrial Economics (IUI)in Stockholm. The staff members participate in international research networks,including Centre for Economic Policy Research (CEPR), London and InternationalAssociation of Maritime Economists (IAME).

1
PREFACE
I would like to take the opportunity to thank some of the people who have
been most helpful throughout the process of writing this thesis. First of all,
Hans Krogh Hvide, who trusted me in on the SNF 1650 shipping project, and
who has given a lot of spirit and excellent suggestions along the way. Second,
my advisor Professor Lars Sørgard, whose “open door” policy and invaluable
comments made me finish on time. I am also indebted to the following people
who kindly shared knowledge with me from chemicals shipping, Tor
Wergeland (NHH), Jacqueline Richardson (Richardson Lawrie Associates,
London) and Hans Petter Amundsen (Odfjell, Bergen). Last, but not the least
all fellow students at NHH for a memorable time in Bergen.
NHH Bergen, July 1999.
Trygve Stene

2
TABLE OF CONTENTS
INTRODUCTION ............................................................................................... 51.1 Theoretical Framework............................................................................. 61.2 Thesis Overview ........................................................................................ 8
CHEMICALS SHIPPING................................................................................. 112.1 Historical Development........................................................................... 112.2 The Market .............................................................................................. 142.3 Deep-sea Trading .................................................................................... 162.4 The Sophisticated Chemical Carriers..................................................... 182.5 “The Four (chemical) Majors” ................................................................. 20
2.5.1 Stolt-Nielsen S.A............................................................................... 212.5.2 Odfjell ASA........................................................................................ 222.5.3 JO Tankers........................................................................................ 252.5.4 Seachem Tankers.............................................................................. 26
2.6 Market Competition ................................................................................ 262.7 Entry Barriers in Deep-sea Chemicals Shipping................................... 282.8 New Entries? ........................................................................................... 31
ENTRY BARRIERS .......................................................................................... 353.1 Definition of Entry Barriers ................................................................... 353.2 The Game of Entry .................................................................................. 373.3 A taxonomy of Entry Deterrence Strategies .......................................... 403.4 Determinants of Barriers to Entry ......................................................... 453.5 Capital Commitment to Deter Entry...................................................... 493.6 Durability of Capital as a Barrier to Entry............................................ 57
TACIT COLLUSION ........................................................................................ 634.1 Tacit Collusion......................................................................................... 634.2 One Shot Game: Cournot-Nash Equilibrium......................................... 654.3 Tacit Collusion in an Infinitely Repeated Game.................................... 684.4 Multimarket Contact............................................................................... 71
CONCLUDING REMARKS ............................................................................. 79REFERENCES.................................................................................................. 89APPENDIX 1..................................................................................................... 95APPENDIX 2..................................................................................................... 97

3
NON-TECHNICAL SUMMARY
Deep-sea chemicals shipping has for the last decade been dominated by fourmajor players, Stolt-Nielsen, Odfjell, JOTankers and Seachem. During thesame period, the risk-adjusted return of these operators has seemingly beenhigher than for other operators in comparable shipping markets. This reportseeks to gain insight into the underlying mechanisms that have sustained thehigh-return oligopoly in the chemicals shipping market.
The first question the report seeks answered, is whether theoligopolists have exercised market power to deter entry from new competitorsand, if yes, in what way. Secondly the report investigates the potential role ofprice collusion in the market. The purpose of the report is to shed light onboth the question of entry deterrence and the question of collusion throughtheory of industrial organisation. The research strategy is to derivetheoretical predictions of optimal behaviour in the chemicals market andthen confront these predictions with factual behaviour from chemicalsshipping.
The report has two main findings. First, it is proposed that the leadingincumbents follow a top dog strategy towards potential competition. Thismeans that the established operators in chemicals shipping act tough torestrain small players and prevent potential new entrants. Toughness todeter competition can for instance be seen in the high level of investment innew chemical tankers in recent years, and in the high investments in "stateof the art" maintenance of current vessels. Second, on the question of pricecollusion, it is proposed that the multimarket contact that is prevalent inchemicals shipping can sustain a situation with price collusion. However, thisissue needs to be further explored in more data-intensive studies.
The deep-sea segment in chemicals shipping is dominated by fourcompanies. Stolt-Nielsen is the largest operator with a market share above25%. The second largest operator is Odfjell, who has a market share ofapproximately 20%. The other two major operators are JO Tankers (appr.8%) and Seachem (appr. 9%). The four leading incumbents have had a steadytotal market share, approximately 60%-65%, since the beginning of the1990s. In addition to being the largest players in the market, Stolt-Nielsenand Odfjell are also strong in related distribution services. Such distributionservices include regional feeder service, tank container management and theoperation of tank terminals.
Stolt-Nielsen and Odfjell operate liner services between all continents,while other operators offer services on fewer routes and continents. The wayoperators compete on several distinct routes leads to what we label amultimarket situation, where the same players meet each other in tightlyrelated, but distinct, geographical markets. Chemicals shipping is also

4
distinguished by high entry barriers, such as the high cost of new tonnage.For instance, a new 38,000 Dwt chemical tanker costs approximately thesame as a new 300,000 Dwt oil tanker. In addition, limited newbuildingcapacity of yards, operational skills and close client relations are additionalfactors making entry difficult in chemicals shipping.
Considering the question of pre-empting entry, an established firmknows that his pre-entry decision can influence the prospective entrant's viewof what will happen if he enters. The incumbent will naturally want to exploitthis to his own advantage, and a taxonomy of four optimal business strategiesregarding entry deterrence and accommodation is derived. The differentinvestment strategies give the optimal action for the incumbent, taking intoaccount the presumed behaviour of the potential entrant. The reportelaborates that when there is competition on capacity, entry can be deterredby overinvestment in capital.
On the second question, it is well known that price collusion can occurif firms in one market compete against each other over an indefinite period oftime. More recently, however, new models have been developed wheremultimarket contact can enhance the incentive for price collusion. The reportgives an introduction to tacit price collusion and shows how such collusioncan affect market competition between established players. Especially it isshown how multimarket contact increases the incentives for tacit collusionwhen there are several firms operating in two distinct markets. It is shownthat multimarket competition can lead to sustained higher profits for theincumbents through tacit collusion.
The conclusion of the report is that the incumbents seem to follow a"top dog" strategy by overinvestment in capital. This strategy is an activeforce to deter potential competition. In addition, multimarket contact hasenhanced the incentives for tacit collusion, thereby increasing the rate ofreturn of the leading incumbents.
It is hard to derive any clear-cut conclusions from chemicals shipping,since data from this market are scarce. One specific notion about chemicalsshipping is that approximately 50% of all cargo is covered by contracts ofaffreightment. This high coverage makes the chemical freight market quitesecretive and details of actual contract rates are rarely divulged. Oneproposal to further research is to focus on multimarket contact andinvestigate how such contact can affect competition in chemicals shipping.

5
CHAPTER ONE
INTRODUCTION
Chemicals shipping is characterised by entry barriers, multimarket contact
and relative strong concentration. This freight market is highly specialised
and the major operators compete in several markets as trading takes place on
distinct geographical routes. Together the four leading operators have had a
steady market share since the beginning of the 1990s, which has remained
approximately 60%-65% up until today. Correspondingly the market share
for each of these companies has been remarkably steady during the same
period. The total market has grown notably the last decade without any new
players being able to obtain a position among the leading incumbents. The
newcomers that have survived have all remained small operators, implying
that the four majors have managed to sustain their market share while
meeting growing demand. There are also some indications that this market is

6
characterised by high profits1, which ought to send an attractive signal to
potential entrants.
This thesis seeks to gain insight into the underlying mechanisms that
are active in chemicals shipping. Can the observed concentration and high
profits result from the leading incumbents exercising market power? This
question will be analysed through established theory of industrial
organisation, as I derive theoretical predictions of optimal behaviour and
confront these predictions with factual behaviour from chemicals shipping. I
will try to establish that the leading incumbents have sustained their
position by exercising market power in two ways. The first is to deter entry
from potential newcomers, leading to the observed concentration. The second
is to increase their profits through tacit collusion, helped by multimarket
contact. This makes an interesting case, as we will be able to combine
traditional analyses of industrial behaviour (entry barriers) with more recent
theories (multimarket contact), and use them to analyse one single industry.
Below I will briefly present the theoretical framework and outline the further
progress of this thesis.
1.1 THEORETICAL FRAMEWORK
Traditional analyses of industrial behaviour typically link the exercise of
market power in an industry to features such as demand conditions,
concentration, and barriers to entry. But more recently, some economists
have developed models to show that other factors, like multimarket contact
between firms, also can play a significant role in determining the level of
1 Birkeland et al (1999) show that the average returns of the major operators have beenhigher than companies in other comparable shipping markets. However, caution should betaken, as the data material in this research is limited.

7
competitiveness in a particular industry. As mentioned, both angles will be
presented in this thesis.
A barrier to entry can create a situation where one or several
incumbent firms successfully deter entry from potential entrants. Using
Salop’s (1979) words they can be classified as either innocent entry barriers
or strategic entry barriers. An innocent entry barrier is unintentionally
erected as a side effect of profit maximisation. A strategic barrier is in
contrast intentionally erected to reduce the possibility of entry.
Two formal models will be presented in this thesis to show how an
incumbent can deter entry from a newcomer. The models are Dixit (1980) and
Eaton and Lipsey (1980). In addition the taxonomy of entry-deterring and
accommodating strategies of Fudenberg and Tirole (1984) will be reviewed.
Dixit (1980) pointed out the game theoretical aspects that distinguish
an incumbent when he faces a potential entrant. Even when we have the
simplest situation where there exist only one established firm and one
potential entrant, there are some subtle strategic interactions. Dixit (1980)
sums up the situation clearly when he writes that “[t]he established firm’s
pre-entry decisions can influence the prospective entrant’s view of what will
happen if he enters, and the established firm will try to exploit this possibility
to his own advantage”. In sharp contrast to a perfect competitive market, the
firms in the setting described by Dixit (1980) do not take market competition
as given. The incumbent can take strategic actions to alter the entrant’s
behaviour and beliefs. It will be shown that an incumbent successfully can
deter entry from a newcomer by overinvesting in capital, as the commitment
in capital is made before the potential entrant makes his decision to enter or
stay out. The incumbent thus has an opportunity to act strategically and
prevent entry.
Eaton and Lipsey (1980) developed the second model that will be
presented. This model shows how an incumbent can deter entry by

8
overinvesting in maintenance. This results in the incumbent having “too
much” maintenance for strategic purposes compared to a cost minimising
solution.
The exercise of market power is also linked to the possibility that
established firms can try to co-ordinate their activities. Many industries are
dominated by a small number of firms, which can have an affect on market
competition. Tacit collusion, where firms are able to “soften” competition
without explicit co-operation, can increase their profits. I will first elaborate
the problems of tacit collusion by looking at the Nash equilibrium in a one
shot game. I will then change the setting and look at tacit collusion in an
infinitely repeated game. This changes the result, and proof will be given for
an equilibrium where tacit collusion can be sustained. Bernheim and
Whinston’s (1990) model will extend this analysis, as I elaborate their model
of multimarket contact. This model shows that the sustainability of tacit
collusion could be enhanced, if firms meet in several distinct geographical
markets. Multimarket contact can make it profitable to sustain tacit collusion
in several markets, even if one of the markets is characterised by tough
competition.
1.2 THESIS OVERVIEW
We head out in the next chapter with a more detailed description of the
market for sea-borne trade of chemicals and associated products. I shall
concentrate on deep-sea trading with sophisticated chemical carriers
operated by the four majors. This shipping segment is fairly new, so a brief
cover of the historical development will be given. Further, a closer
presentation of the four major shipping operators will add background to the
historical review. The end of chapter two will be devoted to a description of

9
market competition in chemicals shipping and an elaboration of the entry
barriers in this industry.
Chapter three will be the first of two chapters providing a theoretical
background. This chapter focuses on entry barriers and on how an incumbent
can deter a potential entrant. The first sections will describe the concept of
entry barriers more closely and present the game between the incumbent and
the entrant more formally. Furthermore the taxonomy of entry and
accommodation strategies by Fudenberg and Tirole (1984) is derived, before
reviewing shortly different theoretical determinants of barriers to entry.
Finally two formal models will be presented to show how an incumbent can
deter entry. The models are Dixit (1980) and Eaton and Lipsey (1980).
In chapter four I examine how a group of firms can increase their
profits without any direct communication. This is achieved through tacit
collusion as I assume that a formal agreement is not possible. Sustainability
of tacit collusion is analysed through game theory, more precisely infinitely
repeated games or supergames. The last section of chapter four extends this
by exploring how multimarket contact can help sustain a tacit cartel.
Chapter five will be devoted to concluding comments and short
discussion. This chapter will view the chemicals shipping market in light of
the theoretical models provided. I will try to answer the questions set out in
this thesis and see if the models put forward can explain the situation in
chemicals shipping. It is hard to derive any clear-cut conclusions from
chemicals shipping since data from this market are scarce. Nevertheless the
different perspectives from the previous chapters will be brought together to
get a broader picture of chemicals shipping, including a proposal to further
research of this market.

10

11
CHAPTER TWO
CHEMICALS SHIPPING
A chemical tanker is a technically advanced ship able to carry a range of
petrochemicals and non-petroleum liquid cargoes2. This chapter will give a
short survey of chemicals shipping where the market for seaborne trade of
chemicals will be introduced and an overview of the most important aspects
of this specialised freight market given. Although the whole market will be
presented, the main focus is on deep-sea3 trading with sophisticated parcel
carriers above 10,000 dwt. These vessels are able to carry the most hazardous
trades and a few companies dominate this market. The main players within
this segment are often referred to as ”the major (chemical) four”.
2.1 HISTORICAL DEVELOPMENT
The world’s chemical industry is fairly new, but has developed rapidly the
last fifty years. This has led to an increase in the demand for seaborne
2 I use the same definition as Østensjø (1992).3 The deep-sea market includes seaborne trade of chemicals on intercontinental routes.

12
transportation of chemicals. Until the mid 1950s liquid chemicals were not
carried in bulk at sea, but were shipped in drums. In this early phase there
existed no strict international requirements to the safe handling of chemical
cargo and the knowledge of problems and consequences of such freight was
scarce. The first ships to carry chemicals in bulk were initially designed for
handling other cargoes, and were usually rebuilt product tankers. Due to low
cost of converting these vessels, many shipowners were willing to invest in
this conversion work. More knowledge of the hazards linked to transportation
of chemicals led to strict international regulation on the treatment of these
products. The new regulations gave way to an era where specialised tankers
purely designed for handling chemicals were developed. In the 1960s the first
tankers designed for operation as parcel tankers came into service. These
ships had a greater number of tanks, and compared to the rebuilt vessels
they were treated with more sophisticated coatings4. This enabled the tankers
to carry a wider range of cargoes at the same time, thus becoming more
competitive towards the traditional liner (Østensjø, 1992).
The demand for chemicals and thus the need for seaborne
transportation have increased steadily since the late 1950s. We can sum up
the historical development of chemicals shipping in four phases. The first
phase was the initial growth period from 1959 to 1973. This period was
characterised by strong growth in the chemical industry and a corresponding
growth in the trade of chemicals. There was also an increase in the number of
chemical products, which meant an increasing demand for more sophisticated
ships to handle the new and more hazardous chemicals. The shipbuilding
prices were still low, encouraging more investment in chemical tankers.
The next phase ran from 1973 to 1982. Within this period the chemical
carrier market became more segmented. There was a further expansion of the
fleet, especially by the major operators. In addition, the fleet was updated to
4 Paint protecting the inside of a vessel’s tanks. Usually epoxy or zinc based paints.

13
meet the increasing international regulation of seaborne trade of chemicals,
meaning bigger ships and more stainless steel capacity. When the freight
rates peaked in 1980, this optimistic outlook gave way for even more
newbuilding. More ships above 30,000 dwt, with higher emphasise on
stainless steel capacity, were built and entered the freight market for
chemicals. By investing in stainless steel capacity an operator became able to
handle the most sophisticated chemicals traded. The decision to use stainless
steel tanks entails using stainless steel in all other parts of the cargo system
which are in contact with the cargo5. This increases the cost of a vessel, but
owners quickly appreciated the advantages of stainless steel construction.
They considered that the extra cost of construction could be recouped by
offering charterers the benefits of stainless steel tanks for products other
than acids and thereby obtain a premium in the freight rate (Drewry, 1999).
The years from 1982 to 1990 describe the third phase, where a
concentration in the chemical carrier market occurred. In the beginning of
this period there was a continued growth in the size of the fleet, which
outstripped the growth in trade, pushing the market into recession. Revival
of the market led to a slow recovery of the freight rates, followed by the main
players strengthening their positions by taking over several of the smaller
operators.
The last phase runs from 1991 until the present time and is
characterised by the growth of independent shipping operators. The main
operators have maintained their strong positions but the spread of ownership
has changed. In the early 1990s the four major operators and Tokyo Marine
controlled 70% of the market. This has changed according to Richardson
Lawrie Associates, as the number of organisations operating in excess of 5%
had increased to six. They estimate that these organisations control nearly

14
65%6 of the total fleet, with a further 22% controlled by a wide range of other
shipping companies. Since mid-1995, the chemical carrier market has
suffered from strong growth in the overall fleet and a subsequent weakening
demand base, hastened by the Asian crisis in mid-1997. The chemical carrier
orderbook is in excess of some 20% of the present fleet in terms of tonnage,
rising to more than 30% in some of the fleet segments (Drewry, 1999). This
and other structural observations, such as some of the smaller operators
growing bigger, will most likely affect the next phase of chemical shipping
emerging in the forthcoming decade.
2.2 THE MARKET
The freight market for chemicals is highly differentiated, as several hundred
different chemicals are traded by sea. Today the total volume of organic and
inorganic chemicals traded is estimated at approximately 60 million metric
tonnes per year. In addition the transportation of vegetable oils, alcohol’s,
molasses and lubricating oils amounts to 40 - 45 million tonnes per year
(Odfjell Annual report, 1998). The product range has developed a lot since the
early days bringing new and more hazardous chemicals into seaborne trade.
This has led to an increase in the technical level a vessel has to meet, which
will be further revealed in section 2.4.
Chemicals are traded all around the world, and freight by sea is an
important way to get the chemicals from supplier to buyer. The chemicals
moved by the chemical fleet are according to Richardson Lawrie Associates
usually divided into five main groups. These are organic chemicals, which is
5 Cargo pumps, valves, pipelines, tank vent lines, heating coils, tank washing machines andtank access ladders are all required to be made from stainless steel of the same quality as thecargo tanks.6 Different sources seem to disagree of this estimate, see section 2.5.

15
the most important and accounts for around 63% of all trade by sea. Organic
chemicals can be divided in two subgroups, commodity chemicals (45.5%) and
speciality chemicals (17.5%). The groups differ in parcel size and the
proportion in which they are traded on specific routes. The other groups are
inorganic acids (12%), vegetable oils/animal fats (19%) and caustic soda
solution (6%). The products mentioned above all have in common that they
are carried on front haul routes although some of the trade flows may be
backhaul as well. Chemical carriers also carry CPP and molasses, but these
are backhaul products and vary enormously year on year. It depends on the
precise patterns of trade whether operators decide to carry these backhaul
products or move other product ranges that are both front haul and backhaul.
Operators can also have trade patterns where they schedule vessels without
moving these products to any large extent.
The market for seaborne trade of chemicals has grown from 49 million
tonnes in 1982 to an estimated 100 million tonnes today. Thus in less than 15
years the market has doubled with an average annual growth rate of 4.9%
(Drewry 1999). This is quite different from the trading pattern of crude oil,
which declined dramatically in the early 1980s as a result of radical energy
saving measures initiated by the world’s leading economies after the OPEC
price hikes of the oil crisis of 1979/80 (Ibid.). Although there were enormous
chemical tanker surpluses in the early to mid 1980s, the growth in chemical
trade has led to a considerable increase in the chemical carrier fleet.
Statistics from Drewry (1991,1999) show that the total chemical fleet7 had
increased by more that 30% to nearly 21,000,000 dwt from 1991 to the end of
1998. Seaborne trade in chemicals is more closely related to changes in world
GDP, as demand for chemicals is associated to levels of industry production
rather than energy consumption. It thus seems that as world GDP expands,
so will the markets for chemicals shipping. Drewry (1999) notes that chemical

16
trade on average for the last 25 years has grown 1.5 times the growth in
world GDP.
2.3 DEEP-SEA TRADING
There are several different types of vessels habitually trading the deep-sea
parcel service. The carriers are classified by the different degrees of
complexity, in particular their cargo containment characteristics. This thesis
will divide the different chemical carriers in the following way; parcel
carriers, product/chemical carriers and specialised carriers8. The major
operators such as Stolt-Nielsen and Odfjell have vessels in all of these
categories except for the specialised carriers, which are owned/operated by
acid producers/receivers.
This thesis examines strategic aspects of deep-sea trading in the most
sophisticated segment of chemicals shipping, and will thus focus on parcel
carriers above 10,000 dwt. The major operators have a strong position in this
segment and have invested increasingly in these vessels. (Odfjell Annual
report, 1998). Before presenting this segment, a brief description will be
made of the other groups in chemicals shipping.
Product/Chemical tankers are built in accordance with the regulations
of Marpol9 Annex I10 to carry crude oil and/or clean and dirty refined products
(Drewry, 1996). The ships are permitted to carry chemicals classified as “oil-
7 This number includes all vessels above 1,000 dwt, and thus also vessels involved in regionaltrade.8 According to Richardson Lawrie Associates the tankers are analysed in four sections; parcelcarriers, chemical carriers, product/chemical carriers and dedicated acid carriers. I will usethe classification from Drewry (1999), which seems to analyse parcel carriers and chemicalcarriers as one group.9 The International Conventions governing Marine Pollution Prevention.10 This was the first international pollution convention, which contained standards for thecontrol of both intentional and accidental pollution from ships transporting hazardousmaterials.

17
like substances”. If the ships are equipped to meet Annex II regulations, they
can carry more “easy” chemicals and vegetable/animal oils. Ownership in this
category is very distributed, with the largest fleet made up of twelve vessels
(Drewry, 1999). According to Drewry (1996) this indicates a shipping segment
with a fleet of marginal status, as owners in this market tend to operate as a
spill over from either the chemical or the product markets. The most
important differences between parcel carriers and product tankers are that
the latter do not have any stainless steel capacity nor are they able to carry
as many types of cargo.
The dedicated specialised chemical carriers are composed of an array of
essentially distinct tankers serving a wide range of different chemical trades.
Their common factor is that they normally are dedicated to trading a
particular commodity, like methanol, phosphoric acid, sulphuric acid or palm
oil. The owner structure within this group is more varied than in the other
groups. The average specialised fleet comprises just 1.7 vessels compared
with 2.1 and 2.3 for the parcel and product/chemical sectors respectively. This
reflects the diverse and unconnected ship types labelled as specialised vessels
and also accounts for the high concentration of single ship owners, which is
nearly 60% (Drewry, 1999).
We can then move on to the parcel carrier segment, sometimes referred
to as the sophisticated chemical carriers. These carriers are constructed in
accordance to the strongest international regulations, and classified after
IMO11 standard. The parcel chemical carriers can be subdivided into IMO
Type 3 ships with coated cargo tanks or Type 1 or 2 ships with some or all
tanks lined with stainless steel. The parcel carriers will be elaborated further
in the next section.
11 This is the International Maritime Organisation, the international UN advisory body ontransport by sea. The IMCO Assembly formally adopted the IMO code on 12th October 1971.

18
2.4 THE SOPHISTICATED CHEMICAL CARRIERS
Sophisticated chemical carriers are, as noted in the last section, carriers with
some or full stainless steel capacity as this offers the most flexible operational
environment. These parcel tankers are designed to carry a number of
chemicals in small lots usually on established routes on a worldwide liner
type service. The ships are characterised by a large number of tanks, up to
58, and a separate pump and load/discharge line for almost every tank. The
modern parcel tankers are tailored to transport 40–50 different products at
the same time and can thereby offer a high degree of flexibility. Stainless
steel capacity makes it possible to carry cargoes that need special handling
thus offering higher freight rates. Another advantage is that a higher
proportion of stainless steel capacity enables the operator to easily
interchange vessels from different trades and services.
Looking at the most sophisticated vessels, the major operators have
dominated the picture for a long time. According to Drewry (1996), 94% of all
stainless steel capacity can be found in the parcel carrier fleet. Accordingly
the distribution by size, corresponds with this. Almost 60% of the stainless
steel capacity is distributed among carriers between 20,000 dwt to 40,000
dwt. The three biggest operators controlled in 1991 almost 85% of this
stainless steel capacity (Drewry, 1991), but this seems to change as some
minor operators lately have taken delivery in stainless steel capacity as well.
According to Lazard (1998) most ships in the sophisticated segment
meet the strictest IMO regulations. The IMO code applies to bulk chemicals
with serious hazards. The purpose of the Code is to minimise the risks of
handling chemicals to the ship, its crew and the environment. The Code
provides containment for three quite different classes of hazardous chemicals.
Type 3 is the least hazardous, while Type 1 is the most hazardous. The Ship

19
Type classification is based on the ship’s ability to survive degree of damage
and to prevent or limit cargo release (Grey, 1984). The Type 1 carriers are
designed to carry products that require maximum preventative measures to
preclude the escape of such cargo. This implies that the ship should be
capable of sustaining collision or stranding damage anywhere along the ship’s
length. The specifications for Type 2 or 3 vessels are less strict, but all of
them are required to sustain collision or stranding to some degree. The IMO
Code also specifies where the siting of the cargo tanks should be in relations
to the ship’s side and bottom. IMO also took under consideration the extent to
which the ship should be capable of remaining afloat after being damaged
and to the extent to which the escape of hazardous cargo should be
tolerated.12
These environmental restrictions add to the cost of building or re-
building chemical tankers. Giving a vessel stainless steel capacity is also
expensive. This makes newbuildings costly compared to other vessels, for
instance crude carriers. We can make a comparison by looking at Frontline13,
a shipping company operating in the crude carrier market. They have
recently engaged in a major newbuilding program, ordering several VLCC14
ships from Hyundai in Korea. The size of these carriers is around 300,000
dwt, and the price for one of them was approximately $ 70 million (Frontline
Annual Report, 1997). This is the same price the major chemical operators
have paid for their new sophisticated chemical carriers. For instance, the new
37,000 dwt chemical parcel tankers Stolt-Nielsen ordered from Danyard in
1993, had a net cost of $ 70 million each (Lazard, 1998).
12 To solve this IMO defined the assumed damages and stated the conditions of survival andcargo containment (Grey, 1984).13 Frontline is a Bermuda based shipping company with one of the world’s most modern crudecarrier fleet.14 Very Large Crude Carrier.

20
2.5 “THE FOUR (CHEMICAL) MAJORS”
Four major independent operators dominate the worldwide deep-sea chemical
trade. This section will present these companies more thoroughly. Despite its
image of concentrated ownership, 593 different owners in fact control the
total chemical fleet of just over 1,50015 vessels. This includes 320 single ship
companies (Drewry, 1999). The concentration occurs however through time
charter or pooling agreements, where the major operators control many of the
vessels owned by smaller companies.
Estimations of how much the five largest operators control of the fleet
above 10,000 dwt are somewhat disputed. Richardson Lawrie Associates
estimate the number to be nearly 60%. Statistics from Odfjell (Annual report,
1998) increase this number to 65%, which coincides with Drewry’s estimate
(Drewry, 1999). Drewry (ibid.) states the sophisticated fleet above 10,000 dwt
to include 229 vessels. They identify only four owners with more than ten
vessels, led by Stolt-Nielsen, Odfjell and Jo Tankers. Drewry (ibid.) further
estimates that the four major operators control nearly 63% of the
sophisticated parcel tankers and almost 70% if one includes Tokyo Marine,
the fifth biggest operator. It also seems that the major operators have
managed to maintain their market share despite a large growth in the total
fleet as noted in section 2.2. If we use the same statistics (Drewry, 1991,
1999) on the parcel tanker fleet, we find that this fleet has grown by almost
60% from 1991 till 1998. Comparable market shares of the parcel tanker fleet
for vessels above 10,000 dwt are given in appendix 1. Inspection of these
diagrams tells us that the market shares of the major operators have
remained quite steady from 1995 till 199816.
15 This number includes all vessels above 1,000 dwt.
16 Unfortunately it was not possible to obtain comparable numbers from 1991 but indicationsfrom Drewry (1996) suggest that these shares also remained steady from 1990 till 1995.

21
2.5.1 Stolt-Nielsen S.A.
The Stolt-Nielsen family has been active in international shipping since the
turn of the century. Jacob Stolt-Nielsen started in the chemical market from
scratch in the 1950s. He was one of the pioneers, and in 1959 his first parcel
tanker came into operation. Stolt-Nielsen soon became a global player in the
chemical market, establishing a New York office in 1961. Offices in Tokyo
and Oslo followed the next year. As mentioned earlier the period from 1973–
1982 was characterised by high growth in the chemical trade due to the
growth in the chemical industry. Stolt-Nielsen took advantage of this,
becoming one of the major operators and continuing their expansion in
specialised ships.
This expansive newbuilding programme got Stolt-Nielsen into financial
problems in 1976/77. British Petroleum (BP) advanced a finance loan of about
US$ 50 million to ease the short term liquidity problems. As part of the
arrangement BP acquired a ten-year option to purchase 50% of the company.
The main office was moved from Oslo to the USA in connection with this deal.
In 1987 BP decided not to exercise the option, and Stolt-Nielsen regained full
control of the company. This proved to be a turning point for Stolt-Nielsen, as
it was followed by an aggressive expansionary policy (Drewry, 1996).
The company has been quoted on the NASDAQ Stock Exchange since
May 1988, but the Stolt-Nielsen family still controls a 60% stake in Stolt-
Nielsen S.A. The company owns a fleet of 49 deep-sea chemical tankers and
operates a further number of vessels on a pool or time charter basis (Drewry,
1999). Core business for the Stolt-Nielsen organisation is its chemical parcel
business, but they are also strong in related distribution services. This
distinguishes Stolt-Nielsen and Odfjell from the other major operators as
both offers integrated logistic services. This includes regional feeder service,
tank containers and tank terminals.

22
The expansive program started in 1987 has been followed by another
program in the 1990s to replace older parcel tankers with new more
sophisticated ships. This included an order for seven 37,000 dwt advanced
IMO Type 1 chemical parcel tankers from Danyard shipyard in Denmark.
Stolt-Nielsen ordered a further three sophisticated ships from a French
shipyard in March 1995. Six ships were delivered from Danyard in 1996-
1998, and a further two sister ships in the series were ordered in 1997. Stolt-
Nielsen is the industry leader in the parcel tanker sector, with approximately
26% of the market for sophisticated deep-sea carriers17 (Drewry, 1999). The
company’s range of services enables Stolt-Nielsen to offer its customers an
extensive and flexible logistics service on a global basis. The company has 25
offices around the world, and a fleet large enough to provide global coverage
and compete keenly for contracts of affreightment to give it its strong
markets position. The financial performance of Stolt-Nielsen has also been
impressive. In the ten years since it became public, the company has given a
double-digit return on capital in five years and double-digit return on equity
in seven years (Lazard, 1998).
2.5.2 Odfjell ASA
Odfjell18 was founded in 1914 and became in the 1950s along with Stolt-
Nielsen one of the pioneers in the development of the chemical tanker trade.
The company went into the sophisticated segment early and expanded
heavily by acquiring 15 chemical tankers and a few specialised gas ships
between 1960 and 1968 (Østensjø, 1992). All but two of the chemical tankers
were smaller than 10,000 dwt, but many of them had stainless steel capacity
17 This reflects parcel carriers above 10,000 dwt.18 The name was changed from Storli ASA to Odfjell ASA in Feb. 1998 to improve andsimplify the company’s profile and identity as operation already were marketed under thename Odfjell Tankers. To make the presentation less confusing I will only use the nameOdfjell throughout this thesis.

23
and constructed with double skin. This was not common at the time, and
paved the way for Odfjell to become a major player in chemicals trading.
Stainless steel capacity gave Odfjell greater flexibility compared to other
operators regarding transportation of different products consecutively.
Odfjell linked in the early 1970s up with Westfal-Larsen to make a
joint venture company. Westfal-Larsen added further stainless steel capacity,
and contributed with their experience from owning and operating product
tankers. This gave the company an edge to compete with Stolt-Nielsen on the
most demanding cargoes, and by 1972 the Odfjell/Westfal-Larsen fleet
comprised 24 vessels, 14 of which offered stainless steel capacity. According
to Østensjø (1992), 17 of these tankers were larger than 6000 dwt.
In the 1970s, Odfjell/Westfal-Larsen continued their expansion in
specialised ships, even though the economic environment of the chemical
industry was not so optimistic as in the 1960s. The rate of growth in
petrochemical products did not turn out to be as high as expected when
orders for new ships were made. This led to an excessive supply of tankers,
giving the shipowners poor returns up until 1979. Odfjell remained
nevertheless together with Stolt-Nielsen the leaders in the sophisticated
chemical carrier niche.
In 1980 Odfjell and Westfal-Larsen established a new joint company to
consolidate their activities. At the end of 1989, this joint venture was
terminated when Westfal-Larsen went out of the chemicals markets, selling
its nine owned chemical tankers, its four part-owned chemical tankers, and
its 50% share in the Baytank terminal to Odfjell (Drewry, 1996). Moreover in
1989 Odfjell acquired five more vessels, and the following year they formed a
new joint venture company with the National Shipping Company of Saudi
Arabia (NSCSA). Odfjell sold the nine vessels bought from Westfal-Larsen to
NSCSA, who put them into a new company, National Chemical Carriers

24
(NCC). The new joint venture was structured so that Odfjell continued to
control the operation and marketing of the NCC fleet (Drewry, 1996).
In the beginning of the 1990s, Odfjell set out a policy to first “safeguard
their market share” before gradually expanding it. The safeguarding was the
collaboration with NSCSA, while the expansionary phase was to set forth an
aggressive policy of newbuilding and second-hand purchase. Odfjell acquired
several tankers through second-hand purchases, consisting of ships
previously employed by Odfjell on a time charter or pool basis.
Odfjell proceeded with their newbuilding program in 1991. They
planned to build six advanced IMO Type 1 37,500 dwt parcel carriers at
different Kværner shipyards. This program was extended in the mid 1990s,
as Odfjell placed orders for two more 37,500 dwt sophisticated tankers from
Kværner Florø. The total number of newbuildings had reached 16 vessels at
the end of 1998. The newbuildings have all been of advanced design making
them among the most sophisticated vessels on the market today along the
newbuildings of Stolt-Nielsen and JO Tankers (Drewry, 1999). Odfjell’s fleet
in the deep-sea segment in the beginning of 1999 was 49. Of those ships, the
Odfjell group owned 30 while the rest were time-chartered. In addition
Odfjell has two further vessels due for delivery in 1999 and 2000 (Odfjell
annual report, 1998).
Odfjell has, as noted in the last sub-section, like Stolt-Nielsen built up
competence in related logistic services. This includes 9 vessels in regional
trade, increasing involvement in tank terminals and a joint venture with
Hoyer19 to provide a worldwide tank container service.
The financial performance of Odfjell has also been relatively
impressive since it went public in 1985. Its operating margin has fallen below
double digits on three occasions only. The company has also produced double
digit return on equity in every year but two. There has been considerable

25
fluctuation in the freight rates during this period, proving the company to be
well managed (Lazard, 1998).
2.5.3 JO Tankers
This company was founded in early 1980, as the two Odfjell cousins decided
to go their separate ways and reorganise Odfjell into two independent
companies. One was named J.O. Odfjell, while the other retained the old
company name. The company JO Tankers was initially a joint venture
between J.O. Odfjell and the Swedish company Johnson Line to operate
chemical tankers under 10,000 dwt. It expanded into the deep sea chemical
niche in 1981, and in 1988 J.O. Odfjell agreed to purchase Johnson Line’s
50% share in JO Tankers and the three tankers owned by Johnson Line
(Østensjø, 1992).
JO Tankers is exclusively concerned with the management and
operation of chemical tankers and controls the most modern fleet of the
leading operators. This has been achieved by an active strategy to increase
their market share in the parcel tanker market. The strategy was
undertaken by adopting a gradual programme of fleet expansion. The
programme was based on newbuilding, second-hand purchase and long-term
time charter. According to Drewry (Drewry, 1999) JO Tanker’s fleet increased
from 8 to 21 vessels between 1988 and 1998, while the chartered pool
increased from 10 to 3420. The company has an 8 % market share of the
chemical carriers market over 10,000 dwt (Ibid.), but has a very sophisticated
fleet with nearly 55 % in stainless capacity. This seems to have been a long-
term strategy as JO Tankers had a large share in stainless steel capacity
already in the beginning of this decade (Drewry, 1991).
19 Hoyer GmbH is a German company involved in the operation and management of tankcontainers.20 This number is a bit controversial. Richardson Lawrie Associates notes JO Tankers fleet of1. January 1999 to be 32 vessels, where 26 of them habitually trade in the deep-sea market.

26
2.5.4 Seachem Tankers
Seachem Tankers was formed in 1990 as a pooling arrangement between
Ceres Hellenic, Nedlloyd and Fearnley & Eger. The company was centred at
Seachem’s head office in London. The other pool partners later pulled out, as
Fearnley & Eger went bankrupt and Nedlloyd wanted to concentrate on its
core liner business. Seachem is still operating as a pool company and owns no
ships, thus drawing its ships from Ceres Hellenic Shipping Enterprises of
Greece and Finaval from Italy. At present time 23 vessels are operated in the
Seachem pool (Drewry, 1999).
Its first step into the business was taken as late as in 1987, when
Ceres Hellenic took delivery of a series of seven 45,000 dwt newbuildings
from Hyundai. This was followed by another big purchase, this time of six
vessels from the Canadian Pacific fleet for $100 million (Drewry, 1999).
Seachem is the youngest company of the major operators and has as the other
major operators focused on expanding their market share in the parcel tanker
market. Seachem is also the only “major” to focus on chemical/product
tankers, operating several vessels in this segment. While the other major
owners have spent huge resources on newbuildings, Ceres Hellenic has
adopted an aggressive second-hand acquisition policy. Their main target has
been 1980s built tankers around 10,000 dwt and 40,000 dwt. Even though the
company has concentrated on second-hand vessels, Seachem controls one of
the youngest of the independent chemical tanker fleets (Drewry, 1999).
2.6 MARKET COMPETITION
The market for deep-sea trade of chemicals is fragmented, where competition
can be divided into distinct geographical trading lanes. These routes can be
27
identified as the trading patterns between the five continents. According to
Richardson Lawrie Associates Stolt-Nielsen, Odfjell and JO Tankers are all
active in routes involving North America, North Pacific, South East Asia, the
Middle East and Europe.
The two largest shipping companies, Stolt-Nielsen and Odfjell operate
liner service between all continents, including South America and South
Africa. Being the largest chemical tanker operator Stolt-Nielsen is the most
important owner (in terms of port calls) in North America, OECD Europe,
Latin America, South East Asia, Japan and Australia. The most important
regions for Stolt-Nielsen are OECD Europe, North America and South East
Asia (Drewry, 1999). Like Stolt-Nielsen, Odfjell also spreads it fleet across
the world’s chemical trading lanes. The map in appendix 2 shows the deep-
sea trading pattern of Odfjell Tankers, with the major ports of call also
displayed. As we can see, Odfjell is well represented all over the world.
JO Tankers is the major operator which is most strongly dedicated to
this transatlantic trade, with more than 60% of its calls in the North America
and OECD Europe regions (Drewry, 1999).
Seachem is according to Richardson Lawrie Associates predominately
involved in the trans-Pacific business to various parts of East Asia, but
particularly the North Pacific and the Middle East to the USA.
One can observe that the major players meet in several distinct
geographical markets and that they compete with each other on a wide
variety of routes. On the senior routes, for instance the transatlantic, the
major operators also compete with smaller, ‘non-major’ companies. Other
routes are distinguished by the fact that only a small number of operators
compete for market shares. There is an analogy here to the airline business
where the major airlines compete on several destinations and face smaller
competitors as well on some of these destinations. This multimarket situation

28
can affect market competition, which will be developed further in chapter
four.
One specific notion about chemical shipping is that around 50%21 of all
chemical movements are covered by contracts of affreightment (coa). The spot
market covers approximately 35%, while the remainder is made up from
other charter agreements and cargoes moved in tonnage controlled by
exporters or importers. These estimates are highly uncertain, but the large
amount of coa coverage makes the chemical tanker freight market quite
secretive and details of actual contract rates are rarely divulged.
2.7 ENTRY BARRIERS IN DEEP-SEA CHEMICALS SHIPPING
Chemicals shipping is distinguished by difficult entry barriers, which makes
it unlikely that the number of major parcel tanker owners will increase
significantly in the future. I will give an overview of the main barriers to
entry in this section.
The sophisticated chemical carriers naturally create a barrier to entry.
Chemical carriers are, as noted in section 2.4, very costly to build compared
to other simpler vessels. The newbuildings of Odfjell and Stolt-Nielsen are
estimated to cost around $65 – $75 million for each ship. High newbuilding
prices are coupled with a very small second-hand market, which means that
newbuildings could be essential for a large-scale entrant. In addition, due to
the complexity of the chemical carriers, there are only a small number of
yards worldwide that are able to build these vessels, making the capacity for
newbuildings limited.
21 This is a rough estimate from Drewry (1999) as the real number is difficult to obtain.Odfjell (Annual report, 1998) states for instance that their coa was about 55% in 1998.

29
Not only are newbuilding prices astronomical, a barrier to entry is also
created by fleet size. To be able to compete with the major operators a
newcomer would have to control more than a couple of ships. It is hard to say
how many vessels are needed, but Drewry (1999) suggests that at least five
parcel tankers are necessary to take up competition on some of the deep-sea
routes, which seems like a plausible number. Operators like Odfjell and Stolt-
Nielsen, that have a large number of vessels, can have a high frequency on
their liner shipping, making it easier to adjust to the customers’ needs. It is
quite obvious that a smaller player would find it difficult to offer the same
kind of service with a smaller number of ships. A new major operator could of
course invest in less sophisticated vessels or even hire vessels on a time
charter basis. But still, if he wanted to take up competition with the major
operators, some sophisticated vessels would be needed, and they seem more
difficult to hire as the major operators already control most of these ships.
Another barrier to entry is operational skills. The skills to operate a
chemical fleet are developed through experience, and in addition to extensive
marketing expertise, they are needed to ensure a high fleet utilisation. Hans
Petter Amundsen of Odfjell emphasised the element of human capital in
chemicals shipping and underlined that Odfjell attaches great importance in
constantly improving their human capital level. For a newcomer it is obvious
that these skills must be obtained by some of the current operators and this
adds to the cost of a potential entry. Operational skills are thus regarded to
be an important factor to prevent entry.
The close relation between the existing operators and their customers
also creates an entry barrier. For instance, Stolt-Nielsen’s top 10 customers
are all leaders in the chemical industry. Among them one finds Arco
Chemical, BASF, Exxon Chemical, Hoechst Celanese, Shell and Union
Carbide (Lazard, 1998). The strong client relations of the existing operators
mean that they are difficult and costly to achieve for a newcomer. This makes

30
entry more difficult as a new entrant must convince potential customers that
they are serious players and that they intend to stay in the business on a
long-term commitment.
Investment in information technology is a new strategic factor that can
establish a future barrier to entry. Both Stolt-Nielsen and Odfjell have
invested heavily in developing information systems customised to their own
operations. Hans Petter Amundsen of Odfjell claimed that when their system
was fully developed, an integrated network would make the company serve
their customers better and faster. A customer will for instance be able to
enter the Odfjell information system and find out exactly where in the world
their chemical parcel is. The implementation of an effective and integrated
information system can give the leading incumbents a cost advantage, which
can be used to deter potential entrants.
The increasingly stringent environmental and safety requirements
cause another barrier to entry. International regulations to ensure safer
handling of cargoes at sea increase the costs a new operator will have to incur
and this adds to the investment needed to enter chemicals shipping.
The integrated land-sea transportation and storage systems also
produce a barrier to entry. The two major operators both own facilities on
land for the storage of chemicals and are involved in the chemical tank
container business. Odfjell has for instance a 100% stake in one of the most
modern tanker terminals in the world, Baytank Inc. in Houston. This enables
the companies to offer their customers complete “door to door” freight services
and both Odfjell and Stolt-Nielsen seem to focus heavily on the development
of these integrated services. This can make entry into chemicals shipping
more difficult as the customers are “locked” to the leading incumbents, who
offer a total logistical package.

31
2.8 NEW ENTRIES?
A new study has suggested that the returns on investment for the major
chemical operators on average have been higher compared to shipping
companies in other segments. (Birkeland, Eide & Hvide, 1999). And as we
know, high returns on investment will always attract newcomers.
In recent years there have been a number of companies entering the
deep-sea chemicals market according to Richardson Lawrie Associates. Some
of them have succeeded to stay, while others have failed to survive22.
Richardson Lawrie Associates also point out the fact that other operators,
like Team Tankers, have expanded their operations in the parcel tanker
business by building from a base of simple product/chemical tankers. One
would expect that somebody would try to become a major player due to the
high returns on investment, but it seems that these minor companies have
remained small and that none of them have tried to threaten the major
operators’ market share.
One incident from spring 1990 is described in Østensjø (1992) and
Seim & Stoutland (1991). Former employees from the two major operators,
Odfjell and Stolt-Nielsen established a new company. They had a well
founded knowledge of chemical tankers operations and Chemteam, as the
company was called intended to become one of the “big” operators and
compete with the established majors. Chemteam did not own any vessels, but
hired vessels on 3 to 12 months basis and operated them. At the time when
Chemteam started, freight rates where expected to rise significantly
(Østensjø, 1992). But when the Kuwait crisis ended in May 1991, rates fell
below what the vessels had been contracted for and Chemteam withdrew
from all activities in autumn 1991. When Chemteam first started they also
experienced attempts from Odfjell and Stolt-Nielsen to take over the
22 These companies include Aurora Tankers, Westchart, The Novamar pool, CopenhagenTankers and Seatrans-Ermefer.

32
company (Seim & Stoutland, 1991), which we can take as an indication of the
leading operators’ willingness to fight hard to sustain their positions. The
attempt did not succeed, but was followed by an agreement to co-operate
(ibid.).
The following chapter will try to explain how potential entrants
effectively can be deterred from a certain market. It is assumed that the
major operators can act as a monopolist. This is not obvious the case in
chemicals shipping, but it simplifies the theoretical analysis in chapter three
as we can study how a monopolist can deter entry from a newcomer.
Chapter four will derive models of tacit collusion and multimarket
contact, which can arise in a market dominated by a small number of firms.
Even though the financial power that is needed to become a major
player in the most sophisticated segment of the chemical carrier market can
be huge, there are several players that would meet these requirements. The
big chemical companies, usually large multinationals have the financial
strength to make such an investment. They may lack the skills to operate a
chemical fleet, but they could easily buy several small operators and/or
persuade key people from the existing operators to change jobs. There is
therefore a possible danger of vertical integration. But up till today the
overseas shipment volume of these companies has been small compared to
total volume, not justifying building a fleet of their own. This was noted by
Østensjø (1992) and still seems plausible today.
The major players have long dominated the parcel tanker business,
and especially companies with a Norwegian background. “The Norwegian
presence in the long haul parcel tanker market is so strong that outsiders have
been trying and failing to get into the business for the last 20 years” writes
Drewry Chemical Carrier Quarterly (1999). This statement seems a bit over
the top, but still, the major incumbents have consequently managed to

33
sustain their position, possibly through the exercise of market power, which
will be elaborated further in the next chapters.

34

35
CHAPTER THREE
ENTRY BARRIERS
A striking observation from chemicals shipping was that there had been few
attempts to challenge the major operators. This could indicate that the
incumbents have taken entry-deterring actions to restrain potential entrants.
This chapter will focus on the theoretical side of entry barriers and how this
can affect market competition. A normative approach will derive the optimal
business strategies for an incumbent facing potential newcomers. We will see
that even when entry-accommodation is chosen, an incumbent can take
strategic measures to improve his post-entry position.
3.1 DEFINITION OF ENTRY BARRIERS
Throughout the last decades there have been several different approaches to
capture the strategic and economic consequences of barriers to entry. I shall
briefly review some in this section.
Bain (1956) formulated the concept as a “condition to entry” equivalent
to the state of potential competition from possible new competitors. He
evaluated it roughly by the advantages established sellers in an industry
have over potential entrants, with “these advantages being reflected in the

36
extent to which established sellers can persistently raise their prices above a
competitive level without attracting new firms to enter the industry” (Bain,
1956). He was interested in the empirical element, and wanted to examine
closer what actually happened in different markets. Later theories have
focused more on the formal side of entry barriers, and examined why they are
present in some markets and how an incumbent can take advantage of this.
Lieberman and Montgomery (1988) survey the theoretical and
empirical literature that gives rise to first-mover advantages and
disadvantages. First-mover advantages are related to entry barriers, as firms
that are pioneers in one market can exploit this and prevent potential entry
from competitors. In their article first-mover advantages are defined in terms
of the ability of the first firm’s opportunity to earn positive economic profits,
i.e. profits in excess of the cost of capital (Lieberman and Montgomery, 1988).
This coincides with Bain’s approach, where entry barriers are seen as a
possibility to earn economic rent for the incumbents.
Yip (1982) emphasises this further, and comments that entry barriers
are the disadvantages a newcomer faces relative to an incumbent. The
important point here is to note that there arises a disadvantage merely due to
the fact of entry versus an established incumbent. This can also be found in
Stigler’s definition of barriers to entry. According to Stigler (1968), “[a]
barrier to entry may be defined as a cost of producing (at some or every rate of
output) which must be borne by a firm which seeks to enter an industry but is
not borne by firms already in the industry”.
One can also find definitions where attention is on the economic
efficiency of a market with entry barriers. Ferguson is noted in Gilbert (1989)
and defines barriers to entry as “factors that make entry unprofitable while
permitting established firms to set prices above marginal cost, and to
persistently earn monopoly return”. The different approaches do not cover the
topic too precisely. For instance it is important to bear in mind that the

37
mobility of capital into an industry can depend on the mobility of capital out
of an industry. This is noted in Gilbert (1989). He points out that “[t]he
central question in entry deterrence is the value that is attached to
incumbency: Why is it that an established firm may lay claim to a profitable
market while other (equally efficient) firms are excluded?” This leaves him
with a more general definition of what a barrier to entry is. He defines a
barrier to entry to be a rent that is derived from incumbency. In other words
the extra profit an established firm can earn due to the fact that he is an
incumbent.
3.2 THE GAME OF ENTRY
An important aspect of entry deterrence is to make it credible. This implies
that threats put forward to a potential entrant must have some sort of
commitment value. If the threat is just “cheap talk” a newcomer will see
trough this and enter the market with the incumbent as a passive spectator.
The formal side of this has been analysed through game theory23. A simple,
but instructive example of this entry deterrence game is shown in extensive
form in figure 3.1 on the next page.
The entrant has the choice of entering or staying out of the market. If
he enters the incumbent can respond with aggression or accommodation. In
this example there is complete information, so both players know each other’s
payoff from the different outcomes. The threat in question is the possibility
that the incumbent chooses the aggressive option if the newcomer decides to
enter the market. This could be exemplified as a situation where the
incumbent starts a price war with the result that the involved parties receive
23 For a short introduction to game theory, see for instance Fudenberg and Tirole (1989) orGibbons (1992).

38
ENTRANT
Stay out
Accommodation
negative or zero profit. The incumbent wants to convince the entrant that an
entry will be unprofitable and hence, that he should stay out of the market
and not undertake any start-up costs. The entrant of course, wants the
incumbent to choose accommodation and thereby let the entrant receive a
share of the market. This implies that the incumbent’s market share declines
and that his profits drop.
Figure 3.1: Typical game of entry.
To solve this game one has to look for a Nash equilibrium, which is not
only an overall equilibrium, but also an equilibrium in all subgames. A Nash
equilibrium with this property is known as a subgame perfect equilibrium
(Varian, 1992). In the game in figure 3.1, the obvious solution is for the
entrant to enter the market. This is due to the fact that the incumbent’s
threat is not credible. If the newcomer enters the market, it is better for the
incumbent to play soft and split the market, than to play tough and not make
any profit at all. The incumbent’s threat of a price war to remain a
monopolist should not discourage the entrant from going into the market. We
INCUMBENT
Enter
Aggressive (-1,0)
(1,2)
(0,4)

39
see that an incumbent, who wants to remain a sole player in one market, has
to make credible threats to keep entrants out of their lucrative business.
The question is whether the incumbent can change the game and
present a credible threat. Can he invest in extra capital or take other
strategic actions that would make it optimal to choose the aggressive action if
someone tries to enter the market? Viewed through the game in figure 3.1,
one can think of an action that changes the payoffs to the different players. If
the aggressive option becomes the rational choice for an incumbent, the
entrant will be aware of this and by reasoning backwards conclude not to
enter the market.
Brandenburger and Nalebuff (1995) presented a popular and practical
approach to this subject. They pointed out that “[t]he essence of business
success lies in making sure you’re playing the right game.” They emphasised
that game theory gives a systematic way to understand the behaviour of
players in situations where their payoffs are interdependent. The authors
also stressed that a company should not just play the game they find, but
actively shape the game they want to play. This coincides with the above-
mentioned game of entry. Incumbents have an incentive to shape the game,
such that their threats towards entrants become credible. One way to shape
the game you play is to enhance the entry barriers in an industry. An entry
barrier makes it more difficult to enter an industry and could deter potential
entrants to remain out. Entry barriers can be a natural factor in one market,
but incumbent firms can also actively take action to create barriers for
newcomers as noted by Salop (1979).

40
3.3 A TAXONOMY OF ENTRY DETERRENCE STRATEGIES
Stackelberg developed in the early 1930s a model that showed how a
first-mover advantage could be of strategic importance. He did not analyse
entry deterrence, but showed as Tirole (1988) remarks “that commitments
matter because of their influence on their rivals’ actions.” The model focuses
on how a player in a duopoly can influence the other player by making an
observable commitment before his opponent can respond and set his quantity.
We want to take this further and see how an incumbent player can influence
a newcomer’s entry decision by strategic investment. Fudenberg and Tirole
(1984) built a normative framework to formalise these ideas. They provide a
taxonomy of business strategies, which can be used to analyse situations of
strategic interaction between an incumbent and an entrant.
To simplify we narrow the time perspective to a two-period model with
only two players, an incumbent and a potential entrant. In the first period
the incumbent24, being the only player in market, determines the amount of
capital he wants to accumulate. Capital should be understood in very broad
terms here, as it could be investment in larger production capacity, but also
investment in knowledge or human capital. The important point is that the
action taken by the incumbent in the first period can influence the entry
decision taken by the entrant in the second period. This means that the
incumbent has to consider all his options and choose the one that will
maximise his total payoff.
In the first period the incumbent chooses how much he wants to invest
in capital, denoted K1. As noted above, the term capital must be widely
understood. Firm number 2 observes K1 and decides whether to enter the
market or not. If the entrant decides to stay out he makes no profit. The
incumbent’s profit is then given by
24 I denote the incumbent as firm 1 and the entrant as firm 2.

41
∏1m (K1,xm
1(K1)),
where m denotes the incumbent remaining a monopolist. If firm 2 decides to
enter, they simultaneously choose output in the second period. Their profits
are then
∏1 (K1,x1,x2)
and
∏2 (K1,x1,x2).
One should note that the optimal choice of x1 and x2 is dependent the size of
K1. This is because the invested capital on stage one determines what the
incumbent can produce in the second period. The entrant must also take K1
into consideration when finding his optimal choice of x2. Any entry costs for
firm 2 are assumed to be a part of ∏2.
I will first show equilibrium where entry is deterred by firm 1’s choice
of K1. The incumbent deters entry if K1 is chosen such that
∏2 (K1,x1
*(K1),x2
*(K1)) = 0.
There are two effects we have to focus on here. If we take the total derivative
of ∏2 with respect to K1 we get
1
*1
1
2
1
2
1
2
dK
dx
xKdK
d
∂Π∂+
∂Π∂=Π
.
The first term on the right hand side is the direct effect. This shows how the
incumbent’s choice of K1 directly influences the entrant’s profit. The second
term is the strategic effect. The strategic effect shows how the investment in

42
K1 will affect the incumbent’s output, and hence how this will influence the
entrant’s profit. Using Tirole’s words we will say that investment makes the
incumbent firm tough if d∏2/dK1 < 0 and soft if d∏2/dK1 > 0 (Tirole, 1988).
This will affect the optimal entry deterring strategies for the incumbent,
which will be explained more closely below. But first we look at the case
where entry is met by accommodation from the incumbent.
What if the incumbent firm finds it too costly to deter entry? In this
situation firm 1’s optimal behaviour is given by its own profit post-entry. The
incentive to invest is given by the total derivative of
( ))(),(, 1*21
*11
1 KxKxKΠ
with respect to K1. We know from the envelope theorem that since x1
*(K1 ) is
the choice of x1 that maximises profits, we have
( )0
,,
1
2111
=∂
Π∂x
xxK.
The basic equation in the entry-accommodation case is then
1
*2
2
1
1
1
1
1
dK
dx
xKdK
d
∂Π∂+
∂Π∂=Π
.
Once again we can decompose this derivative into two effects. The direct
effect is the first term on the right hand side. This effect would have existed
even if the entrant did not observe K1 before making his choice of x2, and
could therefore not affect x2. Thus for the purpose of the classification I will
ignore this. The strategic effect results from the influence the incumbent’s
investment has on firm 2’s second-period action. Again using Tirole’s words
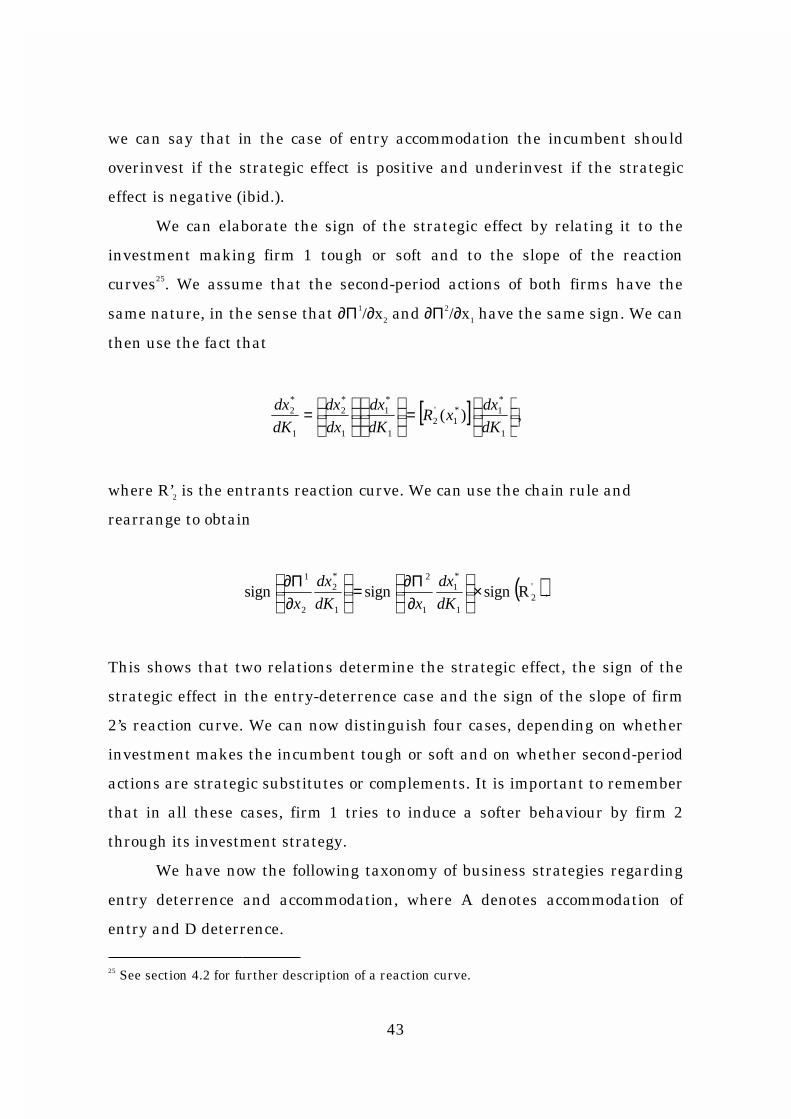
43
we can say that in the case of entry accommodation the incumbent should
overinvest if the strategic effect is positive and underinvest if the strategic
effect is negative (ibid.).
We can elaborate the sign of the strategic effect by relating it to the
investment making firm 1 tough or soft and to the slope of the reaction
curves25. We assume that the second-period actions of both firms have the
same nature, in the sense that ∂Π1/∂x2 and ∂Π2/∂x1 have the same sign. We can
then use the fact that
[ ]
=
=
1
*1*
1'2
1
*1
1
*2
1
*2 )(
dK
dxxR
dK
dx
dx
dx
dK
dx,
where R’2 is the entrants reaction curve. We can use the chain rule and
rearrange to obtain
( )'2
1
*1
1
2
1
*2
2
1
Rsign sign sign ×
∂Π∂=
∂Π∂
dK
dx
xdK
dx
x.
This shows that two relations determine the strategic effect, the sign of the
strategic effect in the entry-deterrence case and the sign of the slope of firm
2’s reaction curve. We can now distinguish four cases, depending on whether
investment makes the incumbent tough or soft and on whether second-period
actions are strategic substitutes or complements. It is important to remember
that in all these cases, firm 1 tries to induce a softer behaviour by firm 2
through its investment strategy.
We have now the following taxonomy of business strategies regarding
entry deterrence and accommodation, where A denotes accommodation of
entry and D deterrence.
25 See section 4.2 for further description of a reaction curve.

44
Figure 3.2. Optimal business strategies.
Fudenberg and Tirole (1984) describe the different strategies where
“[t]he fat-cat strategy is overinvestment that accommodates entry by
committing the incumbent to play less aggressively post-entry. The lean and
hungry strategy is underinvestment to be tougher. The top dog strategy is
overinvestment to be tough; this is the familiar result of Spence and Dixit.
Last, the puppy-dog strategy is underinvestment that accommodates entry by
turning the incumbent into a small, friendly, nonaggressive puppy dog.” The
colourful language of Fudenberg and Tirole needs some more explanation. It
is perhaps easiest to see the intuitive in the top dog strategy. An example
here is to build extra capacity to deter entry by looking tough and aggressive.
A potential newcomer will observe this overinvestment and know that if he
tries to enter, the incumbent can increase his production and flood the
market, driving the price down.
The lean and hungry strategy is more diffuse. Why would an
incumbent want to underinvest? The incumbent wants to look small and
hungry to convince the newcomer that he is ready to fight hard over market
shares and cut prices if necessary. Fudenberg and Tirole (1984) present an
Strategiccomplements(R’>0)
Strategicsubstitutes(R’<0)
A: Puppy DogD: Top Dog
A and D: Top Dog
A: Fat CatD: Lean and Hungry
A and D: Leanand hungry
Investment makes firm 1
Tough Soft

45
example where it is optimal to underinvest in advertising. The incumbent
wants to commit itself to an aggressive pricing policy if entry occurs. By
underinvesting the incumbent serves fewer customers prior to entry, and will
thus fight harder to sustain these customers if a newcomer enters.
The last two strategies describe situations where entry occurs. The fat
cat strategy is overinvestment to become soft and thereby induce a newcomer
be less aggressive post-entry. Once again we can use advertising to exemplify
this strategy, as an incumbent that finds it optimal to accommodate entry
should overinvest in advertising. By overinvesting the incumbent will serve a
larger customer base prior to entry and thereby, by being contempt with a
smaller market share, be less willing to fight hard post-entry. This induces
the entrant to price less aggressively as well.
The puppy-dog ploy is underinvestment in order to make the
incumbent firm appear friendlier to a new entrant. Gelman and Salop (1983)
provide an example where the entrant is the puppy dog. By committing itself
to a low investment strategy, the entrant projects a friendly image that is
intended to spur a more accommodating strategy by the incumbent.
3.4 DETERMINANTS OF BARRIERS TO ENTRY
The last passage states that over- or underinvestment is the crucial way for
the incumbent to deter or accommodate entry. This is however a very
technical approach and I will therefore in this section describe more explicitly
some strategic actions that could create barriers to entry.
One obvious observation is to invest in physical capital, for instance a
plant or a chemical carrier. By investing in large capacity and sinking this
investment, the incumbent can make a credible threat to increase production
and diminish the potential entrant’s profit. This is the case in Dixit’s (1980)

46
model, which will be described in the next section. Higher investment in
capital can also have economies of scale advantages. By investing in more
capital, an incumbent can achieve a more efficient production facility and
thereby making it more difficult for a newcomer to enter. The existence of a
minimum efficient scale as a significant proportion of the market demand
could lead to a market sustainable of only a few firms (Tirole, 1988).
Industries where “learning by doing” is important have often been seen
as a way for an incumbent to deter entry. In this case the incumbent will pre-
entry invest in skills that can be used in the second period to prevent entry.
This is noted in Tirole (1988), where the experience acquired by an incumbent
during the first stage of the game can reduce production costs in the second
period, giving the established firm a cost advantage to deter newcomers. If
the experience acquired today means that a firm can reduce its price
tomorrow, entry will be difficult, as a newcomer will always lag behind in the
race to cut costs and thus market price. The incumbent will here gain a
technological leadership it can exploit. Lieberman & Montgomery (1988) note
however that “[i]t is now generally recognised that diffusion occurs rapidly in
most industries, and learning-based advantages are less widespread than was
commonly believed in the 1970s”. Considering the ambiguous results from the
empirical research it is questionable how important “learning by doing” is to
deter entry.
Building up close relationships with customers can also be seen as a
strategic investment to deter entry. If an incumbent can make an investment
to establish a clientele it could increase the demand for its product. If the
demand for the incumbent’s product is considerable, this could make the
potential demand for the entrant so low that an entry would be unprofitable.
Firms have recognised this in some markets where advertising is vital to the
turnover of a product. By launching an advertising campaign they do not only
make their product known, but also “pre-empt” demand (Tirole, 1988).

47
Customers become loyal to a product, making it difficult for a new firm to
enter. This is not always the case, as we saw in the last section that
overinvestment in advertising could encourage entry as the incumbent
became a “fat cat”.
Establishing a clientele is related to switching costs, which also can
produce a barrier to entry. When there exit switching costs, late entrants
must invest extra resources to attract customers away from the incumbent
firm (Lieberman & Montgomery, 1988). Lieberman and Montgomery (ibid.)
note that switching costs typically enhance the value of a market share
obtained early in a new market, thus making it rational to create switching
costs in pursuit of market share.
Another barrier to entry is product differentiation. This implies that
the incumbent chooses a “strategic place” in a geographical or product space
to deter entry. The incumbent can often choose the most attractive niches and
may be able to take strategic actions that limit the amount of space available
for subsequent entrants (Lieberman & Montgomery, 1988). One has to think
of the preemptable “space” broadly as mentioned above. A study of Wal-Mart26
by Ghemawat is mentioned as a successful example in Lieberman and
Montgomery (1988). According to the study Wal-Mart targeted small
southern towns located in adjacent regions that competitors initially found
unprofitable to service. By coupling spatial pre-emption at the retail level
with an extremely efficient distribution network, the firm was able to defend
its position and earn sustained high profits (ibid.). This could also be related
to chemical shipping, as the major operators can be seen to pre-empt the
niche of the sophisticated chemical segment. Eaton and Lipsey (1980) note
that if capacity has a finite lifetime, the incumbent must renew it
prematurely to avoid pre-emptive investment by an entrant that would
eliminate the incumbent’s incentive to continue (Wilson, 1992). This model
26 A discount retailing firm in the U.S.A.

48
will be presented in more detail in section 3.6. Lieberman and Montgomery
(1988) also suggest that another pre-emption strategy can create a barrier to
entry, as the incumbent firm can gain an advantage by pre-empting potential
rivals in the acquisition of scarce assets.

49
3.5 CAPITAL COMMITMENT TO DETER ENTRY
In this section I will present a model that formally shows how capital
commitment by an incumbent can deter entry. Dixit (1980) developed this
model in a “classic” article, which is still important today.
In this model we have two firms as earlier, an incumbent and a
potential entrant. The two players play a similar game to the one presented
before in section 3.2. This time the extensive form of the game is divided into
three stages27. In the first stage the incumbent firm, referred to as firm 1
invests in capacity. This capacity is fully observed by the potential entrant,
called firm 2. In stage two, after observing firm 1’s choice of capacity the
potential entrant makes a decision to enter or not. If firm 2 decides to enter
he has to set both capacity and output in stage three. In this stage the two
firms engage in a standard Cournot competition. Thus the two firms make
simultaneous quantity decisions. Firm 2 has to build a plant capacity equal to
the quantity he wants to produce, but it is also possible for firm 1 to add to
his capacity. If entry does not occur firm 1 remains a monopolist and sets
quantum accordingly in the third stage of the game. The revenue for firm i is
noted by Ri(q1,q2) and has the following properties
.0),(
, 0),( 21
2
221
2
<∂∂
∂<
∂∂
ji
i
i
i
qqR
q
qqR
We see that the choice variables are strategic substitutes. This means that if
firm 1 increases his output, it is optimal for firm 2 to lower his production
and vice versa. It is further assumed that both firms have constant variable
27 Dixit (1980) sets up a two-stage game, but I divide the last stage in two as I think thismake the situation more comprehensible.

50
cost of output, constant unit cost of capacity expansion and a set up cost.
Firm i’s cost function per period is expressed as follows
,);( iiiiiiii krqwfkqC ++=
where ki is firms i’s capacity, fi is the fixed set-up cost, ri the constant cost per
unit of capacity and wi the constant average variable cost for output. The
capacity a firm invests is sunk and can not be reduced at a later stage. A firm
needs one unit of capacity to produce one unit of quantity, which means that
qi ∈ [0, ki ].
Initially suppose that firm 1 has installed capacityk1. If the firm
produces within the limit of its production capacity (q1≤k1) total cost will be
given by
.111111 krqwfC ++=
If the firm wants to produce more thank1 it has to increase its capacity, and
the total cost function will become
.)( 11111 qrwfC ++=
We can therefore observe that firm 1’s marginal cost will be w1 as long as it
produces withink1 and w1 + q1 if it sets production above this level. The
potential entrant does not have any prior commitment in capacity, thus its
cost function for any positive production will be
.)( 22222 qrwfC ++=

51
N’
M’
M N
R’
R
TV
Firm 2’s marginal cost will be w2 + r2. It is easy to see that firm 1’s choice
ofk1 will affect its marginal cost curve and influence its reaction curve. Thus
if the two firms interact the resulting Cournot competition will depend onk1,
and hence affect the profits of the two firms. Firm 2 will enter the market if it
makes a positive profit and remain out if it does not. Firm 1 will choose
thek1 that maximises total payoff given firm 2’s optimal response. It will be
assumed that this will always be positive, such that exit is never optimal for
firm 1.
( I ) ( II )
Figure 3.3: Typical reaction functions for firm 1 and 2.
By the assumptions of the profit functions, the firms’ reaction functions are
as illustrated in figure 3.3 above. In figure 3.3 (I) two reaction functions for
the incumbent are drawn. The curve NN’ represents the low marginal cost w1
while the curve MM’ is the case where firm 1 has high marginal costs, w1 + r1.
The first curve is relevant when firm 1’s production is lower or equal tok1,
and the latter otherwise. The incumbent’s reaction function is thus given by
the kinked curve shown in thick lines. The reaction function for the entrant is
shown in (II). Let the points M and N have respective co-ordinates (M1, 0) and
q2
q1k1
q2
q1

52
(N1, 0). These two points are interpreted as the profit maximising quanta if
firm 2 does not produce any output. The first point is the profit maximising
point when the cost of increasing capacity is relevant, while the latter is
profit maximising when this cost is not the case.
The reaction function for the potential entrant behaves more naturally.
It is assumed that this reaction function, RR’ crosses both NN’ and MM’.
Equilibrium is found where the reaction functions intersect. Since firm 1 can
decide its first stage production capacity,k1, the incumbent can to a certain
degree influence the equilibrium of the game.
The point T is assumed to have the co-ordinates (T1, T2) and
correspondingly the point V has the co-ordinates (V1, V2). Ifk1 ≤ T1 it is clear
that the Cournot equilibrium will be at point T. It will be optimal for the
incumbent to increase his capacity to the point T1, if he has installed less
than this in the first stage. Also, building a larger capacity than V1 in the first
stage is not a credible threat, as the entrant will know that the incumbent’s
best response here is V1. It follows that the established firm under no
circumstance will set a higher capacity than V1, and that the optimalk1 can
be found in the interval [T1, V1]. In this interval the incumbent firm can act as
a quantity leader, which leads to the point that any capacity level within this
interval is a credible output level for the incumbent following an entry. An
incumbent monopolist will thus always set his pre-entry capacity within this
interval and produce this quantity if the entrant decides to enter.
We would now like to find equilibrium in this game. As we have seen
above, at all points that are ever going to be observed with or without entry,
the incumbent will always produce an output equal its pre-entry chosen
capacity. Thus, we can write the firms profit functions as
.)(),(),( 2121 iiiiii qrwfqqRqq +−−=π
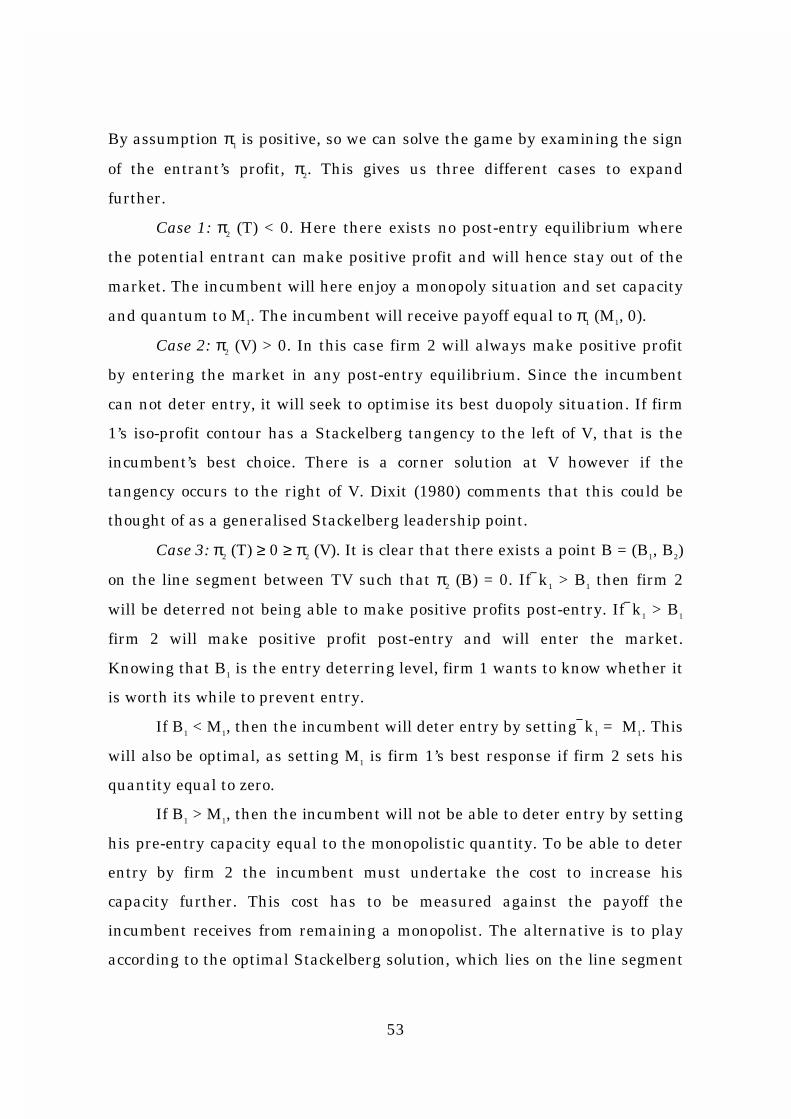
53
By assumption π1 is positive, so we can solve the game by examining the sign
of the entrant’s profit, π2. This gives us three different cases to expand
further.
Case 1: π2 (T) < 0. Here there exists no post-entry equilibrium where
the potential entrant can make positive profit and will hence stay out of the
market. The incumbent will here enjoy a monopoly situation and set capacity
and quantum to M1. The incumbent will receive payoff equal to π1 (M1, 0).
Case 2: π2 (V) > 0. In this case firm 2 will always make positive profit
by entering the market in any post-entry equilibrium. Since the incumbent
can not deter entry, it will seek to optimise its best duopoly situation. If firm
1’s iso-profit contour has a Stackelberg tangency to the left of V, that is the
incumbent’s best choice. There is a corner solution at V however if the
tangency occurs to the right of V. Dixit (1980) comments that this could be
thought of as a generalised Stackelberg leadership point.
Case 3: π2 (T) ≥ 0 ≥ π2 (V). It is clear that there exists a point B = (B1, B2)
on the line segment between TV such that π2 (B) = 0. Ifk1 > B1 then firm 2
will be deterred not being able to make positive profits post-entry. Ifk1 > B1
firm 2 will make positive profit post-entry and will enter the market.
Knowing that B1 is the entry deterring level, firm 1 wants to know whether it
is worth its while to prevent entry.
If B1 < M1, then the incumbent will deter entry by settingk1 = M1. This
will also be optimal, as setting M1 is firm 1’s best response if firm 2 sets his
quantity equal to zero.
If B1 > M1, then the incumbent will not be able to deter entry by setting
his pre-entry capacity equal to the monopolistic quantity. To be able to deter
entry by firm 2 the incumbent must undertake the cost to increase his
capacity further. This cost has to be measured against the payoff the
incumbent receives from remaining a monopolist. The alternative is to play
according to the optimal Stackelberg solution, which lies on the line segment

54
x2 = 0
p2
p1
N’ M’
NM
R
R’
x1 =k1
TV
TV. Assume this Stackelberg solution is given by the point S = (S1, S2). To
determine the best choice for the incumbent we have to compare π1 (S) against
π1 (B). If π1 (S) < π1 (B1, 0) it is optimal to prevent entry and set first stage
capacityk1 = B1. On the other hand, if π1 (S) > π1 (B1, 0) it is optimal to allow
entry and setk = S1.
Following Dixit (1980) we can modify the model to include a Betrand
equilibrium in the post-entry game. He comments that some added
complications can arise due to possible non-convexities even with reasonable
demand and cost functions, but this will be ignored here and only the
simplest case will be shown.
Figure 3.4 Bertrand Nash Equilibrium.
Once again RR’ gives the potential entrant’s reaction function. The
incumbent has two reference curves, MM’ and NN’, the former when
expansion costs matter and the latter when they do not. The curve MM’ is
relevant when x1 >k1 while the curve NN’ holds when x1 ≤k1, where x1 is
found from the demand function D1(p1,p2). The curve ‘x1 =k1’ is shown for a
particular k1, which gives the incumbent’s reaction curve shown in thick

55
lines. In the post-entry Bertrand equilibrium firm 1 can secure any point
along the segment TV of the potential entrant’s reaction function. Dixit
(1980) notes that “[o]nce again, we observe a limited leadership possibility
arise by virtue of the established firm’s advantage in being the first to make a
commitment to capacity”.
The main theme of this model is that an irrevocable commitment of
investment can be a credible threat to deter entry from a newcomer. We
observe that whichever post-entry game is played, the incumbent can
influence the outcome by making a pre-commitment in capacity. Strategic
investments can thus be used for the established firm to remain the sole
player and earn monopoly profits. Worth noting is also that the incumbent
can alter the conditions of the post-entry game to his advantage, even if it is
optimal to let the newcomer enter.
The model I have presented here is equipped with the simplest
scenario, one incumbent and one potential entrant. What happens when we
allow for several incumbents facing potential entry from one entrant? When
there are several incumbents, entry prevention can become a free rider
problem as the established players have an incentive to “cheat” on the others
and not participate in the costly action of overinvestment to deter entry. A
formal model elaborating this will not be discussed here, but Gilbert and
Vives (1986) show that although incumbent firms do not act co-operatively,
underinvest in entry deterrence does not occur. They point out that
incumbents may find themselves in a Pareto dominated arrangement (in
terms of profit) by preventing entry. Another free rider problem can arise
when several incumbents acting noncooperatively face multiple potential
entrants. Eaton and Ware (1987), who look at a generalisation of Dixit (1980),
find that this problem is not an important factor. This is however criticised by
Waldman (1991). He shows that by changing Eaton and Ware’s (1987)
assumption of decreasing average capacity costs and allowing them to be

56
increasing, the free rider problem can become an important factor. Waldman
(1991) argues that this leads to firms underinvesting in entry deterrence.
The strategic results of the capital commitment model rest on the
assumption that only the incumbent firm bears sunk cost through
installation of capacity. Ware (1984) notes that if installed capacity is sunk
cost, which is must be for the incumbent to acquire any strategic advantage
at all, then the entrant’s capacity is equally sunk, and must also be
committed before production. If this observation is correct, our first model
should be extended to include another stage prior to the stage with post-entry
Cournot competition28. The final-period should therefore involve both firms
incurring only variable costs, conditional on their sunken capacity. This
reduces the strategic asymmetry for the incumbent, but he can still maintain
a strategic advantage because he sinks his capacity first. Ware (1984)
specifies a model where the incumbent commits his sunk cost first. If the
entrant decides to enter, he will follow and install his capacity. Finally
quantity equilibrium is established based on the sunken capacity of the two
firms. The game can be solved backwards and a perfect equilibrium
identified. Compared to Dixit (1980), Ware (1984) finds that the strategic
advantage available to the incumbent is lessened as there is less inequality
between the output and profits of the two firm compared to the results
showed earlier. The qualitative results are however similar and do not alter
the conclusions we made of entry deterrence. But Ware (1984) notes that
accommodation is a less likely outcome in the four-stage model if entry
deterrence is feasible. This is because profits post-entry are lower in this
model for the incumbent, whereas profits under entry deterrence are
unchanged.
28 Ware presents a three-stage game in contrast to Dixit’s two-stage game. Following myprevious notes I will see this as four-stage game.

57
3.6 DURABILITY OF CAPITAL AS A BARRIER TO ENTRY
The commitment value of capital as a barrier to entry can depend on the
extent to which the capital is sunk. In this section I will present a model
where capital is sunk only on a short-term basis. Eaton and Lipsey (1980)
presented this idea in two models, examining how the durability of capital
can influence entry deterrence. I will focus on the second model (“maintaining
plant”) but briefly sum up the findings from the first (“one-hoss shay
capital”). In the first model capital is sunk only in the short run and must be
“renewed” periodically. There is room for only one firm in this market, which
will be the equilibrium. The basic idea is that strategic renewal of capital will
deter potential entrants from taking over the incumbent’s position. There
exists a capital element, for instance a chemical carrier and only one unit of
capital is necessary to supply the market demand. The incumbent in this
market has a carrier of some durability. If the incumbent does not replace
this carrier before it expires, it will for certain be profitable for an entrant to
enter with a new carrier just before the monopolist replaces his. Eaton and
Lipsey (1980) show that the incumbent resolves this by replacing his carrier
before the old one expires, at such a time that an entrant will not find it
profitable to enter.
In the second model the capital requires maintenance affecting the
incumbent’s choice of maintenance level. Once again we think of capital as a
chemical carrier to pep up the presentation. I assume capital costs K, where
K > 0, and that maintenance costs, m, are a convex function of age of plant, a:
.0)('' ,0)(' ),( ≥>= agagagm
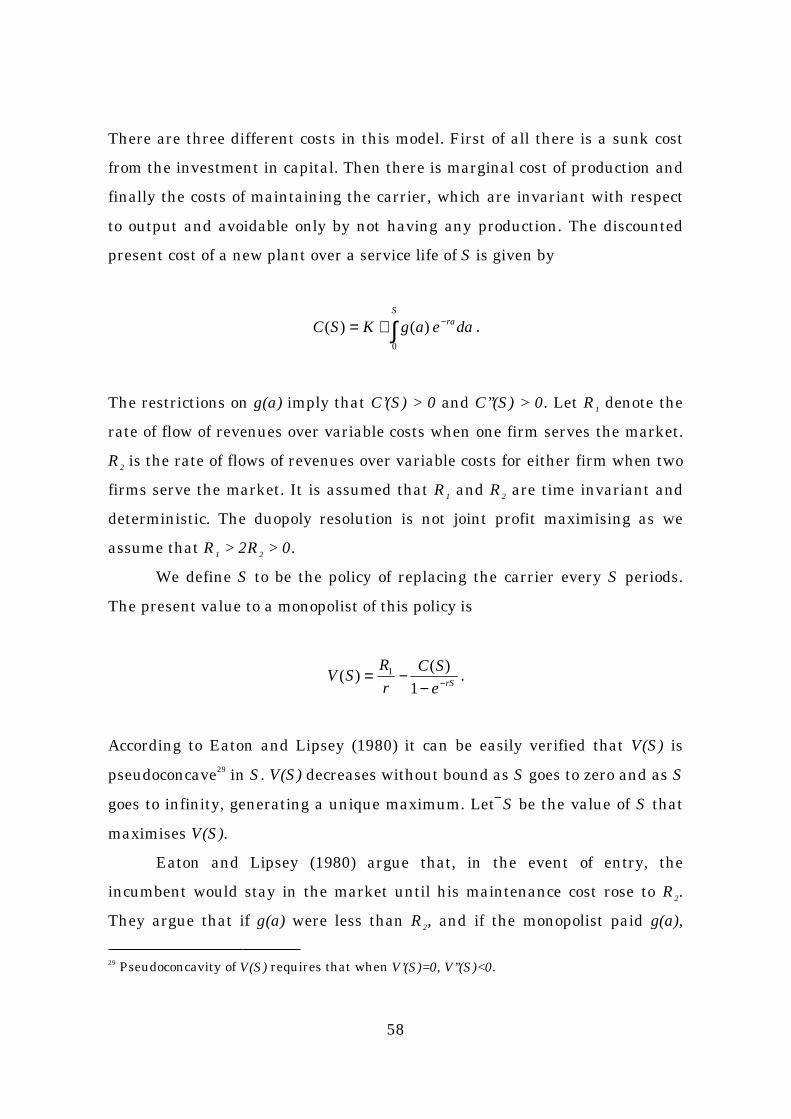
58
There are three different costs in this model. First of all there is a sunk cost
from the investment in capital. Then there is marginal cost of production and
finally the costs of maintaining the carrier, which are invariant with respect
to output and avoidable only by not having any production. The discounted
present cost of a new plant over a service life of S is given by
daeagKSC raS
−∫+= )()(0
.
The restrictions on g(a) imply that C’(S) > 0 and C’’(S) > 0. Let R1 denote the
rate of flow of revenues over variable costs when one firm serves the market.
R2 is the rate of flows of revenues over variable costs for either firm when two
firms serve the market. It is assumed that R1 and R2 are time invariant and
deterministic. The duopoly resolution is not joint profit maximising as we
assume that R1 > 2R2 > 0.
We define S to be the policy of replacing the carrier every S periods.
The present value to a monopolist of this policy is
rSe
SC
r
RSV −−
−=1
)()( 1 .
According to Eaton and Lipsey (1980) it can be easily verified that V(S) is
pseudoconcave29 in S. V(S) decreases without bound as S goes to zero and as S
goes to infinity, generating a unique maximum. LetS be the value of S that
maximises V(S).
Eaton and Lipsey (1980) argue that, in the event of entry, the
incumbent would stay in the market until his maintenance cost rose to R2.
They argue that if g(a) were less than R2, and if the monopolist paid g(a),
29 Pseudoconcavity of V(S) requires that when V’(S)=0, V’’(S)<0.

59
then he and the entrant would face identical avoidable costs, the resolution of
the duopoly problem would be symmetric, and the monopolist would enjoy the
flow R2; therefore the incumbent will incur the maintenance costs if and only
if g(a) ≤ R2. Alternatively, in the event of entry the incumbent could sign a
binding maintenance contract with a third party, his avoidable costs would
then be just the marginal cost of production. An optimal maintenance
contract would run until g(a) = R2.
We let A be the age of the carrier such that g(A) = R2. If the incumbent
chooses a policy S ≤ A, his minimum commitment to the market is A – S. If he
chooses S > A, his minimum commitment to the market is zero. Eaton and
Lipsey (ibid.) go on to seek the existence of a policy S* which solves
subject to
≤ ,0*),(
)( max
SSE
SVS
(1)
where
A.S
A,S
*),(
,)(*)(*),( 0
21
>≤
−−
= ∫−
−
if
if
SV
dteRRSVSSE
SArt
(2)
E(S, S*) is interpreted as the present value of an entrant pursuing policy S*
when the monopolist’s policy is S.
Eaton and Lipsey (1980) discuss several cases and first draw attention
to the case where the incumbent adopts a policyS. From (2) it is clear that if
A is large enough relative toS, the incumbent need not pursue an active
policy of entry prevention. We letA be the value of A in (2) such that
E(S,S). Then, if A ≥A, S* =S, and entry prevention is without costs.
In the next case we denote S1 and S2 the minimum and maximum
values of S such that V(S) = 0. Pseudoconcavity of V(S) then implies that

60
V(S) > 0 in the open interval ( S1, S2) and V(S) < 0 for S < S1 and for S > S2.
When A ≤ S1, the constraint in (1) cannot be satisfied in the profitable range
of production. Thus S* = S1 and S* = S2 are the only solutions to the problem
posed in (1) and V(S*) = 0. In this case it is clear that the use of prepaid
maintenance contract to deter entry is the preferred strategy (ibid.).
Finally, and for us most relevant, is the case when S1 < A <A.
E(S1,S1) <0, since S1 < A, and E(S,S )> 0, since A <A. Both V(S) and E(S,S*)
are increasing in S when S1 < S <S, and thus S* must satisfy E(S,S*) = 0.
Since E(S,S) is increasing in S in this interval, there exists a unique S*,
S1 < S* <S such that E(S*,S*) = 0. It can be shown that S* is the unique
entry preventing policy, which maximises the incumbent’s present value
evaluated at any point in time. Since S* <S, the carrier is replaced before its
economically useful life is over. We have seen here that when an active policy
of entry deterrence is necessary, the incumbent has two options, both of
which require the replacement of capital before its economically useful life is
over. This could also be interpreted as “too well maintained” capital as Eaton
and Lipsey (1980) note. This means that the incumbent uses more resources
on capital maintenance than is actually necessary if he were cost minimising.
The extra resources used to maintain the carrier are thus to deter potential
entrants.
In this model greater durability implies greater strategic advantage to
incumbent firms, so that firms will choose capital that is “too durable,”
maintain it “too well,” or replace it “too soon.” Davies (1991) shows in
contrasts that even though a very brief commitment to capital conveys no
strategic advantage to incumbency, if the commitment is large relative to
short-term profits, it allows the lower-cost firm to deter entry and earn
monopoly profits. The consequence is that neither incumbency nor the order
of moves has any affect on a firm’s ability to deter entry, and according to
Davies (1991) there exist several equilibria when costs are symmetric. She
61
finds, however, that a small cost advantage gives rise to a unique
equilibrium: the lower-cost firm deters entry and charges the monopoly price.

62

63
CHAPTER FOUR
TACIT COLLUSION
Chemicals shipping is dominated by four companies, which to a different
extent provide global tanker services. As described in chapter two, the
leading operators compete on several distinct geographical routes, sometimes
along other smaller operators. When few firms compete in one or several
distinct markets this could influence market behaviour, as players obviously
would benefit from “softer” competition. This can be achieved through tacit
collusion, where the players can increase their profits without explicit
communication. I will again take a normative approach and derive optimal
behaviour for firms in the described setting. It will be shown that tacit
collusion can be sustained when players meet repeatedly in one market and
that multimarket contact can enhance the sustainability of tacit collusion.
4.1 TACIT COLLUSION
Firms in a market would like to collude as it gives them an opportunity to
manipulate the market price and thereby increase their profits. Rees (1993)

64
splits the concept of collusion into two elements. First there is a process of
communication. Here information is exchanged and discussed with the aim of
reaching an agreement. The second element consists of a mechanism to
punish any violation of the agreement to secure its enforcement. In most
cases however explicit collusion is illegal, excluding legally binding
agreements. But this can be overcome if the players can sustain tacit
collusion. Is it possible that firms could co-ordinate their activities without
explicit communication and discussion? Rees (1993) gives a simple example of
a market where it tacitly has become practise to match the price changes of
the largest firm. This makes collusion difficult to disclose, as long as it is
more profitable for a firm to continue this practise than to defect.
Rees (1993) discusses shortly if one can ever talk of tacit collusion.
Could it not be that a case that appears to be tacit collusion in reality is
explicit collusion in which the process of agreement is simply concealed? His
main point30 is that hindering “innocent” business meetings, even if they end
up in connivance to restrict competition is almost impossible. I will leave this
digression here and refer to this behaviour as tacit collusion in the further
discussion.
One of major problems with collusion is that there exists an incentive
to renege on an agreement. I will review this problem in a one-shot game,
which will show that collusion is not sustainable if competitors meet only
once in the market. This conclusion can be extended to a finitely repeated
game. To simplify the analytical framework, I assume the usual Cournot
model with two rivalling firms setting quantity as their strategic variable.
This is consistent with chapter three where the incumbent and the potential
entrant engaged in quantity competition post-entry. Kreps and Scheinkman
(1983) showed that a game where firms build capacity in the first period and
then set price in the second, under specific circumstances was equivalent to a
30 Rees is here referring to a famous statement by Adam Smith.

65
one-stage quantity game. Cournot developed this model in 1838, but the
analytical description in the next section will be based on Gibbons (1992) and
Tirole (1988).
After reviewing the one-shot game I turn to the theory of infinitely
repeated games to show how tacit collusion can be sustained. We will
continue to study the Cournot quantity game, but replicate it an infinitely
number of times. These repeated games are often called supergames. The
main difference from the one-shot game is that credible threats about a
player’s future behaviour can be made in this setting, which will influence his
current behaviour.
4.2 ONE SHOT GAME: COURNOT-NASH EQUILIBRIUM
We have two firms producing an identical product. Let their produced
quantity be noted q1 and q2 respectively. The market-clearing price is given by
the function P(Q), where Q is total quantity produced (q1+q2). It is further
assumed that the firms have identical cost structure. Both firms maximise
their profit function given the quantity of the other
).(qCP(Q) max iii −⋅=∏ i
q
q
i
The strategic edge here is of course that the firms have to choose their
respective output without observing the other’s choice, i.e. they choose their
quantities simultaneously. Assuming that the profit function is strictly
concave in qi and twice differentiable, we get the first order condition:
.0)( =∂∂
−⋅∂∂+=
∂Π∂
i
ii
ii
i
q
Cq
q
PQP
q

66
q2
q1
R2R1
q*
2
q*
1
We can solve this for qi and get firm i’s reaction curve:
).( jii qRq =
The reaction curve gives the optimal quantity produced for a fixed quantity of
the rival firm. It depicts how a firm will react given various beliefs it might
have about the other firm’s choice. If we depict the two firms’ reaction curves
we find the Cournot-Nash equilibrium as shown in figure 4.1 below.
Figure 4.1
It is assumed that the system is stable, so that equilibrium is given by
q*
1 and q*
2. We see that the reaction curve has a negative slope, indicating
that if the rival firm increases its production, it is optimal for the other firm
to lower its own production; i.e. the choice variables are strategic substitutes.
Problems arise because there exists a negative externality between the firms.
When choosing his output, firm i will take into account the adverse effect of
the market-price change on its own output, rather than the effect on
aggregate output (Tirole, 1988). This leads to each firm choosing an output

67
that exceeds the optimal output from the industry’s point of view. As Tirole
(1988) remarks ”[ ] the market price will be lower than the monopoly price,
and the aggregate profit will be lower than the monopoly profit”. One can also
note that this equilibrium does not equalise marginal cost, such that not only
is too little produced, but the industry’s cost of production is not minimised.
It is clear that if they could, the two firms involved would want to
operate as a cartel, gaining each ½ of the monopoly profits. Why don’t they?
The problem is the lack of credible punishments if one of the players should
deviate. A legally binding agreement to co-operate is usually prohibited thus
making open collusion impossible. The only way to increase their profits is to
enter a secret or tacit agreement. What would happen if they tried to enter a
tacit “understanding”? We can think of this as a game where the duopolists
have reached a secret agreement and are about to meet in the market. They
have two strategies, act according to the agreement31 or defect and play
according to their reaction curve. We can illustrate this game on normal form
with the players’ pure strategies.
Figure 4.2
31 This is of course to play the monopoly quantity divided by two.
Collude Defect
Collude
Defect
Firm 2
Firm 1
Π3 , Π3 Π1 , Π4
Π4 , Π1 Π2 , Π2

68
To solve this game we look for the Nash equilibrium. The payoff for each
player is to be interpreted in the following way. Π4 is the highest payoff and is
received when your rival co-operates and you defect. Your rival then receives
Π1, which is the lowest payoff possible. Π3 is the second highest payoff and is
the payoff both players obtain when they act as a cartel, thus receiving ½ of
the monopoly profits. Π2 is the second lowest payoff and will naturally be the
profit a player earns in a Cournot equilibrium. This is a version of the
“classic” Prisoners’ Dilemma game (Gibbons, 1992) and the solution is easy to
elaborate. The strategy “Collude” is strictly dominated for each player by
“Defect”, thus leading to the sub-optimal outcome “Defect, Defect” as the
Nash equilibrium. Since both players have an incentive to defect a collusive
agreement is not possible. This argument can easily be extended to a game
over a finite number of periods (Gibbons, 1992).
4.3 TACIT COLLUSION IN AN INFINITELY REPEATED GAME
We start with the same simple setting as in the last section, a two-player32
game with Cournot competition. But we now assume that the two players
meet an infinitely number of times in the market. To find equilibrium we
need each player to have a strategy set based on the player’s information in
period t. The strategy set gives quantity in each period as a function of the
player’s information. We assume that all past quantities and prices are
common knowledge among the two players. The payoff for player i is the sum
of the discounted single-period profits
32 The result can easily be extended to an n-player game.

69
( )tj
tii
t
t qq ,1
1πδ∑∞
=
− .
δ is the discount factor each period33, while q1 and q2 give the quantity
produced in period t by the two players. We further assume that the firms
produce homogenous products hence the profit function is
( ) ( ) ( )ti
ti
tttj
tii qCqqqPqq −⋅+≡ 21,π .
To solve this game and find a Nash-equilibrium that is also a subgame
perfect equilibrium we have to make some assumptions about the simple
stage game outcomes. Let qs note the static Nash equilibrium quantity, which
can be mathematically defined as:
( )si
s qqq ,maxarg π∈ .
Furthermore let qm represent the joint profit-maximising defined by:
( )im qqq ,maxarg π∈ .
We now have to define a strategy for the players in this game. It is assumed
that the players play according to the following grim trigger strategy. In the
first period they both play a quantity q0, where q0 is defined as
[ )sm qqq , 0 ∈
In the rest of the game the players set quantity in each period to
33 δi ∈ (0,1).

70
, 2 1, i ,2 otherwise; q
or ,1 if si
00
=≥
∀−≤∀=
t
jtqqq j ττ
where τ represents the previously played stages in the game. The following
definitions are made of the firms profit functions:
( ) ( ) ( )( ) ( ) ( ) where)()()(*
21
jjjji qCqqqPq
qCqqqPq
ϕϕϕππ
−+≡
−+≡
( )tj
tiij qqq ,maxarg)( πϕ ∈ .
The second definition maximises player i’s current profit by playing best
response when the other player produces q. We set up the following necessary
and sufficient conditions for this strategy to be a subgame perfect
equilibrium. First we consider period 1 or a period t history such that
.,10 jtqqj ∀−≤∀= ττ For this to be a subgame perfect equilibrium we require
that
( ) ( ) ( )q
q
i
si
i
∀−
+≥− δ
πδπ
δπ
110*
0
or
( ) ( )( ) ( )si
ππππδ
−−≥
0*
00*
.
Second we consider a history such that j somefor and 1 somefor 0 −≤≠ tqqj ττ
( ) ( ) ( )q
qqq
q
i
sis
ji
s
∀−
+≥− δ
πδπ
δπ
1,
1.

71
This strategy profile is a subgame perfect equilibrium if:
( ) ( )( ) ( ) 2,1
,
,=∀
−−
≥ iqqq
qqqss
j
ssj
i ππππ
δ .
We can observe here that a tacit collusion is self-enforcing if δ is close to one.
This means that if these conditions are met, a cartel can be sustainable
without the need of direct communication. Critics of this model have pointed
to the fact that the grim trigger strategy is not renegotiation-proof. This
means that once one of the parties has defected they both have an incentive
to sit down and negotiate a new deal. Abreu (1986) showed that there existed
more severe punishments to deter defection, but this will not be elaborated
further in this thesis.
4.4 MULTIMARKET CONTACT
In chapter two it was noted that the chemical companies competed on several
distinct geographical markets, which could be compared to the airline
industry as airlines normally compete on several different destinations. The
influence multimarket contact could have on market competition was first
presented by Corwin Edwards, who eloquently stated that “[w]hen one large
conglomerate enterprise competes with another, the two are likely to encounter
each other in a considerable number of markets. The multiplicity of their
contact may blunt the edge of their competition”. (Corwin Edwards quoted in
Bernheim and Whinston (1990)) Although Edwards was thinking of
conglomerates, this also applies to “single-product” firms that operate in a
number of distinct geographical markets. Edwards’ statement seems like a
plausible observation, but we need a more formal understanding of how

72
multimarket contact affects competition. I will present a model by Bernheim
and Whinston (1990), who were some of the first to explore multimarket
contact in a theoretical model. This will show how firms can take advantage
of multimarket contact and enhance their ability to sustain non-competitive
outcomes. Relating it to the previous sections, multimarket contact can thus
make tacit collusion easier to sustain.
We have previously looked at quantity competition and the Cournot
equilibrium. In this setting however, we examine competition between
established players and will simplify this to a game of price competition. This
means that we take their quantities for given and concentrate on the second
stage game where competitors set prices. This introduces a simple model of
multimarket contact with repeated (Bertrand34) price competition.
It is easy to see that multimarket contact cannot reduce firms’ abilities
to collude when markets are not inherently linked. Since firms can always
treat each market in isolation the set of subgame perfect equilibria cannot be
reduced by the introduction of multimarket contact. The basic idea is that
multimarketcontact makes collusive outcomes easier to sustain because there
is more scope for punishing deviation in one market. We start by showing
what Bernheim and Whinston (1990) call the irrelevance result.
We assume N firms with differentiated products. Let Pi* denote price
set by firm i in the static Bertrand equilibrium. Pi’ gives the price firm i sets
according to a cartel agreement. Let δ be the discount factor and Ri (P’-i) be
firm i’s reaction curve if all other firms set price equal to P’. If there exists
only one market, a cartel will be sustainable if
δδππ
δπ
−+≥
− −− 1)),((
1
1 *'''iiiiii PPR . (1)
34 When firms are identical the static Bertrand equilibrium is distinguished by price equal tomarginal cost. For a short introduction to the Bertrand-game, see for instance Tirole (1988).

73
Let Pi’ be the minimum of {Pi
m,Pi
+), where Pi
m is the monopoly price and Pi
+ is
the highest price where (1) is valid. We can say that the price Pi’ is a function
of the monopoly price and the discount factor.
We now expand this model and assume that all N firms operate in K
markets. Each firm follows a simple grim trigger strategy. This means that if
one firm deviate in one market, labelled k it will be followed by punishment
in all K markets35. The condition for sustainable cartel equilibrium is thus
given by
∑ ∑= =
−−
−+≥
−
K
k
K
k k
kikikikikik
kik PPR
1 1
*'''
1)),((
1
1
δδ
ππδ
π (2)
We assume further that all firms have the same technology, that all markets
are identical and that the discount factor is the same for all markets. Then
(2) can be transformed to
[ ]
−⋅+⋅≥
−⋅ −− δ
δππδ
π1
)),((1
1 *'''iiiiii KPPRKK . (3)
As shown in (3) and in Bernheim and Whinston (1990), both gain and loss
from deviation can be multiplied with the total number of markets in which
the firms compete. This means that multimarket contact has no relevance for
sustaining a cartel. Bernheim and Whinston call this the irrelevance result.
In this simple model multimarket contact does not facilitate collusive
behaviour. If the discount factor is too low it is impossible to sustain collusion
in any markets. If the discount factor is sufficiently close to one tacit collusion
is sustainable even without multimarket contact. It is important to note the
35 The punishment is playing the static Bertrand equilibrium.
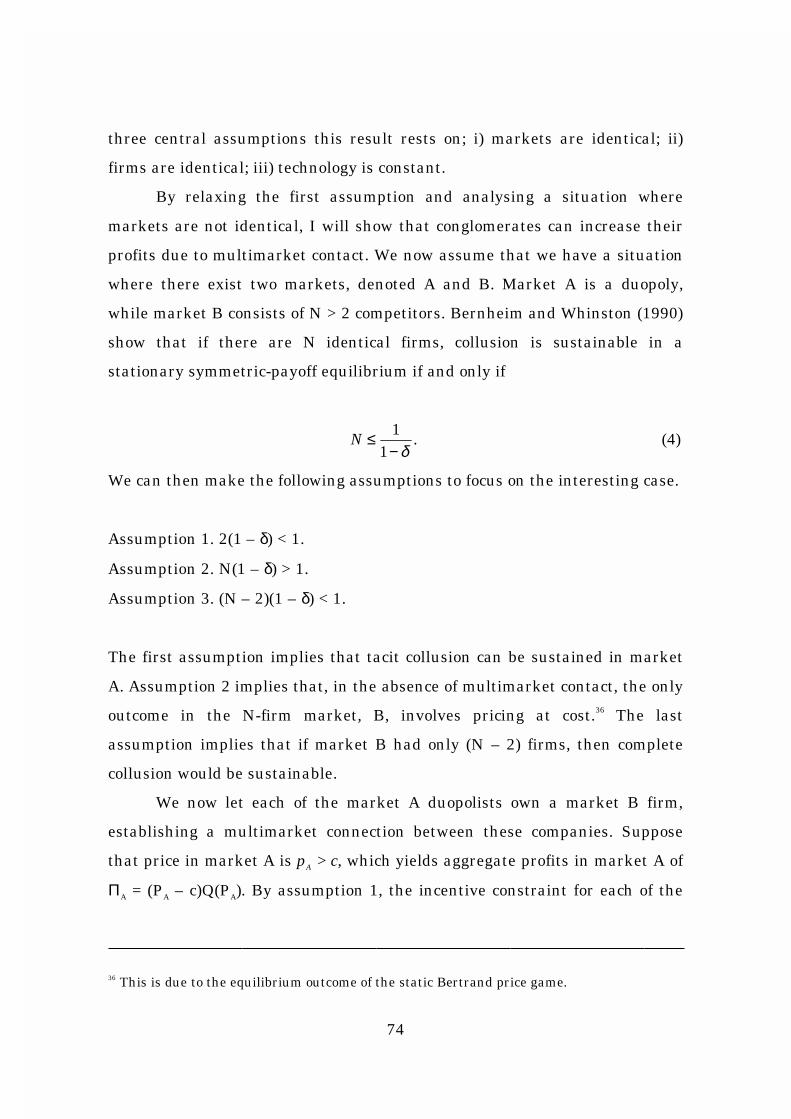
74
three central assumptions this result rests on; i) markets are identical; ii)
firms are identical; iii) technology is constant.
By relaxing the first assumption and analysing a situation where
markets are not identical, I will show that conglomerates can increase their
profits due to multimarket contact. We now assume that we have a situation
where there exist two markets, denoted A and B. Market A is a duopoly,
while market B consists of N > 2 competitors. Bernheim and Whinston (1990)
show that if there are N identical firms, collusion is sustainable in a
stationary symmetric-payoff equilibrium if and only if
.1
1
δ−≤N (4)
We can then make the following assumptions to focus on the interesting case.
Assumption 1. 2(1 – δ) < 1.
Assumption 2. N(1 – δ) > 1.
Assumption 3. (N – 2)(1 – δ) < 1.
The first assumption implies that tacit collusion can be sustained in market
A. Assumption 2 implies that, in the absence of multimarket contact, the only
outcome in the N-firm market, B, involves pricing at cost.36 The last
assumption implies that if market B had only (N – 2) firms, then complete
collusion would be sustainable.
We now let each of the market A duopolists own a market B firm,
establishing a multimarket connection between these companies. Suppose
that price in market A is pA > c, which yields aggregate profits in market A of
ΠA = (PA – c)Q(PA). By assumption 1, the incentive constraint for each of the
36 This is due to the equilibrium outcome of the static Bertrand price game.

75
multimarket firms in market A is not binding. This gives us that the net gain
of deviating for each conglomerate is
.01
1
2
11 <
−−Π
δA (5)
The multimarket firms can potentially use this slack enforcement power to
induce a partially or completely collusive outcome in market B. Bernheim
and Whinston (1990) show how this outcome can occur. Each multimarket
firm sets output so that the market share of market B is less than (1 / N).
This leaves the firms operating in market B only, with a greater share of the
market. A single firm, i, with market share λi will not undercut a price
pB ∈ (c, pm] if and only if
( ) ( ) ( ) ( )BBiBB pQcppQcp −
−≤− λ
δ1
1, (6)
or
( )δλ −≥ 1i . (7)
We see that if the market share of the single-market firms is at least (1 – δ),
they will not undercut a collusive arrangement.
But this strategy violates the market B incentive constraint for each of
the multimarket companies. Suppose that the price in market B is pB, then if
the multimarket companies each have a market share of λC the net gain from
deviating in market B (considered in isolation) is
,1
11
−−Π
δλCB (8)
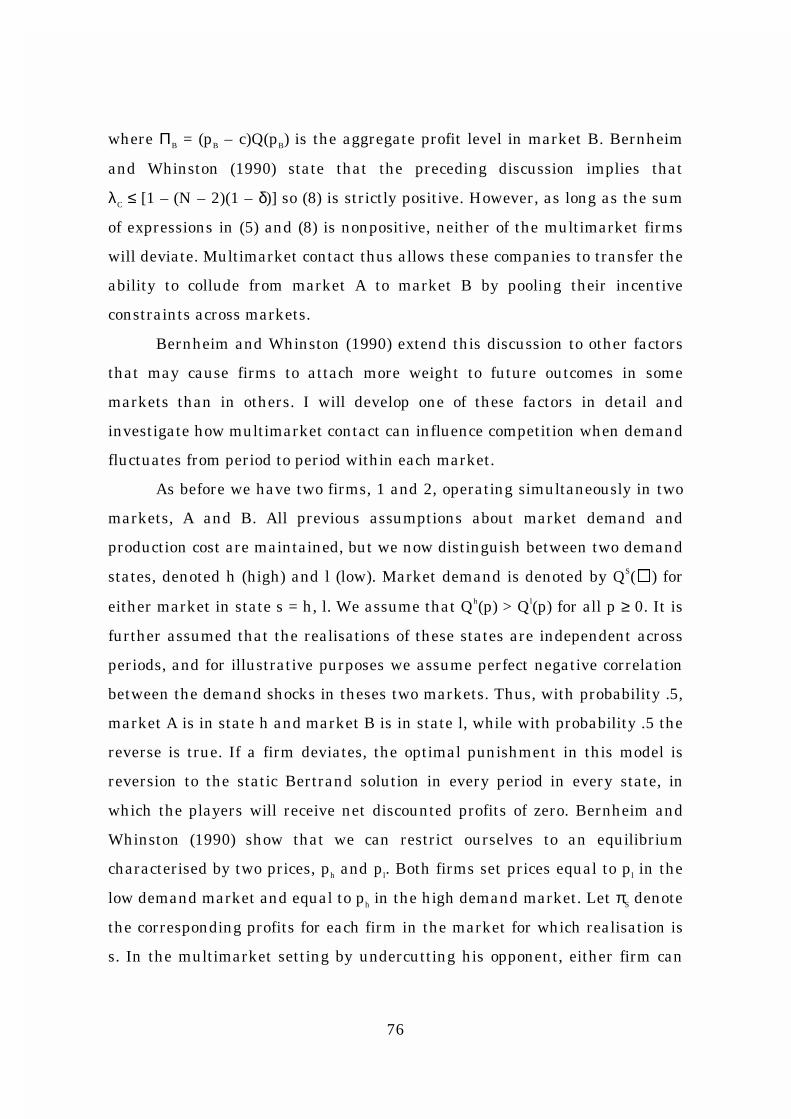
76
where ΠB = (pB – c)Q(pB) is the aggregate profit level in market B. Bernheim
and Whinston (1990) state that the preceding discussion implies that
λC ≤ [1 – (N – 2)(1 – δ)] so (8) is strictly positive. However, as long as the sum
of expressions in (5) and (8) is nonpositive, neither of the multimarket firms
will deviate. Multimarket contact thus allows these companies to transfer the
ability to collude from market A to market B by pooling their incentive
constraints across markets.
Bernheim and Whinston (1990) extend this discussion to other factors
that may cause firms to attach more weight to future outcomes in some
markets than in others. I will develop one of these factors in detail and
investigate how multimarket contact can influence competition when demand
fluctuates from period to period within each market.
As before we have two firms, 1 and 2, operating simultaneously in two
markets, A and B. All previous assumptions about market demand and
production cost are maintained, but we now distinguish between two demand
states, denoted h (high) and l (low). Market demand is denoted by QS(�) for
either market in state s = h, l. We assume that Qh(p) > Ql(p) for all p ≥ 0. It is
further assumed that the realisations of these states are independent across
periods, and for illustrative purposes we assume perfect negative correlation
between the demand shocks in theses two markets. Thus, with probability .5,
market A is in state h and market B is in state l, while with probability .5 the
reverse is true. If a firm deviates, the optimal punishment in this model is
reversion to the static Bertrand solution in every period in every state, in
which the players will receive net discounted profits of zero. Bernheim and
Whinston (1990) show that we can restrict ourselves to an equilibrium
characterised by two prices, ph and pl. Both firms set prices equal to pl in the
low demand market and equal to ph in the high demand market. Let πS denote
the corresponding profits for each firm in the market for which realisation is
s. In the multimarket setting by undercutting his opponent, either firm can
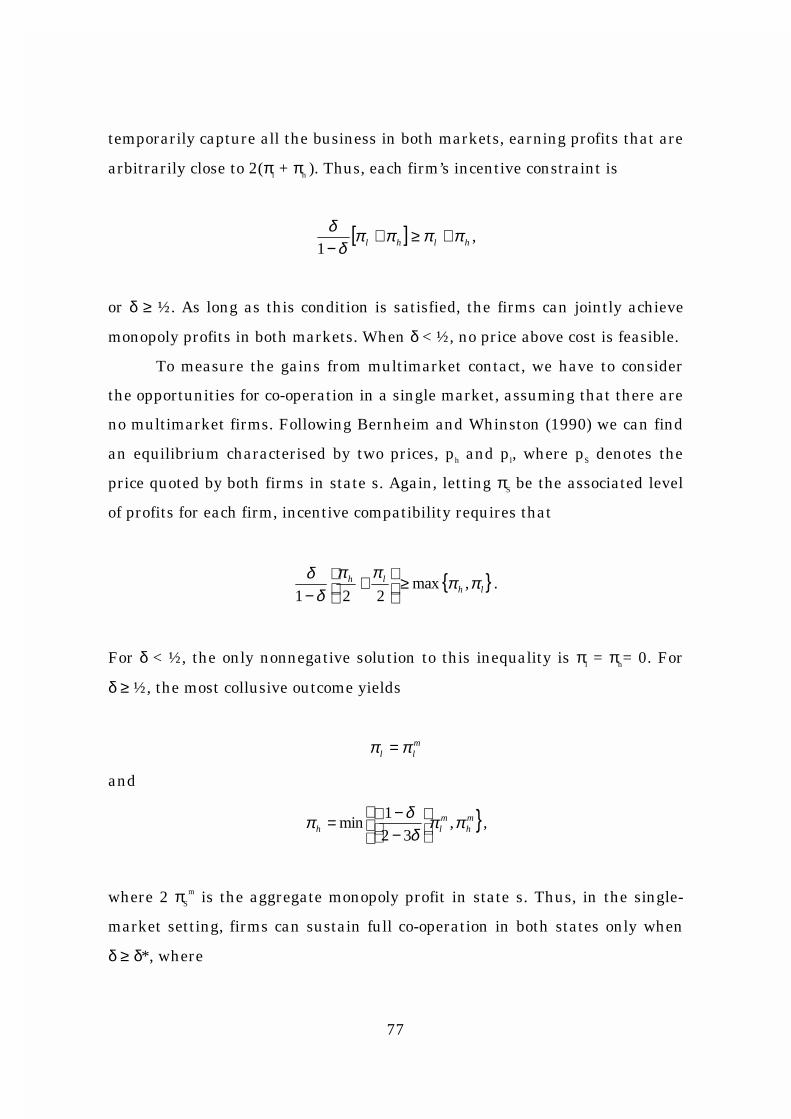
77
temporarily capture all the business in both markets, earning profits that are
arbitrarily close to 2(πl + πh ). Thus, each firm’s incentive constraint is
[ ] hlhl ππππδ
δ +≥+−1
,
or δ ≥ ½. As long as this condition is satisfied, the firms can jointly achieve
monopoly profits in both markets. When δ < ½, no price above cost is feasible.
To measure the gains from multimarket contact, we have to consider
the opportunities for co-operation in a single market, assuming that there are
no multimarket firms. Following Bernheim and Whinston (1990) we can find
an equilibrium characterised by two prices, ph and pl, where pS denotes the
price quoted by both firms in state s. Again, letting πS be the associated level
of profits for each firm, incentive compatibility requires that
}{ lhlh ππ
ππδ
δ, max
221≥
+
−.
For δ < ½, the only nonnegative solution to this inequality is πl = πh= 0. For
δ ≥ ½, the most collusive outcome yields
mll ππ =
and
}
−−= m
hmlh ππ
δδπ ,32
1min ,
where 2 πS
m is the aggregate monopoly profit in state s. Thus, in the single-
market setting, firms can sustain full co-operation in both states only when
δ ≥ δ*, where

78
21*
3
2>
−−
=ml
mh
ml
mh
ππππ
δ .
We see that for ½ ≤ δ < δ*, multimarket contact increases the ability to
sustain collusive outcomes.
Although the theoretical literature is scarce, there have been some
empirical studies of multimarket contact and the impact this can have on
market competition. The airline industry has for instance received attention
from researchers of multimarket effects. Evans and Kessides (1994) examine
multimarket contact in the U.S. airline industry. They remark that the
airline industry seems to be an ideal candidate for testing multimarket
effects for three reasons. First, the market seems to obey most conditions
outlined in Bernheim and Whinston (1990) giving rise to collusive gains from
multimarket contact. Second, it has clearly identified regional markets and
finally precise measure of performance is available through airline fares.
Evans and Kessides (1994) analyse airline fares in the 1000 largest U.S. city-
pair routes and this reveals the presence of statistically significant and
quantitatively important multimarket effects: fares are higher in city-pair
routes served by carriers with extensive interroute contacts.
Fernández and Marín (1998) examine the effects of multimarket
contact on pricing in the Spanish hotel industry. They find relevant strategic
multimarket effects supporting the theoretical research of Bernheim and
Whinston (1990). In particular, in the presence of multimarket contact, prices
are higher in markets where it is difficult to collude and lower in markets
where collusion is easier to achieve.
79
CHAPTER FIVE
CONCLUDING REMARKS
In chapter three and four I have given theoretical predictions of optimal
behaviour when markets are distinguished by entry barriers and
concentration. We saw how an incumbent firm or several incumbents could
deter entry from a newcomer, or how they could induce optimal entry through
accommodation strategies. It was also shown that established firms in a
concentrated market could increase their profits through tacit collusion and
that multimarket contact could make this collusion more sustainable, even if
one of the markets was characterised by hard competition. But how does
these theoretical models fit the chemicals shipping market? In this chapter I
will compare these theoretical predictions with observed behaviour from
chemicals shipping. My aim is as outlined in chapter one to confront factual
behaviour with theoretical predictions to gain insight in the underlying
mechanisms that are active in this market.
First, one should note that it is difficult to draw any clear and distinct
conclusions from the observations we see in chemicals shipping. The market
is complex and with lack of testable data econometric models are not of much
help. Another problem is that different sources do not seem to be consistent

80
with their analyses of this market. This is a bit confusing and leaves some
questions concerning strategic aspects of chemicals shipping inadequately
answered.
Second, whereas the empirical observations can be influenced by a set
of different factors, the theoretical models are stylised and normally focus on
one specific factor to explain observed behaviour. Bearing this in mind I will
try to avoid overestimating a factor’s significance when analysing chemicals
shipping.
There are certainly entry barriers in this market, but they are not
absolute. According to Richardson Lawrie Associates several newcomers have
tried to enter the market in recent years. Some have managed to stay, while
others have failed. Can we then draw the conclusion that the major players
have acted strategically to make these entry-attempts fail, and how can we
explain the successful entries? The major players quite understandably do
not openly admit that they act strategically to deter potential entrants, but
this does not exclude the possibility that they actually do. Although there
have been some successful entries, the fact remains that the same few firms
dominate the market. Thus it seems plausible that the incumbents have
taken some actions to hinder a new firm becoming a major player.
We saw earlier that the game described in chapter three was
distinguished by strategic substitutes when we had quantity competition.
According to Fudenberg and Tirole’s (1984) taxonomy this called for a top dog
strategy if investment made the incumbent firm tough. The top dog strategy
prescribes overinvestment to deter entry by looking tough and aggressive,
which is consistent with both Dixit (1980) and Eaton and Lipsey (1980). We
should also bear in mind that even if the incumbent finds it optimal to
accommodate entry, the suggested strategy is still to be a top dog. This is in
accordance with the facts we observe in chemicals shipping. Irrespective of
whether the incumbents have tried to deter entry or seek an optimal

81
accommodation strategy, they have invested significantly in new capacity.
According to Chemical Week (1996) the major operators started to take
delivery in big, expensive vessels in the last half of the 1990s. Both Stolt-
Nielsen and Odfjell initiated new-building programmes of almost $1 billion.
The third largest operator, JO Tankers also started an expansion program
without any plans to scrap ships simultaneously. Chemical Week (ibid.)
explains this expansion program as a result of a long “bear” market for the
operators through most of the late 1980s and early 1990s. When business
conditions improved in the middle of the 1990s, it moved up sharply catching
the carriers short of capacity. This is not inconsistent with Dixit’s (1980)
model. Even if the newbuilding programmes were driven by market demand,
we can still notice that the major operators seemed to be among the first to
invest in new capacity when the market recovered. By investing, and
probably overinvesting in new capacity, the incumbents could deter
newcomers from entry and smaller established firms from seeking a larger
share of the parcel tanker business.
There is another advantage of being first to place orders. The parcel
tankers are complex to build and this restricts the number of yards capable of
undertaking such an assignment. Hans Petter Amundsen of Odfjell predicted
that only some specified yards in Poland, Spain, Norway and South Korea
would remain competent to build parcel tankers in the next decade. By taking
up shipyard capacity, the incumbents can limit the number of orders other
operators can place for new vessels.
But do we observe overinvestment in the chemical carriers market?
Unfortunately the market structure makes it problematic to unfold this
question. The large amount of different chemical packages being freighted on
liner services leaves much unanswered when it comes to capacity. This makes
it hard to measure how much excess capacity a company has available from
the existing data. Drewry (1999) has tried to estimate the total demand for

82
chemical carriers. The accuracy of this estimate is difficult to validate, but it
should give us some tendencies of investment in chemicals shipping. Their
research shows the relationship between total chemicals trade, tonne-mile
demand and the consequent demand. They have included the aggregate
supply assessment and the overall market balance to 2005 (Drewry, 1999).
This research includes details of the anticipated development of the chemical
carrier fleet including forecast deletions and deliveries to 2005. The surplus
of capacity in relation to total fleet declined from 1993 to 1995. It has
increased steadily since, from 5% in 1995 to almost 20% today. Drewry (ibid.)
predicts that the trend after this will be reversed, bringing the surplus down.
There thus seems to have been a trend in the last years of a large surplus of
chemical carrier capacity. One can not identify the major operators in this
statistic, making it impossible to derive if they overinvested in relation to
their market share. But clearly, as mentioned above, they all expanded their
fleets heavily after 1995, so it seems plausible that the leading operators
accounted for some of this surplus.
The model by Eaton and Lipsey (1980) suggested that an incumbent
could overinvest in maintenance to deter entry by a newcomer. A chemical
carrier is a specialised ship that needs a high degree of maintenance.
International safety codes and environmental regulations, which are very
strict for chemicals shipping, are some of the factors creating this situation.
But can we find any indication of “too much” maintenance in chemicals
shipping, as proposed by Eaton and Lipsey (1980)? This would mean that the
incurred maintenance costs would be higher than if the firm were cost
minimising these activities. Once again it is difficult to draw any clear
conclusions, as it is hard to clarify what we are searching for. What does cost
minimising maintenance include, and what is meant by excess maintenance?
These terms are difficult to define and probably even more difficult to
measure.

83
We can however study one of the main players to achieve some insight.
We look closer at Odfjell, the second largest operator with a global network.
Being one of the major operators its processes should be similar to the other
leading operators in chemicals shipping. Odfjell has a stated policy to keep
their vessels in a “state of the art” shape. Looking further at Odfjell’s (1998)
annual report, they declare that one of their strategies to maintain their
market share is through fleet development. Their objective is to manage a
gradual renewal of their vessels and have a high maintenance level of their
fleet. Odfjells policy is thus in accordance with both models by Eaton and
Lipsey (1980). This could indicate that the company engages in too much
maintenance for strategic purposes and also that they replace their carriers
before their economical lives are over. These indications are in line with the
top dog strategy discussed earlier; the incumbent firms in chemicals shipping
overinvest to look tough and aggressive to deter potential global competitors.
In fact there are other observations from chemicals shipping pointing
to the same conclusion, especially when looking at the two leading operators,
Stolt-Nielsen and Odfjell. Their recent investment in information technology
can be interpreted as a top dog strategy. These two leading operators,
controlling nearly 45% of the market will be offering freight services in a
class of their own when these systems are up and running. Stolt-Nielsen and
Odfjell are also the only operators building competence in the four connected
business areas of chemical freight. These areas include global and regional
shipping, tank terminals and tank containers. While other companies are
strong in one or two of these businesses, Stolt-Nielsen and Odfjell operate in
all four. Odfjell (Annual report, 1998) claims that “[i]ntegrating services in
this way is a major advantage in a market where customers are making ever
tougher demands in terms of efficiency, frequency, flexibility and
competitiveness.” This can also be seen as a top dog strategy as the firms by
investing in integrated business areas will look tougher to competitors. By

84
building competence in information technology and integrated services, Stolt-
Nielsen and Odfjell continue to build the impression of tough offensive
players, i.e. top dogs ready to meet and fight newcomers in several markets.
Viewing the market from the opposite side, the successful entrants
seem to have remained small players not appearing to challenge the major
operators. This is in accordance with the top dog strategy as the incumbents
have accomplished optimal accommodation from the newcomers. We can see
this in combination with the entry strategy presented by Gelman and Salop
(1983). By limiting the scale of its entry, newcomers play the role of a puppy
dog and do not trigger an aggressive response by the larger incumbents.
We have now identified what seems to be a top dog strategy for the
incumbents and a puppy dog strategy for the newcomers in chemicals
shipping. But what about competition between the established players, can
we identify tacit collusion in deep-sea chemicals shipping? It is quite obvious
that there is not a formal cartel in this market, and competition seems hard
between the major operators. But there are perhaps some leads that can
substantiate our theoretical models. It seems plausible that the major
operators would benefit if there were some sort of tacit agreement to soften
market competition. They all compete for the same customers, and it is not
unlikely that this situation could create incentives to engage in some sort of
tacit arrangement. This does not mean that the operators are co-operating,
but more that they have a tacit “understanding” of what the price range
should be. It is in every operator’s interest that the competition is not too
tough, as this will hurt everybody in the next “game”. This was observed in
the supergames presented in chapter four. There are of course factors
restraining the price the incumbents can charge. A “high” price will attract
newcomers or perhaps vertical integration by the chemical producers.
Instefjord (1990) shows that this possibility might give rise to limit pricing
from the incumbents. If the incumbents charged too much, the suppliers

85
would rather carry the chemicals themselves making a vertical integration.
We have not seen any sign of the latter and entry from other shipping
companies has been discussed earlier in this chapter.
Indications of tacit collusion can be found. The most clear-cut reference
is found in Seim and Stoutland (1991), where an employee from Seachem is
quoted. One should be careful when handling such second hand sources, but
the statement matches quite nicely the observations from the market. The
statement suggests that the major companies tacitly have divided the deep-
sea chemical market and contrived an “understanding” to keep the situation
like this. It would thus be natural that the investment in capacity should be
proportional to keep the market shares steady. By inspecting the market
shares for the major operators, one observes that they have not changed
significantly the last decade, which coincides with the statement from Seim
and Stoutland (ibid.).
Jacob Stolt-Nielsen Jr is quoted in Drewry 1996. He raises an offensive
against other chemical tanker owners, saying: “One could ask how many
ships (other companies) have scrapped. If there is anyone involved in senseless
ordering of ships, it must be the players that are seeking to increase their fleets
and bolster their market share.” We know from economic theory that excess
capacity can strengthen tacit collusion as the punishment from deviation can
be harsher. One problem, which was not discussed in the last chapter, is how
the market shares between the involved parties should be divided. In chapter
four we assumed that this was split equally between the two incumbents. In
chemicals shipping the market shares differ a lot between the major
incumbents. Since the market is quite secretive, there could be an incentive
to try to gain a larger share of the market but still hope to maintain the tacit
arrangement. The referred statement could be a signal to encourage other
operators to refrain from pursuing a higher market share, “warning” them
that they could risk a breakdown in this tacit understanding.

86
Chemicals shipping also fits nicely into the setting of the multimarket
models by Bernheim and Whinston (1990). The chemical market is divided
between different trading routes where the same competitors meet. On some
of these routes the major operators compete with several smaller “non-major”
companies, which is akin to one of the settings described in Bernheim and
Whinston (1990). It is not unlikely that this could affect competition between
the companies involved, and Bernheim and Whinston (1990) explain how this
situation could make a tacit cartel sustainable. As stressed before, tacit
collusion here does not necessarily mean that the different companies have
made some sort of agreement. Tacit collusion is understood as a realisation
from the players that if they meet several times in a market, or several
markets it would be optimal to compete less hard than the equilibrium in the
one-shot game. Evidence of multimarket contact is naturally hard to find, but
the different players must certainly be aware of this strategic aspect which
could make it profitable for them to redistribute market power among the
markets where they are operating. The other model presented by Bernheim
and Whinston (1990) could also be relevant for sustaining tacit collusion in
chemicals shipping. Demand fluctuates from period to period within the
different trades and, as Drewry (1999) describes, rates fell heavily on some
destinations in 1998, while they remained somewhat firmer on other trades.
This coincides with Bernheim and Whinston (1990) and could make it easier
to sustain tacit collusion due to multimarket contact.
What does the future hold for chemicals shipping? The leading
operators look to remain strong, but the forthcoming period can according to
Hans Petter Amundsen of Odfjell see some changes in the concentration of
the deep-sea segment. Data from Odfjell show that at the present time the
four major companies only account for 36% of the order book for the core fleet
over 10,000 dwt. Other “non major” operators divide the rest and some of
them, like MISC and Team Tankers, have a significant share of these orders.

87
These firms are some of the biggest operators in the group below the five
largest companies and have at the moment orders for new tonnage larger
than some of the four majors. This means that a lot of new tonnage will enter
the market operated by smaller companies. Amundsen predicts that perhaps
one or two of the smaller companies could take the step up and establish
itself among the major players. He does not see this as a threat to Odfjell’s
position but more as a restructuring of the market share not controlled by the
major operators. This could be accomplished by gaining market shares from
other smaller operators driving them out of business or establishing joint
ventures, as several minor operators already do. This could make it even
more difficult for newcomers to enter in the coming years, as the
concentration in chemicals shipping would become even stronger.
The chemicals shipping market has not been widely analysed from an
academic point of view. One of the reasons is naturally the amount of
contracts of affreightment that makes it difficult to obtain comparable data
from the market. Testing for entry barriers is also hard due to the problems
of estimating excess capacity in the chemical fleet. Lieberman (1987) also
presents empirical evidence suggesting that excess capacity, as a barrier to
entry, is not so common in practise as identified in theory. A proposal to
further research would therefore be to focus on multimarket contact and how
this can effect competition in chemicals shipping. If comparable prices could
be estimated, a similar regression on chemicals shipping as Fernández and
Marín (1998) do on the Spanish hotel industry, could derive more precise
conclusions of the exercise of market power in chemicals shipping.

88

89
REFERENCES.
Abreu, D. (1986), “Extreme equilibrium of oligopolistic supergames”, Journal
of Economic Theory, Vol. 39: 191 – 225.
Bain, J. S. (1956), Barriers to New Competition, Cambridge, Harvard
University Press.
Baumol, W. and R. Willig (1981), “Fixed cost, sunk cost, entry barriers and
sustainability of monopoly”, Quarterly Journal of Economics, Vol. 95: 405 –
431.
Bernheim, D. and M.D. Whinston (1990), “Multimarket contact and collusive
behaviour”, RAND Journal of Economics, Vol. 21: 1 – 26.
Birkeland, S., T. Eide and H.K. Hvide (1999), Unpublished Note, Norwegian
School of Economics and Business Administration.
Brandenburger, A.M. and B.J. Nalebuff (1995), “The right game: Use game
theory to shape strategy”, Harvard Business Review (Jul-Aug), 57 – 71.
Chemical Week (1996), “Parcel tanker lines add new ships”, September 25.
Davies, S.M. (1991), “Dynamic price competition, briefly sunk costs, and
entry deterrence”, RAND Journal of Economics, Vol. 22: 519 – 530.
Dixit, A. (1980), “The role of investment in entry-deterrence”, The Economic
Journal, Vol. 90: 95 – 106.

90
Drewry Shipping Consultants (1991), “The chemical carrier market: Seaborne
trade and shipping in the 1990’s”, London.
Drewry Shipping Consultants (1996), “Chemicals tankers: Market prospects,
costs & profitability”, London.
Drewry Shipping Consultants (1999), “Chemical carriers: Facing an
uncertain future?”, London.
Drewry Shipping Consultants (1999), ”The Drewry Chemical Quarterly: First
quarter 1999”, London.
Eaton, B.C. and R.G. Lipsey (1980), “Exit barriers are entry barriers: The
durability of capital as a barrier to entry”, Bell Journal of Economics, Vol. 11:
721 – 729.
Eaton, B.C. and R. Ware (1987), “A theory of market structure with
sequential entry”, RAND Journal of Economics, Vol. 18: 1 – 16.
Evans, W.N. and I.N. Kessides (1994), “Living by the “Golden rule”:
Multimarket contact in the U.S. airline industry”, Quarterly Journal of
Economics, Vol. 109: 341 – 366.
Fernández, N. and P.L. Marín (1998), “Market power and multimarket
contact: Some evidence from the Spanish hotel industry”, The Journal of
Industrial Economics, Vol. 46: 301 – 317.

91
Fudenberg, D and J. Tirole (1984), “The fat cat effect, the puppy dog ploy and
the lean and hungry look”, American Economic Review: Papers and
Proceedings, Vol. 74: 361 – 368.
Fudenberg, D and J. Tirole (1989), “Noncooperative game theory for
industrial organization: An introduction and overview”, Handbook of
Industrial Organization, Ed. R. Schmalensee and R. Willig, Amsterdam:
North-Holland.
Gelman, J. and S. Salop (1983), “Capacity limitation and coupon
competition”, Bell Journal of Economics, Vol. 14: 315 – 325.
Gibbons, R. (1992), A Primer in Game Theory, New York: Harvester
Wheatsheaf.
Gilbert, R.J. (1989), “Mobility barriers and the value of incumbency” in
Handbook of Industrial Organization, Ed. R. Schmalensee and R. Willig,
Amsterdam: North-Holland.
Gilbert, R. and X. Vives (1986), “Entry deterrence and the free rider
Problem”, Review of Economic Studies, Vol. 53: 71 – 83.
Grey, M. (ed.) (1984), “Chemical/Parcel tankers: Their cargoes, their design
and their markets”, Fairplay Publications Ltd, London.
Instefjord, N. (1990), “Limit pricing strategier: Tilfellet med strategiske
kjøpere”, Spesialoppgave ved Høyere Avdelings Eksamen, Norges
Handelshøyskole, Bergen.
92
Jacquemin, A. and M.E. Slade (1989), “Cartels, collusion, and horizontal
merger”, Handbook of Industrial Organization, Ed. R. Schmalensee and R.
Willig, Amsterdam: North-Holland.
Kreps D. and J. Scheinkman (1983), “Quantity precommitment and Bertrand
competition yield Cournot competition”, Bell Journal of Economics, Vol. 14:
326 – 337.
Lazard Capital Markets (1998), “Chemicals and gas: Shipping review”,
London.
Lieberman, M.B. (1987), “Excess capacity as a barrier to entry: An empirical
appraisal”, The Journal of Industrial Economics, Vol. 35, 607 – 627.
Lieberman, M.B. and D.B. Montgomery (1988), “First mover advantages”,
Strategic Management Journal, Vol. 9, 41 – 58.
Rees, R. (1993), “Tacit collusion”, Oxford Review of Economic Policy, Vol. 9,
27 – 40.
Salop, S.C. (1979), “Strategic entry deterrence”, American Economic
Association, Vol. 69, 335 – 338.
Seim, M. and G. Stoutland (1991), “Dypsjø kjemikaliefart”, Diplomoppgave
ved Handelshøyskolen BI, Oslo.
Stigler, G.J. (1968), The Organization of Industry, Homewood, Ill.: Richard D.
Irwin, Inc.

93
Tirole, J. (1988), The Theory of Industrial Organization, Cambridge, MA: The
MIT Press.
Varian, H. (1992), Microeconomic Analysis, 3rd ed., New York, Norton &
Company, Inc.
Waldman, M. (1991), “The role of multiple potential entrants/sequential entry
in noncooperative entry deterrence”, RAND Journal of Economics, Vol. 22:
446 – 453.
Ware, R. (1984), “Sunk cost and strategic commitment: A proposed three-
stage equilibrium”, The Economic Journal, Vol. 94: 370 – 378.
Wilson, R. (1992), “Strategic models of entry deterrence”, in Handbook of
Game Theory, Volume 1, Ed. R.J. Aumann and S.Hart, Amsterdam:North-
Holland.
Yip, G. S. (1982), Barriers to Entry, Lexington, MA: D.C. Heath and
Company.
Østensjø, P. (1992), ”Chemicals Shipping”, SNF-Report no 53/1992, Bergen.

94

95
APPENDIX 1.
Source: Stolt-Nielsen/Chemical Week
Source: Odfjell/Lazard Capital Markets
Parcel Tanker Market 1995
Stolt-Nielsen24 %
Odfjell20 %
JO Tankers9 %
Seachem9 %
Tokyo Marine6 %
Other32 %
Parcel Tanker Market 1998
Stolt-Nielsen26 %
Odfjell20 %
JO Tankers8 %
Seachem9 %
Tokyo Marine6 %
Other31 %
Parcel Tanker Market 1995
Stolt-Nielsen24 %
Odfjell20 %
JO Tankers9 %
Seachem9 %
Tokyo Marine6 %
Other32 %

96

97
APPENDIX 2.
Odfjell Tankers global trade lanes and major ports of calls.
Source: Odfjell


![[SNF] NyanKoi_cp04](https://img.pdfslide.net/doc/110x75/568bf1191a28ab893391f463/snf-nyankoicp04.jpg)