Embed Size (px)
Citation preview
In collaboration with:
Social and Biodiversity Impact Assessment (SBIA) Manual for REDD+ ProjectsPARt 2 – SocIAl IMPAct ASSESSMEnt toolBoxSeptember 2011
This Manual was created with financial support from:
*This publication is made possible by the generous support of the American people through the United States Agency for International Development (USAID), under the terms of the TransLinks Cooperative Agreement No.EPP-A-00-06-00014-00 to The Wildlife Conservation Society. TransLinks is a partnership of WCS, The Earth Institute, Enterprise Works/VITA, Forest Trends and The Land Tenure Center. The contents are the responsibility of the partnership and do not necessarily reflect the views of USAID or the US government.
SOCIAL AND BIODIVERSITY IMPACT ASSESSMENT (SBIA) MANUAL FOR REDD+ PROJECTS: PART 2 – SOCIAL IMPACT ASESSMENT TOOLBOX
Michael Richards
September 2011
©Copyright 2011 Conservation International and Forest Trends Association
All rights reserved.
Conservation International is the convener of the Climate, Community & Biodiversity Alliance (CCBA).
Users may reproduce content only for noncommercial purposes, with a notice that Conservation International and Forest Trends Association own the copyright in this document. No other uses, including sale or resale of the document, are permitted without the express written permission of Conservation International and Forest Trends Association.
Richards, M. 2011. Social and Biodiversity Impact Assessment (SBIA) Manual for REDD+ Projects: Part 2 – Social Impact Assessment Toolbox. Climate, Community & Biodiversity Alliance and Forest Trends with Rainforest Alliance and Fauna & Flora International. Washington, DC.
Preferred Citation:
Please send feedback or suggestions about this manual to Michael Richards ([email protected]) or Steve Panfil ([email protected]).
The Climate, Community & Biodiversity Alliance is a partnership of international Non-Governmental Organizations seeking to foster the development of forest protection and restoration activities around the world that deliver significant climate, community and biodiversity benefits. The CCBA members – Conservation International, CARE, Rainforest Alliance, The Nature Conservancy and the Wildlife Conservation Society – are all leading the development and implementation of forest carbon activities to demonstrate how effective partnerships and integrated design can deliver significant multiple benefits.
http://www.climate-standards.org/
Forest Trends’ mission is to maintain, restore, and enhance forests and connected natural ecosystems, life-sustaining processes, by promoting incentives stemming from a broad range of ecosystem services and products. Specifically, Forest Trends seeks to catalyze the development of integrated carbon, water, and biodiversity incentives that deliver real conservation outcomes and benefits to local communities and other stewards of our natural resources.
The Katoomba Ecosystem Services Incubator, a program of Forest Trends, aims to link communities with the emerging markets for ecosystem services by providing targeted technical, financial, business management and legal support to promising small-scale community-based projects with potential for long-term financial viability, and with the aim of benefiting low-income rural people and imperilled biodiversity.
http://www.forest-trends.org; http://www.katoombagroup.org/incubator
Fauna & Flora International was founded in 1903 and is the world's longest-established international conservation organisation. Operating in more than 40 countries worldwide, FFI’s mission is to protect threatened species and ecosystems, choosing solutions that are sustainable, based on sound science and take account of human needs. As part of its programme on environmental markets, FFI is developing several REDD initiatives in partnership with governments, local communities and the private sector.
http://www.fauna-flora.org/
The Rainforest Alliance works to conserve biodiversity and ensure sustainable livelihoods by transforming land-use practices, business practices and consumer behavior. With offices worldwide, the Rainforest Alliance works with people whose livelihoods depend on the land, helping them transform the way they grow food, harvest wood and host travelers. From large multinational corporations to small, community-based cooperatives, the organization involves businesses and consumers worldwide in our efforts to bring responsibly produced goods and services to a global marketplace where the demand for sustainability is growing steadily.
http://www.rainforest-alliance.org/
Social Impact Assessment Toolbox| iii
Contents
1. Introduction to the Social Impact Assessment Toolbox ................................................................. 1 1.1 Introduction .................................................................................................................................................... 1 1.2 Structure of the Social Toolbox ..................................................................................................................... 1 1.3 Presentation of Methods .............................................................................................................................. 1
2. Review of Social Outcomes and Impacts of Land-Based Carbon Projects ............................. 3 2.1 Introduction .................................................................................................................................................... 3 2.2 Impacts on the Sustainable Livelihood Framework “Capitals” .................................................................. 3 2.3 Gender and Equity Impacts ........................................................................................................................... 7 2.4 Towards a Typology of Social Change Processes, Outcomes, and Impacts .............................................. 8 2.5 Conclusions ................................................................................................................................................... 11
3. General Data Collection Methods for SIA ........................................................................................... 21 3.1 Overview of Qualitative and Quantitative Data Collection Methods ...................................................... 21 3.2 Main Sources and Further Guidance .......................................................................................................... 25
4. Stakeholder Analysis ................................................................................................................................... 26 4.1 Introduction .................................................................................................................................................. 26 4.2 Description of Method ................................................................................................................................ 26 4.3 Main Sources and Further Guidance .......................................................................................................... 30
5. Scenario Analysis ........................................................................................................................................... 31 5.1 Introduction .................................................................................................................................................. 31 5.2 Description of Method ................................................................................................................................ 31 5.3 Main Sources and Further Guidance .......................................................................................................... 34
6. The Sustainable Livelihoods Framework .......................................................................................... 35 6.1 Introduction .................................................................................................................................................. 35 6.2 The Basic Sustainable Livelihoods Framework (SLF) ................................................................................. 35 6.3 The Social Carbon Methodology (SCM) ..................................................................................................... 38 6.4 The Landscape Outcomes Assessment Methodology (LOAM) ................................................................ 39 6.5 Advantages and Disadvantages of the SLF Approach ............................................................................... 42 6.6 Main Sources and Further Guidance .......................................................................................................... 42
7. Participatory Impact Assessment (PIA) ............................................................................................. 43 7.1 Introduction .................................................................................................................................................. 43 7.2 Description of Method ................................................................................................................................ 43 7.3 Advantages and Disadvantages of Participatory Impact Assessment ..................................................... 52 7.4 Main Sources and Further Guidance .......................................................................................................... 52
8. The Basic Necessities Survey (BNS) ...................................................................................................... 54 8.1 Introduction .................................................................................................................................................. 54 8.2 Description of Method ................................................................................................................................ 54
iv | SBIA Manual for REDD+ Projects – Part 2
8.3 Advantages and Disadvantages of the BNS ............................................................................................... 58 8.4 Main Sources and Further Guidance .......................................................................................................... 58
9. Social Indicator Checklists ........................................................................................................................ 59 9.1 Indicators Derived from ‘Sustainability Framework’ Approaches ........................................................... 59 9.2 Indicators for Clean Development Mechanism (CDM) Projects .............................................................. 61 9.3 Social Indicators Derived from Poverty-Focused Programs ..................................................................... 64 9.4 Social Performance Indicators from the Microfinance Sector ................................................................. 65
References ................................................................................................................................................................ 67
List of Tables Table 1: Potential Positive (+) and Negative (-) Effects on Natural Capital by Project Type ....................................... 5Table 2: Observed or Expected Direct and Indirect Social Effects in Project Case Studies ......................................... 9Table 3: Observed or Potential Short- to Mid-Term Social Outcomes of Land-Based Carbon Projects .................. 12Table 4: Potential Mid- to Long-Term Social Impacts of Land-Based Carbon Projects ............................................. 15Table 5: Stakeholder Analysis Profile Matrix ................................................................................................................ 28Table 6: Relative Influence and Importance of Key Stakeholders .............................................................................. 29Table 7: Matrix for Defining Starting Points in Scenario Analysis ............................................................................... 33Table 8: Example of LOAM Livelihood Indicators and Scoring Approach –
East Usambara Mountains, Tanzania ............................................................................................................. 41Table 9. Advantages and Disadvantages of Sustainable Livelihoods Framework for Impact Assessment ............. 42Table 10: Attribution by Ranking and Scoring for a Food Security Project ................................................................ 47Table 11: Reasons for Improved Household Food Security in Niger .......................................................................... 47Table 12: Scoring of Changes in Agricultural Income, Doon Valley Project, India ..................................................... 49Table 13: Scoring of Soil Erosion Control in the Doon Valley Project, India ............................................................... 50Table 14: Pair-Wise Ranking Showing Food-Source Preferences in Niger ................................................................. 51Table 15: Matrix Scoring of Food Sources against Food Preference Indicators ........................................................ 51Table 16: Food Security Impact Calendar Using 25 Counters ..................................................................................... 52Table 18: Example of a Household BNS Form .............................................................................................................. 56Table 19: Example of a Household BNS Poverty Score ............................................................................................... 57Table 20: Advantages and Disadvantages of the Basic Needs Survey ....................................................................... 58Table 21: Millennium Ecosystem Assessment Components and Indicators of Human Well-Being ........................ 61Table 22. EnCoFor Social and Institutional Principles for Monitoring CDM Projects ................................................ 63Table 23. CARE Household Livelihood Security Indicators .......................................................................................... 64
List of Boxes Box 1. General Data Collection and Analysis Methods for SIA ................................................................................... 22Box 2. A Useful Method for Measuring Social Capital ................................................................................................. 23Box 3. Good Practice List of Actions for Household Surveys ....................................................................................... 23Box 4. Participatory Mapping ........................................................................................................................................ 24Box 5. Data Collection Methods Proposed in the Social Carbon ‘Zero Point Assessment’ ...................................... 24Box 6. Gender Matters: Differentiating Women as Stakeholders .............................................................................. 27
Social Impact Assessment Toolbox | v
Box 7. The “Who Counts First?” Matrix ........................................................................................................................ 28Box 8: Use of Venn Diagrams for Stakeholder Analysis .............................................................................................. 29Box 9. What Makes a Successful Scenario? .................................................................................................................. 31Box 10. Driving Forces in a Community in the Bolivian Amazon ................................................................................ 32Box 11. Measuring Impacts Against a Nominal Baseline ............................................................................................ 49
List of Figures Figure 1. Possible Social Change Processes Converting Outcomes to Impacts
(Community-Based REDD Project) ............................................................................................................... 17Figure 2. Possible Social Change Processes Converting Outcomes to Impacts
(Strict Protection REDD Project 1) ................................................................................................................ 18Figure 3. Possible Social Change Processes Converting Outcomes to Impacts
(Strict Protection REDD Project 2) ................................................................................................................ 19Figure 4. Possible Social Change Processes Converting Outcomes to Impacts
(Strict Protection REDD Project 3) ................................................................................................................ 20Figure 5. Venn Diagram of Stakeholders in a Community Forestry Project .............................................................. 30Figure 6. Sustainable Livelihoods Framework Diagram .............................................................................................. 36Figure 7. The Millennium Ecosystem Assessment Framework .................................................................................. 37Figure 8. Modified Sustainable Livelihoods Framework (SAPA Initiative) ................................................................. 38Figure 9. Radar or Spider Diagram Based on LOAM Analysis ..................................................................................... 40Figure 10. Example of Proportional Piling Scoring of Food Sources ........................................................................... 46Figure 11. “Before and After” Project Scoring of Food Sources ................................................................................. 48
vi | SBIA Manual for REDD+ Projects – Part 2
List of Acronyms A/R Afforestation/Reforestation BIA BNS
Biodiversity Impact Assessment Basic Necessities Survey
CCB Climate, Community and Biodiversity (Standards) CCBA CDM
Climate, Community and Biodiversity Alliance Clean Development Mechanism
CMP FPIC FAO
Conservation Measures Partnership Free, Prior and Informed Consent Food and Agriculture Organisation
GEF GMO HCV
Global Environment Facility Genetically Modified Organism High Conservation Value
IAIA IBAT
International Association for Impact Assessment Integrated Biodiversity Assessment Tools
ISEAL KBA LOAM
International Social and Environmental Accreditation and Labeling (Alliance) Key Biodiversity Area Landscape Outcomes Assessment Methodology
M&E MEA
Monitoring and Evaluation Millennium Ecosystem Assessment
NGO Non-Governmental Organization NTFP PDD
Non-Timber Forest Product Project Design Document
PES PIA
Payment for Ecosystem Service Participatory Impact Assessment
PLA Participatory Learning and Action PRA PSR QPA
Participatory Rural Appraisal Pressure State Response Quantitative Participatory Assessment
REDD RIL
Reduced Emissions from Deforestation and forest Degradation Reduced Impact Logging
ROtI Review of Outcomes to Impacts (methodology) RRA Rapid Rural Appraisal SBIA SCM SIA
Social and Biodiversity Impact Assessment Social Carbon Methodology Social Impact Assessment
SLF Sustainable Livelihoods Framework SMART VCS VFMC
Specific, Measurable, Achievable, Realistic/Reliable, Time-bound Verified Carbon Standard Village Forest Management Committee
WG (Focal Issue) Working Group
Note: Only acronyms that are used more than once are listed here.
Social Impact Assessment Toolbox | vii
Acknowledgements Part 2 of the SBIA Manual was written by Michael Richards (Forest Trends) with advisory support from Steve Panfil (Conservation International, formerly with the Climate, Community and Biodiversity Alliance) and valuable inputs by Steven Price (Rainforest Alliance consultant). The author is responsible for any errors.
We firstly thank PROFOR (World Bank), The Rockefeller Foundation, United States Agency for International Development-TransLinks, Global Environment Facility - United Nations Development Program, Morgan Stanley, The Norwegian Agency for Development Cooperation (Norad) and Moore Foundation for their financial support. The Manual does not necessarily reflect the views of these organizations.
Part 2 of the SBIA Manual has greatly benefited from the detailed editing and comments of Steve Panfil (Conservation International) and Joanna Durbin (CCBA), and the peer reviews of Paul Francis (World Bank), Paddy Doherty (International Social and Environmental Accreditation and Labeling Alliance (ISEAL)) and Kate Schreckenberg (Southampton University). The author is especially grategul to Anne Thiel (Forest Trends) for her outstanding editing and formatting, as well as to Stephanie Wolf (Conservation International) and Lu Wang for their invaluable help with proof reading, formatting and presentation. He is also very grateful to Harriet Fowler for some last-minute logistical heroics.
Others who sent valuable information or comments include: the original Project Advisory Group members Natasha Calderwood (FFI now Conservation International), Julie Fischer (FFI now USAID), Jeff Hayward (Rainforest Alliance) and Jacob Olander (Forest Trends); Julianne Baroody (Rainforest Alliance); Jane Dunlop and Mark Infield (FFI, Indonesia); Phil Franks (CARE International); Rohit Jindal (Michigan State University); Magnus Macfarlane; Oscar Maldonado; Tuyeni Mwampamba; and Paul O’Brien (Oxfam).
We also wish to acknowledge the following individuals and institutions for kindly providing permission to reproduce original figures and for sending essential information, including original materials in an accessible format: Mark Aldrich (WWF International); Andrew Catley (Feinstein International Centre); Rob Craig (Wildlife Conservation Society, formerly with Conservation Development Centre); Viju James (Consultant); Joyce Kasyoki (World Agroforestry Centre); Kate Schreckenberg (University of Southampton); and David Wilkie (Wildlife Conservation Society).
Cover photo credits:
Left to Right, Top to Bottom: © Conservation International/Photo by John Martin © Conservation International/Photo by Steven Panfil © Robin Moore/iLCP © Forest Trends/Photo by Rebecca Asare © Conservation International/Photo by John Martin © Conservation International/Photo by Steven Panfil.

viii | SBIA Manual for REDD+ Projects – Part 2
Social Impact Assessment Toolbox | 1
1. Introduction to the Social Impact Assessment Toolbox
1.1 Introduction
This Toolbox of social impact assessment (SIA) methods and support materials – also referred to as the ‘Social Toolbox’ - comprises Part 2 of the Social and Biodiversity Impact Assessment (SBIA) Manual of REDD+ Projects. It needs to be read or referred to in conjunction with Part 1 of the SBIA Manual; for example, it assumes readers understand the seven SBIA Stages detailed in Part 1.
The Social Toolbox introduces a range of SIA methods with the aim of helping project proponents decide which ones to use. They will however need to refer back to the source materials on specific methods since the guidance provided here is insufficient on its own for implementation. Most of the source materials, which are listed at the end of each section, are available on the internet.
Based on an earlier analysis of the literature (Richards 2008) and other reviews (Schreckenberg et al. 2010), as well as the experience gained from three SIA case study applications and two SIA training workshops (see Box 7, Part 1), the main focus in this Toolbox is on the methods that are most likely to form part of a cost-effective and practical approach to meeting the Climate, Community & Biodiversity (CCB) or other multiple benefit carbon Standards.
1.2 Structure of the Social Toolbox
Following this Introduction, the material is organized as follows:
Section 2 sets the scene by reviewing the literature in terms of our current understanding of the likely social outcomes and impacts from land-based carbon projects; the aim of this section is to help projects think about the social change processes and the range of possible outcomes and impacts, both positive and negative. This complements the ‘theory of change’ approach presented in Part 1.
Section 3 presents an overview of some general data collection methods for SBIA Stage 1 and subsequent stages; Section 4 provides guidance on how to undertake stakeholder analysis which is essential for SBIA Stage 1; Section 5 presents ‘scenario analysis’ as a possible method for SBIA Stage 2 and SBIA Stage 4; Section 6 discusses the Sustainable Livelihoods Framework as a potential framework for selecting indicators (SBIA Stage 5); Section 7 presents a suite of participatory impact assessment (PIA) methods which mainly relate to the measurement of indicators (SBIA Stage 6); Section 8 describes the Basic Necessities Survey (BNS) as a data collection method for measuring changes in poverty; and finally Section 9 presents some sample lists of indicators of potential relevance to measuring the social benefits of land-based carbon projects.
1.3 Presentation of Methods
As far as possible, each approach or method is explained in a systematic way as follows:
• Introduction to method • Description of method • Example of method (if available) • Advantages and disadvantages of the method (or family of methods) • Main sources and further guidance
2 | SBIA Manual for REDD+ Projects – Part 2
Examples that show how the methods have been applied to carbon projects are scarce. Therefore most of the examples are drawn from the biodiversity conservation and sustainable livelihoods literature.
Finally, we wish to stress that the guidance presented here is, in general, only a summary of the more detailed guidance available in the source documents. While these summary descriptions can facilitate a decision by project proponents of what methods to use, users should always refer to the source materials before attempting to implement them. Projects are also strongly advised to invest in expert advice at the project design stage to help select, and in some cases implement, appropriate methods.
Social Impact Assessment Toolbox | 3
2. Review of Social Outcomes and Impacts of Land-Based Carbon Projects1
2.1 Introduction
The objective of this Section is to review what we know from a small literature about the social impacts and outcomes of land-based carbon projects, since this should help project proponents think about the likely positive and negative effects of their projects on local people. It is limited by the fact that there is very little empirical evidence on land-based carbon projects, and it therefore relies to a considerable extent on the slightly greater number of studies of payments for ecosystem service (PES) projects. Many of these studies are quite anecdotal, and few of them have the methodological basis to make convincing statements about the social effects.
This section firstly examines the evidence of social or poverty reduction benefits against the livelihood capital assets of the Sustainable Livelihoods Framework2
2.2 Impacts on the Sustainable Livelihood Framework “Capitals”
(SLF); secondly it looks at equity and gender issues; thirdly it attempts to group and classify different types of outcomes and impacts, and to identify some typical social change processes which help convert social outcomes into impacts for different project types; and ends with some concluding comments.
In general, how a carbon project affects livelihoods tends to depend on how much it restricts or facilitates productive activities (Wunder 2008). Afforestation and reforestation (A/R) projects like plantations can provide a significant boost to local employment, but they also have well-documented environmental and social risks (Smith and Scherr 2002; Wunder 2008). Projects that avoid deforestation while permitting some level of forest use, such as improved forest management, generally provide more diverse livelihood benefits than A/R projects, but the net social effect is again unclear. However, many REDD projects involve a reduction in livelihood options. Due to their resource poor situation, the rural poor sometimes depend on resource degrading land uses, and are therefore at risk of being negatively affected by REDD+ land use changes (Bond et al. 2009; Peskett et al. 2008).
Natural Capital
Natural capital outcomes vary significantly between carbon project types, perhaps more than any other livelihood capital category. The most important way in which a household’s natural capital may be affected would be through a change in land or tree tenure, a change to more or less secure tenure, and/or a change in forest access rights including to ‘common’ land. While there is justifiable international concern about the impact of REDD projects on the rights of indigenous peoples and local communities, there has been a tendency for payments for ecosystem service (PES) projects to consolidate or improve the rights and land tenure security of smallholders (Bond et al. 2009). Some projects have facilitated formal recognition of land tenure or land titling, and it can be supposed that standards like the Climate, Community and Biodiversity (CCB) Standards that demand clear and uncontested carbon rights will help achieve land tenure and carbon rights security.
1 This section was written by Steven Price and Michael Richards. 2 For a detailed explanation of the Sustainable Livelihoods Framework see Section 6.
4 | SBIA Manual for REDD+ Projects – Part 2
At the same time, the CIFOR Poverty and Environment Network (PEN) research initiative3
In the case of REDD projects, a major concern is where natural capital accumulates or is maintained as a result of restrictions on resource use or access. This may disproportionately affect those who do not own land or lack formal access rights, and thus have few options to obtain timber, non-timber forest products (NTFPs), bushmeat, pasture, farmland or firewood (Jindal 2010; Wunder 2008). This can result in the loss of the ‘safety net’ function of forests (Angelsen and Wunder 2003, 21). Reduced access to food and other essentials provided by forests could also have negative impacts on local nutrition and health.
has found that the poorest tend to lose out when tenure is formalized, as has happened in most models of community forestry in which the poorest lost their open access to the former commons (McDermott and Schreckenberg 2009). Also the increased economic value of forests due to the potential for carbon revenue raises the incentives to external interest groups (including governments) that could seek to deny or overlook local tenure and forest use rights (Brown et al. 2008).
Increased competition for land and natural resources could cause land prices to rise and put land ownership beyond the reach of the poor, or under the worst circumstances, lead to the displacement of landless people (Grieg-Gran et al. 2005). Although the CCB Standards require projects to demonstrate that they do not involve involuntary relocation of people or disruption to the activities important for the livelihoods and culture of the communities, some of the indirect market effects are difficult to foresee or measure (CCBA 2008).
Likewise, to the extent that REDD+ projects remove farmland from production and/or limit the expansion of agriculture or other activities like bushmeat hunting, they could affect local food and NTFP prices (Peskett et al. 2008). While higher local prices may be positive for producers, they would negatively affect consumers. Increases in food prices could also lead to a fall in food consumption for the poorest people, substitution of higher quality foods with basic staples, and reduced spending on competing priorities such as schooling, clothing, health, and housing. In contrast, if REDD mechanisms combine with or include agricultural intensification or alternative livelihood activities that increase agricultural production, forest conservation and local food production could both increase.
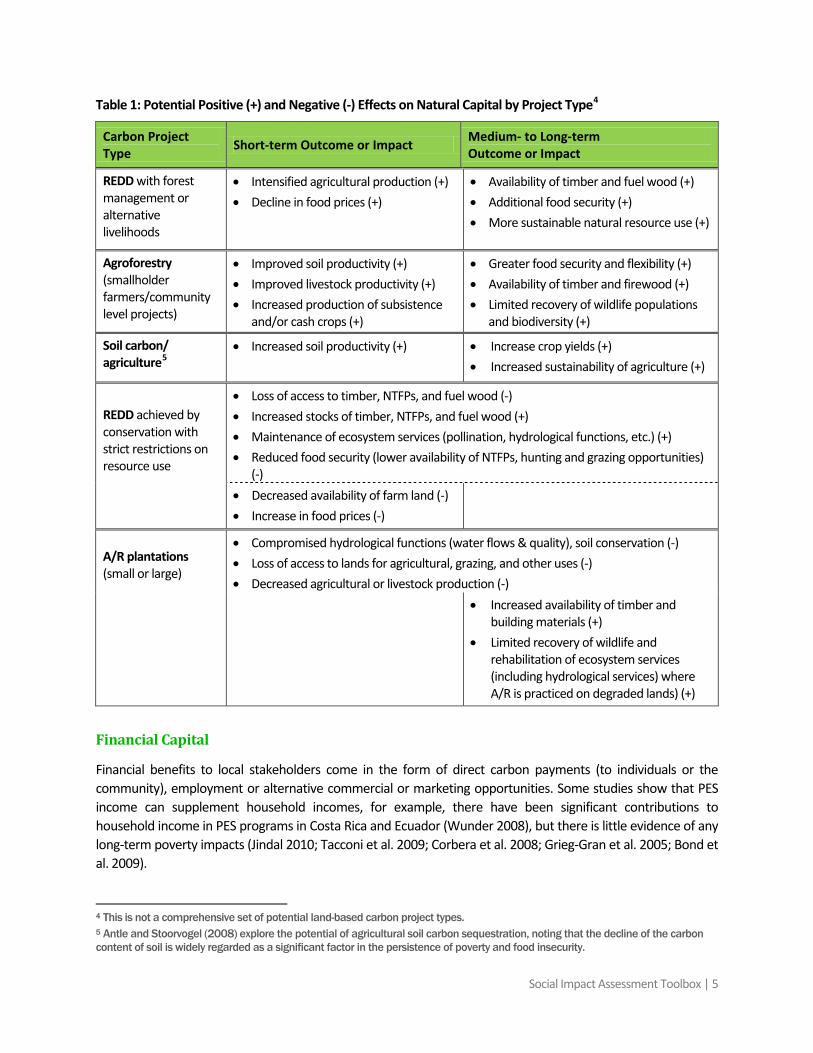
As listed in Table 1, other potential positive outcomes and impacts of carbon projects for natural capital include increased community timber stocks, improved soil fertility and productivity, reduced erosion, recovery of valuable wildlife populations and biodiversity, better pollination, and more stable water quality and flows (Grieg-Gran et al 2005). Agroforestry or plantations commonly establish or restore stocks of natural capital on degraded lands, but there can be trade-offs between carbon and biodiversity. While in most REDD situations there should be significant biodiversity benefits, there may be trade-offs where geographic areas for biodiversity and carbon do not coincide (Angelsen and Wertz-Kanounnikoff, 2008).
3 http://www.cifor.cgiar.org/mediamultimedia/newsroom/press-releases/press-releases-detail-view/article/238/new-global-study-shows-high-reliance-on-forests-among-rural-poor.html.
Social Impact Assessment Toolbox | 5
Table 1: Potential Positive (+) and Negative (-) Effects on Natural Capital by Project Type4
Carbon Project Type Short-term Outcome or Impact Medium- to Long-term
Outcome or Impact
REDD with forest management or alternative livelihoods
• Intensified agricultural production (+) • Decline in food prices (+)
• Availability of timber and fuel wood (+) • Additional food security (+) • More sustainable natural resource use (+)
Agroforestry (smallholder farmers/community level projects)
• Improved soil productivity (+) • Improved livestock productivity (+) • Increased production of subsistence
and/or cash crops (+)
• Greater food security and flexibility (+) • Availability of timber and firewood (+) • Limited recovery of wildlife populations
and biodiversity (+)
Soil carbon/ agriculture5
• Increased soil productivity (+)
• Increase crop yields (+) • Increased sustainability of agriculture (+)
REDD achieved by conservation with strict restrictions on resource use
• Loss of access to timber, NTFPs, and fuel wood (-) • Increased stocks of timber, NTFPs, and fuel wood (+) • Maintenance of ecosystem services (pollination, hydrological functions, etc.) (+) • Reduced food security (lower availability of NTFPs, hunting and grazing opportunities)
(-) • Decreased availability of farm land (-) • Increase in food prices (-)
A/R plantations (small or large)
• Compromised hydrological functions (water flows & quality), soil conservation (-) • Loss of access to lands for agricultural, grazing, and other uses (-) • Decreased agricultural or livestock production (-)
• Increased availability of timber and building materials (+)
• Limited recovery of wildlife and rehabilitation of ecosystem services (including hydrological services) where A/R is practiced on degraded lands) (+)
Financial Capital
Financial benefits to local stakeholders come in the form of direct carbon payments (to individuals or the community), employment or alternative commercial or marketing opportunities. Some studies show that PES income can supplement household incomes, for example, there have been significant contributions to household income in PES programs in Costa Rica and Ecuador (Wunder 2008), but there is little evidence of any long-term poverty impacts (Jindal 2010; Tacconi et al. 2009; Corbera et al. 2008; Grieg-Gran et al. 2005; Bond et al. 2009).
4 This is not a comprehensive set of potential land-based carbon project types. 5 Antle and Stoorvogel (2008) explore the potential of agricultural soil carbon sequestration, noting that the decline of the carbon content of soil is widely regarded as a significant factor in the persistence of poverty and food insecurity.
6 | SBIA Manual for REDD+ Projects – Part 2
The Noel Kempff Mercado Climate Action Project in Bolivia is an early example of a REDD initiative that may have resulted in a modest positive net gain for local people; the project compensated for local jobs lost when timber concessions were retired by facilitating new opportunities in carbon monitoring, harvesting and processing NTFPs, micro-enterprise development, and park management (Smith and Scherr 2002). On the other hand, a review of four watershed services and carbon sequestration projects in Mesoamerica found cases where payments did not cover opportunity costs or provide what farmers perceived to be a fair compensation (Corbera et al. 2007). It is often unclear if the net benefits are positive or negative, for example, a study of the Trees for Global Benefits (TFGB) project in Uganda concluded that the costs of “displaced production and additional expenditure on food items may outweigh carbon income” (German et al. 2009: 16).
Under some circumstances, payments and employment from carbon projects can result in improved income diversification and stability (Wunder 2008; Peskett et al. 2008; Pagiola et al. 2004). For example, income from carbon projects in Costa Rica and Ecuador was cited by local people as being a significant means of income stabilization and diversification (Grieg-Gran et al. 2005). As Peskett et al. (2008) note, PES income can be more stable than, for example, agricultural income. The relative diversity and stability of carbon income depends on many factors including the payment regime, frequency and duration of employment, carbon market stability, and the management and funding of projects.
On the other hand, where carbon projects restrict some land uses, communities may lose both income and flexibility in their livelihood strategies to cope and respond to shocks. For example, A/R projects can reduce the area available for food crop production (Smith and Scherr 2002). This occurred in the Trees for Global Benefits project in Uganda where some households lost customary access to idle lands when neighbors established carbon woodlots. This led some families to rent land for cultivation, whereas others were unable to secure sufficient cultivable land and had to buy food (Carter 2009).
An influx of relatively large cash sums in areas with weak governance or where local organizations lack appropriate systems runs the risks of mismanagement, corruption, and ‘elite capture’ (Angelsen and Wertz-Kanounnikoff 2008; Peskett et al. 2008); one warning is that “large new financial flows would likely fuel conflict and create new opportunities for corruption” (Brown et al. 2008: 13). The benefits of carbon payments or employment may also be limited in remote rural areas where poorer people use forests for subsistence production, and have limited access to local markets (Peskett et al. 2008).
Social Capital
Increased social cohesion and trust have been cited as positive indirect outcomes of agroforestry carbon projects involving smallholders and community organizations (Jindal 2010; Tacconi et al. 2009; Carter 2009). A strengthened community-based organization is another important outcome of carbon projects implemented with local counterparts. More specifically, community groups can develop social coordination capacities as well as increased visibility, representation, and negotiation abilities vis-à-vis government authorities and donors (Wunder 2008). Increased visibility also makes it easier to attract support for local priorities such as the construction of schools, health clinics, roads and credit.
On the other hand, new carbon benefits can provoke increased land speculation or in-migration, thus creating conditions for increased competition and social conflict within and between communities (Peskett et al. 2008). There can also be conflicts between participants and non-participants living within the project area, resulting in a weakening of social capital. Projects that overlook or fail to account for informal or customary rights could feed social grievances and conflict that affect the viability of the carbon objectives (Corbera 2007).
Social Impact Assessment Toolbox | 7
REDD projects with strict restrictions are more likely to exacerbate conflicts over access to and control of natural resources, whereas projects with multiple-use forest management or alternative livelihood activities are more likely to ensure or increase community access to forests and possibly even help resolve land tenure or tenure conflicts (Smith and Scherr 2002).
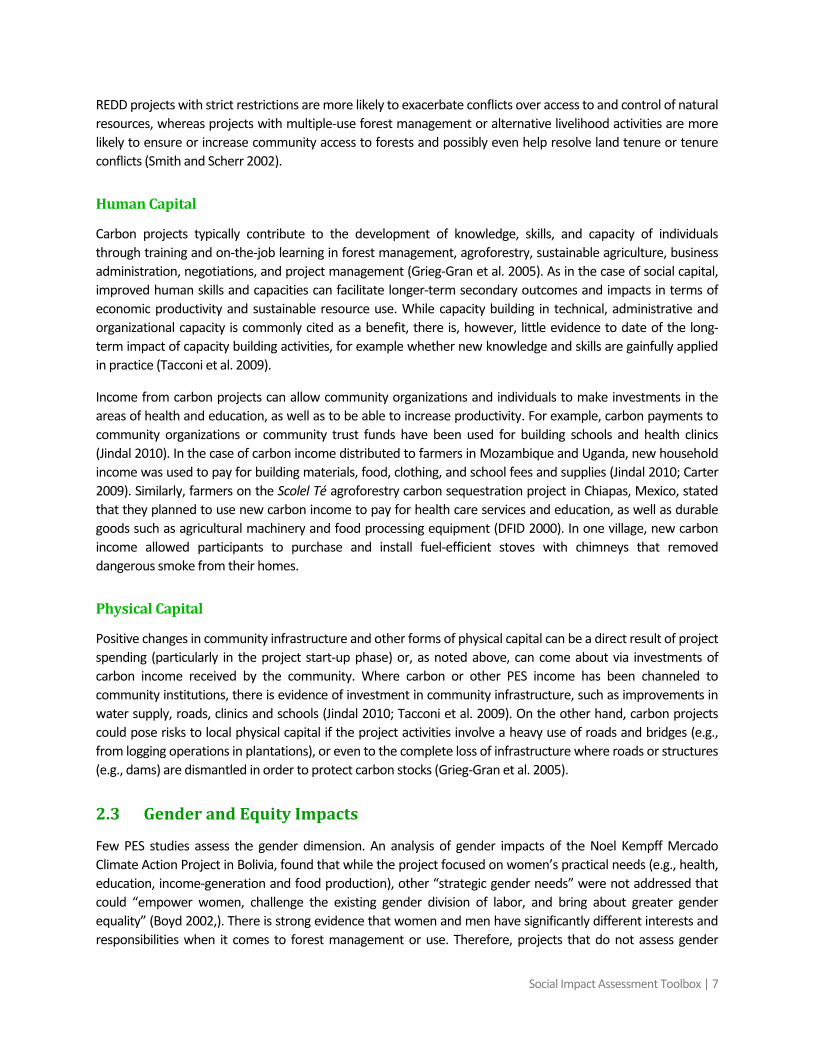
Human Capital
Carbon projects typically contribute to the development of knowledge, skills, and capacity of individuals through training and on-the-job learning in forest management, agroforestry, sustainable agriculture, business administration, negotiations, and project management (Grieg-Gran et al. 2005). As in the case of social capital, improved human skills and capacities can facilitate longer-term secondary outcomes and impacts in terms of economic productivity and sustainable resource use. While capacity building in technical, administrative and organizational capacity is commonly cited as a benefit, there is, however, little evidence to date of the long-term impact of capacity building activities, for example whether new knowledge and skills are gainfully applied in practice (Tacconi et al. 2009).
Income from carbon projects can allow community organizations and individuals to make investments in the areas of health and education, as well as to be able to increase productivity. For example, carbon payments to community organizations or community trust funds have been used for building schools and health clinics (Jindal 2010). In the case of carbon income distributed to farmers in Mozambique and Uganda, new household income was used to pay for building materials, food, clothing, and school fees and supplies (Jindal 2010; Carter 2009). Similarly, farmers on the Scolel Té agroforestry carbon sequestration project in Chiapas, Mexico, stated that they planned to use new carbon income to pay for health care services and education, as well as durable goods such as agricultural machinery and food processing equipment (DFID 2000). In one village, new carbon income allowed participants to purchase and install fuel-efficient stoves with chimneys that removed dangerous smoke from their homes.
Physical Capital
Positive changes in community infrastructure and other forms of physical capital can be a direct result of project spending (particularly in the project start-up phase) or, as noted above, can come about via investments of carbon income received by the community. Where carbon or other PES income has been channeled to community institutions, there is evidence of investment in community infrastructure, such as improvements in water supply, roads, clinics and schools (Jindal 2010; Tacconi et al. 2009). On the other hand, carbon projects could pose risks to local physical capital if the project activities involve a heavy use of roads and bridges (e.g., from logging operations in plantations), or even to the complete loss of infrastructure where roads or structures (e.g., dams) are dismantled in order to protect carbon stocks (Grieg-Gran et al. 2005).
2.3 Gender and Equity Impacts
Few PES studies assess the gender dimension. An analysis of gender impacts of the Noel Kempff Mercado Climate Action Project in Bolivia, found that while the project focused on women’s practical needs (e.g., health, education, income-generation and food production), other “strategic gender needs” were not addressed that could “empower women, challenge the existing gender division of labor, and bring about greater gender equality” (Boyd 2002,). There is strong evidence that women and men have significantly different interests and responsibilities when it comes to forest management or use. Therefore, projects that do not assess gender
8 | SBIA Manual for REDD+ Projects – Part 2
effects may miss key opportunities for strengthening a project’s social design, as well as risk reinforcing negative gender impacts or causing new ones.
Equally, few studies6 have considered how projects affect the distribution of benefits, the division of labor, and participation in decision-making in households and communities. The costs and benefits of carbon projects will affect households and segments of rural society differently as is clear from the above analysis of the five livelihood capitals (see especially natural capital). The distribution of project benefits depends in large part on who participates. Eligibility requirements for participation, such as minimum landholding size, credit, or formal property rights7
For example, the Programa Fase de Forestación (PROFAFOR) carbon sequestration project in Ecuador set the minimum plot size at 50 hectares, thus excluding some poor smallholders (Wunder 2008). In the TFGB project in Uganda, “the availability of land and capital” of local farmers was seen as a determining factor for participation, and smallholders without idle land faced the difficult decision of planting trees for carbon forestry or cultivating food crops (German et al. 2009). Likewise, evidence from some PES schemes
, may exclude the poorest from taking part in carbon projects and their benefits (Tacconi et al. 2009; Grieg-Gran et al. 2005).
8
Equity impacts will also depend on a project’s benefit sharing arrangements, the balance between monetary and in-kind or community level benefits, and the quality of the associated governance. Benefit sharing systems have the potential to alter current institutions, decision-making arrangements, gender relations, and social and organizational dynamics. Whether these changes are positive or negative will be context and governance dependent. Much will depend on the contracts negotiated between project developers and local stakeholders – hence the need for good legal advice, ideally as part of a ‘free, prior and informed consent’ (FPIC) process.
shows that requirements for participation have led to the benefits being received by the ‘less poor’. Selective enrollment or the concentration of carbon benefits may also lead to jealousies and grievances, including among non-participants, and negatively affect social capital (Wunder 2008).
National, regional and local government policies implemented in conjunction with or parallel to carbon projects will also influence social and equity effects. Such policies can include the removal of subsidies for deforestation or forest degradation; taxation of land clearing/conversion; development of transport infrastructure; improved forest law enforcement; improved land tenure security; forest certification; fire prevention programs; improved national forest governance; alternative livelihood programs; and agricultural intensification (Peskett et al. 2008).
2.4 Towards a Typology of Social Change Processes, Outcomes, and Impacts
Social (or livelihood) outcomes and impacts—positive and negative—are the result of dynamic processes involving multiple variables, factors, and circumstances. Some outcomes/impacts are the direct (or primary)
6 Exceptions include an analysis of the Nhambita Community Carbon Project in Mozambique, which briefly addresses how carbon projects have affected women’s workloads (Jindal 2010), and a study by Boyd (2002) of the Noel Kempff Project, Bolivia. 7 The willingness, ability, or eligibility of people to participate in carbon projects is affected by various legal, economic, socio-cultural, and ecological factors (Jindal 2010; Pagiola et al. 2004; Grieg-Gran et al. 2005). A review of eight case studies of PES schemes in Africa, ASIA, and Latin America concluded that poorer households were allowed access to the schemes, but land tenure was often a constraint to participation (Tacconi et al. 2009), although Bond et al. (2009) found that small-scale farmers with informal land tenure have been able to participate in some PES schemes. 8 A case study of Costa Rica’s national PES system found that in one watershed a large number of participants were relatively well-off, and derived more than half their total income from outside the farm (Grieg-Gran et al. 2005). The initial failure of Costa Rica’s PES scheme to involve poorer farmers and land users (who held no formal land titles) led the country to develop specific measures to lower or remove barriers to participation (Bond et al. 2009).
Social Impact Assessment Toolbox | 9
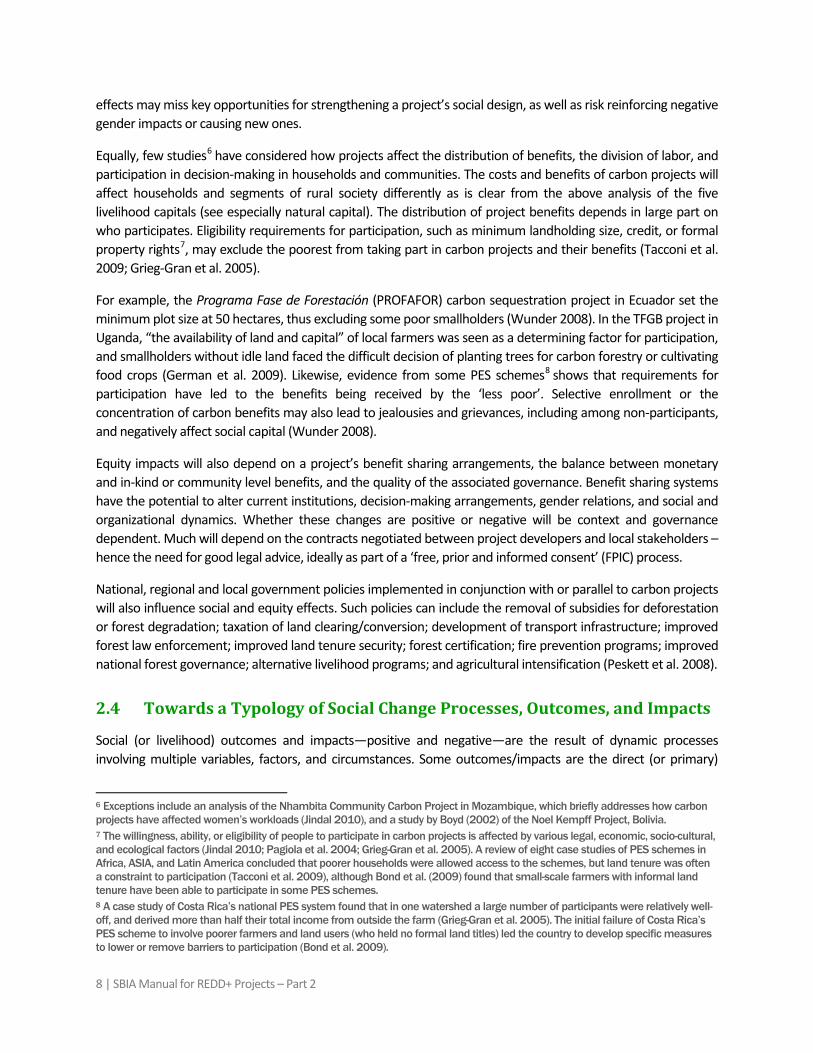
results of project interventions, whereas others are more indirectly related to project activities. Table 2 lists some observed and expected direct and indirect social outcomes/impacts from some of the better documented studies.
The widely accepted SLF is based partly on the idea that short to mid-term social outcomes are a building block of longer-term livelihood impacts. Outcomes beget other changes and alter dynamic processes that in turn affect other outcomes and impacts. While the complexity of these relationships is difficult to capture, we attempt here to depict some potential or likely impacts of different project types on the sustainable livelihood ‘capitals’ in the short- to mid-term (Table 3) and the mid- to long-term (Table 4).
Table 2: Observed or Expected Direct and Indirect Social Effects in Project Case Studies
PROJECT: Trees for Global Benefit TYPE: A/R including Agroforestry COUNTRY: Uganda Observed direct outcomes: • Carbon payments to households • Income generating activities • Strengthened social and human capacity • Improved farm management capacity • Improved timber stocks
Observed indirect outcomes and impacts: • Increased access to credit (loans) • Increased ability for households to make investments • Increased household spending (purchasing power) on basic needs • Improved household food security and diet • Improved fuel security (firewood) • Improved social cohesion • Decreased flexibility in land-use options (loss of alternative economic activities) • Decreased customary access to previously idle land (loss of customary ‘safety net’) • Increased reliance on purchased food • Renting land necessary for farming due to loss of access to land • New disputes and conflict between households regarding land use and natural capital in new woodlots
Sources: Carter 2009; German et al. 2009.
PROJECT: Scolel Té Project, Chiapas TYPE: Agroforestry COUNTRY: Mexico Observed direct outcomes: • New incomes from carbon payments to farmers • New skills developed in agroforestry
Observed indirect outcomes and impacts: • Increased spending on food, medicines, and home improvements • Investment of carbon income in fuel-efficient stoves for homes • Improved indoor air quality in homes due to new stoves
Sources: Smith and Scherr 2002; DFID 2000.
10 | SBIA Manual for REDD+ Projects – Part 2
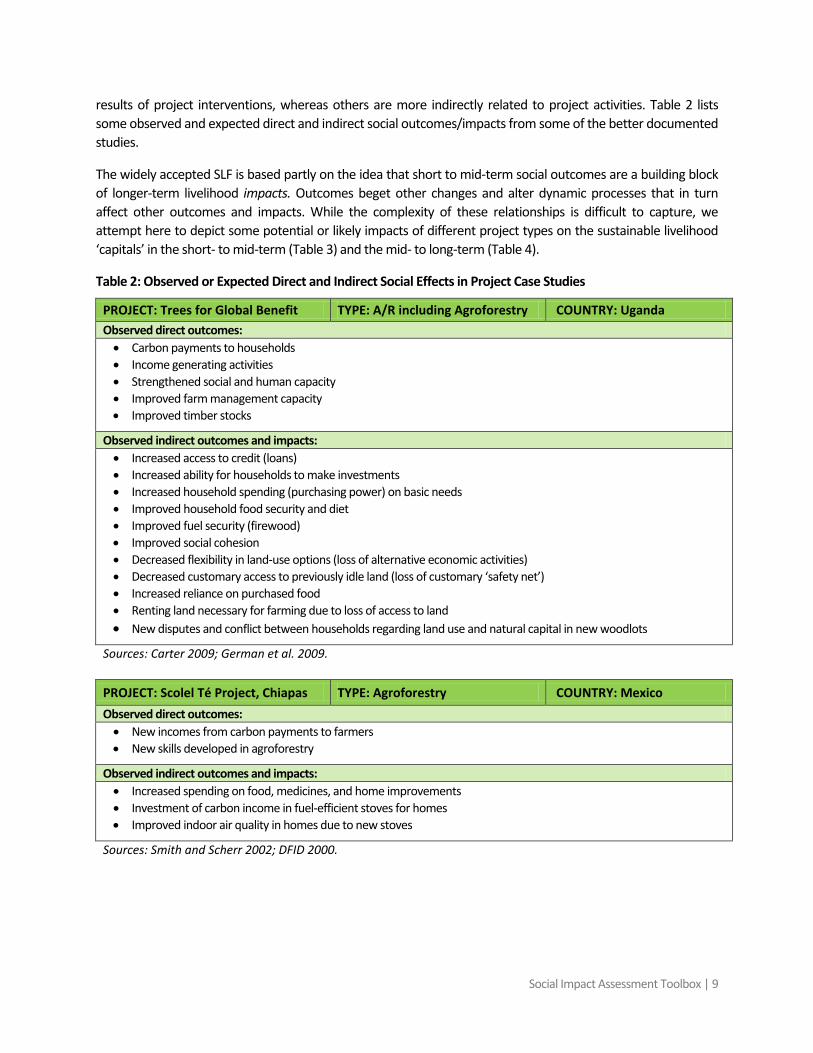
PROJECT: PROFAFOR TYPE: Plantations COUNTRY: Ecuador Observed direct outcomes: • New employment • Forestry added as a livelihood activity • Timber stocks increased • Improved land tenure security • Community credit system established with assistance of the project • Reduced land-use flexibility
Observed indirect outcomes and impacts: • Water quality reduced in one of five communities • Surplus funds used for food, credit schemes and livestock
Sources: Grieg-Gran et al. 2005; Smith and Scherr 2002.
PROJECT: Noel Kempff Mercado Climate Action Project
TYPE: REDD with Strict Restrictions on Resource Use COUNTRY: Bolivia
Observed direct outcomes: • New employment in monitoring, micro-enterprises, and work as park guards • New alternative sources of income • Legal land rights secured for local communities • Employment lost in the forest sector
Source: Smith and Scherr 2002.
PROJECT: Makira Protected Area TYPE: REDD with Zones of Strict Use Restrictions and Multiple-Use COUNTRY: Madagascar
Expected direct outcomes: • Improved natural resource management capacity • New income sources from alternative livelihood activities • Improved health services through health and family planning interventions
Source: Holmes et al. 2008.
PROJECT: Nhambita Community Carbon Project TYPE: REDD and Agroforestry COUNTRY: Mozambique
Observed direct outcomes: • Household incomes supplemented with annual cash payments • New income through monthly wages for people employed in micro enterprises • Community trust fund endowed with annual payments • Improved educational infrastructure (new school and health center built) • Local institutions strengthened and expanded • Human capital strengthened through training • Increase in timber stocks and availability of building supplies, and firewood • Increased workload for women
Observed indirect outcomes: • Carbon income used to pay for home improvement, food, clothing, books, school supplies, agricultural investments,
and durable goods • Reduced demand for seasonal wage labor due to a reduction in the area dedicated to agricultural crops
Source: Jindal 2010.
Social Impact Assessment Toolbox | 11
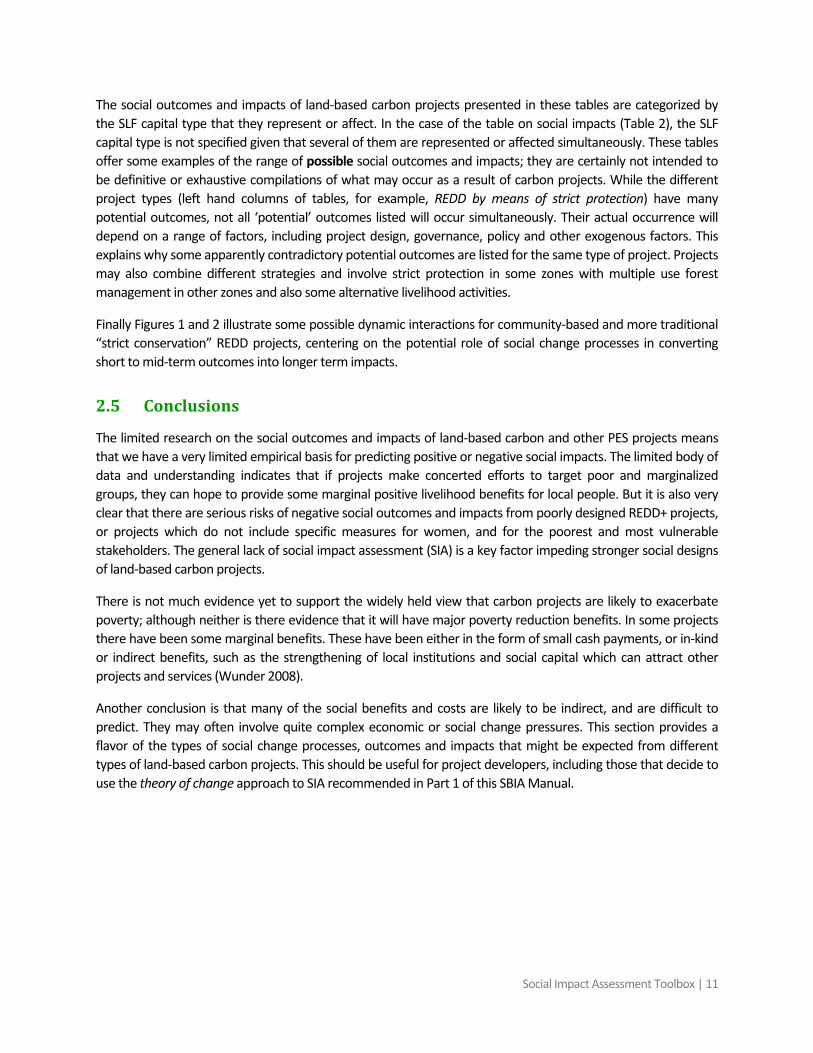
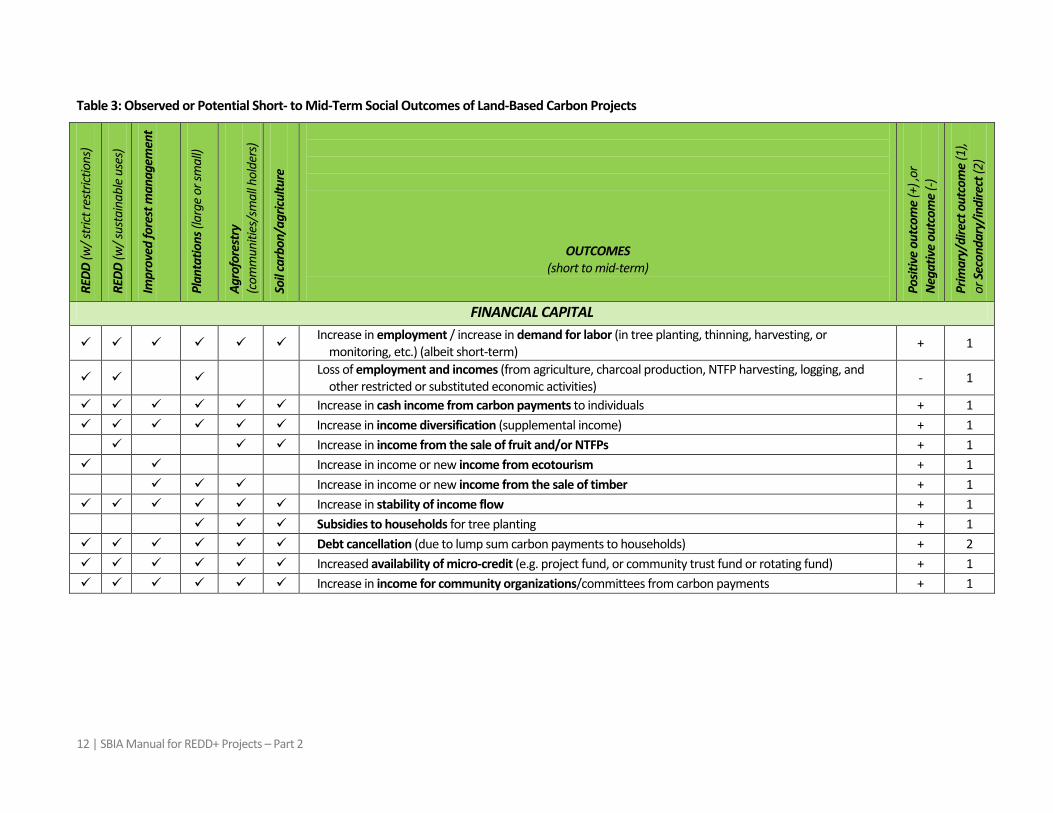
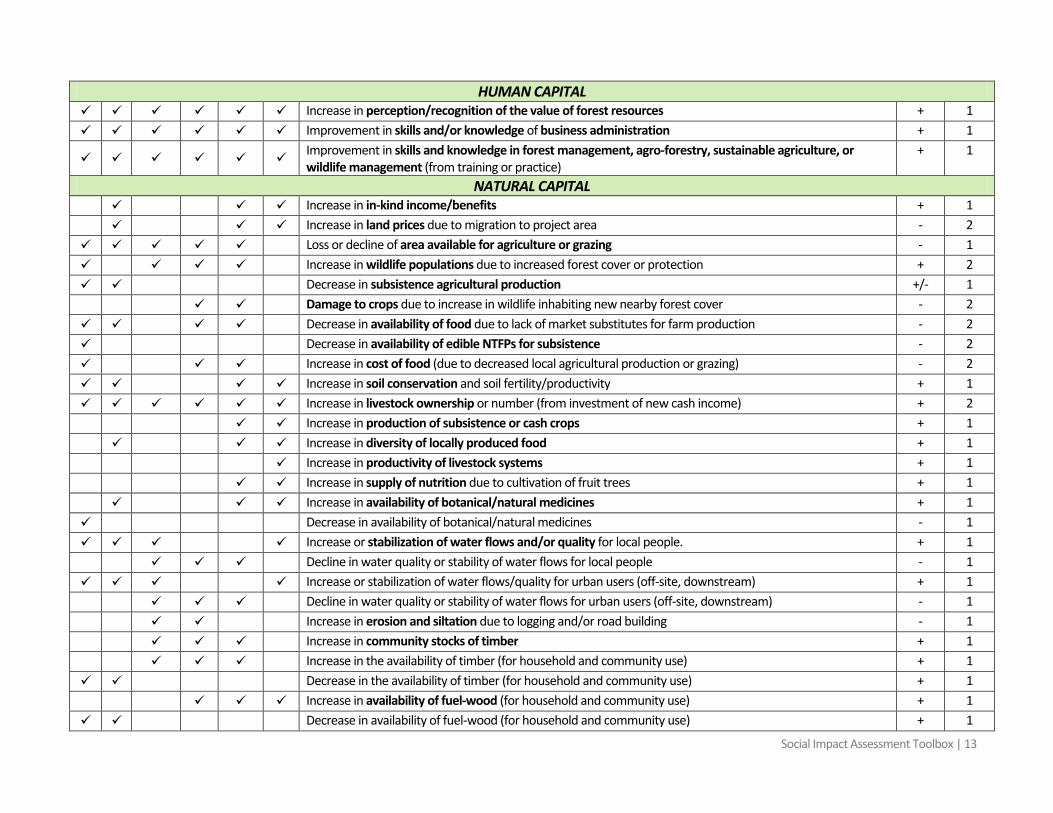
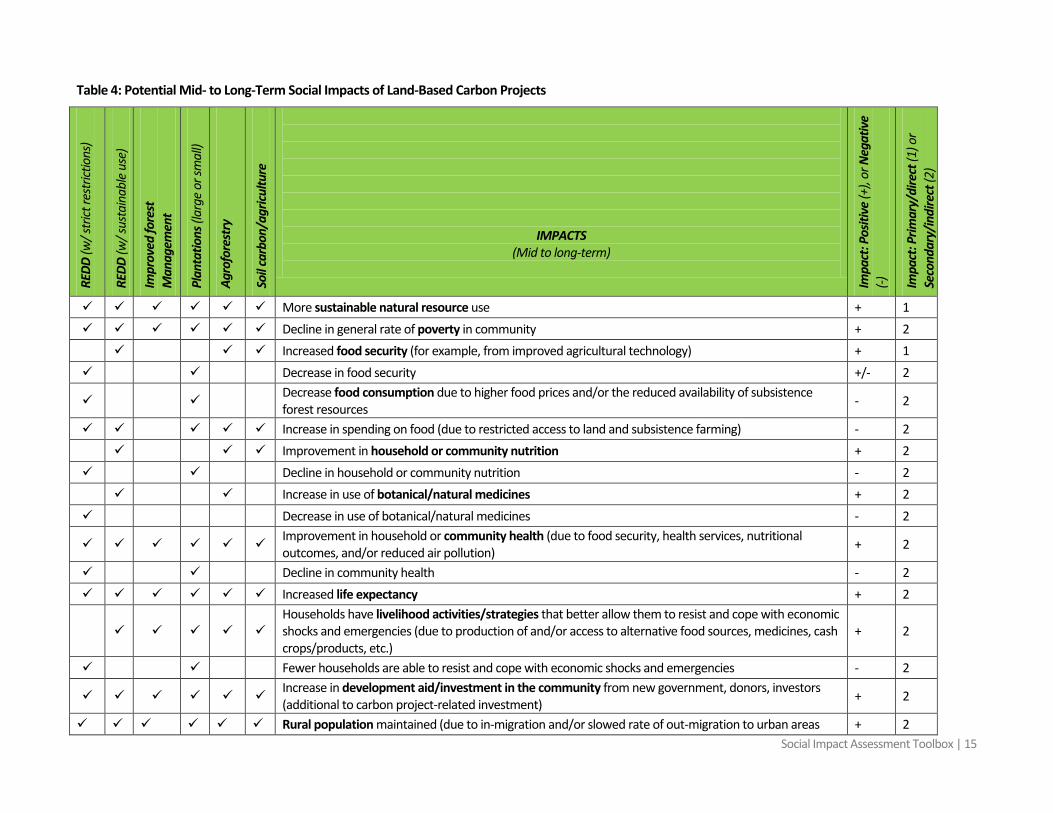
The social outcomes and impacts of land-based carbon projects presented in these tables are categorized by the SLF capital type that they represent or affect. In the case of the table on social impacts (Table 2), the SLF capital type is not specified given that several of them are represented or affected simultaneously. These tables offer some examples of the range of possible social outcomes and impacts; they are certainly not intended to be definitive or exhaustive compilations of what may occur as a result of carbon projects. While the different project types (left hand columns of tables, for example, REDD by means of strict protection) have many potential outcomes, not all ‘potential’ outcomes listed will occur simultaneously. Their actual occurrence will depend on a range of factors, including project design, governance, policy and other exogenous factors. This explains why some apparently contradictory potential outcomes are listed for the same type of project. Projects may also combine different strategies and involve strict protection in some zones with multiple use forest management in other zones and also some alternative livelihood activities.
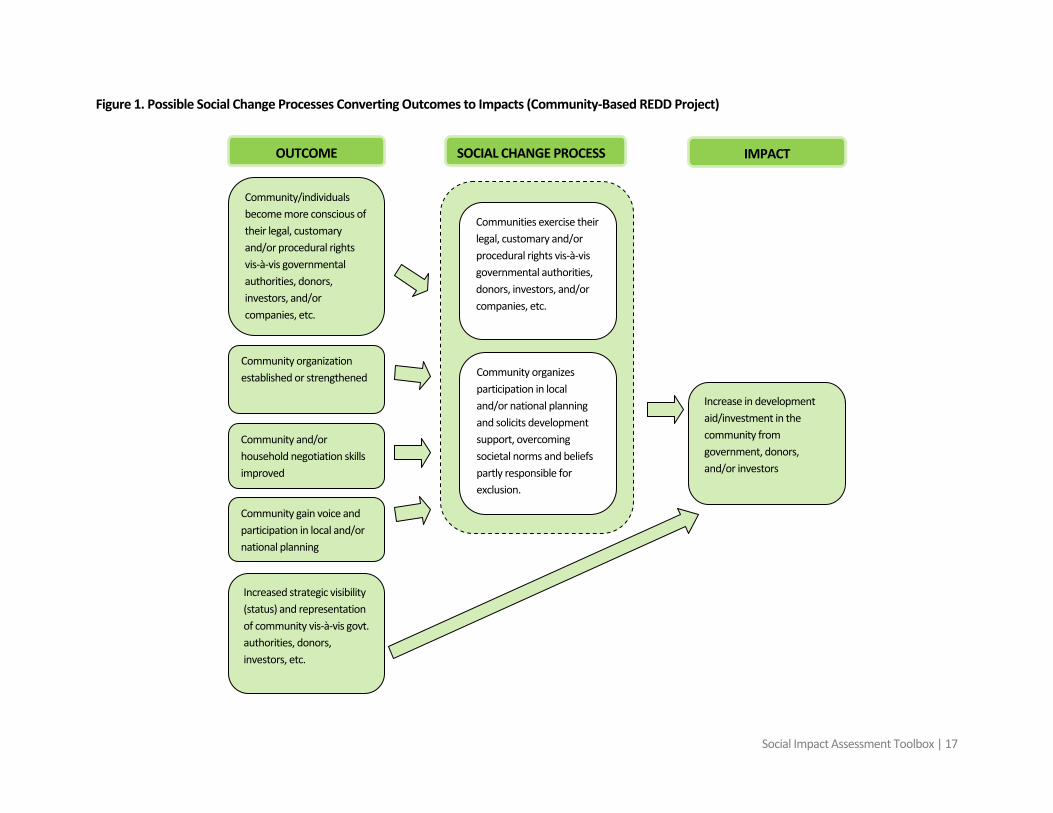
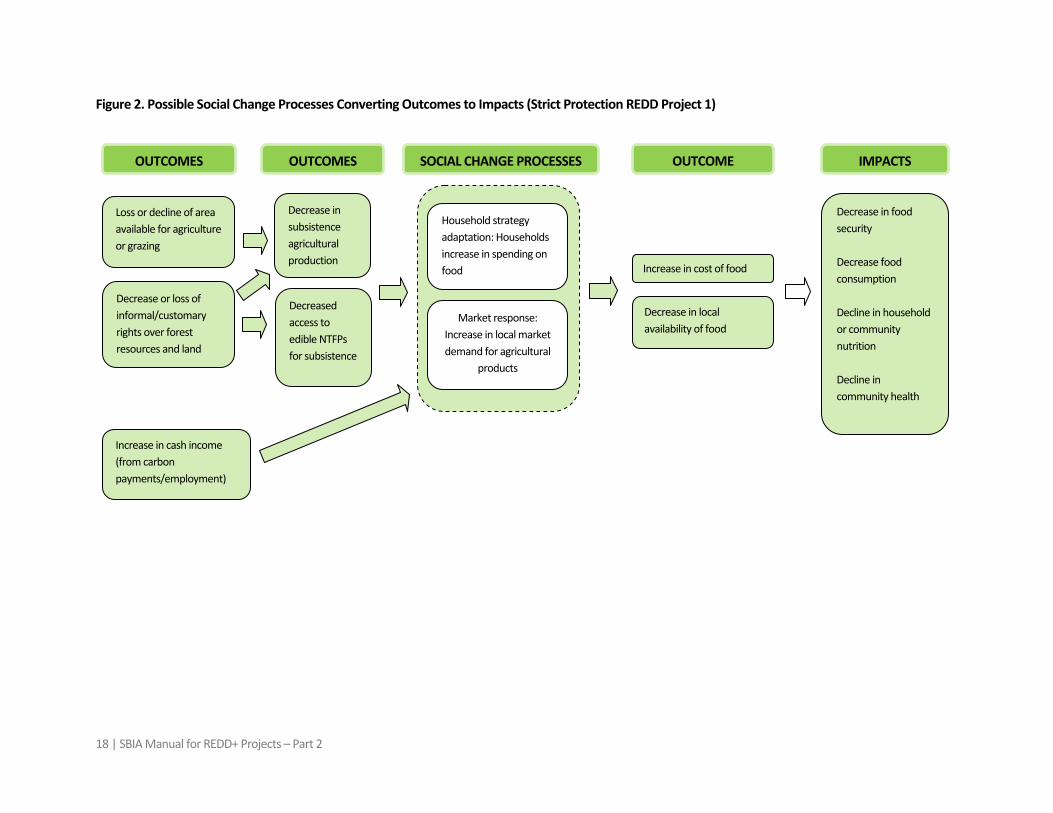
Finally Figures 1 and 2 illustrate some possible dynamic interactions for community-based and more traditional “strict conservation” REDD projects, centering on the potential role of social change processes in converting short to mid-term outcomes into longer term impacts.
2.5 Conclusions
The limited research on the social outcomes and impacts of land-based carbon and other PES projects means that we have a very limited empirical basis for predicting positive or negative social impacts. The limited body of data and understanding indicates that if projects make concerted efforts to target poor and marginalized groups, they can hope to provide some marginal positive livelihood benefits for local people. But it is also very clear that there are serious risks of negative social outcomes and impacts from poorly designed REDD+ projects, or projects which do not include specific measures for women, and for the poorest and most vulnerable stakeholders. The general lack of social impact assessment (SIA) is a key factor impeding stronger social designs of land-based carbon projects.
There is not much evidence yet to support the widely held view that carbon projects are likely to exacerbate poverty; although neither is there evidence that it will have major poverty reduction benefits. In some projects there have been some marginal benefits. These have been either in the form of small cash payments, or in-kind or indirect benefits, such as the strengthening of local institutions and social capital which can attract other projects and services (Wunder 2008).
Another conclusion is that many of the social benefits and costs are likely to be indirect, and are difficult to predict. They may often involve quite complex economic or social change pressures. This section provides a flavor of the types of social change processes, outcomes and impacts that might be expected from different types of land-based carbon projects. This should be useful for project developers, including those that decide to use the theory of change approach to SIA recommended in Part 1 of this SBIA Manual.
12 | SBIA Manual for REDD+ Projects – Part 2
Table 3: Observed or Potential Short- to Mid-Term Social Outcomes of Land-Based Carbon Projects
REDD
(w/ s
trict
rest
rictio
ns)
REDD
(w/ s
usta
inab
le u
ses)
Impr
oved
fore
st m
anag
emen
t
Plan
tatio
ns (l
arge
or s
mal
l)
Agro
fore
stry
(c
omm
uniti
es/s
mal
l hol
ders
)
Soil
carb
on/a
gricu
lture
OUTCOMES (short to mid-term)
Posit
ive
outc
ome
(+) ,
or
Nega
tive
outc
ome
(-)
Prim
ary/
dire
ct o
utco
me
(1),
or S
econ
dary
/indi
rect
(2)
FINANCIAL CAPITAL
Increase in employment / increase in demand for labor (in tree planting, thinning, harvesting, or monitoring, etc.) (albeit short-term) + 1
Loss of employment and incomes (from agriculture, charcoal production, NTFP harvesting, logging, and other restricted or substituted economic activities) - 1
Increase in cash income from carbon payments to individuals + 1 Increase in income diversification (supplemental income) + 1 Increase in income from the sale of fruit and/or NTFPs + 1 Increase in income or new income from ecotourism + 1 Increase in income or new income from the sale of timber + 1 Increase in stability of income flow + 1 Subsidies to households for tree planting + 1 Debt cancellation (due to lump sum carbon payments to households) + 2 Increased availability of micro-credit (e.g. project fund, or community trust fund or rotating fund) + 1 Increase in income for community organizations/committees from carbon payments + 1
Social Impact Assessment Toolbox | 13
HUMAN CAPITAL Increase in perception/recognition of the value of forest resources + 1 Improvement in skills and/or knowledge of business administration + 1
Improvement in skills and knowledge in forest management, agro-forestry, sustainable agriculture, or wildlife management (from training or practice)
+ 1
NATURAL CAPITAL Increase in in-kind income/benefits + 1 Increase in land prices due to migration to project area - 2 Loss or decline of area available for agriculture or grazing - 1 Increase in wildlife populations due to increased forest cover or protection + 2 Decrease in subsistence agricultural production +/- 1 Damage to crops due to increase in wildlife inhabiting new nearby forest cover - 2 Decrease in availability of food due to lack of market substitutes for farm production - 2 Decrease in availability of edible NTFPs for subsistence - 2 Increase in cost of food (due to decreased local agricultural production or grazing) - 2 Increase in soil conservation and soil fertility/productivity + 1 Increase in livestock ownership or number (from investment of new cash income) + 2 Increase in production of subsistence or cash crops + 1 Increase in diversity of locally produced food + 1 Increase in productivity of livestock systems + 1 Increase in supply of nutrition due to cultivation of fruit trees + 1 Increase in availability of botanical/natural medicines + 1 Decrease in availability of botanical/natural medicines - 1 Increase or stabilization of water flows and/or quality for local people. + 1 Decline in water quality or stability of water flows for local people - 1 Increase or stabilization of water flows/quality for urban users (off-site, downstream) + 1 Decline in water quality or stability of water flows for urban users (off-site, downstream) - 1 Increase in erosion and siltation due to logging and/or road building - 1 Increase in community stocks of timber + 1 Increase in the availability of timber (for household and community use) + 1 Decrease in the availability of timber (for household and community use) + 1 Increase in availability of fuel-wood (for household and community use) + 1 Decrease in availability of fuel-wood (for household and community use) + 1
14 | SBIA Manual for REDD+ Projects – Part 2
PHYSICAL CAPITAL Deterioration or reduction in transportation infrastructure - 2 New or improved transportation infrastructure + 1 Improved access to markets (due to new or improved roads/infrastructure) + 2 Ecotourism facilities developed or improved + 1 Health clinic established or improved (directly by the project) + 2
SOCIAL CAPITAL Community organization established or strengthened + 1 Community and/or household negotiation skills improved + 1 Community gain voice and participation in local and/or national planning + 2
Mistrust towards authorities & project managers due to complexity/lack of understanding of project’s payment/compensation regime/contracts & assoc. factors incl. carbon pricing, etc.
- 1
Legal recognition of land tenure rights (private or communal titles) of local inhabitants + 1 Increase in land tenure security (due to change in perception as result of inclusion of land in carbon scheme) + 2 Decrease or loss of informal/customary rights over forest resources and land - 1 Decrease in availability of land for poor landless, due to access restrictions - 1 Decrease or loss of access to forest resources for extraction/harvest (timber, NTFPs, wild game etc.) - 1 Recognition of carbon rights for local communities or individuals + 1 New micro-enterprises developed + 1 Logging companies cause social disruption and tensions - 1
Social Impact Assessment Toolbox | 15
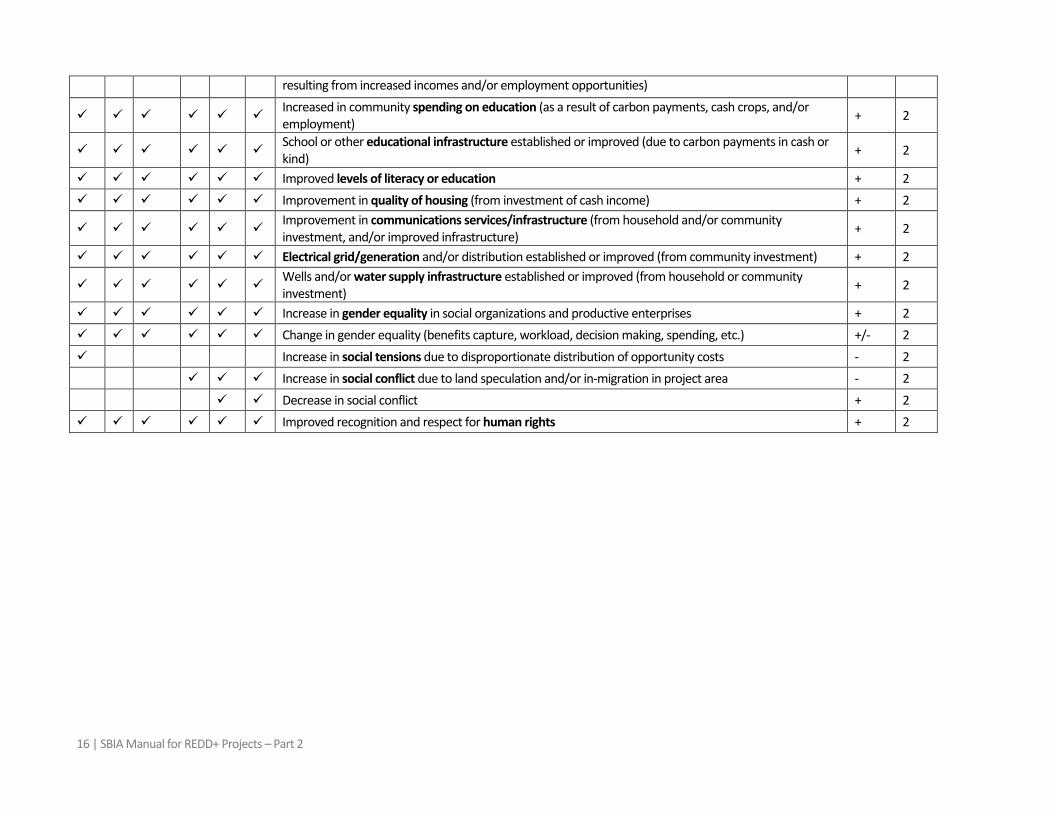
Table 4: Potential Mid- to Long-Term Social Impacts of Land-Based Carbon Projects RE
DD (w
/ stri
ct re
stric
tions
)
REDD
(w/ s
usta
inab
le u
se)
Impr
oved
fore
st
Man
agem
ent
Plan
tatio
ns (l
arge
or s
mal
l)
Agro
fore
stry
Soil
carb
on/a
gricu
lture
IMPACTS (Mid to long-term)
Impa
ct: P
ositi
ve (+
), or
Neg
ativ
e (-)
Impa
ct: P
rimar
y/di
rect
(1) o
r Se
cond
ary/
indi
rect
(2)
More sustainable natural resource use + 1 Decline in general rate of poverty in community + 2 Increased food security (for example, from improved agricultural technology) + 1 Decrease in food security +/- 2
Decrease food consumption due to higher food prices and/or the reduced availability of subsistence forest resources - 2
Increase in spending on food (due to restricted access to land and subsistence farming) - 2 Improvement in household or community nutrition + 2 Decline in household or community nutrition - 2 Increase in use of botanical/natural medicines + 2 Decrease in use of botanical/natural medicines - 2
Improvement in household or community health (due to food security, health services, nutritional outcomes, and/or reduced air pollution) + 2
Decline in community health - 2 Increased life expectancy + 2
Households have livelihood activities/strategies that better allow them to resist and cope with economic shocks and emergencies (due to production of and/or access to alternative food sources, medicines, cash crops/products, etc.)
+ 2
Fewer households are able to resist and cope with economic shocks and emergencies - 2
Increase in development aid/investment in the community from new government, donors, investors (additional to carbon project-related investment) + 2
Rural population maintained (due to in-migration and/or slowed rate of out-migration to urban areas + 2
16 | SBIA Manual for REDD+ Projects – Part 2
resulting from increased incomes and/or employment opportunities)
Increased in community spending on education (as a result of carbon payments, cash crops, and/or employment) + 2
School or other educational infrastructure established or improved (due to carbon payments in cash or kind) + 2
Improved levels of literacy or education + 2 Improvement in quality of housing (from investment of cash income) + 2
Improvement in communications services/infrastructure (from household and/or community investment, and/or improved infrastructure) + 2
Electrical grid/generation and/or distribution established or improved (from community investment) + 2
Wells and/or water supply infrastructure established or improved (from household or community investment) + 2
Increase in gender equality in social organizations and productive enterprises + 2 Change in gender equality (benefits capture, workload, decision making, spending, etc.) +/- 2 Increase in social tensions due to disproportionate distribution of opportunity costs - 2 Increase in social conflict due to land speculation and/or in-migration in project area - 2 Decrease in social conflict + 2 Improved recognition and respect for human rights + 2
Social Impact Assessment Toolbox | 17
Figure 1. Possible Social Change Processes Converting Outcomes to Impacts (Community-Based REDD Project)
OUTCOME SOCIAL CHANGE PROCESS IMPACT
Increase in development aid/investment in the community from government, donors, and/or investors
Community/individuals become more conscious of their legal, customary and/or procedural rights vis-à-vis governmental authorities, donors, investors, and/or companies, etc.
Community organization established or strengthened
Community and/or household negotiation skills improved
Community gain voice and participation in local and/or national planning
Increased strategic visibility (status) and representation of community vis-à-vis govt. authorities, donors, investors, etc.
Communities exercise their legal, customary and/or procedural rights vis-à-vis governmental authorities, donors, investors, and/or companies, etc.
Community organizes participation in local and/or national planning and solicits development support, overcoming societal norms and beliefs partly responsible for exclusion.
18 | SBIA Manual for REDD+ Projects – Part 2
Figure 2. Possible Social Change Processes Converting Outcomes to Impacts (Strict Protection REDD Project 1)
SOCIAL CHANGE PROCESSES
Household strategy adaptation: Households increase in spending on food
Decrease in subsistence agricultural production
OUTCOMES
Increase in cash income (from carbon payments/employment)
OUTCOME
Increase in cost of food
Decrease in food security Decrease food consumption Decline in household or community nutrition Decline in community health
IMPACTS
Decreased access to edible NTFPs for subsistence
Decrease or loss of informal/customary rights over forest resources and land
Loss or decline of area available for agriculture or grazing
Market response: Increase in local market demand for agricultural
products
OUTCOMES
Decrease in local availability of food
Social Impact Assessment Toolbox | 19
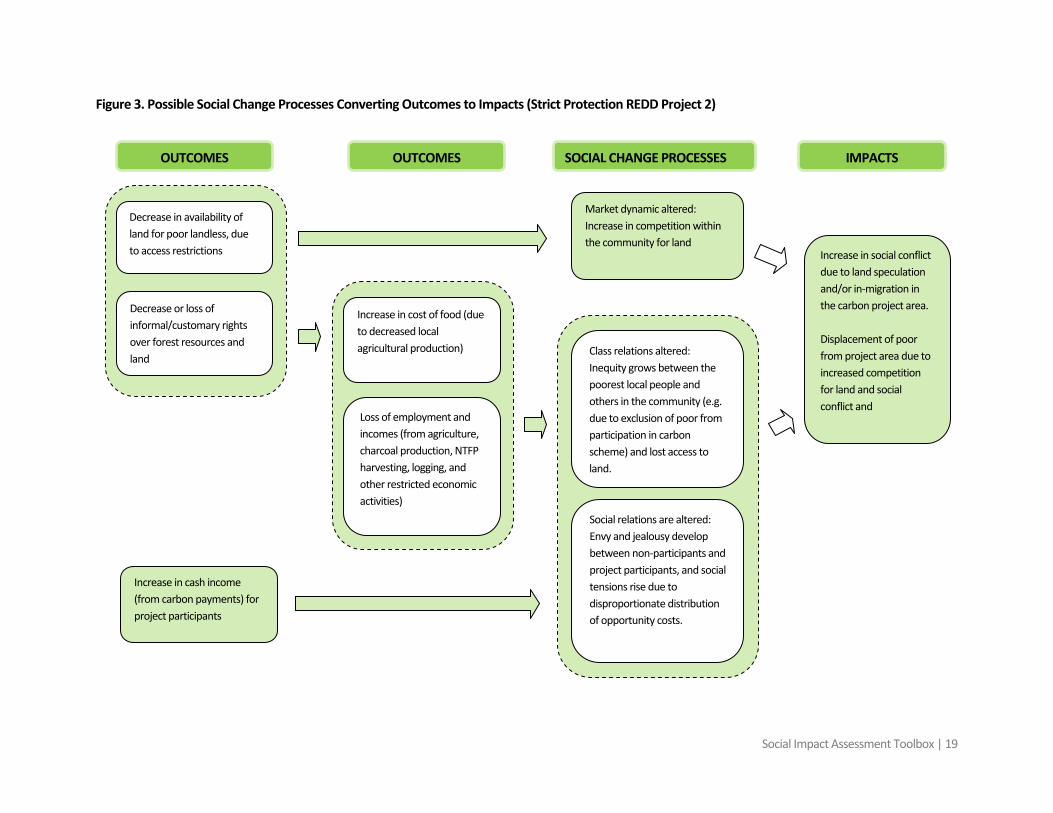
Figure 3. Possible Social Change Processes Converting Outcomes to Impacts (Strict Protection REDD Project 2)
Increase in social conflict due to land speculation and/or in-migration in the carbon project area. Displacement of poor from project area due to increased competition for land and social conflict and
Decrease in availability of land for poor landless, due to access restrictions
OUTCOMES SOCIAL CHANGE PROCESSES
Decrease or loss of informal/customary rights over forest resources and land
IMPACTS
Class relations altered: Inequity grows between the poorest local people and others in the community (e.g. due to exclusion of poor from participation in carbon scheme) and lost access to land.
Market dynamic altered: Increase in competition within the community for land
Social relations are altered: Envy and jealousy develop between non-participants and project participants, and social tensions rise due to disproportionate distribution of opportunity costs.
Increase in cash income (from carbon payments) for project participants
Increase in cost of food (due to decreased local agricultural production)
OUTCOMES
Loss of employment and incomes (from agriculture, charcoal production, NTFP harvesting, logging, and other restricted economic activities)
20 | SBIA Manual for REDD+ Projects – Part 2
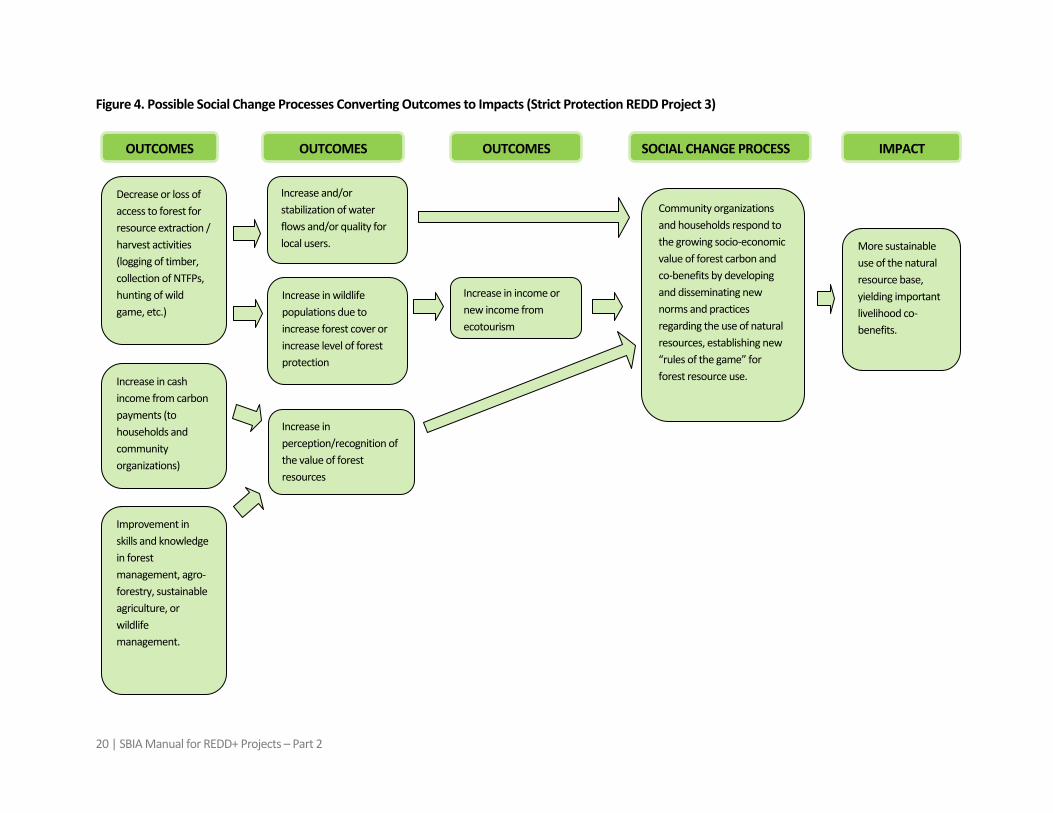
Figure 4. Possible Social Change Processes Converting Outcomes to Impacts (Strict Protection REDD Project 3)
Increase in cash income from carbon payments (to households and community organizations)
OUTCOMES
Increase and/or stabilization of water flows and/or quality for local users.
OUTCOMES SOCIAL CHANGE PROCESS
More sustainable use of the natural resource base, yielding important livelihood co-benefits.
IMPACT
Increase in perception/recognition of the value of forest resources
Increase in wildlife populations due to increase forest cover or increase level of forest protection
Decrease or loss of access to forest for resource extraction / harvest activities (logging of timber, collection of NTFPs, hunting of wild game, etc.)
Increase in income or new income from ecotourism
OUTCOMES
Community organizations and households respond to the growing socio-economic value of forest carbon and co-benefits by developing and disseminating new norms and practices regarding the use of natural resources, establishing new “rules of the game” for forest resource use.
Improvement in skills and knowledge in forest management, agro-forestry, sustainable agriculture, or wildlife management.
Social Impact Assessment Toolbox | 21
3. General Data Collection Methods for SIA
3.1 Overview of Qualitative and Quantitative Data Collection Methods
Commonly used data collection methods include household surveys, case studies, focus group discussions, community mapping and a range of other participatory rural appraisal (PRA) or rapid rural appraisal (RRA) type methods. These methods are most relevant to SBIA Stages 1, 2, 4 and 6.
An overview of frequently used data collection methods is presented in Box 1. Since most general data collection methods are well-known and documented they are not explained in detail here. An initial observation is that these data collection methods should not be seen as mutually exclusive – quite the opposite in fact. It is not a case of using either PRA or household surveys, but more a question of the right combination and sequence of methods in order to obtain reliable estimates. A mix of qualitative and quantitative analysis is necessary for SBIA; some methods are more suitable for analyzing process-based or qualitative indicators, while others are more suited to quantitative indicators.
Qualitative and participatory research methods have become increasingly popular in recent years in various development sectors. They are important for:
• Identifying intangible, negative or unforeseen outcomes;
• Assessing social and institutional change (e.g., Box 2 suggests a simple approach for social capital);
• Capturing local stakeholder perceptions;
• Exploring social and livelihood complexities, including causative links; and,
• Capturing equity, gender and temporal issues.
But there are some important caveats to the use of participatory data collection methods, and more broadly ‘participatory monitoring and evaluation (M&E)’:
• Like quantitative methods, participatory methods are subject to bias and subjectivity9
• They are not necessarily cheap, for example, a well-known ‘Participatory Assessment of Livelihood Impacts’ study based on the SLF and PRA methods, required “highly analytical and skilled study teams” (Ashley and Hussein 2000);
;
• They often require significant time from local people with associated opportunity costs.
According to an authoritative review (Guijt 1999), genuinely participatory M&E is expensive and time consuming, and caution is urged in using this suite of methods unless the benefits are very clear. But the costs and time involved of more traditional data collection methods should not be under-estimated, as indicated by the list of actions (Box 3) required for undertaking household surveys which can be relied on to generate reliable estimates.
9 For example, research by Richards et al. (2003) found that even ‘best practice’ PRA-based estimates of household income are prone to major bias problems, and that PRA or RRA is not appropriate for measuring output, income or other variables with high inter-household variation.
22 | SBIA Manual for REDD+ Projects – Part 2
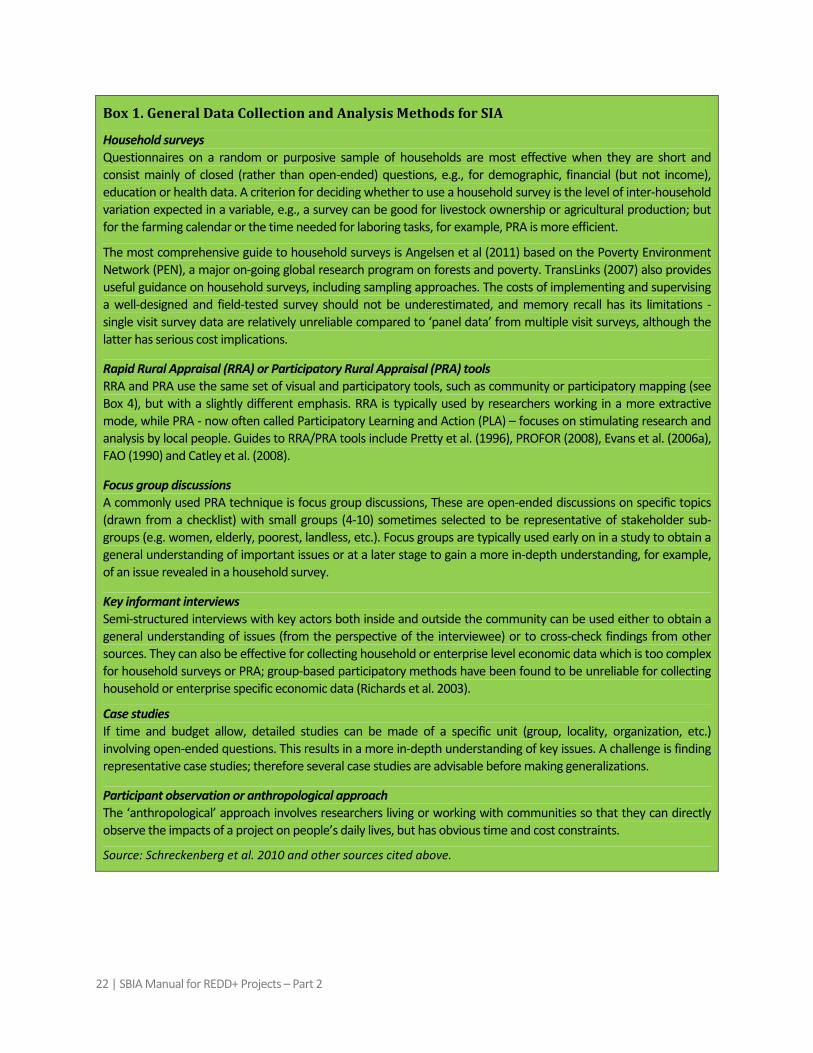
Box 1. General Data Collection and Analysis Methods for SIA
Household surveys Questionnaires on a random or purposive sample of households are most effective when they are short and consist mainly of closed (rather than open-ended) questions, e.g., for demographic, financial (but not income), education or health data. A criterion for deciding whether to use a household survey is the level of inter-household variation expected in a variable, e.g., a survey can be good for livestock ownership or agricultural production; but for the farming calendar or the time needed for laboring tasks, for example, PRA is more efficient.
The most comprehensive guide to household surveys is Angelsen et al (2011) based on the Poverty Environment Network (PEN), a major on-going global research program on forests and poverty. TransLinks (2007) also provides useful guidance on household surveys, including sampling approaches. The costs of implementing and supervising a well-designed and field-tested survey should not be underestimated, and memory recall has its limitations - single visit survey data are relatively unreliable compared to ‘panel data’ from multiple visit surveys, although the latter has serious cost implications.
Rapid Rural Appraisal (RRA) or Participatory Rural Appraisal (PRA) tools RRA and PRA use the same set of visual and participatory tools, such as community or participatory mapping (see Box 4), but with a slightly different emphasis. RRA is typically used by researchers working in a more extractive mode, while PRA - now often called Participatory Learning and Action (PLA) – focuses on stimulating research and analysis by local people. Guides to RRA/PRA tools include Pretty et al. (1996), PROFOR (2008), Evans et al. (2006a), FAO (1990) and Catley et al. (2008).
Focus group discussions A commonly used PRA technique is focus group discussions, These are open-ended discussions on specific topics (drawn from a checklist) with small groups (4-10) sometimes selected to be representative of stakeholder sub-groups (e.g. women, elderly, poorest, landless, etc.). Focus groups are typically used early on in a study to obtain a general understanding of important issues or at a later stage to gain a more in-depth understanding, for example, of an issue revealed in a household survey.
Key informant interviews Semi-structured interviews with key actors both inside and outside the community can be used either to obtain a general understanding of issues (from the perspective of the interviewee) or to cross-check findings from other sources. They can also be effective for collecting household or enterprise level economic data which is too complex for household surveys or PRA; group-based participatory methods have been found to be unreliable for collecting household or enterprise specific economic data (Richards et al. 2003).
Case studies If time and budget allow, detailed studies can be made of a specific unit (group, locality, organization, etc.) involving open-ended questions. This results in a more in-depth understanding of key issues. A challenge is finding representative case studies; therefore several case studies are advisable before making generalizations.
Participant observation or anthropological approach The ‘anthropological’ approach involves researchers living or working with communities so that they can directly observe the impacts of a project on people’s daily lives, but has obvious time and cost constraints.
Source: Schreckenberg et al. 2010 and other sources cited above.
Social Impact Assessment Toolbox | 23
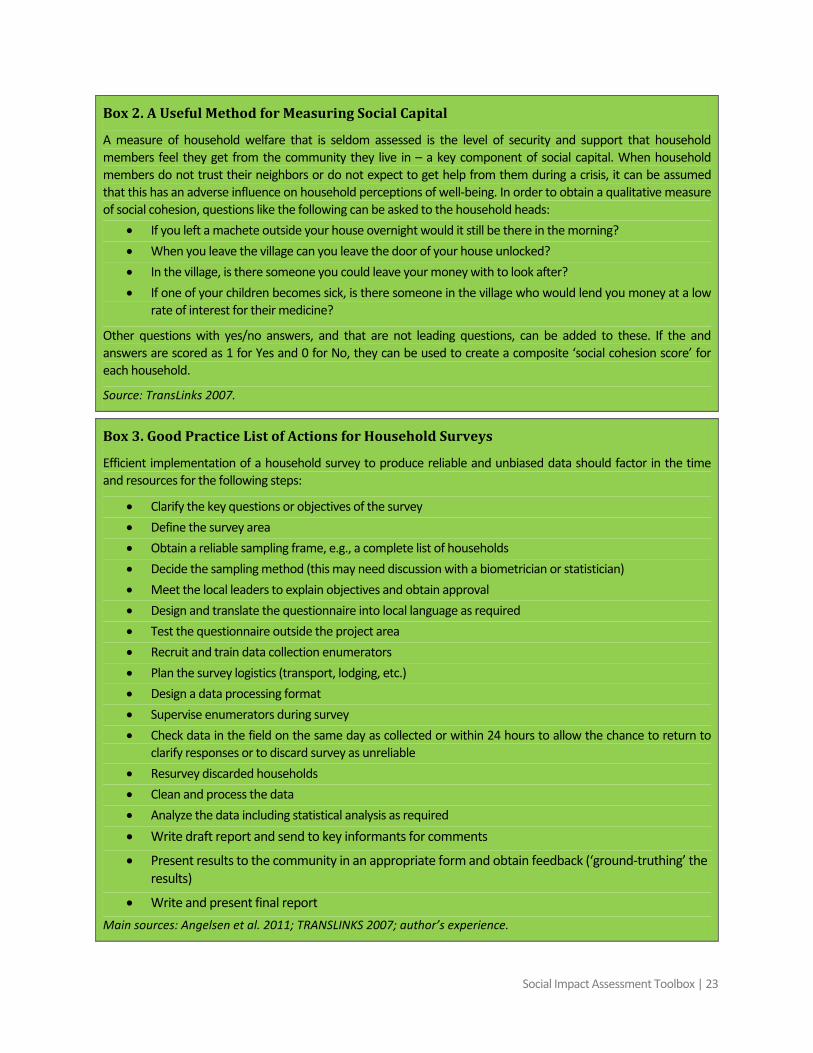
Box 2. A Useful Method for Measuring Social Capital
A measure of household welfare that is seldom assessed is the level of security and support that household members feel they get from the community they live in – a key component of social capital. When household members do not trust their neighbors or do not expect to get help from them during a crisis, it can be assumed that this has an adverse influence on household perceptions of well-being. In order to obtain a qualitative measure of social cohesion, questions like the following can be asked to the household heads:
• If you left a machete outside your house overnight would it still be there in the morning? • When you leave the village can you leave the door of your house unlocked? • In the village, is there someone you could leave your money with to look after? • If one of your children becomes sick, is there someone in the village who would lend you money at a low
rate of interest for their medicine?
Other questions with yes/no answers, and that are not leading questions, can be added to these. If the and answers are scored as 1 for Yes and 0 for No, they can be used to create a composite ‘social cohesion score’ for each household.
Source: TransLinks 2007.
Box 3. Good Practice List of Actions for Household Surveys
Efficient implementation of a household survey to produce reliable and unbiased data should factor in the time and resources for the following steps:
• Clarify the key questions or objectives of the survey • Define the survey area • Obtain a reliable sampling frame, e.g., a complete list of households • Decide the sampling method (this may need discussion with a biometrician or statistician) • Meet the local leaders to explain objectives and obtain approval • Design and translate the questionnaire into local language as required • Test the questionnaire outside the project area • Recruit and train data collection enumerators • Plan the survey logistics (transport, lodging, etc.) • Design a data processing format • Supervise enumerators during survey • Check data in the field on the same day as collected or within 24 hours to allow the chance to return to
clarify responses or to discard survey as unreliable • Resurvey discarded households • Clean and process the data • Analyze the data including statistical analysis as required • Write draft report and send to key informants for comments
• Present results to the community in an appropriate form and obtain feedback (‘ground-truthing’ the results)
• Write and present final report Main sources: Angelsen et al. 2011; TRANSLINKS 2007; author’s experience.
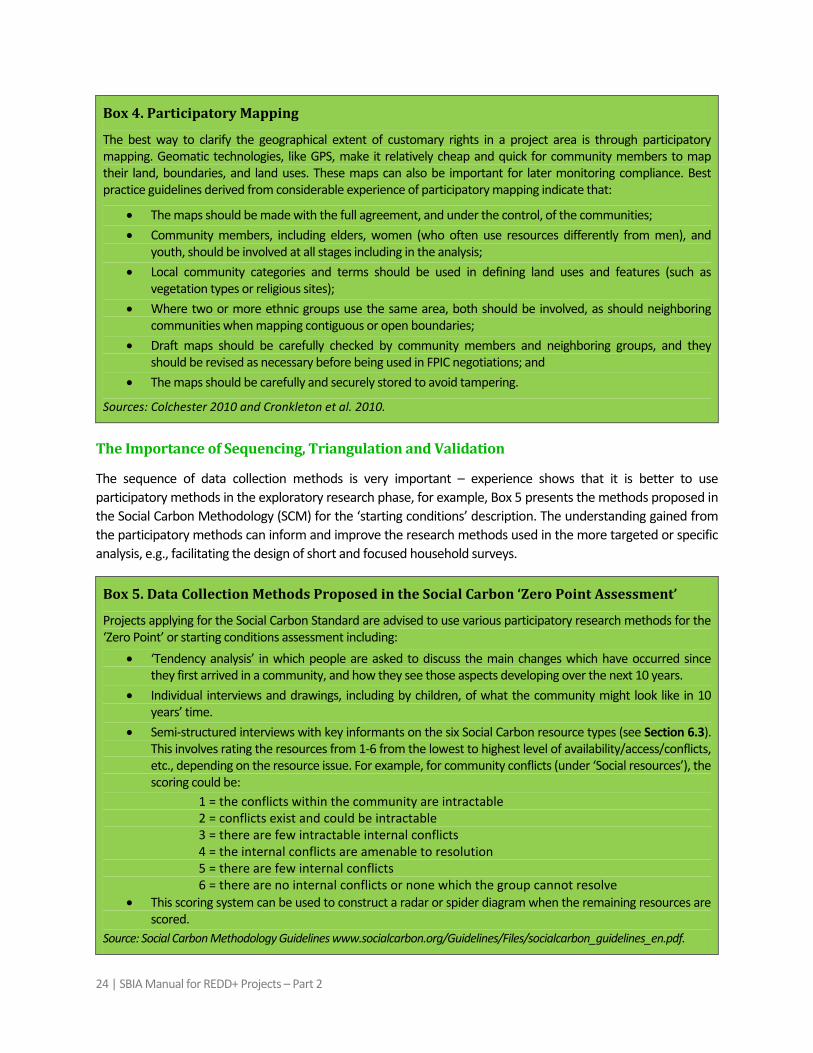
24 | SBIA Manual for REDD+ Projects – Part 2
Box 4. Participatory Mapping
The best way to clarify the geographical extent of customary rights in a project area is through participatory mapping. Geomatic technologies, like GPS, make it relatively cheap and quick for community members to map their land, boundaries, and land uses. These maps can also be important for later monitoring compliance. Best practice guidelines derived from considerable experience of participatory mapping indicate that:
• The maps should be made with the full agreement, and under the control, of the communities; • Community members, including elders, women (who often use resources differently from men), and
youth, should be involved at all stages including in the analysis; • Local community categories and terms should be used in defining land uses and features (such as
vegetation types or religious sites); • Where two or more ethnic groups use the same area, both should be involved, as should neighboring
communities when mapping contiguous or open boundaries; • Draft maps should be carefully checked by community members and neighboring groups, and they
should be revised as necessary before being used in FPIC negotiations; and • The maps should be carefully and securely stored to avoid tampering.
Sources: Colchester 2010 and Cronkleton et al. 2010.
The Importance of Sequencing, Triangulation and Validation
The sequence of data collection methods is very important – experience shows that it is better to use participatory methods in the exploratory research phase, for example, Box 5 presents the methods proposed in the Social Carbon Methodology (SCM) for the ‘starting conditions’ description. The understanding gained from the participatory methods can inform and improve the research methods used in the more targeted or specific analysis, e.g., facilitating the design of short and focused household surveys.
Box 5. Data Collection Methods Proposed in the Social Carbon ‘Zero Point Assessment’
Projects applying for the Social Carbon Standard are advised to use various participatory research methods for the ‘Zero Point’ or starting conditions assessment including:
• ‘Tendency analysis’ in which people are asked to discuss the main changes which have occurred since they first arrived in a community, and how they see those aspects developing over the next 10 years.
• Individual interviews and drawings, including by children, of what the community might look like in 10 years’ time.
• Semi-structured interviews with key informants on the six Social Carbon resource types (see Section 6.3). This involves rating the resources from 1-6 from the lowest to highest level of availability/access/conflicts, etc., depending on the resource issue. For example, for community conflicts (under ‘Social resources’), the scoring could be:
1 = the conflicts within the community are intractable 2 = conflicts exist and could be intractable 3 = there are few intractable internal conflicts 4 = the internal conflicts are amenable to resolution 5 = there are few internal conflicts 6 = there are no internal conflicts or none which the group cannot resolve
• This scoring system can be used to construct a radar or spider diagram when the remaining resources are scored.
Source: Social Carbon Methodology Guidelines www.socialcarbon.org/Guidelines/Files/socialcarbon_guidelines_en.pdf.
Social Impact Assessment Toolbox | 25
It is always good practice to “triangulate” using different data collection methods. A single data collection or research method on its own can lead to erroneous results, for example, due to unidentified bias in either participatory or survey methods. Two research methods can sometimes give surprisingly different results, in which case a third research method may be needed.
The feedback of research results to communities and validation is an essential part of any data collection and analysis process. It provides some degree of ownership or engagement of local or primary stakeholders, and is important for ground-truthing. Feedback should be an iterative process, with one or more feedback sessions before the research team leaves the community (for example, to check on key assumptions or linkages) followed by a final check when data analysis is complete.
3.2 Main Sources and Further Guidance
Schreckenberg et al. (2010) provide an overview and discuss differentiation and other key issues: http://www.careclimatechange.org/files/reports/SAPA_IIED_Social_Assessment.pdf.
TransLinks (2007) presents useful general guidance: http://rmportal.net/library/content/translinks/LivelihoodSurveys_Manual_WCS_2007.pdf/view.
For household surveys:
Angelsen et al. (2011) provides comprehensive guidance on the use of household surveys based on the work of the CIFOR Poverty and Environment Network (PEN).
Catley et al. (2008) present a suite of ‘participatory impact assessment’ methods: http://www.scribd.com/doc/15436957/Participatory-Impact-Assessment-a-Guide-for-Practitioners.
For participatory research methods:
The Forests-Poverty Linkages Toolkit (PROFOR 2008) includes a range of methods: http://www.profor.info/profor/node/103.
Pretty et al. (1996) is the most comprehensive source of ‘participatory learning and action (PLA) tools: http://books.google.com/books?id=uu-BPsudVogC&pg=PA152&source=gbs_selected_pages&cad=3#v=onepage&q&f=false.
Evans et al. (2006a) summarize some key methods: http://www.cifor.cgiar.org/publications/pdf_files/Books/BKristen0601.pdf.
26 | SBIA Manual for REDD+ Projects – Part 2
4. Stakeholder Analysis
4.1 Introduction
Stakeholder analysis is a key tool for SBIA. Identification of the different stakeholder groups and sub-groups, their interests and interactions with other stakeholder groups, and their likely reaction to project interventions or external pressures, are critical elements of SBIA. It is very important for the starting conditions study (SBIA Stage 1) and indeed for all the main SBIA Stages. Appropriate identification and analysis of the stakeholders also permits a robust participatory design and consultation process. Projects that don’t do a good job at understanding their stakeholders risk implementing misguided activities and monitoring the wrong things. Good stakeholder analysis is essential.
4.2 Description of Method
The following proposed steps are adapted from CARE (2002) and PROFOR (2008):
This brainstorm should start by listing all the people or groups who might have an influence over or be impacted by a project. It should include discussions of how these people and groups are impacted by the current situation, and how a land-based carbon project would impact them. This should include stakeholders living outside the project area who could be indirectly impacted by the project.
1. Brainstorm with key informants or focus groups to list and classify stakeholders
There are many ways of classifying stakeholders, and it will be a case of what classification makes most sense in the project context. Categories of stakeholders, including stakeholder sub-groups, that can emerge include:10
• Wealth or well-being groups derived from a participatory ranking exercise (see below)
• Women as a distinctive stakeholder group: lack of attention to gender differentiated roles and interests can reinforce gender inequities (see Box 6)
• Livelihood-based stakeholder groups (e.g., charcoal makers, bushmeat hunters, NTFP collectors, etc.) • Local stakeholders classified according to land tenure and/or landholding • Different ethnic groups • Local leaders • Grass roots or community-based organizations • NGOs • Local government • District or regional government • National government • Influential or powerful individuals from any of the above groups • Insiders and outsiders
10 Groups identified in this list are deliberately overlapping.
Social Impact Assessment Toolbox | 27
Box 6. Gender Matters: Differentiating Women as Stakeholders
Women and men often have very different roles and interests in natural resource management and can contribute complementary skills and knowledge. Though the roles will vary by culture, men often work with timber or commercial NTFP extraction, while women tend to be more prominent in planting, protecting, or caring for seedlings and small trees, as well as in home orchards and public land. Generally, women are more involved in subsistence activities, but in some cultures they are very involved in marketing NTFPs and other produce that they grow or collect.
Men and women have different levels of influence, power, and control over land and natural resources. Women often have limited de jure land rights but can be more important de facto resource users. This can result in stakeholder conflicts which need to be understood.
Working with women as a separate stakeholder group can result in increased overall levels of participation due to greater involvement and commitment of women (and probably children). There is also evidence that when women receive income, positive welfare outcomes are more likely: gender equity can thus be key to wider poverty and equity impacts.
Finally, it is worth noting research in India and Nepal which reveals that forest management groups with a larger percentage of women in their executive committees have achieved substantially greater improvements in forest condition.
Sources: Mainly based on Agarwal 2009 and 2010.
Given the importance of equity issues in SBIA, a wealth or well-being ranking exercise is advisable. It is well established that the tendency in most project types is for ‘elite capture’ and for the poorest to lose out, as has happened with the majority of community forestry experiences (McDermott & Schreckenberg 2009). A wealth ranking exercise should also lead to a better understanding of local perceptions of well-being and poverty, and can also generate a useful sampling frame for household surveys. As described by PROFOR (2008) a wealth or well-being ranking exercise involves the following stages:
2. Wealth or well-being ranking of local or community stakeholders
• Undertake a community mapping exercise to identify and list all households
• Write down the names of the household heads on cards, one per card
• Consult with key informants and focus groups on poverty or well-being categories. In the case of the Nepal Swiss Community Forestry Project (PROFOR, 2008), this resulted in six wealth categories: capable, improving poor, coping poor, declining poor, extreme poor and incapable poor. In other studies, the number of months of household food reserve is a common wealth ‘numeraire’ (note: this stage could be undertaken first)
• Select ‘representative’, respected and knowledgeable key informants, including some women
• Get the key informants to classify the cards (households) into the wealth or well-being categories
A different approach to looking at well-being, and to deciding on the equity importance of stakeholder groups, is the “Who Counts First?” matrix (Colfer 1999) described in Box 7. Another alternative is the Basic Necessities Survey (BNS), described in Section 8.
28 | SBIA Manual for REDD+ Projects – Part 2
Box 7. The “Who Counts First?” Matrix
The “Who Counts First?” matrix evolved as part of the “Criteria and Indicators” for sustainable forest management process of CIFOR. It involves ranking stakeholder groups according to seven dimensions of well-being or importance:
• Proximity to the forest • Pre-existing rights • Dependency on the forest • Poverty level • Local or indigenous knowledge • Forest/culture integration (i.e., the cultural importance of the forest) • Power deficit of stakeholder group compared to other stakeholders
Some of these dimensions will need considerable research, for example, of the pre-existing rights of each stakeholder group, their poverty level and power deficit situations. Then each stakeholder group is scored, according to the extent that each dimension applies to them, with the following simple scoring system: 1 = high 2 = medium 3 = low var = variable
The scores are then added together (except for the “variable” answers) and an average over the seven dimensions estimated (e.g., 1.9). In the case study applications of this method a cut-off point of 2 has been used – in other words, stakeholder groups with less than 2 are regarded as important stakeholders from an equity perspective, while those scoring 2 or more are regarded as less critical.
Source: Colfer 1999.
An important challenge for a wealth ranking exercise is to decide an appropriate level of disaggregation of the local stakeholders: the greater the number of stakeholder groups or sub-groups, the greater will be the complexity and cost of data collection and analysis.
This information can be summarized in Table 5. Venn diagrams are also very useful for analyzing relationships between stakeholders, as shown by the example in Figure 5.
3. Analyze each stakeholder group in terms of their interests, motivation to participate and relationships with other stakeholders
Table 5: Stakeholder Analysis Profile Matrix
Stakeholder or stakeholder sub-group
Interests in the project
Effect of project on their interest(s)
Capacity and motivation to participate
Relationship with other stakeholders (Partnership/Conflict)?
Source: CARE 2002.
Social Impact Assessment Toolbox | 29
Influence refers to the extent to which a stakeholder or stakeholder group has power over the project, and can therefore facilitate or hinder project interventions, and Importance refers to how much the achievement of project goals depends upon the involvement of a given stakeholder. Stakeholders with high levels of influence and importance should be considered as potential project partners. Table 6 may be useful for assessing the relative influence and importance of different stakeholder groups; if it is difficult to separate influence and importance, they can be combined.
4. Analyze the level of influence and importance of each potential stakeholder group
Table 6: Relative Influence and Importance of Key Stakeholders
Influence of Stakeholder group
Importance of stakeholder to project achievement
Unknown Low Moderate Significant Critical Low Moderate Significant Highly influential
Source: CARE 2002.
Another approach is to use a Venn diagram as explained in Box 8. An example of a Venn diagram is presented in Figure 5; this is based on a hypothetical example of an indigenous people’s community with a forest management plan, and which wants to ensure the long-term viability of legal commercial forest management in the region.
Box 8: Use of Venn Diagrams for Stakeholder Analysis
Participants should firstly cut three sizes of circles – at least two sets of circles using different colored cards. One color is for ‘insider stakeholders’ and another is for ‘outsider stakeholders.’ For each ‘outsider stakeholder’, the participants need to decide the importance of their involvement in the project, and select the corresponding size of circle:
• Little importance = small circle • Some or significant importance = middle sized circle • Very important = large circle
The name of the ‘insider’ stakeholder or stakeholder groups can then be written on the appropriate sized circles/cards. This should be repeated for all ‘insider’ stakeholders using the other colored card. When all stakeholders have been represented, the circles should be organized and stuck to a flipchart, grouping and placing the circles according to the relationships between the stakeholders: the closer the relationship between two stakeholders, the closer should be the circles on the flipchart.
The next stage is to cut three sizes of triangles from different colored cards. For each stakeholder (group), a small, medium or large triangle should be chosen to represent the degree of influence that the stakeholder has on the project. The triangle should then be stuck on the edge of the stakeholder circle. A stakeholder with a small ‘importance circle’ could have a large ‘influence triangle’ and vice versa. The overlap of the circles represents the extent of the relationship between stakeholders (see Figure 5). Once the diagram is complete, it should be reviewed by the wider group, which should continue to discuss the relative importance and influence of each stakeholder or stakeholder group until a consensus is reached.
Source: Evans et al. 2006b.
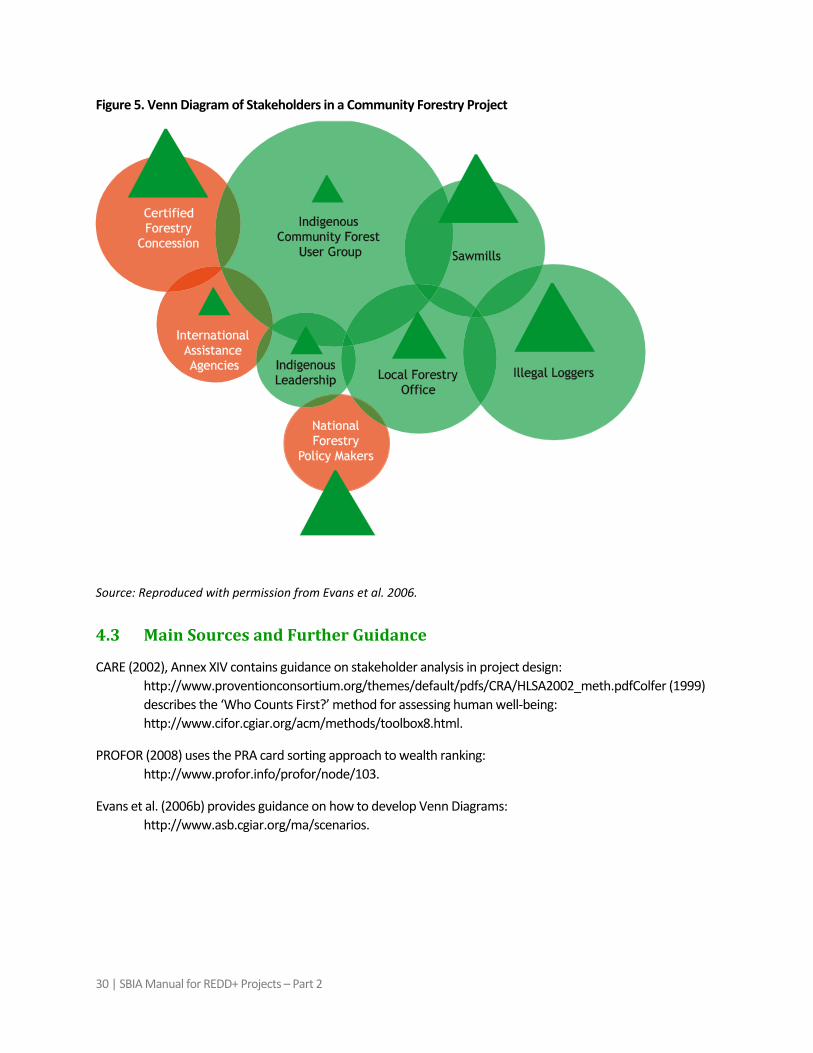
30 | SBIA Manual for REDD+ Projects – Part 2
Figure 5. Venn Diagram of Stakeholders in a Community Forestry Project
Source: Reproduced with permission from Evans et al. 2006.
4.3 Main Sources and Further Guidance
CARE (2002), Annex XIV contains guidance on stakeholder analysis in project design: http://www.proventionconsortium.org/themes/default/pdfs/CRA/HLSA2002_meth.pdfColfer (1999) describes the ‘Who Counts First?’ method for assessing human well-being: http://www.cifor.cgiar.org/acm/methods/toolbox8.html.
PROFOR (2008) uses the PRA card sorting approach to wealth ranking: http://www.profor.info/profor/node/103.
Evans et al. (2006b) provides guidance on how to develop Venn Diagrams: http://www.asb.cgiar.org/ma/scenarios.
Social Impact Assessment Toolbox | 31
5. Scenario Analysis
5.1 Introduction
Scenarios are stories about the future. They are creative answers to the question: “What if…?” Scenarios encourage stakeholders to consider the range of changes that could occur in the future, and to think about their likely outcomes and impacts. It can be helpful to explain scenario building by comparing a scenario to a film or movie (Box 9). Scenario Analysis is mainly useful for SBIA Stages 2, 3, and 4. It can help build the ‘without project’ scenario and the project theory of change, and consideration of potential negative impacts.
Box 9. What Makes a Successful Scenario?
A film has actors, action, scenes, conflict, comedy, drama, and happy or sad endings. A scenario should have the same elements as a good film. The participants should be encouraged to stretch their imaginations to think about what might happen in the community, for example, considering storylines that are unlikely but plausible. If the stories are dull and predictable, the participants are probably not thinking outside their traditional boundaries. The most successful scenarios are ones in which there are interesting comparisons between two or more of the storylines, and where the storylines stretch beyond what most people are already thinking about.
Source: Evans et al. 2006b.
5.2 Description of Method
Six main steps are proposed by Evans et al. (2006b), although the order of these is flexible.
This activity encourages participants to think about change, even when a situation might appear to be quite stable. A long timeframe such as a hundred or even a thousand years can be selected - the longest timeframe understandable to the group. This may require taping several sheets of flipchart paper together. The participants are then asked to write or draw important local events on the timeline, and to identify different historical ‘eras’ and trends. The changes and factors causing the changes are then discussed and identified. It is often helpful to invite a community elder to lead this discussion.
Step 1: Identify historical eras of change and renewal
In some communities, participants may not be used to thinking in terms of historical eras, or historical information on the area may not be readily available, which may mean that outside resources (e.g., regional historians) need to be brought in if this is acceptable.
The focal questions are the main concerns or topics of the exercise. The scenarios should ultimately answer these questions. The group should be asked:
Step 2: Identify the “focal questions”
• What are your main concerns for the future without the project?
• What are your main concerns or issues with the project?
32 | SBIA Manual for REDD+ Projects – Part 2
The participants can brainstorm as a group or individually by writing issues or concerns down on cards. This step can also be done firstly in breakout groups and the results compared in a plenary session. When the groups have narrowed the issues down to a few key or focal questions, these should be written on flipchart paper and stuck to the wall. The focal questions should be referred to frequently to ensure the exercise is ‘on track’.
Driving forces are factors that might influence the future of the community. It is best to split into breakout groups to brainstorm driving forces. The following questions can help kick-start these brainstorm sessions:
Step 3: Identify the ‘driving forces’
• Given the historical eras that we identified, what do you see as the key drivers of these eras? Do you think these drivers will continue to be important in the future?
• What are the most important changes happening in your community? What is causing these changes?
• What things have stayed the same in the community, and what is keeping them stable?
• What environmental changes (especially re forests, streams, rivers, animals, etc.) have happened, and what is causing these changes?
• How are natural resources currently being used in your community?
• Do you expect this to change? Why?
• How is farming undertaken in this area? Has it been changing?
• How has the government impacted on the village?
• How does the village interact with the government?
• How do most people here make a living? Do you expect this to change? How?
• How do you think your children will be different from you? Why?
It is also possible for a facilitator to introduce a driving force which the participants do not seem to be aware of, although s(he) should be careful not to direct the process too heavily.
The driving forces should be classified into ‘certain’ and ‘uncertain’ driving forces. Certain driving forces have a fairly obvious direction or result, while uncertain driving forces are those with an unclear direction and where the impacts are not obvious. For example, the government might be discussing building a new road through the region, but whether it will go ahead is uncertain, and if it does go ahead, the effects on the community are also uncertain. It is also useful to discuss which driving forces are ‘opportunities’ and which ones are ‘threats’. An example of driving forces is presented in Box 10.
Box 10. Driving Forces in a Community in the Bolivian Amazon
For most families in the northern part of the Bolivian Amazon, Brazil nut collection provides the only significant source of cash income. However, many aspects of Brazil nut production and marketing are beyond the control of local people. For instance, the price of the nut is set by international markets and varies widely from year to year. Transportation in the region is poor and unreliable, particularly in the rainy season when the nuts are collected. In Scenario exercises, the communities identified that the two most important driving forces were the price of Brazil nut and the quality of transportation to their village. The price of Brazil nuts was an uncertain driving force, while transportation quality was somewhat more certain.
Source: Evans et al. 2006b.
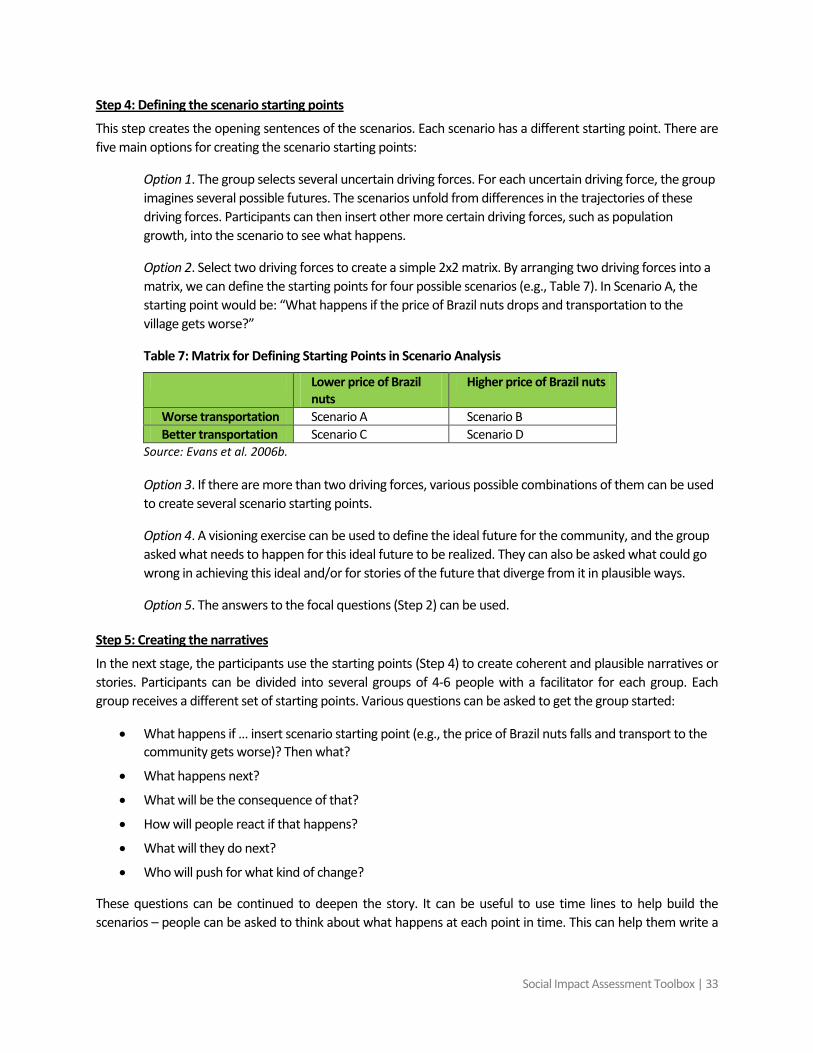
Social Impact Assessment Toolbox | 33
This step creates the opening sentences of the scenarios. Each scenario has a different starting point. There are five main options for creating the scenario starting points:
Step 4: Defining the scenario starting points
Option 1. The group selects several uncertain driving forces. For each uncertain driving force, the group imagines several possible futures. The scenarios unfold from differences in the trajectories of these driving forces. Participants can then insert other more certain driving forces, such as population growth, into the scenario to see what happens.
Option 2. Select two driving forces to create a simple 2x2 matrix. By arranging two driving forces into a matrix, we can define the starting points for four possible scenarios (e.g., Table 7). In Scenario A, the starting point would be: “What happens if the price of Brazil nuts drops and transportation to the village gets worse?”
Table 7: Matrix for Defining Starting Points in Scenario Analysis
Lower price of Brazil nuts
Higher price of Brazil nuts
Worse transportation Scenario A Scenario B Better transportation Scenario C Scenario D
Source: Evans et al. 2006b.
Option 3. If there are more than two driving forces, various possible combinations of them can be used to create several scenario starting points.
Option 4. A visioning exercise can be used to define the ideal future for the community, and the group asked what needs to happen for this ideal future to be realized. They can also be asked what could go wrong in achieving this ideal and/or for stories of the future that diverge from it in plausible ways.
Option 5. The answers to the focal questions (Step 2) can be used.
In the next stage, the participants use the starting points (Step 4) to create coherent and plausible narratives or stories. Participants can be divided into several groups of 4-6 people with a facilitator for each group. Each group receives a different set of starting points. Various questions can be asked to get the group started:
Step 5: Creating the narratives
• What happens if … insert scenario starting point (e.g., the price of Brazil nuts falls and transport to the community gets worse)? Then what?
• What happens next?
• What will be the consequence of that?
• How will people react if that happens?
• What will they do next?
• Who will push for what kind of change?
These questions can be continued to deepen the story. It can be useful to use time lines to help build the scenarios – people can be asked to think about what happens at each point in time. This can help them write a
34 | SBIA Manual for REDD+ Projects – Part 2
story. Each group should develop at least two scenarios - this will stimulate their thinking about different outcomes or impacts.
The facilitator should also point out any inconsistencies and ask the participants to reconcile them. It is important that the story includes the entire cast of characters as well as other identified driving forces. If the group loses focus, the facilitator needs to bring the discussion back on track. A good way of breaking a roadblock is to get the breakout groups to come up with outlines for a set of three to four stories in 45 minutes or less. This process can be repeated a few times, with full group discussions in between, to deepen the stories.
Once the group has reached the logical end of a story, someone from the group should read it to the rest of the group which should review and correct it. Finally it is essential to have a note taker (not the facilitator) recording the discussions as the scenarios are developed.
5.3 Main Sources and Further Guidance
Evans et al. (2006b) present a thorough description of scenario analysis: http://www.asb.cgiar.org/PDFwebdocs/Evans-et-al-2006-Field-guide-to-the-future.pdf.
Wollenberg et al. (2000) describe some variants of scenario analysis, notably “projection scenarios” and “alternative scenarios”: http://www.cifor.cgiar.org/acm/methods/fs.html.
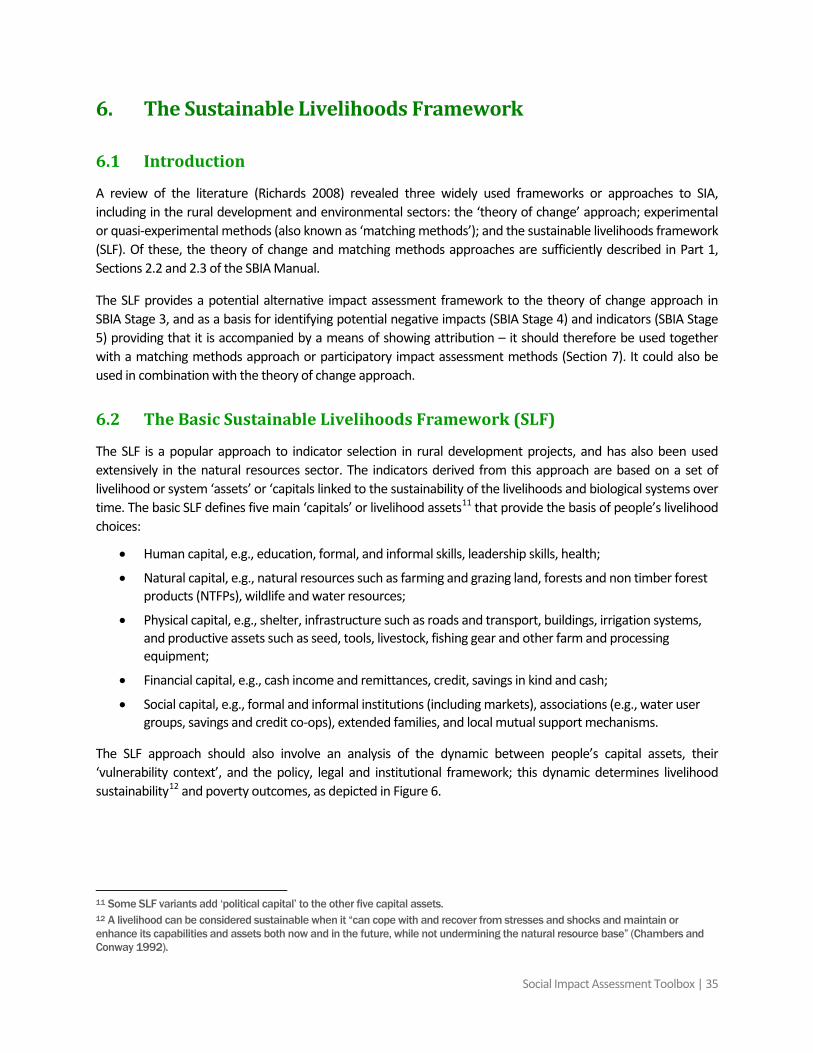
Social Impact Assessment Toolbox | 35
6. The Sustainable Livelihoods Framework
6.1 Introduction
A review of the literature (Richards 2008) revealed three widely used frameworks or approaches to SIA, including in the rural development and environmental sectors: the ‘theory of change’ approach; experimental or quasi-experimental methods (also known as ‘matching methods’); and the sustainable livelihoods framework (SLF). Of these, the theory of change and matching methods approaches are sufficiently described in Part 1, Sections 2.2 and 2.3 of the SBIA Manual.
The SLF provides a potential alternative impact assessment framework to the theory of change approach in SBIA Stage 3, and as a basis for identifying potential negative impacts (SBIA Stage 4) and indicators (SBIA Stage 5) providing that it is accompanied by a means of showing attribution – it should therefore be used together with a matching methods approach or participatory impact assessment methods (Section 7). It could also be used in combination with the theory of change approach.
6.2 The Basic Sustainable Livelihoods Framework (SLF)
The SLF is a popular approach to indicator selection in rural development projects, and has also been used extensively in the natural resources sector. The indicators derived from this approach are based on a set of livelihood or system ‘assets’ or ‘capitals linked to the sustainability of the livelihoods and biological systems over time. The basic SLF defines five main ‘capitals’ or livelihood assets11
• Human capital, e.g., education, formal, and informal skills, leadership skills, health;
that provide the basis of people’s livelihood choices:
• Natural capital, e.g., natural resources such as farming and grazing land, forests and non timber forest products (NTFPs), wildlife and water resources;
• Physical capital, e.g., shelter, infrastructure such as roads and transport, buildings, irrigation systems, and productive assets such as seed, tools, livestock, fishing gear and other farm and processing equipment;
• Financial capital, e.g., cash income and remittances, credit, savings in kind and cash;
• Social capital, e.g., formal and informal institutions (including markets), associations (e.g., water user groups, savings and credit co-ops), extended families, and local mutual support mechanisms.
The SLF approach should also involve an analysis of the dynamic between people’s capital assets, their ‘vulnerability context’, and the policy, legal and institutional framework; this dynamic determines livelihood sustainability12
and poverty outcomes, as depicted in Figure 6.
11 Some SLF variants add ‘political capital’ to the other five capital assets. 12 A livelihood can be considered sustainable when it “can cope with and recover from stresses and shocks and maintain or enhance its capabilities and assets both now and in the future, while not undermining the natural resource base” (Chambers and Conway 1992).
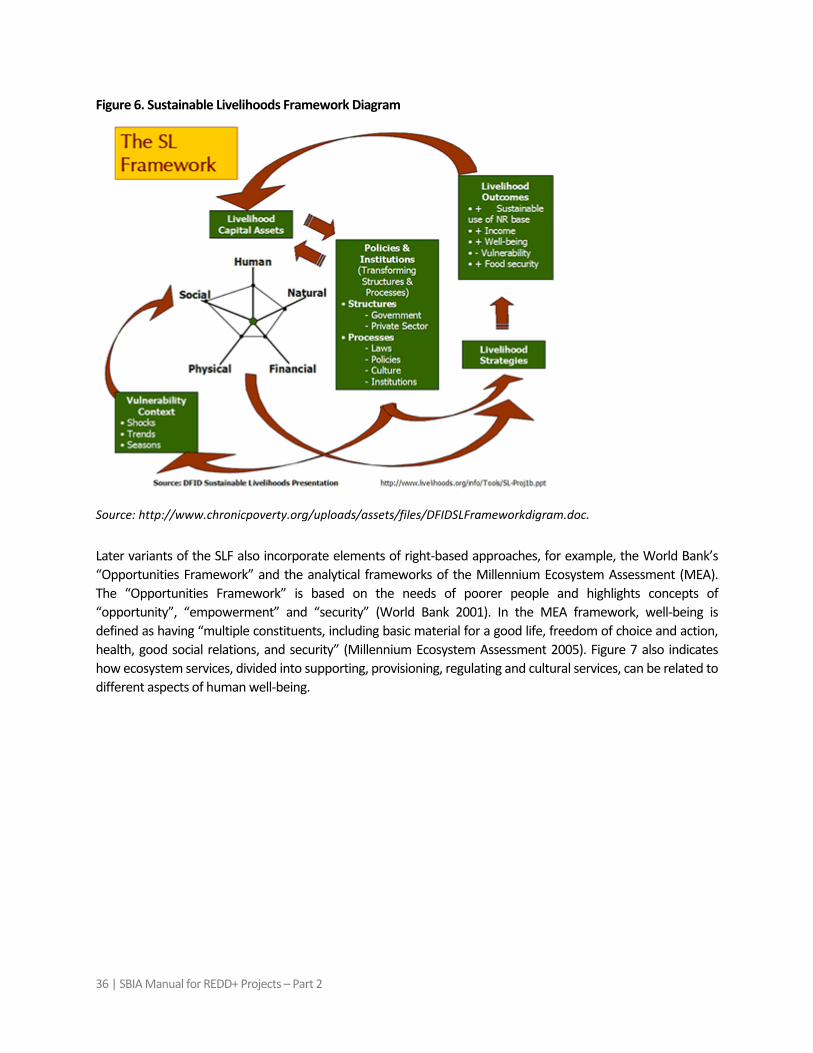
36 | SBIA Manual for REDD+ Projects – Part 2
Figure 6. Sustainable Livelihoods Framework Diagram
Source: http://www.chronicpoverty.org/uploads/assets/files/DFIDSLFrameworkdigram.doc.
Later variants of the SLF also incorporate elements of right-based approaches, for example, the World Bank’s “Opportunities Framework” and the analytical frameworks of the Millennium Ecosystem Assessment (MEA). The “Opportunities Framework” is based on the needs of poorer people and highlights concepts of “opportunity”, “empowerment” and “security” (World Bank 2001). In the MEA framework, well-being is defined as having “multiple constituents, including basic material for a good life, freedom of choice and action, health, good social relations, and security” (Millennium Ecosystem Assessment 2005). Figure 7 also indicates how ecosystem services, divided into supporting, provisioning, regulating and cultural services, can be related to different aspects of human well-being.
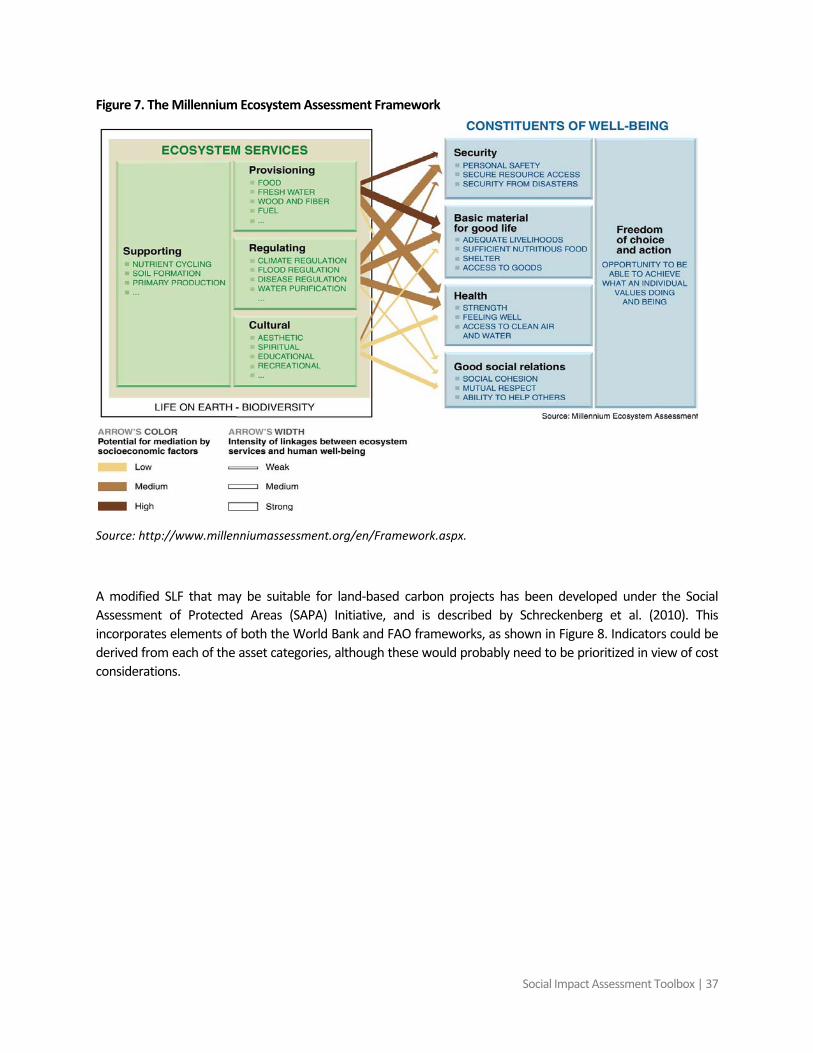
Social Impact Assessment Toolbox | 37
Figure 7. The Millennium Ecosystem Assessment Framework
Source: http://www.millenniumassessment.org/en/Framework.aspx.
A modified SLF that may be suitable for land-based carbon projects has been developed under the Social Assessment of Protected Areas (SAPA) Initiative, and is described by Schreckenberg et al. (2010). This incorporates elements of both the World Bank and FAO frameworks, as shown in Figure 8. Indicators could be derived from each of the asset categories, although these would probably need to be prioritized in view of cost considerations.
38 | SBIA Manual for REDD+ Projects – Part 2
Figure 8. Modified Sustainable Livelihoods Framework (SAPA Initiative)
Source: Reproduced with permission from Schreckenberg et al. 2010.
6.3 The Social Carbon Methodology (SCM)
The main application of the SLF to land-based carbon projects has been through the Social Carbon Methodology (SCM). This was developed by the Instituto Ecologico, Brazil, and is linked to validation under the Social Carbon Standard (http://www.socialcarbon.org/). There are six capitals or 'resources' in the SCM approach – natural, financial, human, social, carbon, and biodiversity resources. The SCM involves the following stages (Social Carbon 2009):
• Undertake a diagnosis or 'zero point assessment' involving questionnaires, semi-structured interviews of key informants, focus groups and other meetings. This should result in a description of all the possible social, economic and environmental impacts;
• Select indicators from a list of approved indicators for each resource type (see Section 9.1 for a list of these) or apply for approval of new indicators;13
• Monitor the indicators using the 'zero point assessment' as the baseline, resulting in annual or periodic monitoring reports;
13New indicators have to be identified by “Accredited Organizations” and submitted for approval by the Social Carbon Team (Social Carbon 2009).
Natural - Provisioning - Regulating - Supporting
Financial - Income - Savings / Credit - Alternative livelihoods
Human - Health - Education - Food security
Physical - Built assets - Non-built assets
Political / Legal - Rights - Empowerment - Participation - Gender/age/class - Governance
Social / Cultural - Networks - Status - Cultural traditions
Livelihood strategies - individual - household - community - local and distant stakeholders
Vulnerability context - Shocks - Trends - Seasonality
Drivers - Policies - Institutions - Markets
Social Impact Assessment Toolbox | 39
• Get the stakeholders to assess the project performance over time through the use of spider diagrams based on measurement of the indicators;
• Undergo periodic, preferably annual, verification by an accredited Certifying Entity. Verification is based not on the absolute performance of the indicators, but on their continuous improvement over time – the main thing is to avoid a decline in the performance of the same ‘resource’ in successive assessments.
In addition to the approved indicators, project developers are advised to focus on the resource base, income, well-being, vulnerability and food security, including:
• community aspirations;
• the survival strategies adopted;
• vulnerabilities and opportunities to which local people are exposed (shocks, trends, seasonality, stresses);
• gender impacts;
• discrimination against the less educated, women and other groups; and,
• the influences of other projects, national policies and institutions (with the aim of highlighting political and social influences that may be influenced through partnerships).
6.4 The Landscape Outcomes Assessment Methodology (LOAM)
The Landscape Outcomes Assessment Methodology (LOAM) is a participatory and practical method of identifying indicators based on the SLF. It was developed by the WWF as a project design and monitoring framework for landscape oriented sustainable livelihood and biodiversity conservation projects (Aldrich and Sayer 2007). LOAM involves the following main steps:
1. Identify a small group of key informants (e.g., 20) covering all parties or stakeholders with an interest in the landscape and project.
2. Undertake a participatory learning assessment (PLA) exercise with the multiple stakeholder group. In the LOAM case studies undertaken to date, specific research methods have included scenario analysis (exploring the worst and best case scenarios), participatory mapping, and historical time-line analysis. The PLA methods are used to get people to discuss their core problems, and the possible project strategies for confronting them.
3. Discuss the possible landscape-level outcomes and "what constitutes success" in terms of the five SLF asset types, and for a sixth asset type called "global conservation assets" covering ecosystem services. From these discussions, progress indicators are defined for each asset type. The indicators are grouped for each asset type on an Excel sheet.
4. Select about five indicators for each asset type, as shown in Table 8, which presents an example of LOAM indicators and scoring for the livelihood and social variables identified for a Joint Forest Management project in Tanzania. For each indicator, a 1-5 scoring system is worked out with the stakeholders, e.g., for the management of village finances, the agreed scoring was:
1 = very poor management; 2 = some management capacity; 3 = intermediate level of management;
4 = good management; 5 = excellent transparent process.
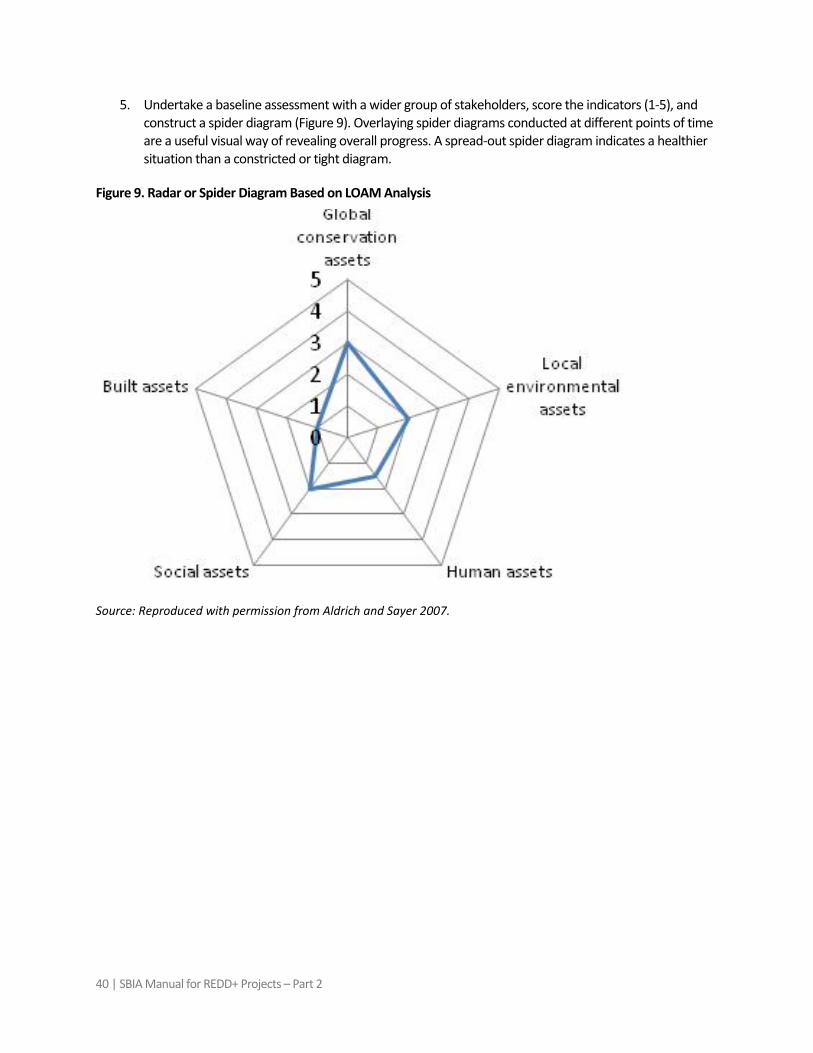
40 | SBIA Manual for REDD+ Projects – Part 2
5. Undertake a baseline assessment with a wider group of stakeholders, score the indicators (1-5), and construct a spider diagram (Figure 9). Overlaying spider diagrams conducted at different points of time are a useful visual way of revealing overall progress. A spread-out spider diagram indicates a healthier situation than a constricted or tight diagram.
Figure 9. Radar or Spider Diagram Based on LOAM Analysis
Source: Reproduced with permission from Aldrich and Sayer 2007.
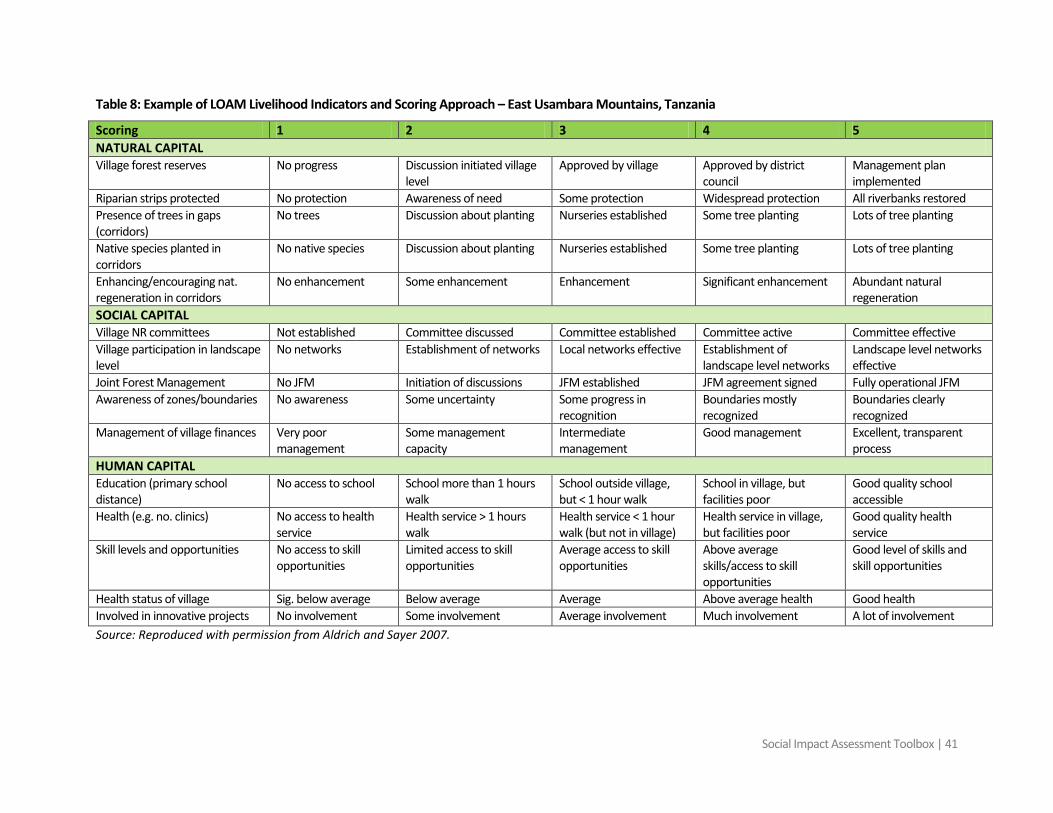
Social Impact Assessment Toolbox | 41
Table 8: Example of LOAM Livelihood Indicators and Scoring Approach – East Usambara Mountains, Tanzania
Scoring 1 2 3 4 5 NATURAL CAPITAL Village forest reserves No progress Discussion initiated village
level Approved by village Approved by district
council Management plan implemented
Riparian strips protected No protection Awareness of need Some protection Widespread protection All riverbanks restored Presence of trees in gaps (corridors)
No trees Discussion about planting Nurseries established Some tree planting Lots of tree planting
Native species planted in corridors
No native species Discussion about planting Nurseries established Some tree planting Lots of tree planting
Enhancing/encouraging nat. regeneration in corridors
No enhancement Some enhancement Enhancement Significant enhancement Abundant natural regeneration
SOCIAL CAPITAL Village NR committees Not established Committee discussed Committee established Committee active Committee effective Village participation in landscape level
No networks Establishment of networks Local networks effective Establishment of landscape level networks
Landscape level networks effective
Joint Forest Management No JFM Initiation of discussions JFM established JFM agreement signed Fully operational JFM Awareness of zones/boundaries No awareness Some uncertainty Some progress in
recognition Boundaries mostly recognized
Boundaries clearly recognized
Management of village finances Very poor management
Some management capacity
Intermediate management
Good management Excellent, transparent process
HUMAN CAPITAL Education (primary school distance)
No access to school School more than 1 hours walk
School outside village, but < 1 hour walk
School in village, but facilities poor
Good quality school accessible
Health (e.g. no. clinics) No access to health service
Health service > 1 hours walk
Health service < 1 hour walk (but not in village)
Health service in village, but facilities poor
Good quality health service
Skill levels and opportunities No access to skill opportunities
Limited access to skill opportunities
Average access to skill opportunities
Above average skills/access to skill opportunities
Good level of skills and skill opportunities
Health status of village Sig. below average Below average Average Above average health Good health Involved in innovative projects No involvement Some involvement Average involvement Much involvement A lot of involvement Source: Reproduced with permission from Aldrich and Sayer 2007.
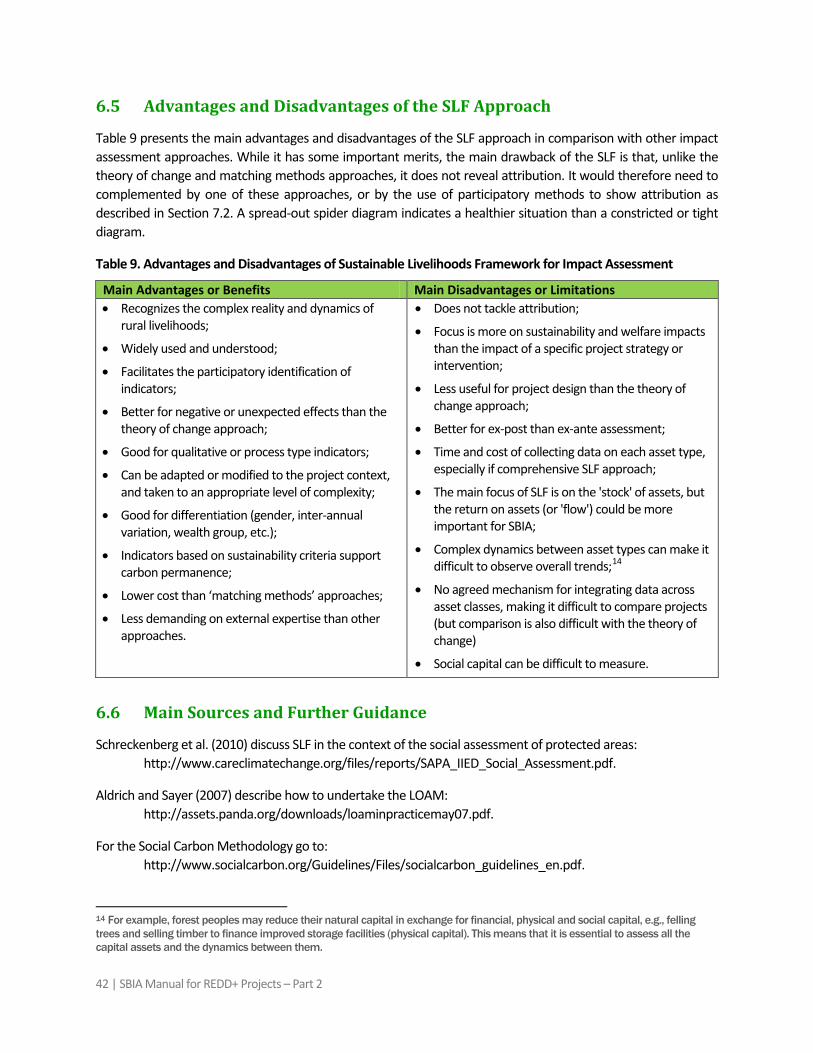
42 | SBIA Manual for REDD+ Projects – Part 2
6.5 Advantages and Disadvantages of the SLF Approach
Table 9 presents the main advantages and disadvantages of the SLF approach in comparison with other impact assessment approaches. While it has some important merits, the main drawback of the SLF is that, unlike the theory of change and matching methods approaches, it does not reveal attribution. It would therefore need to complemented by one of these approaches, or by the use of participatory methods to show attribution as described in Section 7.2. A spread-out spider diagram indicates a healthier situation than a constricted or tight diagram.
Table 9. Advantages and Disadvantages of Sustainable Livelihoods Framework for Impact Assessment
Main Advantages or Benefits Main Disadvantages or Limitations • Recognizes the complex reality and dynamics of
rural livelihoods;
• Widely used and understood;
• Facilitates the participatory identification of indicators;
• Better for negative or unexpected effects than the theory of change approach;
• Good for qualitative or process type indicators;
• Can be adapted or modified to the project context, and taken to an appropriate level of complexity;
• Good for differentiation (gender, inter-annual variation, wealth group, etc.);
• Indicators based on sustainability criteria support carbon permanence;
• Lower cost than ‘matching methods’ approaches;
• Less demanding on external expertise than other approaches.
• Does not tackle attribution;
• Focus is more on sustainability and welfare impacts than the impact of a specific project strategy or intervention;
• Less useful for project design than the theory of change approach;
• Better for ex-post than ex-ante assessment;
• Time and cost of collecting data on each asset type, especially if comprehensive SLF approach;
• The main focus of SLF is on the 'stock' of assets, but the return on assets (or 'flow') could be more important for SBIA;
• Complex dynamics between asset types can make it difficult to observe overall trends;14
• No agreed mechanism for integrating data across asset classes, making it difficult to compare projects (but comparison is also difficult with the theory of change)
• Social capital can be difficult to measure.
6.6 Main Sources and Further Guidance
Schreckenberg et al. (2010) discuss SLF in the context of the social assessment of protected areas: http://www.careclimatechange.org/files/reports/SAPA_IIED_Social_Assessment.pdf.
Aldrich and Sayer (2007) describe how to undertake the LOAM: http://assets.panda.org/downloads/loaminpracticemay07.pdf.
For the Social Carbon Methodology go to: http://www.socialcarbon.org/Guidelines/Files/socialcarbon_guidelines_en.pdf.
14 For example, forest peoples may reduce their natural capital in exchange for financial, physical and social capital, e.g., felling trees and selling timber to finance improved storage facilities (physical capital). This means that it is essential to assess all the capital assets and the dynamics between them.
Social Impact Assessment Toolbox | 43
7. Participatory Impact Assessment (PIA)
7.1 Introduction
Participatory Impact Assessment (PIA) is an extension of PRA methods, and includes the adaptation of some well-known participatory tools, especially ranking and scoring methods, to issues of impact assessment. It was created by the Feinstein International Center (Catley et al. 2008), and was designed mainly to evaluate humanitarian emergency and livelihood projects in Africa. The approach is based on the recognition that “local people are capable of identifying and measuring their own indicators of change” (Catley et al. 2008:9).
A second, somewhat parallel set of methods called Quantitative Participatory Assessment (QPA) has been developed in India, originally to monitor the environmental benefits of watershed projects (James et al. 2002). QPA is a variation of PIA which aims to capture perceptions of change or qualitative indicators in a quantitative way.
PIA methods are most relevant to SBIA Stage 6, but are also relevant to most of the other SBIA Stages.
7.2 Description of Method
PIA aims to answer three key questions:
Overview of the PIA approach
• What changes have there been in the community since the start of the project?
• Which of these changes are attributable to the project?
• What difference have these changes made to people’s lives?
Eight main steps are proposed in the PIA approach (Catley et al., 2008):
1. Define the questions to be answered
The key research issues and questions should be identified, based on a clear understanding of the project logic and objectives.
2. Define the geographical and time limits of the project
Participatory mapping and historical timelines are recommended for this step.
3. Identify and prioritize locally defined impact indicators
PIA proposes the use of indicators identified by community participants since they have their own priorities for improving their lives, and their own ways of measuring change. PIA suggests using a simple questioning process with project participants, e.g., what changes do you expect in your lives due to the project? What changes in your lives have already occurred due to the project? Appropriate follow-up questions can then probe for more specific evidence of change.
44 | SBIA Manual for REDD+ Projects – Part 2
4. Decide which methods to use and test them out
This refers to the data collection methods used to measure the indicators. It is noted that each method (presented below) has its strengths and weaknesses, and some are more appropriate in certain cultures. Several of the methods described produce numerical measurements – it is emphasized that the numbers generated by scoring exercises are meaningless without the reasoning to explain them, and they must therefore be conducted as part of a semi-structured interview process rather than in isolation. The importance of testing out the methods (in non-project communities) is also stressed.
5. Decide which sampling method and sample size to use
The sampling method is likely to be purposive (e.g. ‘typical’ villages) or random sampling. There is no simple answer to the question of what sample size to use: this depends on the type and number of questions and the methods used. In most situations, the important thing is to capture the overall trend, and this can usually be done with a reasonably small sample size as long as the methods are applied consistently.
A principle of the PIA approach is that statistical analysis is possible if the same tool is applied consistently using exactly the same indicators, the same number of counters, the same visual aids, the same questions, etc. Even though the data may be subjective and qualitative indicators are used, if the exercises are repeated identically and systematically, data from 10-15 repetitions can be enough to be regarded as “scientifically rigorous” according to Catley et al. (2008: 47).
6. Assess project attribution
The use of participatory ranking and scoring methods to assess attribution is discussed in more detail below; in general, the preferred approach is to try to separate out the project and non-project causative factors, and to find the relative importance of these factors in the explanation of an identified positive or negative outcome or impact.
7. Triangulate
Triangulation is essential for all data collection methods, including participatory methods. Sometimes secondary data can be used to check if estimates are in the right ‘ball park’; for example, a short household survey could be implemented to check participatory methods; or different participatory methods can be used for same estimation.
8. Feedback and verify the results with the community
It is essential to discuss the results of the analysis with communities and other stakeholders. This is a last opportunity to ‘ground truth’ the results, and the discussions usually reveal further insights into project outcome and impact processes. Focus groups, e.g., by gender, are advisable for getting the best feedback quality.
Social Impact Assessment Toolbox | 45
Scoring methods for attribution
Description and examples of PIA methods
A simple approach to attribution is for community participants to score the importance of different possible causal factors for a given impact or outcome. Also known as the ‘proportional piling’ technique, this involves the stakeholders placing counters (e.g., seeds or stones) on each potential causal factor - these should be represented as far as possible by a picture card or other visual aid, ideally using local materials. An example of proportional piling is presented in Figure 10 in which community stakeholders were asked to score the importance of their food sources. This also shows how the results can be conveniently presented in the form of a pie chart.
Before embarking on proportional piling of the project and non-project factors, it is important to have an informed discussion of the range of possible explanatory factors or ‘independent variables’. This discussion could be summarized in the form of a ‘causal diagram’ showing all the potential project and non-project factors. Some kind of clear visual image is then needed of each of these factors – it may be helpful to have a local artist to help do this.
Community participants should then be divided into different focus groups, e.g., women and men. Individual members of each focus group can then distribute 20, 50 or 100 stones or seeds among the potential explanatory factors (as represented by the visual image). It should be noted that the greater is the number of counters, the longer the exercise takes – fewer counters can be used if there are less variables. The results can be aggregated from the focus groups.
For example, Table 10 shows the scoring for six project and non-project factors contributing to a positive change in food security status following an agricultural recovery project in a post-conflict setting. The conclusion here was that the project-related factors made a 29% relative contribution to improved food security.
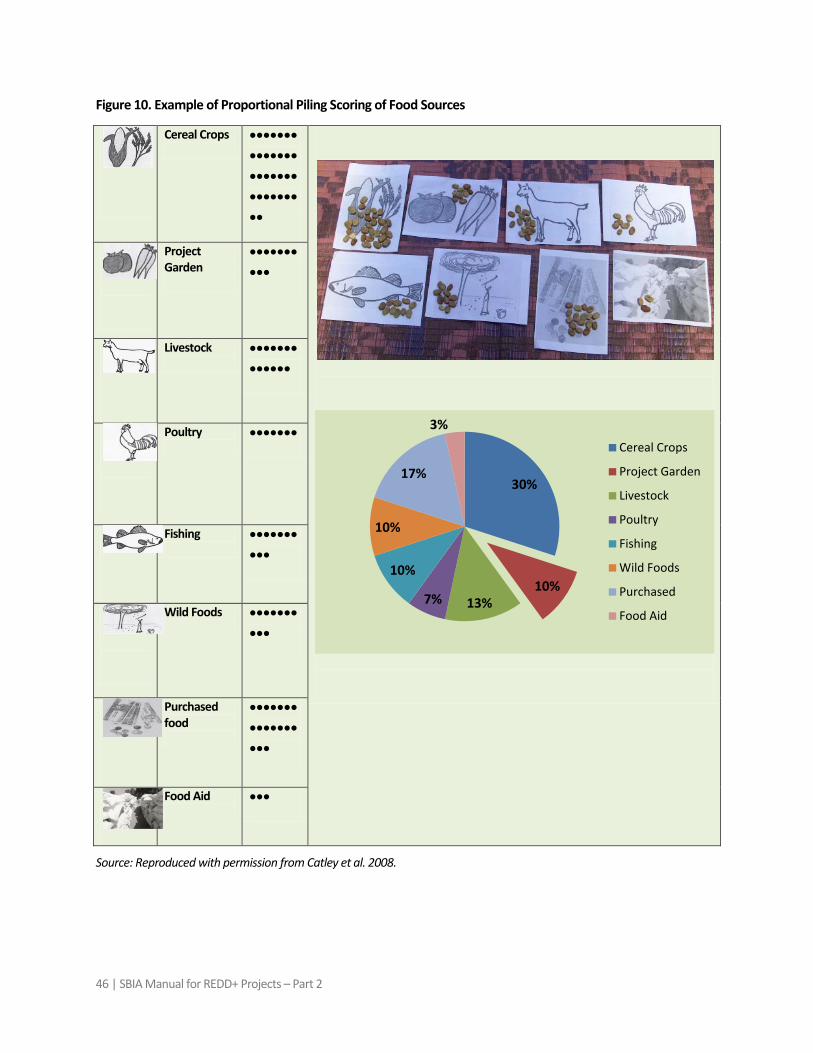
46 | SBIA Manual for REDD+ Projects – Part 2
Figure 10. Example of Proportional Piling Scoring of Food Sources
Source: Reproduced with permission from Catley et al. 2008.
Cereal Crops
••••••••••••••••••••••••••••••
Project Garden
••••••••••
Livestock
•••••••••••••
Poultry
•••••••
Fishing
••••••••••
Wild Foods
••••••••••
Purchased food
•••••••••••••••••
Food Aid
•••
30%
10% 13% 7%
10%
10%
17%
3% Cereal Crops
Project Garden
Livestock
Poultry
Fishing
Wild Foods
Purchased
Food Aid
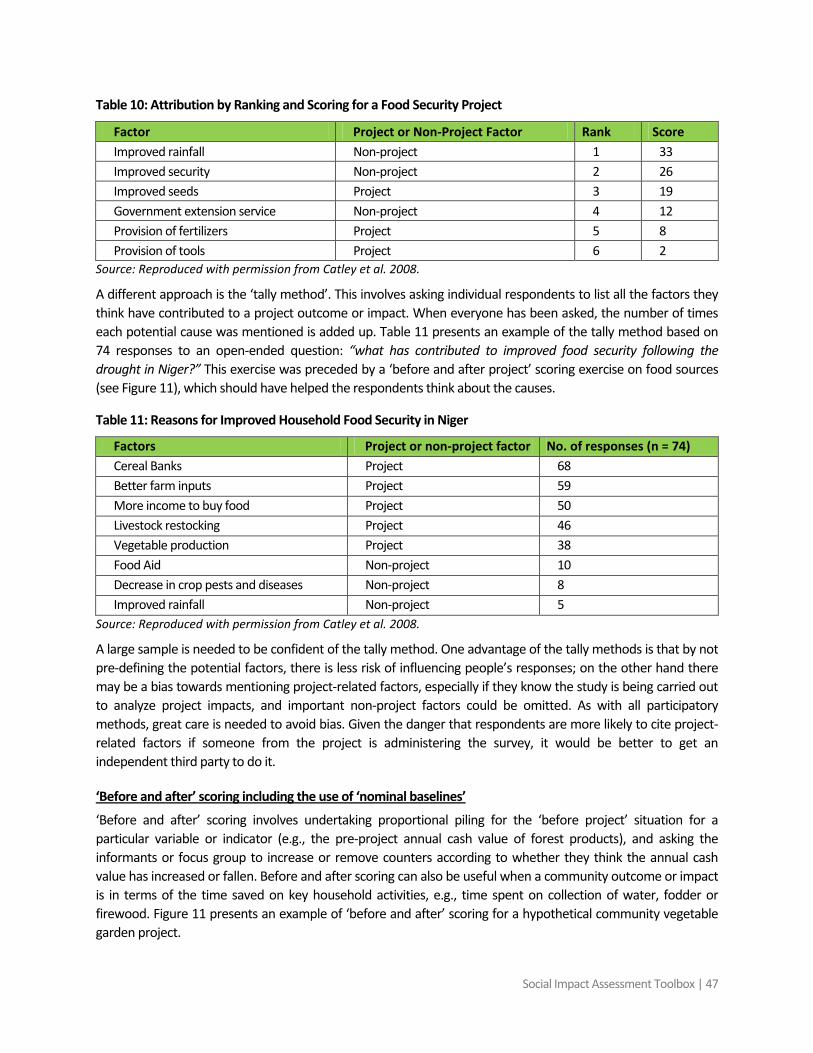
Social Impact Assessment Toolbox | 47
Table 10: Attribution by Ranking and Scoring for a Food Security Project
Factor Project or Non-Project Factor Rank Score Improved rainfall Non-project 1 33 Improved security Non-project 2 26 Improved seeds Project 3 19 Government extension service Non-project 4 12 Provision of fertilizers Project 5 8 Provision of tools Project 6 2
Source: Reproduced with permission from Catley et al. 2008.
A different approach is the ‘tally method’. This involves asking individual respondents to list all the factors they think have contributed to a project outcome or impact. When everyone has been asked, the number of times each potential cause was mentioned is added up. Table 11 presents an example of the tally method based on 74 responses to an open-ended question: “what has contributed to improved food security following the drought in Niger?” This exercise was preceded by a ‘before and after project’ scoring exercise on food sources (see Figure 11), which should have helped the respondents think about the causes.
Table 11: Reasons for Improved Household Food Security in Niger
Factors Project or non-project factor No. of responses (n = 74) Cereal Banks Project 68 Better farm inputs Project 59 More income to buy food Project 50 Livestock restocking Project 46 Vegetable production Project 38 Food Aid Non-project 10 Decrease in crop pests and diseases Non-project 8 Improved rainfall Non-project 5
Source: Reproduced with permission from Catley et al. 2008.
A large sample is needed to be confident of the tally method. One advantage of the tally methods is that by not pre-defining the potential factors, there is less risk of influencing people’s responses; on the other hand there may be a bias towards mentioning project-related factors, especially if they know the study is being carried out to analyze project impacts, and important non-project factors could be omitted. As with all participatory methods, great care is needed to avoid bias. Given the danger that respondents are more likely to cite project-related factors if someone from the project is administering the survey, it would be better to get an independent third party to do it.
‘Before and after’ scoring involves undertaking proportional piling for the ‘before project’ situation for a particular variable or indicator (e.g., the pre-project annual cash value of forest products), and asking the informants or focus group to increase or remove counters according to whether they think the annual cash value has increased or fallen. Before and after scoring can also be useful when a community outcome or impact is in terms of the time saved on key household activities, e.g., time spent on collection of water, fodder or firewood. Figure 11 presents an example of ‘before and after’ scoring for a hypothetical community vegetable garden project.
‘Before and after’ scoring including the use of ‘nominal baselines’
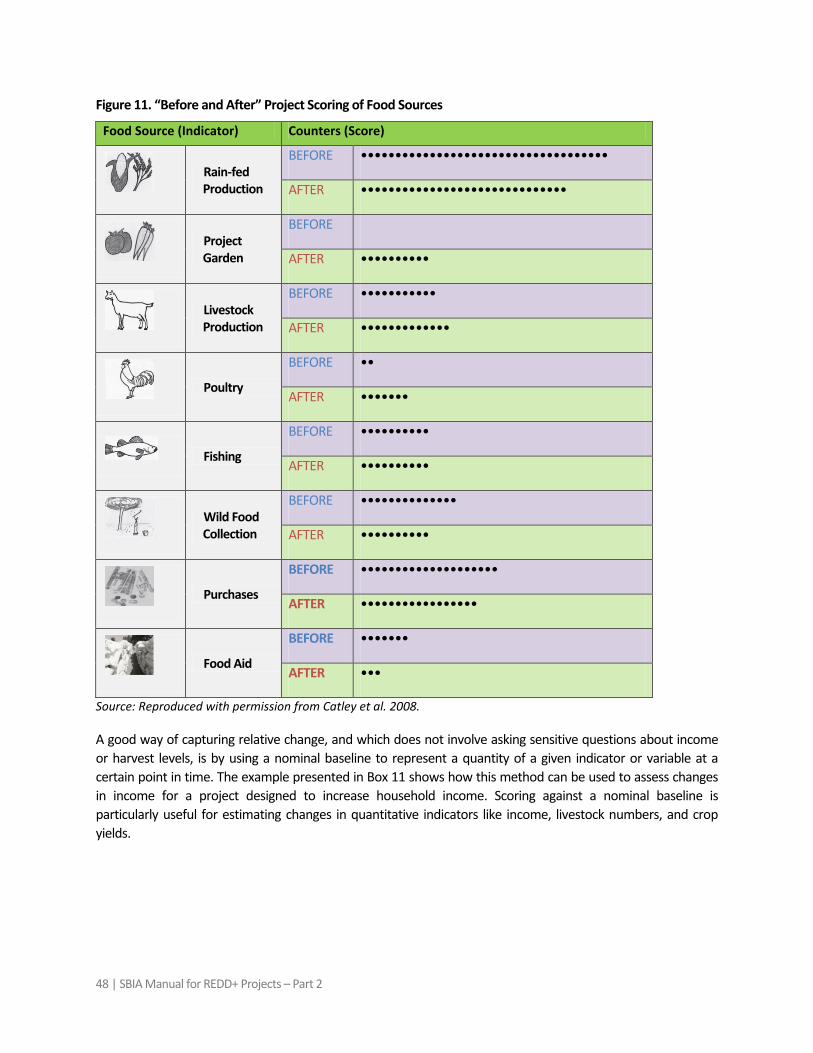
48 | SBIA Manual for REDD+ Projects – Part 2
Figure 11. “Before and After” Project Scoring of Food Sources
Food Source (Indicator) Counters (Score)
Rain-fed Production
BEFORE ••••••••••••••••••••••••••••••••••••
AFTER ••••••••••••••••••••••••••••••
Project Garden
BEFORE
AFTER ••••••••••
Livestock Production
BEFORE •••••••••••
AFTER •••••••••••••
Poultry
BEFORE ••
AFTER •••••••
Fishing
BEFORE ••••••••••
AFTER ••••••••••
Wild Food Collection
BEFORE ••••••••••••••
AFTER ••••••••••
Purchases
BEFORE ••••••••••••••••••••
AFTER •••••••••••••••••
Food Aid
BEFORE •••••••
AFTER •••
Source: Reproduced with permission from Catley et al. 2008.
A good way of capturing relative change, and which does not involve asking sensitive questions about income or harvest levels, is by using a nominal baseline to represent a quantity of a given indicator or variable at a certain point in time. The example presented in Box 11 shows how this method can be used to assess changes in income for a project designed to increase household income. Scoring against a nominal baseline is particularly useful for estimating changes in quantitative indicators like income, livestock numbers, and crop yields.
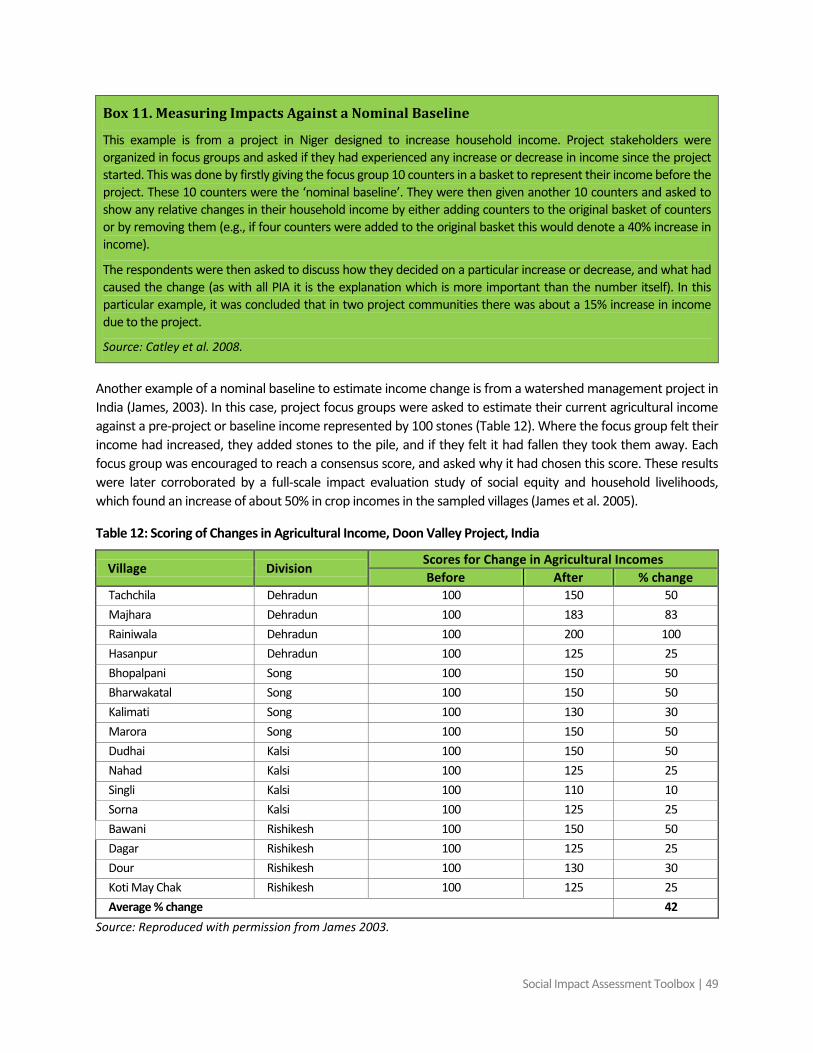
Social Impact Assessment Toolbox | 49
Box 11. Measuring Impacts Against a Nominal Baseline
This example is from a project in Niger designed to increase household income. Project stakeholders were organized in focus groups and asked if they had experienced any increase or decrease in income since the project started. This was done by firstly giving the focus group 10 counters in a basket to represent their income before the project. These 10 counters were the ‘nominal baseline’. They were then given another 10 counters and asked to show any relative changes in their household income by either adding counters to the original basket of counters or by removing them (e.g., if four counters were added to the original basket this would denote a 40% increase in income).
The respondents were then asked to discuss how they decided on a particular increase or decrease, and what had caused the change (as with all PIA it is the explanation which is more important than the number itself). In this particular example, it was concluded that in two project communities there was about a 15% increase in income due to the project.
Source: Catley et al. 2008.
Another example of a nominal baseline to estimate income change is from a watershed management project in India (James, 2003). In this case, project focus groups were asked to estimate their current agricultural income against a pre-project or baseline income represented by 100 stones (Table 12). Where the focus group felt their income had increased, they added stones to the pile, and if they felt it had fallen they took them away. Each focus group was encouraged to reach a consensus score, and asked why it had chosen this score. These results were later corroborated by a full-scale impact evaluation study of social equity and household livelihoods, which found an increase of about 50% in crop incomes in the sampled villages (James et al. 2005).
Table 12: Scoring of Changes in Agricultural Income, Doon Valley Project, India
Village Division Scores for Change in Agricultural Incomes Before After % change
Tachchila Dehradun 100 150 50 Majhara Dehradun 100 183 83 Rainiwala Dehradun 100 200 100 Hasanpur Dehradun 100 125 25 Bhopalpani Song 100 150 50 Bharwakatal Song 100 150 50 Kalimati Song 100 130 30 Marora Song 100 150 50 Dudhai Kalsi 100 150 50 Nahad Kalsi 100 125 25 Singli Kalsi 100 110 10 Sorna Kalsi 100 125 25 Bawani Rishikesh 100 150 50 Dagar Rishikesh 100 125 25 Dour Rishikesh 100 130 30 Koti May Chak Rishikesh 100 125 25 Average % change 42
Source: Reproduced with permission from James 2003.
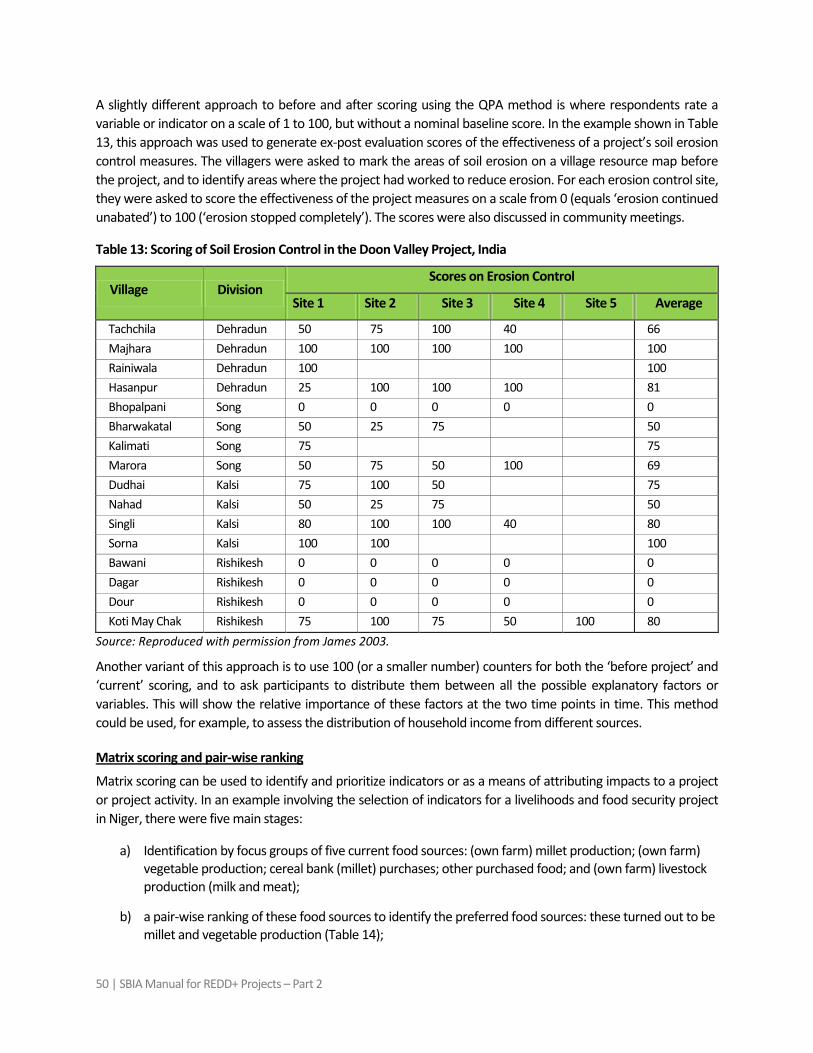
50 | SBIA Manual for REDD+ Projects – Part 2
A slightly different approach to before and after scoring using the QPA method is where respondents rate a variable or indicator on a scale of 1 to 100, but without a nominal baseline score. In the example shown in Table 13, this approach was used to generate ex-post evaluation scores of the effectiveness of a project’s soil erosion control measures. The villagers were asked to mark the areas of soil erosion on a village resource map before the project, and to identify areas where the project had worked to reduce erosion. For each erosion control site, they were asked to score the effectiveness of the project measures on a scale from 0 (equals ‘erosion continued unabated’) to 100 (‘erosion stopped completely’). The scores were also discussed in community meetings.
Table 13: Scoring of Soil Erosion Control in the Doon Valley Project, India
Village Division Scores on Erosion Control
Site 1 Site 2 Site 3 Site 4 Site 5 Average
Tachchila Dehradun 50 75 100 40 66 Majhara Dehradun 100 100 100 100 100 Rainiwala Dehradun 100 100 Hasanpur Dehradun 25 100 100 100 81 Bhopalpani Song 0 0 0 0 0 Bharwakatal Song 50 25 75 50 Kalimati Song 75 75 Marora Song 50 75 50 100 69 Dudhai Kalsi 75 100 50 75 Nahad Kalsi 50 25 75 50 Singli Kalsi 80 100 100 40 80 Sorna Kalsi 100 100 100 Bawani Rishikesh 0 0 0 0 0 Dagar Rishikesh 0 0 0 0 0 Dour Rishikesh 0 0 0 0 0 Koti May Chak Rishikesh 75 100 75 50 100 80
Source: Reproduced with permission from James 2003.
Another variant of this approach is to use 100 (or a smaller number) counters for both the ‘before project’ and ‘current’ scoring, and to ask participants to distribute them between all the possible explanatory factors or variables. This will show the relative importance of these factors at the two time points in time. This method could be used, for example, to assess the distribution of household income from different sources.
Matrix scoring can be used to identify and prioritize indicators or as a means of attributing impacts to a project or project activity. In an example involving the selection of indicators for a livelihoods and food security project in Niger, there were five main stages:
Matrix scoring and pair-wise ranking
a) Identification by focus groups of five current food sources: (own farm) millet production; (own farm) vegetable production; cereal bank (millet) purchases; other purchased food; and (own farm) livestock production (milk and meat);
b) a pair-wise ranking of these food sources to identify the preferred food sources: these turned out to be millet and vegetable production (Table 14);
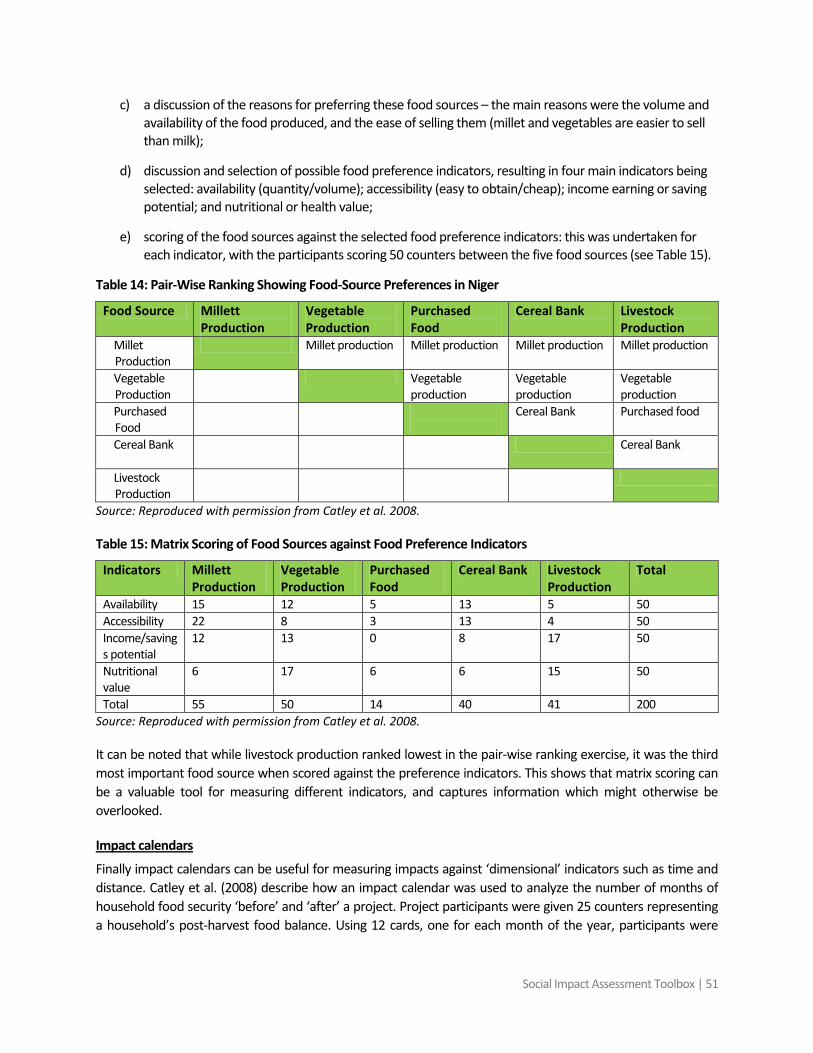
Social Impact Assessment Toolbox | 51
c) a discussion of the reasons for preferring these food sources – the main reasons were the volume and availability of the food produced, and the ease of selling them (millet and vegetables are easier to sell than milk);
d) discussion and selection of possible food preference indicators, resulting in four main indicators being selected: availability (quantity/volume); accessibility (easy to obtain/cheap); income earning or saving potential; and nutritional or health value;
e) scoring of the food sources against the selected food preference indicators: this was undertaken for each indicator, with the participants scoring 50 counters between the five food sources (see Table 15).
Table 14: Pair-Wise Ranking Showing Food-Source Preferences in Niger
Food Source Millett Production
Vegetable Production
Purchased Food
Cereal Bank Livestock Production
Millet Production
Millet production Millet production Millet production Millet production
Vegetable Production
Vegetable production
Vegetable production
Vegetable production
Purchased Food
Cereal Bank Purchased food
Cereal Bank
Cereal Bank
Livestock Production
Source: Reproduced with permission from Catley et al. 2008.
Table 15: Matrix Scoring of Food Sources against Food Preference Indicators
Indicators Millett Production
Vegetable Production
Purchased Food
Cereal Bank Livestock Production
Total
Availability 15 12 5 13 5 50 Accessibility 22 8 3 13 4 50 Income/savings potential
12 13 0 8 17 50
Nutritional value
6 17 6 6 15 50
Total 55 50 14 40 41 200 Source: Reproduced with permission from Catley et al. 2008.
It can be noted that while livestock production ranked lowest in the pair-wise ranking exercise, it was the third most important food source when scored against the preference indicators. This shows that matrix scoring can be a valuable tool for measuring different indicators, and captures information which might otherwise be overlooked.
Finally impact calendars can be useful for measuring impacts against ‘dimensional’ indicators such as time and distance. Catley et al. (2008) describe how an impact calendar was used to analyze the number of months of household food security ‘before’ and ‘after’ a project. Project participants were given 25 counters representing a household’s post-harvest food balance. Using 12 cards, one for each month of the year, participants were
Impact calendars
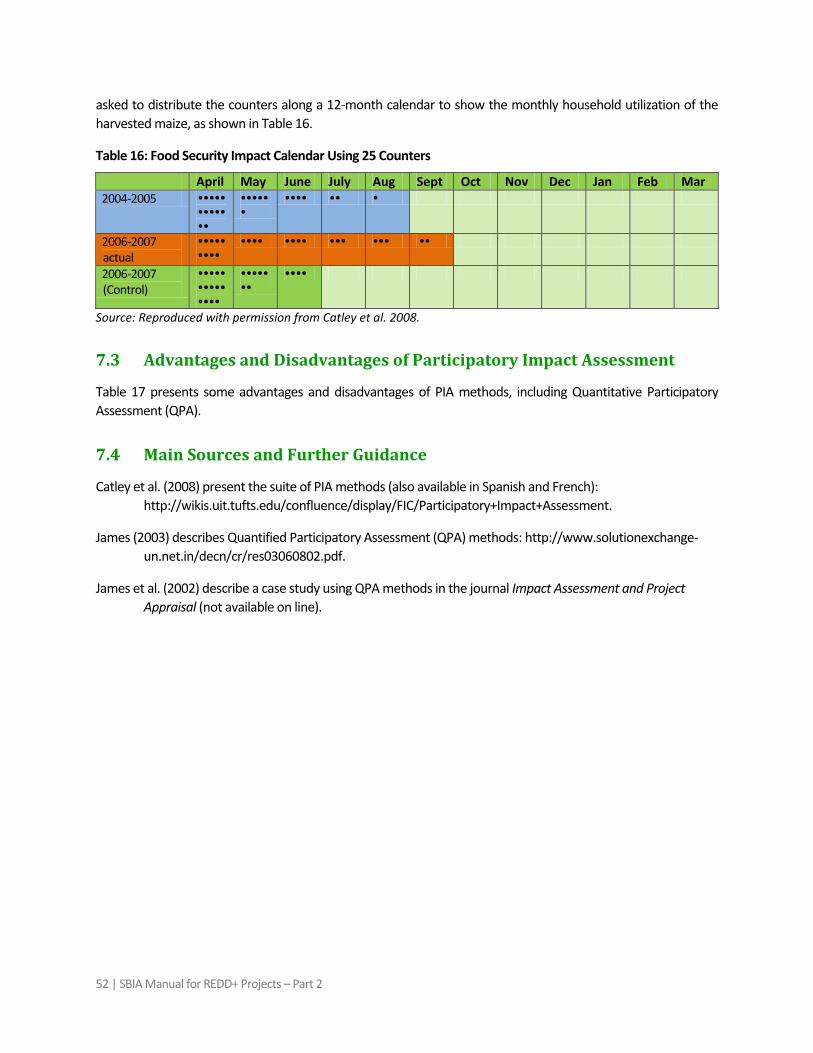
52 | SBIA Manual for REDD+ Projects – Part 2
asked to distribute the counters along a 12-month calendar to show the monthly household utilization of the harvested maize, as shown in Table 16.
Table 16: Food Security Impact Calendar Using 25 Counters
April May June July Aug Sept Oct Nov Dec Jan Feb Mar 2004-2005 •••••
•••••••
••••••
•••• •• •
2006-2007 actual
•••••••••
•••• •••• ••• ••• ••
2006-2007 (Control)
••••••••••••••
•••••••
••••
Source: Reproduced with permission from Catley et al. 2008.
7.3 Advantages and Disadvantages of Participatory Impact Assessment
Table 17 presents some advantages and disadvantages of PIA methods, including Quantitative Participatory Assessment (QPA).
7.4 Main Sources and Further Guidance
Catley et al. (2008) present the suite of PIA methods (also available in Spanish and French): http://wikis.uit.tufts.edu/confluence/display/FIC/Participatory+Impact+Assessment.
James (2003) describes Quantified Participatory Assessment (QPA) methods: http://www.solutionexchange-un.net.in/decn/cr/res03060802.pdf.
James et al. (2002) describe a case study using QPA methods in the journal Impact Assessment and Project Appraisal (not available on line).
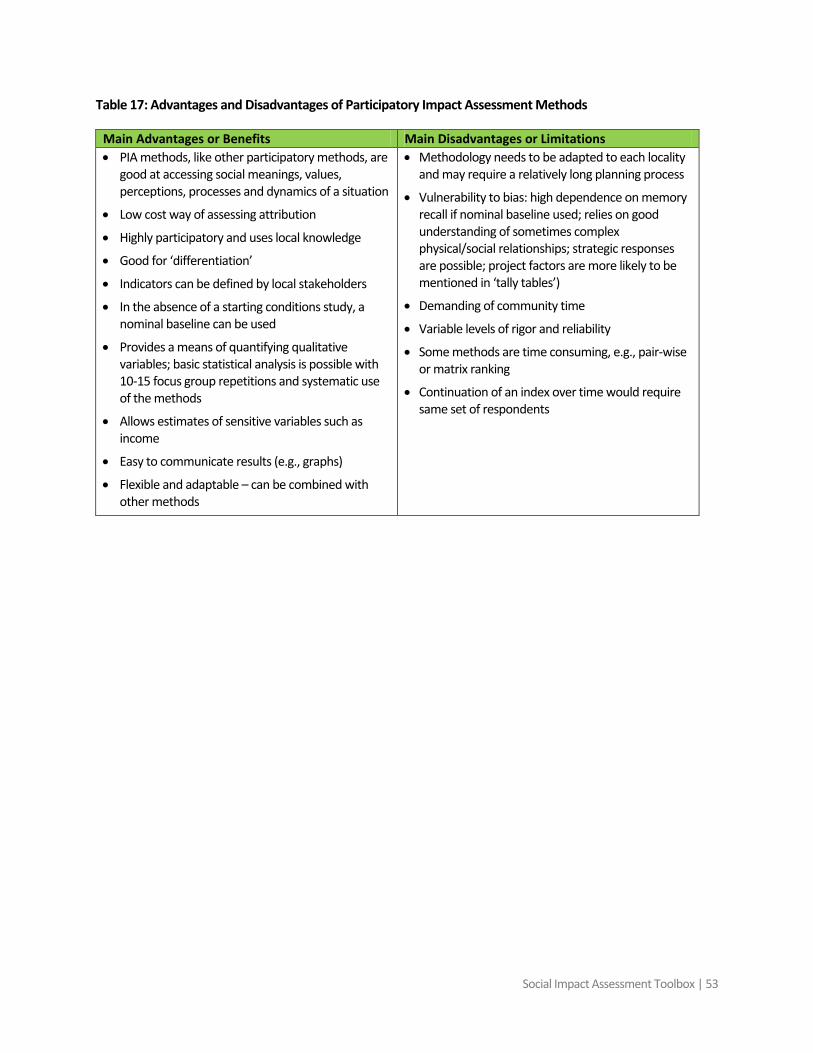
Social Impact Assessment Toolbox | 53
Table 17: Advantages and Disadvantages of Participatory Impact Assessment Methods
Main Advantages or Benefits Main Disadvantages or Limitations • PIA methods, like other participatory methods, are
good at accessing social meanings, values, perceptions, processes and dynamics of a situation
• Low cost way of assessing attribution
• Highly participatory and uses local knowledge
• Good for ‘differentiation’
• Indicators can be defined by local stakeholders
• In the absence of a starting conditions study, a nominal baseline can be used
• Provides a means of quantifying qualitative variables; basic statistical analysis is possible with 10-15 focus group repetitions and systematic use of the methods
• Allows estimates of sensitive variables such as income
• Easy to communicate results (e.g., graphs)
• Flexible and adaptable – can be combined with other methods
• Methodology needs to be adapted to each locality and may require a relatively long planning process
• Vulnerability to bias: high dependence on memory recall if nominal baseline used; relies on good understanding of sometimes complex physical/social relationships; strategic responses are possible; project factors are more likely to be mentioned in ‘tally tables’)
• Demanding of community time
• Variable levels of rigor and reliability
• Some methods are time consuming, e.g., pair-wise or matrix ranking
• Continuation of an index over time would require same set of respondents
54 | SBIA Manual for REDD+ Projects – Part 2
8. The Basic Necessities Survey (BNS)
8.1 Introduction
The Basic Necessities Survey (BNS) method15 was originally developed by Action Aid,16
The BNS is a quick and relatively inexpensive method (about US$3-4/household) of measuring and tracking changes in poverty level. It can also be used to look at other aspects of poverty such as household access to basic needs, the extent of disparity in this access, and how perceptions of what is a ‘basic necessity’ change over time (TransLinks 2007).
and has more recently been adapted by the Wildlife Conservation Society (WCS) for social impact monitoring of protected areas. The BNS method measures poverty change over time according to whether community members think they are getting more or less ‘basic necessities’ than before the project, or since the last time that the BNS was carried out. It is most relevant to SBIA Stages 1, 2, 4, 5 (as indicators) and 6 (measurement of indicators).
The BNS is designed to be implemented in control and treatment (project) communities in order to allow for attribution, and is therefore a very useful method when used in conjunction with the quasi-experimental approach assuming that the project expects to have an impact on the general poverty level of project communities. It could also be used in conjunction with participatory impact assessment methods (Section 7) or the theory of change approach (Part 1, Section 2.3).
8.2 Description of Method
If poverty can be defined broadly as ‘the lack of basic necessities’, a valid approach to poverty assessment is to check whether a project has resulted in a change in the extent to which people’s ‘basic necessities’ are being met. Unlike income approaches to poverty assessment (e.g., number of people living on less than US$2/day), there is no a priori definition of ‘basic necessities’, partly since what can be considered as a basic necessity is likely to vary both by location and over time.
The BNS is undertaken in three steps:
• Identification of possible basic necessities via focus groups;
• Application of the survey;
• Analysis of the data collected.
a) Identification of possible basic necessities via focus groups A mixed age and gender focus group is used to generate an initial list of goods (e.g., TV, bicycle, radio, wheelbarrow, machete) and services (e.g., all school age children attending school, walking distance to a health clinic) that the participants may or may not think are basic necessities. It is important that the list includes items almost everyone would agree with (e.g., enough food each day), and others where there is likely to be disagreement (e.g., having a TV). The list should include between 20 and 25 items.
15 Acknowledgement: this description of the BNS method is adapted from a version licensed under the Creative Commons Attribution-Noncommercial-Share Alike 3.0 License. To view a copy of this license, visit: http://creativecommons.org/licenses/by-nc-sa/3.0/. 16 The BNS was developed especially by Rick Davies (http://www.mande.co.uk), an independent monitoring and evaluation expert working for ActionAid (TRANSLINKS 2007).
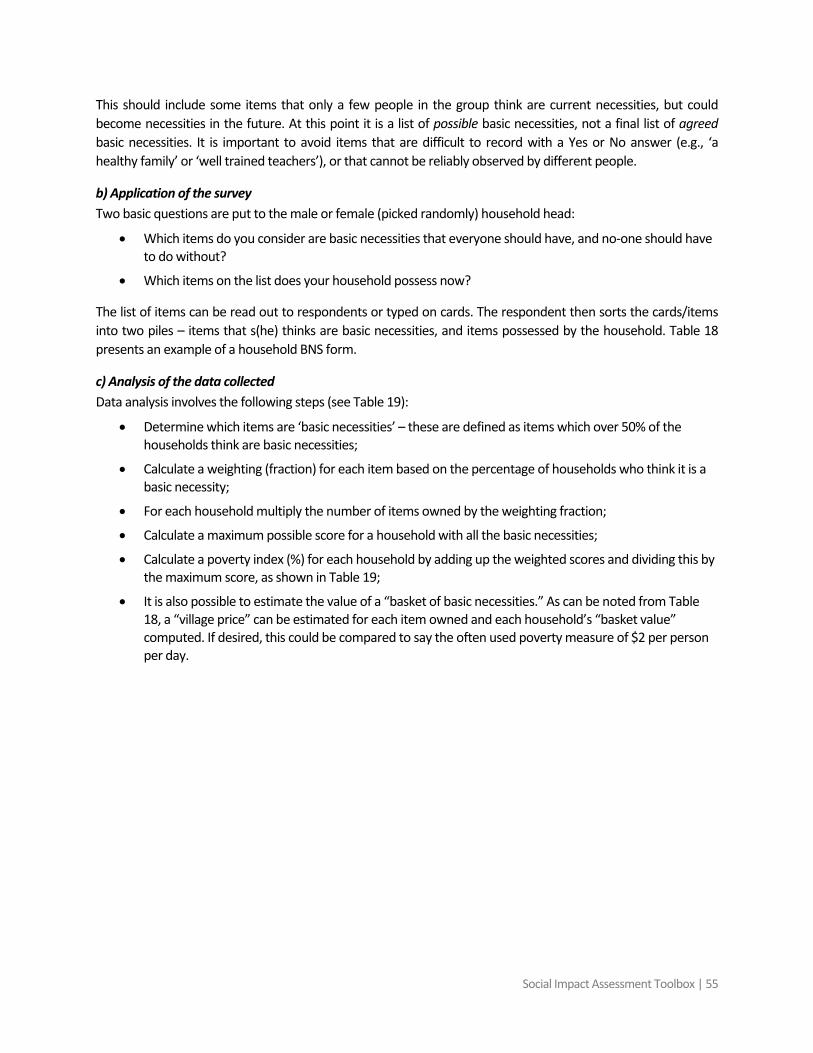
Social Impact Assessment Toolbox | 55
This should include some items that only a few people in the group think are current necessities, but could become necessities in the future. At this point it is a list of possible basic necessities, not a final list of agreed basic necessities. It is important to avoid items that are difficult to record with a Yes or No answer (e.g., ‘a healthy family’ or ‘well trained teachers’), or that cannot be reliably observed by different people.
b) Application of the survey Two basic questions are put to the male or female (picked randomly) household head:
• Which items do you consider are basic necessities that everyone should have, and no-one should have to do without?
• Which items on the list does your household possess now?
The list of items can be read out to respondents or typed on cards. The respondent then sorts the cards/items into two piles – items that s(he) thinks are basic necessities, and items possessed by the household. Table 18 presents an example of a household BNS form.
c) Analysis of the data collected Data analysis involves the following steps (see Table 19):
• Determine which items are ‘basic necessities’ – these are defined as items which over 50% of the households think are basic necessities;
• Calculate a weighting (fraction) for each item based on the percentage of households who think it is a basic necessity;
• For each household multiply the number of items owned by the weighting fraction;
• Calculate a maximum possible score for a household with all the basic necessities;
• Calculate a poverty index (%) for each household by adding up the weighted scores and dividing this by the maximum score, as shown in Table 19;
• It is also possible to estimate the value of a “basket of basic necessities.” As can be noted from Table 18, a “village price” can be estimated for each item owned and each household’s “basket value” computed. If desired, this could be compared to say the often used poverty measure of $2 per person per day.
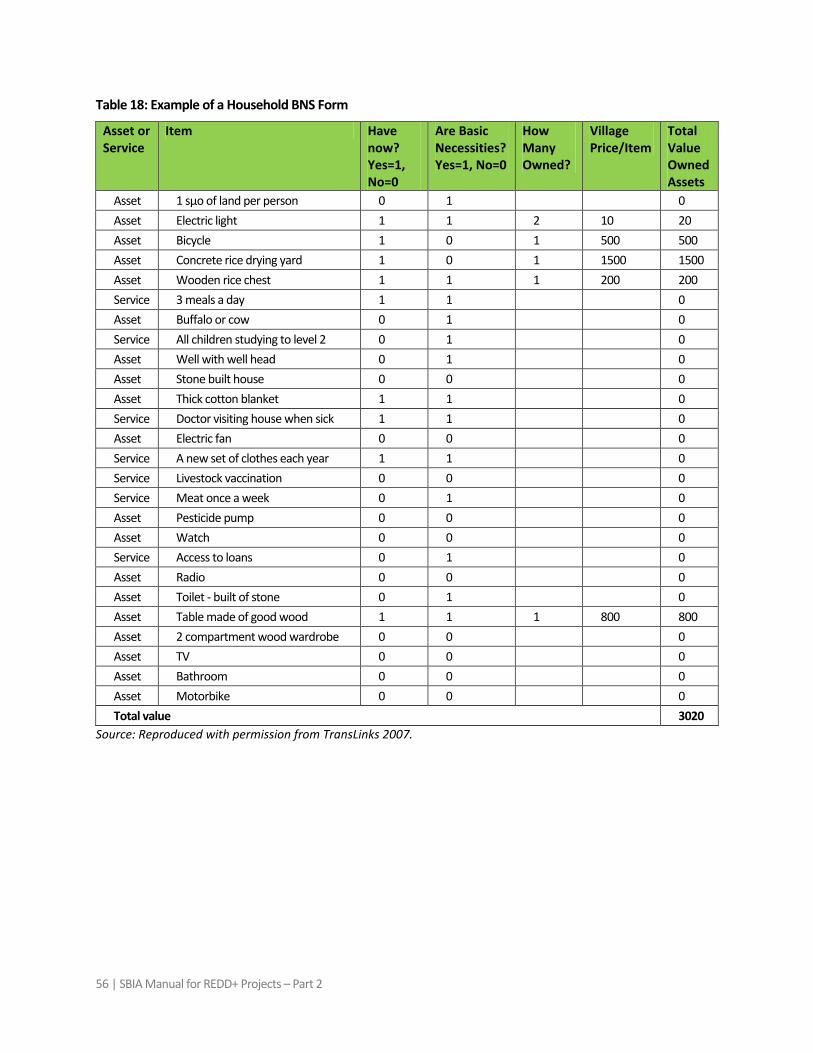
56 | SBIA Manual for REDD+ Projects – Part 2
Table 18: Example of a Household BNS Form
Asset or Service
Item Have now? Yes=1, No=0
Are Basic Necessities? Yes=1, No=0
How Many Owned?
Village Price/Item
Total Value Owned Assets
Asset 1 sμo of land per person 0 1 0 Asset Electric light 1 1 2 10 20 Asset Bicycle 1 0 1 500 500 Asset Concrete rice drying yard 1 0 1 1500 1500 Asset Wooden rice chest 1 1 1 200 200 Service 3 meals a day 1 1 0 Asset Buffalo or cow 0 1 0 Service All children studying to level 2 0 1 0 Asset Well with well head 0 1 0 Asset Stone built house 0 0 0 Asset Thick cotton blanket 1 1 0 Service Doctor visiting house when sick 1 1 0 Asset Electric fan 0 0 0 Service A new set of clothes each year 1 1 0 Service Livestock vaccination 0 0 0 Service Meat once a week 0 1 0 Asset Pesticide pump 0 0 0 Asset Watch 0 0 0 Service Access to loans 0 1 0 Asset Radio 0 0 0 Asset Toilet - built of stone 0 1 0 Asset Table made of good wood 1 1 1 800 800 Asset 2 compartment wood wardrobe 0 0 0 Asset TV 0 0 0 Asset Bathroom 0 0 0 Asset Motorbike 0 0 0 Total value 3020
Source: Reproduced with permission from TransLinks 2007.
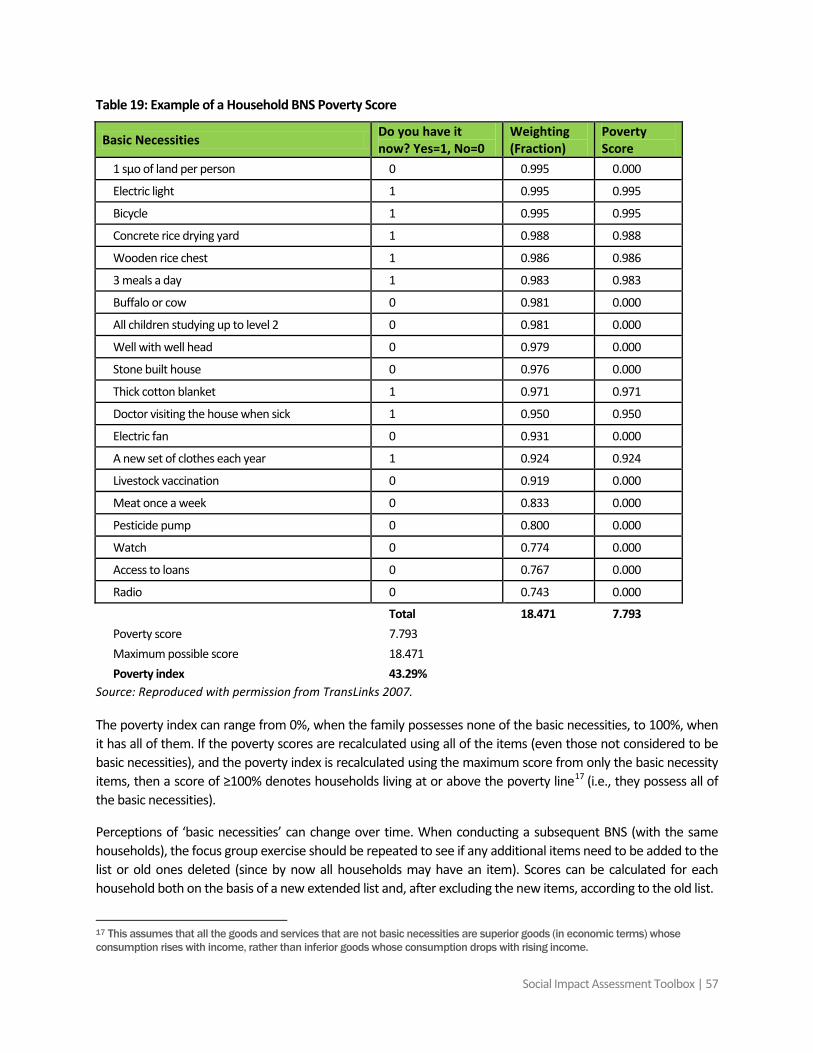
Social Impact Assessment Toolbox | 57
Table 19: Example of a Household BNS Poverty Score
Basic Necessities Do you have it now? Yes=1, No=0
Weighting (Fraction)
Poverty Score
1 sμo of land per person 0 0.995 0.000
Electric light 1 0.995 0.995
Bicycle 1 0.995 0.995
Concrete rice drying yard 1 0.988 0.988
Wooden rice chest 1 0.986 0.986
3 meals a day 1 0.983 0.983
Buffalo or cow 0 0.981 0.000
All children studying up to level 2 0 0.981 0.000
Well with well head 0 0.979 0.000
Stone built house 0 0.976 0.000
Thick cotton blanket 1 0.971 0.971
Doctor visiting the house when sick 1 0.950 0.950
Electric fan 0 0.931 0.000
A new set of clothes each year 1 0.924 0.924
Livestock vaccination 0 0.919 0.000
Meat once a week 0 0.833 0.000
Pesticide pump 0 0.800 0.000
Watch 0 0.774 0.000
Access to loans 0 0.767 0.000
Radio 0 0.743 0.000
Total 18.471 7.793 Poverty score 7.793 Maximum possible score 18.471 Poverty index 43.29%
Source: Reproduced with permission from TransLinks 2007.
The poverty index can range from 0%, when the family possesses none of the basic necessities, to 100%, when it has all of them. If the poverty scores are recalculated using all of the items (even those not considered to be basic necessities), and the poverty index is recalculated using the maximum score from only the basic necessity items, then a score of ≥100% denotes households living at or above the poverty line17
Perceptions of ‘basic necessities’ can change over time. When conducting a subsequent BNS (with the same households), the focus group exercise should be repeated to see if any additional items need to be added to the list or old ones deleted (since by now all households may have an item). Scores can be calculated for each household both on the basis of a new extended list and, after excluding the new items, according to the old list.
(i.e., they possess all of the basic necessities).
17 This assumes that all the goods and services that are not basic necessities are superior goods (in economic terms) whose consumption rises with income, rather than inferior goods whose consumption drops with rising income.
58 | SBIA Manual for REDD+ Projects – Part 2
In order to assist the attribution analysis, a column or two could be added to the standard BNS form. This would ask respondents if they think that any change in ownership of a basic necessity was due to the project, and if yes, why they think this. Finally it is possible to derive financial or economic measures from the BNS, as implied by the values in Table 20, as well as a price index to show the rate of inflation (see TRANSLINKS (2007) for further guidance).
8.3 Advantages and Disadvantages of the BNS
Table 20: Advantages and Disadvantages of the Basic Needs Survey
Main Advantages or Benefits Main Disadvantages or Limitations • A cost-effective way of measuring changes in poverty
• A quantifiable indicator (index over time) that is easy to communicate
• Good for differentiation, e.g., separating stakeholders by female-headed households; ethnicity; age of household head, etc.
• Local people can be trained as facilitators and enumerators
• Relatively simple to understand
• Reported cost of US$3-4 per household
• ‘Attribution column’ could be added to BNS form
• It does not address attribution, so needs to be used in combination with other methods
• It is difficult to make comparisons between communities if each community has its own definition of its basic needs
8.4 Main Sources and Further Guidance
TransLinks (2007) describes the main stages of the BNS: http://www.rmportal.net/library/content/translinks/translinks-2007.
Davies and Smith (1998) describe Action Aid’s experience of using the BNS: http://www.mande.co.uk/docs/BasicNecessitiesSurveyAAV1998.pdf.
The Pro Poor Centre (2006) reports on using the BNS in Vietnam: http://www.mande.co.uk/docs/The%202006%20Basic%20Necessities%20Survey%20Final%20Report%2020%20July%202007.doc.
Social Impact Assessment Toolbox | 59
9. Social Indicator Checklists
This section includes lists of indicators that may be useful in social impact assessment and has been drawn from the methods described in this Manual and from other sources relevant to carbon projects.
9.1 Indicators Derived from ‘Sustainability Framework’ Approaches
The Social Carbon Methodology (SCM) List of Approved Indicators
Approved indicators for the SCM “Financial”, “Human”, “Social” and “Natural Resources” are as follows:
• Ability or capacity to access to credit Financial Resources:
• Participation in goods and services markets • Level of household income and savings • “Economic and social returns” including relative income distribution & distribution of financial assets
• State of family health Human Resources:
• Adult literacy level • Professional skills in the household (especially agriculture, livestock, NTFP harvesting) • Formal education levels • Disease incidence • Work attitudes • Leisure options • Technical competence • Access to technical extension services
• Level of participation in civil organizations Social Resources:
• Number of people taking collective decisions • Adherence to and actions by institutions representing community • Level of dependency on government interventions • Degree of community organization - formal associations or community groups • Presence of support agencies (especially religious) • Family networks • Internal conflicts and their causes (external or internal)
• Rate of deforestation Natural Resources:
• Level of fish & wild game stocks • Quality of soil & water • Degree of fragmentation of local ecosystems • Level of protection • Management regimes
Source: Social Carbon. 2009.
60 | SBIA Manual for REDD+ Projects – Part 2
The Landscape Outcomes Assessment Methodology (LOAM)
Some commonly identified indicators from LOAM case studies are:
• Child and adult mortality, especially to major diseases Human Capital Assets:
• Availability and quality of health care • Availability of education – distance to schools • Skills and education levels (e.g., number of qualified people) • Capacity-building of women • Traditional knowledge
• Levels of corruption/effectiveness of administration Social Capital Assets:
• Equity in application of laws • Existence of community based resource management groups • Respect for traditional resource management rules • Social organizations • Local networks
• Road access Physical Capital Assets:
• Plantations as providers of employment • Quality of housing – number of tin roofs • Local processing industries – sawmills etc. • Village water supply • Mechanization, e.g., number of tractors • Electricity/energy sources
• Income from timber or NTFPs Financial/Economic Assets:
• Employment from tourism, local estates • Total household income • Access to and cost of formal credit/microfinance • Access to and cost of informal credit
• Quality of water Natural Capital Assets:
• Accessibility of drinking water • Availability of non-timber forest products • Erosion • Access/distance to forest reserves • Fire incidence
Source: Aldrich and Sayer 2007.
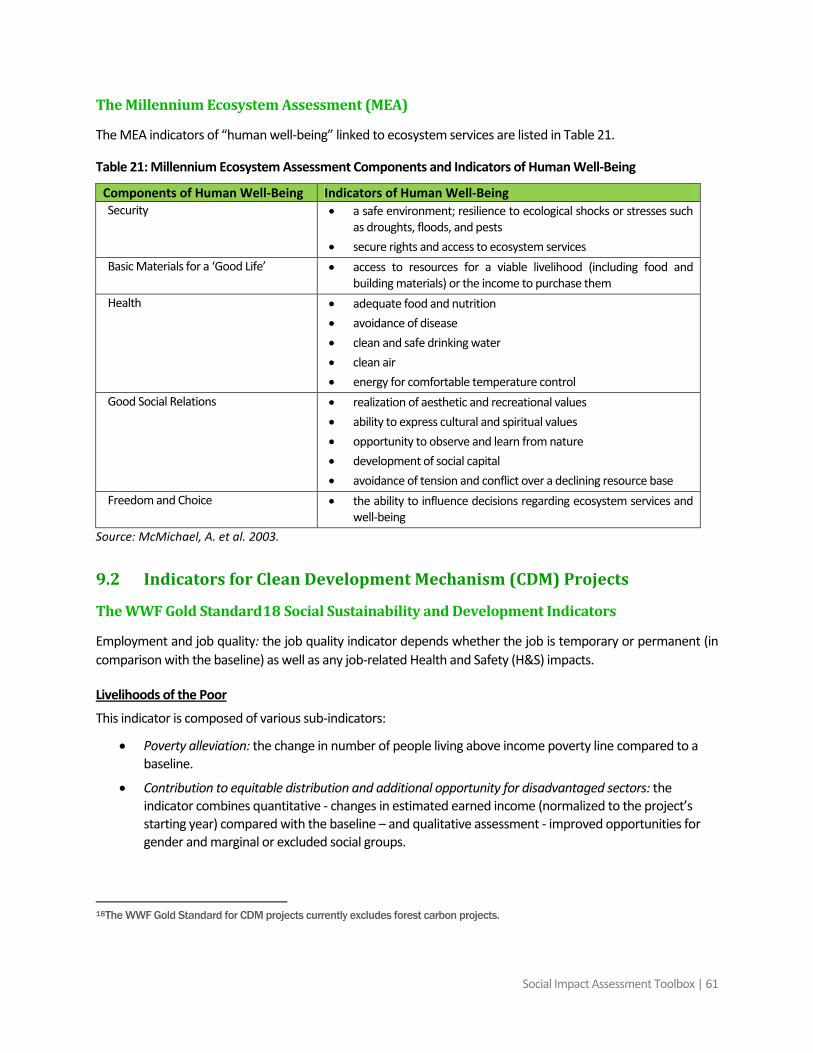
Social Impact Assessment Toolbox | 61
The Millennium Ecosystem Assessment (MEA)
The MEA indicators of “human well-being” linked to ecosystem services are listed in Table 21.
Table 21: Millennium Ecosystem Assessment Components and Indicators of Human Well-Being
Components of Human Well-Being Indicators of Human Well-Being Security • a safe environment; resilience to ecological shocks or stresses such
as droughts, floods, and pests • secure rights and access to ecosystem services
Basic Materials for a ‘Good Life’ • access to resources for a viable livelihood (including food and building materials) or the income to purchase them
Health • adequate food and nutrition • avoidance of disease • clean and safe drinking water • clean air • energy for comfortable temperature control
Good Social Relations • realization of aesthetic and recreational values • ability to express cultural and spiritual values • opportunity to observe and learn from nature • development of social capital • avoidance of tension and conflict over a declining resource base
Freedom and Choice • the ability to influence decisions regarding ecosystem services and well-being
Source: McMichael, A. et al. 2003.
9.2 Indicators for Clean Development Mechanism (CDM) Projects
The WWF Gold Standard18
Employment and job quality: the job quality indicator depends whether the job is temporary or permanent (in comparison with the baseline) as well as any job-related Health and Safety (H&S) impacts.
Social Sustainability and Development Indicators
This indicator is composed of various sub-indicators:
Livelihoods of the Poor
• Poverty alleviation: the change in number of people living above income poverty line compared to a baseline.
• Contribution to equitable distribution and additional opportunity for disadvantaged sectors: the indicator combines quantitative - changes in estimated earned income (normalized to the project’s starting year) compared with the baseline – and qualitative assessment - improved opportunities for gender and marginal or excluded social groups.
18The WWF Gold Standard for CDM projects currently excludes forest carbon projects.
62 | SBIA Manual for REDD+ Projects – Part 2
• Access to essential services (water, health, education, access to facilities, etc.): this indicator is measured by the number of additional people gaining access compared with the baseline (access must be directly related to the project service).
• Access to affordable clean energy services: security of energy supply should be taken into account when assessing this indicator.
This indicator is used to assess the project’s contribution to raising the capacity of local people and/or communities to participate actively in social and economic development. It comprises three indicative sub-indicators:
Human Capacity:
• Empowerment: used to evaluate the project’s contribution to improving the access of local people to, and their participation in, community institutions and decision-making processes.
• Education/skills: used to assess how the project activity enhances and/or requires improved and more widespread education and skills in the community.
• Gender equality: used to assess how the project activity requires or enhances improvement of the empowerment, education/skills and livelihoods of women in the community.
Source: Gold Standard Version 2.1: http://www.cdmgoldstandard.org/Current-GS-Rules.102.0.html.
EnCoFor Social and Institutional Impact Assessment Indicators
The EnCoFor (Environment and Community based Framework for Designing Afforestation, Reforestation and Revegation Projects) Manual (Robledo 2007), which was designed to assess the social and institutional impacts of CDM Projects, does not use a conventional system of indicators, but some indicators can be identified from the discussion of “Social and Institutional Principles and Criteria:”
• Monitoring of alliances and conflicts between social groups; • Immigration rate/level; • Changes in food sources; • Access to timber and NTFPs (for different social groups); • Improved access to capacity-building; • Access to technology; • Changes in land tenure or use rights; • Ownership of carbon pools and Certified Emission Reduction units (CERs); • Access to cultural or religious sites; • Access to information: • Participation and decision-making mechanisms; • Monitoring of inequalities; • Effects on social groups’ internal organizations.
The EnCoFor Social and Institutional Principles are presented in Table 22. The approach is primarily one of identifying risks of negative impact and minimizing or mitigating them.
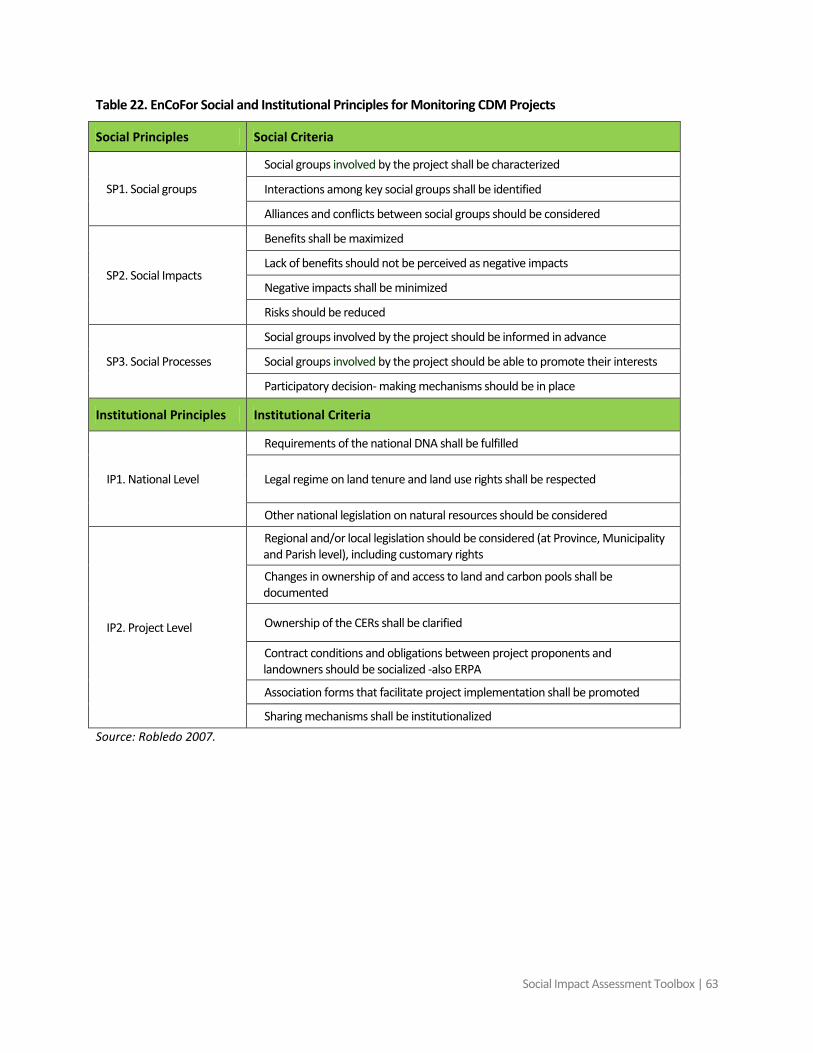
Social Impact Assessment Toolbox | 63
Table 22. EnCoFor Social and Institutional Principles for Monitoring CDM Projects
Social Principles Social Criteria
SP1. Social groups
Social groups involved by the project shall be characterized
Interactions among key social groups shall be identified
Alliances and conflicts between social groups should be considered
SP2. Social Impacts
Benefits shall be maximized
Lack of benefits should not be perceived as negative impacts
Negative impacts shall be minimized
Risks should be reduced
SP3. Social Processes
Social groups involved by the project should be informed in advance
Social groups involved by the project should be able to promote their interests
Participatory decision- making mechanisms should be in place
Institutional Principles Institutional Criteria
IP1. National Level
Requirements of the national DNA shall be fulfilled
Legal regime on land tenure and land use rights shall be respected
Other national legislation on natural resources should be considered
IP2. Project Level
Regional and/or local legislation should be considered (at Province, Municipality and Parish level), including customary rights
Changes in ownership of and access to land and carbon pools shall be documented
Ownership of the CERs shall be clarified
Contract conditions and obligations between project proponents and landowners should be socialized -also ERPA
Association forms that facilitate project implementation shall be promoted
Sharing mechanisms shall be institutionalized Source: Robledo 2007.
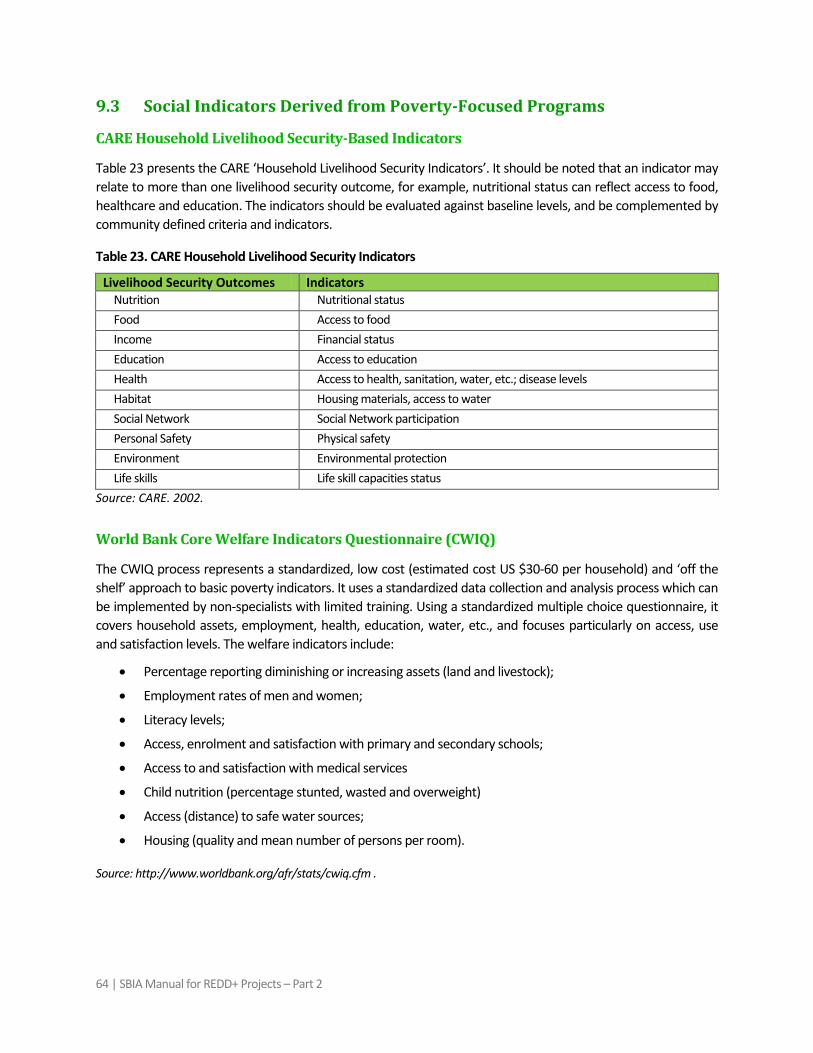
64 | SBIA Manual for REDD+ Projects – Part 2
9.3 Social Indicators Derived from Poverty-Focused Programs
CARE Household Livelihood Security-Based Indicators
Table 23 presents the CARE ‘Household Livelihood Security Indicators’. It should be noted that an indicator may relate to more than one livelihood security outcome, for example, nutritional status can reflect access to food, healthcare and education. The indicators should be evaluated against baseline levels, and be complemented by community defined criteria and indicators.
Table 23. CARE Household Livelihood Security Indicators
Livelihood Security Outcomes Indicators Nutrition Nutritional status Food Access to food Income Financial status Education Access to education Health Access to health, sanitation, water, etc.; disease levels Habitat Housing materials, access to water Social Network Social Network participation Personal Safety Physical safety Environment Environmental protection Life skills Life skill capacities status
Source: CARE. 2002.
World Bank Core Welfare Indicators Questionnaire (CWIQ)
The CWIQ process represents a standardized, low cost (estimated cost US $30-60 per household) and ‘off the shelf’ approach to basic poverty indicators. It uses a standardized data collection and analysis process which can be implemented by non-specialists with limited training. Using a standardized multiple choice questionnaire, it covers household assets, employment, health, education, water, etc., and focuses particularly on access, use and satisfaction levels. The welfare indicators include:
• Percentage reporting diminishing or increasing assets (land and livestock);
• Employment rates of men and women;
• Literacy levels;
• Access, enrolment and satisfaction with primary and secondary schools;
• Access to and satisfaction with medical services
• Child nutrition (percentage stunted, wasted and overweight)
• Access (distance) to safe water sources;
• Housing (quality and mean number of persons per room).
Source: http://www.worldbank.org/afr/stats/cwiq.cfm .
Social Impact Assessment Toolbox | 65
9.4 Social Performance Indicators from the Microfinance Sector
The ‘Social Performance Working Group’ has developed a core or common set of ‘social performance indicators’ for evaluating microfinance institutions (MFIs). A related initiative is the Social Impact Measurement (SIM) Tool developed by the International Network of Alternative Financial Institutions (INAFI), composed of Oxfam, Novib and Ordina, as a cost-effective approach to evaluation. The focus is on easy to measure indicators of performance, including beneficiary perceptions of change. Commonly used indicators by the micro-finance sector are:
• Value of equipment/building for non-farm enterprises Indicators of Changes in Assets:
• Animal ownership; • Land ownership; • Ownership of transport assets • Ownership of consumer appliances
• Housing conditions Indicators of Changes in Living Conditions and Reduced Vulnerability:
• Type and level of cooking fuel • Access to drinking water • Regularity or frequency of meals • Quality of food • An expenditure based index showing whether people have reduced or increased their expenditure on
livestock, production materials, housing, and other assets • Savings (increase or decrease)
• % of children reaching 5th gradeSchooling Indicators:
19
• % of primary school aged daughters/sons attending school or finishing primary school
• % of secondary school aged daughters/sons attending school
• Number of meals per day (strong correlation between nutrition and health) Health Indicators:
• Number of days sick during a given period • % of births attended by skilled personnel • Under 5 mortality rate
• Economic, social and political indicators are under development by INAFI Empowerment of Women Indicators:
• Social capital indicators: • Degree of social organization - average number of community organizations participated in by
beneficiaries
19 This is the preferred indicator of the multiple donor Education For All (EFA) program since grade 5 of primary school has been identified as the ‘threshold for sustainable literacy’.
66 | SBIA Manual for REDD+ Projects – Part 2
• Social and political empowerment - perceived freedom to actively participate in meetings or collective social actions
• Decision-making power - perceived degree of power to take decisions; number of beneficiaries holding a leadership position
Sources: SEEP Network. 2006; INAFI 2006.
Social Impact Assessment Toolbox | 67
References
Agarwal, B. 2009. Gender and Forest Conservation: The Impact of Women's Participation in Community Forest Governance. Ecological Economics, 2009: 2785-99.
Agarwal, B. 2010. Gender and Green Governance. Oxford: Oxford University Press, 2010.
Aldrich, M. and J. Sayer. 2007. In Practice – Landscape Outcomes Assessment Methodology "LOAM". WWF Forests for Life Programme. http://assets.panda.org/downloads/loaminpracticemay07.pdf.
Angelsen, A., ed. 2008. Moving ahead with REDD: Issues, options and implications. Bogor, Indonesia: CIFOR.
Angelsen, A., H.O. Larsen, J.F. Lund, C. Smith-Hall, C., and S. Wunder. 2011. Measuring Livelihoods and Environmental Dependence. Methods for Research and Fieldwork. London, UK: Earthscan.
Angelsen, A. and Wertz-Kanounnikoff, S. 2008. What are the key design issues for REDD and the criteria for assessing options. In Moving ahead with REDD: Issues, options and implications, ed. A. Angelsen. 2008, (Bogor, Indonesia: CIFOR) 11-22.
Angelsen, A. and Wunder, S. 2003. Exploring the Forest-Poverty Link: Key Concepts, Issues and Research Implications. CIFOR Occasional Paper No. 40. Center for International Forestry Research. Bogor, Indonesia.
Ashley, C. and Hussein, K. 2000. Developing Methodologies for Livelihood Impact Assessment: Experience of the African Wildlife Foundation in East Africa, Working Paper 129. Overseas Development Institute, London
Asquith, N. and S. Wunder. 2008. Payments for Watershed Services: The Bellagio Conversations. Santa Cruz de la Sierra, Bolivia: Fundación Natura.
Bond, I. and J. Mayers. 2010. Fair deals for watershed services: Lessons from a multi-country action-learning project. Natural Resource Issues No. 13. London, UK: International Institute for Environment and Development.
Bond, I. et al. 2009. Incentives to sustain forest ecosystem services: A review and lessons for REDD. Natural Resource Issues No. 16. With CIFOR, Bogor, Indonesia, and World Resources Institute, Washington D.C., USA. London, UK: International Institute for Environment and Development.
Boyd, E. 2002. The Noel Kempff project in Bolivia: Gender, power and decision-making in climate mitigation. Gender and Development 10.2: 70-77.
Brown, D., F. Seymour, and L. Peskett. 2008. How do we achieve REDD co-benefits and avoid doing harm? In Moving ahead with REDD: Issues, options and implications, ed. A. Angelsen, (Bogor, Indonesia, CIFOR, 2008), 107-118.
Campbell, B., S. Vermeulen, and T. Lynam. 1991. Value of Trees in the Small-Scale Farming Sector of Zimbabwe. Ottawa, Canada: International Development Research Centre.
68 | SBIA Manual for REDD+ Projects – Part 2
CARE. 2002. Household Livelihood Security Assessments. A Toolkit for Practitioners. Prepared by TANGO International Inc., Tucson, AZ. http://www.proventionconsortium.org/themes/default/pdfs/CRA/HLSA2002_meth.pdf.
Carter, S. 2009. Socio-economic benefits in Plan Vivo projects. Trees for Global Benefits, Uganda, Plan Vivo Foundation and ECOTRUST.
Catley, A., J. Burns , D. Adebe, and O. Suji. 2008. Participatory Impact Assessment. A Guide for Practitioners. Medford, MA: Feinstein International Center, Tufts University. https://wikis.uit.tufts.edu/confluence/download/attachments/19924843/Part_Impact_10_21_08V2.pdf?version=1&modificationDate=1225200269000
CCBA. 2008. Climate, Community & Biodiversity Project Design Standards. Second Edition. Arlington, VA: CCBA. http://www.climate-standards.org/.
CIFOR. 2001. The Criteria and Indicators Toolbox Series No. 1.
Colchester, M. 2010. Free, Prior and Informed Consent: Making FPIC Work for Forests and Peoples. Research Paper Number 11. New Haven, CT: The Forests Dialogue.
Colfer, C.J.P. with R. Prabhu, M. Gunter, C. McDougall, N.M. Porro, and R. Porro. 1999. Who Counts Most? Assessing Human Well-Being in Sustainable Forest Management. The Criteria & Indicators Toolbox Series 8. Bogor, Indonesia: CIFOR. http://www.cifor.cgiar.org/acm/methods/toolbox8.html.
Conservation Measures Partnership.2007. Open Standards for the Practice of Conservation. Version 2.0. The Conservation Measures Partnership http://www.conservationmeasures.org/initiatives/standards-for-project-management.
Corbera, E., C.G. Soberanis, and K. Brown. 2008. Institutional dimensions of Payments for Ecosystem Services: An analysis of Mexico's carbon forestry programme. Ecological Economics 68 (3):743-761.
Corbera, E., N. Kosoy, M. Martınez Tuna. 2007. Equity implications of marketing ecosystem services in protected areas and rural communities: Case studies from Meso-America. Global Environmental Change 17 (2007): 365–380.
Cronkleton, P., Albornoz, M. Barnes, G., Evans, K. and de Jong, W. 2010. Social Geomatics: Participatory Forest Mapping to Mediate Resource Conflict in the Bolivian Amazon. Human Ecology, 2010: 65-76.
Davies, R. and W. Smith. 1998. The Basic Necessities Survey: The experience of ActionAid Vietnam. London, UK: Action Aid. http://www.mande.co.uk/docs/BasicNecessitiesSurveyAAV1998.pdf.
DFID (Department for International Development UK). 2000. An Evaluation Study of FRP’s Carbon Sequestration Project in Southern Mexico. A Report by Planning, Economic and Development Consultants, Edinburgh, UK.
Evans, K., W. de Jong, P. Cronkleton, D. Sheil, T. Lynam, T. Kusumanto, and C.J. P. Colfer. 2006a. Guide to participatory tools for forest communities. Bogor, Indonesia: CIFOR. http://www.cifor.cgiar.org/publications/pdf_files/Books/BKristen0601.pdf.
Social Impact Assessment Toolbox | 69
Evans, K., S.J. Velarde, R. Prieto, S.N. Rao, S. Sertzen, K. Dávila, P. Cronkleton, and W. de Jong. 2006b. Field guide to the Future: Four Ways for Communities to Think Ahead. Nairobi, Kenya: CIFOR, ASB, World Agroforestry Centre. http://www.asb.cgiar.org/ma/scenarios.
FAO. 1990. The community's toolbox: The idea, methods and tools for participatory assessment, monitoring and evaluation in community forestry. Community Forestry Field Manual 2. Rome, Italy: FAO. http://www.fao.org/docrep/x5307e/x5307e00.htm.
German, L., A. Ruhweza, and R. Mwesigwa, with C. Kalanzi. 2009. Social and environmental footprints of carbon payments: A case study from Uganda. Unpublished report.
Grieg-Gran, M., I. Porras, and S. Wunder. 2005. How Can Market Mechanisms for Forest Environmental Services Help the Poor? Preliminary Lessons from Latin America. World Development 33 (9):1511-1527.
Guijt, I. 2009. Monitoring for collective learning in rural resource management. In Farmer First Revisited: Innovation for agricultural research and development, ed. I. Scoones and J. Thompson (Rugby, UK: Practical Action Publishing), 282-289.
Holmes, C., J.C. Ingram,D. Meyers, H. Crowley, and R. Victurine. 2008. Forest Carbon Financing for Biodiversity Conservation, Climate Change Mitigation and Improved Livelihoods: The Makira Forest Protected Area, Madagascar, Wildlife Conservation Society Report to USAID. http://www.undp.org/bcpr/iasc/content/docs/MandE/UNDP_RBM_Selecting_indicators.pdf
IFAD (International Fund for Agricultural Development). 2009. Evaluation manual: methodology and process. Rome, Italy: IFAD Office of Evaluation. http://www.ifad.org/.
INAFI (International Network of Alternative Financial Institutions). 2006. Social Impact Assessment. Theoretical background paper for SIM tool INFAFI. http://www.inafiinternational.org/.
Jagger, P., E.O. Sills, K. Lawlor, and W.D. Sunderlin. 2010. A guide to Learning about livelihood impacts of REDD+ projects. Occasional Paper 56, Bogor, Indonesia: CIFOR
James A., V. Pangtey, P. Singh, and K. Virgo. 2002. Participatory assessment. Bringing people’s perceptions to project management desktops: A quantified participatory assessment of the Doon Valley Watershed Project in North India. Impact Assessment and Project Appraisal 20 (3): 201-214.
James, A. 2003. Quantified Participatory Assessment: Capturing Qualitative Information in Large-Scale Development Projects. ftp://ftp.solutionexchange.net.in/public/decn/cr/res03060802.pdf.
James, A.J., T. Mathew, and N. Rai. 2005. Report of a Ford Foundation supported Action Research Study on Conservation, Enterprise and Livelihoods. New Delhi, India: Pragmatix Research & Advisory Services.
Jindal, R. 2010. Livelihood impacts of payments for forestry carbon services: Field evidence from Mozambique. In Livelihoods in the REDD? Payments for Environmental Services, Forest Conservation and Climate Change , ed. L. Tacconi, S. Mahanty, H. Suich. Cheltenham, UK: Edward Elgar.
La Rovere, R. and J. Dixon. 2007. Operational guidelines for assessing the impact of agricultural research on livelihoods. Good practices from CIMMYT. Batan, Mexico: Impacts Targeting and Assessment (ITA) Unit, CIMMYT.
70 | SBIA Manual for REDD+ Projects – Part 2
Margoluis, R., C. Stem, N. Salafsky, and M. Brown. 2009. Design alternatives for evaluating the impact of conservation projects. New Directions for Evaluation 2009 (122): 85-96.
McDermott, M. H., and K. Schreckenberg. 2009. Equity in community forestry:Insights from North and South. International Forestry Review, 2009: 157-170.
McMichael, A. et al. 2003. Linking Ecosystem Services and Human Well-being. Chapter 3. Millennium Ecosystem Assessment. http://www.millenniumassessment.org/en/Synthesis.aspx.
Millennium Ecosystem Assessment. 2005. Ecosystems and Human Well-being: Synthesis. Island Press, Washington, DC.
Pagiola, S., A. Arcenas, and G. Platais. 2004. Can payments for environmental services help reduce poverty? An exploration of the issues and evidence to date from Latin America. World Development. 33 (2): 237-253.
Pattanayak, S. K. 2009. Rough guide to impact evaluation of environmental and development programs. SANDEE Working Paper No. 40-09. South Asian Network for Development and Environmental Economics, Kathmandu, Nepal. http://www.sandeeonline.com/publicationdetails_disp.php?pcid=1&pid=847.
Peskett, L., D. Huberman, E. Bowen-Jones, G. Edwards, and J. Brown. 2008. Making REDD Work for the Poor. A Poverty Environment Partnership (PEP) Report. www.odi.org.uk/resources/download/2580.pdf.
Plan Vivo Foundation. 2008. The Plan Vivo Standards. Plan Vivo Foundation, Edinburgh.
Pretty, J., I. Guijt, J. Thompson. I. and Scoones. 1996. Participatory Learning and Action. A Trainer's Guide. London, UK: IIED.
Pro Poor Centre. 2006. The 2006 Basic Necessities Survey (BNS) in Can Loc District, Ha Tinh Province, Vietnam. A report by the Pro Poor Centre and Rick Davies. http://www.mande.co.uk/docs/The%202006%20Basic%20Necessities%20Survey%20Final%20Report%2020%20July%202007.doc.
PROFOR. 2008. Poverty Forests Linkages Toolkit. Program on Forests, World Bank, Washington, DC http://www.profor.info/profor/node/103.
Rezende D. and S. Merlin. 2003. Social Carbon. Adding value to sustainable development. Sao Paulo, Brazil: Instituto Ecológica, Renata Farhat Borges.
Richards, M. 2008. Issues and Challenges for Social Evaluation or Impact Assessment of ‘Multiple-Benefit’ Payment for Environmental Services (PES) Projects. Prepared for United Nations Forum for Forests. Forest Trends. Washington, D.C. http://moderncms.ecosystemmarketplace.com/repository/moderncms_documents/Pro-poor%20pes-MB.1.1.1.doc
Richards, M., J. Davies, and G. Yaron. 2003. Stakeholder Incentives in Participatory Forest Management. A Manual for Economic Analysis. London, UK: ITDG Publishing.
Social Impact Assessment Toolbox | 71
Robledo C. 2007. Manual for addressing social and institutional issues. Environment and community based framework for designing afforestation/reforestation projects in the CDM: methodology development and case studies. http://www.joanneum.at/encofor/.
Schreckenberg, K., I. Camargo, K. Withnall, C. Corrigan, P. Franks, D. Roe, L.M. Scherl, and V. Richardson. 2010. Social Assessment of Conservation Initiatives: A Review of Rapid Methodologies. Natural Resources Issues No. 22. London, UL: IIED.
SEEP Network. 2006. Social Performance Map. Washinton, DC: The SEEP Network Social Performance Working Group. http://www.seepnetwork.org/Pages/Default.aspx.
Smith, J. and S. Scherr. 2002. Forest carbon and local livelihood: assessment of opportunities and policy recommendations. Occasional Paper 37. Bogor, Indonesia: CIFOR.
Social Carbon. 2009. Social Carbon Guidelines. Manual for the Development of Projects and Certification of Social Carbon Credits. Version 03, May 2009. http://www.socialcarbon.org/Guidelines/Files/socialcarbon_guidelines_en.pdf.
Tacconi, L., S. Mahanty, and H. Suich. 2009. Assessing the potential livelihood impacts of incentive payments for avoided deforestation. Paper presented at the XIII World Forestry Congress 18 - 23 October 2009. Buenos Aires, Argentina.
Tanburn, J. 2008. Measuring and Reporting Results. The 2008 Reader on Private Sector Development. Swiss Agency for Development and Cooperation.
TransLinks. 2007. Livelihood Surveys. A tool for conservation design, action and monitoring. TransLinks 16 Household Survey Manual. Wildlife Conservation Society/USAID http://rmportal.net/library/content/translinks/LivelihoodSurveys_Manual_WCS_2007.pdf/view.
Wilkie, D. 2006. Household Surveys – a tool for conservation design, action and monitoring. Living Landscapes Technical Manual 4, August. USAID and WSC. http://wcslivinglandscapes.com/landscapes/media/file/LLP_Manual4_HouseholdSurveys_EN.pdf
World Bank. 2000. World Development Report 2000/2001: Attacking poverty. Washington, DC: World Bank.
World Bank. 2011. World Development Report 2011: Conflict, Security and Development. Washington, DC: World Bank
Wunder, S. 2008. Payments for environmental services and the poor: concepts and preliminary evidence. Environment and Development Economics 13: 1–19.