Embed Size (px)
Citation preview

SOCIAL EXCLUSION AND CRIMINAL JUSTICE:
ETHNIC MINORITIES AND STOP AND SEARCH IN NORTH LONDON
Dr JAYNE MOONEYProf JOCK YOUNG
2
Centre for CriminologyMiddlesex University
CONTENTS
Page
Acknowledgements
(i)
Tables and Figures
(ii-iii)
Chapter One: BACKGROUND AND AIMS OF PROJECT 1
Chapter Two: EXPLAINING DIFFERENCES 9
Chapter Three: CAR STOPS
17
Chapter Four: THE POLITICS OF EXCLUSION 23
Chapter Five: THE PROFLIGATE USE OF STOP AND SEARCH 36
Chapter Six: POLICY RECOMMENDATIONS 41
Appendix STATISTICAL REPORT, Prof. C. Hale
Bibliography

(i)
ACKNOWLEDGEMENTS
Our thanks to Councilor Derek Sawyer, Leader of
Islington Council and member of the Metropolitan
Police Committee who has been a constant champion
of objective research as a guide to policy. To Dr
Michael Pollak of Islington Council who has
patiently and understandingly waited for this
report, to Garoid O'Meachair, Chair of CARA, The
Irish Housing Association, who has given both his
support and insight as has Trevor Jones,
Secretariat All Party Irish in Britain,
Parliamentary Group.
At Middlesex University our colleagues Peter
Kennison, Malcolm Read and John Lea have been
helpful in their suggestions and advice.
Professor Chris Hale at the University of Kent has
provided statistical analysis and useful
criticism. Lastly, Catriona Woolner has been
unstinting in her editorial work on the
manuscript.
JAYNE MOONEY
JOCK YOUNG

(ii)
TABLES AND FIGURES
Page
Table 1 Prevalence of Footstops by Country of Origin,Finsbury Park Study 2
Figure 1 Number of Searches and Resultant Arrests, 1986-96England Scotland and Wales 6
Figure 2 Percentage of Searches Resulting in Arrest 6
Figure 3 Number of Searches and Resultant Arrests, 1986-96.Metropolitan Police Service 7
Figure 4 Percentage of Searches Resulting in Arrests 7
Table 2 Prevalence of Foot Stops: Numbers Stopped byEthnic Group 9
Table 3 Ratio of Black to White Stops: London Studies 12
Table 4 Ethnic Populations, Finsbury Park, by Class 13
Table 5 Ethnic Populations, Finsbury Park, by Age 13
Table 6 Gender Ratios and Ethnicity, Finsbury Park 13
Figure 5 Focus of Police Attention with Regards to FootStops by Three Ethnic Groups 15
Table 7 Car Stops by Frequency 17
Table 8 Foot Stops and Car Stops leading to Searches 17
Table 9 Car Stops by Class 18
Table 10 Percentage of Car Stops that Involve Searches, byClass 19
Table 11 Reasons for Car Stops by Class 19
Table 12 Car Stops by Age 20
Table 13 Car Searches by Age 20
Table 14 Percentage of Cars Stopped and Subsequently Searched, by Gender 21
Table 15 Car Stops and Ethnicity 21
Table 16 Ratio of Foot Stops and Car Stops by Ethnicity 21
Table 17 Victims of Street Crime by Ethnicity and Gender26

(iii)
Table 18 Violence in Public Space by Ethnicity and Gender26
Table 19 Factors Likely to Influence Ethnic Patterns inPACE Data 28
Table 20 The Demand and Supplyn Model of Stop and Search28
Figure 6 Types of Racism 31
Table 21 Types of Racism and Remedial Policies 32
Table 22 Stop and Search by Selected Police Areas 1997/836

1
CHAPTER ONE:
BACKGROUND AND AIMS OF THE PROJECT
Background of the Project
This project forms part of a long-term study of Stop and
Search in North London, particularly the Borough of
Islington, and focusing, amongst other things, on the
relationship between the police and ethnic minorities. The
advantage of such continuing research rather than one-off
projects is that it allows ideas to develop and hypotheses
arising out of one project to be tested in another. It also
permits some measure of comparison over time. Let us look
at the extent of the research work that has occurred within
the Borough which has focused primarily, or touched upon,
Stop and Search.
First Islington Crime Survey 1986 (Jones et al)
Second Islington Crime Survey 1990 (Crawford et al)
The Irish and Policing in Islington 1991
(Woodhouse, O'Meachair et al)
Policing the Streets 1995 (Young)
The Present Study 1999 (Mooney and Young)
The present study arises particularly out of a need to re-
examine the findings of the 1995 study, Policing the Streets,
which was based on a large scale high intensity study of the
Finsbury park area in North Islington. This involved a
survey of 1,000 individuals using a sample of 50% of all
households and a random selection of one person over 16
per household. It was funded by the Department of the
Environment and was one of the most intensive studies of
policing to occur in this country. It came up with some
extremely interesting findings, not the least being the
patterning of foot stops:
2
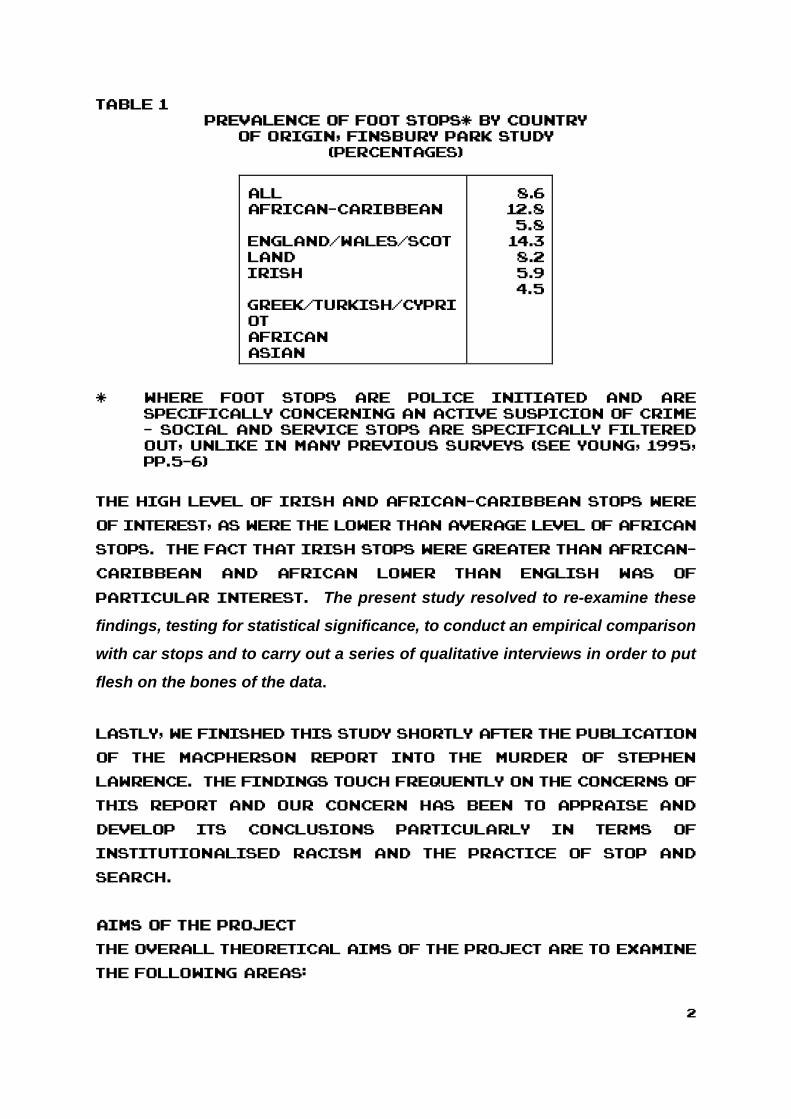
Table 1PREVALENCE OF FOOT STOPS* BY COUNTRY
OF ORIGIN, FINSBURY PARK STUDY(Percentages)
AllAfrican-Caribbean
England/Wales/ScotlandIrish
Greek/Turkish/CypriotAfricanAsian
8.612.85.8
14.38.25.94.5
* Where foot stops are police initiated and arespecifically concerning an active suspicion of crime- social and service stops are specifically filteredout, unlike in many previous surveys (see Young, 1995,pp.5-6)
The high level of Irish and African-Caribbean stops were
of interest, as were the lower than average level of African
stops. The fact that Irish stops were greater than African-
Caribbean and African lower than English was of
particular interest. The present study resolved to re-examine these
findings, testing for statistical significance, to conduct an empirical comparison
with car stops and to carry out a series of qualitative interviews in order to put
flesh on the bones of the data.
Lastly, we finished this study shortly after the publication
of the Macpherson Report into the murder of Stephen
Lawrence. The findings touch frequently on the concerns of
this report and our concern has been to appraise and
develop its conclusions particularly in terms of
institutionalised racism and the practice of stop and
search.
Aims of the Project
The overall theoretical aims of the project are to examine
the following areas:

3
1. DISPROPORTIONALITY A wide scale debate exists with
regards to the 'disproportional' contact between
ethnic groups and the criminal justice system (for a
good summary of the literature and research findings
see Smith, 1997; Sanders, 1997).
Much of this is focused on disproportionality at
sentencing (see Hood, 1992) and its subsequent effect on
the structure of the prison population, but interest
has also been extensive in terms of the 'entry' point
into the criminal justice system (see Fitzgerald and
Sibbit, 1997).
Our present study's remit was first of all to discover
if our findings of disproportionality were
statistically sound and, if so, to attempt explanation
of the patterning of stops. Three competing theories
will be examined:
a) The Incongruity Thesis: that stops are a
function of the conspicuousness of members
of one ethnic group in an area predominantly
made up of other ethnic groups (Dixon et al,
1989; Jefferson and Walker, 1992);
b) The Prejudice Thesis: that stops are a simple
function of police prejudices against
particular ethnic groups; and
c) The Class Thesis: that the differential
patterns of stops are largely a function of
the police focus of suspicion on working
class, young men (Walker, 1987). That is, the
high focus on certain ethnic groups largely
reflects the sizeable proportion of working
class, young men in their population.
Of particular interest here is the recent literature
on the health of migrants which points strongly to the

4
fact that the explanation of disproportionalities in
mortality and prevalence of illness cannot be simply
reduced to class and other demographic variables (see
S. Harding, 1998).
2. INSTITUTIONALISED RACISM Directly relating to the
phenomenon of disproportionality is the notion of its
mechanism being a function of institutionalised
racism within the police service (see Gilroy, 1987;
Gordon, 1987; Macpherson, 1999). Both the incongruity
thesis and the prejudice thesis clearly fit this
conjecture, although both have different outcomes in
terms of police focus of suspicion. Such discussions
are obviously of considerable political significance
particularly in the wake of the Lawrence Inquiry. The
accusation of institutionalised racism can span
everything from clearly State instituted policy (such
as in South Africa under the Nationalist
administration), to a 'cop culture' which exaggeratedly
stereotypes certain ethnic minorities as criminogenic
(the clearest analysis of the concept is in Lea, 1986).
What is important to note, for the moment, is that there
is no necessary symmetry between racist intent and
racist outcome in terms of a disproportionate focus on
particular minorities. For example, clearly racist
police cultures can lead to a neglect of ethnic
minorities, Asian groups can, for example, be
stereotyped as committing little crime and, therefore,
be of little interest to the police officer on the beat.
The extremely low level of stops experienced by Asians
in nearly every survey bears this out. In the extreme,
violent attacks and even homicide, within the black
communities in Nationalist South Africa or the South
of the United States, were comparatively neglected
because of racist indifference. And the reverse, as we
shall see, stereotypes and institutions can generate
intense focus on particular ethnic groups even

5
without any racist intent.
3. ACTUARIAL JUSTICE In the last ten years there have
been repeated assertions as to a major shift in the
orientation of Western criminal justice systems. That
is from a system which was neo-classicist, concerned
with justice, evidence, individual guilt - or innocence
and clear cut crimes, to that which is managerial and
administrative, concerned with control, balance of
probability and categorical suspicion and concerned
with the management of actual and potential
troublemakers (see Feeley and Simon, 1992; 1994; Young,
1999).
This assertion has to be put in the context of the rapid
change in the use of Stop and Search in the present
period. Several authors have pointed to the rise in the
prevalence of stop and search since 1986, yet the
decline in the proportion of arrests (eg Sander, 1997;
Fitzgerald and Sibbit, 1997). The dramatic nature of
this phenomenon is illustrated in the following
graphs. Thus, over seven times more people were
stopped and searched on foot or vehicle under PACE in
1996 than in 1986, the first year of the PACE
legislation, whereas arrests declined from 17% to 11%
during that period (Wilkins and Addicott, 1997). In the
Metropolitan District searches rose by almost eight
times, whilst the arrests declined similarly from 17% to
11%.
From an actuarial point of view such a decline might
be explained as a clear indication of a shift to a
concern with disorder management, rather than
criminal justice. That is, with moving undesirables
along rather than being involved in the criminal
justice process starting at arrest. This clearly links
to the incongruity thesis detailed above.

6
The most recent national figures show the continuation
of this trend with a 21% increase in the last year (1998)
an overall nine times increase since 1986 and the
arrest rate now reduced to 10%. On the face of it such
a remarkable deployment of police resources has
strong actuarial overtones particularly the low
arrest rate and the minor nature of many of the
offences dealt with.
4. SOCIAL EXCLUSION The focus of policing on certain
sections of the community raises the question of the
degree to which the exclusionary forces emanating
from the criminal justice system are exerted on those
who are excluded from the labour force - or at least
the secure, primary labour market. The compounding of
social exclusion is an important area of investigation
as is the extent to which this represents a
criminalisation and scapegoating of poverty.

7
Figure 1
Figure 2
NUMBER OF SEARCHES AND RESULTANT ARRESTS, 1986-96: ENGLAND, SCOTLAND & WALES
0
100000
200000
300000
400000
500000
600000
700000
800000
900000
1986 1987 1988 1989 1990 1991 1992 1993 1994 1995 1996
SEARCHES
ARRESTS
Percentage of Searches Resulting in Arrest
10
11
12
13
14
15
16
17
18
1986 1987 1988 1989 1990 1991 1992 1993 1994 1995 1996
Arrests

8
Figure 3
Figure 4
Percentage of Searches Resulting in Arrest (MPS)
1011
1213
1415
1617
18
1986 1987 1988 1989 1990 1991 1992 1993 1994 1995 1996
ARRESTS
9
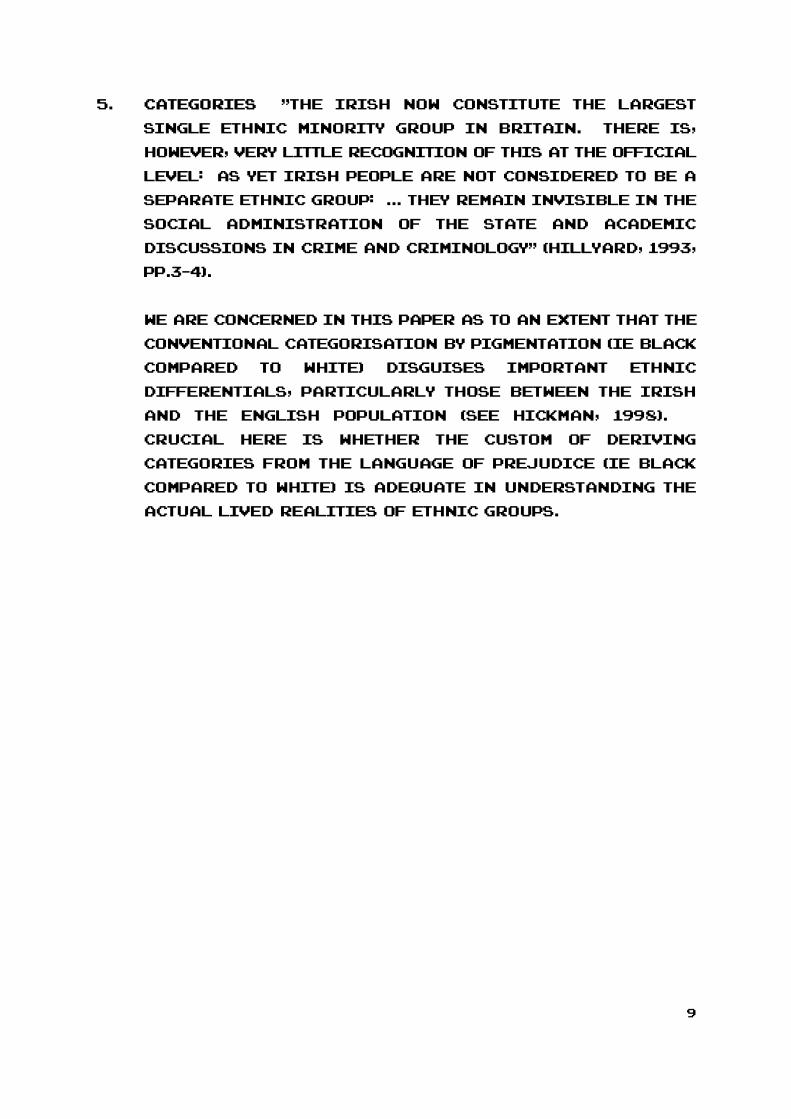
5. CATEGORIES "The Irish now constitute the largest
single ethnic minority group in Britain. There is,
however, very little recognition of this at the official
level: as yet Irish people are not considered to be a
separate ethnic group: ... they remain invisible in the
social administration of the state and academic
discussions in crime and criminology" (Hillyard, 1993,
pp.3-4).
We are concerned in this paper as to an extent that the
conventional categorisation by pigmentation (ie black
compared to white) disguises important ethnic
differentials, particularly those between the Irish
and the English population (see Hickman, 1998).
Crucial here is whether the custom of deriving
categories from the language of prejudice (ie black
compared to white) is adequate in understanding the
actual lived realities of ethnic groups.

10
CHAPTER TWO:
EXPLAINING DIFFERENCES
Our first task is to re-examine the data to see if the
findings of differences between the ethnic groups are
statistically sound. Let us add numbers to the data in Table
1:
Table 2
PREVALENCE OF FOOT STOPSNUMBERS STOPPED AND NOT STOPPED BY POLICE, BY ETHNIC GROUP
Stopped
NotStopp
edTota
l
English/Scottish/WelshIrishAfricanAfrican-Caribbean
312228
5011343255
5321563463
Total: 63 722 785
The problem with our data is that the numbers involved are
small yet, over against this, our sampling size is extremely
high, viz 50% of households. This is a far greater sample
than that usually occurring in such surveys. Furthermore,
a further 12 people were stopped who did not fit the above
ethnic categories (eg Greek Cypriot, Asian, Turkish) which
made our prevalence figure 75. More crucially, the average
number of stops per individual was in the region of six
which generated 450 incidents in all picked up by the
survey. Dr Chris Hale, Professor of Criminology at the
University of Kent and the leading expert in this field, was
kind enough to look over our data for us. His analysis is
reproduced as an appendix to this report. But his overall
assessment is that, whilst we must discount the African data
as being too small to allow generalisation, there are
significant differences in the following two instances:
11
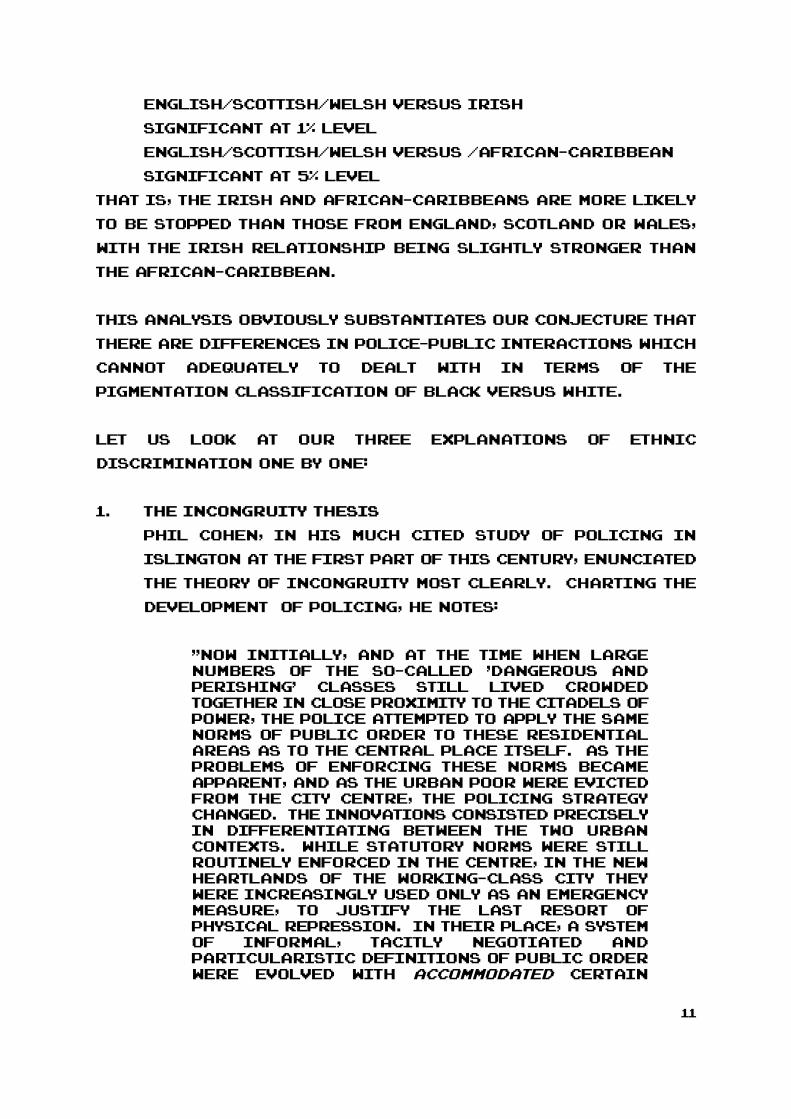
English/Scottish/Welsh versus Irish
Significant at 1% level
English/Scottish/Welsh versus /African-Caribbean
Significant at 5% level
That is, the Irish and African-Caribbeans are more likely
to be stopped than those from England, Scotland or Wales,
with the Irish relationship being slightly stronger than
the African-Caribbean.
This analysis obviously substantiates our conjecture that
there are differences in police-public interactions which
cannot adequately to dealt with in terms of the
pigmentation classification of black versus white.
Let us look at our three explanations of ethnic
discrimination one by one:
1. The Incongruity Thesis
Phil Cohen, in his much cited study of policing in
Islington at the first part of this century, enunciated
the theory of incongruity most clearly. Charting the
development of policing, he notes:
"Now initially, and at the time when largenumbers of the so-called 'dangerous andperishing' classes still lived crowdedtogether in close proximity to the citadels ofpower, the police attempted to apply the samenorms of public order to these residentialareas as to the central place itself. As theproblems of enforcing these norms becameapparent, and as the urban poor were evictedfrom the city centre, the policing strategychanged. The innovations consisted preciselyin differentiating between the two urbancontexts. While statutory norms were stillroutinely enforced in the centre, in the newheartlands of the working-class city theywere increasingly used only as an emergencymeasure, to justify the last resort ofphysical repression. In their place, a systemof informal, tacitly negotiated andparticularistic definitions of public orderwere evolved with accommodated certain

12
working-class usages of social space andtime, and outlawed others. What were ratifiedwere those practices which articulated theinstitutions of patriarchy and publicpropriety within the class habitat; what wereoutlawed were those practices of women andchildren which challenged the monopoly ofthose institutions over the working-classcity and its legitimate usage. The new normsin effect imposed a system of unofficialcurfew, informal out-of-bounds, to definewhat were the wrong people, wrong age, wrongsex, in the wrong place and the wrong time." (1979, pp.130-1)
Such an analysis, applied to discrimination against
blacks in the present period, has achieved wide
currency (eg Dixon et al, 1989; Sanders, A, 1997). As
noted, it is closely associated with the notions of
social exclusion and the creation of barriers
separating 'respectable' and 'non-respectable' sections
of the population - in particular, the patrolling of a
posited underclass.
At first glance some of these figures give credence to
the incongruity thesis. Thus the ratio in London as a
whole (where the overall black proportion of the
population is small) is much greater than in more
central Boroughs such as Islington and Hammersmith
and Fulham (where the proportion is comparatively
higher). It is even further corroborated by the Leeds
study of Walker et al (1990), which shows a very high
ratio of stops in that part of Leeds with low ethnic
minority populations (2.7:1 in areas at <10%) and even a
reversal of the ratio in an area of Leeds where the
ethnic minority population is high.
It falls down, however, when one looks at a breakdown
within Islington. Thus the ratio in North Islington, with a
higher black population, is much greater than in South
Islington - the reverse of what should happen under the
incongruity thesis. And this is corroborated by the

13
Finsbury Park figures which show a ratio which, although
not as high as North Islington overall (of which more
later), is considerably greater than in the South of the
Borough.
2. The Prejudice Thesis
The prejudice thesis would state that the explanation
of the disparities in police stops is simply a function
of police prejudice. If this is so, one might expect
some uniformity of results in the various studies,
particularly in the same area which presumably
consists of police officers of roughly similar
attitudes. The London studies simply do not show this.
For example, within Islington, as a whole, there are
clear and wide disparaties, whilst in Hammersmith and
Fulham (surveyed in the same period) the differences
are not substantial.
Table 3
RATIO OF BLACK TO WHITE STOPSLONDON STUDIES
Study Area Ratio Author
PSIICS2HCS
Greater LondonIslingtonHammersmith &Fulham
3.7:12.1:11.2:1
D Smith, 1983Crawford et al1990Painter et al1989
ICS2
FPCS
North IslingtonSouth Islington
Finsbury Park
3.0:11.4:1
2.2:1
Crawford et al1990Crawford et al
1990
Young, 1995
One glance at the above shows a wide variation in
rates and, indeed, a remarkable difference between
practices in the North and South of Islington.
3. The Class Thesis
Let us know look at the Class thesis. This states that

14
what seems to be prejudice or incongruity is in fact
class, coupled with youth and masculinity. That black
is merely a signifier for working class and that as the
African-Caribbean community has a higher working
class population than whites, it inevitably will have
higher stop rates. Therefore, why the ratios are so
high in London as a whole is that the white population
has a wide class spread, and why it is low in the inner
boroughs is that the white population is much more
working class - hence the differences between black
and white begin to narrow. As we see, this fits well
with the first three London studies in Table 3, and is
generally congruent with findings elsewhere but still
has the problem of the divisions between the borough
with the middle class South having lower rates than
the more working class North.
What I want to do in terms of this present study in
Finsbury Park is look at the class, age and gender
dimensions of the ethnic population there and see if
this explains the differences in discrimination.
Table 4
ETHNIC POPULATIONS FINSBURY PARK BY CLASS
Professional
LowerMiddle Class
WorkingClass
English/Scottish/WelshIrishAfrican-Caribbean
20.325.918.1
35.223.320.1
47.850.961.1
The main differences are the markedly working class
nature of the African-Caribbean population, but note
the comparatively high professional middle class
population of the Irish, which makes it perhaps the
most class varied of the ethnic groups.

15
Table 5
ETHNIC POPULATIONS FINSBURY PARK BY AGE
Age <24 25-44 >45
English/Scottish/WelshIrishAfrican-Caribbean
13.817.120.1
56.256.950.0
30.026.029.2
The Irish population is comparatively youthful, with a
low population greater than 45, the African-Caribbean
has the widest spread of age, with the high proportion
under 24 yet almost a third over 45.
Table 6
GENDER RATIOS AND ETHNICITY FINSBURY PARK;MALE : FEMALE
English/Scottish/WelshIrishAfrican-Caribbean
0.93 : 11.39 : 11.07 : 1
Note the strikingly higher proportion of men in the
Irish community.
Let us summarise: the overall proportion of each of
the above three groups is English, Scottish and Welsh
- 46%, Irish - 14% and African-Caribbean - 14%. If we
compare the two immigrant communities with the
English, Scottish and Welsh majority, we could make the
following distinctions:
Irish - Has a wider class composition
- A more youthful population
- A higher ratio of men to women
The class thesis suggests that stops are related to the
population of working class, young, males. On this
score the more youthful and masculine nature of the
population would, all things being equal, ensure a

16
higher rate of stops. Let us apply this now to:
African-Caribbean - Has a markedly
more working class population
- Has a more youthful population
- Has a fairly equal ratio of men to
women
In terms of the class thesis, then, we would expect a
higher rate of stops because of the working class and
youthful nature of the population.
The question now revolves around: is the higher Irish
and African-Caribbean rate of stops merely a function
of the differences in the demography of their
communities when compared to the English, Scottish and
Welsh, or is there something extra? Although it is
difficult to be precise because of the exigencies of
classification by the age groups used or contestable
definitions of class, it can be surmised that we would
need to hypothesise that all stops were solely directed
at young, working class males and nobody else (which is
clearly not true) to explain the higher African-
Caribbean rate. Further, this would only at the most
explain 75% of the higher rate of Irish stops.
Foot stops by Age and Class
Let us look at the differences in the patterning of
police contact by age and class to see if we can
determine what makes for this extra level of stops.
Although the numbers are small, some distinct
differences can be observed:
1. English, Scottish and Welsh (ESW) can be
characterised as focusing predominantly on the
young and the working class;
2. African-Caribbean stops do not have a working
class focus: they occur irrespective of class.

17
They also extend to a much wider age range, but
drop off after 45;
3. The Irish stops have a working class focus, like
the ESW, but they have an extremely wide age range,
including those over 45.
Figure 5
FOCUS OF POLICE ATTENTION WITH REGARDS TOFOOT STOPS BY THREE ETHNIC GROUPS

18
The patterning of stops thus varies across these three
dimensions by ethnic group. The class thesis in an
undiluted form only works for the English, Scottish
and Welsh; the focus on young working class males is,
of course, also true for the Irish and African-
Caribbeans, but age is of less relevance for the Irish
(the focus is less youthful) where class is of less
relevance for the African-Caribbeans (the middle
class are less immune from stops.

19
CHAPTER THREE:
CAR STOPS
Car stops are the most frequent form of police initiated
interaction with the public. It is, therefore, of great
interest to see how car stops relate to the findings from
stops on foot. The national figures for vehicle stops are
14% of the population and for stops on foot are 3% (Mirrlees-
Black and Budd, 1997). The Finsbury Park figures are
distinctive in terms of the very high proportion of foot
stops, the level of car stops is not significantly higher.
16.1% of people had been stopped by the police whilst in a
car in the last twelve months. This is almost double the
level of foot stops (8.0%). 61% of these had been stopped more
than once: 21% more than three times.
Table 7
CAR STOPS BY FREQUENCY
Frequen
cy
1 2 3-7 >12 T
n
%
109
59
36
20
24
13
15
8
184
100
Of these stops, searches were carried out in 20% of cases.
The overall percentage of searches by population was 3.2%.
Table 8
FOOT STOPS AND CAR STOPS LEADING TO SEARCHES
Stops Searches Proportionof StopsSearched
FootCar
8.616.1
6.53.2
76%20%
Thus searches are over three times less likely after a car
20
stop rather than a foot stop and, although twice as many of
the population have been stopped in a car compared to on
foot, only one half as many of the population have
experienced having their car searched compared to being
searched on foot. The obvious reason for this is that car
stops are overwhelmingly concerned with driving offences
and not suspicion of other criminal offences.
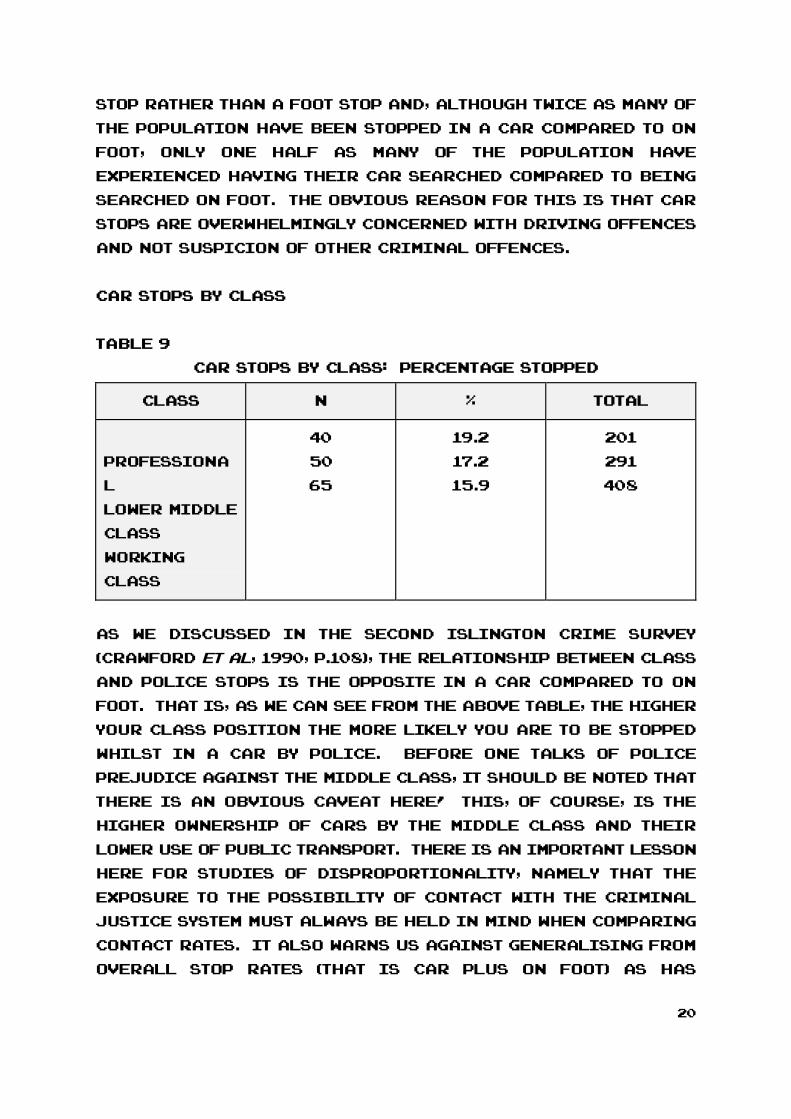
Car Stops by Class
Table 9
CAR STOPS BY CLASS: PERCENTAGE STOPPED
Class n % Total
Professiona
l
Lower Middle
Class
Working
Class
40
50
65
19.2
17.2
15.9
201
291
408
As we discussed in the Second Islington Crime Survey
(Crawford et al, 1990, p.108), the relationship between class
and police stops is the opposite in a car compared to on
foot. That is, as we can see from the above table, the higher
your class position the more likely you are to be stopped
whilst in a car by police. Before one talks of police
prejudice against the middle class, it should be noted that
there is an obvious caveat here! This, of course, is the
higher ownership of cars by the middle class and their
lower use of public transport. There is an important lesson
here for studies of disproportionality, namely that the
exposure to the possibility of contact with the criminal
justice system must always be held in mind when comparing
contact rates. It also warns us against generalising from
overall stop rates (that is car plus on foot) as has

21
occurred in the recent Home Office study (Mirrlees Black
and Budd, 1997).
Car Searches by Class
If, however, we examine car stops which involved searches
of the car, exactly the opposite relationship is found, viz
the likelihood of having the car searched increases the
lower you are in the class structure.
Table 10
PERCENTAGE OF CAR STOPS THAT INVOLVE SEARCHESBY CLASS
ProfessionalLower MiddleClassWorking Class
16.722.524.6
ALL 20.1
As searches are concerned with conventional, non-motoring
crime, this reversal in relationship becomes clear viz the
inverse relationship of police stops and class generally
found in all studies relates to the greater suspicion of
working class involvement in crime and holds up in all
cases, apart from car stops which are concerned with
motoring offences. Hence it is invalid only for car stops
and not for searches.
Reasons for stop
Table 11
REASONS FOR STOP BY CLASSPercentage Stopped
Speeding VehicleDefect
RoutineCheck
ProfessionalLower MiddleClassWorkingClass
151023
31611
23209
22
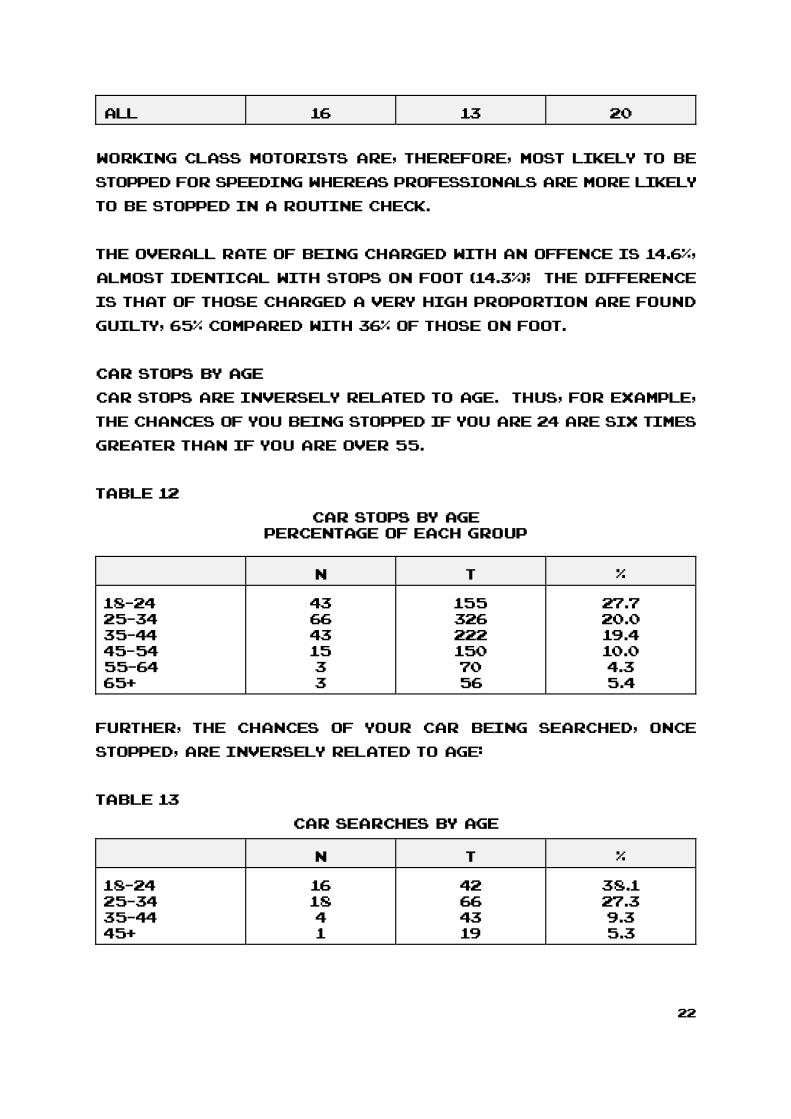
ALL 16 13 20
Working class motorists are, therefore, most likely to be
stopped for speeding whereas professionals are more likely
to be stopped in a routine check.
The overall rate of being charged with an offence is 14.6%,
almost identical with stops on foot (14.3%); the difference
is that of those charged a very high proportion are found
guilty, 65% compared with 36% of those on foot.
Car Stops by Age
Car stops are inversely related to age. Thus, for example,
the chances of you being stopped if you are 24 are six times
greater than if you are over 55.
Table 12
CAR STOPS BY AGEPercentage of Each Group
n T %
18-2425-3435-4445-5455-6465+
4366431533
1553262221507056
27.720.019.410.04.35.4
Further, the chances of your car being searched, once
stopped, are inversely related to age:
Table 13
CAR SEARCHES BY AGE
n T %
18-2425-3435-4445+
161841
42664319
38.127.39.35.3

23
Car Stops by Gender
Table 14
PERCENTAGE OF CARS STOPPED ANDSUBSEQUENTLY SEARCHED BY GENDER
Car Stops Car Searches
MaleFemale
1814
2221
There is not such a wide gender differential between car
stops and foot stops. Foot stops are typically much more
focused on males, in the instance of this research 2.7:1,
whereas for car stops it is only 1.3:1. Once stopped, however,
one-fifth were search irrespective of gender.
Table 15
CAR STOPS AND ETHNICITY
% n Total
English/Scottish/WelshIrishAfrican-Caribbean
11.120.516.9
221612
1997871
Clearly the type of distribution noted in terms of foot
stops is reproduced in terms of car stops, although
somewhat less pronounced.
Table 16
RATIOS OF FOOT STOPS AND CAR STOPS BY ETHNICITY
Foot Stops Car Stops
Irish 2.4 1.9
African-Caribbean
2.2 1.5
English/Scottish/Welsh
1.0 1.0

24
The figures for searches by ethnicity are too small to be of
significance.
DISCUSSION
Car stops occur for two reasons: because of motor offences
relating to bad driving or poor maintenance or, as in
footstops, because of suspicion of crime unrelated to
motoring. Searches are, of course, related to crime per se
rather than motoring offences. Thus the seeming anomaly of
a higher proportion of middle class car stops is explained
in terms of car ownership and that the focus, in this
instance, is on motoring offences. Indeed the palpable
evidence of car defect or speeding means that, in genedral,
those stopped in a car are less disgruntled (although
scarcely happier) than those stopped on foot and the
overall rate of those found guilty is considerably greater
(see also Crawford, et al, 1990, pp.107-110).
However, if we focus on searches (which most usually relate
to crime) then the inverse relationship with class and age,
and, in the case of ethnicity, car stops replicates the
pattern of foot stops with the Irish and African-Caribbean
way ahead of the English, Scottish and Welsh.

25
CHAPTER FOUR:
THE POLITICS OF SOCIAL EXCLUSION
Let us first delineate the level of concentration of the
police on certain sectors of the population. The level of
focus of foot stops is extraordinary, one in seven of the
Irish population is stopped on suspicion of crime in a
twelve month period and one in eight of the African-
Caribbean. And, of course, each individual is liable to
multiple stops in the year, seven to eight on average.
Furthermore, if we hone down our focus by age and gender we
find that over one in two African-Caribbean men between
the age of 18-24 have been stopped and a slightly higher
proportion of young Irish men. Yet even here we have not
added class, once you put working class into the perspective
then you are in all probability talking about nearly all
African-Caribbeans and Irish in this group having been
stopped. Our numbers do not allow us to generalise here,
although they point in that direction and are universally
corroborated by the interviewees.
"The police assume black boys are up to no goodparticularly if you're out as part of a group of matesbut even if you are on your own. They [the police]should be made to know that all black boys aren't bad- most aren't." (Male, 14, Second Generation, African-Caribbean - mother a civilian worker for the police.)
"We are stopped all the time: I can't think once ofanyone who had done anything. I think they've got itagainst the Irish. You can tell by their snide remarks,their attitude, the way they stick around outside Irishpubs." (Male, 20, Unemployed, Second Generation Irish.)
It is necessary to spell out these findings because they
assist the reader to realise that one is not talking about
a police procedure which now and then, ever so slightly,
impacts on the lives of people. This is true of some, we, for
example, found no professional, white men over 55 who had
been stopped on foot and the occasional over 45 year old.
In these instances it would be quite correct to say that
26
such policing encounters have little or no effect on
people's attitudes to the police: the occasional, rate stop on
the way back home at night may lead to a one-off adverse or
critical comment at most, but is soon forgotten. But for
some people the constant attention of the police becomes a
subject of constant discussion and resentment. And this is,
of course, particularly true of those, such as the Irish or
African-Caribbeans, who consciously identify as part of an
ethnic group and who in discussion come to realise that
'people like us' are a prime and regular target of police
attention.
"When I was in my teens I hung out with West Indian kids,acting black. It was part of our thing: we'd get stoppedevery night and acted tough and all that." (Male,African, Student, Early Twenties.)
THE COMPOUNDING OF EXCLUSION
It is common to examine the level of stop and search as an
entry point into the criminal justice system. This is, of
course, important and will obviously relate to
disproportionalities in terms of sentencing and prison
populations. But just as important is the lateral effect:
that is in terms of the general compounding of social
exclusion.
It cannot be too strongly emphasised how the focus of foot
patrols is, on the whole, proportional to the level of
economic marginalisation of a social group. That is, the
more a section of the population is economically in the
categories of the structurally unemployed, or that part of
the secondary labour market where work is casual and
insecure, the more they are suspect in the street, and other
public places by police patrols. No one suggests that such
a coincidence is necessarily purposive (although elements
of such stereotyping undoubtedly occurs) but what is
without doubt is that economic exclusion is compounded by
what is perceived as a legal exclusion. Having being

27
belittled in their economic citizenship such groups are
then belittled in their citizenship as legal equals. Thus
the effects of such gross focusing on certain groups in our
population is not merely limited to the impact of the
perceived injustice and indignity of interrogation but
occurs in the already fragile circumstances of economic
marginalisation. John Lea and myself, elsewhere,
(particularly in What is to be Done About Law and Order?,
1993) have noted how such compounding of economic
marginalisation and perceived harassment by the police is
the standard component of riot situations whether it is in
Brixton or Los Angeles. This, of course, is an extreme
example of such compounding of social exclusion. The day
to day gradual process we depict in this research has the
more mundane effect of simple alienation from society and
from the moral bind to law and order. It creates a
situation of cops and outlaws where the extraordinary
levels of focus of police attention create and constitute
groups.
"It becomes a game, they know you and you knowthem. They treat you like dirt but you don't showit. You just stare them out." (Young, African-Caribbean man).
THEY'RE NEVER THERE WHEN YOU WANT THEM
"I have been stopped plenty of times both on footand in the car. In the least twelve months I havehad seven car stops, four in four nights in a row. I was told it was just a random check - every timethey looked through my documents. I got so fed upproducing them I made a copy and gave it in to thepolice station! All of this occurred just up theroad [in Durham Road area] near the station. Thepolice officers were polite but I felt fed up thattwice the same officers stopped me and I had to goall the way through the same procedure. As far asstops on foot, its generally young people - I can'tsee it being very effective. It's more so for carswhen they are looking for defects, no tax disc andsuch. But my car was in good condition.
I feel generally dissatisfied with the police: theydon't seem to want to know about crime in the
28
estate. I witnessed a break in recently and'phoned them but nobody turned up. Then I rangthem two hours later and they said they had norecord of the call. If you ask me they spend toomuch time in the pub over the road - what is thepoint of giving them information if they don't acton it. Don't they want to solve crimes?" (Man, 46,Local Government Officer, born in Irish Republic,Council Accommodation)
A frequent criticism of the police by those stopped centres
around not a critique of policing or a dislike of the
police per se but on the lack of protection which the police
provide when the interviewee has been victimised.
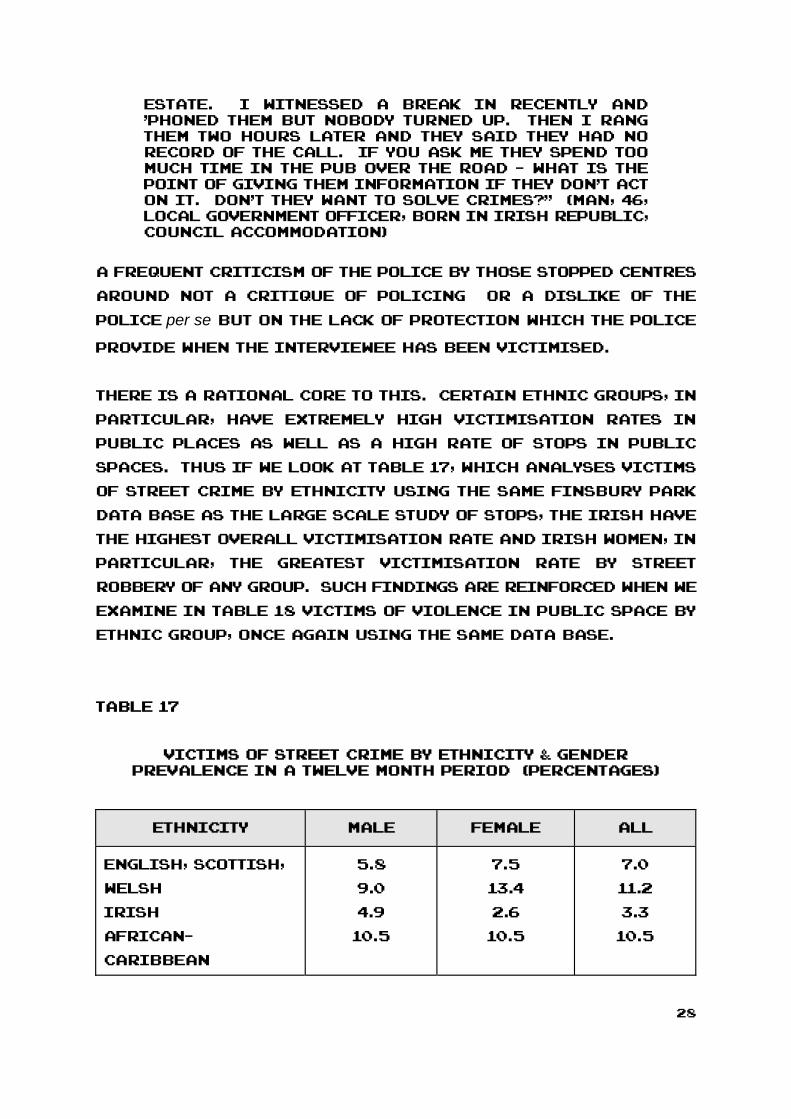
There is a rational core to this. Certain ethnic groups, in
particular, have extremely high victimisation rates in
public places as well as a high rate of stops in public
spaces. Thus if we look at Table 17, which analyses victims
of street crime by ethnicity using the same Finsbury Park
data base as the large scale study of stops, the Irish have
the highest overall victimisation rate and Irish women, in
particular, the greatest victimisation rate by street
robbery of any group. Such findings are reinforced when we
examine in Table 18 victims of violence in public space by
ethnic group, once again using the same data base.
Table 17
VICTIMS OF STREET CRIME BY ETHNICITY & GENDERPrevalence in a Twelve Month Period (Percentages)
Ethnicity Male Female All
English, Scottish,
Welsh
Irish
African-
Caribbean
5.8
9.0
4.9
10.5
7.5
13.4
2.6
10.5
7.0
11.2
3.3
10.5

29
African
[Source Islington Street Crime Survey, Harper et al, 1995]
Table 18
VIOLENCE* IN PUBLIC SPACE BY ETHNICITY AND GENDERPer Cent of Total Sample
ETHNICITY WOMEN
%
MEN
%
English, Scottish,
Welsh
Irish
African-Caribbean
Other
7
6
13
6
13
21
13
7
n = 1,000 * Threats of or anyform of physical violence
THE TRIPLE COMPOUNDING OF EXCLUSION
Our argument, so far, is that the economically excluded are
most likely to be the focus of police attention and of
criminal victimisation. The marginalised are harassed and
then neglected. Let us now turn to the reasons why the
police focus in particular tends to be of this nature.
THE SOCIAL CONSTRUCTION OF STOP AND SEARCH STATISTICS
In our 1995 study we pointed to the fact that there are two
major components which generate the stop and search
statistics:
1. The people selected by the police, and
2. The people available to be selected.
If one wants, the demand and the supply of the situation. We
indicated how it was commonplace to ignore the second
component although it is obvious that, for example, as 51%

30
of stops in Finsbury Park occur either at dusk or in the
night - those people who regularly go out at night are more
likely to be stopped than others. This certainly would
suggest men rather than women, the young rather than the
old, in terms of on foot, working class rather than middle
class and, given our knowledge of leisure patterns, members
of certain ethnic groups (such as African-Caribbean and
Irish) rather than others. Such an analysis was developed
by the Home Office (see Fitzgerald and Sibbitt, 1997;
Fitzgerald and Hale, 1999) in which they suggest that to
understand differences in rates of stops by ethnicity one
must separate out a series of socio-economic factors other
than ethnicity (eg age, class), lifestyle factors which
determine the availability for being stopped, as well as
policing factors:

31
Table 19Factors Likely to Influence Ethnic Patters in PACE Data
Socio-economic factors Lifestyle factors
Policing factors
Age Car ownership Patterns of stop/search withinand between forces
Gender Nights out per weekArea of residence School exclusions
Operational reasonsfor variations (eg response tocrime reports targetedoperations and surveillanceof prominent nominals
Employment and education status Interpretation of powers
Marital status Recording practices[Source: Fitzgerald and Sibbitt, 1997, p.65]
Let us rejig this in terms of our notions of demand and
supply: police suspicion and public availability.
Table 20
The Demand and Supply Model of Stop and Search
DEMAND SUPPLY
SUSPICIOUSNESS AVAILABILITY
POLICE STEREOTYPES
YIELD
SPATIAL FOCUS
(Clubs and Pubs)
UNEMPLOYMENT
LIFESTYLE
SCHOOL EXCLUSIONS
POVERTY
It should be noted that in terms of the class thesis both
demand and supply come together markedly. The police are
suspicious of young, working class males as indeed they
commit a high proportion of street crime and yield from
stop and search is presumably highest for this group. And
precisely this section of the population are more likely to
be out at night, to be on the street because of school
exclusion etc.

32
Thus young working class men are the most frequent
offenders and have the lifestyle (out at night and on foot)
which makes them available for stop and search. Our
conclusion from our earlier study was that on a
superficial level police suspicion would be rationally
directed towards this group. Yet, in fact, only a very small
proportion will be (and ever are) arrested for serious
offences. Thus, although this may be the most sensible
group to focus upon, the yield will be small (and is indeed
falling) and the likelihood of alienating a significant
section of the population is considerable.
INSTITUTIONALISED CLASSISM?
As we have seen, the overwhelming focus of police attention
is on the working class, young, male. And let us note that
both police suspicion and public availability come
together to produce this statistic .. That is these are the
people the police suspect most and these are the people most
available to be picked up on the street, at night, or
wandering the city in 'inappropriate places'.
Zygmunt Bauman, in his recent work, talks of 'the
criminalisation of poverty' (1998a, p.125) and notes how
"poverty turns from the subject matter of social policy into
a problem for penology and criminal law" (1998b, p.77).
Indeed, these people, 'the police property' are largely poor
- lower working class rather than skilled and this focus
seems to have increased, facilitated by notions of
'underclass' and the belief that social problems can be
solved, or at least contained, by multi-agency policing and
the rhetoric and practice of community safety.
THE CRIMINALISATION OF POVERTY
The stereotypical division of the world by police officers
into the vast majority of respectable people and 'the dregs',
'the scum' - the small minority of the unworthy and the

33
disreputable has been pointed out by nearly every
commentator on policing (see Reiner, 1992; Smith, 1983). These
people are, in J A Lee's (1981) graphic phrase, 'police
property', the 'true' object of police attention and concern.
The rational core of this is that it is, of course, the poor
who commit most street crimes such as mugging and burglary,
with which police patrols are concerned (and conversely,
that it is the rich and the middle classes who commit crimes
such as fraud and insider dealing with whom patrols are, by
definition, unconcerned). The focus upon the poor, the
young and the male part of the population is not, therefore,
at all odd. Yet as only a tiny minority of the suspect poor
are actually guilty of such an offence, the widespread use
of stop and search inevitably results in a large number of
innocent people being stopped and consequently alienated.
Indeed the figures shown in Figures 1-4 in the introduction
to this report show that the proportion of searches which
do not result in arrest has been rising rapidly since 1986.
The problem, always there, has seemingly increased
remarkably.
As numerous studies have shown, this section of the
population which is the focus of police attention has:
a) the highest level of criminal victimisation (ie the
greatest need for police services);
b) the highest knowledge of illegalities (ie the
potentially most useful knowledge as informants);
c) the highest level of alienation and suspicion of the
police;
d) the lowest level of willingness to cooperate with the
police.
The division of the society into two sections is
dramatically indicated by Peter Kennison's observation
that the ratio of black to white police contacts is inverted
when we compare police-public contacts in public spaces.
That is, the disproportionate level of police initiated

34
contacts with blacks compared to whites becomes a
similarly disproportional level of public initiated
contacts with the police of white compared to blacks (see
Kennison, 1999). Thus one side of the line are perceived as
the focus of police attention as potential criminals and
demand less of a service from the police whilst the other
are seen as the focus of police service provisions and
demand a comparatively higher level of provision. Such a
stereotypical division of the world is seen tragically in
the events following Stephen Lawrence's death where the
detectives seemed to view the dead teenager as part of a
criminal incident rathe than the victim and were
extraordinarily unhelpful to the Lawrence family in the
subsequent investigation (Macpherson, 1999).
The focus of police attention on this group is, therefore,
rational in direction but irrational in terms of the low
yield. As we have seen, the degree to which ethnic groups
have a high masculine or youthful or working class
component will mean that in these terms they will inevitably
have a higher focus upon them: the critique of this point is
therefore not on the existence of disproportionality but
the high amount of stops and the low level of yield. But, as
we have argued in the previous Chapter, the high stop rate
of African-Caribbeans and the Irish is over and above that
expected simply from a focus on the working class poor. It
is here locked on top of institutionalised classism we will
find racism both of an institutionalised and non-
institutionalised variety.
INSTITUTIONALIZED RACISM
There is considerable disagreement and confusion in the
literature as to what constitutes institutionalized racism,
let alone whether it exists and what is its impact (Solomos
and Back, 1996). The clearest exposition of types of racism
is that set out by John Lea (1986) which is of particular
interest as it is developed in a discussion of policy. In
this he uses two dimensions, whether the racism is direct or

35
indirect, and whether it is based on individual or
institutional practice. Thus:
Figure 6 TYPES OF RACISM
IndividualA BIndividual racist Individuals behavingacts consciously in ways which haveintended racist consequences
Direct Indirect
C DPolicies of Institutional practicesinstitutions directly having racistgeared to racism consequences
Institutional[Source: John Lea, 1986, p.149]
Each of these four types of reason has a policy implication.
Table 21
TYPES OF RACISM AND TYPES OF REMEDIAL POLICIES
A 'Bad Apple' Weed out these individuals
B Unconscious Stereotyping Racial Awareness
Training
C Institutionalised Racism at Political Changelevel of State
D Institutionalised Racism as OrganisationalChange
a Function of UnintendedPractice
Lea's classification is of importance because it clearly
distinguishes working practices from individual attitudes
and, takes on board, the fact that certain practices can
have racist outcomes whether or not the overarching policy
is racist in intent. The institutional racism (type C above)
which is intended, as exemplified historically by the
Apartheid régime in South Africa and the activities of some
police departments in the South of the United States, has no
clear parallel here, it is institutionalised racism of an
unintended nature (type D) which is of greatest relevance.

36
Thus racism can occur on all of these levels but
institutionalised racism which is locked into the practices
of a bureaucracy is much more difficult to eradicate than
that which is merely on an attitudinal level. With the right
practices in place, as Lea indicates, even racist officers
can act in a civilised fashion because it is in their
interests to do so. On the other hand, when racist practices
are institutionalised into the working practices of a
police service, then racist attitudes are given legitimacy.
In these instances those police officers with racist
opinions will be encouraged to express them but, even more
unfortunately, those perfectly decent officers of a fair
minded disposition will find themselves bound into
practices which have racist outcomes.
OCCLUDED FOCUS
By occluded focus we mean that police officers may put a
particularly high pressure of surveillance on a community
without realising that this is happening. For example, as
the white population of Finsbury Park is considerably
larger than the black population, from the point of view of
the police officer, he or she is hardly singling out blacks
given that five out of six footstops are directed at whites.
Yet, of course, from the point of view of young blacks what
actually happens is a very high proportion are multiply
stopped. This is even more occluded in the cases of those of
Irish descent to whom one in three of stops occur in
Finsbury Park. This is a fairly high proportion of stops, yet
because many second generation Irish have London accents
with little or slight Irish lilt, it would not be obvious to
the police officer in many instances that they were Irish
although from the perspective of those stopped and their families it would be
obvious that a very significant targeting was occurring.
Furthermore, it is interesting what the effect of including
the Irish in the same category as English, Scottish and
Welsh in the pseudo-scientific category 'white' when making

37
comparisons. For, in fact, just over one half of stops are
focused on African-Caribbeans and the Irish. Put this way,
the bias of policing is obvious.
THE SOCIAL FOCUS
The focus of police attention evidenced in the survey was
clearly corroborated in the interviews. Time and time
again interviewees in their thirties and forties noted that
being stopped was less likely now than compared to when
they were young.
"I was stopped a lot when I was young - just a teenager,not doing much, just hanging around as you do. I wasconstantly asked to move on. It doesn't happen to menow that I am older; anyway I have a young family anddon't go out much anymore." (Male, 32, SecondGeneration Irish, BT Engineer).
"I don't get stopped as much as when I was younger, atleast in this area - although I did get stopped threemonths ago outside a club in the West End. It'steenagers who get stopped the most." (Male, 28, GreekCypriot, Unemployed).

38
LURKING AND LARKING: THE SPATIAL FOCUS
"We go out once a week on Saturday night to [well knownIrish pub]. It's open late, the music is good and we geta wee bit boisterous. It's just larking about really. But the funny thing is we're almost always stopped onour way home. Say one in two times. It's as if they arelying in wait for us. We're regularly stopped butthere's never any reason to arrest us." (Two Irish Lads,Late Teens, one born in Ireland, the other secondgeneration)
The focus both of stops and searches was clearly focused
71% of all multiple stops was in the Finsbury Park area
(rather than people being stopped outside of their area of
residence) as did 70% of searches. But the spatial focus was
greater than this: it was outside of particular pubs and
clubs, it was on specific areas of particular estates. It
was surely targeting towards what were seen at certain
times as hotspots of incivilities and crime. Places which
deserved attention but perhaps, more significantly, places
where it was easy to attend to. The incongruity thesis
clearly did not apply: the focus was on particular sorts of
people in precisely those parts of Finsbury park, at those
times, that one would expect to find them. If anything, this
corroborates the surmise of our earlier, 1995, study which
used the metaphor of trawling. The police trawl in those
areas where they can make some level of arrest, some
possibility of result, even though the yield is low and
consists largely of trivial crimes and misdemeanours.
FAILING THE ATTITUDE TEST
It is important to stress the hostility, more often unspoken
but sometimes replete with racist epithets, which
accompanies many a stop particularly late at night.
Interviewee after interviewee mentioned the bristling of
resentment as one group of young men in uniform confronted
another walking the streets. Frequently the individuals
stopped eventually crack and quarrel with the police
sometimes on the edge of violence. The arrests which arise
from such confrontations we called, in the last report,

39
'meta-crimes' - crimes created by the confrontation rather
than crimes in themselves. It is difficult not to view these
situations as an attempt to bolster arrest statistics or, as
one police officer interviewed succinctly put it, the
suspects had "failed the attitude test".
INSTITUTIONALISED CLASSISM AND RACISM
As we have seen the notion of the class thesis (more
precisely the focus on the young, the male and the working
class) is frequently posited as an alternative to the notion
of racist prejudice as the mechanism which explains away
the ethnically disproportional focus of stops. In the
marvellous phrase of the Macpherson Report, the host of
factors which 'pray away' racism (see Chapter Six). But even
if the disproportionality were to be explained completely
by class factors (and as we have seen this is not so) this
would not for a moment mitigate the racist impact of such
disproportionality. Yet we have uncovered not only
institutionalised classism but upon its back
institutionalised racism: a double burden of prejudice and
exclusion. This process has both a social and a spatial
focus - it concentrates on certain ethnic groups and dwells
upon the places (the pubs, clubs and streets) that they
frequent. Its stereotype varies and differentiates between
ethnic groups. Thus it sees certain South Asian groups as of
low criminality and others, such as African-Caribbean and
Irish of high criminality, troublesome and uncivil. And, as
we have delineated, it draws different parameters around
groups. It focuses on all African-Caribbeans regardless
of class, with the exception of those over 45, as potential
troublemakers. Perhaps this is because officers see black
skin as equalling lower class and are unable to
distinguish middle class African-Caribbeans, perhaps this
is simply racism, whatever, it has a significant racist
impact on the community placing black people in the
category of the targets rather than the 'consumers' of the
police service. (The events around the death of Stephen

40
Laurence were a tragic example of this). With regards to the
Irish, the parameters cut differently: the focus is more
upon the working class but there is little allowance made
for age. "They see us all as drunken Paddies", one
interviewee said and this sentiment was echoed amongst the
older people we talked to.

41
CHAPTER FIVE:
THE PROFLIGATE USE OF STOP AND SEARCH
We noted in the first Chapter the extraordinary rise in stop
and search which has occurred since the inception of PACE
in 1986. This has been accompanied by a steady decline in
those arrested so that at present 90% of those searched are
innocent - and, of course, these are only those whose stop
has been recorded. If we look at the variation nationally
we can find some clues as the way forward in terms of
return in the Metropolitan Police Area:
Table 22
Stops and Searches under SI Police on Criminal EvidenceAct 1984
and other Legislation, by Selected Police force Areas1997/8
Rate of Stop &Search per
1,000Population
Percentage ofStop & SearchResulting in
Arrest
Proportion ofAll ArrestsResulting
from Stop &Search
BedfordshireGreaterManchester
HertfordshireLancashire
Leicestershire
1122101519
1210101411
45446
Metropolitan
52 11 11
NottinghamshireThamesValleyWestMidlandsWest
991912
1313812
2333

42
Yorkshire
ENGLAND &WALES
- - 5
[Source: Tables 3.2, 3.4, 4.3, Home Office, 1998]
If we examine Table 22 which is derived from the recent
Statistics on Race and the Criminal Justice System, we can
note the following:
1. Variation in Rates of Stop and Search
There is extremely wide variation from 9 per 1,000 in
Nottinghamshire to 52 per 1,000 of the population in
the Metropolitan Police District. Even Greater
Manchester, which is a comparable urban area, has a
rate considerably less than half (42%) of the
Metropolitan rate. It is difficult to imagine what
justifications there are for the high use of such
powers in London. There are obviously no
unsurmountable reasons why considerable reductions
could not be made.
2. Arrest Yield from Stop and Search
Here the rate varies from 8% in the West Midlands to 13%
in Nottinghamshire and The Thames Valley, with the MPD
being in between, at 11%. The percentage of innocent
people stopped is, therefore, high in all areas -
around the 90% mark - this is a general problem of stop
and search which needs to be remedied rather than a
problem of practices in particular police districts.
3. Percentage of Total Arrests the Result of Stop and
Search
Here there is considerable variation from 2% in
Nottinghamshire, through 5% in Greater Manchester to
11% in the MPD. It is obvious that there is no cast iron
reason why stops should provide one tenth of all

43
arrests as they do in London. That is, the argument
that stop and search is vital because of its valuable
contribution to the overall arrest rate would not seem
to hold water.
THREE TYPES OF SUSPICION
In Policing the Streets we argued that suspicion could be of
three sorts:
1. STEREOTYPICAL: which is the present system where police
stereotypes and practice focus upon certain groups
creating alienation from the public yet producing a
low yield;
2. DEMOCRATIC: where every group, sub-group and
individual with society is suspected equally. This is
often the ideal against which stereotypical suspicion
is found wanting but it would be costly to enact, be
politically counterproductive and would in no time
make the law look like an ass. It would be a nonsense
to suspect old ladies of burglary, street robbery and
the possession of ecstasy tablets. As stop and search
is aimed at street crimes and working class young men
are the chief offenders, the focus is naturally upon
them. In a way this is "institutionalised classism" but
the public prioritise these crimes, and in that the poor
suffer more from these crimes than do the middle
classes (see Lea and Young, 1993). The problem of such
institutionalised classism is not the focus but the
scale: enormous numbers of innocent people are
suspects and stopped causing widespread public
disaffection. And, on top of such classism, is an
institutionalised racism which, as we have seen, both
intentionally and unintentionally focuses on ethnic
groups such as the Irish and the African-Caribbean in
a discriminatory fashion.

44
3. INFORMATION-LED: Against both of the above modes it
was argued that the ideal use of stop and search would
be where suspicion was information-led, that is where
stops only occurred where there was actual hard
evidence as to the likelihood that the person stopped
was an offender.
The Home Office Research Study Ethnic Monitoring in
Police Forces: A Beginning (Fitzgerald and Sibbitt,
1997) follows this line of reasoning, concurring that
democratic suspicion would be unfeasible and
illogical and agreeing that stereotypical suspicion
undoubtedly occurs. But the researchers note:
"This poses a real dilemma ... also illustrated byreference to Young's 1994 study of stop and search... - the police cannot do their job effectivelywithout being selective in their suspicions; andthere are strong arguments that improved sharingand strategic use of 'intelligence' will contributeto more effective (and efficient) policing. Yet, inthe context of concerns about police relationswith ethnic minorities, two considerations need tobe borne in mind. One is that, inasmuch as someproportion of those targeted will inevitably beinnocent of any offence, a greater proportion ofinnocent black people will be targeted thanwhites. The other is that suspicion reinforced byintelligence may provide a legitimate cloak forharassment. This can only increase resentment,reinforcing the widespread perception that thepolice disproportionately pick on black people. Where forces are conscious of this dilemma,ethnic monitoring data may prove invaluable - notonly in indicating whether they are achieving theright balance between the potentially conflictingdemands of better targeting and improvedcommunity relations but also, as necessary, inpinpointing where the first of these objectives isputting the second in jeopardy." (1997, p.95)
This seems to mistake our position. The nature of the crimes
upon which stop and search focuses makes it inevitable that
there will be disproportionate focus by class, age and
gender and because of this, ethnicity. That is any group
which has a higher than average working class population

45
(such as the African-Caribbean and the Irish) or a higher
male proportion (such as the Irish) will inevitably have a
disproportionate police focus upon them. The problem is
not the existence of disproportionality but its level and
the quantity of people suspected. As far as level is
concerned, we have seen how racist stereotyping and
practice inflates the proportion of Irish and African-
Caribbean compared to the English, Scottish and Welsh
population. If this institutionalised racism were removed
the class focus would still result in disproportionality
but this would be of a substantially reduced level. But the
problem of the high (and increasing) number of stop and
searches would remain with the concomitant alienation of
a large number of innocent people. This is the problem of
institutionalised classism. What is necessary here is to
fundamentally change the practice of stop and search so
that the numbers are drastically reduced. This would be
achieved by a shift from stereotypical to information-led
suspicion. The Home Office study agrees with the notion of
information-led suspicion but casts information in much
too general a mode. It is not based on specific and
detailed information about individuals and places but on
much more general information of likelihood. Because of
this it would not alleviate the problem of community
relations as it quite correctly points out.
STOPS TO BE JUDGED IN TERMS OF YIELD
Stops must be judged in terms of yield, that is in terms of :
(a) quality and seriousness of crime: it is not impressive,
for example, to net as in Hackney 83% of possession of
drugs arrests for cannabis (a crime which is
extremely low on public priorities, see Jones et al,
1986; Crawford et al, 1990, and only 5% for cocaine and
4% for heroin (Hackney Community Safety Partnership,
1999);
(b) level of arrest and ultimate successful prosecution,

46
ie the present 10% arrest rate with perhaps 3% found
guilty must be raised considerably so that many less
innocent people are harassed by the police.
To argue that police performance should be stringently tied
to yield, of course, completely rules out the habit of making
stops a register of performance in themselves. There can be
no doubt that accountability demands that public bodies be
subject to assessment by the application of agreed
performance indicators. But the impact of an
overburdening and ill-thought out performance culture is
often counter-productive (see Loveday, 1999). There is a point
where rather than the indicator measuring the performance we have the
performance being judged by the measurement of the indicator.
DEALING WITH PRACTICE RATHER THAN ATTITUDE
We have taken a position which maintains that in order to
tackle institutionalised racism and classism one must
tackle the institutionalised practices themselves rather
than hope that reforming individuals will achieve the task.
In particular this should be achieved through the
assessment of results in terms of clearly specified yield
(see D Smith, 1986). We wholeheartedly concur with the
Macpherson Report that a central problem of current
policing is institutionalised racism (and would add
classism to this category) and that the disparities in the
stop and search statistics relate to stereotyping. But these
stereotypes are lodged and maintained in institutionalised
practices, yet the Macpherson Report stops short of
recommending any institutional change (see Recommendation
60). Instead, by putting such a strong emphasis on racial
awareness training, it focuses in upon individual mistakes
in belief rather than tackling the institutional roots of
the problem (Type B rather than Type D racism - see Figure 6
on page 31).
CHAPTER SIX:

47
POLICY RECOMMENDATIONS
1. REDUCTION IN LEVELS OF STOP AND SEARCH
The rate of stop and search should be brought down, in the
first instance, to the national level and thereby reduced
to a situation where suspicion is based on concrete
evidence. That is, the practice should be information-led
and not based on generality or probability.
Our general argument is that stop and search as used at
present is a massive and blunt instrument, costly to
maintain and grossly inaccurate in its impact. Its effects
are counterproductive, its yield largely of minor crimes
and its necessity unproven. In its place we suggest a
smaller, precision instrument, intelligence led and sharply
focused.
In order to achieve this aim there has to be a radical
change in the practice of stop and search both in terms of
its basis (see 2 and 3 below) and its yield (see 4 below).
2. SUSPICION MUST BE INFORMATION-LED
Stop and search must be based on concrete evidence with
regards to individuals (ie direct police observation and
public information).
3. SPATIAL TARGETING MUST BE INFORMATION-LED
Just as the surveillance and searching of individuals must
be based on hard evidence, so too must the focus on spatial
areas whether it is clubs, pubs, or designated 'hotspots'.
The danger of regular, indiscriminate surveillance is that
it will generate hostility and bear down disproportionally
on particular sections of the population. The fashion of
identifying hotspots prevalent in recent Crime Audits is
useful only if the targeting is honed down and temporary.
4. STOPS MUST BE JUDGED IN TERMS OF YIELD

48
The reduced, more lean version of stop and search should
aim at a much higher arrest rate. Furthermore, this rate
should have high quality crimes. Crimes of a minor nature
(eg cannabis possession) should be weighted very lightly in
any measure and offences which are often the result of
altercation resulting from the stop itself - should be
regarded with suspicion. What should be looked for is a
yield which is both high in productivity and quality. The
number of stops achieved per se should cease to be used as
a performance indicator.
5. ETHNIC MONITORING
In line with the Macpherson Report we stress the importance
of the ethnic monitoring of stop and search by 'self-defined
ethnic identity' (Recommendation 61). Important here is
inclusion of the Irish (not just Irish born, but self-
identifying) and the separation out of figures for
different South and South-East Asian ethnic groups, Turks,
Cypriots, etc.
The aim should be to discern patterns of discrimination but
although ethnic disproportionality should be
substantially reduced, their elimination is an unlikely and
undesirable goal as differentials in age, class and gender
between ethnic groups will always result in variation.
What is more important is the drastic reduction in the ratio
and the quantity of stops so that such disproportionality
does not have a largescale discriminatory effect as it does
at present.

APPENDIX
STATISTICAL REPORT
In the following I have made the following assumptions:
1. households can be (neatly) characterised as beingBritish, Irish, African or West Indian.
2. 50% of household from each domain (i.e. British, Irishetc.) were sampled.
Strictly any analysis needs to take account of thehousehold size. I understand this is not possible.
For any domain let N be the total number of households andn the number of households sampled. Then n/N is referredto as the sampling fraction, denoted f, and in this case is0.5 for all domains. If p is the proportion of householdswhere the respondent has been stopped then v(p), an estimateof the variance of p, can be calculated by
v(p) = (1-f)p(n-1)
The estimated proportions of households where therespondent has been stopped are:
British 0.06 (6%)Irish 0.14 (14%)African 0.06 (6%)West Indian 0.13 (13%)
Let's take as an example the difference ins tops betweenBritish and Irish households. Using an obvious notation,with the subscripts indicating domain, the statistic to testthe hypothesis that the proportion of British householdswhere there has been a stop is the same as the proportion ofIrish households is given by:
(pB - pI)/√(V(pB)+V(pI)) (1)
Similar statistics can be calculated for the other pair-wise comparisons. The distributions of these statistics canbe generally approximated by the normal distribution ifthe sample sizes are large. With your data the only problemis with the African data which strictly speaking is toosmall to allow use of the normal approximation.
We are interested in the null hypothesis that theproportions of households experiencing stops in the twogroups being considered are the same. We would reject thisnull hypothesis if the value of the statistics calculatedfrom (1) is larger in absolute value than some criticalvalue.
These critical values depend upon the significance levelchosen and would typically be 2.58 (1%), 1.96 (5%) and 1.64 (10%).

1% implying a stronger relationship than 5% etc.
We obtain the following results
1. British vs. IrishThe calculated statistic is 8.11. Since 8.11 is greaterthan 2.58 this means we reject the null hypothesis atthe 1% significance level and conclude respondentsfrom Irish households are more statisticallysignificantly more likely to have been stopped thanthose from a British household.
2. British vs. West IndianThe calculated statistic is -2.03. At the 5%significance level respondents from West Indianhouseholds are more likely to be stopped than thosefrom a British household.
3. Irish vs. BlackThe calculated statistic is -2.34. At the 5%significance level respondents from Irish householdsare statistically more likely to have been stoppedthan those from Black Households.
4. West Indian vs. BlackThe calculated statistic is -1.64. This is justsignificant at the 10% level.
5. All other pair-wise comparisons are not statisticallysignificant.
When considering the results for the Black households thesmall sample size and the health warning given above needto be remembered.
Prof. C. HaleProfessor of Criminology
University of Kent, at Canterbury