Embed Size (px)
Citation preview
Report No. 52
SOCIAL IMPACT ASSESSMENT STUDY ON
DHAULASIDH HYDRO ELECTRIC PROJECT (DSHEP) 66 MW, HAMIRPUR (Sponsored by SJVNL, Hamirpur vide letter No.SJVNL/DSHEP/PCD/10-1264-68, Dated 15.05.2010)
DEPARTMENT OF AGRICULTURAL ECONOMICS,
EXTENSION EDUCATION & RURAL SOCIOLOGY
COLLEGE OF AGRICULTURE
CSK HP KRISHI VISHVAVIDYALAYA PALAMPUR- 176 062
APRIL, 2011
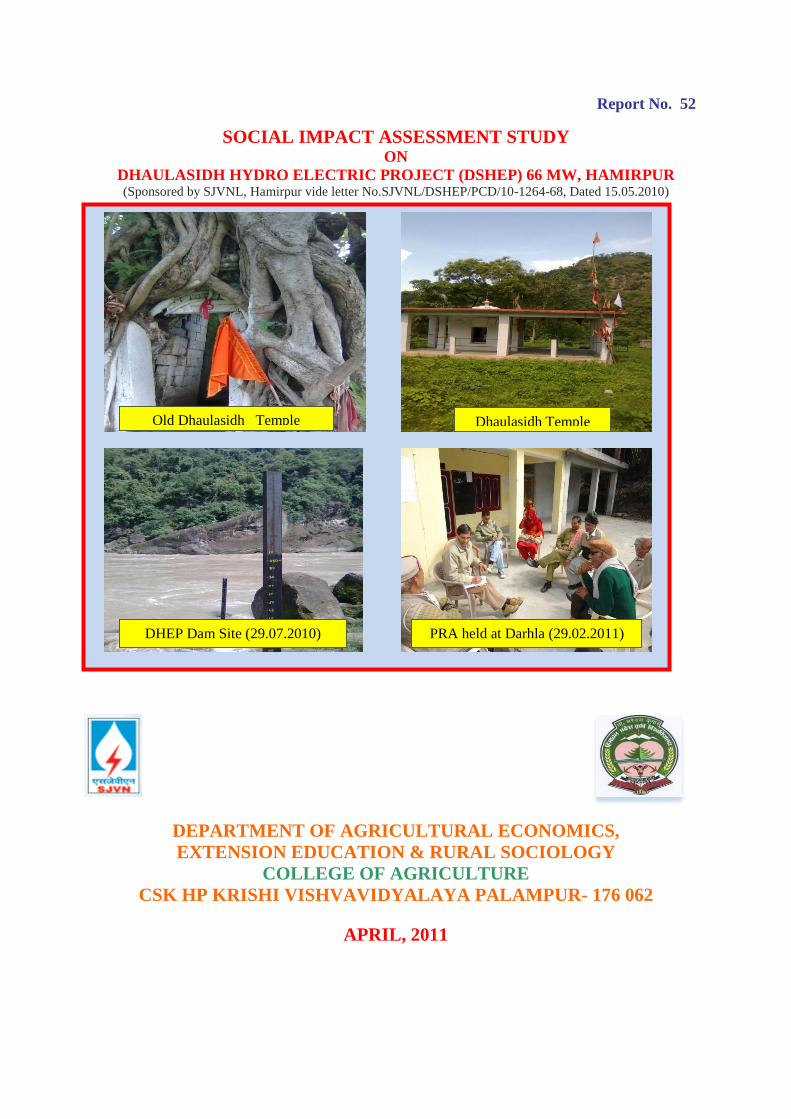
Dhaulasidh Temple Old Dhaulasidh Temple
DHEP Dam Site (29.07.2010) PRA held at Darhla (29.02.2011)

SOCIAL IMPACT ASSESSMENT STUDY ON
DHAULASIDH HYDRO ELECTRIC PROJECT (DHEP) 66 MW, HAMIRPUR
DEPARTMENT OF AGRICULTURAL ECONOMICS,
EXTENSION EDUCATION & RURAL SOCIOLOGY
COLLEGE OF AGRICULTURE
CSK HP KRISHI VISHVAVIDYALAYA PALAMPUR- 176 062
APRIL, 2011
ACKNOWLEDGEMENT
The Social Impact Assessment (SIA) Study has been conducted for the Dhaulasidh Hydro
Electric Project (DHEP) 66 MW, Hamirpur which is being executed by SJVN Limited, a
corporate venture. At the outset we, a team of scientists comprising Agroeconomists,
Environmentist and Agriengineers, wish to thank the SJVNL for funding the project and
giving us an opportunity to conduct this study. Our special thanks are due to Mr. Nand Lal,
Director, SJVNL, Shimla for his initiative, advice and valuable support during course of the
completion of the study. We are also thankful to Er. Sushil Mahajan, Head of DHEP,
Hamirpur, Er. D. Sarveshwar, Er. Avdesh Prasad, Er. Surinder and Er Sushil Sagar Sharma
for their advice, support and help in the coordination of various activities of the study. Er.
Avadesh Prasad, Sr. R & R Officer in ER & R Unit of SJVNL not only made available to us
secondary information and reports of various committees of SJVNL but also helped during
the field survey. Sample farmers/stakeholders, in the project area deserve our sincere thanks
for their kind cooperation in providing required data about different aspects of their
household economies. Last but not the least we wish to put on record the efforts of our
research staff comprising Mr. Arvind, Mr. Kulbhushan, Mr. Dalvinder, Ms. Kusma and Ms.
Sakshi who paid number of visits to study area for the collection and verification of primary
data.
Palampur Research Team
March, 31, 2011 S K Chauhan
H R Sharma
Virender Kumar
Ranbir Rana
A K Goel
List of Abbreviations
AEO Agriculture extension officer
APL Above poverty line
BPL Below poverty line
DHEP Dhaulasidh hydro electric project
FMD Foot & mouth disease
Ha Hectare
HEO Horticulture extension officer
HHs Households
ITI Industrial training institute
Kanal Local unit of land measurement (1 Kanal=
384 sq mt and 25 Kanal = 1 ha)
LBRB Left bank of river beas
LIS Lift irrigation scheme
LPG Liquid petroleum gas
NA Not Available
OBC Other backward castes
PAHs Project affected households
PAVs Project affected villages
PHC Primary health centre
PRA Participatory rural appraisal
PRIs Panchayati raj institutions
RBRB Right bank of river beas
RRA Rapid rural appraisal
SC Scheduled caste
SIA Social impact assessment
SJVNL Satluj Jal Vidyut Nigam Limited
WSS Water supply scheme
CONTENTS
Chapter Title Page
Executive summary 1
0.1 Suggested interventions 1
Chapter 1 INTRODUCTION 6
1.1 Dhaulasidh Hydro Electric Project (DHEP) 6
1.2 Objectives of the study 6
1.3 The Approach 7
Chapter 2 METHODOLOGY 8
2.1 The project affected villages 8
2.2 The questionnaire 8
2.3 Methods of data collection 9
2.4 Limitations of the study 9
2.5 Summing up 9
Chapter 3 RESULTS 13
3.1 DEMOGRAPHY AND SOCIO ECONOMIC PROFILE 13
3.1.1 General description of project affected villages 13
3.1.2 Farm holdings and their classification 14
3.1.3 Households above and below poverty line 14
3.1.4 Information on vulnerable households 15
3.1.5 Project affected households 15
3.1.6 Age and educational wise distribution 16
3.1.7 Housing structure 16
3.1.8 Livestock inventory 17
3.1.9 Average productivity of crops and fruits 18
3.1.10 Household income 19
3.1.11 Access to physical infrastructure/amenities 19
3.1.12 Summing up 20
3.2 TANGIBLE GAINS AND LOSSES OF PROJECT 48
3.2.1 Background information of project affected villages /
households
48
3.2.2 Issues/concerns voiced by project affected households 49
3.2.3 Farmer households losing land 50
3.2.4 Loss of livelihoods 50
3.2.5 Loss of access to common property resources 51
3.2.6 Likely positive impacts 52
3.2.7 Effect on social and cultural relations 52
3.2.8 Likely negative economic effects 53
3.2.9 Summing up 53
3.3 INTANGIBLE GAINS /LOSS 70
3.3.1 Expected environmental/ecological impact 70
Chapter 4 SUMMARY AND CONCLUSION 72
4.1 Background 72
4.2 Objectives 72
4.3 Methodology 73
4.4 Main findings 73
4.5 Suggested solutions to safeguard livelihoods 75
LIST OF TABLES
Table No. Title Page
Table 0.1 Summary of socio-economic profile of the affected villages and
expected positive and negative effects
3
Table 2.1a Geographical features of project affected villages located on LBRB 10
Table 2.1b Geographical features of project affected villages located on RBRB 11
Table 1a Type of farmer households in PAVs on LBRB 22
Table 1b Type of farmer households in PAVs on RBRB 23
Table 2a Number of APL and BPL families on LBRB 24
Table 2b Number of APL and BPL families on RBRB 25
Table 3a Number of vulnerable households in the PAVs on LBRB 26
Table 3b Number of vulnerable households in the PAVs on RBRB 27
Table 4a Number of households affected by project in the project affected
villages on LBRB
28
Table 4b Number of households affected by project in the project affected
villages on RBRB
29
Table 5a Age and education profile of population in affected villages on
LBRB
30
Table 5b Age and education profile of population in affected villages on
RBRB
31
Table 6a Housing structures in PAVs on LBRB 32
Table 6b Housing structures in PAVs on RBRB 33
Table 7a Livestock inventory in project affected villages on LBRB 34
Table 7b Livestock inventory in project affected villages on RBRB 35
Table 8a Average yield of milk (Lt/animal/day) on LBRB 36
Table 8b Average yield of milk (Lt/animal/day) on RBRB 37
Table 9a Average yield of cereal crops (Kg / kanal) on LBRB 38
Table 9b Average yield of cereal crops (Kg / kanal) on RBRB 39
Table 10a Average yield of fruits (Kg/Plant of average age) on LBRB 40
Table 10b Average yield of fruits (Kg/Plant of average age) on RBRB 41
Table 11a Gross household income of households in the PAVs on LBRB 42
Table 11b Gross household income of households in the PAVs on RBRB 43
Table 12a Access to physical infrastructure facilities on LBRB 44
Table 12b Access to physical infrastructure facilities on RBRB 46
Table 13a Issues raised and interventions suggested by households in project
affected villages on LBRB
55
Table 13b Issues raised and interventions suggested by households in project
affected villages on RBRB
57
Table 14a Number of farmer households loosing land and amount of land lost in
PAVs on LBRB
58
Table 14b Number of farmer households loosing land and amount of land lost in
PAVs on RBRB
59
Table 15a Caste composition of households loosing land and per cent land lost
in PAVs of LBRB
60
Table 15b Caste composition of households loosing land and per cent land lost
in PAVs of RBRB
61
Table 16a Households losing livelihoods and the extent of loss across PAVs on
LBRB
62
Table 16b Households losing livelihoods and the extent of loss across PAVs on
RBRB
63
Table 17 Effect on physical infrastructure in PAVs 64
Table 18 Details of the public operated irrigation cum public health water
supply schemes affected by the project
65
Table 19 List of cremation grounds affected by project 66
Table 20a Other facilities affected by project in PAVs in LBRB 67
Table 20b Other facilities affected by project in PAVs on RBRB 68
Table 21 Likely positive impacts of project 69
Table 22 Likely socio-economic negative impacts of project 69
Table 23 Perceived positive environmental/ecological impacts of the project 71
Table 24 Perceived positive and negative environmental/ecological impacts of
the project
71
Table 25 Prioritizations of facilities as per peoples view points (Ranks) 77
Table 26 Consultation matrix based on relevant discussants’ views 78
LIST OF FIGURES
Fig No. Title Page
2.1 Map of the project affected villages under DHEP, 66 MW, Hamirpur 12
LIST OF PHOTOGRAPHS
Title
Participatory Rural Appraisal (PRA) exercise
Nature of land affected
Effects of project on livelihood
Effects of project on public facilities
……
1
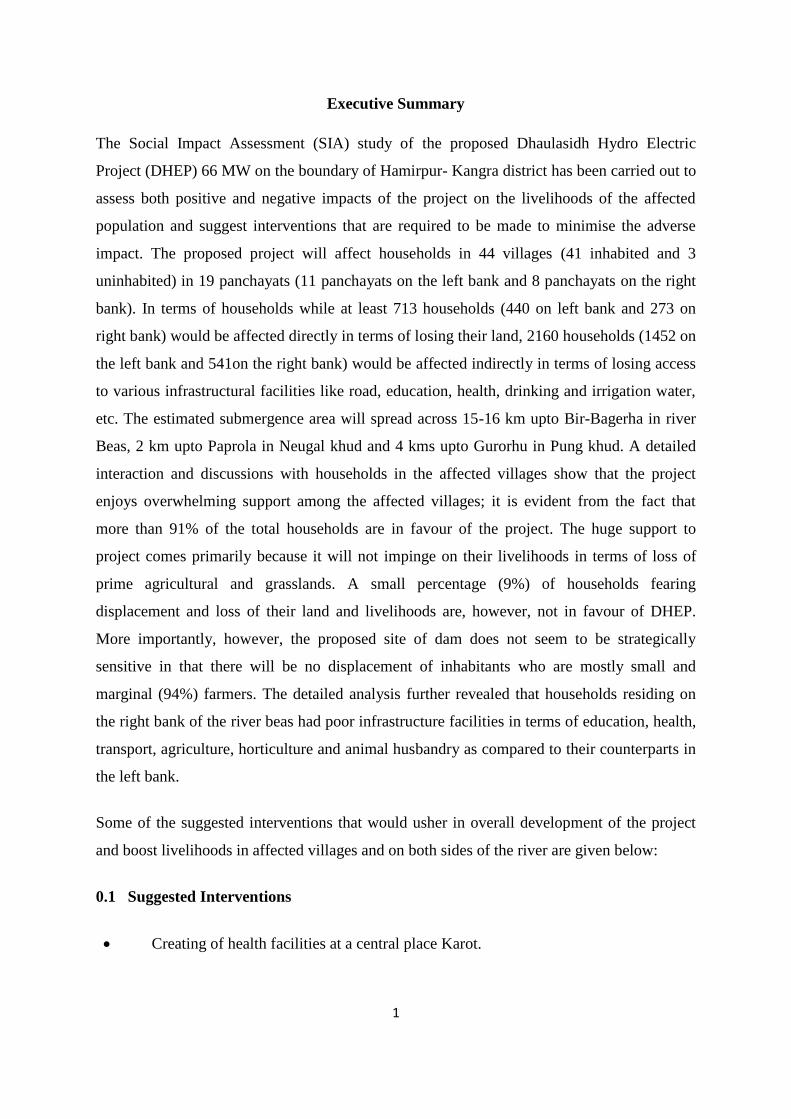
Executive Summary
The Social Impact Assessment (SIA) study of the proposed Dhaulasidh Hydro Electric
Project (DHEP) 66 MW on the boundary of Hamirpur- Kangra district has been carried out to
assess both positive and negative impacts of the project on the livelihoods of the affected
population and suggest interventions that are required to be made to minimise the adverse
impact. The proposed project will affect households in 44 villages (41 inhabited and 3
uninhabited) in 19 panchayats (11 panchayats on the left bank and 8 panchayats on the right
bank). In terms of households while at least 713 households (440 on left bank and 273 on
right bank) would be affected directly in terms of losing their land, 2160 households (1452 on
the left bank and 541on the right bank) would be affected indirectly in terms of losing access
to various infrastructural facilities like road, education, health, drinking and irrigation water,
etc. The estimated submergence area will spread across 15-16 km upto Bir-Bagerha in river
Beas, 2 km upto Paprola in Neugal khud and 4 kms upto Gurorhu in Pung khud. A detailed
interaction and discussions with households in the affected villages show that the project
enjoys overwhelming support among the affected villages; it is evident from the fact that
more than 91% of the total households are in favour of the project. The huge support to
project comes primarily because it will not impinge on their livelihoods in terms of loss of
prime agricultural and grasslands. A small percentage (9%) of households fearing
displacement and loss of their land and livelihoods are, however, not in favour of DHEP.
More importantly, however, the proposed site of dam does not seem to be strategically
sensitive in that there will be no displacement of inhabitants who are mostly small and
marginal (94%) farmers. The detailed analysis further revealed that households residing on
the right bank of the river beas had poor infrastructure facilities in terms of education, health,
transport, agriculture, horticulture and animal husbandry as compared to their counterparts in
the left bank.
Some of the suggested interventions that would usher in overall development of the project
and boost livelihoods in affected villages and on both sides of the river are given below:
0.1 Suggested Interventions
Creating of health facilities at a central place Karot.

2
Better education particularly of technical / vocational training in the processing of
vegetable and of cottage industry like making leaf plates, mat and broom.
Among infrastructure facilities, construction of bridge between Laungni and Bulli in
place of existing ferrying site and the provision of diesel/ power engine boats till
construction of bridge which further may be used in fishing activity would be given
priority.
Conversion of rope bridge to pucca motor able bridge between Chauki and Bhaleth.
Alternative pucca route to Dhaulasidh Temple and also to promote eco-tourism
/religious tourism in its vicinity.
Rehabilitation of irrigation and drinking water supply schemes on priority.
Provision of fodder bank depots at four points one at Karot, one at Miharpur one at
Bir Bagerha and one at Sihorwala.
Strengthening of horticulture development activities to cope with the problem of
diseases / insect pest, etc and to bring more area under fruits particularly of mango.
Strengthening of animal husbandry /veterinary facilities.
Immediate payments for the acquisition of land.
Development of fishing through the introduction of cat fishes in the dam area
especially the rohu, catla and singhara fishes and issuing license for capturing fish
under co-operative umbrella.
Improvement of grass lands infected with obnoxious weeds.
Development of micro enterprises like mushroom, beekeeping both stationary and
migratory and sericulture by providing adequate financial help besides technical
training.
In net terms, the results of the social impact study, based on comprehensive and detailed
discussions/interviews with all categories of stakeholders in the project affected villages,
clearly show that the proposed project enjoys an overwhelming support among all concerned.
This is primarily due to the fact that unlike other projects of such type, the DHEP would not
have significant adverse affect on the livelihoods of the affected people in terms of loss of
their productive/agricultural land and residential houses. Further, though the project would
have some negative economic and environmental/ecological effects like loss of grazing land
and access to infrastructural facilities, these adverse effects can be mitigated through making
right kind of interventions as suggested above.
3
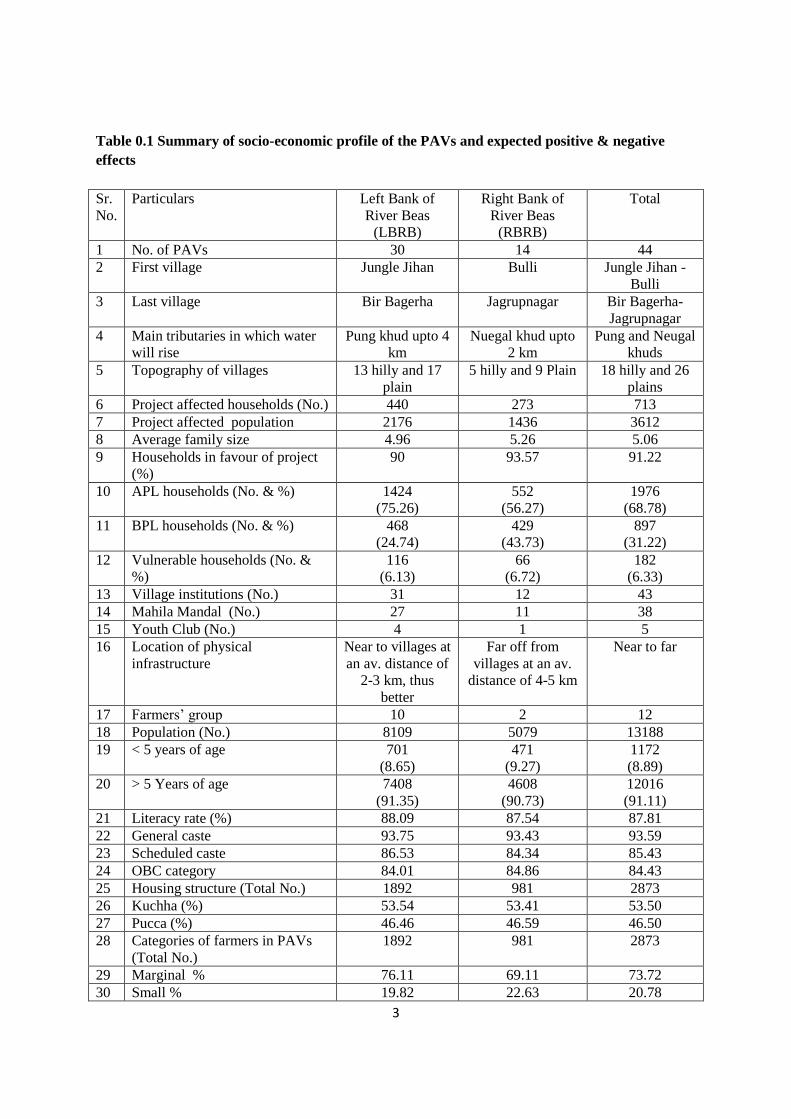
Table 0.1 Summary of socio-economic profile of the PAVs and expected positive & negative
effects
Sr.
No.
Particulars Left Bank of
River Beas
(LBRB)
Right Bank of
River Beas
(RBRB)
Total
1 No. of PAVs 30 14 44
2 First village Jungle Jihan Bulli Jungle Jihan -
Bulli
3 Last village Bir Bagerha Jagrupnagar Bir Bagerha-
Jagrupnagar
4 Main tributaries in which water
will rise
Pung khud upto 4
km
Nuegal khud upto
2 km
Pung and Neugal
khuds
5 Topography of villages 13 hilly and 17
plain
5 hilly and 9 Plain 18 hilly and 26
plains
6 Project affected households (No.) 440 273 713
7 Project affected population 2176 1436 3612
8 Average family size 4.96 5.26 5.06
9 Households in favour of project
(%)
90 93.57 91.22
10 APL households (No. & %) 1424
(75.26)
552
(56.27)
1976
(68.78)
11 BPL households (No. & %) 468
(24.74)
429
(43.73)
897
(31.22)
12 Vulnerable households (No. &
%)
116
(6.13)
66
(6.72)
182
(6.33)
13 Village institutions (No.) 31 12 43
14 Mahila Mandal (No.) 27 11 38
15 Youth Club (No.) 4 1 5
16 Location of physical
infrastructure
Near to villages at
an av. distance of
2-3 km, thus
better
Far off from
villages at an av.
distance of 4-5 km
Near to far
17 Farmers’ group 10 2 12
18 Population (No.) 8109 5079 13188
19 < 5 years of age 701
(8.65)
471
(9.27)
1172
(8.89)
20 > 5 Years of age 7408
(91.35)
4608
(90.73)
12016
(91.11)
21 Literacy rate (%) 88.09 87.54 87.81
22 General caste 93.75 93.43 93.59
23 Scheduled caste 86.53 84.34 85.43
24 OBC category 84.01 84.86 84.43
25 Housing structure (Total No.) 1892 981 2873
26 Kuchha (%) 53.54 53.41 53.50
27 Pucca (%) 46.46 46.59 46.50
28 Categories of farmers in PAVs
(Total No.)
1892 981 2873
29 Marginal % 76.11 69.11 73.72
30 Small % 19.82 22.63 20.78
4
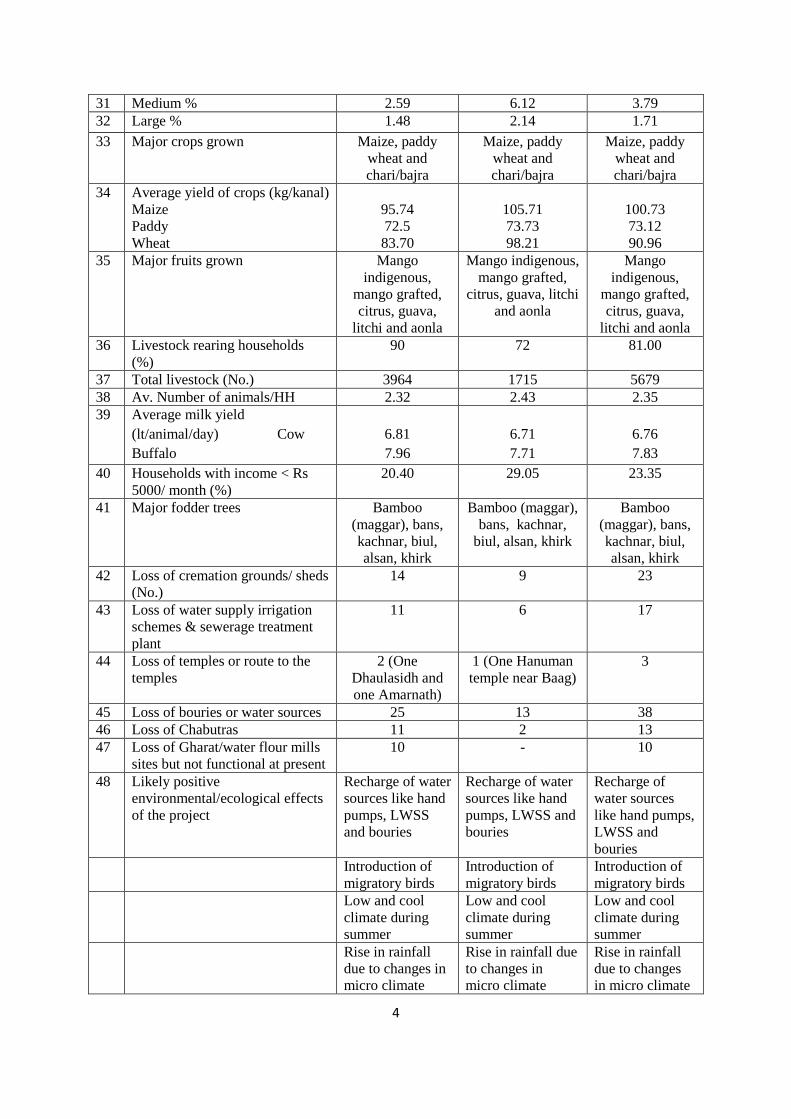
31 Medium % 2.59 6.12 3.79
32 Large % 1.48 2.14 1.71
33 Major crops grown Maize, paddy
wheat and
chari/bajra
Maize, paddy
wheat and
chari/bajra
Maize, paddy
wheat and
chari/bajra
34 Average yield of crops (kg/kanal)
Maize
Paddy
Wheat
95.74
72.5
83.70
105.71
73.73
98.21
100.73
73.12
90.96
35 Major fruits grown Mango
indigenous,
mango grafted,
citrus, guava,
litchi and aonla
Mango indigenous,
mango grafted,
citrus, guava, litchi
and aonla
Mango
indigenous,
mango grafted,
citrus, guava,
litchi and aonla
36 Livestock rearing households
(%)
90 72 81.00
37 Total livestock (No.) 3964 1715 5679
38 Av. Number of animals/HH 2.32 2.43 2.35
39 Average milk yield
(lt/animal/day) Cow
Buffalo
6.81
7.96
6.71
7.71
6.76
7.83
40 Households with income < Rs
5000/ month (%)
20.40 29.05 23.35
41 Major fodder trees Bamboo
(maggar), bans,
kachnar, biul,
alsan, khirk
Bamboo (maggar),
bans, kachnar,
biul, alsan, khirk
Bamboo
(maggar), bans,
kachnar, biul,
alsan, khirk
42 Loss of cremation grounds/ sheds
(No.)
14 9 23
43 Loss of water supply irrigation
schemes & sewerage treatment
plant
11 6 17
44 Loss of temples or route to the
temples
2 (One
Dhaulasidh and
one Amarnath)
1 (One Hanuman
temple near Baag)
3
45 Loss of bouries or water sources 25 13 38
46 Loss of Chabutras 11 2 13
47 Loss of Gharat/water flour mills
sites but not functional at present
10 - 10
48 Likely positive
environmental/ecological effects
of the project
Recharge of water
sources like hand
pumps, LWSS
and bouries
Recharge of water
sources like hand
pumps, LWSS and
bouries
Recharge of
water sources
like hand pumps,
LWSS and
bouries
Introduction of
migratory birds
Introduction of
migratory birds
Introduction of
migratory birds
Low and cool
climate during
summer
Low and cool
climate during
summer
Low and cool
climate during
summer
Rise in rainfall
due to changes in
micro climate
Rise in rainfall due
to changes in
micro climate
Rise in rainfall
due to changes
in micro climate
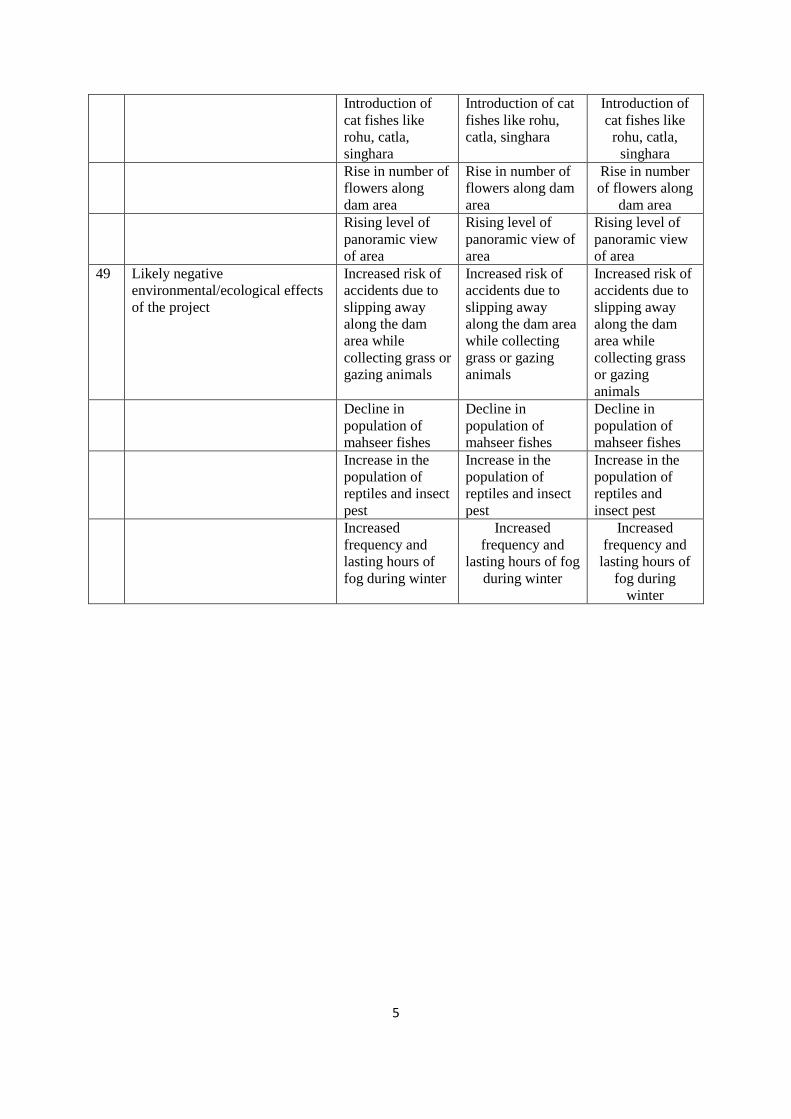
5
Introduction of
cat fishes like
rohu, catla,
singhara
Introduction of cat
fishes like rohu,
catla, singhara
Introduction of
cat fishes like
rohu, catla,
singhara
Rise in number of
flowers along
dam area
Rise in number of
flowers along dam
area
Rise in number
of flowers along
dam area
Rising level of
panoramic view
of area
Rising level of
panoramic view of
area
Rising level of
panoramic view
of area
49 Likely negative
environmental/ecological effects
of the project
Increased risk of
accidents due to
slipping away
along the dam
area while
collecting grass or
gazing animals
Increased risk of
accidents due to
slipping away
along the dam area
while collecting
grass or gazing
animals
Increased risk of
accidents due to
slipping away
along the dam
area while
collecting grass
or gazing
animals
Decline in
population of
mahseer fishes
Decline in
population of
mahseer fishes
Decline in
population of
mahseer fishes
Increase in the
population of
reptiles and insect
pest
Increase in the
population of
reptiles and insect
pest
Increase in the
population of
reptiles and
insect pest
Increased
frequency and
lasting hours of
fog during winter
Increased
frequency and
lasting hours of fog
during winter
Increased
frequency and
lasting hours of
fog during
winter
6
Chapter 1
INTRODUCTION
1.1 Dhaulasidh hydro electric project
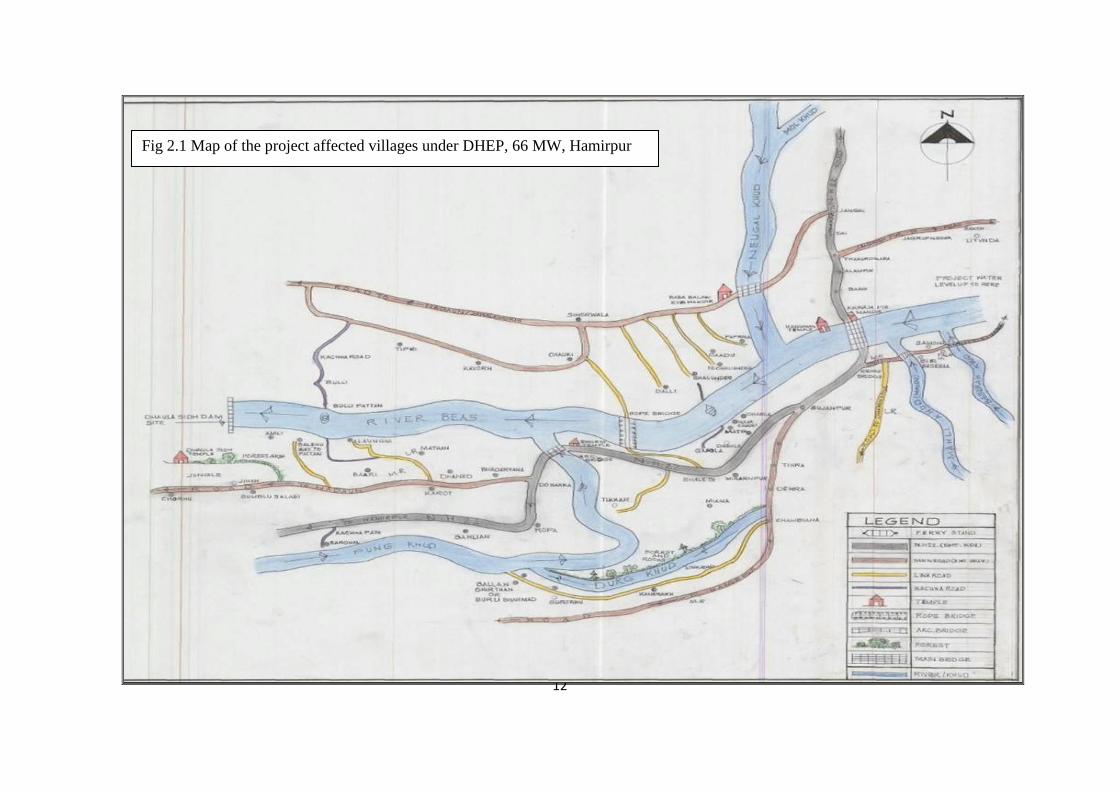
The 66 MW Dhaulasidh Hydro Electric Project (DHEP) is under construction by the Satluj
Jal Vidyut Nigam (SJVN), a public sector undertaking of the Govt. of India and Govt. of
Himachal Pradesh. The proposed project will be a run of the river project on the river Beas,
with a dam near famous temple Dhaulasidh and villages, namely, Jungle Jihan on the left
bank and Bulli on the right bank in district Hamirpur and Kangra, respectively. The back
water of the proposed dam may go to Bir Bagehra above Sujanpur Tihra which is nearly 15 -
16 km from the actual dam site. There will be two main khuds joining the dam area, Pung
khud near Bhaleth and Neugal khud near Sujanpur Tira. Both these khuds are perennial in
nature. The catchment of Neugal khud is more than Pung khud. The creation of dam will shift
the water in these two khuds and some villages situated along these khuds are likely to be
affected. The dam area will lie along the Hamirpur- Palampur & Nadaun-Sujanpur national
highways and partially along the Sujanpur Tira- Sandhol state highway (see Fig 1).
Tira Sujanpur founded by Raja Abhay Chand, the king of ruling Katoch dynasty of Kangra in
1748 AD, is famous for International Holi Mela. Similarly, Naduan, where Maharaja Sansar
Chand of Kangra used to held his court during summer, was the headquarter of Nadaun Jagir
in princely days. Hamirpur derived its present name from Katoch dynasty king named Hamir
Chand who ruled from 1700 AD to 1740 AD. The DHEP was first proposed to be constructed
during British period and then in 1960, before the execution of BSL project and the Pong
dam project.
1.2 Objectives of the study
The social impact assessment aims at identifying the likely social impacts of the proposed
project and possible measures for realigning the social development outcomes in the project.
The specific objectives of the SIA are:
7
To carry out socio- economic, cultural and political/institutional analysis and to identify
potential social impacts of the proposed development of the project.
To identify principal stakeholders and develop a consultation framework for participatory
implementation;
To assess likely social and economic impacts during the construction phase and after the
project completion;
To ascertain social development issues in the affected area vicinity and design social services
that may be provided by the project in order to improve the quality of life of affected people
and achieve the projects’ economic and social goals;
To ensure that results of SIA provide inputs in formulation of social strategy for participatory
implementation.
1.3 The Approach
The following approach is adopted for the study
To visit all affected villages to understand the social and economic issues
associated with the project
To conduct personal interviews, RRA and PRA with the households of the
affected villages to understand the perceptions of various stakeholders to local
issues; and
To develop a social management framework

8
Chapter 2
METHODOLOGY
2.1 The project affected villages
The baseline data related to the demography in the project area is considered vital in order to
understand the social issues associated with the project. The base line data were collected
from both primary and secondary sources. A complete list of project affected villages (PAVs)
was acquired from the SJVN Limited, Hamirpur. The geographical features of project
affected villages are given in Table 2.1a and 2.1b.
2.2 The questionnaire
A detailed schedule/questionnaire was prepared to conduct the SIA study which was mailed
to the funding agency during July, 2010. Since no feedback was received on the schedule, the
supplied schedule was canvassed among the selected villages (please see Appendix 1 for the
detailed schedule). The data have been collected following both personal interview and PRA
approaches. The interviewees include knowledgeable persons, most of whom were members
of PRI, Mahila Mandals. The data collection work commenced from the second week of
October inasmuch as the field staff was employed in the first week of October, 2010. The
data collection work was disrupted in the months of December-January, 2010-11 because of
PRI elections. The data were collected on the following main aspects;
General description of the project affected villages
Identification and description of stakeholder groups
Issues and interventions suggested by the stakeholders
Livestock population profile of the project affected villages
Description of households based on land holdings and type of buildings
Age and education profile of the population

9
Income levels of households in the affected villages
Physical infrastructure facilities and availability of services
Dependence of households on the minor forest produce and community lands and
their contribution towards livelihoods of the local people.
Likely social and economic impact impacts of project on the individual households
Expectations of villagers from project administration about provision of social
services
Discussants’ views about hydropower and general remarks
2.3 Methods of data collection
Data were collected both by personal interview and PRA approaches (see photos on next
page). The members of village level institutions’ like member of PRIs, mahila mandals,
yuvak mandals, etc were involved in the discussions. In some of the villages, well informed
serving and retired persons were also interviewed. The data were collected by visiting the
PAVs a number of times beginning from October 14th
2010. The preliminary work, however,
stated on 29th
July, 2010 (see cover photo). The data have been analysed using simple
statistical tools like averages and percentages.
2.4 Limitations of the study
The study is based on participatory rural appraisals (PRAs) conducted with different
groups of stakeholders and observations gathered from PRI officials, affected farmer
households, the mahila mandal members; etc in 41 villages (in 3 villages namely Amli,
Haar and Kanerah on the left bank there was no inhabitation) of the project affected area.
All the project affected villages were visited and included in the study despite severe time
constraint. As is usual, since no farm records were maintained by the affected farmer
households, the data collected by PRAs and survey method were based on their memory
and past experience. The people during data collection exaggerated the expected loss
figures and underestimated the benefits since it was really difficult for them to provide
exact quantitative estimates. To begin with, the team members helped the local people to
involve them fully in the discussions. Though due care was taken to extract accurate

10
information, the possibility of few memory slips of the respondents could not be ruled out.
The study is applicable only to the Dhaulasidh project affected area.
2.5 Summing up
The study is based on the data collected from all the project affected 44 villages so as to
prepare resettlement and rehabilitation(R&R) plans based on complete information/data. The
data were collected following PRAs and individual interview methods. The data have been
analysed using simple statistical tools like percentages and averages.
Table 2.1a Geographical features of project affected villages located on LBRB
Sr.
No.
Village Panchayat Height (mt
above msl)
Latitude (N) Longitude (E) Topogra
phy
Historical
importance
1 Jungle
Jihan
Chorhu 670.2 31°46’45.1” 076°26’27.9” Hilly Famous for dairy
products
2 Bumblu Chorhu 591 31°47’4.2” 076°27’01.8” Hilly -
3 Amli Chorhu 561 31°47’26.9” 076°27’20.7” Hilly Amarnath temple
4 Balehu Karot 542.1 31°47’47.2” 076°27’36.8” Plain Ancestors came
from Kutlehar
5 Baari Karot 608.2 31°48’01.3” 076”28’07.7” Plain -
6 Mathan Karot 515.4 31°48’28.2” 076°27’55.4” Plain -
7 Laungni Karot 518 31°48’19.9” 076°27’53.3” Plain Water supply
scheme
8 Dhaned Karot 550.5 31°48’03.4” 076°28’24.5” Hilly -
9 Bhadryana Darhla 528.3 31°48’22.5” 076°28’36.7” Plain Old natural water
spring (chhrurhu)
10 Gahliyan Darhla 534 31°46’24.6” 076°28’25.9” Hilly Remains of fort
11 Ropa Darhla 536.4 31°48’24.6” 076°28’43.8” Hilly -
12 Sarohal Banal 638 31°48’03.9” 076°29’04.4” Hilly King Sansar
Chand nagri
13 Gurorhu Chambiana 518 31°48’35.2” 076°29’34.8” Hilly -
14 Kanerarh - - - - - -
15 Tikkar Dehra 561 31°48’25.4” 076°29’08.2” Hilly -
16 Miana Darhla 516 31°48’53.4” 076°28’43.8” Plain Remains of old
fort and named
after one caste
Katoch (mian)
17 Miharhpur Darhla 522 31°48’15.1” 076°28’44.8” Hilly Old Hanuman
temple
18 Chauki Darhla 521.4 31°49’01.0” 076°28’37” Plain -
19 Darhla Darhla 534 31°49’16.2” 076°28’36.3” Plain -
20 Kharsaal Darhla 536.4 31°49’28.7” 076°28’26.3” Plain -
21 Gaagla Darhla 538.8 31°49’30.8” 076°28’26.8 ” Plain -
22 Haar Darhla - - - - -
23 Matyal Darhla 555 31°49’25.7” 076°28’34.4” Plain -
24 Balla
Girthan*
Chambiana 573.5 31°48’21.9” 076°29’30.4” Hilly -
25 Sujanpur Sujanpur 550.5 31°50’01.4” 076°30’15.4” Plain International holi
fair and big
ground
11
26 Tihra Tihra 700.2 31°49’43.9 ” 076°30’46.9” Hilly Capital of Sansar
Chand
27 Riyah Dhamiana 522 31°50’23.9” 076°30’40.8” Hilly Two old forts of
Sansar Chand
28 Palahi Jol 550.2 31°51’10.4” 076°32’05.5” Plain
29 Samona Jol 550.2 31°51’10.4” 076°32’05.5” Plain Old Shiv temple
30 Bir Bagerha Bir Bagerha 562.0 31°51’27.4” 076°32’07.7” Plain -
Note: Amli, Kanerarh and Haar are revenue villages but not inhabited villages
* Now named as Burli Bharmad.
Source: Field survey, 2010
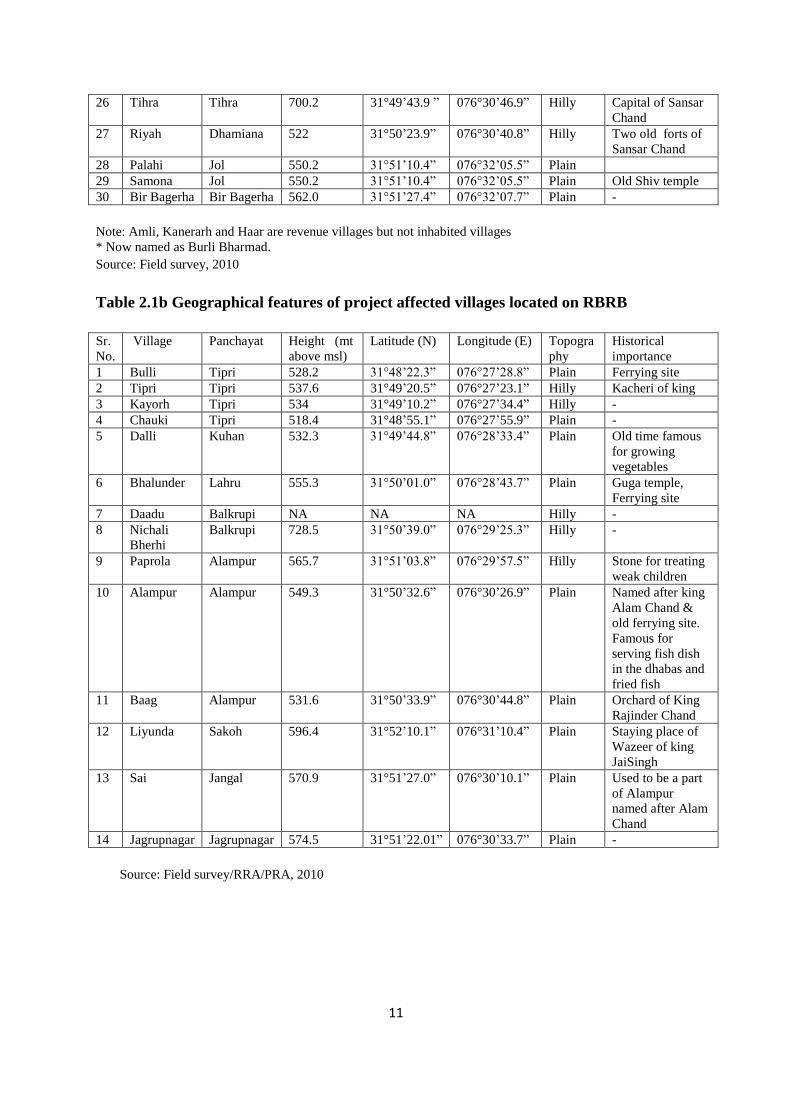
Table 2.1b Geographical features of project affected villages located on RBRB
Sr.
No.
Village Panchayat Height (mt
above msl)
Latitude (N) Longitude (E) Topogra
phy
Historical
importance
1 Bulli Tipri 528.2 31°48’22.3” 076°27’28.8” Plain Ferrying site
2 Tipri Tipri 537.6 31°49’20.5” 076°27’23.1” Hilly Kacheri of king
3 Kayorh Tipri 534 31°49’10.2” 076°27’34.4” Hilly -
4 Chauki Tipri 518.4 31°48’55.1” 076°27’55.9” Plain -
5 Dalli Kuhan 532.3 31°49’44.8” 076°28’33.4” Plain Old time famous
for growing
vegetables
6 Bhalunder Lahru 555.3 31°50’01.0” 076°28’43.7” Plain Guga temple,
Ferrying site
7 Daadu Balkrupi NA NA NA Hilly -
8 Nichali
Bherhi
Balkrupi 728.5 31°50’39.0” 076°29’25.3” Hilly -
9 Paprola Alampur 565.7 31°51’03.8” 076°29’57.5” Hilly Stone for treating
weak children
10 Alampur Alampur 549.3 31°50’32.6” 076°30’26.9” Plain Named after king
Alam Chand &
old ferrying site.
Famous for
serving fish dish
in the dhabas and
fried fish
11 Baag Alampur 531.6 31°50’33.9” 076°30’44.8” Plain Orchard of King
Rajinder Chand
12 Liyunda Sakoh 596.4 31°52’10.1” 076°31’10.4” Plain Staying place of
Wazeer of king
JaiSingh
13 Sai Jangal 570.9 31°51’27.0” 076°30’10.1” Plain Used to be a part
of Alampur
named after Alam
Chand
14 Jagrupnagar Jagrupnagar 574.5 31°51’22.01” 076°30’33.7” Plain -
Source: Field survey/RRA/PRA, 2010
12
Fig 2.1 Map of the project affected villages under DHEP, 66 MW, Hamirpur

13
Chapter 3
RESULTS
The present section discusses the socio-economic profile of the villages likely to be affected
by the construction and execution of the project. The results have been discussed to conform
to the requirements of the SJVN Limited executing the Dhaulasidh hydroelectric project.
Section I
3.1 DEMOGRAPHY AND SOCIO ECONOMIC PROFILE
This section presents data on number of households belonging to various socio-economic
groups such as APL & BPL families, classification of households according to size of
landholdings, population, age, literacy status, livestock inventory, household incomes, and so
on. The data on these important aspects would provide crucial inputs for the preparation of
rehabilitation and resettlement plans in the project affected villages (PAVs).
3.1.1 General description of project affected villages
As per list obtained from SJVN Limited, Hamirpur the proposed DHEP may affect 44
villages, out of these while fourteen (14) are located on the Right Bank of River Beas
(RBRB), thirty (30) villages are located on the Left Bank of river Beas(LBRB). The dam site
is proposed in the village Bulli on the right bank and village Jungle Jihan on the left bank of
river Beas. Bir Bagerha on the left side and Jagrupnagar on the right bank of river Beas will
be the last village up to where the water of dam is expected to rise (See Fig. 1). Neugal khud
and Pung khud are the main tributaries of river Beas joining the proposed dam area. Neugal
khud joins Beas at Alampur - Sujanpur and Pung khud joins it near Bhaleth where famous
Hanuman temple is situated. In both these khuds, the dam water will rise and, therefore, few
villages situated on both sides of these khuds will also be affected (see Fig 1). The water in
Neugal khud will rise upto a distance of nearly 2 km whereas in Pung khud it will rise upto 4
km because of its nearness to the down side of dam area. Inasmuch as the project affected
villages on both sides of the river basin area are located quite far off, the water of dam area
may not inundate the actual villages. Amli is the village which is situated very near to river
bank on the left side where 3 old house structures will be very close to submerged area. As

14
per evidences collected, out of three houses two were damaged and the remaining one was
partially used for keeping livestock (3 bullocks, 4 mules and 18 goats) during winter by a
household presently in other village. Though, Amli has a very good potential land but not
cultivated for the last many years has turned it barren fully infested with ageratum. The
nature of land to be affected along river Beas from the proposed DHEP site towards upstream
is shown in photos (see next pages). Some of the affected villages have historical importance
because Sujanpur Tihra was the capital of King Sansar Chand who ruled during the 18th
century. The remains of fort and other defense posts can be seen near Bhaleth and also in and
around Tihra. The dam water along the affected villages is expected to inundate an area
spread over 15-16 km behind the dam. In between this stretch two famous ferrying sites one
at Bulli known as Bulli Pattan and other at Bhalunder known as Bhalunder Pattan will also
be affected. These two ferrying sites used to be the main source of inter-district
communication besides being route of transport for three panchayats of district Kangra,
namely, Lahru, Tipri, and Kuhan.
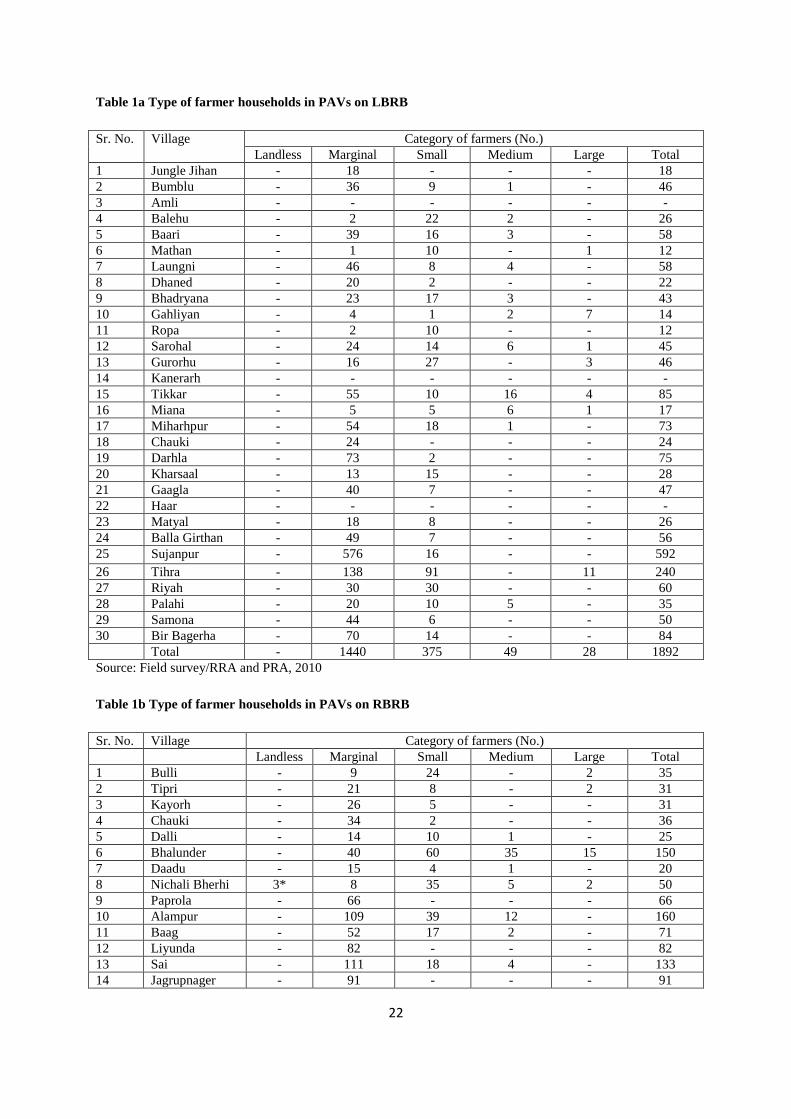
3.1.2 Farm holdings and their classification
Table 1a depicts the distribution of households into landless, marginal, small, medium and
large categories. The table shows that on the left bank side of the river, there were 1892 farm
holdings in all the project affected villages of which 76%, 20%, 3% and 1%% respectively
belonged to marginal, small, medium and large categories. Thus a majority of the households
belonged to marginal category followed by households of small, medium and large categories.
There was no incidence of landlessness in any of the project affected villages. The pattern of
distribution of households was broadly similar in all the project affected villages. On the
right hand side of river beas, there were 981 farm holdings, out of which 69% belonged to
marginal category followed by 23% small, 60.6% medium and 2% large category (Table 1b).
It may further be seen from the table that three households in Nichali Bherhi were landless
while in Paprola, Liyunda and Jagrupnagar all the households belonged to marginal category.
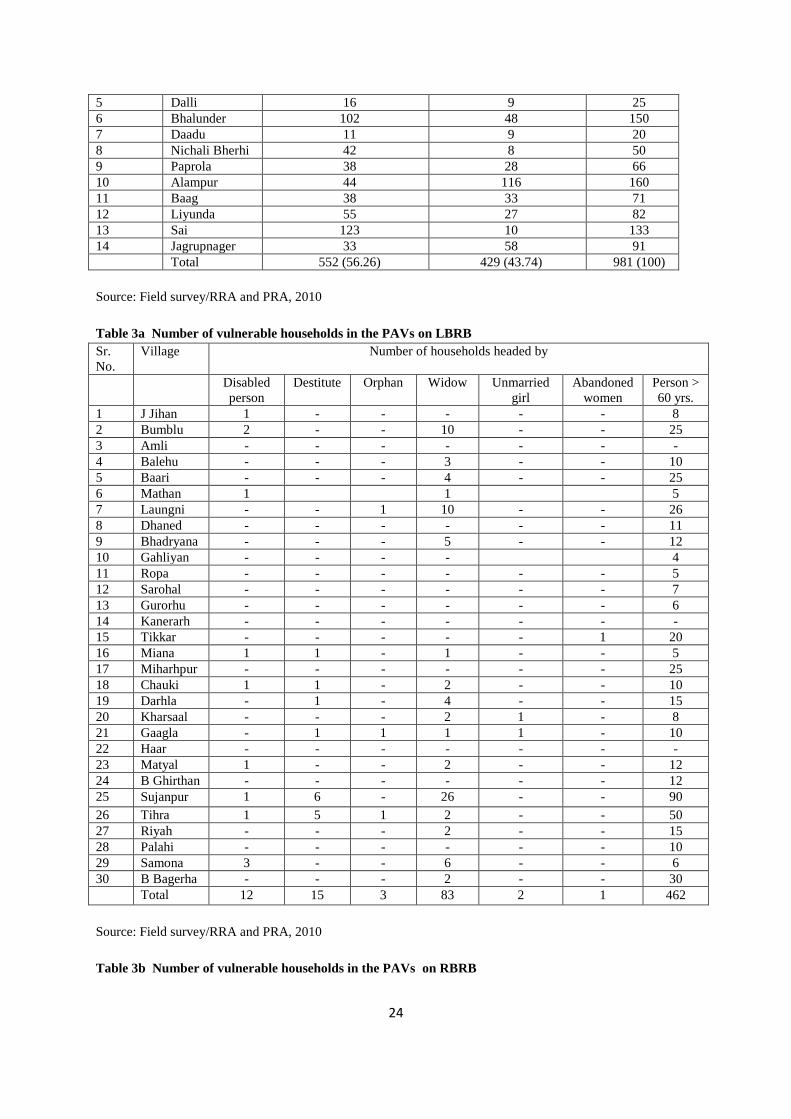
3.1.3 Households above and below poverty line
The availability of resources coupled with necessary infrastructure facilities, among other
things; determine the economic status of households. Table 2a and 2b depicts the number of
households above poverty line (APL) and below poverty line (BPL) on the right bank and left
15
bank of river, respectively. As may be seen from the tables, the proportion of households
below poverty line was higher in the RBRB than LBRB mainly due to poor infrastructure and
inadequate means of transport and communication. For example, even today the people
residing in Bulli, Tipri, Kayorh, Dalli, Bhalunder, and Daadu villages have to cross river
through ferrying during rainy season from July – September months. Not only that, this
facility also remains out of order compelling people to travel 15-20 km extra distance by road
to reach at Sujanpur-- the nearby main market for daily needs and also to avail better
educational institutions facility like sanik school, the degree college and ITI. In comparison,
all the project affected villages on the left bank have very good road connectivity, better
educational institutions and better market access.
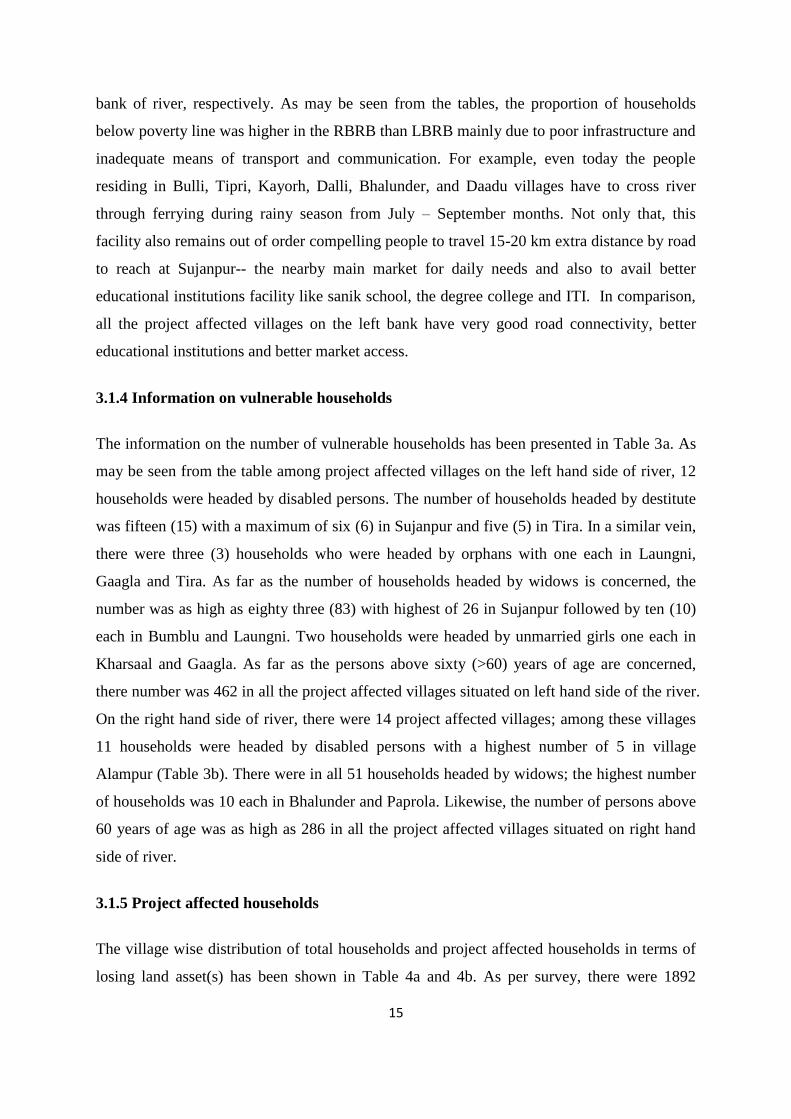
3.1.4 Information on vulnerable households
The information on the number of vulnerable households has been presented in Table 3a. As
may be seen from the table among project affected villages on the left hand side of river, 12
households were headed by disabled persons. The number of households headed by destitute
was fifteen (15) with a maximum of six (6) in Sujanpur and five (5) in Tira. In a similar vein,
there were three (3) households who were headed by orphans with one each in Laungni,
Gaagla and Tira. As far as the number of households headed by widows is concerned, the
number was as high as eighty three (83) with highest of 26 in Sujanpur followed by ten (10)
each in Bumblu and Laungni. Two households were headed by unmarried girls one each in
Kharsaal and Gaagla. As far as the persons above sixty (>60) years of age are concerned,
there number was 462 in all the project affected villages situated on left hand side of the river.
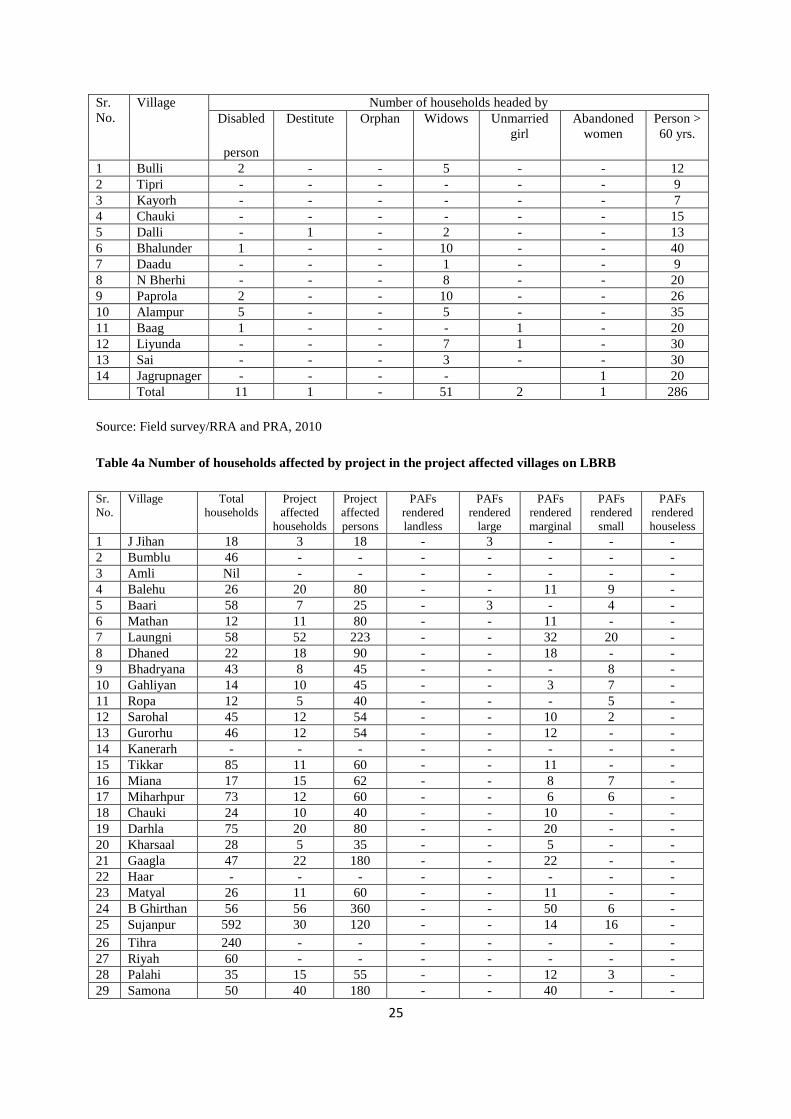
On the right hand side of river, there were 14 project affected villages; among these villages
11 households were headed by disabled persons with a highest number of 5 in village
Alampur (Table 3b). There were in all 51 households headed by widows; the highest number
of households was 10 each in Bhalunder and Paprola. Likewise, the number of persons above
60 years of age was as high as 286 in all the project affected villages situated on right hand
side of river.
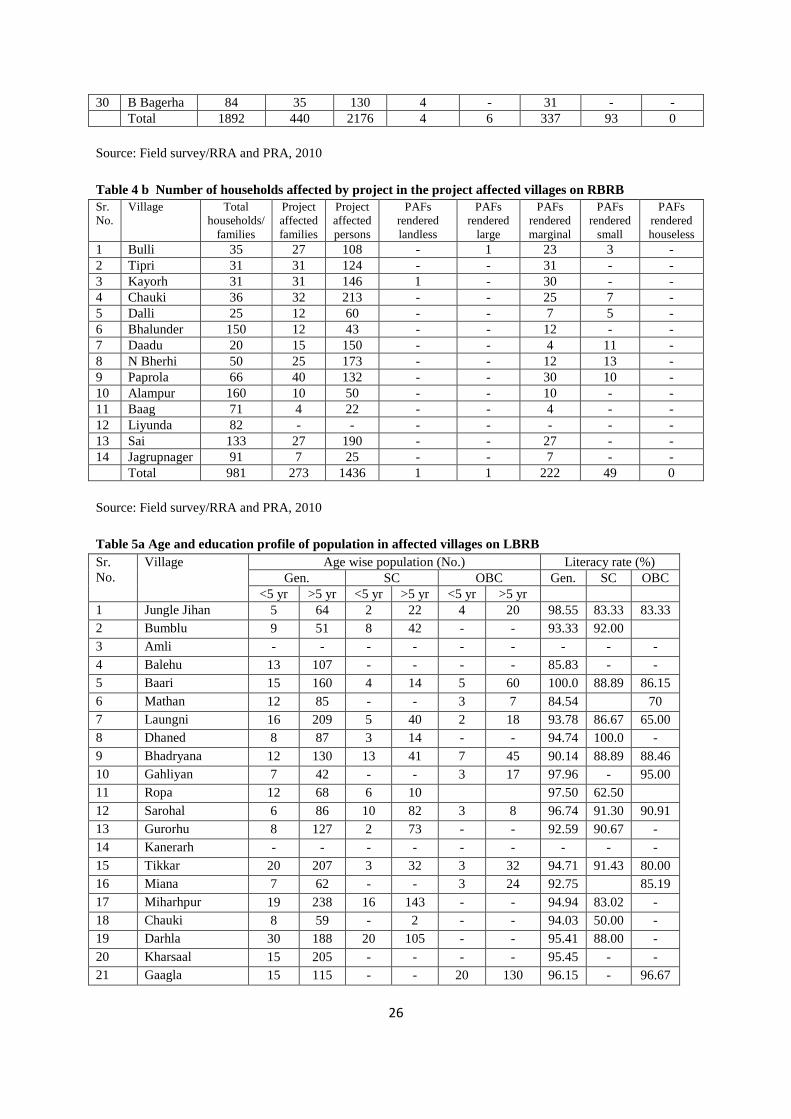
3.1.5 Project affected households
The village wise distribution of total households and project affected households in terms of
losing land asset(s) has been shown in Table 4a and 4b. As per survey, there were 1892
16
households on the left bank of river Beas, out of which 440 were expected to be the affected
i.e. losing land of either classification. The total population of these households was
estimated to be 2176 with an average family size of 4.94 persons. On the right bank of river,
there were 981 households of which 273 were expected to be affected with a total population
of 1436 and an average family size of 5.26 persons. The table further shows that five
households in Kayorh on the right bank and Bir Bagerha on left bank will be rendered
landless due to project related activities. More importantly, however, no households will lose
his residential house.
3.1.6 Age and education wise distribution
The table 5a further shows that while among general category households in the affected
villages, the percentage of population below 5 year was about 9%, among scheduled castes
and other backward castes, the proportion of population below 5 years was about 8%.
Similarly, on the right hand side of river, the proportion of general category population
falling in the age group of below 5 years was 9% whereas about 10% of the population in
scheduled caste and OBC category was below 5 years of age.
The table further reveals that among villages situated on the left side of the river, the literacy
rate among households of general category was above 93% in majority of villages while
among SC and OBC it was nearly 84%. The overall literacy rate was 93.73, 83.53 and 84.01
% among households of general category, scheduled caste and OBC, respectively (Table 5a).
Similar pattern was observed among the villages in the right bank (Table 5b). More
importantly, however, in two villages, namely, Bulli and Kayorh, the literacy level was
hundred per cent despite non-availability of good educational facilities within their reach.
Also in some of the project affected villages like Baari and Dhaned situated on the left bank,
the literacy rate was cent per cent among households of scheduled caste and general
categories.
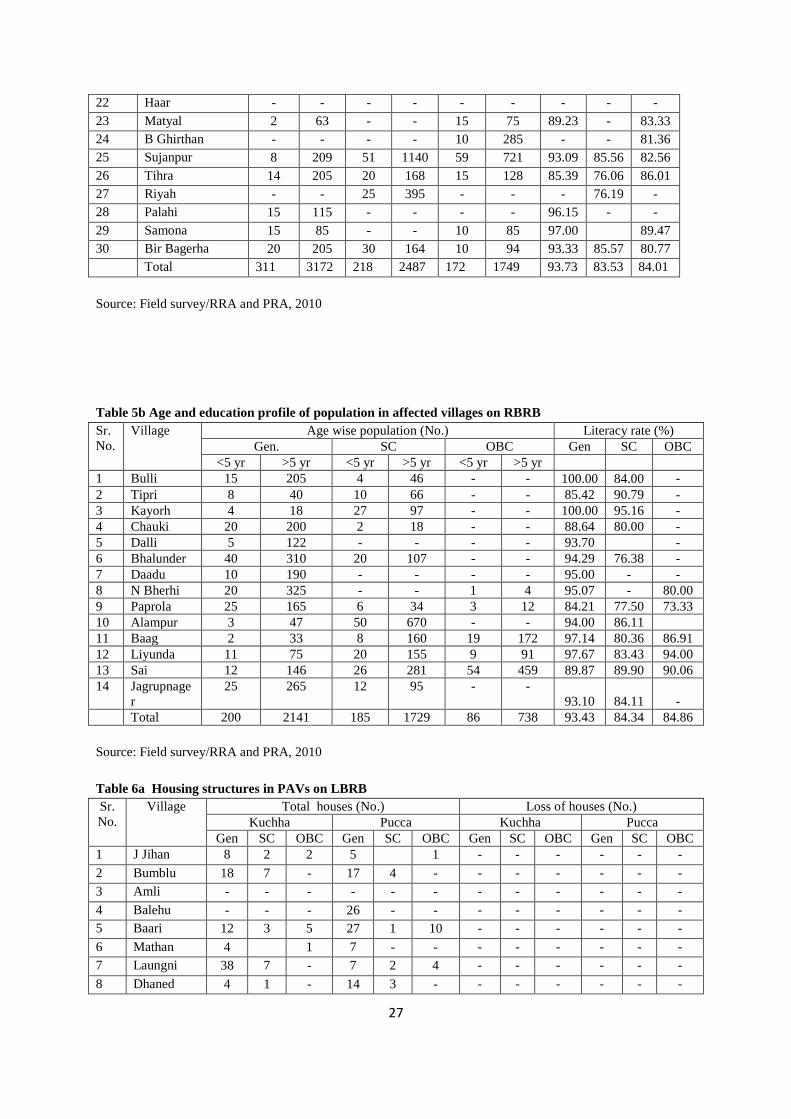
3.1.7 Housing structure
The ratio of kuchha and pucca houses in the project affected villages was 43:57 among
households of all categories (Table 6a and Table 6b). The number of households losing
houses/cattle shed was very low; one cattle shed in Samoan, three Garrets in Mina (but not
17
existed presently) and four in Ropa (not functional). Similarly, three old house structures may
submerge in the water in Amli village.
On the left bank of river, there were 1892 households out of which 53.54% had kasha
dwellings and 46.46% had in pucca dwellings (Table 6a). The proportion of kuchha houses
was the highest (35.14 %) among OBC category followed by in scheduled caste (33.47 %)
and in general category (31.39%). The proportion of households living in pucca houses was
47.78% among general category followed by 26.62% among scheduled castes and 25.60%
among OBC category. On the right bank of river, there were 981 households, out of which
53.41% households had kuchha and 46.59% pucca houses (Table 6 b). As far as caste
category wise position is concerned; the table shows that of the total pucca houses, general
category households owned 52.30 % followed by 33.04% scheduled caste households and
14.66% OBC category households. Nearly one-half of the kuchha houses were possessed by
households of scheduled caste category followed by 41% households of general category and
14% of OBC category. To conclude, on both sides of river, the proportion of kuchha to pucca
houses was 43% to 57%. Nearly one-half of the pucca houses were possessed by general
category households followed by 27 to 33% by households of scheduled caste categories and
15 to 26% by those of OBC category.
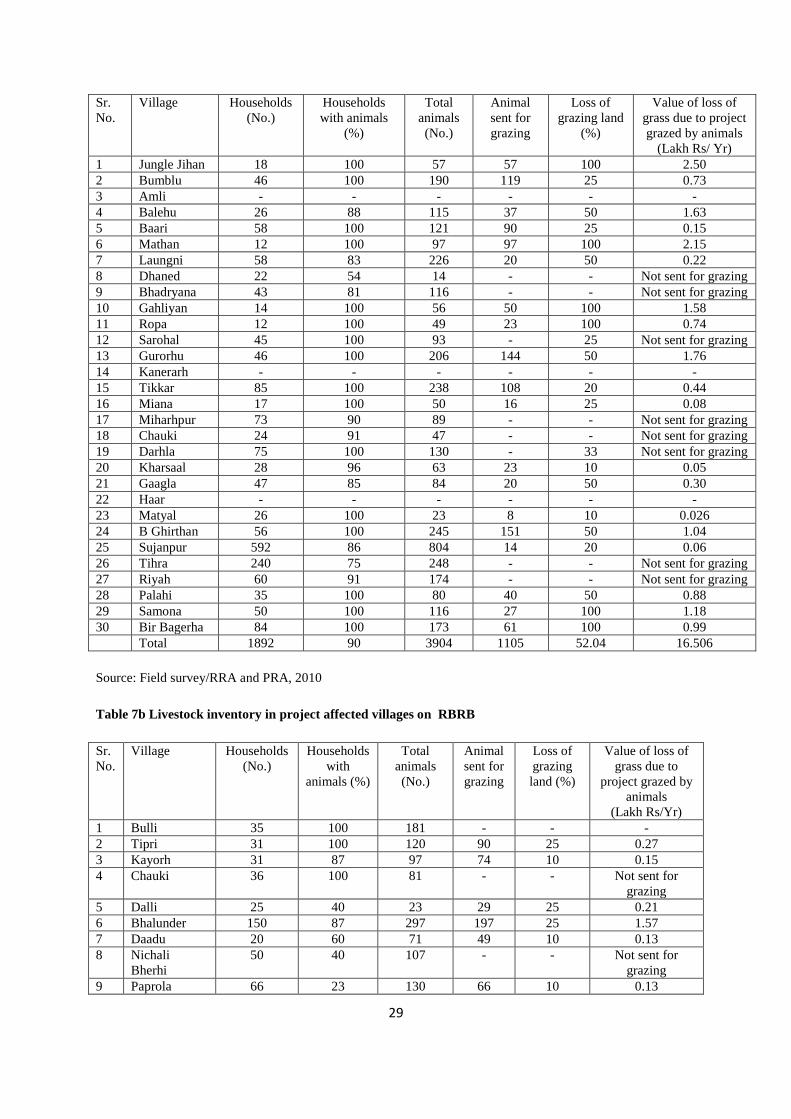
3.1.8 Livestock inventory
Land and livestock are the two most important assets and sources of livelihood in any rural
agro pastoral based economy. Land is not only the main source of livelihood but has social
and cultural values as well. Livestock another important asset of rural households provides a
regular source of income and employment. In the project affected villages, buffalo was the
main milch animal followed by cross-bred cow. The practice of rearing bullocks for
ploughing is becoming unpopular thanks to increasing mechanization of farming. As a result,
the bullocks were maintained by very few households. In villages with uneven topography
and small size and fragmented cultivated fields, the role of bullocks was more important in
comparison to villages with flat topography. Among ruminants, goats were in greater number
than sheep, though in some villages like Laungni poor SC households reared both goats &
sheep.

18
Tables 7a and 7b depict the status of livestock inventory. These tables reveal that out of 1892
households on the left bank of river, 90% possessed livestock comprising mostly of buffaloes,
cattle, sheep and goats. In the project affected villages on left bank, there were as many as
3964 animals of different type. Across villages, the proportion of households rearing
livestock varied from 54% in Dhaned to 100% in villages like Jungle Jihan, Bumblu, Barri,
Mathan, Gahliyan, Samona and Bir Bagerha. The average number of livestock reared by a
household was 2.10. The table further shows that grazing land ranging from 5% to 100%
would be lost due to project activities, whose economic value to all affected households at
the current prevailing market prices was assessed to be Rs.16.74 lakh per annum on the left
hand side .This loss will be the highest (Rs.2.15 lakh per annum) in Mathan village. As far as
right bank of river is concerned, there were in all 981 household, out of which 72 %
possessed livestock with an average of 1.75 animals which is slightly lower than the left bank.
In villages located on this side of the river, 10 % to 100% of the grazing land was expected to
be lost by the project work which in monetary terms amounts to Rs.3.99 lakh per annum.
On the whole, it can be concluded that 72 % to 90 % of the households in the project
affected villages reared livestock whose number per household varied from 1.75 to 2.10 .The
value of the grass grazed by animals was assessed at around Rs. 20 lakh on both sides of river.
However, this amount did not include the benefits enjoyed by the households in terms of fuel
wood and fodder from the trees in the same affected area. Many villages like Balehu,
Laungni and Bulli had a serious problem of monkey menace. The problem of wild boars, neel
gai menace was also reported in these villages.
Mules in small number were also reared in Bulli which are used in transporting sand, bajri
and boulders from river Beas. On an average, 15 mules loaded with sand and bajri and 100-
150 cut stones/boulders were transported from the river site every day.
Tables 8a and 8b show the average yield of milk per milch animal. The average milk yield
varied from 6.71 liters/cow/day on the right hand side to 6.81 liters/cow/day on the left bank.
Similarly, the average yield of buffalo milk varied from 7.71 liters/day to 7.91 liters per day.
During survey it was found that farmers on both sides of river owned murrah breeds of
buffalo which are high milk yielders.
19
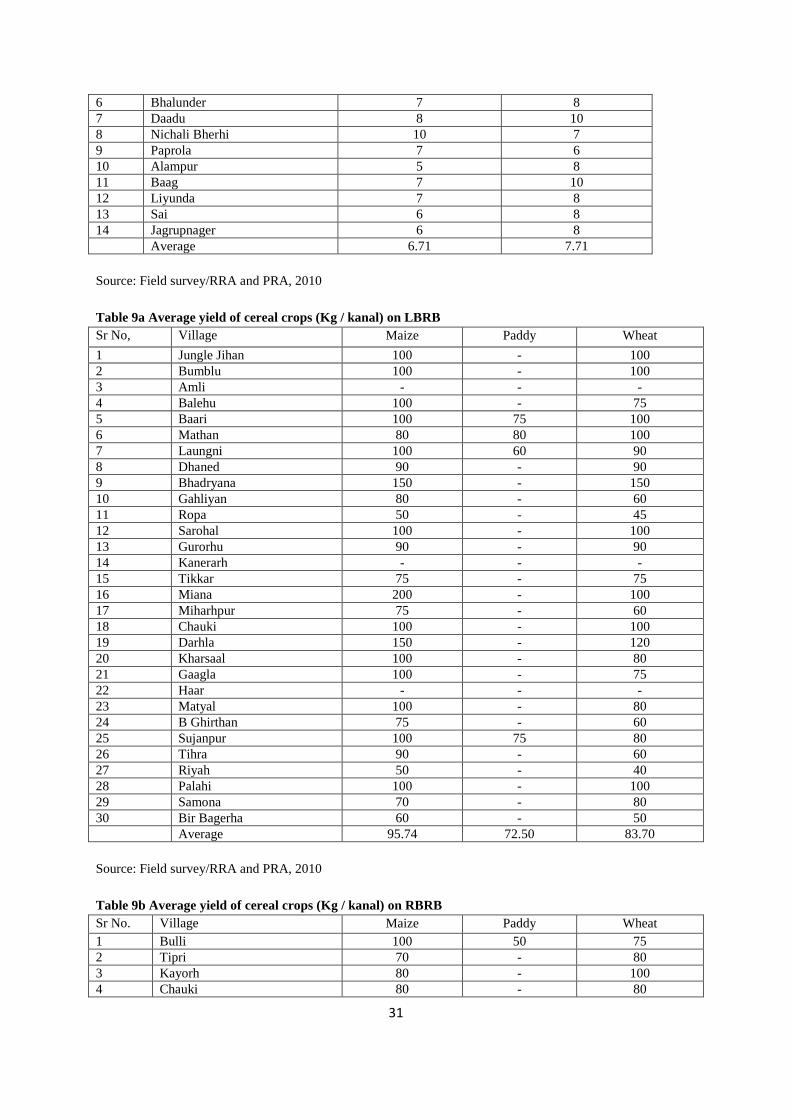
3.1.9 Average productivity of crops and fruits
As mentioned above, the economy of project affected villages is predominantly agro pastoral.
Wheat and maize are the two most important rabi and kharif crops. In villages like Laungni,
Bhalunder, Bhadryana, Ropa, Ghaliyan, Bir Bagerha and Balehu, which had irrigation
facilities a number of farmers also raised vegetables like cabbage, cauliflower, bhindi, brinjal
and radish. These farmers market their produce in Sujanpur Tihra. The fruit trees like mango,
guava and citrus were also found in almost all villages. The average yield of maize varied
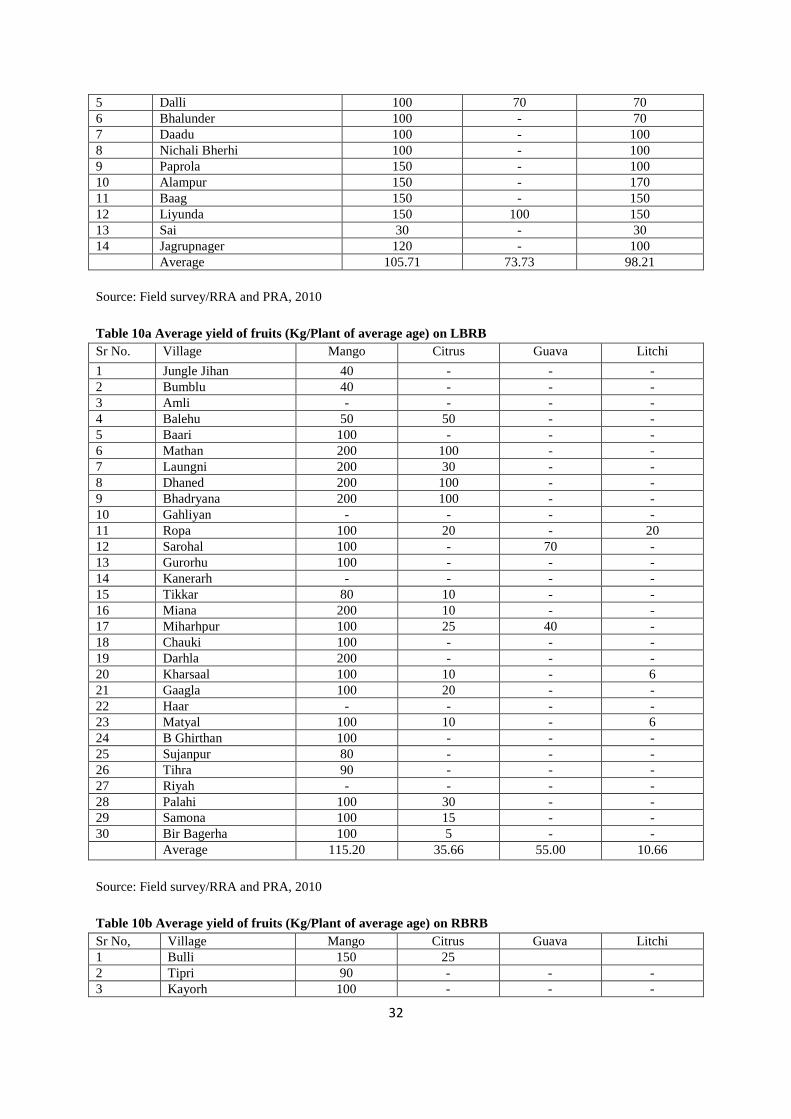
from 96 kg / kanal to 106 kg/kanal (Table 9a and 9b). Likewise, paddy yield was almost
equal at 73kg/kanal. As far as wheat is concerned, its average productivity ranged from 84
kg/ kanal to 98 kg / kanal. On the whole, the average yield of cereals was higher on right
bank of river beas as compared to yield levels on left bank. The average yield of mango and
citrus was 160 kg / plant and 33.57 kg / plant, respectively on right bank of river (Table 10b).
On the left side of river, in addition to mango and citrus, guava and litchi were the newly
introduced fruits. In some villages, Aonla (Amla) was also grown. The average yield of
mango, citrus, guava and litchi was 115 kg , 36 kg , 55 kg and 11 kg per plant of average age
on the left hand side of river (Table 10 a).
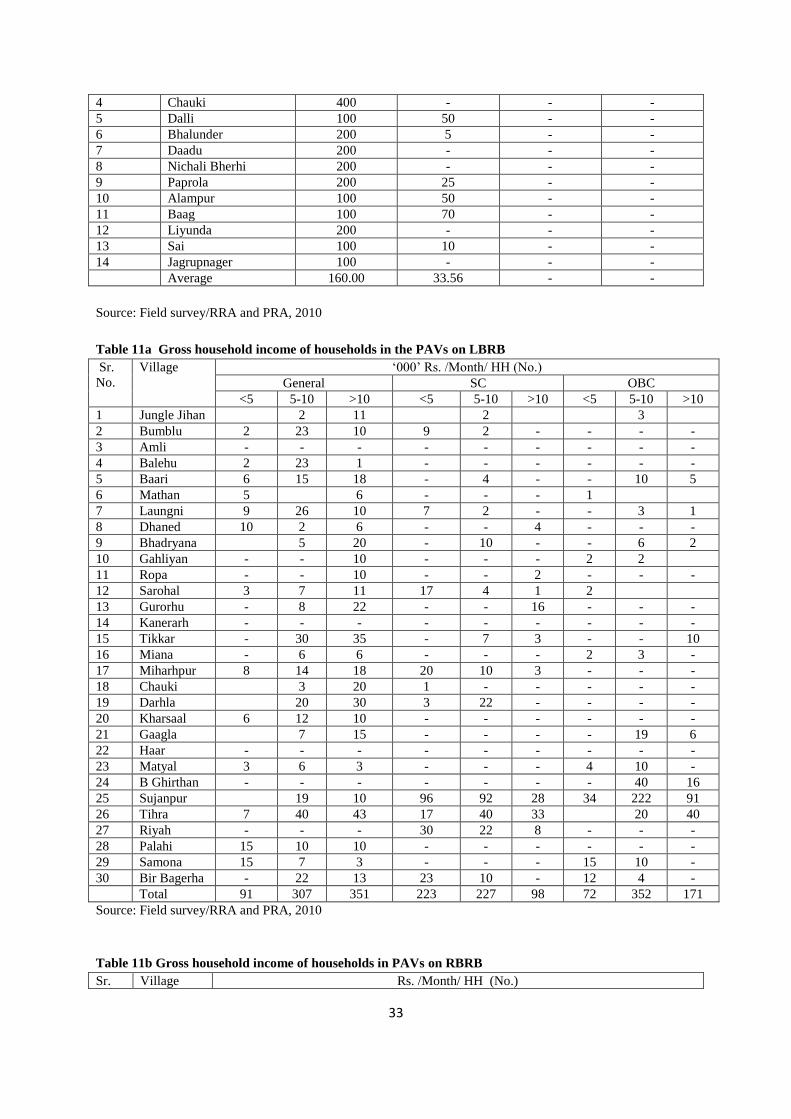
3.1.10 Household income
Gross household income of different categories of households in the project affected villages
is summarized in Tables 11a and11b. As may be seen from these tables, majority of the
households of general category had income above Rs. 10 thousand per household per month
in comparison to scheduled castes and OBCs where a maximum proportion of households
derived an average income between Rs 5-10 thousand per month. A significant proportion of
households in all castes had an average income below Rs 5 thousand per month.
3.1.11 Access to physical infrastructure/amenities
The availability of infrastructure facilities like transport and communication, educational
institutions, human and animal health institutions, drinking water and markets affect the level
of living of local people. All villages located on left side of river have a good infrastructure in
terms of transport facilities, health institutions, drinking water and educational institutions.
Jungle Jihan, Balehu, Laungni, Mathan, Bhadryana, Bumblu, Baari, Dhaned, Miharpur, Balla
20
Ghirthan, Sujanpur, Tihra, Palahi, Samona, Bir Bagerha located on the left side have good
road connectivity. However, some villages, namely, Sarohal, Ropa, Gurorhu, Riyah are yet to
be connected with a link road. (Table 12a and 12b). The motorable road facility was good in
left bank and poor in right bank. Among villages on the right bank of river, Bulli has been
recently provided with a link road, part of which is again going to be affected due to its
submergence in the dam water. Bulli is having only kuchha road and have to cross Bulli
Pattan to catch bus at Karot. The right bank people have to cross river to catch bus on the
other side; if they come via Balkrupi then it takes nearly two hours more and cost Rs. 25 – Rs.
30 per capita to reach at the same place. Most of the villages had anganwaries for infants. To
avail educational facilities (Senior Secondary, ITI, etc) the children of Bulli have to travel to
Karot. Again from health point of view, the infrastructure for left bank villages is adequate
and easily accessible. The people of both sides have to come to Sujanpur, Karot or Hamirpur
to avail banking (ATM) facilities. In comparison, the people residing on the right bank have
to travel long distances to avail these facilities. Not only this, the district headquarter, tehsil
headquarter and block headquarter are quite far off for people living on right side. On the
whole, the people of left bank are in an advantageous position as compared to their brethrens
on the right bank. Therefore, the people living on the right bank deserve preferential
treatment in the provision of infrastructure facilities in lieu of the land scarified by them.
A majority of population in all the project affected villages is of Hindus. After death the
bodies are cremated. The cremation grounds of all the villages are situated/ located on either
side of the bank of river. Many villages have constructed cremation sheds on the bank of
river though they are using open space for cremating dead bodies to have an easy access of
water. As many as 23 cremation grounds, 14 on left side and 9 on right side, will submerge
in the dam water. The facility of these cremation grounds/sheds is also availed of by many
others nearby villages which are not included in the list of project affected villages. In some
cases dead bodies from villages located at a distance of 5-6 km are brought for cremation.
3.1.12 Summing up
The construction of Dhaulasidh Hydro Electric Project (DHEP) 66 MW will affect at least 41
inhabited villages of 19 Panchayats located on both sides of the proposed dam in river Beas.
The topography of project affected villages is hilly to plain with good fertile land particularly
in Balehu, Bulli Laungni, Dalli, Bhalunder, Chauki, Paprola, Bir Bagerha and Palahi. The
21
mahila mandals (38), the youth clubs (5) and vegetable farmers’ groups (12) are the main
village level institutions functioning in the project affected villages. A very high percentage
(91%) of households is in favour of the project in that it will not affect their prime
agricultural land and residential houses. A preponderant majority (94.50%) of the households
among those affected by the project belong to small and marginal category. In a similar vein,
about 31% households were below poverty line (BPL) whose proportion was higher on the
right bank of river Beas. A small proportion of households (6.33%) was headed by vulnerable
persons; the proportion of such households was marginally higher on right bank of river.
According to panchayat register (not as per revenue records), a total population of 3613 and
713 households (440 on LBRB and 273 on RBRB) with an average family size of 5.06 will
be directly affected. The total population in all the project affected villages is estimated to be
13188 with average family size of 4.59 persons. Overall literacy rate was 88% with highest of
94% among households of general category followed by 85% in scheduled caste and 84%
among those in OBC category. Nearly 54% houses were kuchha and remaining 46% pucca.
All the households in PAVs collected building material from the river bed and nearby khuds
which in monetary terms amounted to Rs 5337 per household per annum.
More than four-fifths of the households reared livestock whose average number per
household was about 2 animals. On the whole, 71% of all households reared buffaloes; 78 per
cent on the left side and 56% on the right bank. Cows were maintained by 19 % of
households with larger percentage of 29% on right bank. Bullocks were maintained by 12%
of households each on both sides of river. Sheep and goats were maintained by 23% of
households with larger chunk of 29% on the left side particularly in Bumblu, Laungni, Tikkar
and Gurorhu villages. Among animals, buffaloes of murrah breed were more common milch
animals. In cattle, cross bred cows were more popular. The average yield of milk was more in
case of buffalo than cow. Wheat, maize and paddy were the important cereal crops grown in
the area. Among fruits, mango (Indigenous and improved varieties) was more common
followed by citrus, guava, papaya, indigenous banana and aonla. As many as 60-70
indigenous mango trees may submerge in the dam water particularly in Bhalunder, Gaagla,
Matyal and Baag villages. Good number of papaya and banana was found in many villages
like Balehu, Laungni, Bulli, Chauki, etc. And in terms of infrastructure facilities, the left bank
villages were in good position than those located on the right bank of river. Again, while on
the left bank the infrastructure facilities were located within a reach of 2-3 kms, those on the
right bank were available at a distance of 4-5 kms.
22
Table 1a Type of farmer households in PAVs on LBRB
Sr. No. Village Category of farmers (No.)
Landless Marginal Small Medium Large Total
1 Jungle Jihan - 18 - - - 18
2 Bumblu - 36 9 1 - 46
3 Amli - - - - - -
4 Balehu - 2 22 2 - 26
5 Baari - 39 16 3 - 58
6 Mathan - 1 10 - 1 12
7 Laungni - 46 8 4 - 58
8 Dhaned - 20 2 - - 22
9 Bhadryana - 23 17 3 - 43
10 Gahliyan - 4 1 2 7 14
11 Ropa - 2 10 - - 12
12 Sarohal - 24 14 6 1 45
13 Gurorhu - 16 27 - 3 46
14 Kanerarh - - - - - -
15 Tikkar - 55 10 16 4 85
16 Miana - 5 5 6 1 17
17 Miharhpur - 54 18 1 - 73
18 Chauki - 24 - - - 24
19 Darhla - 73 2 - - 75
20 Kharsaal - 13 15 - - 28
21 Gaagla - 40 7 - - 47
22 Haar - - - - - -
23 Matyal - 18 8 - - 26
24 Balla Girthan - 49 7 - - 56
25 Sujanpur - 576 16 - - 592
26 Tihra - 138 91 - 11 240
27 Riyah - 30 30 - - 60
28 Palahi - 20 10 5 - 35
29 Samona - 44 6 - - 50
30 Bir Bagerha - 70 14 - - 84
Total - 1440 375 49 28 1892
Source: Field survey/RRA and PRA, 2010
Table 1b Type of farmer households in PAVs on RBRB
Sr. No. Village Category of farmers (No.)
Landless Marginal Small Medium Large Total
1 Bulli - 9 24 - 2 35
2 Tipri - 21 8 - 2 31
3 Kayorh - 26 5 - - 31
4 Chauki - 34 2 - - 36
5 Dalli - 14 10 1 - 25
6 Bhalunder - 40 60 35 15 150
7 Daadu - 15 4 1 - 20
8 Nichali Bherhi 3* 8 35 5 2 50
9 Paprola - 66 - - - 66
10 Alampur - 109 39 12 - 160
11 Baag - 52 17 2 - 71
12 Liyunda - 82 - - - 82
13 Sai - 111 18 4 - 133
14 Jagrupnager - 91 - - - 91

23
Total 3* 678 222 60 21 981
Note: * Not included in the total
Source: Field survey/RRA and PRA, 2010
Table 2a Number of APL and BPL families on LBRB
Sr. No. Village Above Poverty Line (APL) Below Poverty Line (BPL) Total
1 Jungle Jihan 12 6 18
2 Bumblu 29 17 46
3 Amli - - -
4 Balehu 17 9 26
5 Baari 48 10 58
6 Mathan 8 4 12
7 Laungni 46 12 58
8 Dhaned 20 2 22
9 Bhadryana 27 16 43
10 Gahliyan 8 6 14
11 Ropa 10 2 12
12 Sarohal 29 16 45
13 Gurorhu 33 13 46
14 Kanerarh - - -
15 Tikkar 70 15 85
16 Miana 11 6 17
17 Miharhpur 65 8 73
18 Chauki 16 8 24
19 Darhla 60 15 75
20 Kharsaal 23 5 28
21 Gaagla 38 9 47
22 Haar - - -
23 Matyal 20 6 26
24 B Ghirthan 47 9 56
25 Sujanpur 404 188 592
26 Tihra 208 32 240
27 Riyah 40 20 60
28 Palahi 30 5 35
29 Samona 36 14 50
30 Bir Bagerha 69 15 84
Total 1424 (75.26) 468 (24.74) 1892 (100)
Source: Field survey/RRA and PRA, 2010
Table 2b Number of APL and BPL families on RBRB
Sr. No. Village Above Poverty Line (APL) Below Poverty Line
(BPL)
Total
1 Bulli 24 11 35
2 Tipri 1 30 31
3 Kayorh 4 27 31
4 Chauki 21 15 36
24
5 Dalli 16 9 25
6 Bhalunder 102 48 150
7 Daadu 11 9 20
8 Nichali Bherhi 42 8 50
9 Paprola 38 28 66
10 Alampur 44 116 160
11 Baag 38 33 71
12 Liyunda 55 27 82
13 Sai 123 10 133
14 Jagrupnager 33 58 91
Total 552 (56.26) 429 (43.74) 981 (100)
Source: Field survey/RRA and PRA, 2010
Table 3a Number of vulnerable households in the PAVs on LBRB
Sr.
No.
Village Number of households headed by
Disabled
person
Destitute Orphan Widow Unmarried
girl
Abandoned
women
Person >
60 yrs.
1 J Jihan 1 - - - - - 8
2 Bumblu 2 - - 10 - - 25
3 Amli - - - - - - -
4 Balehu - - - 3 - - 10
5 Baari - - - 4 - - 25
6 Mathan 1 1 5
7 Laungni - - 1 10 - - 26
8 Dhaned - - - - - - 11
9 Bhadryana - - - 5 - - 12
10 Gahliyan - - - - 4
11 Ropa - - - - - - 5
12 Sarohal - - - - - - 7
13 Gurorhu - - - - - - 6
14 Kanerarh - - - - - - -
15 Tikkar - - - - - 1 20
16 Miana 1 1 - 1 - - 5
17 Miharhpur - - - - - - 25
18 Chauki 1 1 - 2 - - 10
19 Darhla - 1 - 4 - - 15
20 Kharsaal - - - 2 1 - 8
21 Gaagla - 1 1 1 1 - 10
22 Haar - - - - - - -
23 Matyal 1 - - 2 - - 12
24 B Ghirthan - - - - - - 12
25 Sujanpur 1 6 - 26 - - 90
26 Tihra 1 5 1 2 - - 50
27 Riyah - - - 2 - - 15
28 Palahi - - - - - - 10
29 Samona 3 - - 6 - - 6
30 B Bagerha - - - 2 - - 30
Total 12 15 3 83 2 1 462
Source: Field survey/RRA and PRA, 2010
Table 3b Number of vulnerable households in the PAVs on RBRB
25
Sr.
No.
Village Number of households headed by
Disabled
person
Destitute Orphan Widows Unmarried
girl
Abandoned
women
Person >
60 yrs.
1 Bulli 2 - - 5 - - 12
2 Tipri - - - - - - 9
3 Kayorh - - - - - - 7
4 Chauki - - - - - - 15
5 Dalli - 1 - 2 - - 13
6 Bhalunder 1 - - 10 - - 40
7 Daadu - - - 1 - - 9
8 N Bherhi - - - 8 - - 20
9 Paprola 2 - - 10 - - 26
10 Alampur 5 - - 5 - - 35
11 Baag 1 - - - 1 - 20
12 Liyunda - - - 7 1 - 30
13 Sai - - - 3 - - 30
14 Jagrupnager - - - - 1 20
Total 11 1 - 51 2 1 286
Source: Field survey/RRA and PRA, 2010
Table 4a Number of households affected by project in the project affected villages on LBRB
Sr.
No.
Village Total
households
Project
affected
households
Project
affected
persons
PAFs
rendered
landless
PAFs
rendered
large
PAFs
rendered
marginal
PAFs
rendered
small
PAFs
rendered
houseless
1 J Jihan 18 3 18 - 3 - - -
2 Bumblu 46 - - - - - - -
3 Amli Nil - - - - - - -
4 Balehu 26 20 80 - - 11 9 -
5 Baari 58 7 25 - 3 - 4 -
6 Mathan 12 11 80 - - 11 - -
7 Laungni 58 52 223 - - 32 20 -
8 Dhaned 22 18 90 - - 18 - -
9 Bhadryana 43 8 45 - - - 8 -
10 Gahliyan 14 10 45 - - 3 7 -
11 Ropa 12 5 40 - - - 5 -
12 Sarohal 45 12 54 - - 10 2 -
13 Gurorhu 46 12 54 - - 12 - -
14 Kanerarh - - - - - - - -
15 Tikkar 85 11 60 - - 11 - -
16 Miana 17 15 62 - - 8 7 -
17 Miharhpur 73 12 60 - - 6 6 -
18 Chauki 24 10 40 - - 10 - -
19 Darhla 75 20 80 - - 20 - -
20 Kharsaal 28 5 35 - - 5 - -
21 Gaagla 47 22 180 - - 22 - -
22 Haar - - - - - - - -
23 Matyal 26 11 60 - - 11 - -
24 B Ghirthan 56 56 360 - - 50 6 -
25 Sujanpur 592 30 120 - - 14 16 -
26 Tihra 240 - - - - - - -
27 Riyah 60 - - - - - - -
28 Palahi 35 15 55 - - 12 3 -
29 Samona 50 40 180 - - 40 - -
26
30 B Bagerha 84 35 130 4 - 31 - -
Total 1892 440 2176 4 6 337 93 0
Source: Field survey/RRA and PRA, 2010
Table 4 b Number of households affected by project in the project affected villages on RBRB
Sr.
No.
Village Total
households/
families
Project
affected
families
Project
affected
persons
PAFs
rendered
landless
PAFs
rendered
large
PAFs
rendered
marginal
PAFs
rendered
small
PAFs
rendered
houseless
1 Bulli 35 27 108 - 1 23 3 -
2 Tipri 31 31 124 - - 31 - -
3 Kayorh 31 31 146 1 - 30 - -
4 Chauki 36 32 213 - - 25 7 -
5 Dalli 25 12 60 - - 7 5 -
6 Bhalunder 150 12 43 - - 12 - -
7 Daadu 20 15 150 - - 4 11 -
8 N Bherhi 50 25 173 - - 12 13 -
9 Paprola 66 40 132 - - 30 10 -
10 Alampur 160 10 50 - - 10 - -
11 Baag 71 4 22 - - 4 - -
12 Liyunda 82 - - - - - - -
13 Sai 133 27 190 - - 27 - -
14 Jagrupnager 91 7 25 - - 7 - -
Total 981 273 1436 1 1 222 49 0
Source: Field survey/RRA and PRA, 2010
Table 5a Age and education profile of population in affected villages on LBRB
Sr.
No.
Village Age wise population (No.) Literacy rate (%)
Gen. SC OBC Gen. SC OBC
<5 yr >5 yr <5 yr >5 yr <5 yr >5 yr
1 Jungle Jihan 5 64 2 22 4 20 98.55 83.33 83.33
2 Bumblu 9 51 8 42 - - 93.33 92.00
3 Amli - - - - - - - - -
4 Balehu 13 107 - - - - 85.83 - -
5 Baari 15 160 4 14 5 60 100.0 88.89 86.15
6 Mathan 12 85 - - 3 7 84.54 70
7 Laungni 16 209 5 40 2 18 93.78 86.67 65.00
8 Dhaned 8 87 3 14 - - 94.74 100.0 -
9 Bhadryana 12 130 13 41 7 45 90.14 88.89 88.46
10 Gahliyan 7 42 - - 3 17 97.96 - 95.00
11 Ropa 12 68 6 10 97.50 62.50
12 Sarohal 6 86 10 82 3 8 96.74 91.30 90.91
13 Gurorhu 8 127 2 73 - - 92.59 90.67 -
14 Kanerarh - - - - - - - - -
15 Tikkar 20 207 3 32 3 32 94.71 91.43 80.00
16 Miana 7 62 - - 3 24 92.75 85.19
17 Miharhpur 19 238 16 143 - - 94.94 83.02 -
18 Chauki 8 59 - 2 - - 94.03 50.00 -
19 Darhla 30 188 20 105 - - 95.41 88.00 -
20 Kharsaal 15 205 - - - - 95.45 - -
21 Gaagla 15 115 - - 20 130 96.15 - 96.67
27
22 Haar - - - - - - - - -
23 Matyal 2 63 - - 15 75 89.23 - 83.33
24 B Ghirthan - - - - 10 285 - - 81.36
25 Sujanpur 8 209 51 1140 59 721 93.09 85.56 82.56
26 Tihra 14 205 20 168 15 128 85.39 76.06 86.01
27 Riyah - - 25 395 - - - 76.19 -
28 Palahi 15 115 - - - - 96.15 - -
29 Samona 15 85 - - 10 85 97.00 89.47
30 Bir Bagerha 20 205 30 164 10 94 93.33 85.57 80.77
Total 311 3172 218 2487 172 1749 93.73 83.53 84.01
Source: Field survey/RRA and PRA, 2010
Table 5b Age and education profile of population in affected villages on RBRB
Sr.
No.
Village Age wise population (No.) Literacy rate (%)
Gen. SC OBC Gen SC OBC
<5 yr >5 yr <5 yr >5 yr <5 yr >5 yr
1 Bulli 15 205 4 46 - - 100.00 84.00 -
2 Tipri 8 40 10 66 - - 85.42 90.79 -
3 Kayorh 4 18 27 97 - - 100.00 95.16 -
4 Chauki 20 200 2 18 - - 88.64 80.00 -
5 Dalli 5 122 - - - - 93.70 -
6 Bhalunder 40 310 20 107 - - 94.29 76.38 -
7 Daadu 10 190 - - - - 95.00 - -
8 N Bherhi 20 325 - - 1 4 95.07 - 80.00
9 Paprola 25 165 6 34 3 12 84.21 77.50 73.33
10 Alampur 3 47 50 670 - - 94.00 86.11
11 Baag 2 33 8 160 19 172 97.14 80.36 86.91
12 Liyunda 11 75 20 155 9 91 97.67 83.43 94.00
13 Sai 12 146 26 281 54 459 89.87 89.90 90.06
14 Jagrupnage
r
25 265 12 95 - -
93.10 84.11 -
Total 200 2141 185 1729 86 738 93.43 84.34 84.86
Source: Field survey/RRA and PRA, 2010
Table 6a Housing structures in PAVs on LBRB
Sr.
No.
Village Total houses (No.) Loss of houses (No.)
Kuchha Pucca Kuchha Pucca
Gen SC OBC Gen SC OBC Gen SC OBC Gen SC OBC
1 J Jihan 8 2 2 5 1 - - - - - -
2 Bumblu 18 7 - 17 4 - - - - - - -
3 Amli - - - - - - - - - - - -
4 Balehu - - - 26 - - - - - - - -
5 Baari 12 3 5 27 1 10 - - - - - -
6 Mathan 4 1 7 - - - - - - - -
7 Laungni 38 7 - 7 2 4 - - - - - -
8 Dhaned 4 1 - 14 3 - - - - - - -

28
9 Bhadryana 3 7 2 22 3 6 - - - - - -
10 Gahliyan - - 2 10 2 - - - - - -
11 Ropa - - - 10 2 - - - - - - -
12 Sarohal 1 2 - 20 20 2 - - - - - -
13 Gurorhu 22 14 - 8 2 - - - - - - -
14 Kanerarh - - - - - - - - - - - -
15 Tikkar 4 5 1 61 5 9 - - - - - -
16 Miana 4 - 3 8 - 2 - - - - - -
7 Miharhpur 13 25 - 27 8 - - - - - - -
18 Chauki 8 1 - 15 - - - - - - - -
19 Darhla 15 10 - 35 15 - - - - - - -
20 Kharsaal 5 - - 23 - - - - - - - -
21 Gaagla 11 10 11 - 15 - - - - - - -
22 Haar - - - - - - - - - - - -
23 Matyal 6 - 4 6 - 10 - - - - - -
24 B Ghirthan - - 46 - - 10 - - - - - -
25 Sujanpur 15 100 197 14 116 150 - - - 1 - -
26 Tihra 81 85 53 9 5 7 - - - - - -
27 Riyah - 35 - - 25 - - - - - - -
28 Palahi 17 - - 18 - - - - - - - -
29 Samona 12 - 16 13 - 9 - - - - - -
30 B Bagerha 17 25 13 18 8 3 - - - - - -
Total 318 339 356 420 234 225 0 0 0 1 0 0
Source: Field survey/RRA and PRA, 2010
Table 6b Housing structures in PAVs on RBRB
Sr.
No.
Village Total houses (No.) Loss of houses (No.)
Kuchha Pucca Kuchha Pucca
Gen SC OBC Gen SC OBC Gen SC OBC Gen SC OBC
1 Bulli 16 6 - 9 4 - - - - - - -
2 Tipri 6 10 - 6 9 - - - - - - -
3 Kayorh 4 15 - 12 - - - - - - -
4 Chauki 2 2 - 30 2 - - - - - -
5 Dalli 19 - - 6 - - - - - - - -
6 Bhalunder 40 30 - 70 10 - - - - - - -
7 Daadu 13 - - 7 - - - - - - - -
8 Ni Bherhi 32 - 1 17 - - - - - - - -
9 Paprola 20 9 5 30 2 - - - - - - -
10 Alampur 2 90 - 8 60 - - - - - - -
11 Baag 2 15 19 2 8 25 - - - - - -
12 Liyunda 12 29 14 6 9 12 - - - - - -
13 Sai 12 19 35 10 27 30 - - - - - -
14 Jagrupnager 37 8 - 38 8 - - - - - - -
Total 217 233 74 239 151 67 - - - - - -
Source: Field survey/RRA and PRA, 2010
Table 7a Livestock inventory in project affected villages on LBRB
29
Sr.
No.
Village Households
(No.)
Households
with animals
(%)
Total
animals
(No.)
Animal
sent for
grazing
Loss of
grazing land
(%)
Value of loss of
grass due to project
grazed by animals
(Lakh Rs/ Yr)
1 Jungle Jihan 18 100 57 57 100 2.50
2 Bumblu 46 100 190 119 25 0.73
3 Amli - - - - - -
4 Balehu 26 88 115 37 50 1.63
5 Baari 58 100 121 90 25 0.15
6 Mathan 12 100 97 97 100 2.15
7 Laungni 58 83 226 20 50 0.22
8 Dhaned 22 54 14 - - Not sent for grazing
9 Bhadryana 43 81 116 - - Not sent for grazing
10 Gahliyan 14 100 56 50 100 1.58
11 Ropa 12 100 49 23 100 0.74
12 Sarohal 45 100 93 - 25 Not sent for grazing
13 Gurorhu 46 100 206 144 50 1.76
14 Kanerarh - - - - - -
15 Tikkar 85 100 238 108 20 0.44
16 Miana 17 100 50 16 25 0.08
17 Miharhpur 73 90 89 - - Not sent for grazing
18 Chauki 24 91 47 - - Not sent for grazing
19 Darhla 75 100 130 - 33 Not sent for grazing
20 Kharsaal 28 96 63 23 10 0.05
21 Gaagla 47 85 84 20 50 0.30
22 Haar - - - - - -
23 Matyal 26 100 23 8 10 0.026
24 B Ghirthan 56 100 245 151 50 1.04
25 Sujanpur 592 86 804 14 20 0.06
26 Tihra 240 75 248 - - Not sent for grazing
27 Riyah 60 91 174 - - Not sent for grazing
28 Palahi 35 100 80 40 50 0.88
29 Samona 50 100 116 27 100 1.18
30 Bir Bagerha 84 100 173 61 100 0.99
Total 1892 90 3904 1105 52.04 16.506
Source: Field survey/RRA and PRA, 2010
Table 7b Livestock inventory in project affected villages on RBRB
Sr.
No.
Village Households
(No.)
Households
with
animals (%)
Total
animals
(No.)
Animal
sent for
grazing
Loss of
grazing
land (%)
Value of loss of
grass due to
project grazed by
animals
(Lakh Rs/Yr)
1 Bulli 35 100 181 - - -
2 Tipri 31 100 120 90 25 0.27
3 Kayorh 31 87 97 74 10 0.15
4 Chauki 36 100 81 - - Not sent for
grazing
5 Dalli 25 40 23 29 25 0.21
6 Bhalunder 150 87 297 197 25 1.57
7 Daadu 20 60 71 49 10 0.13
8 Nichali
Bherhi
50 40 107 - - Not sent for
grazing
9 Paprola 66 23 130 66 10 0.13

30
10 Alampur 160 50 28 - 20 Not sent for
grazing
11 Baag 71 72 137 63 25 0.57
12 Liyunda 82 50 71 - 100 Not sent for
grazing
13 Sai 133 100 274 - 25 Not sent for
grazing
14 Jagrupnager 91 96 98 22 100 0.96
Total 981 72 1715 590 34.09 3.99
Source: Field survey/RRA and PRA, 2010
Table 8a Average yield of milk (Lt/animal/day) on LBRB
Sr. No. Village Cow Buffalo
1 Jungle Jihan 10 7
2 Bumblu 10 7
3 Amli - -
4 Balehu 10 10
5 Baari 4 6
6 Mathan 6 8
7 Laungni 8 5
8 Dhaned 7 8
9 Bhadryana 7 10
10 Gahliyan 7 8
11 Ropa 4 7
12 Sarohal 6 7
13 Gurorhu 6 8
14 Kanerarh - -
15 Tikkar 6 8
16 Miana 7 6
17 Miharhpur 7 8
18 Chauki 6 10
19 Darhla 7 8
20 Kharsaal 7 10
21 Gaagla 8 5
22 Haar - -
23 Matyal 7 10
24 B Ghirthan 4 8
25 Sujanpur 7 8
26 Tihra 7 9
27 Riyah 8 10
28 Palahi 6 8
29 Samona 7 9
30 Bir Bagerha 5 7
Average 6.81 7.96
Source: Field survey/RRA and PRA, 2010
Table 8b Average yield of milk (Lt/animal/day) on RBRB
Sr No, Village Cow Buffalo
1 Bulli 5 6
2 Tipri 6 8
3 Kayorh 5 7
4 Chauki 5 8
5 Dalli 10 6
31
6 Bhalunder 7 8
7 Daadu 8 10
8 Nichali Bherhi 10 7
9 Paprola 7 6
10 Alampur 5 8
11 Baag 7 10
12 Liyunda 7 8
13 Sai 6 8
14 Jagrupnager 6 8
Average 6.71 7.71
Source: Field survey/RRA and PRA, 2010
Table 9a Average yield of cereal crops (Kg / kanal) on LBRB
Sr No, Village Maize Paddy Wheat
1 Jungle Jihan 100 - 100
2 Bumblu 100 - 100
3 Amli - - -
4 Balehu 100 - 75
5 Baari 100 75 100
6 Mathan 80 80 100
7 Laungni 100 60 90
8 Dhaned 90 - 90
9 Bhadryana 150 - 150
10 Gahliyan 80 - 60
11 Ropa 50 - 45
12 Sarohal 100 - 100
13 Gurorhu 90 - 90
14 Kanerarh - - -
15 Tikkar 75 - 75
16 Miana 200 - 100
17 Miharhpur 75 - 60
18 Chauki 100 - 100
19 Darhla 150 - 120
20 Kharsaal 100 - 80
21 Gaagla 100 - 75
22 Haar - - -
23 Matyal 100 - 80
24 B Ghirthan 75 - 60
25 Sujanpur 100 75 80
26 Tihra 90 - 60
27 Riyah 50 - 40
28 Palahi 100 - 100
29 Samona 70 - 80
30 Bir Bagerha 60 - 50
Average 95.74 72.50 83.70
Source: Field survey/RRA and PRA, 2010
Table 9b Average yield of cereal crops (Kg / kanal) on RBRB
Sr No. Village Maize Paddy Wheat
1 Bulli 100 50 75
2 Tipri 70 - 80
3 Kayorh 80 - 100
4 Chauki 80 - 80
32
5 Dalli 100 70 70
6 Bhalunder 100 - 70
7 Daadu 100 - 100
8 Nichali Bherhi 100 - 100
9 Paprola 150 - 100
10 Alampur 150 - 170
11 Baag 150 - 150
12 Liyunda 150 100 150
13 Sai 30 - 30
14 Jagrupnager 120 - 100
Average 105.71 73.73 98.21
Source: Field survey/RRA and PRA, 2010
Table 10a Average yield of fruits (Kg/Plant of average age) on LBRB
Sr No. Village Mango Citrus Guava Litchi
1 Jungle Jihan 40 - - -
2 Bumblu 40 - - -
3 Amli - - - -
4 Balehu 50 50 - -
5 Baari 100 - - -
6 Mathan 200 100 - -
7 Laungni 200 30 - -
8 Dhaned 200 100 - -
9 Bhadryana 200 100 - -
10 Gahliyan - - - -
11 Ropa 100 20 - 20
12 Sarohal 100 - 70 -
13 Gurorhu 100 - - -
14 Kanerarh - - - -
15 Tikkar 80 10 - -
16 Miana 200 10 - -
17 Miharhpur 100 25 40 -
18 Chauki 100 - - -
19 Darhla 200 - - -
20 Kharsaal 100 10 - 6
21 Gaagla 100 20 - -
22 Haar - - - -
23 Matyal 100 10 - 6
24 B Ghirthan 100 - - -
25 Sujanpur 80 - - -
26 Tihra 90 - - -
27 Riyah - - - -
28 Palahi 100 30 - -
29 Samona 100 15 - -
30 Bir Bagerha 100 5 - -
Average 115.20 35.66 55.00 10.66
Source: Field survey/RRA and PRA, 2010
Table 10b Average yield of fruits (Kg/Plant of average age) on RBRB
Sr No, Village Mango Citrus Guava Litchi
1 Bulli 150 25
2 Tipri 90 - - -
3 Kayorh 100 - - -
33
4 Chauki 400 - - -
5 Dalli 100 50 - -
6 Bhalunder 200 5 - -
7 Daadu 200 - - -
8 Nichali Bherhi 200 - - -
9 Paprola 200 25 - -
10 Alampur 100 50 - -
11 Baag 100 70 - -
12 Liyunda 200 - - -
13 Sai 100 10 - -
14 Jagrupnager 100 - - -
Average 160.00 33.56 - -
Source: Field survey/RRA and PRA, 2010
Table 11a Gross household income of households in the PAVs on LBRB
Sr.
No.
Village ‘000’ Rs. /Month/ HH (No.)
General SC OBC
<5 5-10 >10 <5 5-10 >10 <5 5-10 >10
1 Jungle Jihan 2 11 2 3
2 Bumblu 2 23 10 9 2 - - - -
3 Amli - - - - - - - - -
4 Balehu 2 23 1 - - - - - -
5 Baari 6 15 18 - 4 - - 10 5
6 Mathan 5 6 - - - 1
7 Laungni 9 26 10 7 2 - - 3 1
8 Dhaned 10 2 6 - - 4 - - -
9 Bhadryana 5 20 - 10 - - 6 2
10 Gahliyan - - 10 - - - 2 2
11 Ropa - - 10 - - 2 - - -
12 Sarohal 3 7 11 17 4 1 2
13 Gurorhu - 8 22 - - 16 - - -
14 Kanerarh - - - - - - - - -
15 Tikkar - 30 35 - 7 3 - - 10
16 Miana - 6 6 - - - 2 3 -
17 Miharhpur 8 14 18 20 10 3 - - -
18 Chauki 3 20 1 - - - - -
19 Darhla 20 30 3 22 - - - -
20 Kharsaal 6 12 10 - - - - - -
21 Gaagla 7 15 - - - - 19 6
22 Haar - - - - - - - - -
23 Matyal 3 6 3 - - - 4 10 -
24 B Ghirthan - - - - - - - 40 16
25 Sujanpur 19 10 96 92 28 34 222 91
26 Tihra 7 40 43 17 40 33 20 40
27 Riyah - - - 30 22 8 - - -
28 Palahi 15 10 10 - - - - - -
29 Samona 15 7 3 - - - 15 10 -
30 Bir Bagerha - 22 13 23 10 - 12 4 -
Total 91 307 351 223 227 98 72 352 171
Source: Field survey/RRA and PRA, 2010
Table 11b Gross household income of households in PAVs on RBRB
Sr. Village Rs. /Month/ HH (No.)

34
No.
General SC OBC
<5 5-10 >10 <5 5-10 >10 <5 5-10 >10
1 Bulli 20 - 5 6 - 4 - - -
2 Tipri - 10 2 1 11 7 - - -
3 Kayorh 3 1 - - 19 3 - 2 3
4 Chauki 12 10 10 - 4 - - - -
5 Dalli 3 10 12 - - - - - -
6 Bhalunder 10 60 40 17 10 13 - - -
7 Daadu 7 10 3 - - - - - -
8 N Bherhi 5 20 24 - - - 1 - -
9 Paprola - 18 32 11 - - 3 - 2
10 Alampur - - 10 80 50 20 - - -
11 Baag - 2 2 13 8 2 14 25 5
12 Liyunda 2 10 6 6 20 12 - 20 6
13 Sai 2 17 3 31 15 - 25 40 -
14 Jagrupnager 5 40 30 8 8 - - - -
Total 69 208 179 173 145 61 43 87 16
Source: Field survey/RRA and PRA, 2010
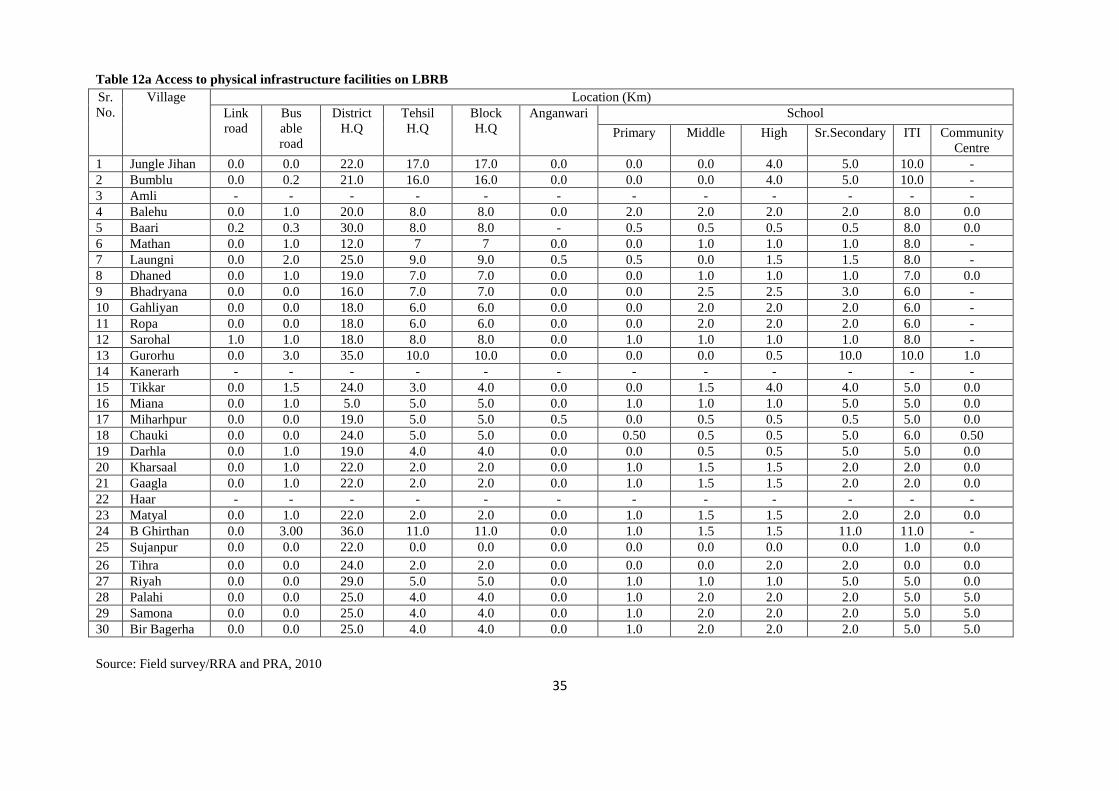
35
Table 12a Access to physical infrastructure facilities on LBRB
Sr.
No.
Village Location (Km)
Link
road
Bus
able
road
District
H.Q
Tehsil
H.Q
Block
H.Q
Anganwari School
Primary Middle High Sr.Secondary ITI Community
Centre
1 Jungle Jihan 0.0 0.0 22.0 17.0 17.0 0.0 0.0 0.0 4.0 5.0 10.0 -
2 Bumblu 0.0 0.2 21.0 16.0 16.0 0.0 0.0 0.0 4.0 5.0 10.0 -
3 Amli - - - - - - - - - - - -
4 Balehu 0.0 1.0 20.0 8.0 8.0 0.0 2.0 2.0 2.0 2.0 8.0 0.0
5 Baari 0.2 0.3 30.0 8.0 8.0 - 0.5 0.5 0.5 0.5 8.0 0.0
6 Mathan 0.0 1.0 12.0 7 7 0.0 0.0 1.0 1.0 1.0 8.0 -
7 Laungni 0.0 2.0 25.0 9.0 9.0 0.5 0.5 0.0 1.5 1.5 8.0 -
8 Dhaned 0.0 1.0 19.0 7.0 7.0 0.0 0.0 1.0 1.0 1.0 7.0 0.0
9 Bhadryana 0.0 0.0 16.0 7.0 7.0 0.0 0.0 2.5 2.5 3.0 6.0 -
10 Gahliyan 0.0 0.0 18.0 6.0 6.0 0.0 0.0 2.0 2.0 2.0 6.0 -
11 Ropa 0.0 0.0 18.0 6.0 6.0 0.0 0.0 2.0 2.0 2.0 6.0 -
12 Sarohal 1.0 1.0 18.0 8.0 8.0 0.0 1.0 1.0 1.0 1.0 8.0 -
13 Gurorhu 0.0 3.0 35.0 10.0 10.0 0.0 0.0 0.0 0.5 10.0 10.0 1.0
14 Kanerarh - - - - - - - - - - - -
15 Tikkar 0.0 1.5 24.0 3.0 4.0 0.0 0.0 1.5 4.0 4.0 5.0 0.0
16 Miana 0.0 1.0 5.0 5.0 5.0 0.0 1.0 1.0 1.0 5.0 5.0 0.0
17 Miharhpur 0.0 0.0 19.0 5.0 5.0 0.5 0.0 0.5 0.5 0.5 5.0 0.0
18 Chauki 0.0 0.0 24.0 5.0 5.0 0.0 0.50 0.5 0.5 5.0 6.0 0.50
19 Darhla 0.0 1.0 19.0 4.0 4.0 0.0 0.0 0.5 0.5 5.0 5.0 0.0
20 Kharsaal 0.0 1.0 22.0 2.0 2.0 0.0 1.0 1.5 1.5 2.0 2.0 0.0
21 Gaagla 0.0 1.0 22.0 2.0 2.0 0.0 1.0 1.5 1.5 2.0 2.0 0.0
22 Haar - - - - - - - - - - - -
23 Matyal 0.0 1.0 22.0 2.0 2.0 0.0 1.0 1.5 1.5 2.0 2.0 0.0
24 B Ghirthan 0.0 3.00 36.0 11.0 11.0 0.0 1.0 1.5 1.5 11.0 11.0 -
25 Sujanpur 0.0 0.0 22.0 0.0 0.0 0.0 0.0 0.0 0.0 0.0 1.0 0.0
26 Tihra 0.0 0.0 24.0 2.0 2.0 0.0 0.0 0.0 2.0 2.0 0.0 0.0
27 Riyah 0.0 0.0 29.0 5.0 5.0 0.0 1.0 1.0 1.0 5.0 5.0 0.0
28 Palahi 0.0 0.0 25.0 4.0 4.0 0.0 1.0 2.0 2.0 2.0 5.0 5.0
29 Samona 0.0 0.0 25.0 4.0 4.0 0.0 1.0 2.0 2.0 2.0 5.0 5.0
30 Bir Bagerha 0.0 0.0 25.0 4.0 4.0 0.0 1.0 2.0 2.0 2.0 5.0 5.0
Source: Field survey/RRA and PRA, 2010
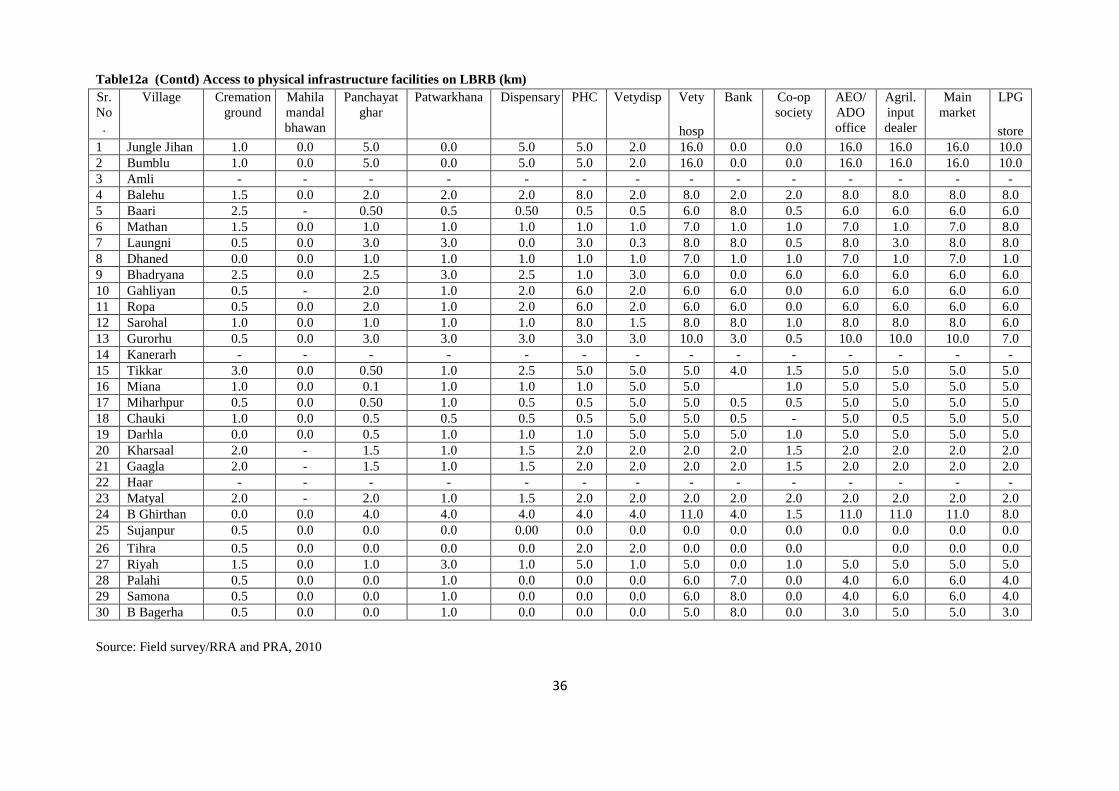
36
Table12a (Contd) Access to physical infrastructure facilities on LBRB (km)
Sr.
No
.
Village Cremation
ground
Mahila
mandal
bhawan
Panchayat
ghar
Patwarkhana Dispensary PHC Vetydisp Vety
hosp
Bank Co-op
society
AEO/
ADO
office
Agril.
input
dealer
Main
market
LPG
store
1 Jungle Jihan 1.0 0.0 5.0 0.0 5.0 5.0 2.0 16.0 0.0 0.0 16.0 16.0 16.0 10.0
2 Bumblu 1.0 0.0 5.0 0.0 5.0 5.0 2.0 16.0 0.0 0.0 16.0 16.0 16.0 10.0
3 Amli - - - - - - - - - - - - - -
4 Balehu 1.5 0.0 2.0 2.0 2.0 8.0 2.0 8.0 2.0 2.0 8.0 8.0 8.0 8.0
5 Baari 2.5 - 0.50 0.5 0.50 0.5 0.5 6.0 8.0 0.5 6.0 6.0 6.0 6.0
6 Mathan 1.5 0.0 1.0 1.0 1.0 1.0 1.0 7.0 1.0 1.0 7.0 1.0 7.0 8.0
7 Laungni 0.5 0.0 3.0 3.0 0.0 3.0 0.3 8.0 8.0 0.5 8.0 3.0 8.0 8.0
8 Dhaned 0.0 0.0 1.0 1.0 1.0 1.0 1.0 7.0 1.0 1.0 7.0 1.0 7.0 1.0
9 Bhadryana 2.5 0.0 2.5 3.0 2.5 1.0 3.0 6.0 0.0 6.0 6.0 6.0 6.0 6.0
10 Gahliyan 0.5 - 2.0 1.0 2.0 6.0 2.0 6.0 6.0 0.0 6.0 6.0 6.0 6.0
11 Ropa 0.5 0.0 2.0 1.0 2.0 6.0 2.0 6.0 6.0 0.0 6.0 6.0 6.0 6.0
12 Sarohal 1.0 0.0 1.0 1.0 1.0 8.0 1.5 8.0 8.0 1.0 8.0 8.0 8.0 6.0
13 Gurorhu 0.5 0.0 3.0 3.0 3.0 3.0 3.0 10.0 3.0 0.5 10.0 10.0 10.0 7.0
14 Kanerarh - - - - - - - - - - - - - -
15 Tikkar 3.0 0.0 0.50 1.0 2.5 5.0 5.0 5.0 4.0 1.5 5.0 5.0 5.0 5.0
16 Miana 1.0 0.0 0.1 1.0 1.0 1.0 5.0 5.0 1.0 5.0 5.0 5.0 5.0
17 Miharhpur 0.5 0.0 0.50 1.0 0.5 0.5 5.0 5.0 0.5 0.5 5.0 5.0 5.0 5.0
18 Chauki 1.0 0.0 0.5 0.5 0.5 0.5 5.0 5.0 0.5 - 5.0 0.5 5.0 5.0
19 Darhla 0.0 0.0 0.5 1.0 1.0 1.0 5.0 5.0 5.0 1.0 5.0 5.0 5.0 5.0
20 Kharsaal 2.0 - 1.5 1.0 1.5 2.0 2.0 2.0 2.0 1.5 2.0 2.0 2.0 2.0
21 Gaagla 2.0 - 1.5 1.0 1.5 2.0 2.0 2.0 2.0 1.5 2.0 2.0 2.0 2.0
22 Haar - - - - - - - - - - - - - -
23 Matyal 2.0 - 2.0 1.0 1.5 2.0 2.0 2.0 2.0 2.0 2.0 2.0 2.0 2.0
24 B Ghirthan 0.0 0.0 4.0 4.0 4.0 4.0 4.0 11.0 4.0 1.5 11.0 11.0 11.0 8.0
25 Sujanpur 0.5 0.0 0.0 0.0 0.00 0.0 0.0 0.0 0.0 0.0 0.0 0.0 0.0 0.0
26 Tihra 0.5 0.0 0.0 0.0 0.0 2.0 2.0 0.0 0.0 0.0 0.0 0.0 0.0
27 Riyah 1.5 0.0 1.0 3.0 1.0 5.0 1.0 5.0 0.0 1.0 5.0 5.0 5.0 5.0
28 Palahi 0.5 0.0 0.0 1.0 0.0 0.0 0.0 6.0 7.0 0.0 4.0 6.0 6.0 4.0
29 Samona 0.5 0.0 0.0 1.0 0.0 0.0 0.0 6.0 8.0 0.0 4.0 6.0 6.0 4.0
30 B Bagerha 0.5 0.0 0.0 1.0 0.0 0.0 0.0 5.0 8.0 0.0 3.0 5.0 5.0 3.0
Source: Field survey/RRA and PRA, 2010
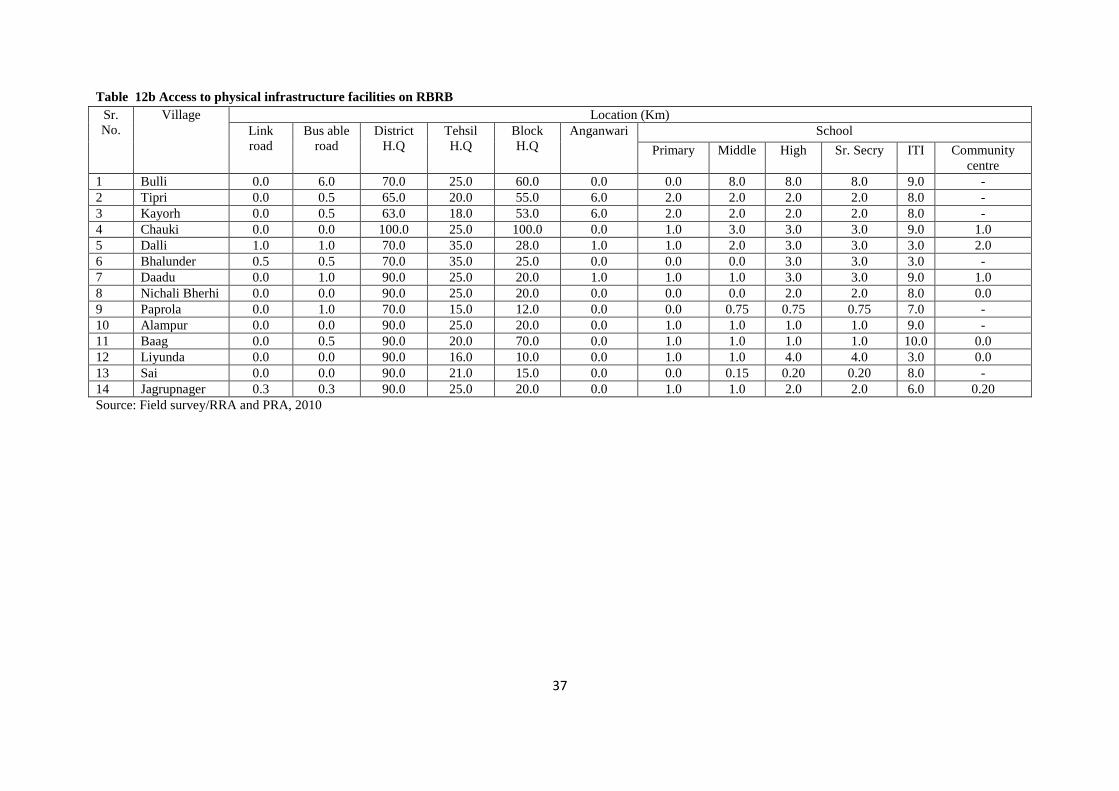
37
Table 12b Access to physical infrastructure facilities on RBRB
Sr.
No.
Village Location (Km)
Link
road
Bus able
road
District
H.Q
Tehsil
H.Q
Block
H.Q
Anganwari School
Primary Middle High Sr. Secry ITI Community
centre
1 Bulli 0.0 6.0 70.0 25.0 60.0 0.0 0.0 8.0 8.0 8.0 9.0 -
2 Tipri 0.0 0.5 65.0 20.0 55.0 6.0 2.0 2.0 2.0 2.0 8.0 -
3 Kayorh 0.0 0.5 63.0 18.0 53.0 6.0 2.0 2.0 2.0 2.0 8.0 -
4 Chauki 0.0 0.0 100.0 25.0 100.0 0.0 1.0 3.0 3.0 3.0 9.0 1.0
5 Dalli 1.0 1.0 70.0 35.0 28.0 1.0 1.0 2.0 3.0 3.0 3.0 2.0
6 Bhalunder 0.5 0.5 70.0 35.0 25.0 0.0 0.0 0.0 3.0 3.0 3.0 -
7 Daadu 0.0 1.0 90.0 25.0 20.0 1.0 1.0 1.0 3.0 3.0 9.0 1.0
8 Nichali Bherhi 0.0 0.0 90.0 25.0 20.0 0.0 0.0 0.0 2.0 2.0 8.0 0.0
9 Paprola 0.0 1.0 70.0 15.0 12.0 0.0 0.0 0.75 0.75 0.75 7.0 -
10 Alampur 0.0 0.0 90.0 25.0 20.0 0.0 1.0 1.0 1.0 1.0 9.0 -
11 Baag 0.0 0.5 90.0 20.0 70.0 0.0 1.0 1.0 1.0 1.0 10.0 0.0
12 Liyunda 0.0 0.0 90.0 16.0 10.0 0.0 1.0 1.0 4.0 4.0 3.0 0.0
13 Sai 0.0 0.0 90.0 21.0 15.0 0.0 0.0 0.15 0.20 0.20 8.0 -
14 Jagrupnager 0.3 0.3 90.0 25.0 20.0 0.0 1.0 1.0 2.0 2.0 6.0 0.20
Source: Field survey/RRA and PRA, 2010
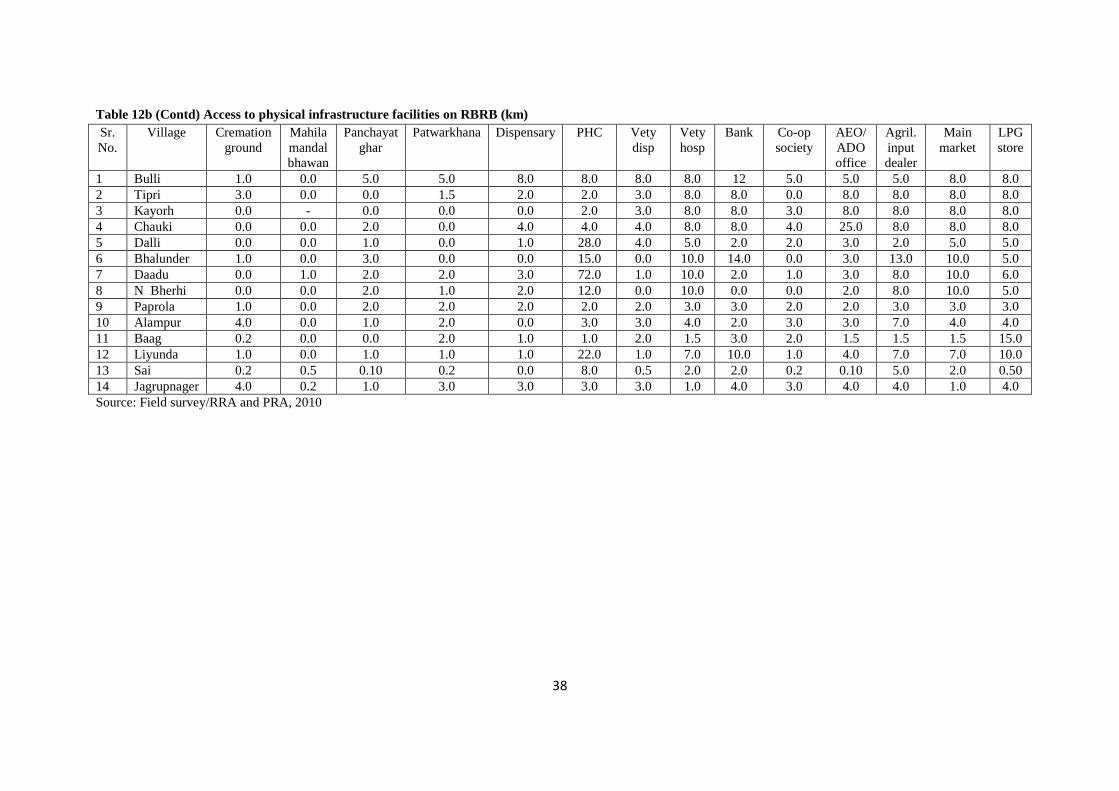
38
Table 12b (Contd) Access to physical infrastructure facilities on RBRB (km)
Sr.
No.
Village Cremation
ground
Mahila
mandal
bhawan
Panchayat
ghar
Patwarkhana Dispensary PHC Vety
disp
Vety
hosp
Bank Co-op
society
AEO/
ADO
office
Agril.
input
dealer
Main
market
LPG
store
1 Bulli 1.0 0.0 5.0 5.0 8.0 8.0 8.0 8.0 12 5.0 5.0 5.0 8.0 8.0
2 Tipri 3.0 0.0 0.0 1.5 2.0 2.0 3.0 8.0 8.0 0.0 8.0 8.0 8.0 8.0
3 Kayorh 0.0 - 0.0 0.0 0.0 2.0 3.0 8.0 8.0 3.0 8.0 8.0 8.0 8.0
4 Chauki 0.0 0.0 2.0 0.0 4.0 4.0 4.0 8.0 8.0 4.0 25.0 8.0 8.0 8.0
5 Dalli 0.0 0.0 1.0 0.0 1.0 28.0 4.0 5.0 2.0 2.0 3.0 2.0 5.0 5.0
6 Bhalunder 1.0 0.0 3.0 0.0 0.0 15.0 0.0 10.0 14.0 0.0 3.0 13.0 10.0 5.0
7 Daadu 0.0 1.0 2.0 2.0 3.0 72.0 1.0 10.0 2.0 1.0 3.0 8.0 10.0 6.0
8 N Bherhi 0.0 0.0 2.0 1.0 2.0 12.0 0.0 10.0 0.0 0.0 2.0 8.0 10.0 5.0
9 Paprola 1.0 0.0 2.0 2.0 2.0 2.0 2.0 3.0 3.0 2.0 2.0 3.0 3.0 3.0
10 Alampur 4.0 0.0 1.0 2.0 0.0 3.0 3.0 4.0 2.0 3.0 3.0 7.0 4.0 4.0
11 Baag 0.2 0.0 0.0 2.0 1.0 1.0 2.0 1.5 3.0 2.0 1.5 1.5 1.5 15.0
12 Liyunda 1.0 0.0 1.0 1.0 1.0 22.0 1.0 7.0 10.0 1.0 4.0 7.0 7.0 10.0
13 Sai 0.2 0.5 0.10 0.2 0.0 8.0 0.5 2.0 2.0 0.2 0.10 5.0 2.0 0.50
14 Jagrupnager 4.0 0.2 1.0 3.0 3.0 3.0 3.0 1.0 4.0 3.0 4.0 4.0 1.0 4.0
Source: Field survey/RRA and PRA, 2010
39
Section II
3.2 TANGIBLE GAINS AND LOSSES OF PROJECT
The execution of new projects/ventures to harness natural resources like the Dhaulasidh
hydroelectric project is sine qua non for the growth and development of any region/country.
The implementation of these projects is bound to have both positive and negative effects
which are tangible and intangible in nature and create positive and negative externalities.
While the tangible effects are easy to assess and quantify, quantification of various intangible
effects remains a matter of debate in that it involves subjective judgment. It is against this
background that an attempt has been made in this section to highlight and quantify the
tangible benefits and losses expected to accrue from the implementation of the project.
3.2.1 Background information of project affected villages/households
Tables 13a and 13b shows the number of households in favour of project, the main issues
raised by them and the interventions suggested to minimise the negative effects of the
execution of the project on both sides of the river Beas. As alluded to above, the execution of
the project will affect fourteen villages located on the right bank of the river while the
number of affected villages on the left side of the river is 30 villages out of which 3 are
uninhabited. The number of households in the affected villages located on the right bank
villages varied from 20 in Daadu to as high as 160 in Baag. Among the villages located on
the right side, Alampur used to be the terminal point and night halt for buses before the
construction of bridge at Beas connecting Alampur in Kangra district and Sujanpur in
Hamirpur district. Alampur was named after King Alam Chand and Sai was its one of the
constituents. Both these villages have flat/plain topography and there is a junction/diversion
point near Thakurdwara hamlet. Thakurdwara has very old Shiva Temple. Alampur has a
sizable population of Zheebar and Draie castes who traditionally depend on fishing in river
Beas for their livelihood. The people of Draie caste used to run ferrying (pattan) in olden
times earning a reasonable amount of income. In a similar vein, number of households in the
project affected villages located on the left bank of the river varied from 12 in Ropa to 110 in
Bumblu. Ropa, situated on the bank of Pung Khud, is the smallest village will lose its
connectivity with nearby village Balla Ghirthan located on the other side of Pung Khud.
40
3.2.2 Issues/concerns voiced by project affected households
As may be seen from Tables 13a and 13b, there were 1892 households in the project affected
villages on the left bank, of which 90% are in favour of project. On the other hand, there were
981 households in the villages located on the right bank, out of which 94% are in favour of
the project. However, the proportion of households supporting the project varied from village
to village. For example, in Barri, Laungni, Gahlian and Samona 50 % were in favour and
50% were not favouring primarily because of the fear of losing land and becoming dam
oustees. The main issues that were raised by the stakeholders include loss of private
grasslands with fodder trees, agricultural land, common land used for grazing animals, road
connectivity, lift irrigation schemes, etc. Loss of common gazing land, the irrigation
infrastructure and loss of ferrying site were other major concerns expressed by the affected
people on both sides. To meet these concerns, interventions like the provision of bridge
connectivity, rehabilitation of irrigation and drinking water schemes and monetary
compensation were suggested to mitigate the perceived negative effects.
The issues like appearance of wild animals, insect pests, and losing fishing grounds were
also voiced by stakeholders. The loss of connectivity by Bulli, Bhalunder, Balla Ghirthan and
Ropa villages was a very important issue which would not only affect the livelihoods and
overall development of these villages but villagers would also have to spend more than two
hours and incur an expenditure of Rs 25-30/head to avail of various facilities that are
available on other side of the river bank and Pung khud. The stakeholders in these villages,
therefore, demanded a construction of bridge to connect to nearby villages from Bulli to
Mathan/Laungni and Ropa to Balla Ghirthan.
As far as the loss of land is concerned, majority of the stakeholders asked for cash
compensation. In Balla Ghirthan and Balehu some farmers demanded a share in the project
income to protect their own and future generation livelihoods. The provision of fishing rights
in the dam was yet another main demand of the households losing their livelihoods. At
present, the fishermen (Dheebars) catch 7-8 kg fish/head/day which is valued at Rs. 500 to Rs.
600. The rise of water in the Neugal khud will affect three important sites used for fishing by
the local license holder fishermen. During rainy season, the flow of fish is checked on these
41
sites by putting gillnet while in the closed area people go for fishing during night hours. The
fish catch so realized is used for self-consumption and also sold in Alampur and Sujanpur
markets which are famous for fish products both in raw and fried form.
3.2.3 Farmer households losing land
Tables 14a and 14b show that in all 121 households of general category, 22 of scheduled
caste and 32 households of OBC group would lose cultivated land on the left bank. Likewise,
58 households of general category, 10 households belonging to SC category and14
households of OBC category would lose cultivated land on the right bank. On an average, a
household may lose 4.71 kanals (1809 sq mt) of cultivated land and 3.30 kanals (1267 sq mt)
of uncultivated land on the left bank. On the right bank, a farmer household may lose 4.60
kanals (1766 sq mt) of cultivated land and 6.16 kanals (2365 sq mt) of uncultivated land.
Considering all categories of affected farmer households, a farmer household on an average
may lose 4.68 kanals (1797 sq mt) of cultivated land and 4.52 kanals (1736 sq mt) of
uncultivated land due to the construction of project. And out of the total land which would be
lost by farmer households, 51% will be cultivated and 49% uncultivated. In comparison,
Table 15a and 15b show that farmer households on the left bank will lose 19% of their crop
land and 18% of their grassland. The households on the right bank may lose their 16%
cultivated and 29% of their grassland on account of project activities. It is equally important
to mentioned that the farmer households are getting very low amount of income from these
lands in comparison to their lands located nearby to their houses.
3.2.4 Loss of livelihoods
The farmers would lose in terms of land, business activities and rural craft which would
impinge on their livelihoods. Among rural craft, bamboo basket making, leaves plate (pattal)
making and broom and mat (chatai) making are important activities that are being undertaken
by the most disadvantaged SC and OBC families. The status of households losing livelihoods
associated with agriculture, business and rural craft has been provided in Tables 16a and 16b.
The loss on account of agriculture has been assessed at Rs 9,040 in case of general category
households, Rs 10,887 in respect of scheduled caste households and Rs 4,153 in case of
households of OBC category. The figures for losses in the corresponding categories of
households in the right bank amounted to Rs 10,482, Rs 10,820 and Rs 5,893, respectively.

42
On the whole, it is estimated that the loss in income from agriculture sector would be Rs
8,339 on the left bank and Rs 9,740 per household on the right bank with an overall loss of
Rs 8,804. Further, 13 households on the left bank and 7 households on the right bank would
be affected because of adverse affects on their business activities in terms of supply of
building material like sand, boulders, cut stones and concrete (bajri) and catching fish. The
extent of loss to these households amounts to Rs 60,923/per household on the left bank and
Rs 99,375/HH on the right bank with an overall average of Rs 75,571 per household per
annum. Again, 17 households on the left bank would lose on account of adverse effect on
their rural craft like making leaves plates, brooms, basket, mat, etc amounting to Rs 5,047 per
households per annum. The likely effects on livelihood have been shown in photographs (see
next pages).
3.2.5 Loss of access to common property resources
The negative effects at the community level have been brought out in Table 17. It can be
seen from the table that loss of grazing land for animals and taking animals for bath and
drinking water will have adverse effect on the community. The community will also lose the
common land available for cutting grass and sarkanda used for making soop (Chhaj) and
stitching toreyn leaves (pattals). A few poor households who collect flooded fuel wood from
the river during rainy season and use it for the whole year would also stand to lose. Two
persons who ferry people in countryside boats at Bulli and Bhalunder and earn Rs
4000/month will lose their job and thus would be obliged to look for alternative employment.
These persons need to be provided with engine boats in near future. Loss of building material
(bajri, sand boulder and cut stones) extraction sites will be yet another adverse effect on the
PAVs and the society as a whole. Beas, Neugal and Pung khud sites area are mostly used for
harvesting the basic and essential natural building material. According to rough estimates, on
an average, 50 trucks and 100 trolleys per day valued at Rs. 75,000 and Rs. 40,000
respectively are extracted from the area which will be submerged in the dam water.
Again, as many as 23 cremation grounds will also submerge in the dam water (Table 18).
More than 99% of the households in the entire project affected villages are Hindu and
consign the dead bodies to flames. These cremation grounds/sheds have been constructed on
the banks of river Beas, Pung and Neugal Khuds. These cremation grounds/sheds are also
used by the households of other villages which are not included in the list of PAVs.
43
Therefore, all the cremation grounds lost on account of creation of dam need to be
reconstructed and compensated. There were 14 cremation grounds on left bank and 9 on the
right bank of the dam area.
The loss of chabutras, gharats and drinking water bouries is shown in Table 20a and 20b. In
all 13 chabutras, 10 gharats (presently non functional) and 38 water bouries will be lost due
to their submergence in the dam. Loss of fishing grounds and the thick forest area covered
under Khzoor and Toreyn mostly used for making brooms, mats and eating plates (Pattals)
will be a net loss to the society. On an average, the poor people engaged in these activities
earn around Rs 150/- to Rs. 200- /day. Similarly, the villagers make brooms and mats from
Khzoor leaves which are used for self-consumption and sale. In Barri and Bulli villages,
people earn Rs. 30/broom, Rs. 100/- mat made of Khzoor leaves.
The people would also lose infrastructure facilities like access to lift irrigation and drinking
water supplies which may go out of order for many days. The list of affected irrigation and
drinking water schemes has been provided in Table 19. The effects on public facilities have
been depicted through photographs (see next pages).
3.2.6 Likely positive impacts
It is expected that during and after the construction of the project, local people may get
employment opportunities in terms of supplying construction material, by doing some petty
business like running a tea stall, other shops of daily needs, selling agricultural produce
particularly vegetables and milk. The stakeholders also expect that project authorities would
provide them with good road, health, educational and drinking water facilities, cheap
electricity street light, etc. in lieu of loss of land (Table 21).
3.2.7 Effect on social and cultural relations
The socio-cultural relations would be affected adversely because of loss of common meeting
place, platform for sharing knowledge with relatives/friends in the fairs and festivals, loss of
temples like DhauliSidh near Jihan, the Guga near Bhalunder, Sankat Mochan near Bhaleth
and Murli Manohar Sujanpur Tira where people gather to offer prayers and share knowledge
and discuss issues affecting the community at large. Another loss would be in terms of the
availability of services of carpenter, masoner, blacksmith, agriculture labour, etc. The effect
44
of such inter-caste services will be more pronounced in Bulli, Laungni, Balehu, Bhalunder,
Dalli, Mathan and Gagla villages from where such people go to other sides very frequently.
Another socio-cultural loss would be the non-availability of cooperation from adjoining
villages during different social ceremonies like marriages and death ceremonies. The people
of either side participate in different social ceremonies like marriages and death (Table 22).
3.2.8 Likely negative economic effects
Increase in soil erosion due to construction of link roads and the splash of water along the
village boundaries will have negative effect on livelihoods of the local people. The
productivity of crops would decline due to increased frequency and lasting hours of fog. This
will have more severe effect in some villages like Bulli, Laungni, Balehu, Mathan, Dalli,
Gaagla and Bhalunder. According to an estimate, the productivity of crops (field) and fruits
valued at Rs 1500/ha in case of field crops like wheat and Rs. 7500/ha in case of fruits may
decline by 10%. Again, the increase in expenditure on human and animal health on account
of increased fog & infestation of diseases and pest is estimated to be Rs. 300/ to Rs. 200/head,
respectively. Woollen clothes, fuel wood & electricity would be the additional requirements
of the people in the affected area. However, during summer people may get relief from heat
due to cool climate but in net terms the losses would be higher estimated to be Rs 100 per
person (Table 22).
3.2.9 Summing up
The main issues that were raised by the stakeholders include loss of private grasslands with
fodder trees, agricultural land, common land used for grazing animals, road connectivity, lift
irrigation schemes, etc. In addition loss of common gazing land, the irrigation infrastructure
and loss of ferrying site were other major concerns expressed by the affected people on both
sides of river Beas. The issues like appearance of wild animals, insect pests, and losing
fishing grounds were also voiced by stakeholders. The loss of connectivity by Bulli, Balla
Ghirthan and Ropa villages was a very important issue which would not only affect the
livelihoods and overall development of these villages but villagers would also have to spend
more than two hours and incur an expenditure of Rs 25-30/head to avail of various facilities
that are available on other side of the river bank. Considering all categories of affected
farmer households, a farmer household on an average may lose 4.68 kanals (1797 sq mt) of
cultivated land and 4.52 kanals (1736 sq mt) of uncultivated land due to the construction of
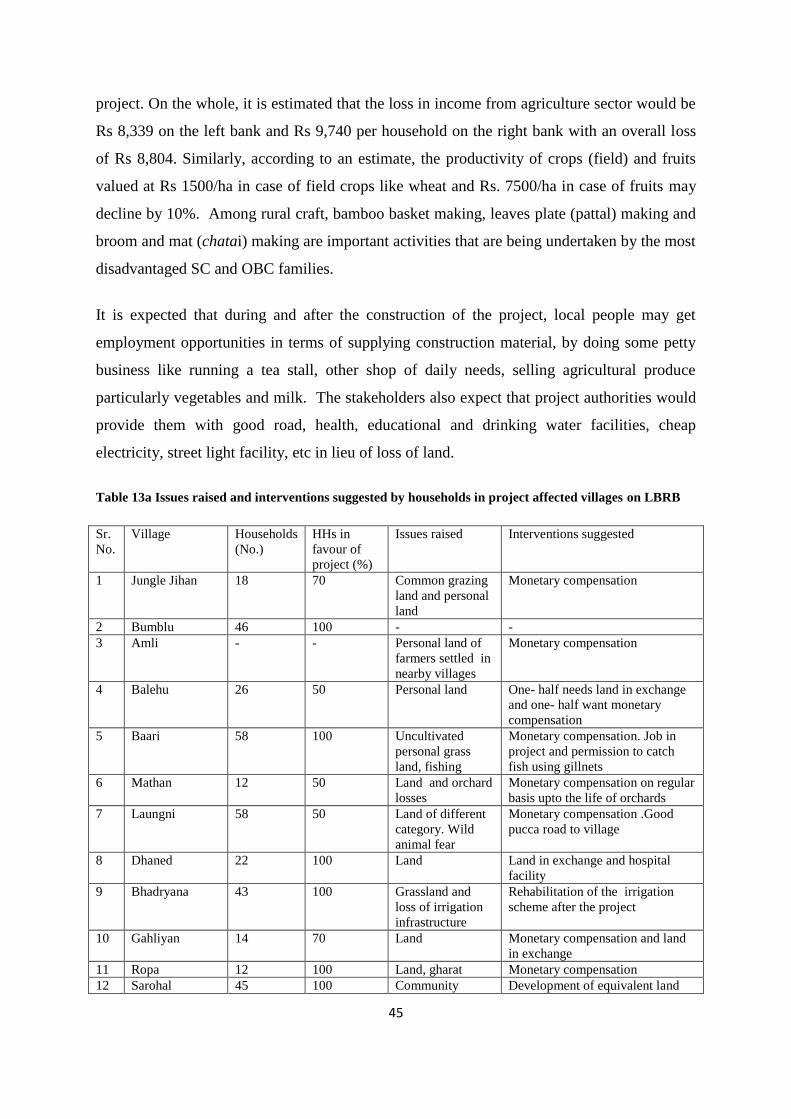
45
project. On the whole, it is estimated that the loss in income from agriculture sector would be
Rs 8,339 on the left bank and Rs 9,740 per household on the right bank with an overall loss
of Rs 8,804. Similarly, according to an estimate, the productivity of crops (field) and fruits
valued at Rs 1500/ha in case of field crops like wheat and Rs. 7500/ha in case of fruits may
decline by 10%. Among rural craft, bamboo basket making, leaves plate (pattal) making and
broom and mat (chatai) making are important activities that are being undertaken by the most
disadvantaged SC and OBC families.
It is expected that during and after the construction of the project, local people may get
employment opportunities in terms of supplying construction material, by doing some petty
business like running a tea stall, other shop of daily needs, selling agricultural produce
particularly vegetables and milk. The stakeholders also expect that project authorities would
provide them with good road, health, educational and drinking water facilities, cheap
electricity, street light facility, etc in lieu of loss of land.
Table 13a Issues raised and interventions suggested by households in project affected villages on LBRB
Sr.
No.
Village Households
(No.)
HHs in
favour of
project (%)
Issues raised Interventions suggested
1 Jungle Jihan 18 70 Common grazing
land and personal
land
Monetary compensation
2 Bumblu 46 100 - -
3 Amli - - Personal land of
farmers settled in
nearby villages
Monetary compensation
4 Balehu 26 50 Personal land One- half needs land in exchange
and one- half want monetary
compensation
5 Baari 58 100 Uncultivated
personal grass
land, fishing
Monetary compensation. Job in
project and permission to catch
fish using gillnets
6 Mathan 12 50 Land and orchard
losses
Monetary compensation on regular
basis upto the life of orchards
7 Laungni 58 50 Land of different
category. Wild
animal fear
Monetary compensation .Good
pucca road to village
8 Dhaned 22 100 Land Land in exchange and hospital
facility
9 Bhadryana 43 100 Grassland and
loss of irrigation
infrastructure
Rehabilitation of the irrigation
scheme after the project
10 Gahliyan 14 70 Land Monetary compensation and land
in exchange
11 Ropa 12 100 Land, gharat Monetary compensation
12 Sarohal 45 100 Community Development of equivalent land

46
grassland and
personal land
for grazing and monetary
compensation
13 Gurorhu 46 100 Land Monetary compensation
14 Kanerarh - - - -
15 Tikkar 85 100 Grassland Development of equivalent land
for grazing
16 Miana 17 100 Grassland, Gharat Development of equivalent land
for grazing. Compensation
17 Miharhpur 73 100 Community
grazing land
Development of equivalent land
for grazing
18 Chauki 24 100 Irrigation Rehabilitation of irrigation after
the project
19 Darhla 75 100 Personal land,
Ghraat, river
crossing pattan
Bridge, road connectivity
20 Kharsaal 28 100 Personal land,
river crossing
pattan
Bridge, road connectivity
21 Gaagla 47 100 Personal land,
river crossing
pattan
Bridge, road connectivity
22 Haar - - - -
23 Matyal 26 100 Personal land,
river crossing
pattan
Bridge, road connectivity, School
24 B Ghirthan 56 100 Loss of road
connectivity to
other side of
villages located
on the bank of
Pung khud
Bridge connectivity
25 Sujanpur 592 95 House, lift
irrigation and
drinking water
supply, sewerage
scheme
uncultivated land
Monetary compensation and
rehabilitation of irrigation and
drinking water schemes as well as
of sewerage treatment plant
26 Tihra 240 100 Rahni bridge Bridge connectivity
27 Riyah 60 100 Rahni bridge Bridge connectivity
28 Palahi 35 100 Personal and
Govt. grazing
land
Monetary compensation.
Development of equivalent land
for grazing
29 Samona 50 50 Personal and
Govt. grazing
land
Monetary compensation.
Development of equivalent land
for grazing
30 Bir Bagerha 84 100 Personal and
Govt. grazing
land
Monetary compensation.
Development of equivalent land
for grazing
Total 1892 90.00 - -
Source: Field survey/RRA and PRA, 2010
Table 13b Issues raised and interventions suggested by households in project affected villages on RBRB
Sr.
No.
Village Household
s (No.)
HHs in favour
of project (%)
Issues raised Interventions suggested
1 Bulli 35 100 Personal land Monetary compensation and
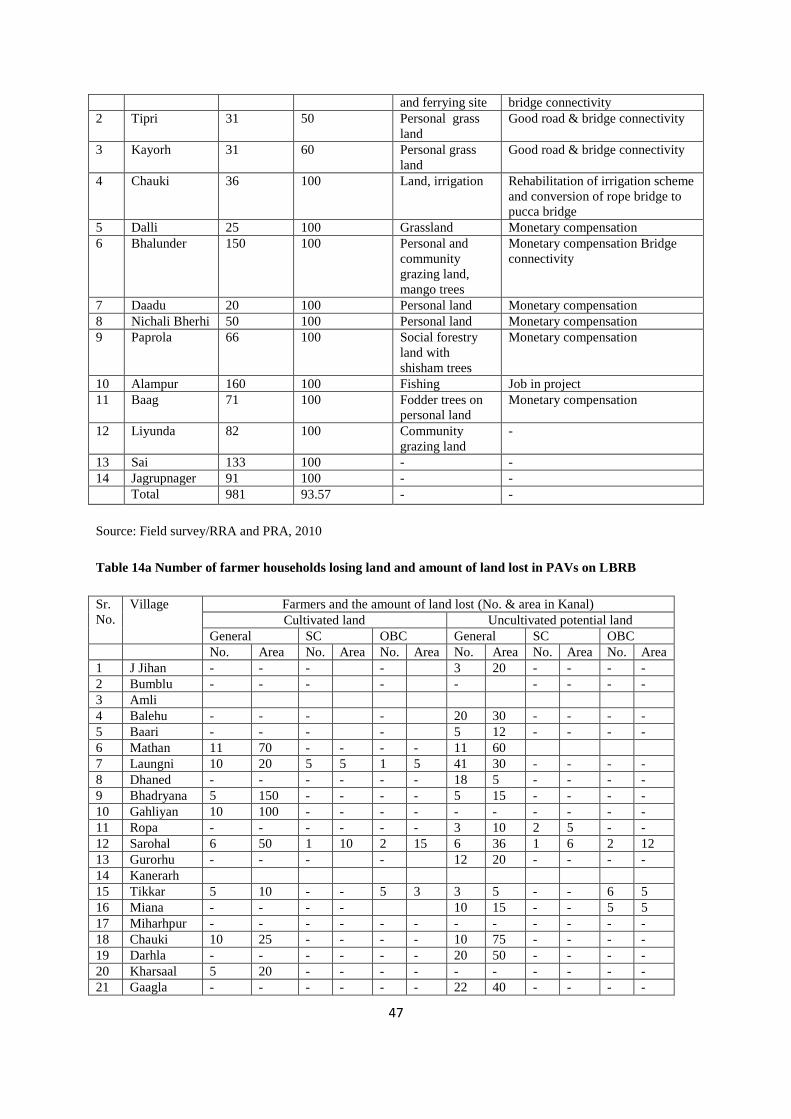
47
and ferrying site bridge connectivity
2 Tipri 31 50 Personal grass
land
Good road & bridge connectivity
3 Kayorh 31 60 Personal grass
land
Good road & bridge connectivity
4 Chauki 36 100 Land, irrigation Rehabilitation of irrigation scheme
and conversion of rope bridge to
pucca bridge
5 Dalli 25 100 Grassland Monetary compensation
6 Bhalunder 150 100 Personal and
community
grazing land,
mango trees
Monetary compensation Bridge
connectivity
7 Daadu 20 100 Personal land Monetary compensation
8 Nichali Bherhi 50 100 Personal land Monetary compensation
9 Paprola 66 100 Social forestry
land with
shisham trees
Monetary compensation
10 Alampur 160 100 Fishing Job in project
11 Baag 71 100 Fodder trees on
personal land
Monetary compensation
12 Liyunda 82 100 Community
grazing land
-
13 Sai 133 100 - -
14 Jagrupnager 91 100 - -
Total 981 93.57 - -
Source: Field survey/RRA and PRA, 2010
Table 14a Number of farmer households losing land and amount of land lost in PAVs on LBRB
Sr.
No.
Village Farmers and the amount of land lost (No. & area in Kanal)
Cultivated land Uncultivated potential land
General SC OBC General SC OBC
No. Area No. Area No. Area No. Area No. Area No. Area
1 J Jihan - - - - 3 20 - - - -
2 Bumblu - - - - - - - - -
3 Amli
4 Balehu - - - - 20 30 - - - -
5 Baari - - - - 5 12 - - - -
6 Mathan 11 70 - - - - 11 60
7 Laungni 10 20 5 5 1 5 41 30 - - - -
8 Dhaned - - - - - - 18 5 - - - -
9 Bhadryana 5 150 - - - - 5 15 - - - -
10 Gahliyan 10 100 - - - - - - - - - -
11 Ropa - - - - - - 3 10 2 5 - -
12 Sarohal 6 50 1 10 2 15 6 36 1 6 2 12
13 Gurorhu - - - - 12 20 - - - -
14 Kanerarh
15 Tikkar 5 10 - - 5 3 3 5 - - 6 5
16 Miana - - - - 10 15 - - 5 5
17 Miharhpur - - - - - - - - - - - -
18 Chauki 10 25 - - - - 10 75 - - - -
19 Darhla - - - - - - 20 50 - - - -
20 Kharsaal 5 20 - - - - - - - - - -
21 Gaagla - - - - - - 22 40 - - - -
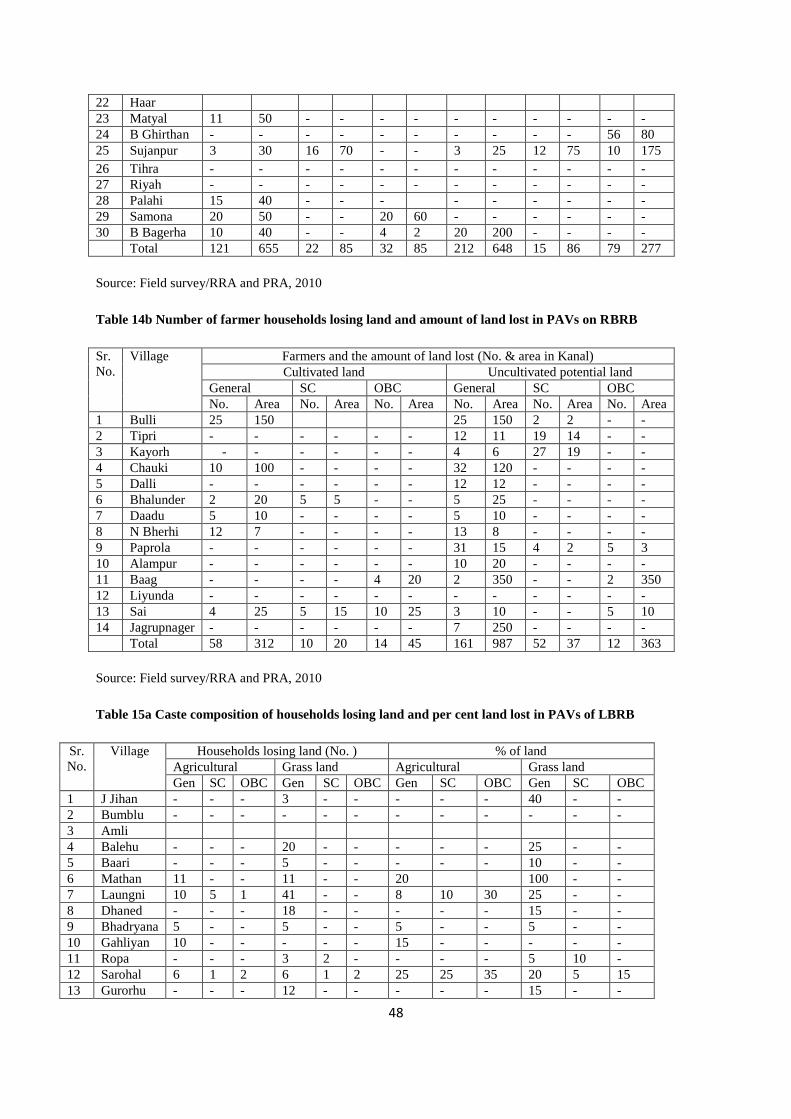
48
22 Haar
23 Matyal 11 50 - - - - - - - - - -
24 B Ghirthan - - - - - - - - - - 56 80
25 Sujanpur 3 30 16 70 - - 3 25 12 75 10 175
26 Tihra - - - - - - - - - - - -
27 Riyah - - - - - - - - - - - -
28 Palahi 15 40 - - - - - - - - -
29 Samona 20 50 - - 20 60 - - - - - -
30 B Bagerha 10 40 - - 4 2 20 200 - - - -
Total 121 655 22 85 32 85 212 648 15 86 79 277
Source: Field survey/RRA and PRA, 2010
Table 14b Number of farmer households losing land and amount of land lost in PAVs on RBRB
Sr.
No.
Village Farmers and the amount of land lost (No. & area in Kanal)
Cultivated land Uncultivated potential land
General SC OBC General SC OBC
No. Area No. Area No. Area No. Area No. Area No. Area
1 Bulli 25 150 25 150 2 2 - -
2 Tipri - - - - - - 12 11 19 14 - -
3 Kayorh - - - - - - 4 6 27 19 - -
4 Chauki 10 100 - - - - 32 120 - - - -
5 Dalli - - - - - - 12 12 - - - -
6 Bhalunder 2 20 5 5 - - 5 25 - - - -
7 Daadu 5 10 - - - - 5 10 - - - -
8 N Bherhi 12 7 - - - - 13 8 - - - -
9 Paprola - - - - - - 31 15 4 2 5 3
10 Alampur - - - - - - 10 20 - - - -
11 Baag - - - - 4 20 2 350 - - 2 350
12 Liyunda - - - - - - - - - - - -
13 Sai 4 25 5 15 10 25 3 10 - - 5 10
14 Jagrupnager - - - - - - 7 250 - - - -
Total 58 312 10 20 14 45 161 987 52 37 12 363
Source: Field survey/RRA and PRA, 2010
Table 15a Caste composition of households losing land and per cent land lost in PAVs of LBRB
Sr.
No.
Village Households losing land (No. ) % of land
Agricultural Grass land Agricultural Grass land
Gen SC OBC Gen SC OBC Gen SC OBC Gen SC OBC
1 J Jihan - - - 3 - - - - - 40 - -
2 Bumblu - - - - - - - - - - - -
3 Amli
4 Balehu - - - 20 - - - - - 25 - -
5 Baari - - - 5 - - - - - 10 - -
6 Mathan 11 - - 11 - - 20 100 - -
7 Laungni 10 5 1 41 - - 8 10 30 25 - -
8 Dhaned - - - 18 - - - - - 15 - -
9 Bhadryana 5 - - 5 - - 5 - - 5 - -
10 Gahliyan 10 - - - - - 15 - - - - -
11 Ropa - - - 3 2 - - - - 5 10 -
12 Sarohal 6 1 2 6 1 2 25 25 35 20 5 15
13 Gurorhu - - - 12 - - - - - 15 - -
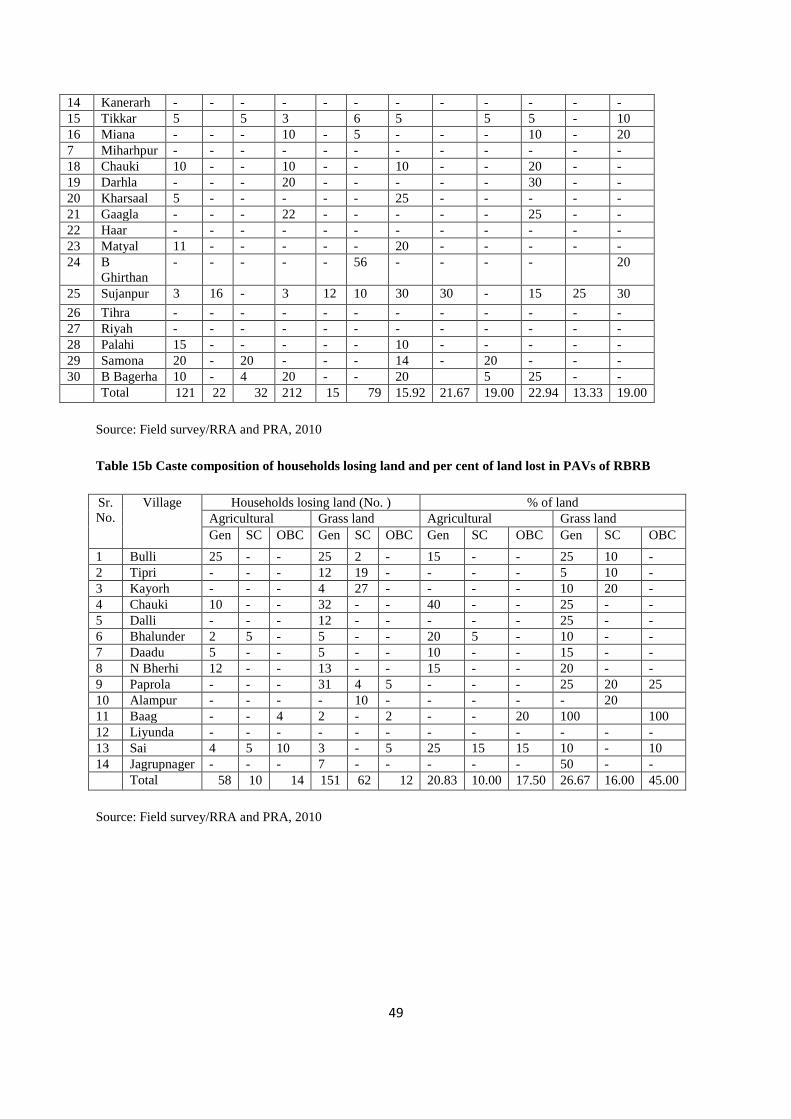
49
14 Kanerarh - - - - - - - - - - - -
15 Tikkar 5 5 3 6 5 5 5 - 10
16 Miana - - - 10 - 5 - - - 10 - 20
7 Miharhpur - - - - - - - - - - - -
18 Chauki 10 - - 10 - - 10 - - 20 - -
19 Darhla - - - 20 - - - - - 30 - -
20 Kharsaal 5 - - - - - 25 - - - - -
21 Gaagla - - - 22 - - - - - 25 - -
22 Haar - - - - - - - - - - - -
23 Matyal 11 - - - - - 20 - - - - -
24 B
Ghirthan
- - - - - 56 - - - - 20
25 Sujanpur 3 16 - 3 12 10 30 30 - 15 25 30
26 Tihra - - - - - - - - - - - -
27 Riyah - - - - - - - - - - - -
28 Palahi 15 - - - - - 10 - - - - -
29 Samona 20 - 20 - - - 14 - 20 - - -
30 B Bagerha 10 - 4 20 - - 20 5 25 - -
Total 121 22 32 212 15 79 15.92 21.67 19.00 22.94 13.33 19.00
Source: Field survey/RRA and PRA, 2010
Table 15b Caste composition of households losing land and per cent of land lost in PAVs of RBRB
Sr.
No.
Village Households losing land (No. ) % of land
Agricultural Grass land Agricultural Grass land
Gen SC OBC Gen SC OBC Gen SC OBC Gen SC OBC
1 Bulli 25 - - 25 2 - 15 - - 25 10 -
2 Tipri - - - 12 19 - - - - 5 10 -
3 Kayorh - - - 4 27 - - - - 10 20 -
4 Chauki 10 - - 32 - - 40 - - 25 - -
5 Dalli - - - 12 - - - - - 25 - -
6 Bhalunder 2 5 - 5 - - 20 5 - 10 - -
7 Daadu 5 - - 5 - - 10 - - 15 - -
8 N Bherhi 12 - - 13 - - 15 - - 20 - -
9 Paprola - - - 31 4 5 - - - 25 20 25
10 Alampur - - - - 10 - - - - - 20
11 Baag - - 4 2 - 2 - - 20 100 100
12 Liyunda - - - - - - - - - - - -
13 Sai 4 5 10 3 - 5 25 15 15 10 - 10
14 Jagrupnager - - - 7 - - - - - 50 - -
Total 58 10 14 151 62 12 20.83 10.00 17.50 26.67 16.00 45.00
Source: Field survey/RRA and PRA, 2010

50
Table 16a Households losing livelihoods and the extent of loss across PAVs on LBRB
Sr.
No
Village Households Losing livelihoods (No. & income in Rs. per year)
Agriculture Business Rural craft
General SC OBC General SC OBC General SC OBC
No Income No Income No. Income No. Income No Income No. Income No. Income No. Income No. Income
1 J Jihan - - - - - - - - - - - -
2 Bumblu - - - - - - - - - - - - - - - - - -
3 Amli
4 Balehu - - - - - - - - - - - - - - - - - -
5 Baari - - - - - - - - - - - - 2 9000 - - - -
6 Mathan 11 145250 - - - - - - - - - - - - - - - -
7 Laungni 10 40600 5 10150 1 2030 - - 1 36000 - - - - 2 42000 - -
8 Dhaned - - - - - - - - - - - - - - - - - -
9 Bhadryana 5 33000 - - - - - - - - - - - - - - - -
10 Gahliyan 10 152000 - - - - - - - - - - - - - - - -
11 Ropa - - - - - - - - - - - - - - - - - -
12 Sarohal 6 110000 1 22000 2 33000 2 180000 2 180000 - - - - - - - -
13 Gurorhu - - - - - - - - - - - - - - - - - -
14 Kanerarh
15 Tikkar 5 16500 - - 5 4750 - - - - - - - - - - - -
16 Miana - - - - - - - - - - - - - - - - -
17 Miharhpur - - - - - - - - - - - - - - - - -
18 Chauki 10 55000 - - - - - - - - - - - - - - - -
19 Darhla - - - - - - 1 81000 - - - - - - - - - -
20 Kharsaal 5 66000 - - - - 2 100000 - - - - - - - - - -
21 Gaagla - - - - - - - - - - - - - - - - - -
22 Haar
23 Matyal 11 98000 - - - - - - - - - - - - - - - -
24 B Ghirthan - - - - - - - - - - 1 95000 - - - - - -
25 Sujanpur 3 58125 16 207373 0 0 0 0 4 120000 0 0 0 0 1 6000 0
26 Tihra - - - - - - - - - - - - - - 10 24000 - -
27 Riyah - - - - - - - - - - - - - - 2 4800 - -
28 Palahi 15 98000 - - - - - - - - - - - - - - - -
29 Samona 20 83000 - - 20 90700 - - - - - - - - - - - -
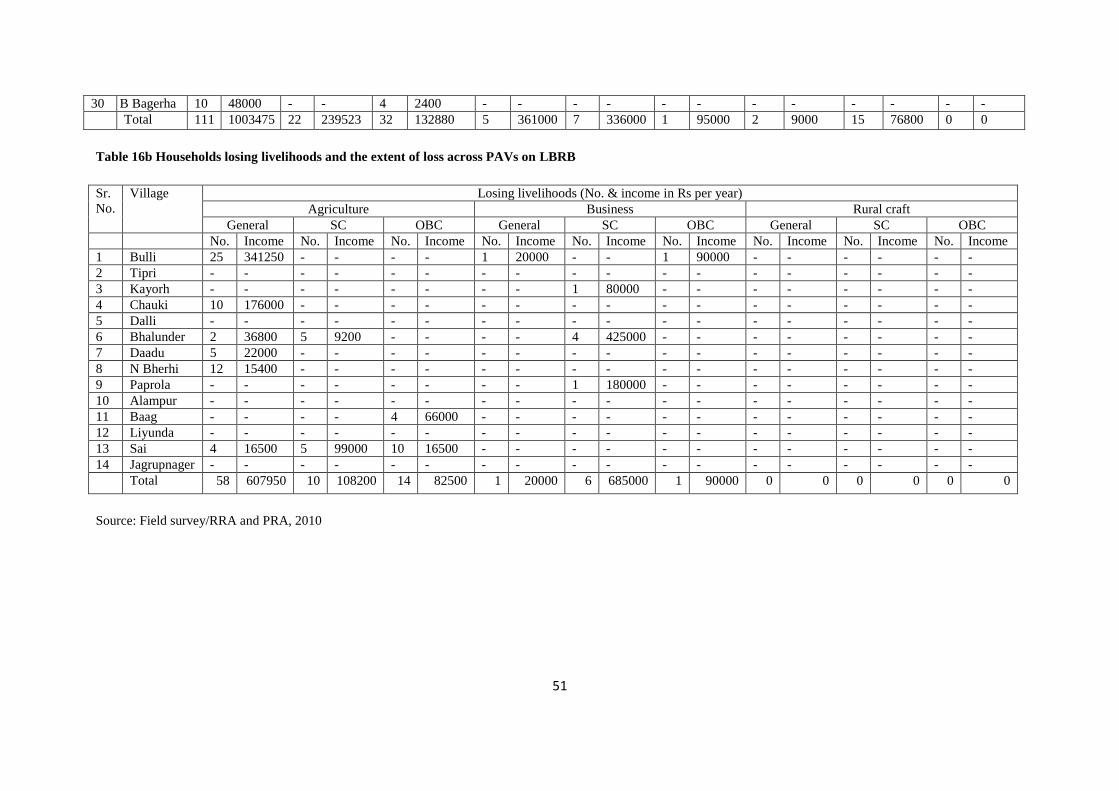
51
30 B Bagerha 10 48000 - - 4 2400 - - - - - - - - - - - -
Total 111 1003475 22 239523 32 132880 5 361000 7 336000 1 95000 2 9000 15 76800 0 0
Table 16b Households losing livelihoods and the extent of loss across PAVs on LBRB
Sr.
No.
Village Losing livelihoods (No. & income in Rs per year)
Agriculture Business Rural craft
General SC OBC General SC OBC General SC OBC
No. Income No. Income No. Income No. Income No. Income No. Income No. Income No. Income No. Income
1 Bulli 25 341250 - - - - 1 20000 - - 1 90000 - - - - - -
2 Tipri - - - - - - - - - - - - - - - - - -
3 Kayorh - - - - - - - - 1 80000 - - - - - - - -
4 Chauki 10 176000 - - - - - - - - - - - - - - - -
5 Dalli - - - - - - - - - - - - - - - - - -
6 Bhalunder 2 36800 5 9200 - - - - 4 425000 - - - - - - - -
7 Daadu 5 22000 - - - - - - - - - - - - - - - -
8 N Bherhi 12 15400 - - - - - - - - - - - - - - - -
9 Paprola - - - - - - - - 1 180000 - - - - - - - -
10 Alampur - - - - - - - - - - - - - - - - - -
11 Baag - - - - 4 66000 - - - - - - - - - - - -
12 Liyunda - - - - - - - - - - - - - - - - - -
13 Sai 4 16500 5 99000 10 16500 - - - - - - - - - - - -
14 Jagrupnager - - - - - - - - - - - - - - - - - -
Total 58 607950 10 108200 14 82500 1 20000 6 685000 1 90000 0 0 0 0 0 0
Source: Field survey/RRA and PRA, 2010
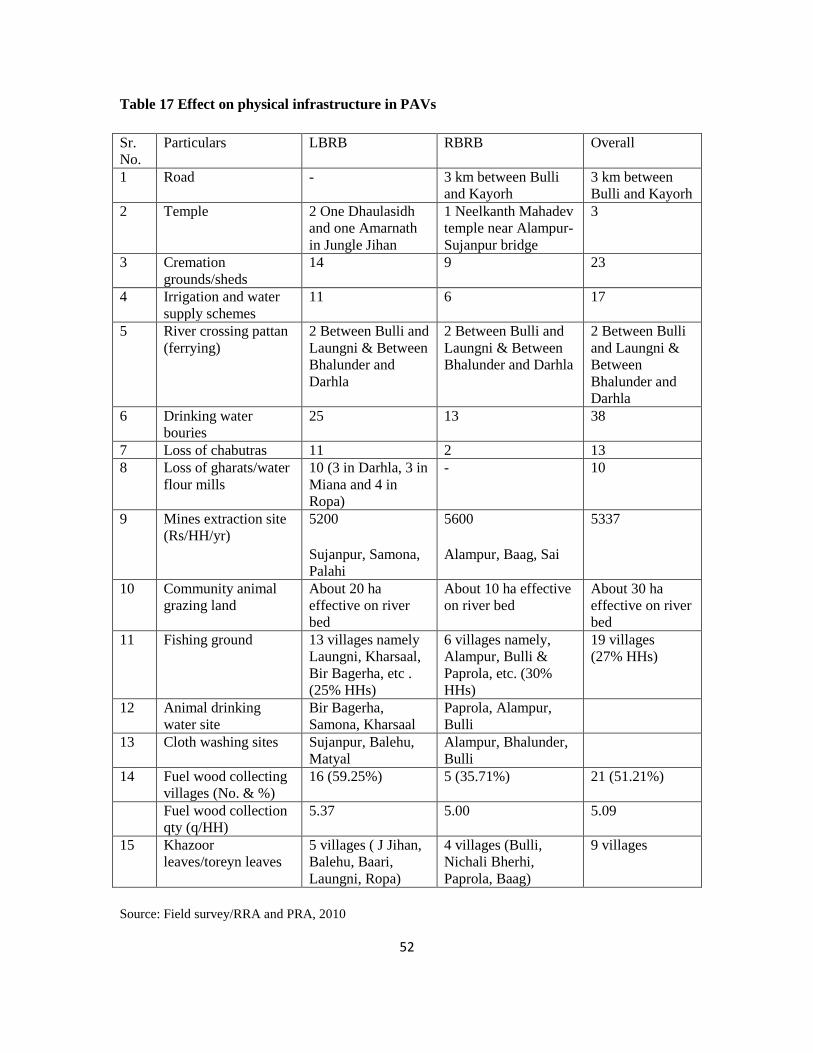
52
Table 17 Effect on physical infrastructure in PAVs
Sr.
No.
Particulars LBRB RBRB Overall
1 Road - 3 km between Bulli
and Kayorh
3 km between
Bulli and Kayorh
2 Temple 2 One Dhaulasidh
and one Amarnath
in Jungle Jihan
1 Neelkanth Mahadev
temple near Alampur-
Sujanpur bridge
3
3 Cremation
grounds/sheds
14 9 23
4 Irrigation and water
supply schemes
11 6 17
5 River crossing pattan
(ferrying)
2 Between Bulli and
Laungni & Between
Bhalunder and
Darhla
2 Between Bulli and
Laungni & Between
Bhalunder and Darhla
2 Between Bulli
and Laungni &
Between
Bhalunder and
Darhla
6 Drinking water
bouries
25 13 38
7 Loss of chabutras 11 2 13
8 Loss of gharats/water
flour mills
10 (3 in Darhla, 3 in
Miana and 4 in
Ropa)
- 10
9 Mines extraction site
(Rs/HH/yr)
5200
Sujanpur, Samona,
Palahi
5600
Alampur, Baag, Sai
5337
10 Community animal
grazing land
About 20 ha
effective on river
bed
About 10 ha effective
on river bed
About 30 ha
effective on river
bed
11 Fishing ground 13 villages namely
Laungni, Kharsaal,
Bir Bagerha, etc .
(25% HHs)
6 villages namely,
Alampur, Bulli &
Paprola, etc. (30%
HHs)
19 villages
(27% HHs)
12 Animal drinking
water site
Bir Bagerha,
Samona, Kharsaal
Paprola, Alampur,
Bulli
13 Cloth washing sites Sujanpur, Balehu,
Matyal
Alampur, Bhalunder,
Bulli
14 Fuel wood collecting
villages (No. & %)
16 (59.25%) 5 (35.71%) 21 (51.21%)
Fuel wood collection
qty (q/HH)
5.37 5.00 5.09
15 Khazoor
leaves/toreyn leaves
5 villages ( J Jihan,
Balehu, Baari,
Laungni, Ropa)
4 villages (Bulli,
Nichali Bherhi,
Paprola, Baag)
9 villages
Source: Field survey/RRA and PRA, 2010

53
Table 18 Details of the public operated irrigation cum public health water supply schemes
affected by the project
Sr.
No.
Name of Scheme Location Villages
served
(No.)
Population
served
(No.)/Area
irrigated
Estimated
Cost
( LakhRs)
Re-
habitation
Cost (Lakh
Rs)
1 Lift Irrigation
Scheme, Bulli
District
Kangra
NA NA NA NA
2 LWS Scheme,
Dalli & Bhalunder
District
Kangra
NA NA NA NA
3 Lift Water Supply
Scheme, Sihorwala
District
Kangra
NA NA NA NA
4 LWS Scheme,
Daadu &
Bhalunder
District
Kangra
NA NA NA NA
5 Lift Water Supply
Scheme, Alampur
District
Kangra
NA NA NA NA
6 LWS Scheme,
Bheri & Balakrupi
District
Kangra
NA NA NA NA
7 Water supply
Scheme, Rangar &
Dadarmiyana
District
Hamirpur
20 2124 20.00 30.00
8 LWS Scheme,
Tihra & Bandoh
District
Hamirpur
5 910 25.00 35.00
9 Lift Irrigation
Scheme, Samona &
Palahi
District
Hamirpur
NA NA NA NA
10 Lift Water Supply
Scheme, Sujanpur
District
Hamirpur
1 9596 100.00 205.00
11 Lift Irrigation
Scheme, Dolli
District
Hamirpur
1 97 ha 10.00 27.00
12 Lift Irrigation
Scheme, Bhaleth
District
Hamirpur
5 86 ha 8.00 25.00
13 Lift Irrigation
Scheme,
Bhadaryana
District
Hamirpur
2 30 ha 5.00 15.00
14 LWS Scheme,
Laungni Mathan
District
Hamirpur
NA NA NA NA
15 Lift Irrigation
Scheme, Laungni
Mathan
District
Hamirpur
2 36 ha 5.00 20.00
16 Lift Water Supply
Scheme,Karot,
District
Hamirpur
6 4500 5.00 30.00
17 LWS Scheme,
Bhaleth & Balla
Rathian
District
Hamirpur
14 2696 18.00 25.00
Source: Field survey/RRA and PRA, 2010
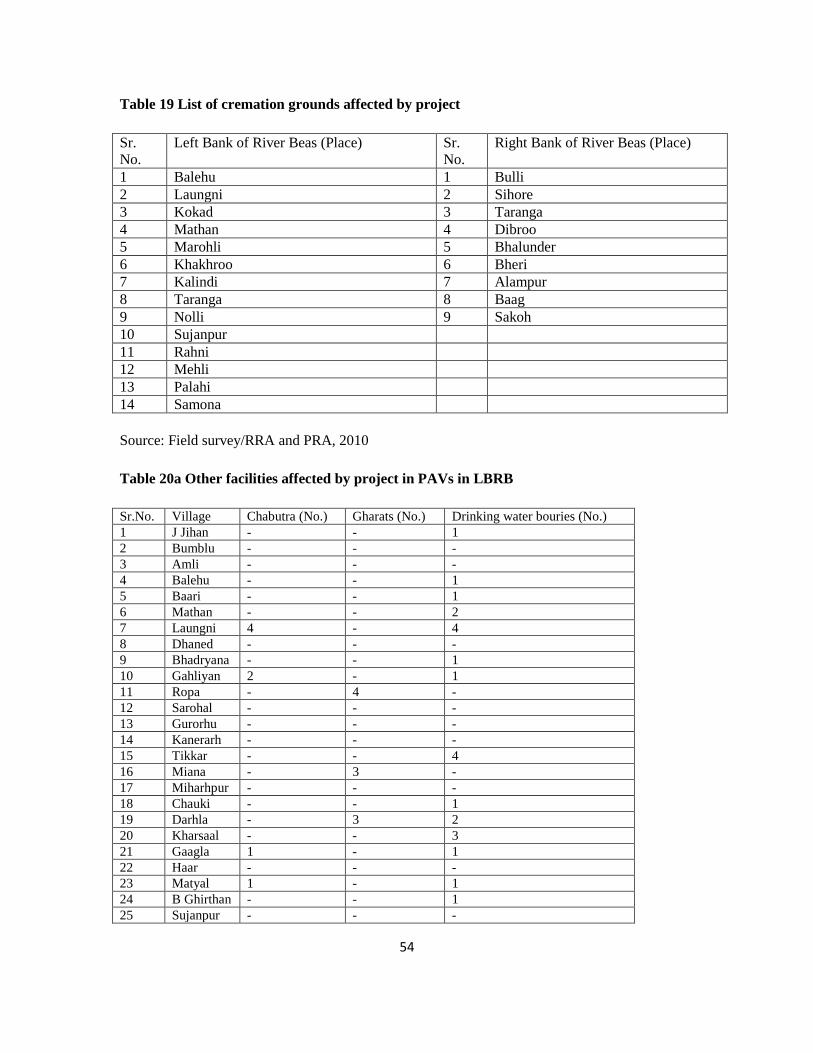
54
Table 19 List of cremation grounds affected by project
Sr.
No.
Left Bank of River Beas (Place) Sr.
No.
Right Bank of River Beas (Place)
1 Balehu 1 Bulli
2 Laungni 2 Sihore
3 Kokad 3 Taranga
4 Mathan 4 Dibroo
5 Marohli 5 Bhalunder
6 Khakhroo 6 Bheri
7 Kalindi 7 Alampur
8 Taranga 8 Baag
9 Nolli 9 Sakoh
10 Sujanpur
11 Rahni
12 Mehli
13 Palahi
14 Samona
Source: Field survey/RRA and PRA, 2010
Table 20a Other facilities affected by project in PAVs in LBRB
Sr.No. Village Chabutra (No.) Gharats (No.) Drinking water bouries (No.)
1 J Jihan - - 1
2 Bumblu - - -
3 Amli - - -
4 Balehu - - 1
5 Baari - - 1
6 Mathan - - 2
7 Laungni 4 - 4
8 Dhaned - - -
9 Bhadryana - - 1
10 Gahliyan 2 - 1
11 Ropa - 4 -
12 Sarohal - - -
13 Gurorhu - - -
14 Kanerarh - - -
15 Tikkar - - 4
16 Miana - 3 -
17 Miharhpur - - -
18 Chauki - - 1
19 Darhla - 3 2
20 Kharsaal - - 3
21 Gaagla 1 - 1
22 Haar - - -
23 Matyal 1 - 1
24 B Ghirthan - - 1
25 Sujanpur - - -
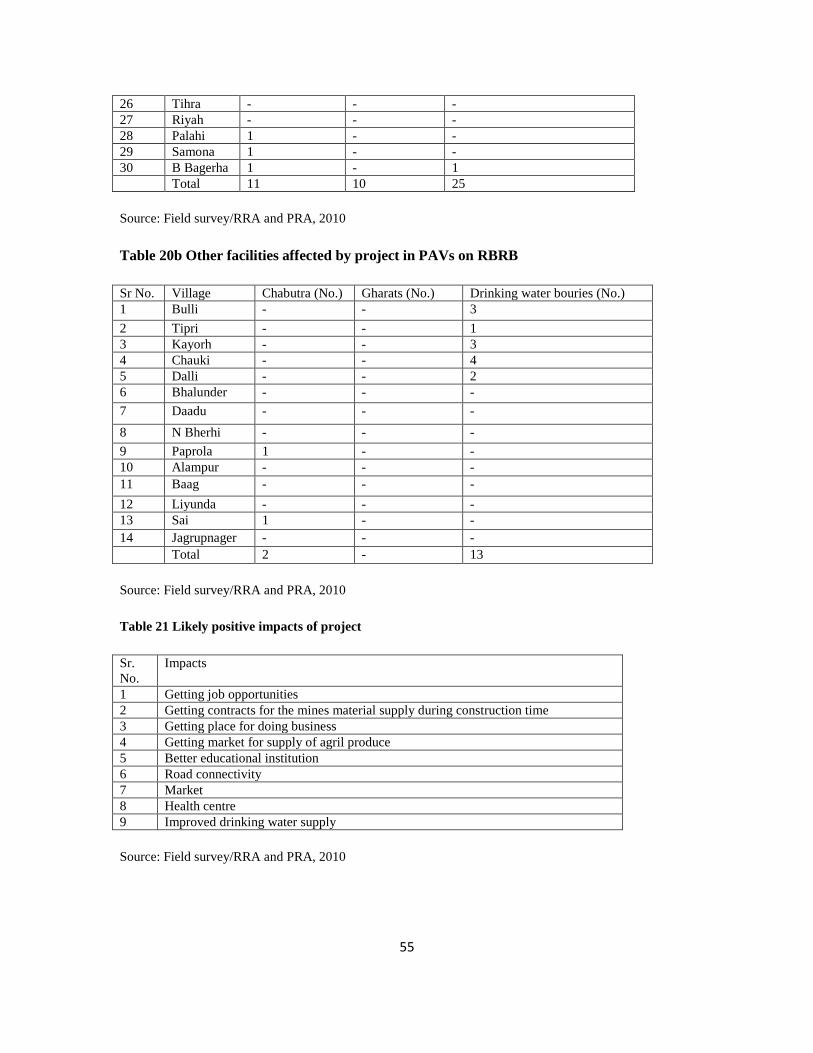
55
26 Tihra - - -
27 Riyah - - -
28 Palahi 1 - -
29 Samona 1 - -
30 B Bagerha 1 - 1
Total 11 10 25
Source: Field survey/RRA and PRA, 2010
Table 20b Other facilities affected by project in PAVs on RBRB
Sr No. Village Chabutra (No.) Gharats (No.) Drinking water bouries (No.)
1 Bulli - - 3
2 Tipri - - 1
3 Kayorh - - 3
4 Chauki - - 4
5 Dalli - - 2
6 Bhalunder - - -
7 Daadu - - -
8 N Bherhi - - -
9 Paprola 1 - -
10 Alampur - - -
11 Baag - - -
12 Liyunda - - -
13 Sai 1 - -
14 Jagrupnager - - -
Total 2 - 13
Source: Field survey/RRA and PRA, 2010
Table 21 Likely positive impacts of project
Sr.
No.
Impacts
1 Getting job opportunities
2 Getting contracts for the mines material supply during construction time
3 Getting place for doing business
4 Getting market for supply of agril produce
5 Better educational institution
6 Road connectivity
7 Market
8 Health centre
9 Improved drinking water supply
Source: Field survey/RRA and PRA, 2010
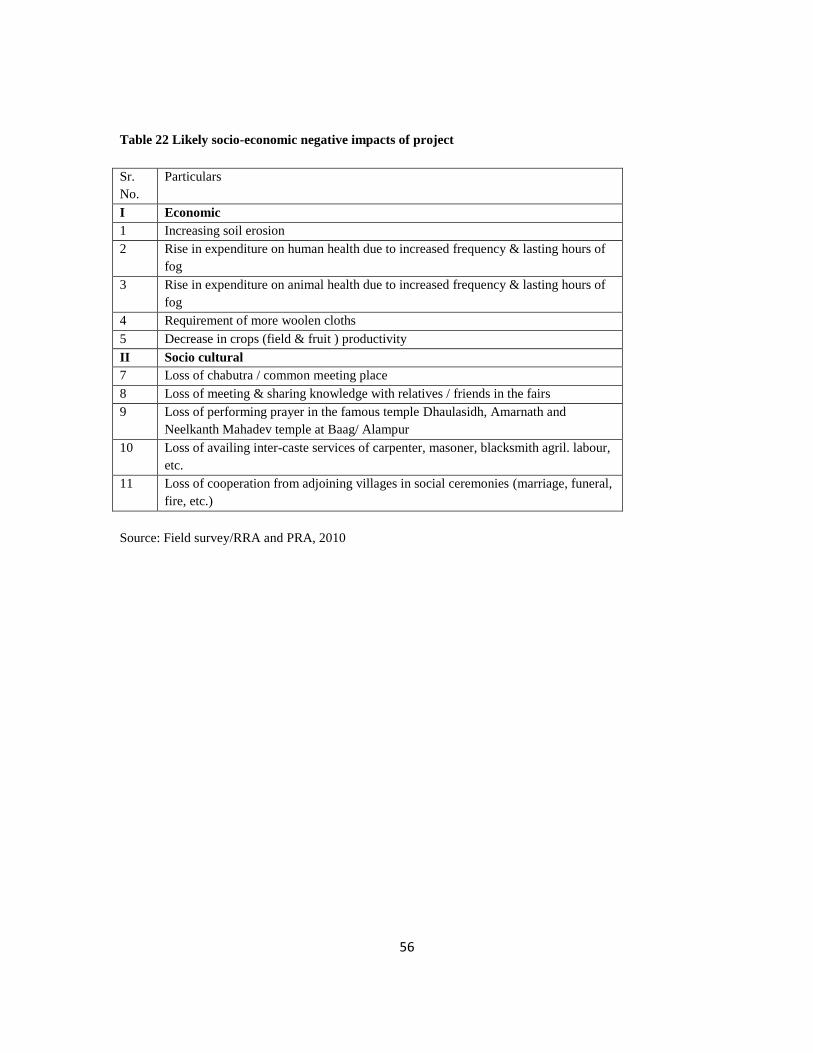
56
Table 22 Likely socio-economic negative impacts of project
Sr.
No.
Particulars
I Economic
1 Increasing soil erosion
2 Rise in expenditure on human health due to increased frequency & lasting hours of
fog
3 Rise in expenditure on animal health due to increased frequency & lasting hours of
fog
4 Requirement of more woolen cloths
5 Decrease in crops (field & fruit ) productivity
II Socio cultural
7 Loss of chabutra / common meeting place
8 Loss of meeting & sharing knowledge with relatives / friends in the fairs
9 Loss of performing prayer in the famous temple Dhaulasidh, Amarnath and
Neelkanth Mahadev temple at Baag/ Alampur
10 Loss of availing inter-caste services of carpenter, masoner, blacksmith agril. labour,
etc.
11 Loss of cooperation from adjoining villages in social ceremonies (marriage, funeral,
fire, etc.)
Source: Field survey/RRA and PRA, 2010
57
Section III
3.3 INTANGIBLE GAINS /LOSSES
In this section an attempt has been made to highlight the expected intangible gains and
losses of the proposed Dhaulasidh hydro electric project.
3.3.1 Expected environmental/ecological impact
The recharge of aquifers in the drying hand pumps installed in almost all the villages, the
drinking water supplies, the lift irrigation schemes installed particularly in Balehu,
Laungni and Bhalunder and the water bouries is expected to increase consequent to the
construction of the project. Migratory birds will be attracted towards the dam area.
Besides, low and cool climate during summer, rise in rainfall, the appearance of different
flowers along the dam area and introduction of cat fishes like Rohu, Catla, Singhara are
other positive intangible effects. The increase in the panoramic view of the area as result
of the construction of the dam would be yet another positive externality (Table23).
Increased risk of accidents due to slipping away along the dam area while cutting
grass/lopping trees and grazing animals will be one of the negative effects. Such
incidents have been reported in Govind Sagar dam where similar type of dam with
straight cliffs has been created. People of the PAVs have also apprehensions about the
substantial increase in the population of snakes and other dangerous reptiles, the insect-
pests; etc after the construction of dam. The still water and obstruction in the water ways
will drastically reduce the population of fishes, particularly of Mahseer, which prefer
running and gushing water (Table 24). Mahseer population in the river Beas is adequate
and the local fish eaters have liking for this fish. The breeding sites in the nearby Neugal
and Pung khuds will be inundated in water which would lead to its extinction. The
probability of animal and plant diseases and insects would be enhanced which would
have negative ecological and environmental impacts. The tangible costs of all these
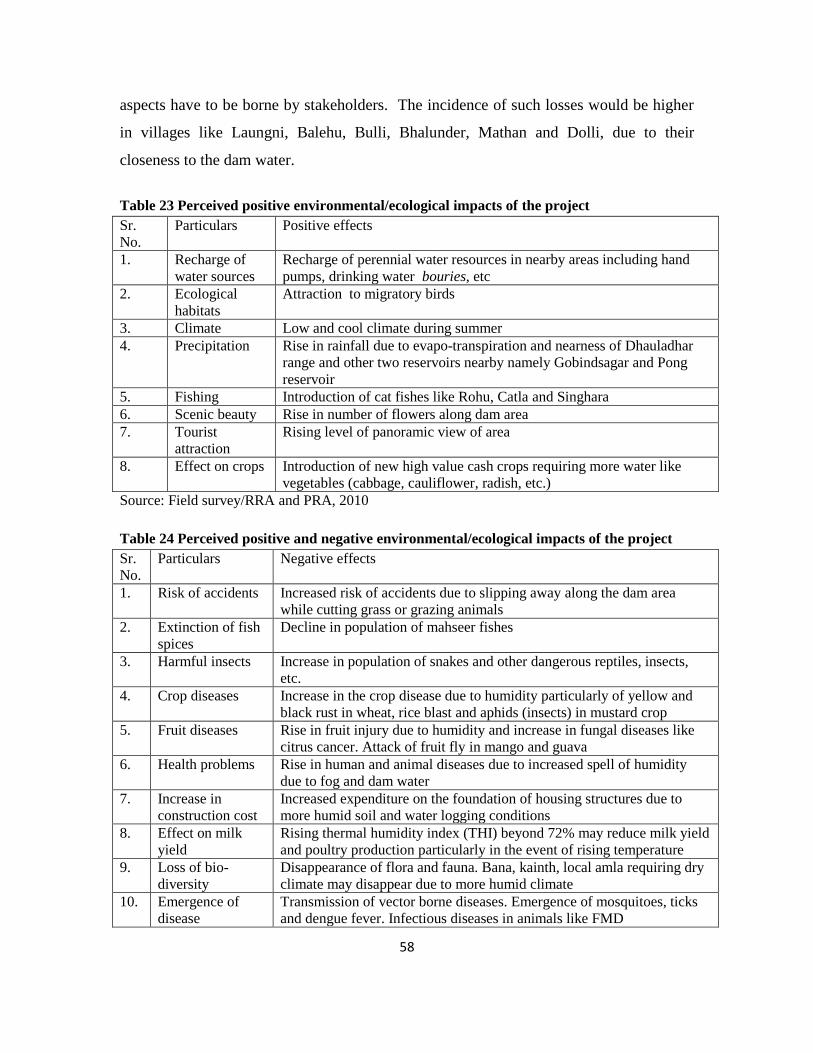
58
aspects have to be borne by stakeholders. The incidence of such losses would be higher
in villages like Laungni, Balehu, Bulli, Bhalunder, Mathan and Dolli, due to their
closeness to the dam water.
Table 23 Perceived positive environmental/ecological impacts of the project
Sr.
No.
Particulars Positive effects
1. Recharge of
water sources
Recharge of perennial water resources in nearby areas including hand
pumps, drinking water bouries, etc
2. Ecological
habitats
Attraction to migratory birds
3. Climate Low and cool climate during summer
4. Precipitation Rise in rainfall due to evapo-transpiration and nearness of Dhauladhar
range and other two reservoirs nearby namely Gobindsagar and Pong
reservoir
5. Fishing Introduction of cat fishes like Rohu, Catla and Singhara
6. Scenic beauty Rise in number of flowers along dam area
7. Tourist
attraction
Rising level of panoramic view of area
8. Effect on crops Introduction of new high value cash crops requiring more water like
vegetables (cabbage, cauliflower, radish, etc.)
Source: Field survey/RRA and PRA, 2010
Table 24 Perceived positive and negative environmental/ecological impacts of the project
Sr.
No.
Particulars Negative effects
1. Risk of accidents Increased risk of accidents due to slipping away along the dam area
while cutting grass or grazing animals
2. Extinction of fish
spices
Decline in population of mahseer fishes
3. Harmful insects Increase in population of snakes and other dangerous reptiles, insects,
etc.
4. Crop diseases Increase in the crop disease due to humidity particularly of yellow and
black rust in wheat, rice blast and aphids (insects) in mustard crop
5. Fruit diseases Rise in fruit injury due to humidity and increase in fungal diseases like
citrus cancer. Attack of fruit fly in mango and guava
6. Health problems Rise in human and animal diseases due to increased spell of humidity
due to fog and dam water
7. Increase in
construction cost
Increased expenditure on the foundation of housing structures due to
more humid soil and water logging conditions
8. Effect on milk
yield
Rising thermal humidity index (THI) beyond 72% may reduce milk yield
and poultry production particularly in the event of rising temperature
9. Loss of bio-
diversity
Disappearance of flora and fauna. Bana, kainth, local amla requiring dry
climate may disappear due to more humid climate
10. Emergence of
disease
Transmission of vector borne diseases. Emergence of mosquitoes, ticks
and dengue fever. Infectious diseases in animals like FMD

59
Source: Field survey/RRA and PRA, 2010
Chapter 4
SUMMARY AND CONCLUSION
4.1 Background
The proposed Dhaulasidh Hydro Electric Project (DHEP), under construction by the
Satluj Jal Vidyut Nigam (SJVN) Limited will come up on the river Beas with a dam near
famous temple Dhaulasidh and villages Jungle Jihan on the left bank and Bulli on the
right bank in district Hamirpur and Kangra, respectively. Pung khud near Bhaleth and
Neugal khud near Sujanpur Tira will be the two main perennial tributaries of Beas joining
the dam area. According to local people a project of similar kind was first proposed to be
constructed way back during British period and later in 1960 before the introduction of
BSL project and the Pong dam project. As many as 44 villages (3 uninhabited and 41
inhabited) would be affected because of the construction of the project. The project will
have both positive and negative socio-economic-cultural-environmental/ecological
impacts on the population of the affected villages. The present study attempts to examine
different kinds of impacts and their implications towards livelihoods of the affected
population. In brief, the objectives of the study are listed below.
4.2 Objectives
To carry out socio- economic, cultural and political/institutional analysis; and to identify
potential social impacts of the proposed development of the project.
To identify principal stakeholders and develop a consultation framework for
participatory implementation;

60
To assess likely social and economic impacts during the construction phase and after the
project completion;
To ascertain social development issues in the affected area vicinity and design social
services that may be provided by the project in order to improve the quality of life of
affected people and achieve the projects’ economic and social goals;
4.3 Methodology
The study is based on both primary and secondary data collected from the stake holders
and farmers affected directly and indirectly in the Project Affected Villages (PAVs). A
complete list of affected villages was acquired from the SJVN Limited, Hamirpur. A
detailed schedule/questionnaire was prepared and pre-tested before actually starting the
data collection. A copy of the questionnaire was also mailed to the funding agency for
comments and feed back during July, 2010. The data for this study have been collected
following both personal interview and PRA approaches. The interviewees included
members of PRI, Mahila Mandals, informed and knowledgeable persons and public
officials working at grassroots level. The data have been analyzed using simple statistical
tools like averages and percentages. The results have been presented in as many as 46
tables in the text and 3 tables in the appendix. Figures and photographs to support the
data presented in tables have also been given.
4.4 Main findings
The number of project affected villages in DHEP is 30 (27 inhabited and 3
uninhabited) on the left side and 14 on the right side of river Beas. The
topography of project affected villages is hilly to plain. The villages situated on
left side are the segments of 11panchayats while those located on the left side are
part of 8 panchayats. The number of mahila mandals and youth club village
institutions in the affected villages is 38 and 5, respectively. As many as 12
farmers’ groups mostly of vegetable growers are functioning in the project
61
affected area. A very high percentage (91%) of households is in favour of the
project.
There are 2873 households (comprising 1892 on the left side and 981 on the right
side) in the project affected villages. Of the total farmers, 94.50% belong to small
and marginal category. Similarly, about 69% households were above poverty line
(APL) whereas 31% were below poverty line (BPL).The proportion of BPL
households was higher on right bank of river beas. The households headed by
vulnerable persons accounted for 6.33% of the total households and the
proportion of such households was marginally higher among villages on the right
bank of river as compared to those on the left bank.
Out of total households, 713 households (440 on LBRB and 273 on RBRB) will
be directly affected due to project activities i.e. in terms of losing land and
livelihoods.
The number of persons affected by project will be 3613 with an average family
size of 5.06. The total population of all project affected villages will be 13188
with an average family size of 4.59 persons. Overall literacy rate was 88% which
was higher (94%) among households of general category followed by 85%
among households of scheduled caste and 84% among those of OBCs.
Nearly 54% houses were kuchha while the remaining were pucca houses. All the
households in PAVs collected building material from the river bed and nearby
khuds which in monetary terms amounted to Rs 5337 per household per annum.
More than four-fifths of (81%) households reared livestock whose average
number per household was about 2 animals. Among animals, buffalo of murrah
breed were common milch animals. In cattle, cross bred cows were more popular.
However the average yield of milk was more in case of buffalo than cow. At the
overall level, 71% households reared buffaloes with highest percentage of 78 on
the left side followed by 56% on the right bank. Cows were maintained by 19%
of households while the percentage households owning cow was significantly
higher at 29% on right bank. Bullocks were maintained by 12% households in
villages of both sides of river. Sheep and goats were maintained by 23% of
62
households with larger proportion (29%) on the left side particularly in villages
like Bumblu, Tikkar and Gurorhu.
Wheat, maize and paddy were important cereals grown in the area. Among fruits
mango (Indigenous and improved varieties), papaya, indigenous banana were
more common.
In terms of infrastructure, the villages on left side had better access compared to
those on the right bank. Further while on the left bank, the infrastructure facilities
were located within the reach of 2-3 km, these were available within a reach of 4-
5 kilometres on the right bank.
Due to submergence of area in dam water, 23 cremation ground/sheds (14 on the
left side and 9 on the right side) will be affected.
Likewise, 17 water supply (irrigation cum drinking water) schemes will be
affected on both sides of river Beas.
In all 3 temples 2 on the left side (Dhaulasidh and Amarnath) and 1 on the right
side (Neelkanth Mahadev temple near Alampur in Baag village) would be
affected.
Recharge of water in perennial sources, introduction of migration birds, cat fishes
like rohu, cattle and singhara will be some of the positive affects of the project.
Decline in population of mahseer fishes, increase in the incidence of insects-pest
and diseases in crops, livestock and human being would be some of the important
negative affects of DHEP.
4.5 Suggested solutions to safeguard livelihoods
The present section presents some suggested interventions for securing/minimizing the
adverse effect on the livelihoods of farmers residing in the project affected villages who
are affected either directly or indirectly. Interviews with stakeholders comprising farming
community, PRI functionaries, Mahila Mandal members, youth club members, public
servants like teachers, IPH/PWD engineers, administrators and media persons revealed
that community level infrastructure like upgradation of ITI college at Sujanpur to
Polytechnic level, establishment of ITI College at Sihorewala and creation of PHC,
63
Mobile Van, LPG supply depot, agricultural/horticultural service centre and marketing
yard at Karot suits to many PAVs located on either bank (Table 25).
There is also a dire need to construct at least rope bridges between Laungni/Mathan and
Bulli and between Gaagla and Bhalunder and construction of pucca motorable bridge
between Chauki and Bhaleth to have on easy access for the speedy development of
villages located on right bank who have suffered due to their locational disadvantage.
An alternative road to Dhaulasidh temple should be constructed because the road which
is presently followed from Salasi via Amli by the people to offer prayer, particularly on
every Thursday, will submerge in the dam water. The other approach to this temple is
from Phou village but because of its steep gradient it is difficult for the children and aged
persons. As the project has been named after Dhaulasidh, good infrastructure like road,
staying place, drinking water facility, etc needs to be created around this temple.
All the project affected families should be given adequate cash compensation before the
start of work. Since the farmers will be facing shortage of grazing land and grasslands on
account of project execution, fodder bank should be established to meet the fodder
shortages. The project affected family members be given preference in the job that would
become available because of dam construction. It will be better if a regular flow of
income from the project is disbursed among the families in lieu of one time cash
compensation for the acquired land. This will protect the interests of PAFs on long term
and sustainable basis.
Irrigation facilities need to be provided to all the project affected villages for agricultural
development to enhance income and employment of local people.
Enterprises like beekeeping, sericulture, mushroom farming and dairy farming which
have potential should be promoted to enhance avenues of income and employment.
Technical vocational training should be provided to promote rural craft like making
bamboo basket, leaf plates, broom and mat, chhaj and also in knitting, weaving, tailoring
should be provided along with marketing assistance.
64
The project affected families needing land in exchange of land be given in the same
village of comparable quality. The project affected households losing houses, though
negligible, should be provided constructed houses with same accommodation and near to
their original villages or should be given adequate monetary compensation for the
construction of a new house valued at current prices. .
Local youths particularly in PAFs need to be given preference in allotting shops near the
project colonies/ offices. All the PAVs should be provided with good street lights, roads,
toilet and sewerage facilities, etc.
Good portion of the thick forest cover along the river Beas will be affected which would
have adverse affect on the ecology (flora and fauna). It is suggested that double of this
area be identified nearby to bring it under forestry of the same species fulfilling the
demand for fodder, fuel wood and timber. The families of fisherman be allowed to catch
fish in the dam area and the fishermen should be provided with boats and gillnets.
In net terms, the results of the social impact study, based on comprehensive and detailed
discussions/interviews with all categories of stakeholders in the project affected villages
(Table 26), clearly show that the proposed project enjoys an overwhelming support
among all concerned. This is primarily due to the fact that unlike other projects of such
type, the DHEP would not have significant adverse affect on the livelihoods of the
affected people in terms of loss of their productive/agricultural land and residential
houses. Further, though the project would have some negative economic and
environmental/ecological effects like loss of grazing land and access to infrastructural
facilities, these adverse effects can be mitigated through making right kind of
interventions as suggested above.
Table 25 Prioritizations of facilities as per peoples view points (Ranks)
Sr. Particulars LBRB RBRB
1 Better education ( up gradation of ITI to Polytechnic level at
Sujanpur)
I II
2 Development of provision of irrigation facilities II IV
3 Better hospital with modern hospitalization facilities Better hospital III I
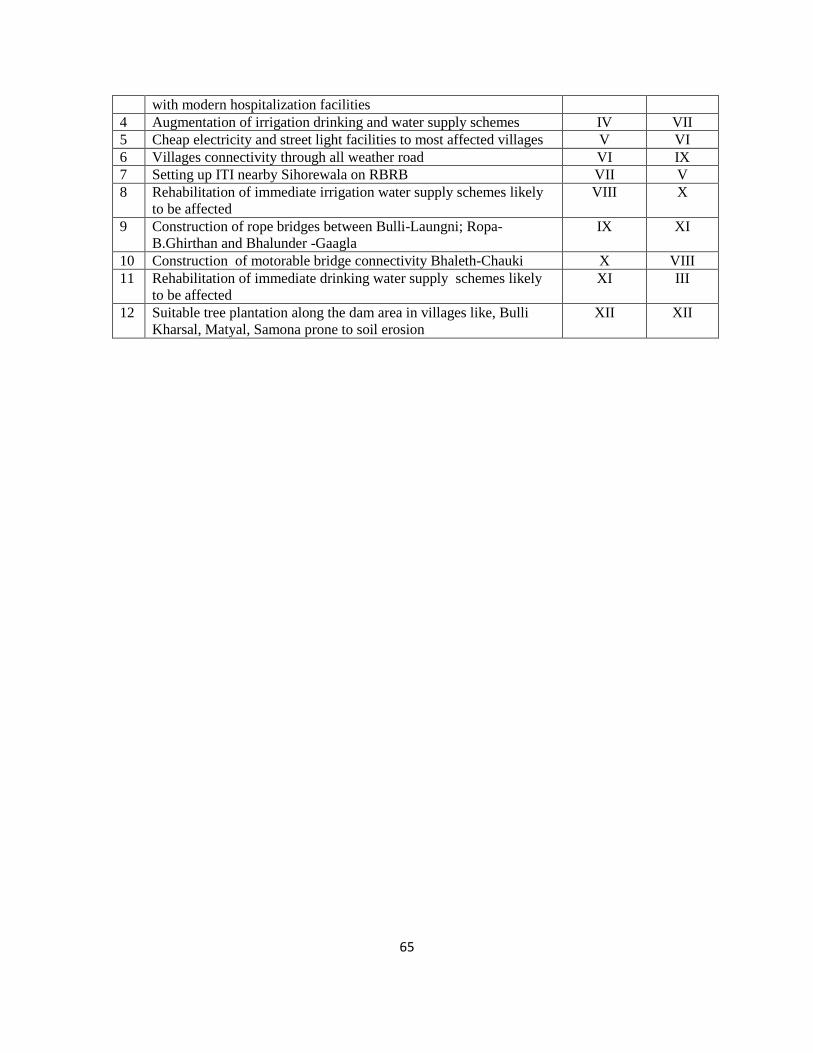
65
with modern hospitalization facilities
4 Augmentation of irrigation drinking and water supply schemes IV VII
5 Cheap electricity and street light facilities to most affected villages V VI
6 Villages connectivity through all weather road VI IX
7 Setting up ITI nearby Sihorewala on RBRB VII V
8 Rehabilitation of immediate irrigation water supply schemes likely
to be affected
VIII X
9 Construction of rope bridges between Bulli-Laungni; Ropa-
B.Ghirthan and Bhalunder -Gaagla
IX XI
10 Construction of motorable bridge connectivity Bhaleth-Chauki X VIII
11 Rehabilitation of immediate drinking water supply schemes likely
to be affected
XI III
12 Suitable tree plantation along the dam area in villages like, Bulli
Kharsal, Matyal, Samona prone to soil erosion
XII XII

66
Table 26 Consultation matrix based on relevant discussants’ views
Date and venue Particip
ants
(No.)
Target group Key issues raised Suggested interventions
30.07.2010 Gram
Panchayat ghar,
Chorhu
5 PRI officials and farmers Loss of land and way to Dhaulasidh and Amarnath
temples
Adequate compensation for land and
construction of alternative route to
Dhaulasidh.
30.07.2010 Gram
Panchayat ghar,
Karot
10 PRI officials and farmers Loss of personal land and fear of losing houses after
the project in Laungni which is very close to river
Beas
Adequate monetary compensation for land
and to reduce the height of dam so that
Laungni may not submerge in the water
14.10.2010 village
Balehu
22 Ward panch, farmers and mahila
mandal members
Loss of personal land providing grass and fodder to
animals. Loss of community land
Adequate monetary compensation for land
15.10.2010, village
Jihan, Barri and
Laungni
25 Ward panches, farmers and
mahila mandal members
Loss of personal land providing grass and fodder to
animals. Loss of community land
Adequate compensation for land creation of
infrastructure like, agri inputs sale centre,
PHC, ITI, cooking gas supply depot at Karot.
Construction of bridge between Laungni and
Bulli
29.10.2010, village
Bulli, Kyorh
5 Ward panch and farmers Loss of personal land providing foodgrains, grass
and fodder to animals. Loss of community land, loss
of newly constructed road. Loss of job of ferryman.
Loss of time by two hour because of following the
alternative way to nearby Karot village. Loss of
building material like sand, boulders, and concrete.
Delay in the execution of irrigation scheme
sanctioned by the govt.
Adequate compensation for land creation of
infrastructure like, agri input sale centre,
cooking gas supply depot at Karot.
Construction of bridge between Bulli and
Laungni. Provision of alternative link road to
Kyorh. Alternative job to ferryman. PHC and
ITI at Sihorewala
14.12.2010, village,
Paprola, Bhalunder,
Balla Ghirthan
12 Ward panch, farmers, ex
servicemen, secretary
cooperative society
Loss of personal land providing foodgrains, fruits,
grass and fodder to animals. Loss of community
land, Loss of job of ferryman. Loss of time by one
hour because of following the alternative way to
nearby Sujanpur market. Loss of building material
like sand, boulders, and concrete.
Adequate compensation for land .Share in the
project income. Preference in job for
households losing land. Alternative job to
ferryman.
15.12.2010, village,
Bulli, Bir Bagerha,
10 Ward panch, Pardhan, panchyat Loss of land, ferrying site, drinking water bouries,
building construction material, compensation for
Bridge connectivity to Bulli, Job assurance in
the project. Regular share in the project’s
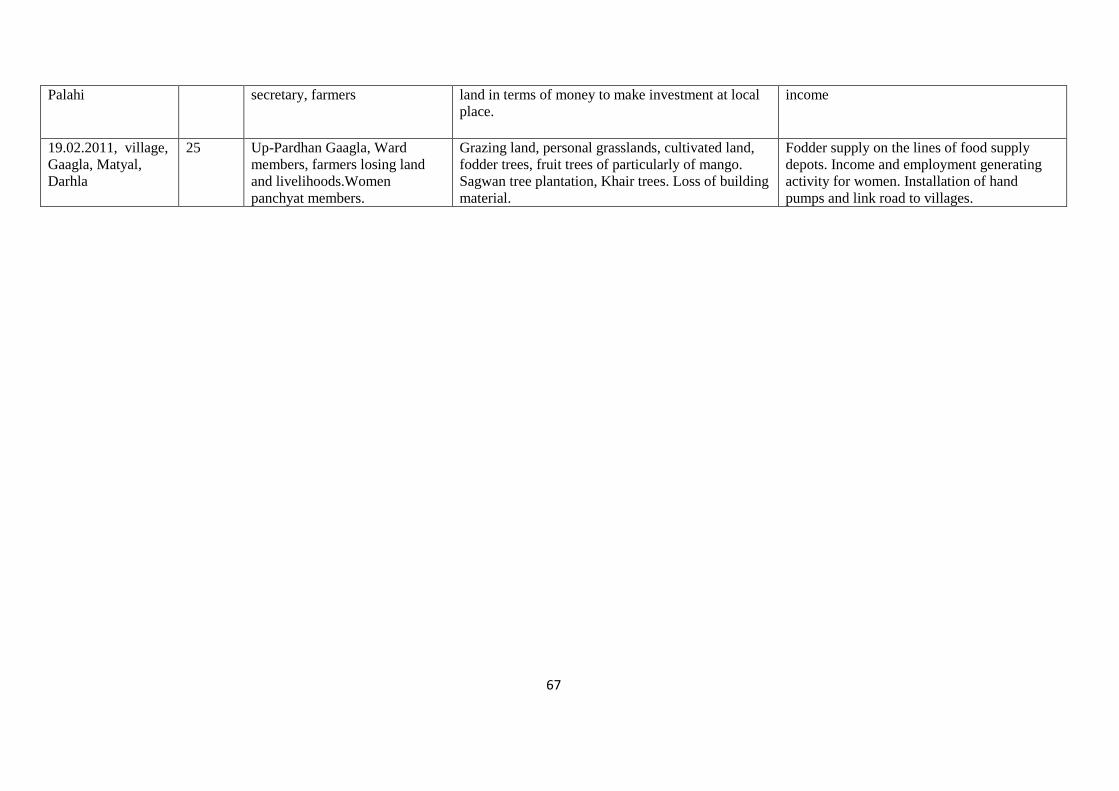
67
Palahi secretary, farmers
land in terms of money to make investment at local
place.
income
19.02.2011, village,
Gaagla, Matyal,
Darhla
25 Up-Pardhan Gaagla, Ward
members, farmers losing land
and livelihoods.Women
panchyat members.
Grazing land, personal grasslands, cultivated land,
fodder trees, fruit trees of particularly of mango.
Sagwan tree plantation, Khair trees. Loss of building
material.
Fodder supply on the lines of food supply
depots. Income and employment generating
activity for women. Installation of hand
pumps and link road to villages.