Embed Size (px)
Citation preview
Workinp Paper 9206
SOCIAL SECURITY AND MEDICARE POLICY FROM THE PERSPECTIVE OF GENERATIONAL ACCOUNTING
by Alan J. Auerbach, Jagadeesh Gokhale, and Laurence J. Kotlikoff
Alan J. Auerbach is a professor of economics at the University of Pennsylvania and an associate of the National Bureau of Economic Research; Jagadeesh Gokhale is an economist at the Federal Reserve Bank of Cleveland; and Laurence J. Kotlikoff is a professor of economics at Boston University and an asso- ciate of the National Bureau of Economic Research.
Working papers of the Federal Reserve Bank of Cleveland are preliminary materials circu- lated to stimulate discussion and critical comment. The views stated herein are those of the authors and not necessarily those of the Federal Reserve Bank of Cleveland or of the Board of Governors of the Federal Reserve Sys tem .
April 1992
clevelandfed.org/research/workpaper/index.cfm

Abstract
Our'previous study (Auerbach, Gokhale, and Kotlikoff [1991]) introduced the concept of generational accounting, a method of determining how the burden of fiscal policy falls on different generations. It found that U.S. fiscal policy is out of balance in terms of projected generational burdens. This means that either current generations will bear a larger share (than we project under current law) of the burden of the government's spending, or that future generations will have to pay, on average, at least 21 percent more on a growth-adjusted basis than will those generations who have just been born.
These conclusions were based on relatively optimistic assumptions about the path of Social Security and Medicare policies, namely that the accumula- tion of a Social Security trust fund would continue and that Medicare costs would not rise as a share of GNP. In this paper, we simulate the effects of realistic alternative paths for Social Security and Medicare. Our results suggest that such alternative policies could greatly increase the imbalance in generational policy, making not only future generations pay significantly more, but current young Americans as well. For example, continued expansion of Medicare in this decade alone could double the 21-percent imbalance figure if its bill is shifted primarily to future generations.
clevelandfed.org/research/workpaper/index.cfm

I. Introduction
Of late, economists and noneconomists alike have been questioning the
appropriateness of using the fiscal deficit as an indicator of the stance of
economic policy. The deficit is a single number that measures the govern-
ment's current net cash flow. As such, it is ill-suited to reflect the
longer-term effects of fiscal policy on saving, investment, and growth.
Moreover, the deficit cannot reveal how different generations, both those
living and those yet to come, are being treated under current economic
policies. Doubts about the deficit have been accentuated by the aging of the
U.S. population, with its attendant increase in the number of retirees depen-
dent on workers for pay-as-you-go spending and transfer programs.
In 1983, in recognition of these concerns about the demographic transi-
tion, the U.S. federal government began to accumulate a large Social Security
trust fund to help finance the baby boom generation's Social Security
benefits. But this break with short-term, pay-as-you-go financing also raised
new questions about using the unified federal deficit, which includes Social
Security, as a measure of fiscal policy. If funds for the future need to be
accumulated by the Social Security system, then shouldn't such accumulations
be excluded from the overall deficit measure?
The federal government's response, as expressed in the 1990 budget agree-
ment, has been to exclude Social Security from future calculations of the
deficit. However, this has not prevented public discussion of the deficit
inclusive of Social Security. Nor has it put to rest the concerns that
government spending is now larger and will continue to grow, and that taxes
are now smaller and will continue to be smaller than they would in the absence
of the Social Security surpluses. That is, it has not put to rest the concern
clevelandfed.org/research/workpaper/index.cfm

that the federal government is using the large pay-as-you-go Social Security
surpluses to offset large on-budget deficits.
This is but one example of the ambiguity of the deficit and the
deficiency of any single deficit measure as a gauge of the fiscal burden faced
by different generations. While one response to this deficiency has been to
construct different deficits for different purposes, such constructs are
clearly ad hoc in nature and require continual refinements to prevent perverse
results. For example, if the Social Security system is excluded from the
budget for deficit purposes, how does one deal with changes in income taxes
that are induced by changes in Social Security taxes: Should such changes in
off-budget taxes be permitted to alter the on-budget deficit?
The key economic question associated with fiscal deficits - which generation will pay for what the government spends - is not answered by any version of the government's budget deficit. As we discuss below, an increase
in the deficit does not nece&arily signal a shift in the fiscal burden to
future generations. Moreover, policies that dramatically alter the inter-
generational distribution of fiscal burdens may do so without inducing any
change whatsoever in the measured deficit.
In an earlier paper (Auerbach, Gokhale, and Kotlikoff, hereafter AGK
[1991]), we developed an alternative to the deficit - generational accounting - and showed how this new approach could be used to assess fiscal policy and its distributional impact with respect to different generations. Our previous
analysis stressed that generational accounts are quite informative about the
effects of changes in tax and transfer policies on the burdens of different
generations.
We now use generational accounting to analyze potential changes in the
federal government's most important transfer program, Old Age Survivors,
clevelandfed.org/research/workpaper/index.cfm
Disability, and Health Insurance (OASDHI), which includes the Social Security
pension system and Medicare. This component of the federal budget has grown
much more rapidly than other components inrecent years. If current trends
continue, OASDHI will continue to grow relative to the economy due to the
rising share of the elderly in the population and the rapid increase in real
medical costs.
Before turning to such policy analysis, we briefly review the genera-
tional accounting methodology, which is discussed more fully in AGK (1991,
1992).
11. The Generational Accounting Approach
The basic idea behind generational accounting is that generations
currently alive and those yet to be born must pay for the government's current
and future spending on goods and services less the external resources avail-
able to the government to cover these expenditures (its net wealth). This is
the government's intertemporal budget constraint. The constraint reminds us
of the zero-sum nature of paying for the government's expenditures; if genera-
tions currently alive pay less, those yet to come will be forced to pay more.
It also reminds us that changes in fiscal policy today are likely to neces-
sitate changes in the future. We express the government's intertemporal
budget constraint in present value, with the initial value of government
liabilities and the present value of future spending being equal to the sum of
the present values of each generation's burden. Emphasizing the present-value
burdens of different generations, regardless of the year in which such burdens
are imposed, neutralizes the timing problems inherent in annual deficit
measures and allows us to summarize in a compact form the likely effects of
fiscal policy on individuals through time.
clevelandfed.org/research/workpaper/index.cfm

The analysis is forward-looking, in that it calculates only the future
fiscal burdens that each generation faces. Becausk we are interested in the
issue of generational imbalance in fiscal policy, we treat current and future
generations separately when analyzing a partieular fiscal policy path. For
current generations, we calculate the burden under the particular fiscal
scenario. For future generations, we calculate the total present value of
payments required to balance the government's intertemporal budget constraint.
One cannot say how this burden will be distributed among future generations.
For purposes of illustrating the size of the burden likely to be imposed on
future generations versus that on current generations, we assume that the
burden on each successive future generation remains fixed as a fraction of the
lifetime income of that generation; that is, the absolute fiscal burden of
successive generations increases at the rate of growth of their lifetime
incomes, which we take to be the growth rate of productivity.
To calculate the burden faced by a member of an existing generation, we
first project the net payments to the government in each future year for a
representative member of that generation (distinguishing males and females)
and then take the present value of such payments. By net payments we mean all
taxes paid to, less all transfers received from, government at the federal,
state, and local levels. Payments include not only direct taxes such as
income and property taxes, but also indirect business taxes, corporate taxes,
and seigniorage. Transfers include Medicare, Medicaid, food stamps, Social
Security benefits, and so on.
The present-value calculation for each representative individual
discounts future payments not only for interest, but also for mortality: An
individual's future burden is reduced by the probability that he or she will
not be alive when that burden occurs. Given our assumption that members of
clevelandfed.org/research/workpaper/index.cfm

each generation (distinguished only by sex) face the same survival probabil-
ities, multiplying individual payments in each year by the generation's
projected surviving population for that year provides a measure of that gener-
ation's payment, the separate components of which are benchmarked to
aggregates from the National Income and Product Accounts.
Once burdens for current generations have been calculated, those faced by
future generations are estimated as a residual, based on the fiscal balance
requirement and on the assumption that the remaining fiscal burden will be
borne proportionally. Policy changes affect the projected net payments faced
by current generations and, through the fiscal balance requirement, by future
generations as well.
Because the accounts are forward-looking, they do not consider the net
payments made in the past. The present value of future net payments, which is
positive for young and middle-aged existing generations, is negative for older
generations, who are largely retired and facing lower labor income taxes while
at the same time receiving Social Security benefits and Medicare. Thus, the
level of an existing generation's account does not indicate how well or poorly
that generation has fared at the hands of the government. We therefore focus
on the changes in each generation's account that are induced by alternative
policies.
111. Construction of Generational Accounts
The construction of generational accounts is a two-step process. The
first step entails projecting each currently living generation's average taxes
less transfers in each future year during which at least some members of the
generation will be alive. The second step converts these projected average
net tax payments into a present value using an assumed discount rate and
clevelandfed.org/research/workpaper/index.cfm
taking into account the probability that the generation's members will be
alive in each of the future years (that is, actuarially discounting for both
mortality and interest).
In projecting each currently living generation's taxes and transfers, we
consider first their taxes and transfers in the base year - in this case, 1989. The totals of the different taxes and transfers in the base year are
those reported by the National Income and Product Accounts. As described in
detail in AGK (1991), these totals of base-year taxes and transfers are
distributed to the different generations according to their ages and sexes
based on cross-section survey data from the Bureau of the Census* Survey of
Income and Plan Participation and from the Bureau of Labor Statistics* Survey
of consumer Expenditures. The distribution of future taxes and transfers by
age and sex is assumed to equal that in the current year with adjustments for
growth and projected changes in policy.
Because the government already forecasts the totals of its various taxes
and transfers for many years ahead, the additional work involved in genera-
tional accounting is primarily in allocating these projected totals by age and
sex. Thus, although a few elements are added and the requisite projections
extend further into the future, generational accounting uses mostly the same
numbers the government uses, only in a different manner.
The calculations presented here assume a 6.00 percent real rate of
discount and a productivity growth rate of 0.75 percent. The rate of produc-
tivity growth is based on recent U.S. experience. The discount rate is higher
than the rate of return on government obligations, reflecting the fact that
future government receipts and expenditures are risky.' The estimates also
l ~ s we discussed in our 1991 paper, the appropriate discount rate to use depends on the risk characteristics of the flows being discounted. (A similar point has been made by Bohn [1991]). If government receipts and expenditures were roughly proportional to aggregate fluctuations in income, then the
clevelandfed.org/research/workpaper/index.cfm

incorporate the mortality probabilities embedded in the Social Security Admin-
istration's projections of U.S. population by age and sex. As discussed in
AGK (1991), the absolute value of the generational accounts is sensitive to
the choice of rates of discount and growth, as well as to rates of birth and
death. But for many of the questions of interest, such as the fiscal burden
being imposed on future generations relative to that being shouldered by
current generations, the results are quite robust to reasonable departures
from baseline assumptions.
As mentioned, inferring the fiscal burden on future generations requires
knowing not only the sum total of generational accounts of current genera-
tions, but also the projected present value of the government's expenditures
on goods and services as well as the government's initial net wealth position.
As described in AGK (1991), the government's net wealth is estimated in a
manner consistent with the government sector deficit reported in the National
Income and Product Accounts. The present value of government expenditures is
calculated by projecting current expenditures into the future, taking into
account those elements that are sensitive to the demographic structure. For
example, our projections consider the decrease in per capita spending on
education that is likely to arise as the school-age population declines
relative to the total population.
Our baseline generational accounts reflect policy as of 1989 (prior to
the 1990 budget agreement). They show that a newborn male faces a net payment
private sector discount rate, measured by the real before-tax rate of return, would seem the appropriate discount rate to use. We use a somewhat lower rate to reflect the existence of countercyclical government policy. In principle, one would also discount separate components of expenditures and net receipts using different rates.
clevelandfed.org/research/workpaper/index.cfm

to the government of $73,700, reflecting present values of $85,300 of tax
payments and $11,600 of transfers received. For females, the comparable
figures are $36,400 in net present value, comprising $54,700 in taxes and
$18,300 in transfers. The lower taxes for females primarily reflect their
lower rate of labor-force participation, and hence lower income and payroll
taxes. The higher transfers reflect both greater female longevity and the
concentration of female-headed households in circumstances of poverty.
Together, Medicare and Social Security account for nearly half of all trans-
fers received by males, and for more than a third of those received by
females.
Based on our estimates of initial government wealth and the projections
of the effects of this baseline fiscal policy on existing generations, we find
that, as of 1989, generational policy was out of balance in the sense that the
fiscal burden on future generations was 21 percent larger than that on 1989
male and female newborns, who are assumed to fall under the current policy
regime. Because the net lifetime payments that newborns are projected to make
represent almost 40 percent of their lifetime incomes, this imbalance in
generational policy translates into an added burden of nearly one-tenth of the
income of members of future generations.
An alternative way of measuring how far the current regime is out of
generational balance is the change in any particular fiscal instrument that
would be necessary to bring this 21 percent excess to zero - to make the "new" current policy sustainable without further adjustment. Our calculations
suggest that an immediate and permanent increase in the average income tax
rate of 5.3 percent (just under 1 percentage point) would suffice. If,
instead, payroll taxes were used to equalize the burden, they would have to
rise by 7.8 percent, or about 1 percentage point. Alternatively, an increase
clevelandfed.org/research/workpaper/index.cfm

in sales taxes of 10.2 percent (just over 1 percentage point) or a 14.3
percent hike (nearly 4 percentage points) in capital income taxes would be
required. Although any of these fiscal instruments (or many others) could be
used to provide intergenerational balance, each policy change would lead to a
different burden on current and future generations. The most favorable to the
young and future generations are sales taxes, more of which would be paid by
older individuals. At the other extreme, not surprisingly, are payroll taxes.
Hence, generational balance may be achieved with a range of impacts on partic-
ular generations. 2
IV. Generational Accounting and Deficits
The usefulness of generational accounting is immediately clear when one
compares the effects of specific fiscal polices on deficits and generational
accounts. Policies that change the pattern of generational burdens need not
affect the deficit, while other policies may change the deficit without
affecting the pattern of generational burdens. This is illustrated by table 1
(reprinted from AGK [1992]), which presents simulations of the effects of four
different, but not unusual, policies.
The first is a five-year, 20 percent reduction in the average federal
income tax rate, with the tax rate increased above its initial value after
five years to maintain a constant debt-to--GNP ratio. This policy would raise
the deficit and shift the fiscal burden to young and future generations - not a surprising result. However, the second policy - an immediate and permanent
20 percent increase in Social Security retirement and disability benefits
financed on a pay-as-you-go basis by increases in payroll taxes - would
2 ~ e e AGK (1992) for further discussion.
clevelandfed.org/research/workpaper/index.cfm

induce a quite similar shifting of fiscal burdens without any change in the
time path of measured deficits (including or excluding the Social Security .
system). The third policy involves an equal revenue switch in tax structure
- a permanent 30 percent cut in payroll taxes financed by increased sales .taxes - which, again, shifts generational burdens without changing the
deficit . The final policy illustrated in table 1 involves the elimination of the
discount that presently exists in the price of existing assets as a result of
investment incentives. Removing this discount (as would be accomplished by
extending the tax treatment of new assets to existing assets) is essentially a
windfall to owners of existing capital. We assume in the simulation that this
grant is paid for by a permanent increase in capital income tax rates, a
policy shift that transfers resources from the young (who, on average, have
not yet accumulated significant wealth) to the old (who, on average, have).
As the simulations in this section indicate, the generational effects of
a variety of realistic policies cannot be determined by looking at deficits.
We turn now to an examination of several Social Security and Hedicare policies
that may actually be adopted through time.
V. The Generational Impacts of Social Policies
A. Social Security's OASDI Program
We first consider policies to alter the structure of the OASDI (non-
Hedicare) portion of the Social Security system. As a result of the increases
in payroll taxes mandated by the 1983 changes, this program has in recent
years been running large cash flow surpluses of roughly $100 billion per year.
While these accumulations were planned to help offset benefit payments in the
decades to come, their existence, combined with historically high payroll tax
clevelandfed.org/research/workpaper/index.cfm

rates, has lent force to arguments for reducing payroll taxes. However,
cutting payroll taxes is not, in itself, a full description of a fiscal policy
- payroll tax cuts alone would cause a violation of the government's fiscal
balance requirement. A complete policy specification also requires a
compensating change in either net government receipts or spending (or both).
This section presents simulations for four such policies and their effects on
the fiscal burdens of different generations.
The first of the four policies considered is a proposal to cut the Social
Security payroll tax rate over the next three decades and to increase the tax
rate thereafter. The second policy involves the same reduction in payroll
taxes (through the year 2020) as in the first simulation. However, rather
than raising tax rates after 2020, this policy reduces Social Security
benefits beginning in that year by the same amount that payroll taxes would
otherwise have increased. The third policy entails the indirect dissipation
of the Social Security trust fund though an increase in government spending
over the next three decades equal, on an annual basis, to the Social Security
surplus. Over these decades, funds to pay for the larger government spending
are "borrowedn so that in 2020, the additional accumulated federal debt is
equal in magnitude to the Social Security trust fund. The fourth policy is an
immediate and permanent switch from payroll tax finance to income tax finance
of Social Security.
The first column of table 2 indicates what reducing and then increasing
payroll taxes will do to the burdens placed on different generations. The
policy provides windfalls to Americans currently alive, with the exception of
the very old and the very young. Those currently aged 30 to 40 receive the
largest windfalls, roughly $3,000 for males and $1,500 for females. These
gains come at the expense of children currently under age 10 as well as future
clevelandfed.org/research/workpaper/index.cfm

individuals. If all future Americans are treated uniformly, up to the growth
adjustment, their lifetime net payments will rise by $6,100 in the case of
males and $3,000 in the case of females.
Enactment of a policy that promises to raise future taxes to pay for
current tax cuts does not ensure that such taxes will actually be raised. The
government might use an alternative method to restore fiscal balance. For
example, the necessary increase in net payments might take the form of a cut
in Social Security benefits. Such a policy, depicted in the second column of
table 2, reduces by about one-third for males and by about two-thirds for
females the gains enjoyed under the initial policy. Females lose relatively
more because their share of Social Security benefits is larger than their
share of payroll tax payments.
The third column in table 2 shows what happens if the federal government
indirectly dissipates the Social Security surplus by raising its spending
beyond the amount projected in the baseline generational accounts. In the
simulation, the government continues to accumulate its Social Security trust
fund, but it also borrows to pay for additional spending with the annual
amount of the borrowing equal in size to the annual Social Security surplus.
We assume this process of deficit-financed increased spending continues
through 2020, and that after 2020 the government raises income taxes to pay
interest less an adjustment for growth on the additional accumulated official
debt.
This policy has quite different effects from those in the previous
simulations, because, unlike policies that do not change direct government
spending, increases in government spending may expand the sum of all genera-
tional accounts. Here, this added burden is borne by all generations who will
be alive to service the extra debt, with the greatest burden on those
clevelandfed.org/research/workpaper/index.cfm
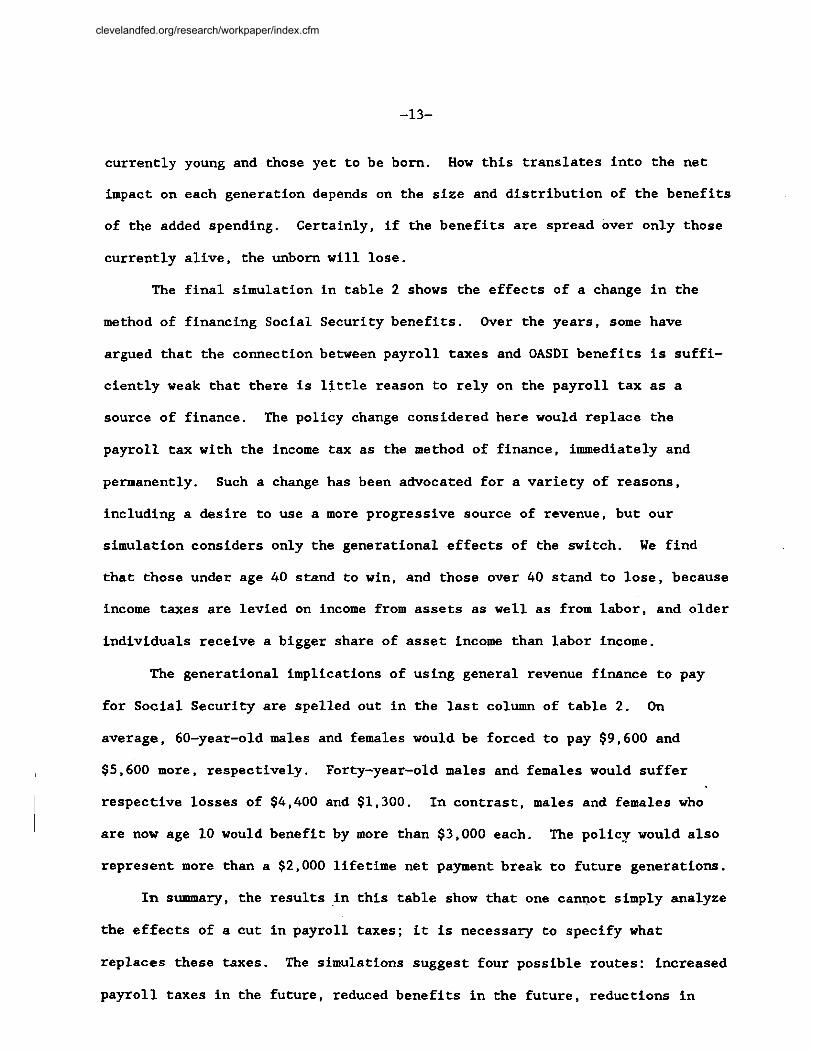
currently young and those yet to be born. How this translates into the net
impact on each generation depends on the size and distribution of the benefits
of the added spending. Certainly, if the benefits are spread over only those
currently alive, the unborn will lose.
The final simulation in table 2 shows the effects of a change in the
method of financing Social Security benefits. Over the years, some have
argued that the connection between payroll taxes and OASDI benefits is suffi-
ciently weak that there is little reason to rely on the payroll tax as a
source of finance. The policy change considered here would replace the
payroll tax with the income tax as the method of finance, immediately and
permanently. Such a change has been advocated for a variety of reasons,
including a desire to use a more progressive source of revenue, but our
simulation considers only the generational effects of the switch. We find
that those under age 40 stand to win, and those over 40 stand to lose, because
income taxes are levied on income from assets as well as from labor, and older
individuals receive a bigger share of asset income than labor income.
The generational implications of using general revenue finance to pay
for Social Security are spelled out in the last column of table 2. On
average, 60-year-old males and females would be forced to pay $9,600 and
$5,600 more, respectively. Forty-year-old males and females would suffer
respective losses of $4,400 and $1,300. In contrast, males and females who
are now age 10 would benefit by more than $3,000 each. The policg would also
represent more than a $2,000 lifetime net payment break to future generations.
In summary, the results in this table show that one cannot simply analyze
the effects of a cut in payroll taxes; it is necessary to specify what
replaces these taxes. The simulations suggest four possible routes: increased
payroll taxes in the future, reduced benefits in the future, reductions in
clevelandfed.org/research/workpaper/index.cfm

government spending, and replacement with income taxes. Each has its own
effects on the generational fiscal burden.
B. Medicare Policy
Many observers have worried about the rising cost of providing health
care in the United States, where a much larger fraction of GNP is spent on
medical care than in any other OECD country. Canada has the second-highest
per capita expenditure on health care, but spends almost 30 percent less per
person. At present, about 12 cents of every dollar of U.S. output goes to
health care, compared with 6 cents in 1960. By the turn of the century, this
figure is projected to be 17 cents. If the growth of this sector continues
unabated, the figure will reach 37 cents by the year 2030 (see Darman [1991]).
What explains the rapid growth in real per capita U.S. health care
expenditures? Since 1960, slightly more than half of the increase simply
reflects expanded use of health care services and facilities. Another third
is due to the escalation in medical care prices relative to the prices of
other goods and services, and the remaining 11 or so percent reflects the
aging of the population. This trend will, of course, intensify in the years
ahead.
The growth of health care expenditures has potentially enormous implica-
tions for government outlays and for the well-being of different generations.
Consider just the federal government's expenditure on Medicare, which
currently constitutes 7 percent of total federal outlays. According to the
Office of Management 3nd Budget, Medicare is projected to exceed 30 percent of
the federal budget by 2025. To support this program at its current levels
alone, either the federal budget would have to grow far beyond its present
clevelandfed.org/research/workpaper/index.cfm
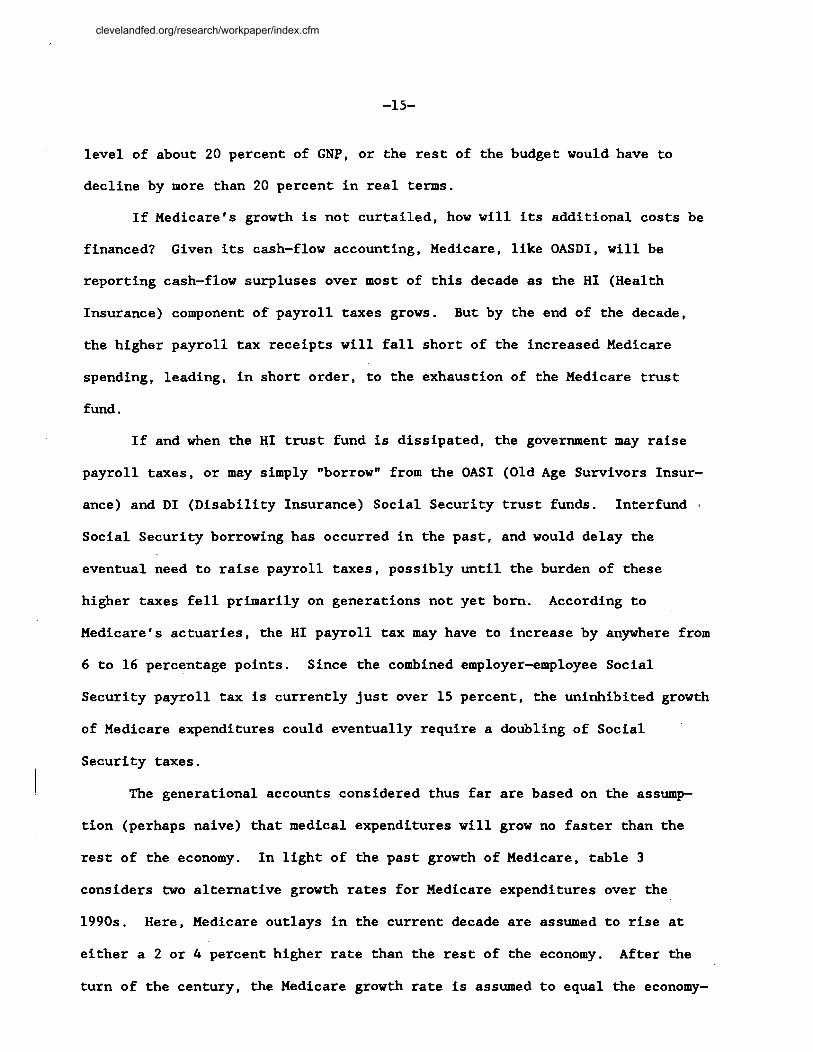
level of about 20 percent of GNP, or the rest of the budget would have to
decline by more than 20 percent in real terms.
If Medicare's growth is not curtailed, how will its additional costs be
financed? Given its cash-flow accounting, Medicare, like OASDI, will be
reporting cash-flow surpluses over most of this decade as the HI (Health
Insurance) component of payroll taxes grows. But by the end of the decade,
the higher payroll tax receipts will fall short of the increased Medicare
spending, leading, in short order, to the exhaustion of the Medicare trust
fund . If and when the HI trust fund is dissipated, the government may raise
payroll taxes, or may simply "borrow" from the OASI (Old Age Survivors Insur-
ance) and DI (Disability Insurance) Social Security trust funds. Interfund
Social Security borrowing has occurred in the past, and would delay the
eventual need to raise payroll taxes, possibly until the burden of these
higher taxes fell primarily on generations not yet born. According to
Medicare's actuaries, the HI payroll tax may have to increase by anywhere from
6 to 16 percentage points. Since the combined employer-employee Social
Security payroll tax is currently just over 15 percent, the uninhibited growth
of Medicare expenditures could eventually require a doubling of Social
Security taxes.
The generational accounts considered thus far are based on the assump-
tion (perhaps naive) that medical expenditures will grow no faster than the
rest of the economy. In light of the past growth of Medicare, table 3
considers two alternative growth rates for Medicare expenditures over the
1990s. Here, Medicare outlays in the current decade are assumed to rise at
either a 2 or 4 percent higher rate than the rest of the economy. After the
turn of the century, the Medicare growth rate is assumed to equal the economy-
clevelandfed.org/research/workpaper/index.cfm

wide growth rate. The 2 and 4 percent growth rates bracket the 2.77 rate of
growth of health spending in excess of GNP observed between 1960 and 1989.
The 4 percent path is consistent with projections of an increase, over the
decade, from 12 to 17 percent in the share of U.S. health care spending
relative to GNP.
For each growth rate, there are three alternative financing scenarios.
The first is that future generations pick up the entire bill for this decade's
projected higher Medicare growth. The second is that the expansion in
Medicare over the next decade is ultimately paid for by a reduction in
Medicare benefits starting in the year 2020. The third is that this decade's
growth in Medicare is matched, on an annual basis, with increases in HI
payroll taxes.
The three scenarios have markedly different implications for both living
and unborn generations. Under the first scenario, the burden is entirely
shifted onto future generations; all living generations benefit from the
growth in Medicare because they don't have to pay for it. Depending on the
growth rate assumed, future generations end up paying from 10 to 23 percent
more than in the base case. If Medicare growth is 4 percent, the absolute
increase in the bill handed our male descendants is $19,400; it is $9,000 for
our female descendants. These additional burdens raise substantially the
ratio of total net payments of the unborn to those of newborns. Rather than
paying 21 percent more than newborns, future generations in the 4 percent
growth scenario end up paying almost 50 percent more!
The second scenario, given in columns 2 and 5, indicates what happens
if, instead of borrowing from the Social Security trust fund, Medicare pays
for its prospective near-term generosity with longer-term (after 2020) benefit
cuts. In this case, individuals below age 50 lose, because of the net cuts in
clevelandfed.org/research/workpaper/index.cfm
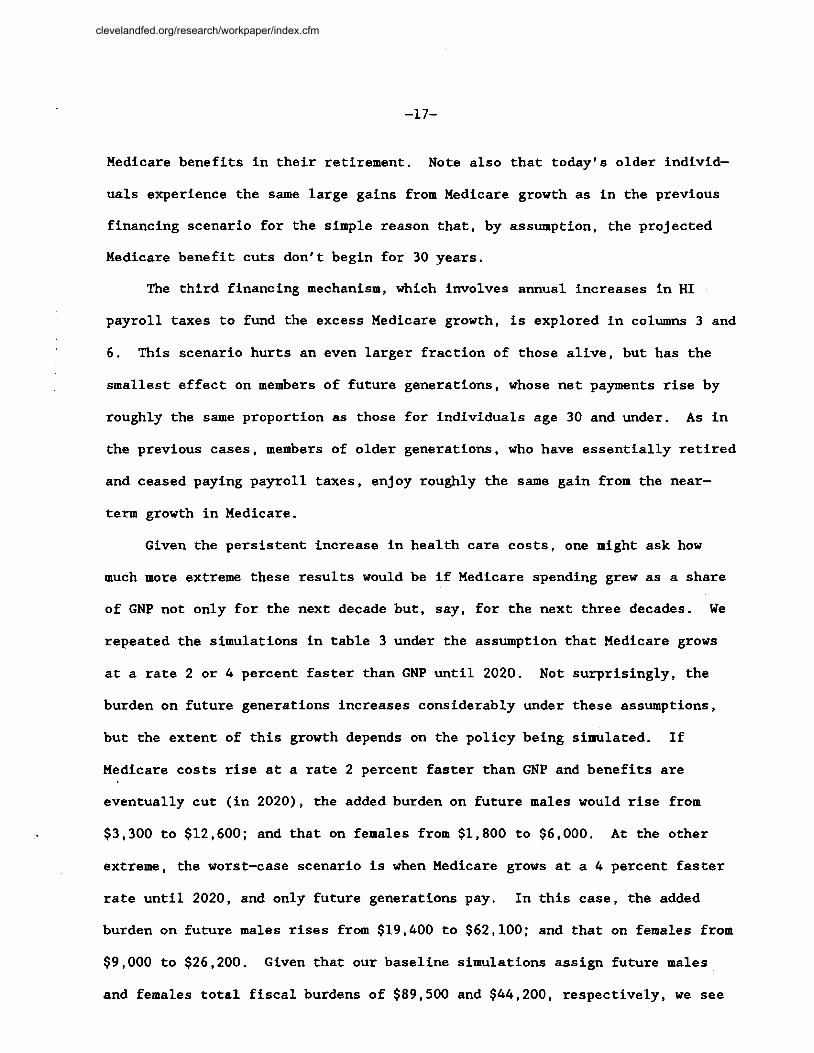
Medicare benefits in their retirement. Note also that today's older individ-
uals experience the same large gains from Medicare growth as in the previous
financing scenario for the simple reason that, by assumption, the projected
Medicare benefit cuts don't begin for 30 years.
The third financing mechanism, which involves annual increases in HI
payroll taxes to fund the excess Medicare growth, is explored in columns 3 and
6. This scenario hurts an even larger fraction of those alive, but has the
smallest effect on members of future generations, whose net payments rise by
roughly the same proportion as those for individuals age 30 and under. As in
the previous cases, members of older generations, who have essentially retired
and ceased paying payroll taxes, enjoy roughly the same gain from the near-
term growth in Medicare.
Given the persistent increase in health care costs, one might ask how
much more extreme these results would be if Medicare spending grew as a share
of GNP not only for the next decade but, say, for the next three decades. We
repeated the simulations in table 3 under the assumption that Medicare grows
at a rate 2 or 4 percent faster than GNP until 2020. Not surprisingly, the
burden on future generations increases considerably under these assumptions,
but the extent of this growth depends on the policy being simulated. If
Medicare costs rise at a rate 2 percent faster than GNP and benefits are
eventually cut (in 2020), the added burden on future males would rise from
$3,300 to $12,600; and that on females from $1,800 to $6,000. At the other
extreme, the worst-case scenario is when Medicare grows at a 4 percent faster
rate until 2020, and only future generations pay. In this case, the added
burden on future males rises from $19,400 to $62,100; and that on females from
$9,000 to $26,200. Given that our baseline simulations assign future males
and females total fiscal burdens of $89,500 and $44,200, respectively, we see
clevelandfed.org/research/workpaper/index.cfm
that sustained Medicare growth has the potential of absorbing a significant
share of the government's overall budget.
VI. Conclusion
We have estimated that America's policy path, based on current law and
the assumption of balanced growth in government spending, will place a roughly
21 percent larger growth-adjusted net tax burden on future generations than it
will place on Americans who have recently been born. But this estimate is
based on what may be relatively optimistic assumptions: that the Social 1 Security system's projected cash-flow surpluses will continue to accumulate
and that Medicare spending will immediately stabilize as a share of GNP.
Those individuals coming in the future as well as today's infants and young
children could end up paying considerably more under less-optimistic but
realistic alternative paths for Social Security and Medicare policies.
Specifying a different path for payroll taxes or Medicare costs is not
enough to describe an alternative fiscal policy: One must also indicate how
the government will compensate for either of these changes in order to
preserve intertemporal fiscal balance. Though we know some balancing response
must occur, the ultimate path cannot, of course, be known with certainty - we
have considered several alternatives in each case.
The Social Security policies we have analyzed include short-term payroll
tax cuts financed by long-term payroll tax increases, future benefit cuts, or
general revenue finance, as well as the dissipation of the impending Social
Security off-budget surpluses through increased on-budget deficits. Our
simulations for Medicare consider alternative responses to the continued
growth of Medicare expenditures as a share of GNP. The use of generational
clevelandfed.org/research/workpaper/index.cfm

accounting reveals, as deficit accounting cannot, the relative burdens that
these different policy responses place on different generations.
clevelandfed.org/research/workpaper/index.cfm

References
Auerbach, Alan J.', Jagadeesh Gokhale, and Laurence J. Kotlikoff, "Generational Accounts: A Meaningful Alternative to Deficit Accounting," in David Bradford, ed., Tax Policv and the Economv, National Bureau of Economic Research, volume 5, 1991, pp. 55-110.
Auerbach, Alan J., Jagadeesh Gokhale, and Laurence J. Kotlikoff, "Generational Accounting - A New Approach to Understanding the Effects of Fiscal Policy on Saving," Scandinavian Journal of Economics, 1992, forthcoming.
Bohn, Henning , "The Sustainability of Budget Deficits in a Stochastic Economy," unpublished working paper, Wharton School, University of Pennsylvania, July 1991.
Darman, Richard, "Introductory Statement: The Problem of Rising Health Costs," testimony presented before the Senate Finance Committee, Executive Office of the President, Office of Management and Budget, April 16, 1991, p. 6.
Kotlikoff, Laurence J., f L
for What We Spend, New York, N.Y.: The Free Press, 1992, forthcoming.
clevelandfed.org/research/workpaper/index.cfm

Table 1
Males Ages 0 10 2 0 3 0 40 50 6 0 7 0 8 0
F'uture Generations
Females Ages 0 10 20 3 0 40 50 60 7 0 8 0
Future Generations
5 Year Tax Cut
Changes in Generational Accounts Arising from Four Hypothetical Policies
(present value, thousands of dollars)
20 Percent Social Security
Benefit Increase
Shifting from Payroll to Sales and Excise Taxes
Eliminating Investment Incentives
Source: Authors8 calculations.
clevelandfed.org/research/workpaper/index.cfm

Table 2
Changes in Generational Accounts from Four Social Security Pol ic ies
(present value, thousands of dollars)
Immediate Payroll Tax Cuts
Financed by Future Tax Increases
Males 43es
0 10 2 0 3 0 40 5 0 6 0 7 0 8 0
Future Generations
Females 43es
0 10 20 3 0 40 50 60 7 0 8 0
Future Gene rat ions
Immediate Payroll Tax Cuts
Financed by Benefit Reductions
Dissipating the
Social Security Trust Fund
Switching from Payroll to Income
Tax Finance
Source: Authors' calculations.
clevelandfed.org/research/workpaper/index.cfm
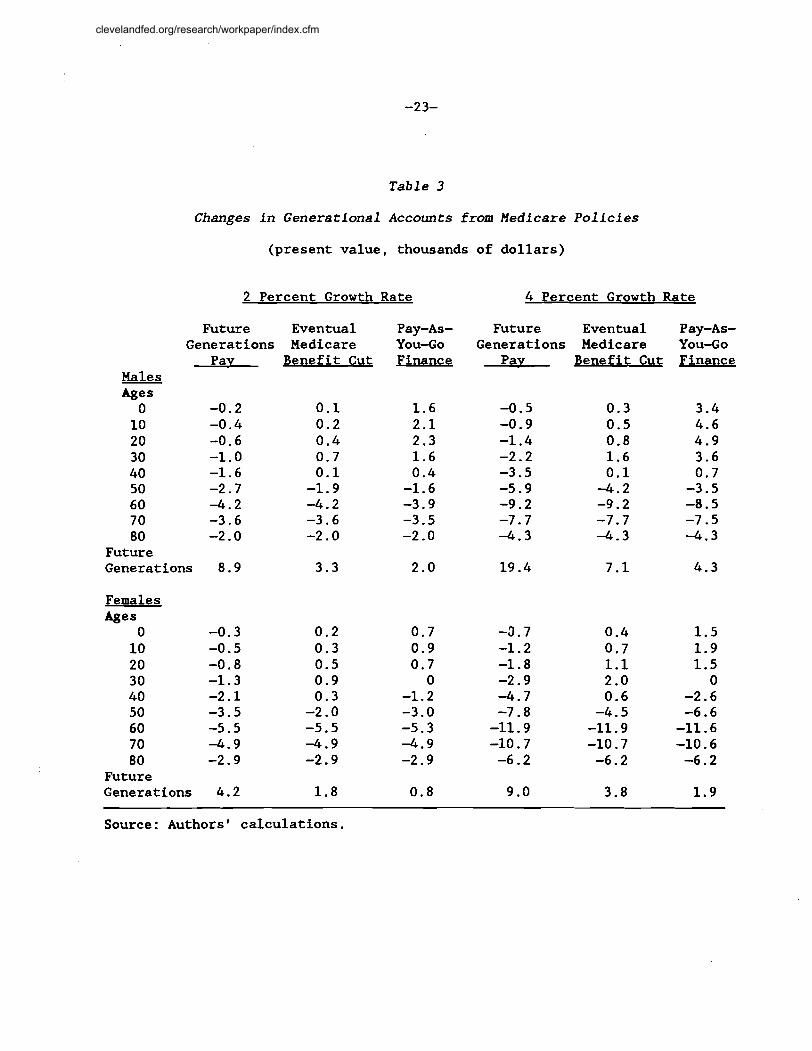
Table 3
Changes in Generational Accounts from Medicare Policies
(present value, thousands of dollars)
2 Percent Growth Rate
Future Eventual Generations Medicare
Pav Benefit Cut Males Ages
0 -0.2 0.1 10 -0.4 0.2 2 0 -0.6 0.4 30 -1.0 0.7 40 -1.6 0.1 50 -2.7 -1.9 6 0 -4.2 -4.2 70 -3.6 -3.6 80 -2.0 -2.0
Future Generations 8.9 3.3
Females &es
0 -0.3 10 -0.5 2 0 -0.8 3 0 -1.3 40 -2.1 50 -3.5 60 -5.5 7 0 -4.9 8 0 -2.9
Future Generations 4.2
Pay-As- You-Go Finance
4 Percent Growth Rate
Future Eventual Pay-As- Generations Hedicare You-Go
Pav Benefit Cut Finance
Source: Authors' calculations.
clevelandfed.org/research/workpaper/index.cfm