Embed Size (px)
Citation preview

Social survey toolkit
Neighbourhood Planning programme
Table Of Contents
Introduction ................................................................................................ 3
Purpose of this toolkit ........................................................................................... 3
Neighbourhood Planning ........................................................................................ 4
Consultation and evidence base ............................................................................... 5
Overview of the Toolkit .................................................................................. 7
What is the toolkit and why is it needed? .................................................................... 7
How to use the toolkit? .......................................................................................... 8
Limitations ......................................................................................................... 9
Gathering existing data.................................................................................. 10
Conducting social surveys............................................................................... 11
Purpose ............................................................................................................ 11
Relating your objectives to research questions ........................................................... 11
Different types of surveys ..................................................................................... 12
Key principles and good practice measures ......................................................... 14
Survey Questions ......................................................................................... 17
Core survey questions .......................................................................................... 18
1.1.1 Basic household information ........................................................................ 19
1.1.2 Aspirational questions ................................................................................ 27
1.1.3 Level of involvement in decision-making .......................................................... 30
1.2 Optional questions ...................................................................................... 33
How to analyse ............................................................................................ 46
Further Information ...................................................................................... 47
References in full ......................................................................................... 50
Introduction
Purpose of this toolkit
As more and more Neighbourhood Planning Qualifying Bodies 1 (QBs) seek to develop
household, resident and interest group surveys to aid their evidence gathering, it becomes
increasingly important that such surveys are effective, easy to analyse and produce the data
hoped for. This toolkit is aimed at neighbourhood planners who may be developing a survey
for the first time and explains how Parish and Town Councils and Neighbourhood Forums can
best approach a survey phase and use the data and evidence produced to maximum effect in
justifying their neighbourhood plan policies. Essentially, this toolkit is for QBs and their sub-
groups, volunteers or consultants. It is worth noting that the Planning Practice Guidance
advises that plan makers should avoid expending significant resources on primary research
(information that is collected through surveys, focus groups or interviews etc. and analysed to
produce a new set of findings) as this will in many cases be a disproportionate way of
establishing an evidence base. They should instead look to rely predominantly on secondary
data (e.g. Census, national surveys) to inform their assessment which are identified within
the Planning Practice Guidance2.
Local communities have been producing Neighbourhood Development Plans since 2011 and
since then over 2,000 communities have begun or completed their neighbourhood plans with
over 230 passing through their referendum phase and over 200 neighbourhood plans ‘made’
by local councils and integrated into their local plans3. Neighbourhood plans are presenting
real opportunities for local communities to help shape the development and growth of their
local area. However, communities face a number of challenges during the plan-making
process due to a lack of guidance on data collection and analysis methods suitable for
neighbourhood planning. As a result, data is often incomparable across wards, local boroughs
and nationally; and evidence collected challengeable due to survey bias.
1 A Qualifying Body is a town or parish council or a neighbourhood forum formed of at least 21 people 2 Further information on the Planning Practice Guidance can be found at:
http://planningguidance.communities.gov.uk/blog/guidance/housing-and-economic-development-needs-assessments/methodology-assessing-housing-need/ 3 See DCLG Newsletter, Oct 2016

This toolkit sets out a set of core questions and optional questions covering a range of topics
relevant to the neighbourhood planning process that can be applied to any evidence-based
data being produced. By using questions contained in this toolkit, the reviewer can
strengthen their analysis of the evidence and improve decision-making based on better
quality and fit-for-purpose neighbourhood plan data. It can also be used by QBs to help them
focus their priorities and as well as help improve the process of carrying out social surveys to
gather evidence.
This toolkit has been drafted by AECOM for Locality. At AECOM we have extensive knowledge
and experience of designing surveys as part of planning engagement exercises conducting
social impact work and as part of our technical support work for neighbourhood planning
bodies.
The next section will present a brief overview of neighbourhood planning to provide a useful
background context for the development of this toolkit.
Neighbourhood Planning
The Localism Act 2011 gave communities direct power to shape the development and growth
of their local area through a Neighbourhood Development Plan or by granting planning
permission through Neighbourhood Development Orders 4 and Community Right to Build
Orders5. A Neighbourhood Development Plan establishes the use and development of land and
the general planning policies for development6.
4 Neighbourhood Development Orders allow for the granting of planning permission for specific types of development in a specific
neighbourhood area. A neighbourhood area can apply to a specific site, sites, or wider geographical area, grant planning permission for a certain type or types of development and grant planning permission subject to conditions. Further information can be found at: http://planningguidance.communities.gov.uk/blog/guidance/neighbourhood-planning/what-is-neighbourhood-planning/what-is-a-neighbourhood-development-order/ 5 A Community Right to Build Order is a type of Neighbourhood Development Order and forms one of the neighbourhood planning tools
introduced in the Localism Act 2011. It can be used to grant outline or full planning permission for specific development which complies with the order. For example: homes, shops, businesses, affordable housing for rent or sale, community facilities or playgrounds. Further information can be found at: http://mycommunity.org.uk/resources/understanding-the-community-right-to-build/ 6 Further advice on the neighbourhood planning process can be found at ‘Neighbourhood Planning Roadmap Guide’ http://locality.org.uk/resources/neighbourhood-planning-roadmap-guide/
This includes:
Where new buildings (such as homes and offices) and facilities should be built
What places and new development should look like
Improving certain areas
Allocating sites for specific types of development
Protecting the environment
Promoting sustainable development7.
Establishing at an early stage local opinion and facts on issues relating to the six bullets above
can help to establish the vision, priorities, and objectives of a neighbourhood plan.
As of summer 2016, around 2,000 communities across England have taken up their new
neighbourhood planning powers. There have been over 200 neighbourhood planning
referendums, all except one of which have been successful, with an average yes vote of 88%8.
Qualifying bodies (which are Town or Parish Councils or Neighbourhood Forums) can
undertake formal and informal surveys to develop a more in-depth understanding of local
issues and especially residents, businesses and other stakeholders’ aspirations for the future,
concerns for the present and characteristics. They inform the future vision for an area and
guide the emergence of policy priorities to guide development for the next 15-20 years. They
also provide an important engagement point in their own right with some QBs sending out a
household survey to every household in their area.
Consultation and evidence base
To meet the basic conditions, a neighbourhood plan has to be based on a ‘proportional’ but
credible evidence base, which entails gathering data and information about the
7 Sustainable development is development that “meets the needs of the present without compromising the ability of future generations to
meet their needs”. The National Planning Policy Framework (NPPF) sets out five principles of sustainable development: living within the planet’s means; ensuring a strong, healthy and just society; achieving a sustainable economy; promoting good governance; and using sound science responsibly (Locality, Roadmap Guide, 2016). A QB must demonstrate that its plan has given consideration of how any potential adverse effects from proposals may be prevented, reduced or offset (DCLG, 2014). 8 DCLG Newsletter, Oct 2016

neighbourhood area and analysing this to gain a fuller understanding of the local issues. Data
might be gathered on local demographics, social environment, local economy, infrastructure,
community services, and levels of engagement amongst residents in the local community.
The amount of evidence gathered needs to be proportionate to the scale of ambition relating
to the policies in a neighbourhood plan and the degree to which those policies challenge
existing policy (for example the Local Plan or Core Strategy).
As part of the process of producing a neighbourhood plan, QBs will typically undertake a
range of informal engagement and more formal stakeholder consultation in order to produce
a robust evidence base and to consult on draft proposals. This helps to increase the group’s
understanding of the local area and creates more practical, tested and realistic
neighbourhood plans. Engagement with local residents also ensures that the local community
is involved in the process and participates in developing both the vision and detailed
proposals for their local area.
Establishing an evidence base and carrying out stakeholder engagement are key steps in the
neighbourhood planning process and will help ensure that neighbourhood plans are relevant
and based on the needs and desires of the community. Without sufficient and relevant
evidence the plan can be modified or even thrown out by independent examiners and
challenged both informally and through legal challenge by others opposed to sections of the
plan, and it can give the plan less importance in future planning decision9.
‘Further Information’ provides a list of useful resources that can be drawn upon when
undertaking a consultation and developing an evidence base.
9 Further advice on the process of gathering and using evidence can be found at:
http://mycommunity.org.uk/resources/how-to-gather-and-use-evidence/

Overview of the toolkit
What is the toolkit and why is it needed?
This toolkit is a simple, easily accessible and evidence-driven tool that has been developed to
support the neighbourhood planning process and to help QBs analyse their survey data
relevant to robust planning policies. The toolkit sets out good practice for conducting social
surveys and explains the types of surveys that can be used during the neighbourhood planning
process.
There are any number of questions that can and are asked by QBs when conducting a survey.
Some are more effective than others however, and the toolkit contains a set of recommended
survey questions that can be used by QBs to collect survey data. These questions are simple,
easy to use and are effective at eliciting the most useful response to inform a neighbourhood
development plan. In addition, the recommended questions have been selected based on
their comparability with existing data-sets publically available.
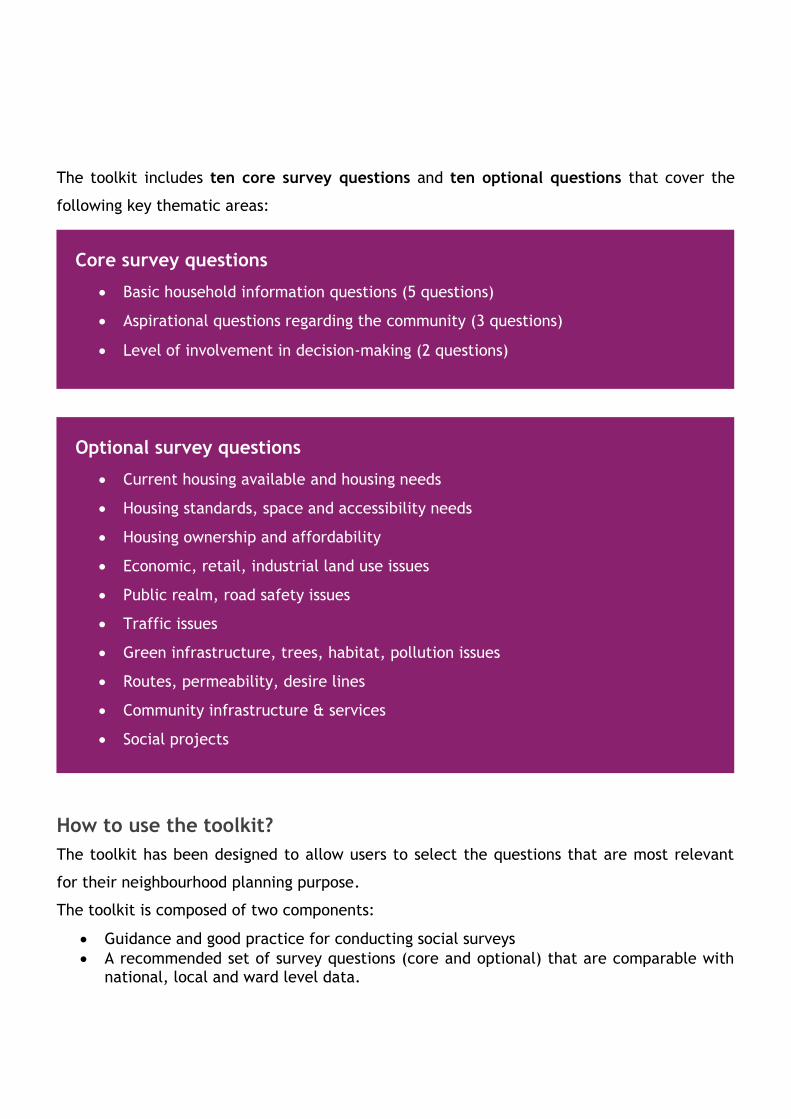
The toolkit includes ten core survey questions and ten optional questions that cover the
following key thematic areas:
How to use the toolkit?
The toolkit has been designed to allow users to select the questions that are most relevant
for their neighbourhood planning purpose.
The toolkit is composed of two components:
Guidance and good practice for conducting social surveys
A recommended set of survey questions (core and optional) that are comparable with national, local and ward level data.
Core survey questions
Basic household information questions (5 questions)
Aspirational questions regarding the community (3 questions)
Level of involvement in decision-making (2 questions)
Optional survey questions
Current housing available and housing needs
Housing standards, space and accessibility needs
Housing ownership and affordability
Economic, retail, industrial land use issues
Public realm, road safety issues
Traffic issues
Green infrastructure, trees, habitat, pollution issues
Routes, permeability, desire lines
Community infrastructure & services
Social projects
The ‘Survey Questions’ section presents a table set out by thematic area which provides
available data at the national level, local level (borough) and neighbourhood level (ward) for
allowing useful comparisons to be made to understand the extent to which the neighbourhood
differs from local and national characteristics for a given theme. A recommended survey
question for use by QBs is then provided, with an explanation and rationale for the question
selected. Each set of data for each level (national, local, and neighbourhood) is referenced
with the source and a website link where possible. The data that will be provided by the
survey questions is comparable to a wide range of existing sources from national and local
level statistics, such as census data, traffic safety and air pollution datasets.
At the national level the links in the first column ‘National Level Data’ of the table, data is
included from ONS datasets: Household Census 2011, Community Life Survey 2015, Labour
Force Survey 2014, Opinions and Lifestyle Survey 2015, and British Social Attitudes Survey
2014. At the local and neighbourhood level comparable data is included from ONS
Neighbourhood Statistics, Crash Map, Magic, and How Polluted is my Road. Each dataset is
presented for each thematic area with the full links to these datasets provided in
‘References in full’ section.
At the end of the toolkit are links to further information on resources for neighbourhood
planning from Locality, Forum for Neighbourhood Planning, Open Spaces Society, and others.
The full list is found in the ‘Further Information’ section .
Limitations
There are a number of limitations to using the toolkit which should be taken into
consideration. Not least that a limited number of questions are focused on here. It is
important to remember that while there are hundreds of publicly available datasets to
support the comparison of data findings, there may be limitations in terms of answering the
research questions QBs are asking. These limitations relate to the age of the data, the
geographic areas covered and selection of appropriate datasets that relate to the questions
asked in a neighbourhood planning survey. For example, many neighbourhood plan areas
correspond directly with ward or parish boundaries. In these cases, data gathering will be a
relatively straightforward process where all Census data for 2011 is available at ward and
parish level. In cases where neighbourhood plan areas do not correspond directly with ward or
parish boundaries, a ‘best fit’ approach will need to be adopted. Users will need to be aware
of drawing conclusions about a specific neighbourhood from data that is general to, or from,
a much larger geographical area.
Gathering existing data
Neighbourhood planners often start with some understanding of the social, economic and
environmental context of their area and the associated local issues, aspirations and
opportunities. Up-to-date, objective and relevant data is central to confirming or challenging
these early thoughts and building a relevant evidence base. Neighbourhood surveys are best
used when there are clear gaps in available data, when the existing data is considered out of
date or where the existing data begs more questions than it answers. Gathering, presenting
and interpreting data about the local social, economic and environmental context of an area
will provide the evidence necessary to underpin the development of a sound neighbourhood
plan.
The first step is to review information that already exists and is publically available, such as
data collected for a council’s Local Plan, socio-economic data, neighbourhood statistics and
other reports and studies of the local area10. After a review of existing evidence, if any gaps
are identified it may be necessary to collect new evidence by conducting a survey using a
questionnaire to gather local information, for example on community facilities, traffic flows,
local businesses in the area and so on11 . However, QBs should beware ‘rushing out’ to
conduct a survey as it is better to plan well and ensure that the questionnaire is going to be
effective and asks the right questions.
The different approaches to carrying out surveys with local stakeholders are set out in the
‘Conducting social surveys’ section.
10 Further information and links to guidance documents on undertaking neighbourhood surveys are provided in ’Further Information’ and
‘References in full’. 11 See Locality Quick Guide, 2013
Conducting social surveys
This section sets out the purpose and objectives of conducting social surveys and the
different methods that can be used to collect data using a survey.
Purpose
The purpose of carrying out a social survey is to collect information that will answer a
specific research question or set of questions. The first consideration in designing a survey is
to define the objectives of the survey in the context of these questions. By conducting a
social survey a large amount of data can be collected on the characteristics of a local area
(e.g. demography, socio-economic), as well as the attitudes and opinions of local residents
and businesses, which can then be easily analysed to help the QB draw conclusions.
Relating your objectives to research questions
It is important to frame the objectives of the research question. The research objectives set
out what the QB is intending to do, where and for what purpose. If the objectives are not
defined then the research will lack clear direction and the data gathered will not inform the
research question. The objectives should be clear, concise and measurable. When developing
objectives it is useful to use the S.M.A.R.T. guidelines: Specific, Measurable, Achievable,
Realistic, Timebound (i.e. be aware of the time constraints)12.
For QBs at an early stage, for example, the objective might be very general - to understand
better the local community’s (or specific stakeholder’s) views and opinions on living and
working in the area and issues they think the neighbourhood plan should address. At later
stages the survey objective might be much more specific, for example, to understand better
and quantify loss of habitat or cycling patterns, or access to open spaces. As part of this
process QBs have typically been developing and using a questionnaire style format to collect
evidence and the next section will discuss the different types of surveys that can be used.
12 Further guidance on developing S.M.A.R.T. objectives can be found at:
http://www.wcasa.org/file_open.php?id=910
Different types of surveys
A survey can range from a short feedback form to an extensive questionnaire or a one-to-one
interview. One-to-one interviews with local residents and businesses can range from a
structured interview that includes pre-arranged questions, to a semi-structured interview, or
an informal interview that does not contain set questions, but is a loosely structured enquiry.
Questionnaires are a popular form of collecting the evidence base as information can be
collected from a large number of people. If the questionnaire is sent by post or is available
on-line then it represents a relatively cost-effective means of collecting data. However, it
can be difficult to achieve a high response rate, particularly if the questionnaire is sent by
post or over the telephone.
Survey questions can be ‘open’ ended or ‘closed’. An open ended question does not provide
an answer so the respondent will give their own answer, while a closed question has pre-
determined answers that the respondent has to choose from. Surveys developed by QBs
mainly use closed questions with a few open questions to allow respondents to express their
opinions freely.
There are many different types of surveys and which survey is chosen will depend on the level
of detail required, resources, time available, and type of data that needs to be collected by
the Neighbourhood Forum. Each method is discussed below including the pros and cons of
using each method for neighbourhood planning purposes.
A social survey can be carried out using a number of different methods:
By post or email
On-line
One-to-one interviews
By phone
Postal survey
Surveys can be sent by post which enables the QB to cover a larger group of people and a
wider geographical area; response rates using this method tend to be less than 20%. The
response rate for postal surveys also depends on how easy it is to fill out the questionnaire,
including the content of the questionnaire, format, and length.
Online surveys
Many QB’s use online surveys (such as Survey Monkey) as using the internet is cheap and quick
and also able to reach a large number of people over a wide geographical area. Web surveys
have advantages over sending the questionnaire by email as the respondent may be cautious
about opening any attachments to protect themselves against any viruses or ‘fake’ emails. In
addition, by using programmes such as Survey Monkey the data can be downloaded directly
into an Excel table and the QB does not need to manually type in each response. However,
response rates can also be low and not all members of the population have access to the
internet or email so they would not be able to participate. For example, in 2016 10.2% of the
population (5.3 million people) had never used the internet in the U.K. while internet use is
highest in adults aged 16 to 24 (99.2%) only 38.7% of adults aged 75 years and over use the
internet13.
Face to face interviews
QB’s are also conducting face to face interviews, which is when stakeholders are asked survey
questions directly, either on the street, at their house, or at their place of work. The
response rate for face to face interviews tends to be higher that a postal or email
questionnaire but it is more time consuming and costly, which can impact on a QB when there
are only limited funds available14. (
Telephone interviews
13 Statistics such as these are available online at:
https://www.ons.gov.uk/ 14 Further information on conducting interviews can be found online:http://intqhc.oxfordjournals.org/content/15/3/261

Another method for QBs is to ask stakeholders survey questions directly by telephone. There
is often a lower response rate than a face to face interview as telephone surveys tend to be
easier to refuse due to their relatively impersonal nature. The advantages of telephone
surveys are that they are quicker, less costly (if volunteers used), and enable a wider
geographical area to be covered. They require an up to date data-base and many people will
only provide a mobile number with the associated issues of reception and the respondents
being on the move. A telephone call from a local organisation such as the QB, however may
be more warmly received than most cold-callers!
Key principles and good practice measures
The next step when designing a social survey is to think about the information the QB is trying
to gather and what it needs to know.
Designing questions
A social survey should only gather data that is relevant and it should clearly relate to the
research topic; otherwise the social survey may end up trying to cover too many questions
and this will reduce the usefulness of the data and response rate. To develop the research
questions the QB should research the study area and avoid questions that have already been
researched previously, for example by checking the available census data for the area..
For QBs, questionnaires using closed questions with pre-defined responses is easier, both for
the respondent to choose a response and for the QB to manage and analyse than open ended
Consider the following when designing a social survey1:
Initial engagement method
Length (time to complete)
Structure and design
Maximising responses
Confidentiality
Analysis – time and skills needed

questions. There are commonly two types of closed questions used in questionnaires: either a
simple yes or no response or a scaled response ranging from strongly agree, agree, neither
agree nor disagree, disagree, to strongly disagree to a statement.15 However, the questions
themselves must be clear and easy to understand and they should not manipulate a
respondent to choose a restricted answer. For example, instead of asking “Do you agree
parking is terrible?” where ‘terrible’ is an emotive word and leads the respondent on, choose
a neutral question such as “How do you rate the parking available?”.
It is also advisable to include some open-ended questions to allow respondents to express
their opinions and thoughts freely and feedback on the neighbourhood plan. In this toolkit we
have opted for a mix of closed questions using a Likert Scale and where needed an open
question for the respondent to provide a more detailed response.
Layout
A questionnaire should be designed for ease of filling out so the respondent has a clear idea
of the purpose of each section, the wording clear and easy to understand and there is clarity
on the use of the results. The questionnaire should have clear headings and instructions to
make it easy the follow. Questions shouldn’t be leading or ambiguous in their meaning, for
example, the question should not contain a view that the QB would like confirmed. An
example of a leading question would be ‘Do you think open space is important?’ as most
respondents would answer yes to this question (and therefore not take you much further
forward). Instead the question could be phrased to ask, for example, ‘Are you able to access
open space in the neighbourhood?’ or ‘How important do you feel neighbourhood open space
is?’ Phrasing questions in this way will help to remove bias and result in more reliable, useful
and objective data.
Length
There is a balance between the amount of information and feedback sought and the number
of questionnaires returned. If a questionnaire is too long this will deter people from filling it
15 This is known as a Likert Scale. A Likert Scale is commonly a five point scale which asks the respondent to respond how much they agree
or disagree with a particular statement.
in or they may not answer all of the questions. A telephone questionnaire is recommended to
be no longer than 20-30 minutes, while a postal or on-line questionnaire should not take
longer than 10 to 15 minutes to complete. Questionnaires should not exceed 8-12 sides of an
A4. Many QBs start with an initial, short questionnaire consisting mostly of open questions
(e.g. what do you most/least like about this area?) to inform their early visioning and
prioritisation. This is then followed up with a more in-depth survey at a later stage using the
contact details and permissions sought from the initial survey to go back to the same
respondents as well as others where appropriate, to seek out more in-depth information.
Response rate
To help a QB increase their response rate when using a postal or online survey, sending a
covering letter in advance informing the respondent of the survey can help. The cover letter
should explain the purpose of the survey, the organisation conducting the survey, and why
the respondent’s views are needed. Sending out a stamped addressed envelope with a postal
questionnaire can also help to increase the response rate. Telephone surveys don’t
necessarily need to contact respondents in advance, however, if a respondent is willing but
cannot complete a survey at the time of call, asking if a future time suits them better and
scheduling a follow-up call at an agreed time can be an effective method in eliciting
responses.
Other techniques used to try and increase the response rate include providing incentives such
as refreshments at drop-in sessions, or entry into a prize draw with the prize of interest to
the local population. Although using incentives is generally seen as having a positive effect on
response rates, the results are mixed, in particular for on-line surveys16. Furthermore, there
are ethical considerations surrounding the appropriateness of using financial incentives to
elicit responses to surveys. The Research Ethics Guidebook sets out the pros and cons of using
incentives such as paying individuals to participate, offering lotteries or entry into prize
draws. An ethical consideration in the use of incentives is that participants from financially
disadvantaged groups may be more vulnerable to an incentive payment, resulting in
16 For further explanation of the use of incentives, information is available at:
http://www.surveypractice.org/index.php/SurveyPractice/article/view/323/html_53
individuals responding less out of ‘free will’, rather from a position of vulnerability. However,
the counter argument is that offering a payment to participants can lead to a reduction in
non-response bias by attracting individuals who would typically be less likely to respond to
surveys and therefore it can increase the sample quality. Precisely because payment
encourages response rates, researchers may achieve a sample that is more representative of
the population being studied than could otherwise be achieved17.
Piloting
QBs should pilot their questionnaire on a small sample of the local population to help the
Forum check that respondents have understood the instructions and questions and whether
the provided answers for closed questionnaires are appropriate. An early draft of the
questionnaire can be piloted on family or QB members, a later draft on a few people
uninvolved in the QB.
Survey Questions
This section presents the core and optional recommended survey questions that have been
chosen as they are comparable. The recommended survey questions are presented by
thematic area with a table for each thematic area. Each table includes a column for
comparative data at the national level, local level (borough), and neighbourhood level
(ward), a recommended survey question for the topic, and a column for rationale on each
recommended survey question. The bottom row of the table cites the source of the data for
each column, where relevant.
17Further guidance of ethical considerations in the use of incentives is available at: http://www.ethicsguidebook.ac.uk/Are-you-paying-
participants-or-using-lotteries-or-prize-draws-192
Core survey questions
This section sets out the 10 core survey questions in a series of tables with a table for each of
the topic areas: basic household information (5 questions), aspirational questions (3
questions), and level of involvement in decision-making questions (2 questions).
A number of the recommended questions contained in the ‘basic household information’
section can be compared to similar questions in the Census, such as age and household
composition and tenure. This would facilitate the comparison and contrast of survey
responses with Census data, in order to assess how far the survey findings reflect the needs of
all households within a neighbourhood and parish. Additionally, a diversity monitoring
question covering ethnicity is proposed to facilitate the monitoring of the extent to which the
survey reached a representative cross-section of demographic groups within the survey area.
Basic household information
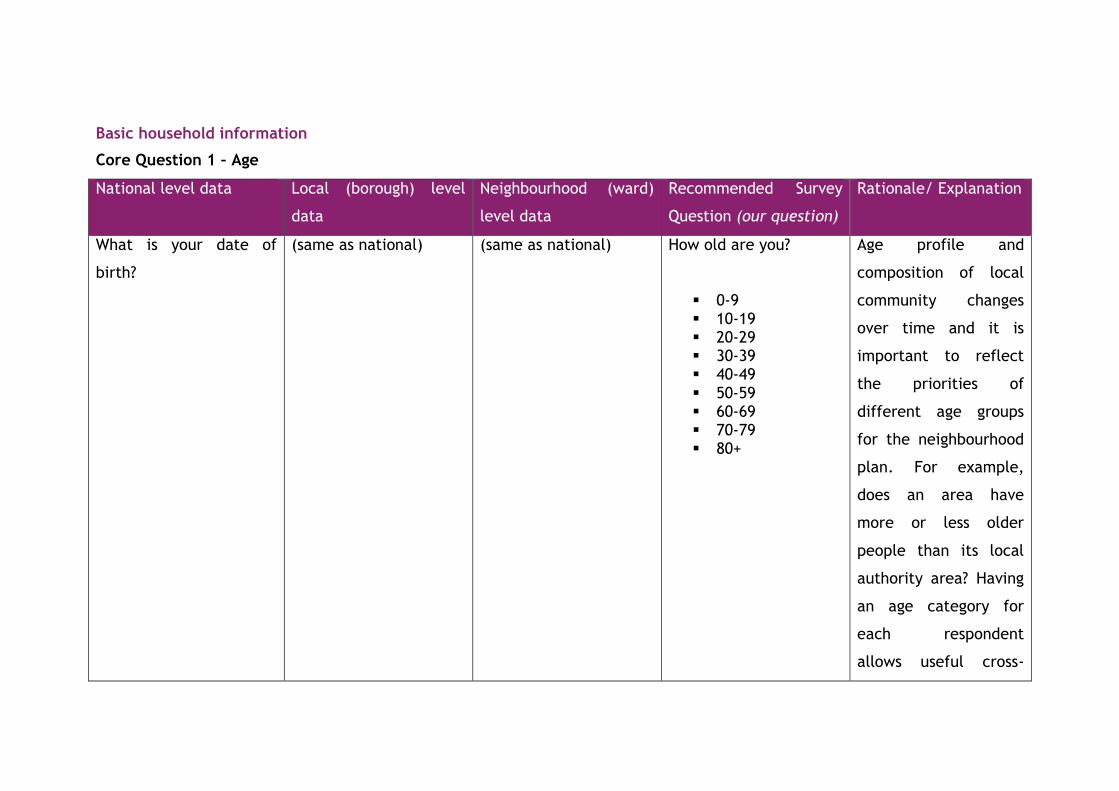
Core Question 1 – Age
National level data Local (borough) level
data
Neighbourhood (ward)
level data
Recommended Survey
Question (our question)
Rationale/ Explanation
What is your date of
birth?
(same as national)
(same as national)
How old are you?
0-9 10-19 20-29 30-39 40-49 50-59 60-69 70-79 80+
Age profile and
composition of local
community changes
over time and it is
important to reflect
the priorities of
different age groups
for the neighbourhood
plan. For example,
does an area have
more or less older
people than its local
authority area? Having
an age category for
each respondent
allows useful cross-
tabulation (analysis) of
the results.
ONS, 2011 Census
Household Questionnaire
ONS, Neighbourhood
Statistics
ONS, Neighbourhood
Statistics
Adapted from various
resources
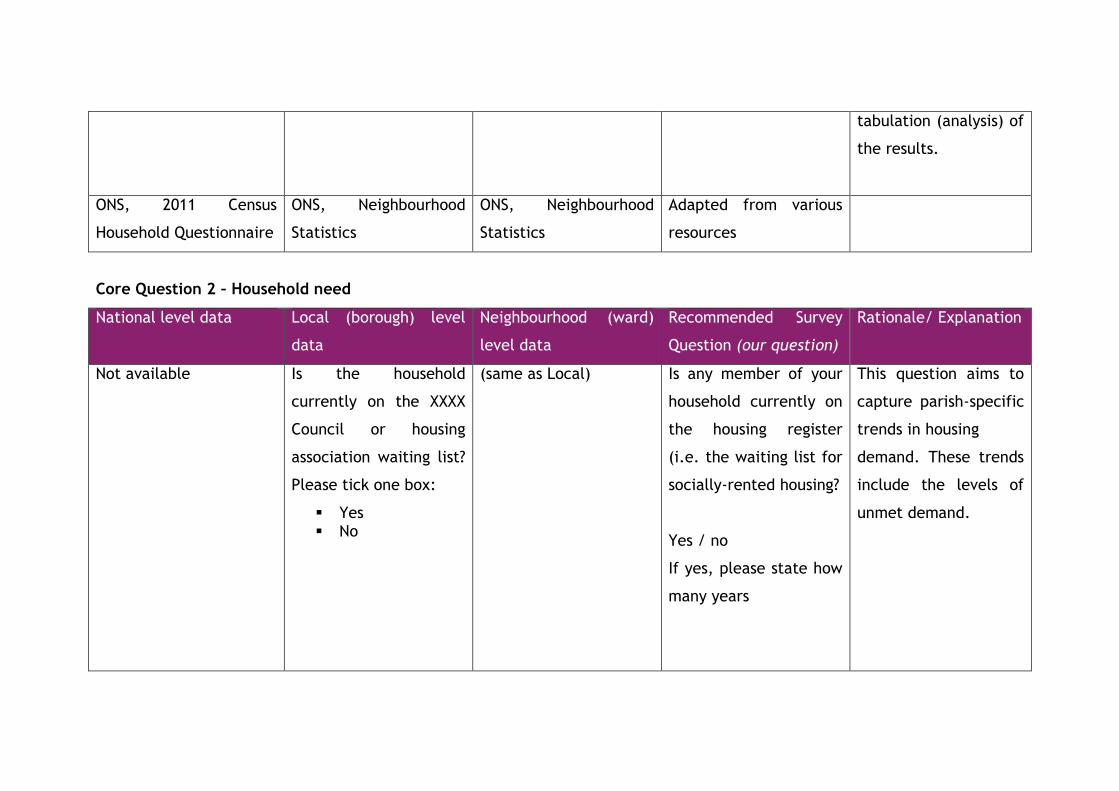
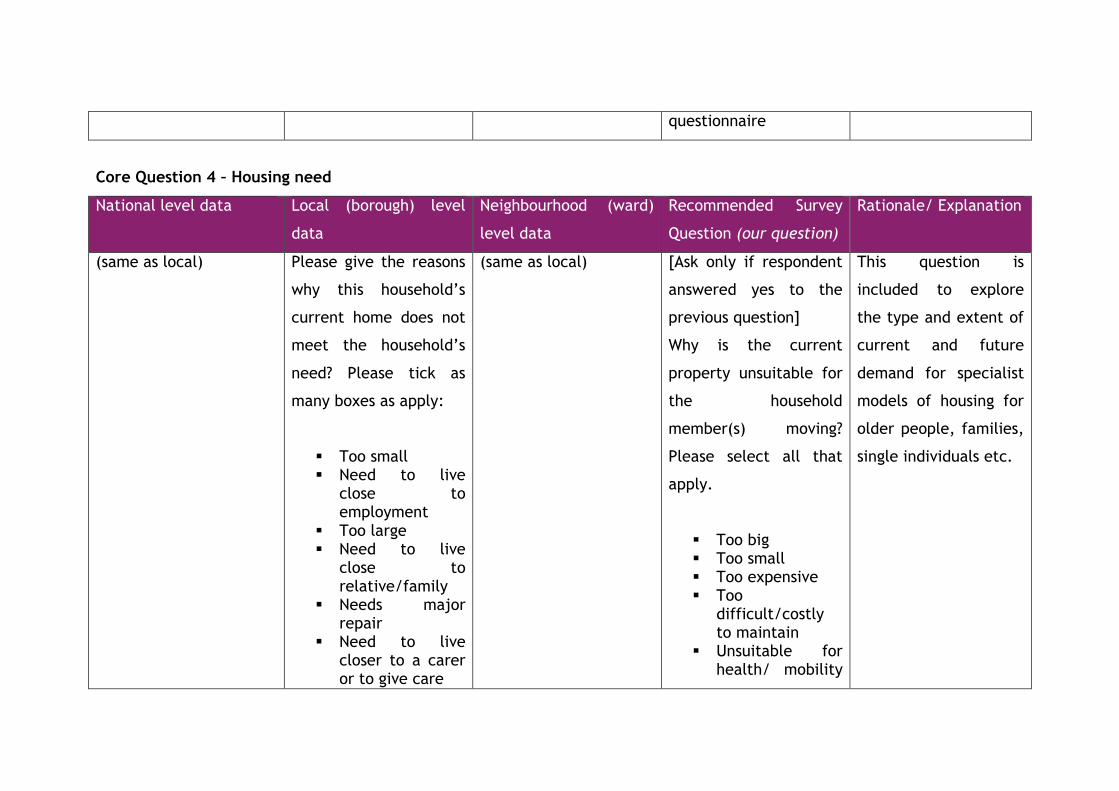
Core Question 2 – Household need
National level data Local (borough) level
data
Neighbourhood (ward)
level data
Recommended Survey
Question (our question)
Rationale/ Explanation
Not available Is the household
currently on the XXXX
Council or housing
association waiting list?
Please tick one box:
Yes No
(same as Local) Is any member of your
household currently on
the housing register
(i.e. the waiting list for
socially-rented housing?
Yes / no
If yes, please state how
many years
This question aims to
capture parish-specific
trends in housing
demand. These trends
include the levels of
unmet demand.
ONS, Neighbourhood
Statistics
Peak District model
housing needs survey
ONS, Neighbourhood
Statistics
Rottingdean
Neighbourhood Plan
Housing Needs Advice
questionnaire
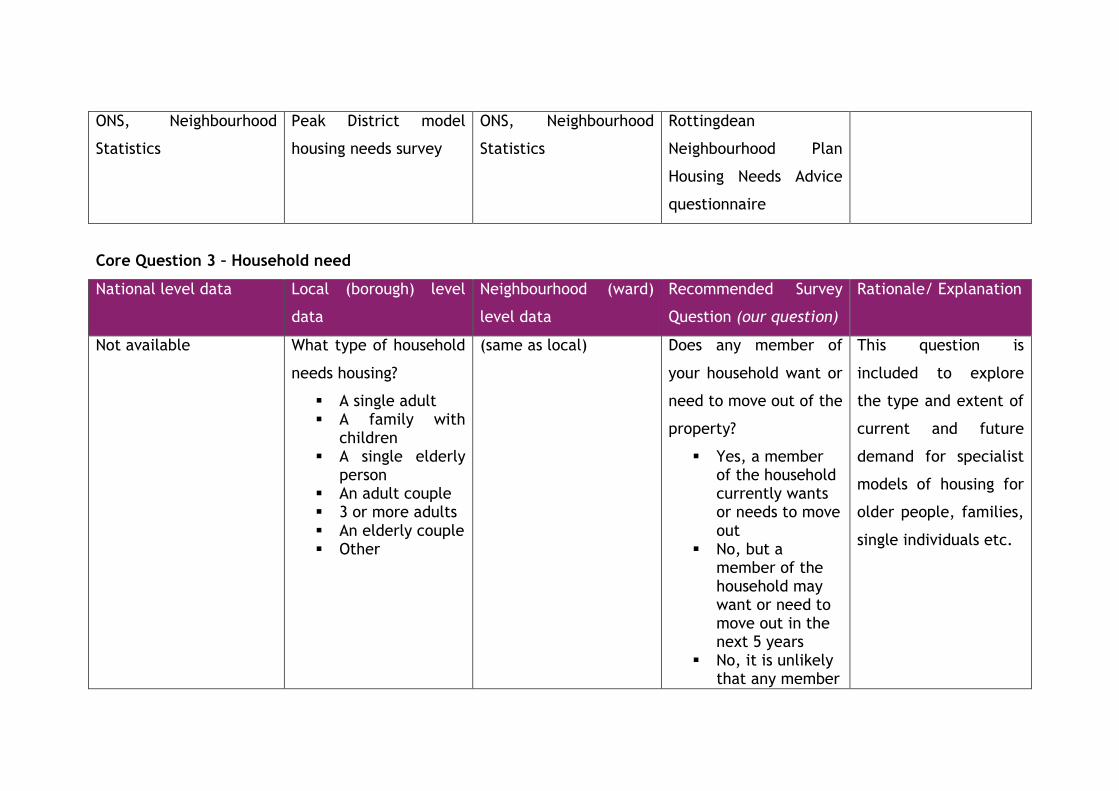
Core Question 3 – Household need
National level data Local (borough) level
data
Neighbourhood (ward)
level data
Recommended Survey
Question (our question)
Rationale/ Explanation
Not available What type of household
needs housing?
A single adult A family with
children A single elderly
person An adult couple 3 or more adults An elderly couple Other
(same as local) Does any member of
your household want or
need to move out of the
property?
Yes, a member of the household currently wants or needs to move out
No, but a member of the household may want or need to move out in the next 5 years
No, it is unlikely that any member
This question is
included to explore
the type and extent of
current and future
demand for specialist
models of housing for
older people, families,
single individuals etc.
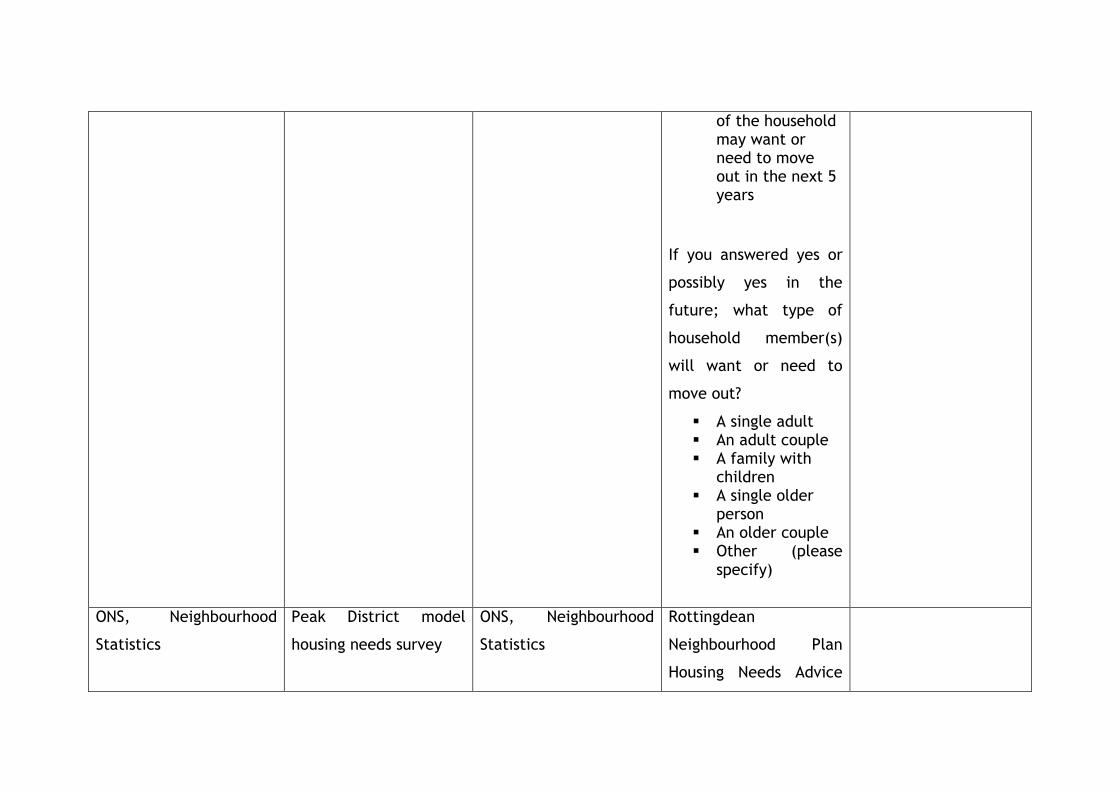
of the household may want or need to move out in the next 5 years
If you answered yes or
possibly yes in the
future; what type of
household member(s)
will want or need to
move out?
A single adult An adult couple A family with
children A single older
person An older couple Other (please
specify)
ONS, Neighbourhood
Statistics
Peak District model
housing needs survey
ONS, Neighbourhood
Statistics
Rottingdean
Neighbourhood Plan
Housing Needs Advice
questionnaire
Core Question 4 – Housing need
National level data Local (borough) level
data
Neighbourhood (ward)
level data
Recommended Survey
Question (our question)
Rationale/ Explanation
(same as local) Please give the reasons
why this household’s
current home does not
meet the household’s
need? Please tick as
many boxes as apply:
Too small Need to live
close to employment
Too large Need to live
close to relative/family
Needs major repair
Need to live closer to a carer or to give care
(same as local) [Ask only if respondent
answered yes to the
previous question]
Why is the current
property unsuitable for
the household
member(s) moving?
Please select all that
apply.
Too big Too small Too expensive Too
difficult/costly to maintain
Unsuitable for health/ mobility
This question is
included to explore
the type and extent of
current and future
demand for specialist
models of housing for
older people, families,
single individuals etc.
Unsuitable for physical needs
Want to live independently
Temporary accommodation
Being harassed Other
requirements Want/need to
live independently
Want/need to move for work reasons
Want/need to move to be closer to family
Other reasons (please specify)
ONS Development Trust
Association Scotland
Community Housing
Needs Survey Template
ONS, Neighbourhood
Statistics
Rottingdean
Neighbourhood Plan
Housing Needs Advice
questionnaire
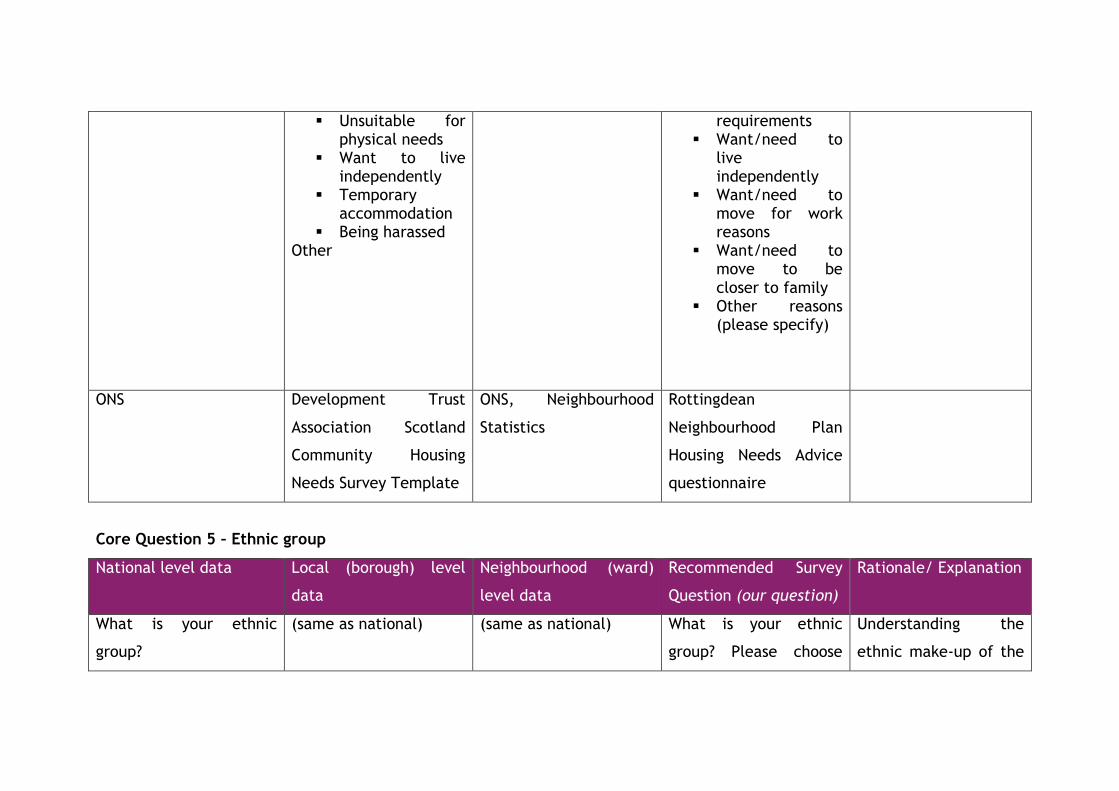
Core Question 5 – Ethnic group
National level data Local (borough) level
data
Neighbourhood (ward)
level data
Recommended Survey
Question (our question)
Rationale/ Explanation
What is your ethnic
group?
(same as national) (same as national) What is your ethnic
group? Please choose
Understanding the
ethnic make-up of the

White (English/ Welsh/ Scottish/ Northern Irish/ British)
White (Irish/ Gypsy or Irish Traveller/ Other White)
Mixed/Multiple Ethnic Groups (White and Black Caribbean/ White and Black African/ White and Asian/ Other Mixed)
Asian/Asian British (Indian/ Pakistani/ Bangladeshi/ Chinese/ Other Asian)
Black/African/Caribbean/Black British (African/ Caribbean/ Other Black)
Other Ethnic Group (Arab/ Any Other Ethnic
one option that best
describes your ethnic
group or background.
White Mixed / Multiple
ethnic groups Asian / Asian
British African Caribbean or
Black Arab Other ethnic
group
local area. Can also
provide evidence base
on accessibility to
services and provision
of additional
community
infrastructure for
different ethnic groups
when other specific
questions asked.
Having an ethnic
category for each
respondent allows
useful cross-tabulation
(analysis) of the
results.

Group)
ONS, 2011 Census
Household Questionnaire
ONS, Neighbourhood
Statistics
ONS, Neighbourhood
Statistics
Labour Force Survey
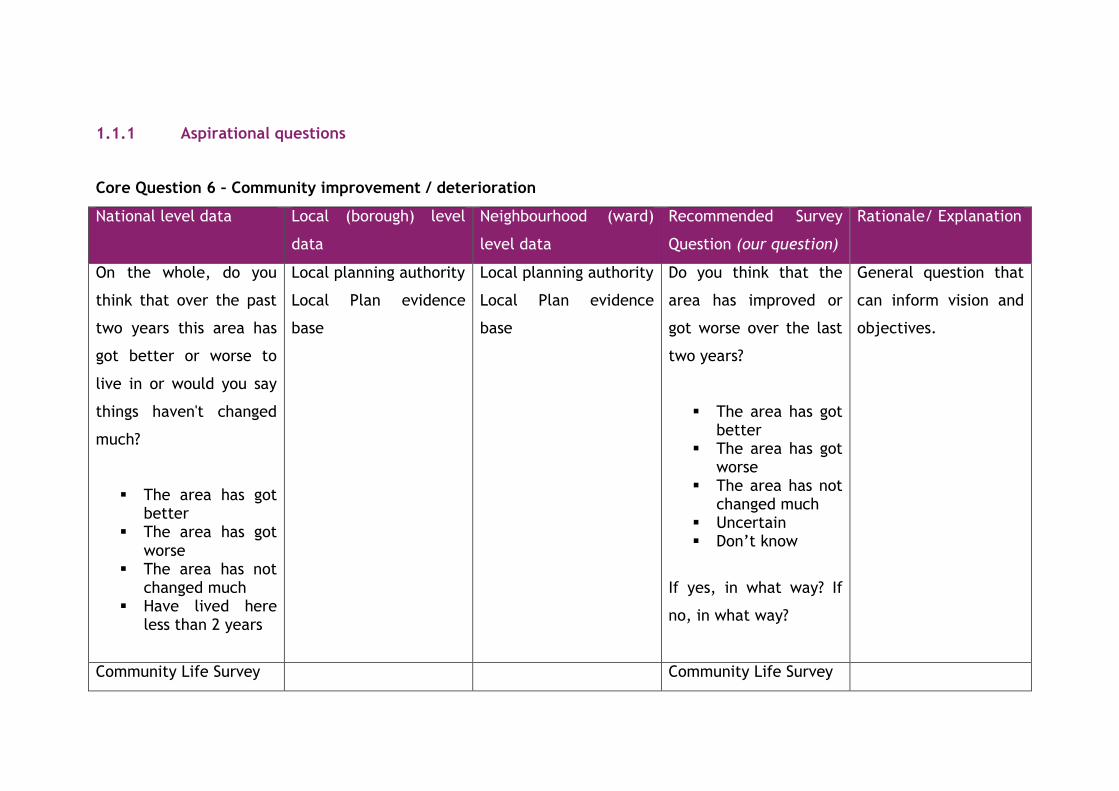
1.1.1 Aspirational questions
Core Question 6 – Community improvement / deterioration
National level data Local (borough) level
data
Neighbourhood (ward)
level data
Recommended Survey
Question (our question)
Rationale/ Explanation
On the whole, do you
think that over the past
two years this area has
got better or worse to
live in or would you say
things haven't changed
much?
The area has got better
The area has got worse
The area has not changed much
Have lived here less than 2 years
Local planning authority
Local Plan evidence
base
Local planning authority
Local Plan evidence
base
Do you think that the
area has improved or
got worse over the last
two years?
The area has got better
The area has got worse
The area has not changed much
Uncertain Don’t know
If yes, in what way? If
no, in what way?
General question that
can inform vision and
objectives.
Community Life Survey Community Life Survey
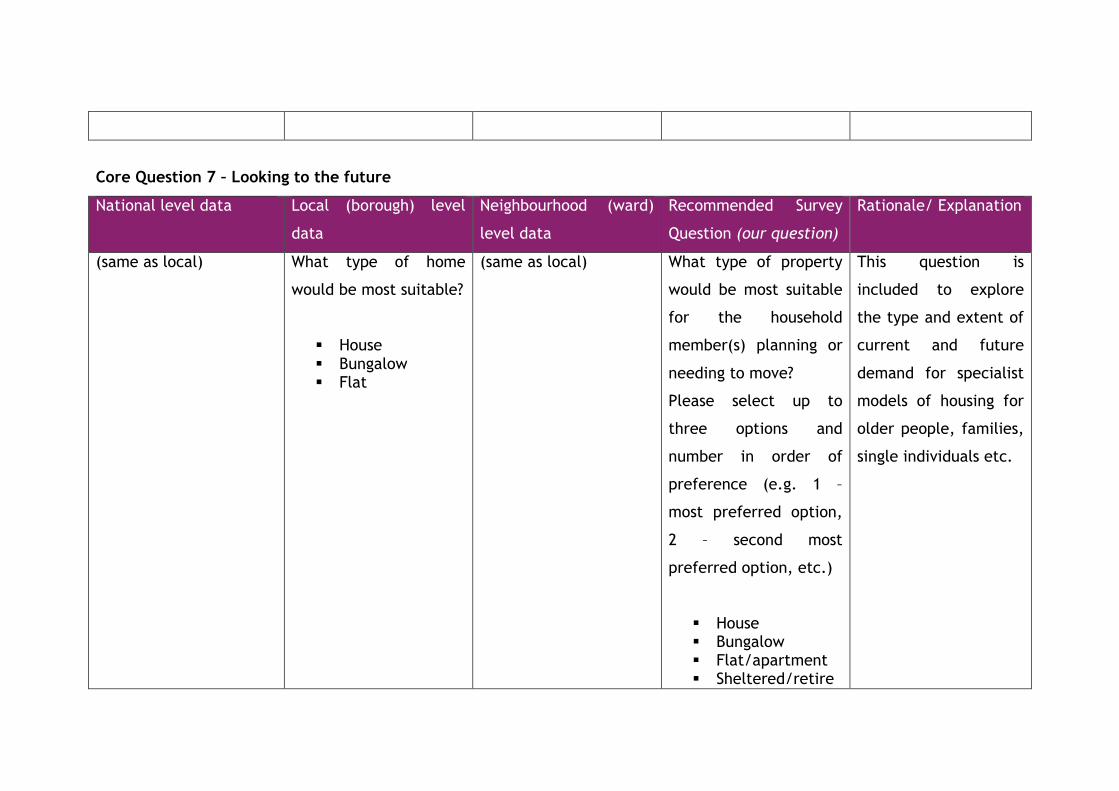
Core Question 7 – Looking to the future
National level data Local (borough) level
data
Neighbourhood (ward)
level data
Recommended Survey
Question (our question)
Rationale/ Explanation
(same as local) What type of home
would be most suitable?
House Bungalow Flat
(same as local) What type of property
would be most suitable
for the household
member(s) planning or
needing to move?
Please select up to
three options and
number in order of
preference (e.g. 1 –
most preferred option,
2 – second most
preferred option, etc.)
House Bungalow Flat/apartment Sheltered/retire
This question is
included to explore
the type and extent of
current and future
demand for specialist
models of housing for
older people, families,
single individuals etc.
ment housing Extra care
housing Other (please
specify)
ONS, Neighbourhood
Statistics
Peak District model
housing needs survey
ONS, Neighbourhood
Statistics
Rottingdean
Neighbourhood Plan
Housing Needs Advice
questionnaire
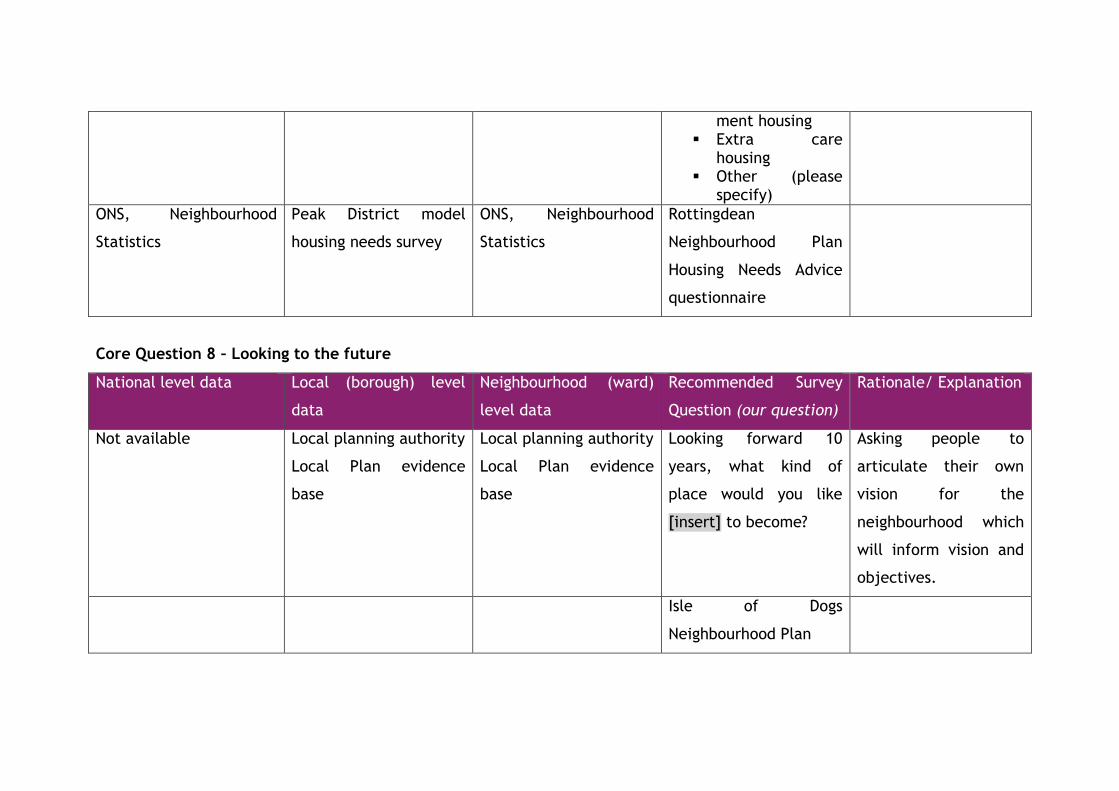
Core Question 8 – Looking to the future
National level data Local (borough) level
data
Neighbourhood (ward)
level data
Recommended Survey
Question (our question)
Rationale/ Explanation
Not available Local planning authority
Local Plan evidence
base
Local planning authority
Local Plan evidence
base
Looking forward 10
years, what kind of
place would you like
[insert] to become?
Asking people to
articulate their own
vision for the
neighbourhood which
will inform vision and
objectives.
Isle of Dogs
Neighbourhood Plan
1.1.2 Level of involvement in decision-making
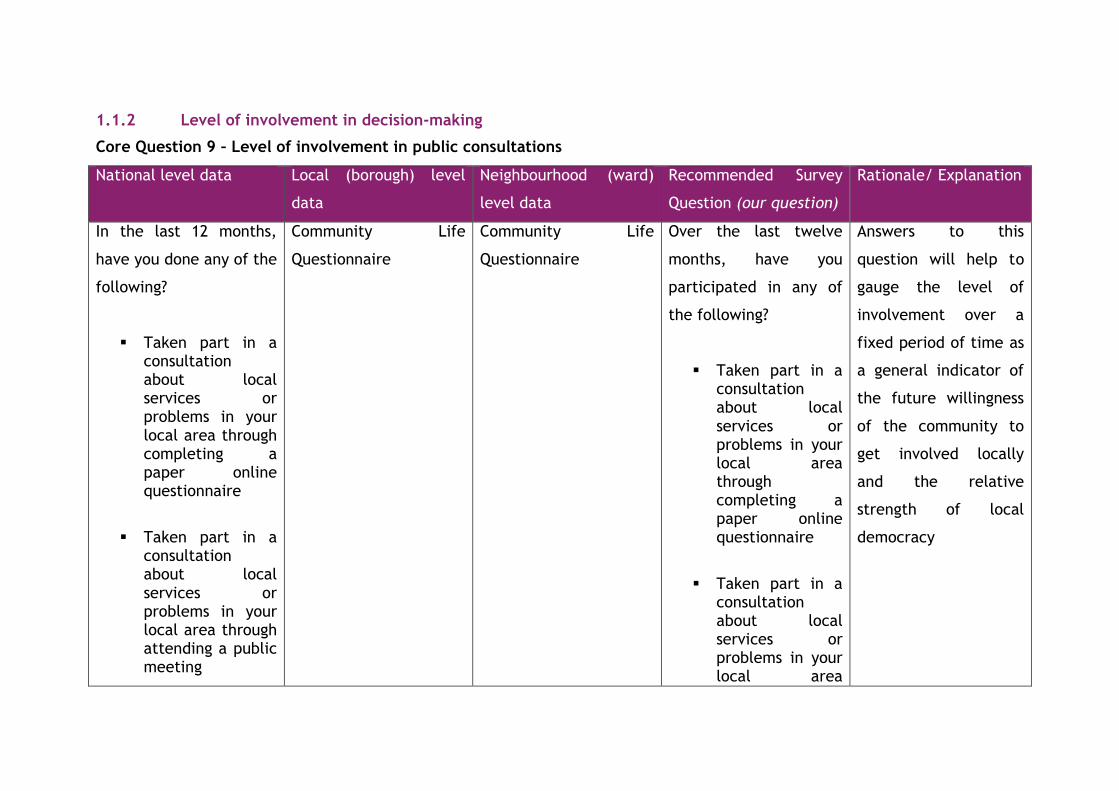
Core Question 9 – Level of involvement in public consultations
National level data Local (borough) level
data
Neighbourhood (ward)
level data
Recommended Survey
Question (our question)
Rationale/ Explanation
In the last 12 months,
have you done any of the
following?
Taken part in a consultation about local services or problems in your local area through completing a paper online questionnaire
Taken part in a consultation about local services or problems in your local area through attending a public meeting
Community Life
Questionnaire
Community Life
Questionnaire
Over the last twelve
months, have you
participated in any of
the following?
Taken part in a consultation about local services or problems in your local area through completing a paper online questionnaire
Taken part in a consultation about local services or problems in your local area
Answers to this
question will help to
gauge the level of
involvement over a
fixed period of time as
a general indicator of
the future willingness
of the community to
get involved locally
and the relative
strength of local
democracy
Taken part in a consultation about local services or problems in your local area through being involved in a face-to-face or online group
through attending a public meeting
Taken part in a consultation about local services or problems in your local area through being involved in a face-to-face or online group
Community Life Survey
Community Life Survey
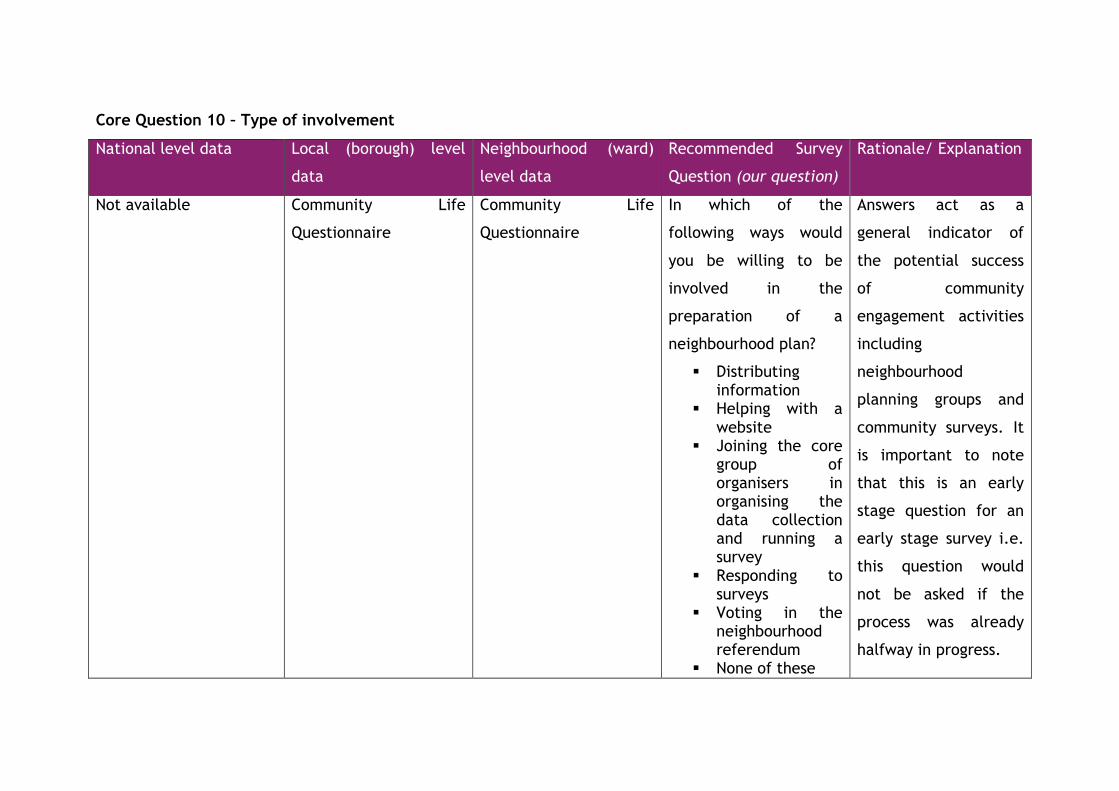
Core Question 10 – Type of involvement
National level data Local (borough) level
data
Neighbourhood (ward)
level data
Recommended Survey
Question (our question)
Rationale/ Explanation
Not available Community Life
Questionnaire
Community Life
Questionnaire
In which of the
following ways would
you be willing to be
involved in the
preparation of a
neighbourhood plan?
Distributing information
Helping with a website
Joining the core group of organisers in organising the data collection and running a survey
Responding to surveys
Voting in the neighbourhood referendum
None of these
Answers act as a
general indicator of
the potential success
of community
engagement activities
including
neighbourhood
planning groups and
community surveys. It
is important to note
that this is an early
stage question for an
early stage survey i.e.
this question would
not be asked if the
process was already
halfway in progress.
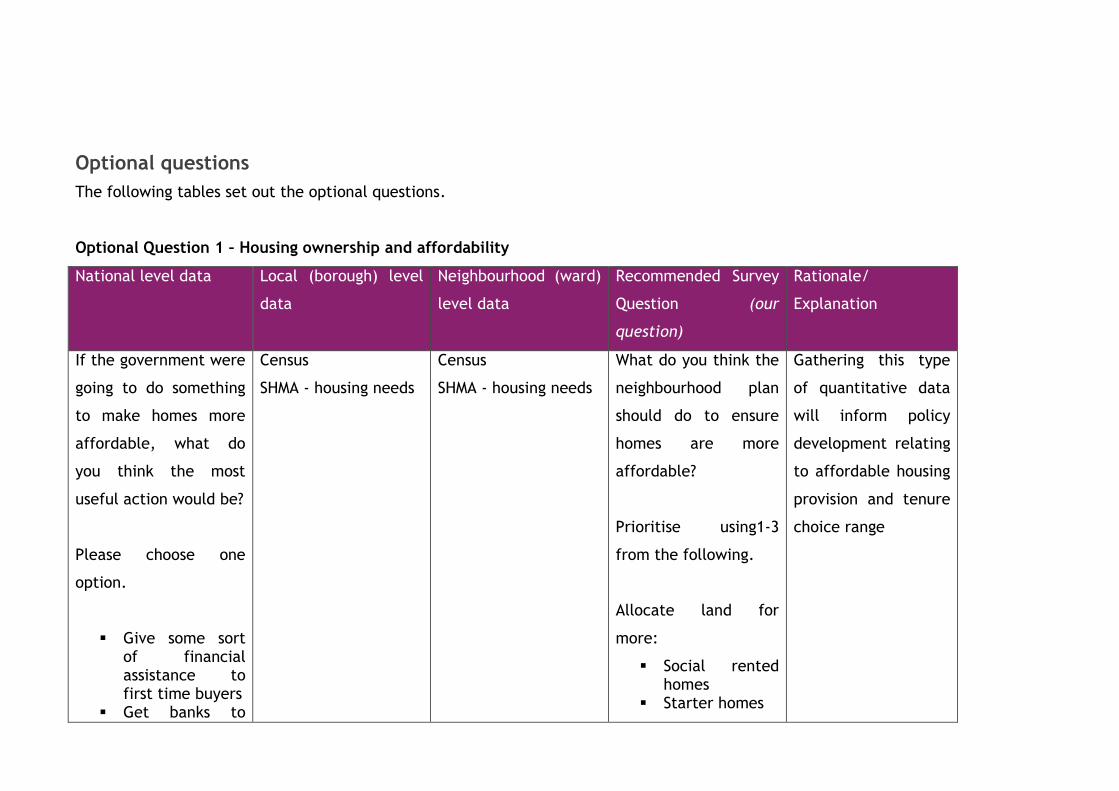
Optional questions
The following tables set out the optional questions.
Optional Question 1 – Housing ownership and affordability
National level data Local (borough) level
data
Neighbourhood (ward)
level data
Recommended Survey
Question (our
question)
Rationale/
Explanation
If the government were
going to do something
to make homes more
affordable, what do
you think the most
useful action would be?
Please choose one
option.
Give some sort of financial assistance to first time buyers
Get banks to
Census
SHMA - housing needs
Census
SHMA - housing needs
What do you think the
neighbourhood plan
should do to ensure
homes are more
affordable?
Prioritise using1-3
from the following.
Allocate land for
more:
Social rented homes
Starter homes
Gathering this type
of quantitative data
will inform policy
development relating
to affordable housing
provision and tenure
choice range

increase access to mortgages
Give more money to housing associations and local authorities to build affordable homes for those on low incomes
Give more money to shared ownership schemes
Make it more expensive to purchase second homes
Make it easier for developers to get planning permission to build more homes
Something else (SPECIFY)
Do nothing Don't know Refusal
Co-housing or co-op schemes
Shared equity homes
Self-build homes
None of the above
British Social Attitudes Based on various
Survey
sources.
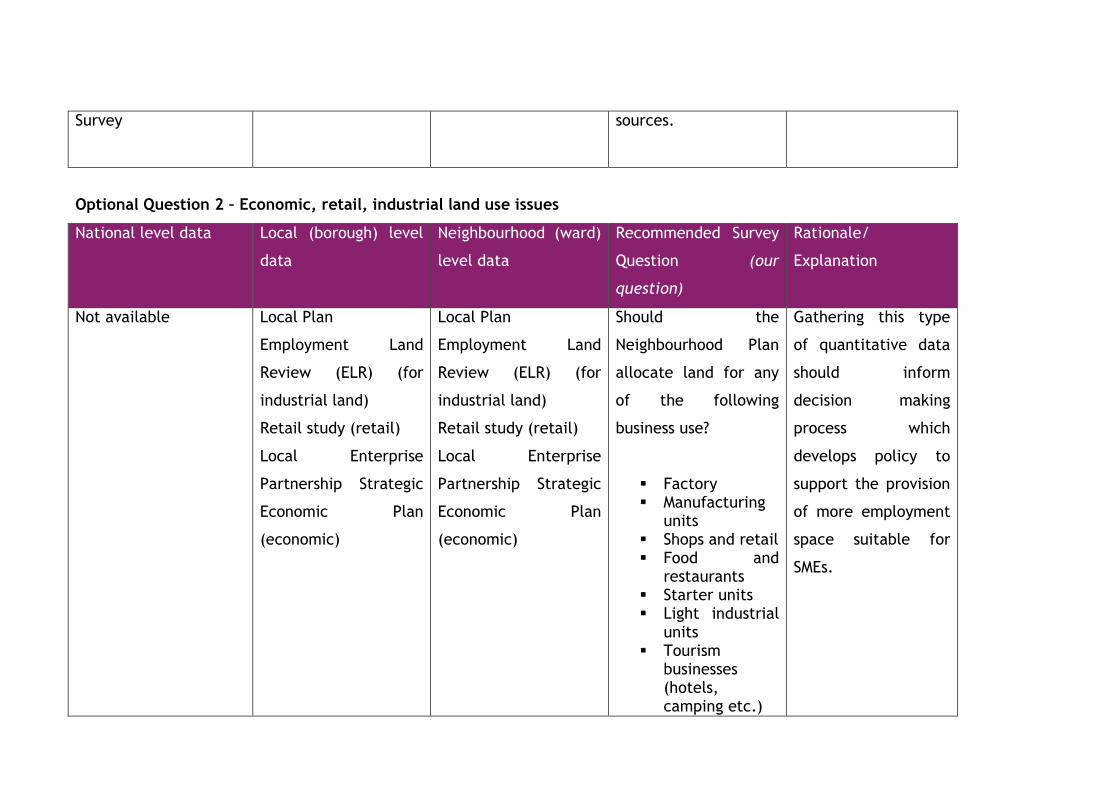
Optional Question 2 – Economic, retail, industrial land use issues
National level data Local (borough) level
data
Neighbourhood (ward)
level data
Recommended Survey
Question (our
question)
Rationale/
Explanation
Not available Local Plan
Employment Land
Review (ELR) (for
industrial land)
Retail study (retail)
Local Enterprise
Partnership Strategic
Economic Plan
(economic)
Local Plan
Employment Land
Review (ELR) (for
industrial land)
Retail study (retail)
Local Enterprise
Partnership Strategic
Economic Plan
(economic)
Should the
Neighbourhood Plan
allocate land for any
of the following
business use?
Factory Manufacturing
units Shops and retail Food and
restaurants Starter units Light industrial
units Tourism
businesses (hotels, camping etc.)
Gathering this type
of quantitative data
should inform
decision making
process which
develops policy to
support the provision
of more employment
space suitable for
SMEs.
Offices Don’t know Other (specify) None of the
above
Based on various
resources.
[Pulborough Parish
Council]
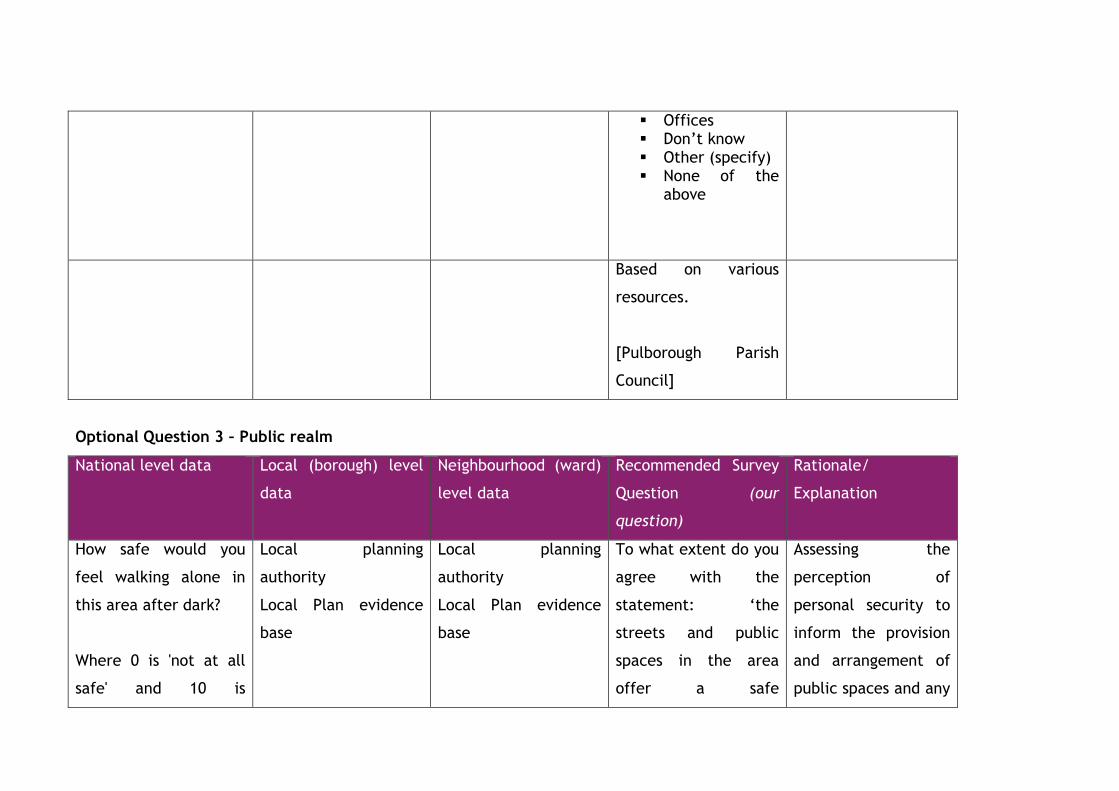
Optional Question 3 – Public realm
National level data Local (borough) level
data
Neighbourhood (ward)
level data
Recommended Survey
Question (our
question)
Rationale/
Explanation
How safe would you
feel walking alone in
this area after dark?
Where 0 is 'not at all
safe' and 10 is
Local planning
authority
Local Plan evidence
base
Local planning
authority
Local Plan evidence
base
To what extent do you
agree with the
statement: ‘the
streets and public
spaces in the area
offer a safe
Assessing the
perception of
personal security to
inform the provision
and arrangement of
public spaces and any

'completely safe'.
0 1 2 3 4 5 6 7 8 9 10
environment‘?
Strongly Agree Agree Disagree Strongly
disagree Don’t know
areas of
concentrated
deprivation.
Opinions and Lifestyle
Survey
Isle of Dogs
Neighbourhood Plan
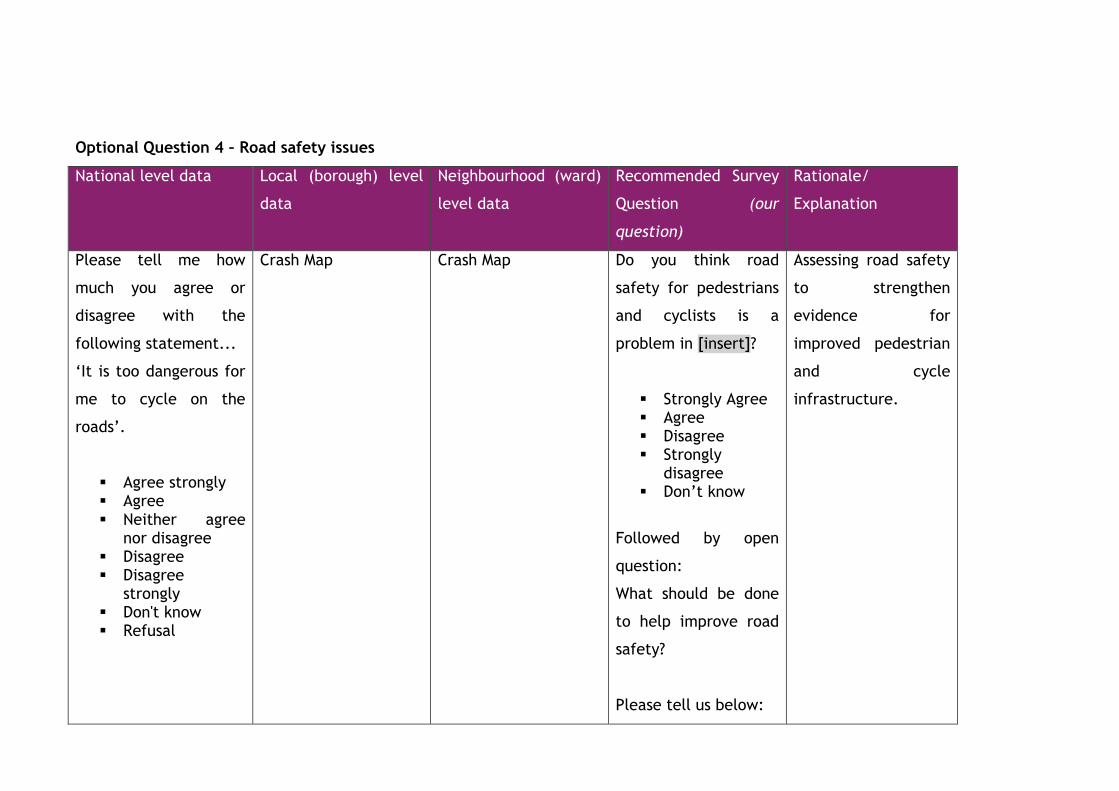
Optional Question 4 – Road safety issues
National level data Local (borough) level
data
Neighbourhood (ward)
level data
Recommended Survey
Question (our
question)
Rationale/
Explanation
Please tell me how
much you agree or
disagree with the
following statement...
‘It is too dangerous for
me to cycle on the
roads’.
Agree strongly Agree Neither agree
nor disagree Disagree Disagree
strongly Don't know Refusal
Crash Map Crash Map Do you think road
safety for pedestrians
and cyclists is a
problem in [insert]?
Strongly Agree Agree Disagree Strongly
disagree Don’t know
Followed by open
question:
What should be done
to help improve road
safety?
Please tell us below:
Assessing road safety
to strengthen
evidence for
improved pedestrian
and cycle
infrastructure.
British Social Attitudes http://www.crashmap
.co.uk/
http://www.crashmap
.co.uk/
Based on various
sources.
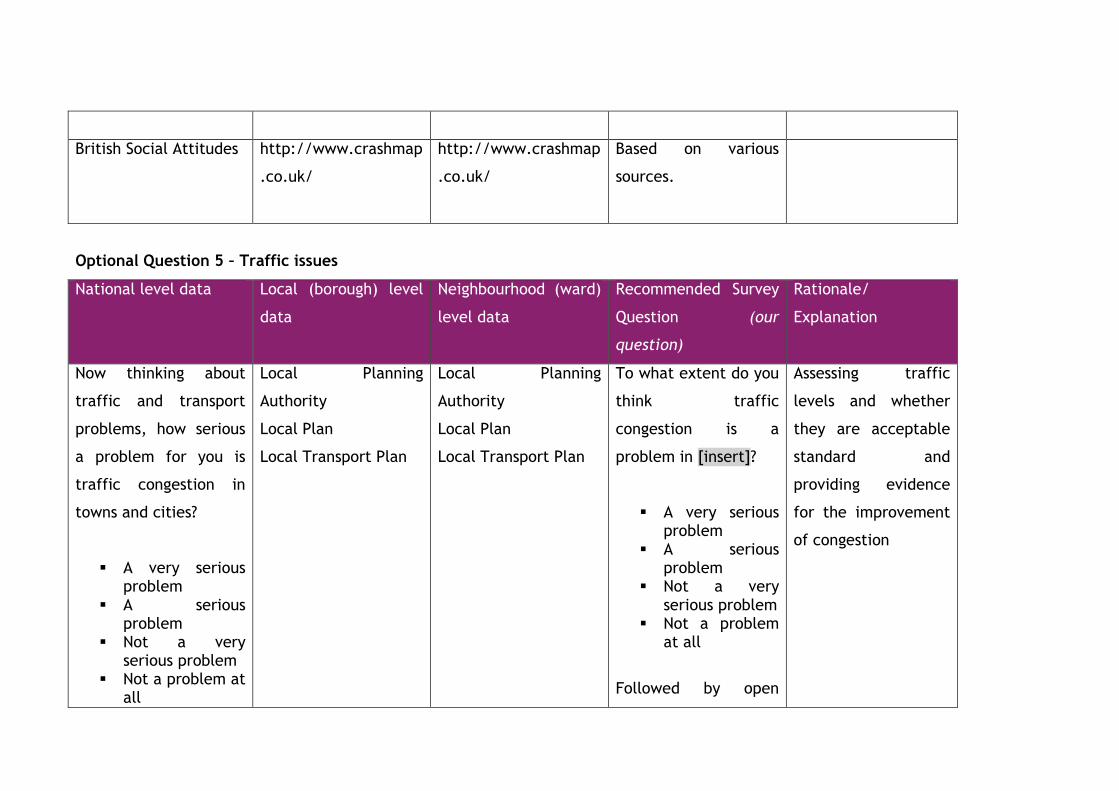
Optional Question 5 – Traffic issues
National level data Local (borough) level
data
Neighbourhood (ward)
level data
Recommended Survey
Question (our
question)
Rationale/
Explanation
Now thinking about
traffic and transport
problems, how serious
a problem for you is
traffic congestion in
towns and cities?
A very serious problem
A serious problem
Not a very serious problem
Not a problem at all
Local Planning
Authority
Local Plan
Local Transport Plan
Local Planning
Authority
Local Plan
Local Transport Plan
To what extent do you
think traffic
congestion is a
problem in [insert]?
A very serious problem
A serious problem
Not a very serious problem
Not a problem at all
Followed by open
Assessing traffic
levels and whether
they are acceptable
standard and
providing evidence
for the improvement
of congestion
(Don't know) Refusal
question: What should
be done to help
improve traffic
congestion?
Please tell us below:
British Social Attitudes
Based on various
sources.
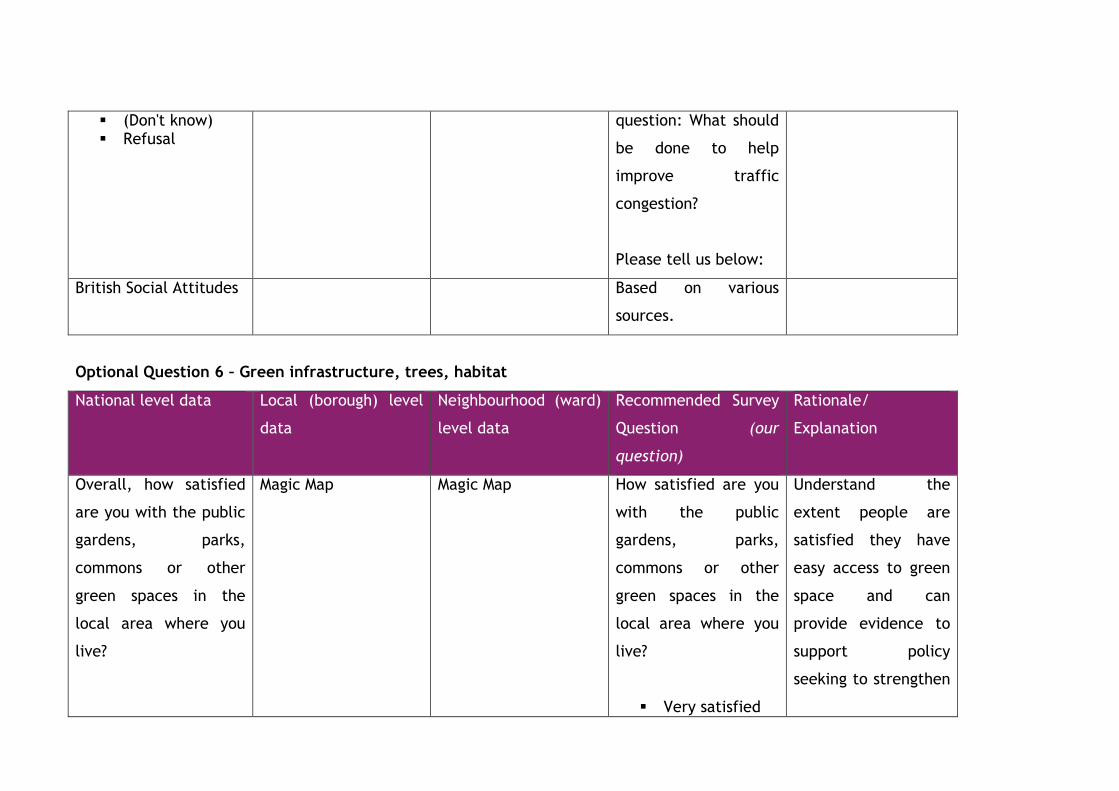
Optional Question 6 – Green infrastructure, trees, habitat
National level data Local (borough) level
data
Neighbourhood (ward)
level data
Recommended Survey
Question (our
question)
Rationale/
Explanation
Overall, how satisfied
are you with the public
gardens, parks,
commons or other
green spaces in the
local area where you
live?
Magic Map Magic Map How satisfied are you
with the public
gardens, parks,
commons or other
green spaces in the
local area where you
live?
Very satisfied
Understand the
extent people are
satisfied they have
easy access to green
space and can
provide evidence to
support policy
seeking to strengthen
Satisfied Neither
satisfied nor dissatisfied
Dissatisfied Very
dissatisfied
green infrastructure
and public open
space.
Opinions and Lifestyle
Survey
www.magic.gov.uk www.magic.gov.uk Isle of Dogs
Neighbourhood Plan
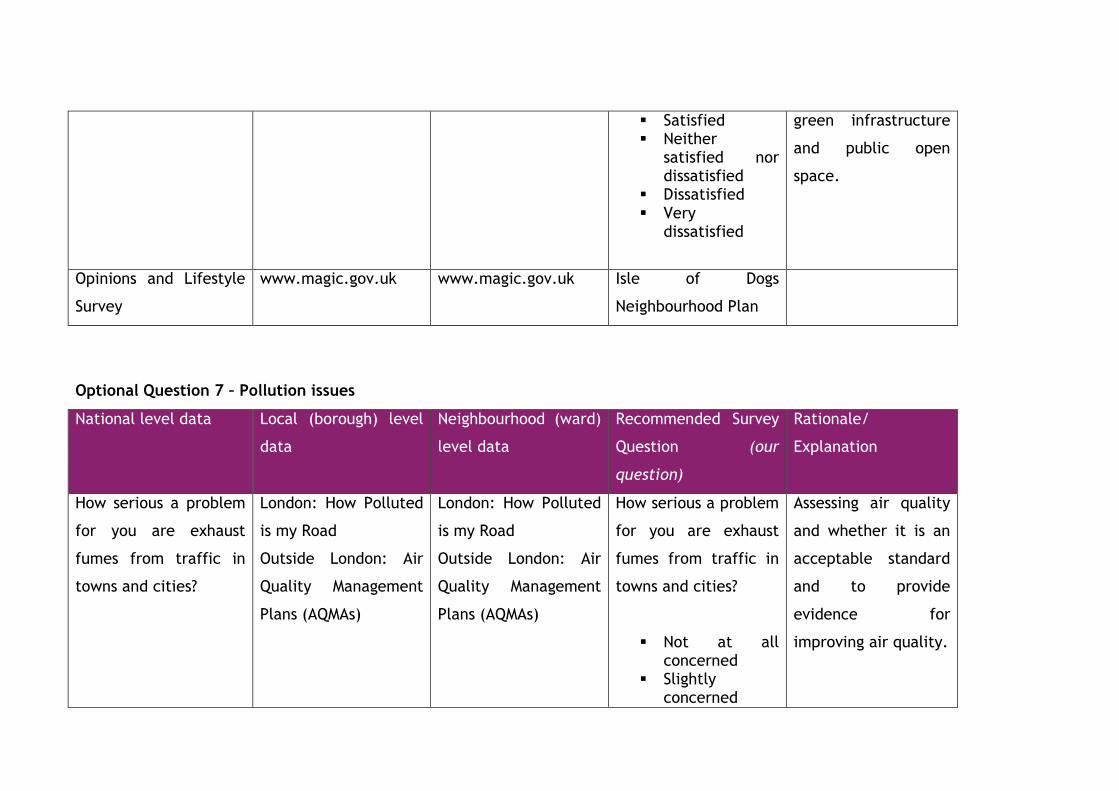
Optional Question 7 – Pollution issues
National level data Local (borough) level
data
Neighbourhood (ward)
level data
Recommended Survey
Question (our
question)
Rationale/
Explanation
How serious a problem
for you are exhaust
fumes from traffic in
towns and cities?
London: How Polluted
is my Road
Outside London: Air
Quality Management
Plans (AQMAs)
London: How Polluted
is my Road
Outside London: Air
Quality Management
Plans (AQMAs)
How serious a problem
for you are exhaust
fumes from traffic in
towns and cities?
Not at all concerned
Slightly concerned
Assessing air quality
and whether it is an
acceptable standard
and to provide
evidence for
improving air quality.
Moderately concerned
Very concerned Extremely
concerned
British Social Attitudes www.howpollutedismy
road.org.uk
www.howpollutedismy
road.org.uk
Based on various
resources.
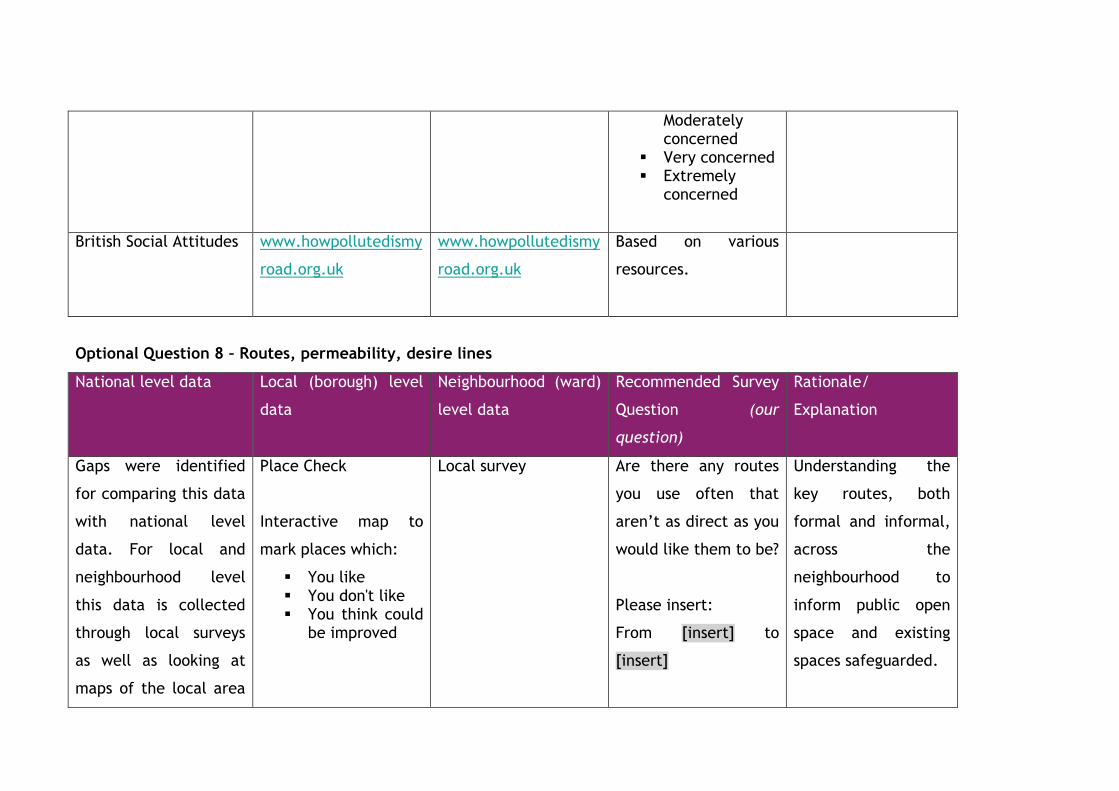
Optional Question 8 – Routes, permeability, desire lines
National level data Local (borough) level
data
Neighbourhood (ward)
level data
Recommended Survey
Question (our
question)
Rationale/
Explanation
Gaps were identified
for comparing this data
with national level
data. For local and
neighbourhood level
this data is collected
through local surveys
as well as looking at
maps of the local area
Place Check
Interactive map to
mark places which:
You like You don't like You think could
be improved
Local survey Are there any routes
you use often that
aren’t as direct as you
would like them to be?
Please insert:
From [insert] to
[insert]
Understanding the
key routes, both
formal and informal,
across the
neighbourhood to
inform public open
space and existing
spaces safeguarded.
to assess permeability.
http://holisticcity.co.
uk/placecheck/nottin
gham
Based on various
resources.
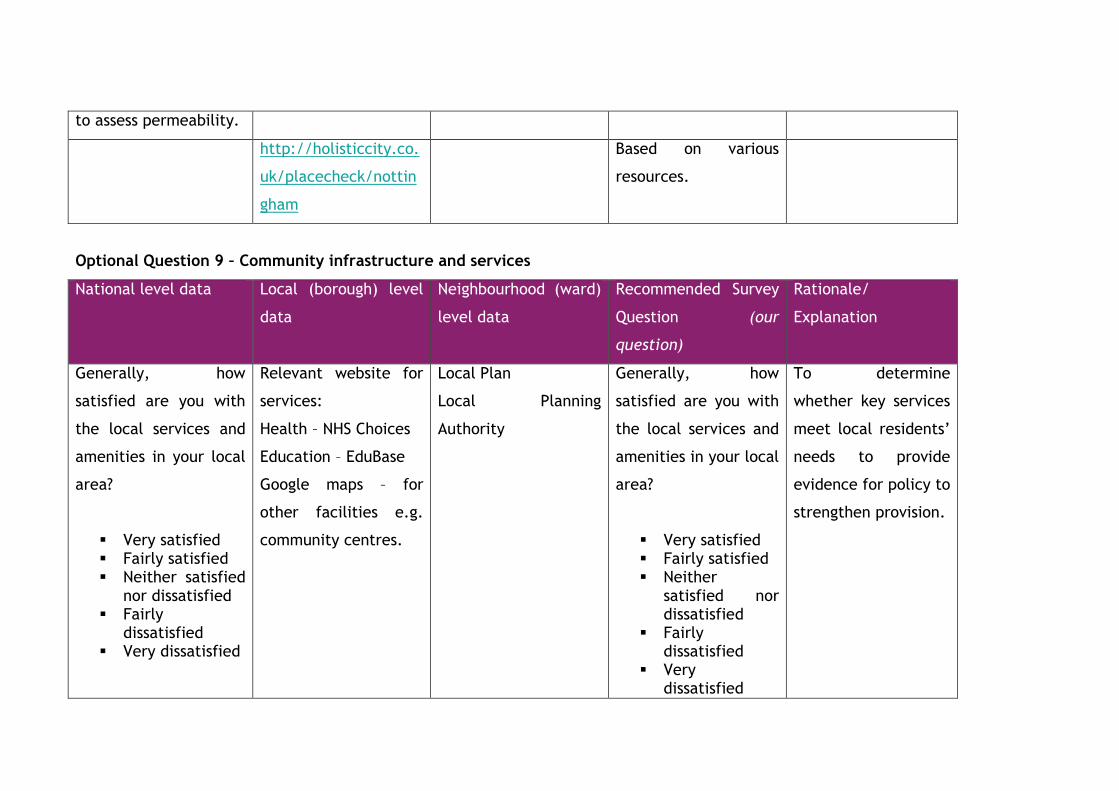
Optional Question 9 – Community infrastructure and services
National level data Local (borough) level
data
Neighbourhood (ward)
level data
Recommended Survey
Question (our
question)
Rationale/
Explanation
Generally, how
satisfied are you with
the local services and
amenities in your local
area?
Very satisfied Fairly satisfied Neither satisfied
nor dissatisfied Fairly
dissatisfied Very dissatisfied
Relevant website for
services:
Health – NHS Choices
Education – EduBase
Google maps – for
other facilities e.g.
community centres.
Local Plan
Local Planning
Authority
Generally, how
satisfied are you with
the local services and
amenities in your local
area?
Very satisfied Fairly satisfied Neither
satisfied nor dissatisfied
Fairly dissatisfied
Very dissatisfied
To determine
whether key services
meet local residents’
needs to provide
evidence for policy to
strengthen provision.
Community Life
Questionnaire
Isle of Dogs
Neighbourhood Plan
Optional Question 10 – Social projects
National level data Local (borough) level
data
Neighbourhood (ward)
level data
Recommended Survey
Question (our
question)
Rationale/
Explanation
Please tell me, as far
as you know, which of
these services or
amenities are provided
in your local area, by
which we mean within
15-20 minutes walking
distance from your
home.
A general/grocery shop
A pub A park
Gaps were identified
for comparing this
data with national
level data.
Gaps were identified
for comparing this
data with national
level data.
In your opinion, for
which of the following
types of community
facility do you think
there is the greatest
need for in the
neighbourhood plan
area – see map?
(please rank your
choice from 1-6 in
order of priority, 1
being the facility for
which there is the
Identifies social
infrastructure and
peoples’ priorities
and can provide
evidence base to for
new or different
infrastructure.
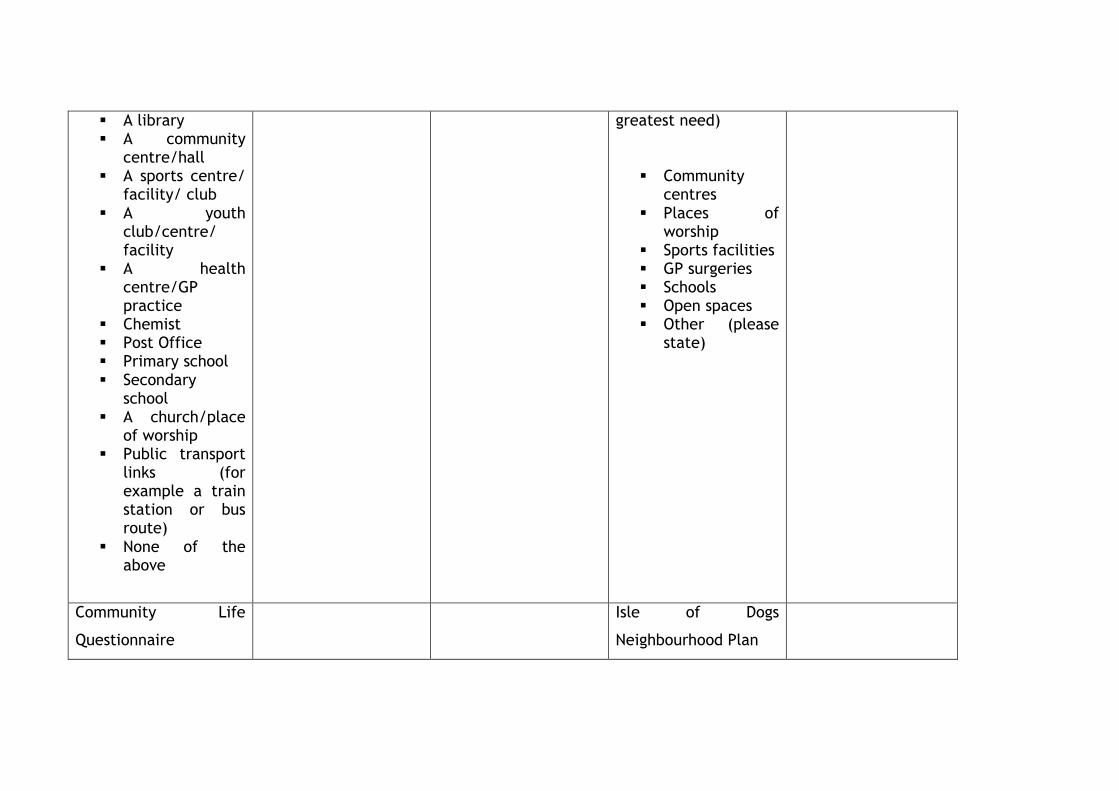
A library A community
centre/hall A sports centre/
facility/ club A youth
club/centre/ facility
A health centre/GP practice
Chemist Post Office Primary school Secondary
school A church/place
of worship Public transport
links (for example a train station or bus route)
None of the above
greatest need)
Community centres
Places of worship
Sports facilities GP surgeries Schools Open spaces Other (please
state)
Community Life
Questionnaire
Isle of Dogs
Neighbourhood Plan

How to analyse
Once QBs collect their completed questionnaires they will need to analyse the results in order
to present the findings. Using an Excel spreadsheet to manage and organise the data is
recommended when there are a large number of responses. A data line is created for each
respondent answer for each question into the Excel table (Survey Monkey will do this for you
automatically) with each respondents answers. Data entry needs to be regularly spot-checked
by someone not entering the data as it is surprisingly easy for errors to creep in. Using Excel
makes it easier to present findings in numbers, such as number of people who are concerned
about lack of affordable homes, by using filters. It also allows data to be put into more visual
form (e.g. graph or pie-chart) and for easy cross analysis (e.g. by different age or ethnic
groups). For open-ended questions where there are lots of responses that are unrelated, this
data can be managed by finding key words and tagging the feedback according to these key
words, such as traffic, housing, etc.
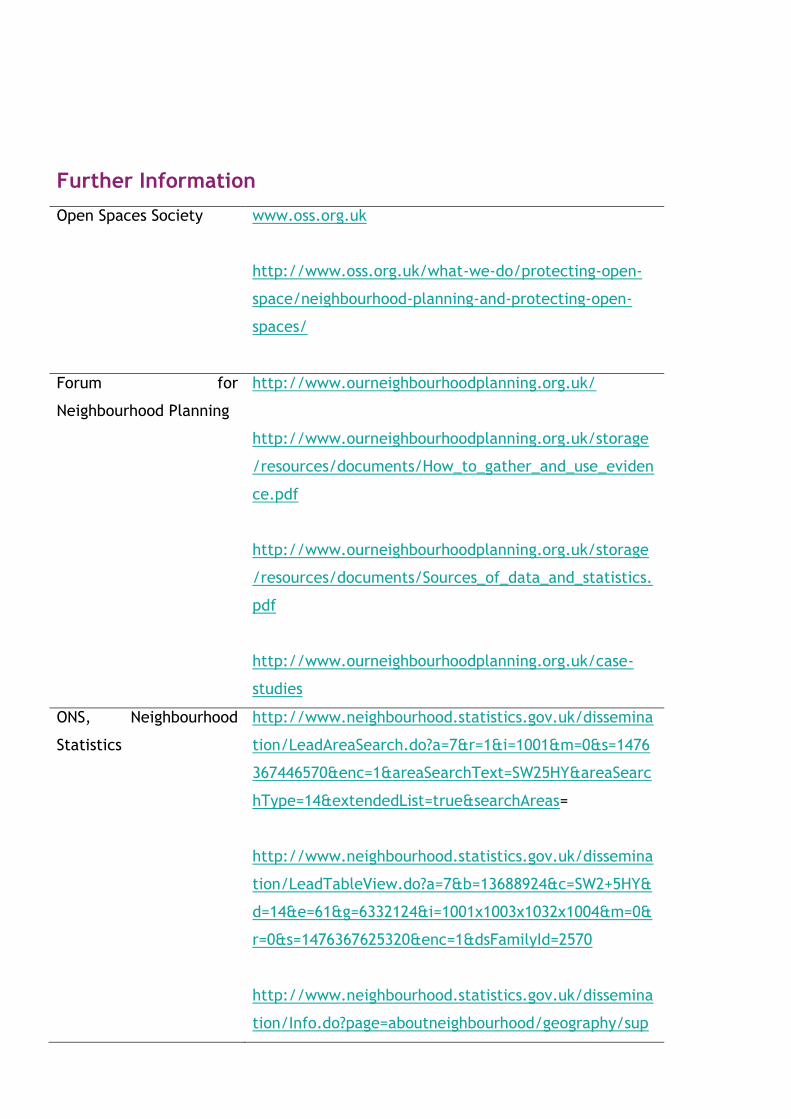
Further Information
Open Spaces Society www.oss.org.uk
http://www.oss.org.uk/what-we-do/protecting-open-
space/neighbourhood-planning-and-protecting-open-
spaces/
Forum for
Neighbourhood Planning
http://www.ourneighbourhoodplanning.org.uk/
http://www.ourneighbourhoodplanning.org.uk/storage
/resources/documents/How_to_gather_and_use_eviden
ce.pdf
http://www.ourneighbourhoodplanning.org.uk/storage
/resources/documents/Sources_of_data_and_statistics.
http://www.ourneighbourhoodplanning.org.uk/case-
studies
ONS, Neighbourhood
Statistics
http://www.neighbourhood.statistics.gov.uk/dissemina
tion/LeadAreaSearch.do?a=7&r=1&i=1001&m=0&s=1476
367446570&enc=1&areaSearchText=SW25HY&areaSearc
hType=14&extendedList=true&searchAreas=
http://www.neighbourhood.statistics.gov.uk/dissemina
tion/LeadTableView.do?a=7&b=13688924&c=SW2+5HY&
d=14&e=61&g=6332124&i=1001x1003x1032x1004&m=0&
r=0&s=1476367625320&enc=1&dsFamilyId=2570
http://www.neighbourhood.statistics.gov.uk/dissemina
tion/Info.do?page=aboutneighbourhood/geography/sup

eroutputareas/soa-intro.htm
UK Data Service https://census.ukdataservice.ac.uk/use-
data/censuses/forms
Community Planning http://www.communityplanning.net
http://www.communityplanning.net/neighbourhoodpla
nning/npwebsites.php
Locality, Building
Community Consortium
http://locality.org.uk/projects/building-community
Campaign to Protect
Rural England (CPRE)
and National Association
of Local Councils (NALC)
The Campaign to Protect Rural England (CPRE), in
partnership with the National Association of Local
Councils (NALC), provide advice and guidance on
planning through the 'Supporting Communities and
Neighbourhoods in Planning' project.
Planning Aid England http://www.rtpi.org.uk/planningaid
Planning Aid England http://mycommunity.org.uk/resources/how-to-gather-
and-use-evidence/
The Princes Foundation http://www.princes-foundation.org/our-
work/supporting-communities-and-neighbourhoods-
planning
Civic Voice http://www.civicvoice.org.uk/
Neighbourhood Planning http://www.neighbourhoodplanning.info
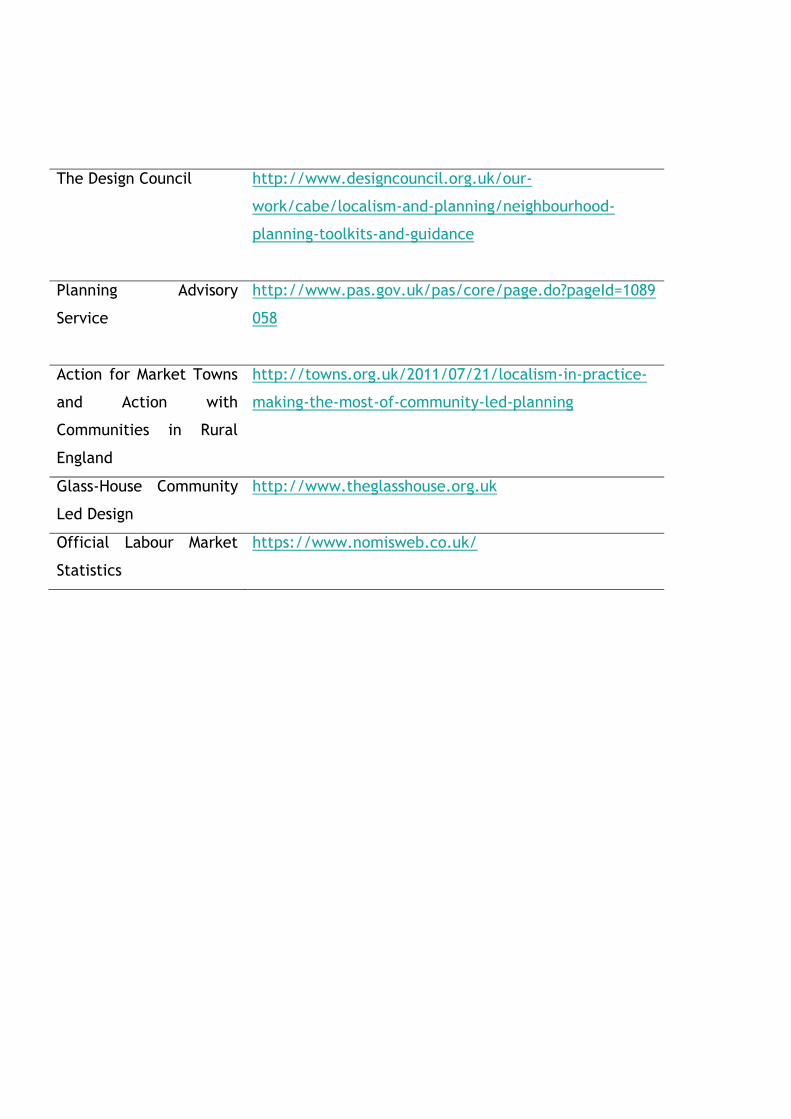
The Design Council http://www.designcouncil.org.uk/our-
work/cabe/localism-and-planning/neighbourhood-
planning-toolkits-and-guidance
Planning Advisory
Service
http://www.pas.gov.uk/pas/core/page.do?pageId=1089
058
Action for Market Towns
and Action with
Communities in Rural
England
http://towns.org.uk/2011/07/21/localism-in-practice-
making-the-most-of-community-led-planning
Glass-House Community
Led Design
http://www.theglasshouse.org.uk
Official Labour Market
Statistics
https://www.nomisweb.co.uk/
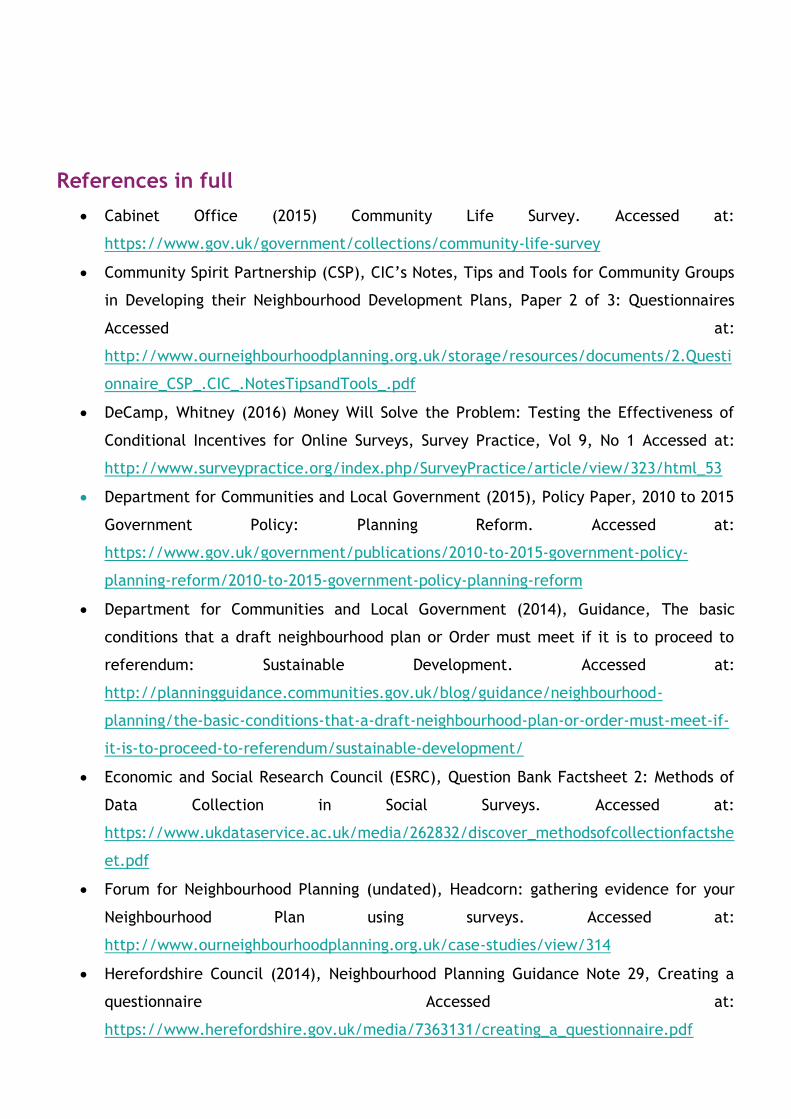
References in full
Cabinet Office (2015) Community Life Survey. Accessed at:
https://www.gov.uk/government/collections/community-life-survey
Community Spirit Partnership (CSP), CIC’s Notes, Tips and Tools for Community Groups
in Developing their Neighbourhood Development Plans, Paper 2 of 3: Questionnaires
Accessed at:
http://www.ourneighbourhoodplanning.org.uk/storage/resources/documents/2.Questi
onnaire_CSP_.CIC_.NotesTipsandTools_.pdf
DeCamp, Whitney (2016) Money Will Solve the Problem: Testing the Effectiveness of
Conditional Incentives for Online Surveys, Survey Practice, Vol 9, No 1 Accessed at:
http://www.surveypractice.org/index.php/SurveyPractice/article/view/323/html_53
Department for Communities and Local Government (2015), Policy Paper, 2010 to 2015
Government Policy: Planning Reform. Accessed at:
https://www.gov.uk/government/publications/2010-to-2015-government-policy-
planning-reform/2010-to-2015-government-policy-planning-reform
Department for Communities and Local Government (2014), Guidance, The basic
conditions that a draft neighbourhood plan or Order must meet if it is to proceed to
referendum: Sustainable Development. Accessed at:
http://planningguidance.communities.gov.uk/blog/guidance/neighbourhood-
planning/the-basic-conditions-that-a-draft-neighbourhood-plan-or-order-must-meet-if-
it-is-to-proceed-to-referendum/sustainable-development/
Economic and Social Research Council (ESRC), Question Bank Factsheet 2: Methods of
Data Collection in Social Surveys. Accessed at:
https://www.ukdataservice.ac.uk/media/262832/discover_methodsofcollectionfactshe
et.pdf
Forum for Neighbourhood Planning (undated), Headcorn: gathering evidence for your
Neighbourhood Plan using surveys. Accessed at:
http://www.ourneighbourhoodplanning.org.uk/case-studies/view/314
Herefordshire Council (2014), Neighbourhood Planning Guidance Note 29, Creating a
questionnaire Accessed at:
https://www.herefordshire.gov.uk/media/7363131/creating_a_questionnaire.pdf
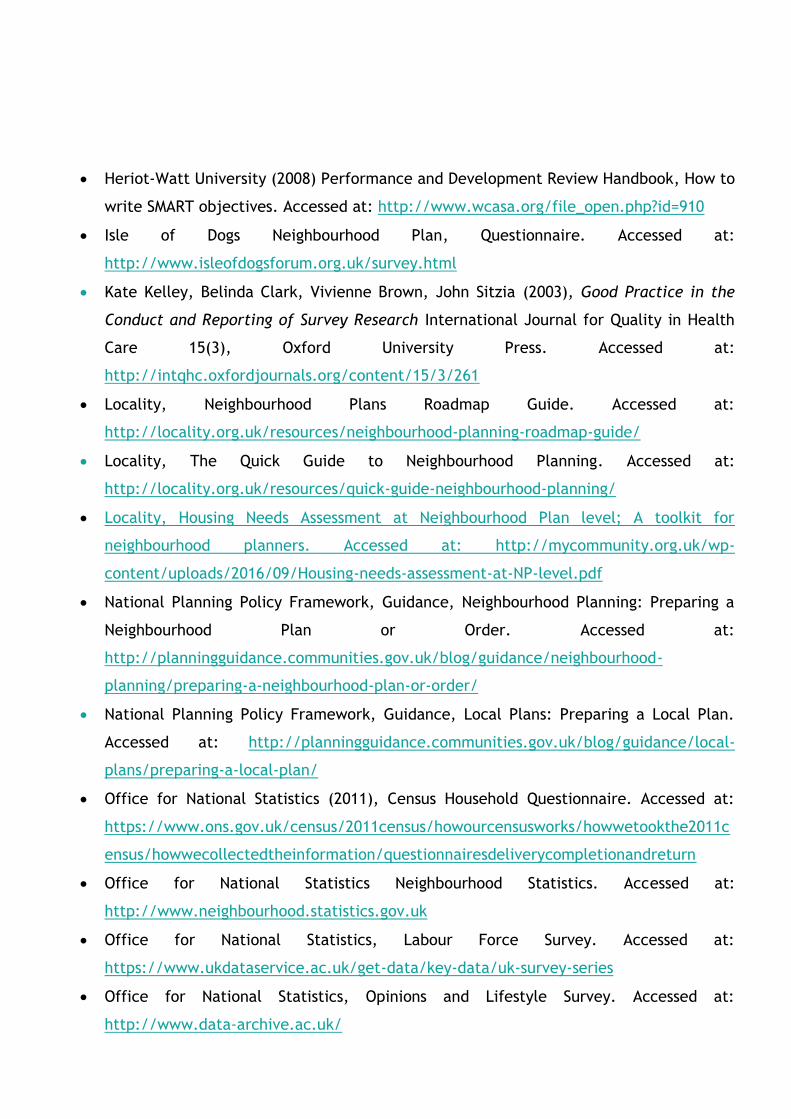
Heriot-Watt University (2008) Performance and Development Review Handbook, How to
write SMART objectives. Accessed at: http://www.wcasa.org/file_open.php?id=910
Isle of Dogs Neighbourhood Plan, Questionnaire. Accessed at:
http://www.isleofdogsforum.org.uk/survey.html
Kate Kelley, Belinda Clark, Vivienne Brown, John Sitzia (2003), Good Practice in the
Conduct and Reporting of Survey Research International Journal for Quality in Health
Care 15(3), Oxford University Press. Accessed at:
http://intqhc.oxfordjournals.org/content/15/3/261
Locality, Neighbourhood Plans Roadmap Guide. Accessed at:
http://locality.org.uk/resources/neighbourhood-planning-roadmap-guide/
Locality, The Quick Guide to Neighbourhood Planning. Accessed at:
http://locality.org.uk/resources/quick-guide-neighbourhood-planning/
Locality, Housing Needs Assessment at Neighbourhood Plan level; A toolkit for
neighbourhood planners. Accessed at: http://mycommunity.org.uk/wp-
content/uploads/2016/09/Housing-needs-assessment-at-NP-level.pdf
National Planning Policy Framework, Guidance, Neighbourhood Planning: Preparing a
Neighbourhood Plan or Order. Accessed at:
http://planningguidance.communities.gov.uk/blog/guidance/neighbourhood-
planning/preparing-a-neighbourhood-plan-or-order/
National Planning Policy Framework, Guidance, Local Plans: Preparing a Local Plan.
Accessed at: http://planningguidance.communities.gov.uk/blog/guidance/local-
plans/preparing-a-local-plan/
Office for National Statistics (2011), Census Household Questionnaire. Accessed at:
https://www.ons.gov.uk/census/2011census/howourcensusworks/howwetookthe2011c
ensus/howwecollectedtheinformation/questionnairesdeliverycompletionandreturn
Office for National Statistics Neighbourhood Statistics. Accessed at:
http://www.neighbourhood.statistics.gov.uk
Office for National Statistics, Labour Force Survey. Accessed at:
https://www.ukdataservice.ac.uk/get-data/key-data/uk-survey-series
Office for National Statistics, Opinions and Lifestyle Survey. Accessed at:
http://www.data-archive.ac.uk/

Office for National Statistics, British Social Attitudes. Accessed at: http://www.data-
archive.ac.uk/
Office for National Statistics (2016), Internet users in the UK. Accessed at:
https://www.ons.gov.uk/businessindustryandtrade/itandinternetindustry/bulletins/int
ernetusers/2016
Planning Aid England, How to Gather and Use Evidence: Putting the Pieces Together.
Accessed at:
http://www.ourneighbourhoodplanning.org.uk/storage/resources/documents/How_to_
gather_and_use_evidence.pdf
Revise Sociology (2016), Social Surveys: An Introduction to Structured Questionnaires
and Structured Interviews. Accessed at:
https://revisesociology.com/2016/01/09/social-surveys-definition-types/
Revise Sociology (2016), Social Surveys: Advantages and Disadvantages. Accessed at:
https://revisesociology.com/2016/01/11/social-surveys-advantages-and-
disadvantages/

©2016
Visit the My Community
website to find out more:
mycommunity.org.uk/
Follow us on twitter: @mycommunityhelp
© Locality 2016