Embed Size (px)
Citation preview

Social Trends Influencing Families in Missouri:Whither the Middle Class?
2008 Catholic ConferenceJefferson City, Missouri
October 4, 2008
Bill Elder, PhDDirectorOffice of Social & Economic Data Analysis (OSEDA)University of Missouri

Overview
• What’s Middle Class?– Class, Status and Power
• Large Scale Trends• Trends in Missouri• Discussion
Wh`

Recent BooksWar on the Middle Class: How the Government, Big Business, and Special Interest Groups are Waging War on the American Dream and how to Fight BackBy Lou DobbsPublished by Viking, 2006
Rich Dad, Poor Dad By Robert T. Kiyosaki, Sharon L. Lechter 2000
The Two-income Trap: Why Middle-class Mothers and Fathers are Going Brokeby Elizabeth Warren, Amelia Warren Tyagi, 2003
The Great Risk Shift: The Assault on American Jobs, Families, Health Care ...by Jacob S. Hacker - Social Science - 2006


Source:Pew ResearchCenter, 2008

The Census Bureau does not have an official definition of the "middle class," but it does derive several measures related to the distribution of income and income inequality.

Up then Flat, but still Squeezed
• Real median annual household income has declined since 2000.
• Since 1970, median household income has risen by 41%.

Middle Income Squeeze
• The upper-income households outperformed the middle
– (150%+ -- 75% and150%)
• From 1983 to 2004, the median net worth of upper-income families more than doubled, while the median net worth of middle-income families grew by just 29%.
Source: Pew Foundation

Falling Back• Shrinking middle class
• Increased inequality
• Working class majority
CBO, retrieved 2007
Inflation adjusted percent increaseIn after-tax household incomeby income Quintiles 1979-2005

Income Range by Fifths and Five Percent, 2007
Range of IncomesHouseholds
(Millions)
0 $ 20,291 23,357
$ 20,291 $ 39,100 23,357
$ 39,100 $ 62,000 23,357
$ 62,000 $ 100,000 23,357
$100,000 $ 177,000 23,357
$177,000 Highest 5,839 Source: U.S. Census

Historical Comparison IncomeSource: U.S. Census
Year Hlds Lowest Second Third FourthTop Five
Pct
2007 116,783 $20,291 $39,100 $62,000 $100,000 $ 177,000
1970 64,778 $17,574 $33,667 $48,968 $ 69,863 $ 110,435
Diff $ 2,717 $ 5,433 $13,032 $ 30,137 $ 66,565
In 2007 Dollars

• Changes in the labor market– “Globalization”
• Household composition (living arrangements)– shift away from married-couple households to
single-parent families and nonfamily households

How f l a tf l a t the world is depends on where your standing..
• The World is Flat – “new oil wells” -- Thomas Friedman
• Making Globalization Work -- Joseph Stiglitz
• Networking Diverse Assets, especially human capital…”collaboration” is hard

Breakout of Household Type Number in Percent
Source: U.S Census HouseholdsFourth
Fifth In Fourth Fifth
Family households 77,873 18,813 24%
Married-couple families 58,370 15,705 27%
Male householder
5,100 1,058 21%
Female householder
14,404 2,050 14%
Nonfamily households 38,910 4,545 12%

Increased Household Income by Increasing Household Workers
• Female Labor Force Participation + 50%
• Real male earning flat since 1971

But Families Still SqueezedExpenditures (see Warren)
• Costs Down– Clothes– Food– Appliances
• Costs UP– Houses (price)– Mortgages (payments)– Debt (credit cards)– Insurance
Credit is the worst thing ever imagined. "SPEND WHAT YOU DON'T HAVE!" What a terrible concept. (YouTube)
No, spending it on what you don’t need.
* ** *
*
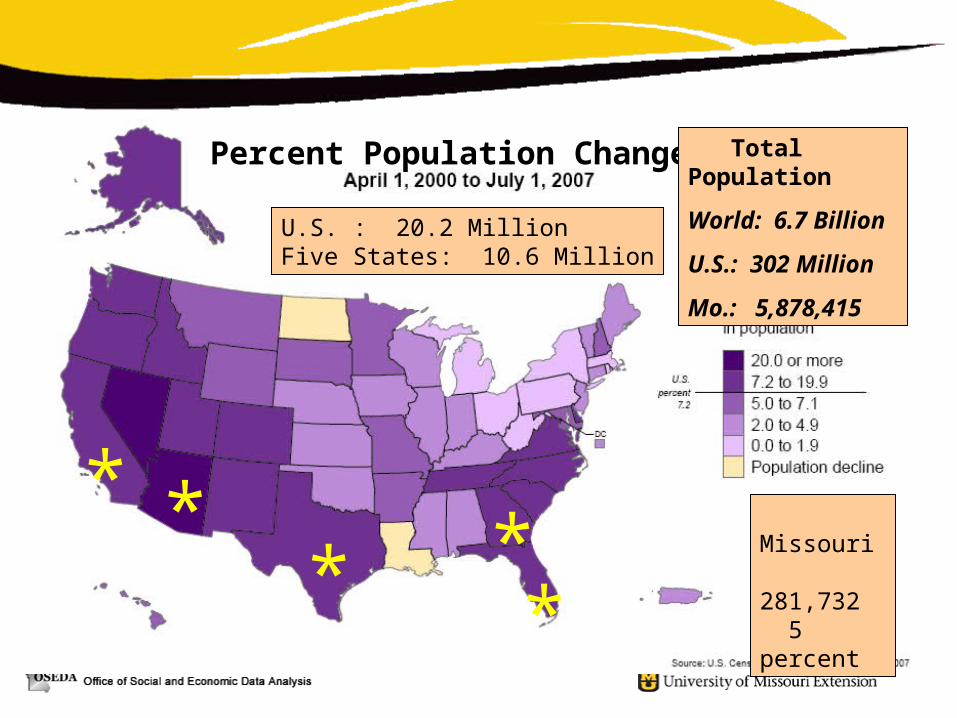
Percent Population Change Total Population
World: 6.7 Billion
U.S.: 302 Million
Mo.: 5,878,415
Missouri 281,732 5 percent
U.S. : 20.2 MillionFive States: 10.6 Million


Camden Co. August 2007 3.9% --- August 2008 5.3%

MissouriProjected Employment Growth by Sector 2004-2014Source: MERIC

Source: MERIC
New Businesses
per 1,000 Population,
2006
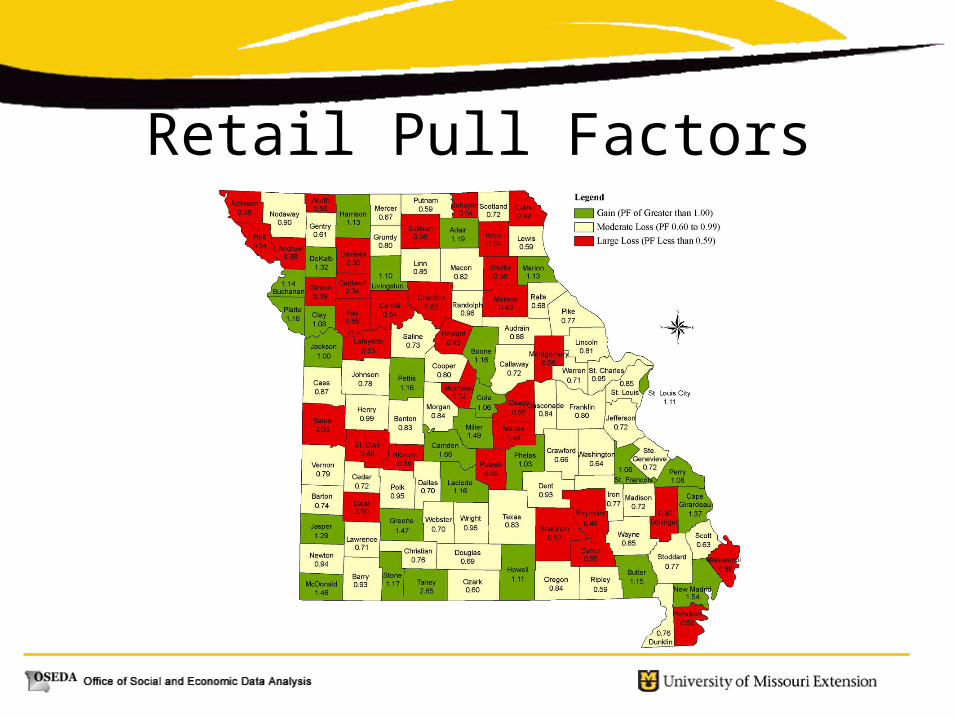
Retail Pull Factors

Missouri “Sustainable Wages”• Two Working Family with Insured
Infant, Preschooler & School age child
County Hourly Annual
• Jackson $13.29 $55,283• Livingston $10.04 $41,756• Maries $10.36 $43,079• St. Charles $13.63 $56,684

Cost Component Jackson Maries
Childcare $18,369.00 $11,288.86
Food $7,965.75 $7,965.75
Housing $10,488.00 $6,804.00
Medical $3,378.03 $3,378.03
Telephone $340.00 $340.00
Transportation $5,121.95 $5,804.46
Total $55,283.10 $43,079.16
Pct Child Care 33% 26%
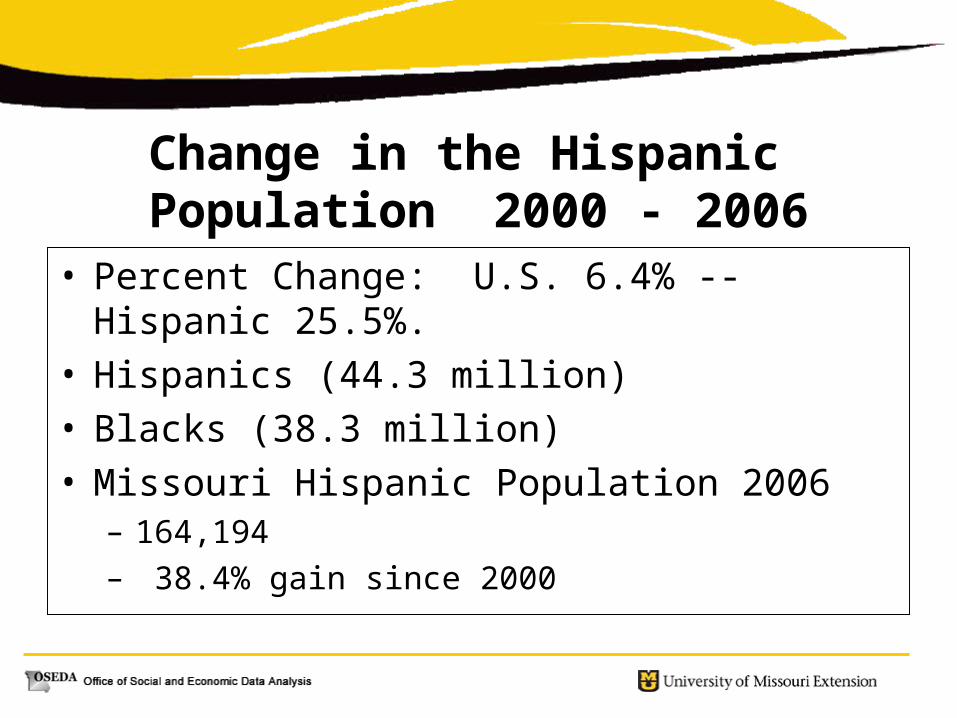
Change in the Hispanic Population 2000 - 2006
• Percent Change: U.S. 6.4% -- Hispanic 25.5%.• Hispanics (44.3 million)• Blacks (38.3 million)• Missouri Hispanic Population 2006
– 164,194 – 38.4% gain since 2000

Pew Hispanic Center, 2008
Undocumented immigrants make up 30% of the nation’s foreign-bornpopulation of more than 39 million people. More than four-in-ten of thenation’s unauthorized immigrants—5.3 million people—have arrivedsince the decade began.
12 Million “Unauthorized Immigrants”
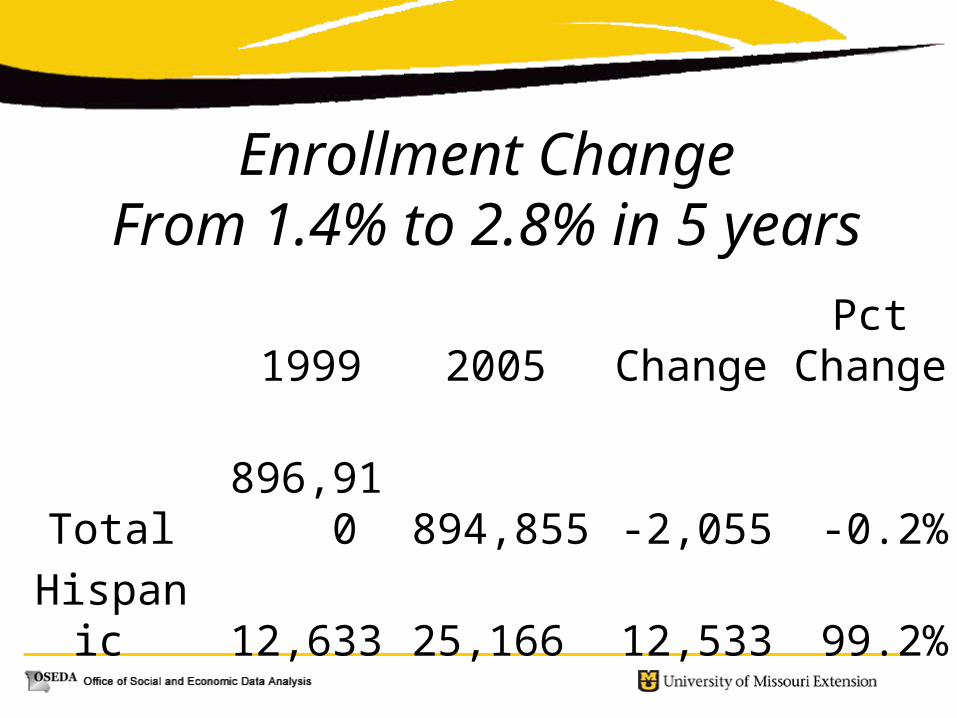
1999 2005 ChangePct
Change
Total
896,910
894,855 -2,055 -0.2%
Hispanic
12,633
25,166
12,533 99.2%
Enrollment ChangeFrom 1.4% to 2.8% in 5 years


0
5
10
15
20
Per
cen
t
1990 2000 2010 2020
Year
Percent Missouri Population Age 65+: 1990-2020
SOURCE: Census Bureau/NCHS. Projection algorithm, programming by OSEDA Chart Prepared by: University of Missouri Extension, Office of Social and Economic Data Analysis24March2006


Social Trends Influencing Families in Missouri:Whither the Middle Class?
2008 Catholic ConferenceJefferson City, Missouri
October 4, 2008
Bill Elder, PhDDirectorOffice of Social & Economic Data Analysis (OSEDA)University of Missouri