Embed Size (px)
Citation preview
SOCIETY OF ECOLOGICAL CHEMISTRY AND ENGINEERING
ECOLOGICAL CHEMISTRY
AND ENGINEERING A
CHEMIA I IN¯YNIERIA EKOLOGICZNA A
Vol. 16 No. 8
OPOLE 2009
EDITORIAL COMMITTEE
Witold Wac³awek (University, Opole) – Editor-in-Chief
Milan Kraitr (Western Bohemian University, Plzen, CZ)
Jerzy Skrzypski (University of Technology, Lodz)
Maria Wac³awek (University, Opole)
Tadeusz Majcherczyk (University, Opole) – Secretary
PROGRAMMING BOARD
Witold Wac³awek (University, Opole) – Chairman
Jerzy Bartnicki (Meteorological Institute – DNMI, Oslo-Blindern, NO)
Mykhaylo Bratychak (National University of Technology, Lviv, UA)
Bogus³aw Buszewski (Nicolaus Copernicus University, Torun)
Eugenija Kupcinskiene (University of Agriculture, Kaunas, LT)
Bernd Markert (International Graduate School [IHI], Zittau, DE)
Nelson Marmiroli (University, Parma, IT)
Jacek Namieœnik (University of Technology, Gdansk)
Wanda Pasiuk-Bronikowska (Institute of Physical Chemistry PAS, Warszawa)
Lucjan Paw³owski (University of Technology, Lublin)
Krzysztof J. Rudziñski (Institute of Physical Chemistry PAS, Warszawa)
Manfred Sager (Agency for Health and Food Safety, Vienna, AT)
Mark R.D. Seaward (University of Bradford, Bradford, UK)
Jíøi Ševèik (Charles University, Prague, CZ)
Piotr Tomasik (University of Agriculture, Krakow)
Roman Zarzycki (University of Technology, Lodz)
Tadeusz Majcherczyk (University, Opole) – Secretary
EDITORIAL OFFICE
Opole University, Chair of Chemical Physics
POB 313, ul. Oleska 48, 45–951 OPOLE
tel./fax +48 77 455 91 49
email: [email protected]
http://tchie.uni.opole.pl
SECRETARIES
Agnieszka Do³hañczuk-Œródka, tel. +48 77 401 60 45, email: [email protected]
Ma³gorzata Rajfur, tel. +48 77 401 60 42, email: [email protected]
SECRETARIES’ OFFICE
tel. +48 77 401 60 42
email: [email protected]
Copyright © by
Society of Ecological Chemistry and Engineering
Ecological Chemistry and Engineering
is partly financed by Ministry of Science and Higher Education, Warszawa
ISSN 1898–6188
CONTENTS
Editorial . . . . . . . . . . . . . . . . . . . . . . . . . . . . . . . 907
Stanis³aw CHMIEL and Ewa MACIEJEWSKA – Share of Precipitation Nitrogen
in the River Discharge of the Upper Wieprz River (Roztocze, SE Poland) . . . . . . 909
Aleksandra DRA¯BO, Wies³aw SOBOTKA, Zofia ANTOSZKIEWICZ and Karol
WEBER – Effect of the Concentrations and Quality of Protein in Diets for
Growing-Finishing Pigs on Nitrogen Excretion to the Environment . . . . . . . . . 917
Marek GUGA£A and Krystyna ZARZECKA – Content of Nitrates(V) in Potato
Tubers in Conditions of Application of New Generation Insecticides . . . . . . . . 927
Pawe³ HARASIM and Tadeusz FILIPEK – Nitrogen Content and Amino-acid Protein
Composition of Grain of Rape Foliar Fertilized with Urea and Microelements . . . . . 933
Andrzej JAGUΠРInfluence of Reed-Bed Treatment Plant on the Environment
Protection from Nitrogen Contamination . . . . . . . . . . . . . . . . . . . 939
Jan KUCHARSKI, Ma³gorzata BAÆMAGA and Jadwiga WYSZKOWSKA – Effect
of Soil Contamination with Herbicides on the Nitrification Process . . . . . . . . . 947
Jan KUCHARSKI, Agnieszka WYRWA£, Edyta BOROS and Jadwiga WYSZKOWSKA
– Nitrification Process as an Indicator of Soil Contamination with Heavy Metals . . . 953
Jan KUCHARSKI, Jadwiga WYSZKOWSKA and Agata BOROWIK – Nitrification
Process in Soil Contaminated with Benzene . . . . . . . . . . . . . . . . . 963
Miros³aw ORZECHOWSKI – Mineralization of Organic Nitrogen Compounds
in Alluvial and Deluvial Soils of Morainic, Riverine and Delta Landscapes . . . . . . 971
Apolonia OSTROWSKA and Gra¿yna PORÊBSKA – Mineral Composition of Plants
as an Indicator of Their Quality in Nitrogen Stress Condition . . . . . . . . . . . 983
Anna P£AZA, Feliks CEGLAREK, Barbara G¥SIOROWSKA, Danuta BURACZYÑSKA
and Milena Anna KRÓLIKOWSKA – Effect of Intercrops on the Content of Mineral
Nitrogen in Soil in Autumn and Spring . . . . . . . . . . . . . . . . . . . 995
Wiera S¥DEJ, Teresa BOWSZYS and Anna NAMIOTKO – Leaching of Nitrogen Forms
from Soil Fertilized with Sewage Sludge . . . . . . . . . . . . . . . . . . 1001
S³awomir SMÓLCZYÑSKI – Mineralization of Nitrogen Compounds in Upper-Silted
Organic Soils of North-Eastern Poland . . . . . . . . . . . . . . . . . . . 1009
Cezary TRAWCZYÑSKI – Influence of Drip Irrigation and Fertigation on the Yield
of Potato Tubers and Content of Nitrogen Mineral in the Soil . . . . . . . . . . 1021
Kazimierz WARMIÑSKI and Agnieszka BÊŒ – Diurnal and Seasonal Variations
in the NO2 Photolysis Rate Constant, NO Titration Rate Constant and the NO2/NO
Ratio in Ambient Air in the City of Olsztyn . . . . . . . . . . . . . . . . . 1029
Miros³aw WYSZKOWSKI and Maja RADZIEMSKA – Content of Nitrogen Compounds
in Soil Polluted with Chromium(III) and Chromium(VI) after Application of Compost,
Zeolite and Calcium Oxide . . . . . . . . . . . . . . . . . . . . . . . 1039
Miros³aw WYSZKOWSKI, Maja RADZIEMSKA and Veranika SIVITSKAYA – Effect
of Compost, Bentonite, Zeolite and Calcium Oxide on Mineral Nitrogen Content
in Nickel Contaminated Soil . . . . . . . . . . . . . . . . . . . . . . . 1047
Miros³aw WYSZKOWSKI and Agnieszka ZIÓ£KOWSKA – Relationships between Petrol
and Diesel Oil Contamination Versus Mineral Nitrogen Content in Soil Following
Application of Compost, Bentonite and Calcium Oxide . . . . . . . . . . . . . 1057
Krystyna ZARZECKA, Marek GUGA£A and Iwona MYSTKOWSKA – Effect of Agri-
cultural Treatments on the Content of Total and Protein Nitrogen in Potato Tubers . . . 1065
VARIA
Invitation for ECOpole ’09 Conference . . . . . . . . . . . . . . . . . . . . 1073
Zaproszenie na Konferencjê ECOpole ’09 . . . . . . . . . . . . . . . . . . . 1077
Invitation for 15th
International Conference on Heavy Metals in the Environment . . . . . 1081
Guide for Authors on Submission of Manuscripts . . . . . . . . . . . . . . . . 1083
Zalecenia dotycz¹ce przygotowania manuskryptów . . . . . . . . . . . . . . . . 1085
SPIS TREŒCI
Od Redakcji . . . . . . . . . . . . . . . . . . . . . . . . . . . . . . 907
Stanis³aw CHMIEL i Ewa MACIEJEWSKA – Udzia³ azotu z opadów atmosferycznych
w odp³ywie rzecznym górnego Wieprza (Roztocze, Polska) . . . . . . . . . . . . 909
Aleksandra DRA¯BO, Wies³aw SOBOTKA, Zofia ANTOSZKIEWICZ i Karol WEBER
– Wp³yw poziomu i jakoœci bia³ka w mieszankach paszowych dla tuczników
na wydalanie azotu do œrodowiska . . . . . . . . . . . . . . . . . . . . . 917
Marek GUGA£A i Krystyna ZARZECKA – Zawartoœæ azotanów(V) w bulwach
ziemniaka w warunkach stosowania insektycydów nowej generacji . . . . . . . . . 927
Pawe³ HARASIM i Tadeusz FILIPEK – Zawartoœæ azotu i sk³ad aminokwasowy
bia³ka nasion rzepaku jarego dokarmianego dolistnie mocznikiem i mikro-
elementami . . . . . . . . . . . . . . . . . . . . . . . . . . . . . 933
Andrzej JAGUŒ – Skutecznoœæ trzcinowej oczyszczalni œcieków w ochronie œrodowiska
przed zanieczyszczeniem zwi¹zkami azotu . . . . . . . . . . . . . . . . . . 939
Jan KUCHARSKI, Ma³gorzata BAÆMAGA i Jadwiga WYSZKOWSKA – Wp³yw
zanieczyszczenia gleby herbicydami na przebieg procesu nitryfikacji . . . . . . . . 947
Jan KUCHARSKI, Agnieszka WYRWA£, Edyta BOROS i Jadwiga WYSZKOWSKA
– Proces nitryfikacji wskaŸnikiem zanieczyszczenia gleb metalami ciê¿kimi . . . . . . 953
Jan KUCHARSKI, Jadwiga WYSZKOWSKA i Agata BOROWIK – Proces nitryfikacji
w glebie zanieczyszczonej benzenem . . . . . . . . . . . . . . . . . . . . 963
Miros³aw ORZECHOWSKI – Mineralizacja organicznych zwi¹zków azotu w glebach
nap³ywowych obszarów m³odoglacjalnych w krajobrazie morenowym dolin rzecznych
i deltowym . . . . . . . . . . . . . . . . . . . . . . . . . . . . . 971
Apolonia OSTROWSKA i Gra¿yna PORÊBSKA – Sk³ad mineralny roœlin jako wskaŸnik
ich jakoœci w warunkach nadmiaru azotu w œrodowisku . . . . . . . . . . . . . 983
Anna P£AZA, Feliks CEGLAREK, Barbara G¥SIOROWSKA, Danuta BURACZYÑSKA
i Milena Anna KRÓLIKOWSKA – Wp³yw miêdzyplonów na zawartoœæ azotu
mineralnego w glebie jesieni¹ i wiosn¹ . . . . . . . . . . . . . . . . . . . 995
Wiera S¥DEJ, Teresa BOWSZYS i Anna NAMIOTKO – Wymywanie form azotu
z gleby nawo¿onej osadami œciekowymi . . . . . . . . . . . . . . . . . . . 1001
S³awomir SMÓLCZYÑSKI – Mineralizacja zwi¹zków azotu w odgórnie namulonych
glebach organicznych Polski Pó³nocno-Wschodniej . . . . . . . . . . . . . . . 1009
Cezary TRAWCZYÑSKI – Wp³yw nawadniania kroplowego i fertygacji na plon bulw
ziemniaka i zawartoϾ azotu mineralnego w glebie . . . . . . . . . . . . . . . 1021
Kazimierz WARMIÑSKI i Agnieszka BÊŒ – Dobowa i sezonowa zmiennoœæ sta³ych
szybkoœci reakcji fotolizy NO2 i titracji NO oraz stosunku NO2/NO w powietrzu
atmosferycznym Olsztyna . . . . . . . . . . . . . . . . . . . . . . . . 1029
Miros³aw WYSZKOWSKI i Maja RADZIEMSKA – Zawartoœæ zwi¹zków azotowych
w glebie zanieczyszczonej chromem(III) i chromem(VI) po aplikacji kompostu, zeolitu
i tlenku wapnia . . . . . . . . . . . . . . . . . . . . . . . . . . . . 1039
Miros³aw WYSZKOWSKI, Maja RADZIEMSKA i Veranika SIVITSKAYA – Wp³yw
kompostu, bentonitu, zeolitu i tlenku wapnia na zawartoϾ azotu mineralnego
w glebie zanieczyszczonej niklem . . . . . . . . . . . . . . . . . . . . . 1047
Miros³aw WYSZKOWSKI i Agnieszka ZIÓ£KOWSKA – Relacje miêdzy zanieczysz-
czeniem benzyn¹ i olejem napêdowym a zawartoœci¹ azotu mineralnego w glebie
po aplikacji kompostu, bentonitu i tlenku wapnia . . . . . . . . . . . . . . . 1057
Krystyna ZARZECKA, Marek GUGA£A i Iwona MYSTKOWSKA – Wp³yw zabiegów
agrotechnicznych na zawartoœæ azotu ogólnego i bia³kowego w bulwach ziemniaka . . . 1065
VARIA
Invitation for ECOpole ’09 Conference . . . . . . . . . . . . . . . . . . . . 1073
Zaproszenie na Konferencjê ECOpole ’09 . . . . . . . . . . . . . . . . . . . 1077
Invitation for 15th
International Conference on Heavy Metals in the Environment . . . . . 1081
Guide for Authors on Submission of Manuscripts . . . . . . . . . . . . . . . . 1083
Zalecenia dotycz¹ce przygotowania manuskryptów . . . . . . . . . . . . . . . . 1085
Papers published in the issue have been presented during the 3rd
International
Scientific Conference on Nitrogen in Natural Environment, Olsztyn, May 21–22, 2009.
Artyku³y opublikowane w tym zeszycie by³y przedstawione w czasie III Miêdzy-
narodowej Konferencji Naukowej pt.: Azot w œrodowisku przyrodniczym, Olsztyn,
21–22 maja 2009 r. Organizatorem konferencji by³a Katedra Chemii Œrodowiska Uni-
wersytetu Warmiñsko-Mazurskiego w Olsztynie kierowana przez Pana Prof. dr. hab.
Zdzis³awa Cieæko.
Prezentowane artyku³y przesz³y normaln¹ procedurê recenzyjn¹ i redakcyjn¹.
Konferencja by³a dofinansowana przez Komitet Gleboznawstwa i Chemii Rolnej
Polskiej Akademii Nauk oraz Wojewódzki Fundusz Ochrony Œrodowiska i Gospodarki
Wodnej w Olsztynie. Dziêkujemy Sponsorom za wsparcie.

Stanis³aw CHMIEL1
and Ewa MACIEJEWSKA1
SHARE OF PRECIPITATION NITROGEN
IN THE RIVER DISCHARGE
OF THE UPPER WIEPRZ RIVER (ROZTOCZE, SE POLAND)
UDZIA£ AZOTU Z OPADÓW ATMOSFERYCZNYCH
W ODP£YWIE RZECZNYM GÓRNEGO WIEPRZA
(ROZTOCZE, POLSKA)
Abstract: Based on hydrochemical, hydrometric and meteorological material, a nitrogen balance was made
for the catchment of the upper Wieprz River, covering the years 2005–2006. The calculations showed that
nitrogen discharged through the river system accounted for approx 4.1 % of the pool of nitrogen introduced
into the Wieprz River catchment (1572.7 Mg � year–1
). The proportion of precipitation nitrogen in the total
nitrogen discharge through the Wieprz River (64.4 Mg � year–1
) was estimated at 11.4 %. The main part of
nitrogen discharged via the river system was nitrogen of agricultural origin (53.3 Mg � year–1
).
Keywords: water cycle, nitrogen, precipitation, agriculture
The water cycle in a river catchment is an important stage of nitrogen migration in
the natural environment [1]. The importance of this element in the aquatic environment
is emphasised by special legislation applicable in the EU and Poland, referred to as the
Nitrates Directive. The overriding task of this Directive is to reduce the pollution of
waters with nitrogen compounds and to prevent further such pollution from agricultural
sources, since this element affects the intensity of eutrophication of waters and the
possibility to use them for consumption purposes. The excessive nitrogen load to the
aquatic environment usually results from human activity: the emissions of pollutants
into the atmosphere, agricultural use of land (field fertilisation) and sewage discharge.
In order to make a quantitative evaluation of the nitrogen load to the environment,
area balances of this element within an administrative unit or a hydrographic unit –
catchment area – are made [2–5]. It allows the determination of the contribution of
atmospheric and agricultural nitrogen reaching the catchment and discharged from it.
Results of calculations can be used to prepare water management plans within
E C O L O G I C A L C H E M I S T R Y A N D E N G I N E E R I N G A
Vol. 16, No. 8 2009
1Institute of Earth Sciences, Maria Curie-Sklodowska University in Lublin, al. Kraœnicka 2cd, 20–718
Lublin, Poland; email: [email protected]; [email protected]
catchment areas, incorporating sustainable development principles, which are essential,
in particular, in agriculturally used areas, valuable natural areas as well as areas being
drinking water reservoirs or used for recreation purposes.
The study area
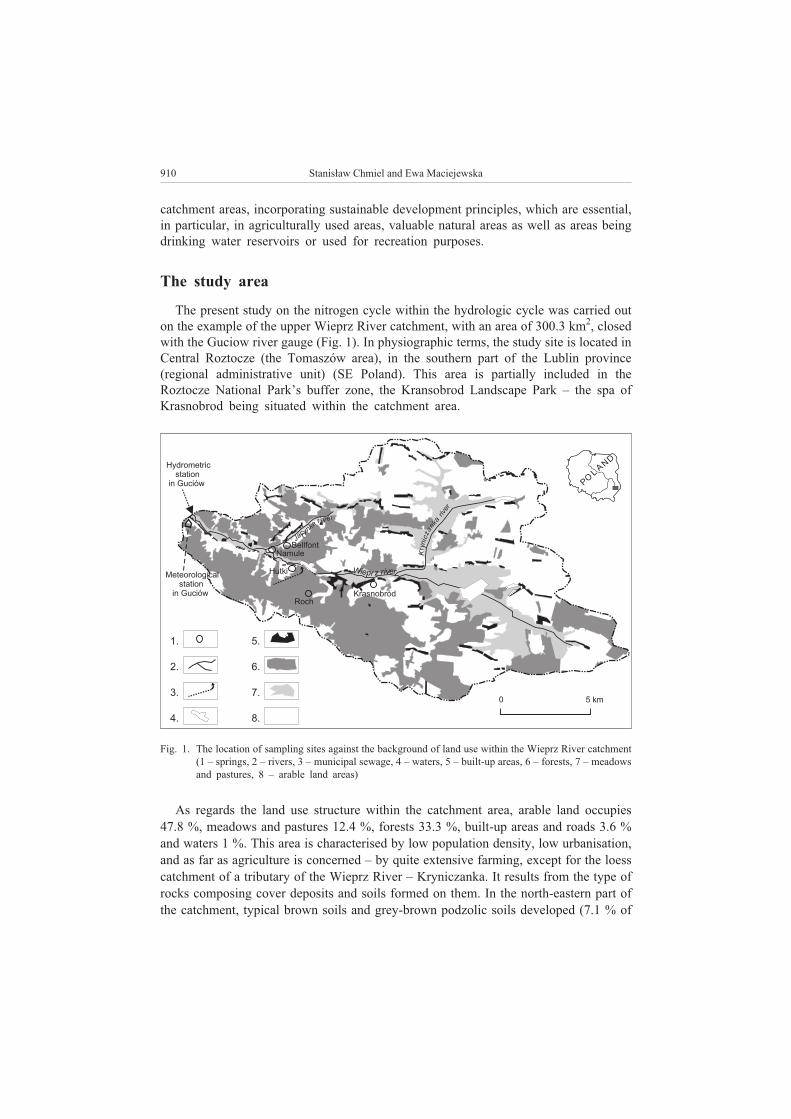
The present study on the nitrogen cycle within the hydrologic cycle was carried out
on the example of the upper Wieprz River catchment, with an area of 300.3 km2, closed
with the Guciow river gauge (Fig. 1). In physiographic terms, the study site is located in
Central Roztocze (the Tomaszów area), in the southern part of the Lublin province
(regional administrative unit) (SE Poland). This area is partially included in the
Roztocze National Park’s buffer zone, the Kransobrod Landscape Park – the spa of
Krasnobrod being situated within the catchment area.
As regards the land use structure within the catchment area, arable land occupies
47.8 %, meadows and pastures 12.4 %, forests 33.3 %, built-up areas and roads 3.6 %
and waters 1 %. This area is characterised by low population density, low urbanisation,
and as far as agriculture is concerned – by quite extensive farming, except for the loess
catchment of a tributary of the Wieprz River – Kryniczanka. It results from the type of
rocks composing cover deposits and soils formed on them. In the north-eastern part of
the catchment, typical brown soils and grey-brown podzolic soils developed (7.1 % of
910 Stanis³aw Chmiel and Ewa Maciejewska
PO
LA
ND
W epri z river
Jacyn
kar eiv
r
Kr y
nic
zanka
river
Hutki
Bellfont
Namule
Roch
Krasnobród
Hydrometric
station
in Guciów
0 5 km
1.
2.
3.
4.
5.
6.
7.
8.
Meteorological
station
in Guciów
Fig. 1. The location of sampling sites against the background of land use within the Wieprz River catchment
(1 – springs, 2 – rivers, 3 – municipal sewage, 4 – waters, 5 – built-up areas, 6 – forests, 7 – meadows
and pastures, 8 – arable land areas)
the catchment area), with favourable plant cultivation conditions, likewise rendzina
soils formed from marl and marly rocks (4.9 % of the catchment area). Leached and
acid brown soils, predominant within the catchment area (51.8 %), which developed on
shallow calcareous-siliceous rocks as well as loess rocks, are characterised by a medium
potential for plant cultivation. Rusty and podzolic soils, formed primarily from sand
deposits, with unfavourable plant cultivation conditions, are found in a large area
(22.8 % of the catchment area). At the bottoms of the river valleys, on alluvial soils,
silts and peats as well as hydrogenic soils developed (11 % of the catchment area), used
primarily as meadows and pastures [6, 7]. In the areas with fertile soils as well as within
meadows and pastures, ca 60 kg N � ha–1
� year–1
is applied as fertiliser, on poorer soils
~40 kg N � ha–1
� year–1
.
The leaching of nitrogen from soil to groundwater is conditioned to a large extent by
precipitation. In the upper Wieprz River catchment, average total precipitation is approx
680 mm, and the total discharge rate is 160 mm [8]; the share of groundwater inflow in
the total river discharge is estimated at over 80 % [9]. The Wieprz River is fed by
efficient springs and through direct channel drainage. The main and most abundant
aquifer of this area, referred to as the Rotocze aquifer, occurs in tight Upper Cretaceous
and Tertiary calcareous-siliceous rocks (eg gaizes). In the river valleys, the waters of the
Rotocze aquifer merge with those filling Quaternary alluvia (mainly sands), forming a
joint system [9].
Materials and methods
The aim of this study was to determine the share of the nitrogen load introduced into
the substratum by precipitation and agricultural land use in the river discharge from the
upper Wieprz River catchment. This task was carried out by measuring nitrogen
concentrations at particular stages of the hydrologic cycle: in precipitation, surface
runoff, groundwater and the river. Based on hydrometric and meteorological material,
a nitrogen balance was made for the catchment of the upper Wieprz River, covering the
years 2005–2006.
Water samples from precipitation events were collected on a daily basis, at the
Guciow-based Roztocze Research Station of the Maria Curie-Sklodowska University,
as total precipitation: dry + wet [10]; precipitation was recorded using Hellmann’s
standard rain gauge. Water samples from slope runoff were collected randomly after
heavy rainfalls and during snowmelt. The nitrogen concentration in groundwater was
determined based on periodic water sampling from 4 springs, including 3 springs from
the main aquifer feeding the Wieprz River and 1 from the Quaternary aquifer located
above it. 49 water samples were collected from the Wieprz River under different
hydrometeorological conditions.
In the samples collected, total nitrogen (TN) and dissolved inorganic nitrogen (DIN)
were determined as the sum of nitrogen: nitrate nitrogen(III, V) and the ammonium
nitrogen, using an ion chromatograph (MIC 3 manufactured by Metrohm) with
conductometric detection. Anion forms were determined by using an anion separation
column Metrosep A Supp 5-250 for analyses with chemical suppression, whereas cation
Share of Precipitation Nitrogen in the River Discharge... 911
forms by means of a cation separation column Metrosep C 2-150 for analyses without
chemical suppression. Dissolved inorganic nitrogen forms were determined in water
samples filtered through a 0.45 �m filter. Total nitrogen was determined from samples
collected from the Wieprz River: unfiltered, acidified with H2SO4 to pH ~2 and
subjected to UV oxidation with an addition of H2O2. During analytical procedures,
Merck standard solutions and CMR RAIN-97 certified material were used.
Results and discussion
The nitrogen content in the hydrologic cycle
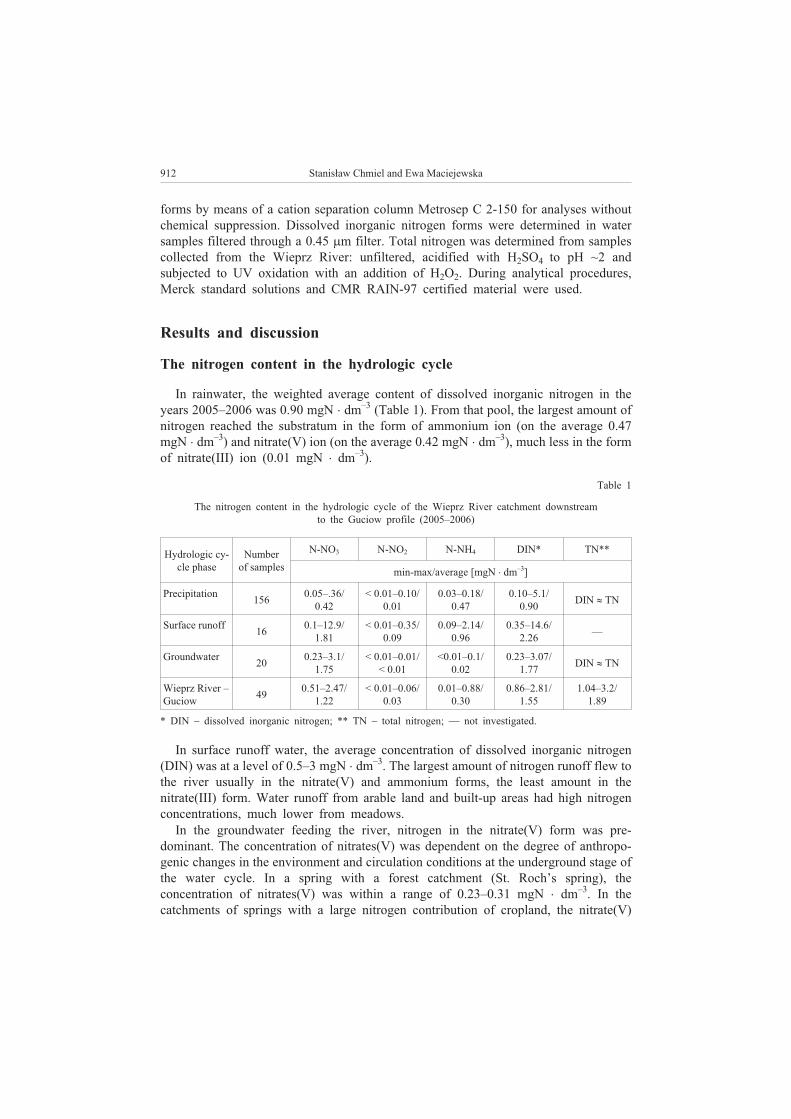
In rainwater, the weighted average content of dissolved inorganic nitrogen in the
years 2005–2006 was 0.90 mgN � dm–3
(Table 1). From that pool, the largest amount of
nitrogen reached the substratum in the form of ammonium ion (on the average 0.47
mgN � dm–3
) and nitrate(V) ion (on the average 0.42 mgN � dm–3
), much less in the form
of nitrate(III) ion (0.01 mgN � dm–3
).
Table 1
The nitrogen content in the hydrologic cycle of the Wieprz River catchment downstream
to the Guciow profile (2005–2006)
Hydrologic cy-
cle phase
Number
of samples
N-NO3 N-NO2 N-NH4 DIN* TN**
min-max/average [mgN � dm–3
]
Precipitation156
0.05–.36/
0.42
< 0.01–0.10/
0.01
0.03–0.18/
0.47
0.10–5.1/
0.90DIN � TN
Surface runoff16
0.1–12.9/
1.81
< 0.01–0.35/
0.09
0.09–2.14/
0.96
0.35–14.6/
2.26—
Groundwater20
0.23–3.1/
1.75
< 0.01–0.01/
< 0.01
<0.01–0.1/
0.02
0.23–3.07/
1.77DIN � TN
Wieprz River –
Guciow49
0.51–2.47/
1.22
< 0.01–0.06/
0.03
0.01–0.88/
0.30
0.86–2.81/
1.55
1.04–3.2/
1.89
* DIN – dissolved inorganic nitrogen; ** TN – total nitrogen; — not investigated.
In surface runoff water, the average concentration of dissolved inorganic nitrogen
(DIN) was at a level of 0.5–3 mgN � dm–3
. The largest amount of nitrogen runoff flew to
the river usually in the nitrate(V) and ammonium forms, the least amount in the
nitrate(III) form. Water runoff from arable land and built-up areas had high nitrogen
concentrations, much lower from meadows.
In the groundwater feeding the river, nitrogen in the nitrate(V) form was pre-
dominant. The concentration of nitrates(V) was dependent on the degree of anthropo-
genic changes in the environment and circulation conditions at the underground stage of
the water cycle. In a spring with a forest catchment (St. Roch’s spring), the
concentration of nitrates(V) was within a range of 0.23–0.31 mgN � dm–3
. In the
catchments of springs with a large nitrogen contribution of cropland, the nitrate(V)
912 Stanis³aw Chmiel and Ewa Maciejewska
nitrogen content was as follows: Krasnobrod spring – 2.9–3.2 mgN � dm–3
, Hutki spring
– 1.1–1.4 mgN � dm–3
and Belfont spring – 0.9–1.3 mgN � dm–3
. The content of
ammonium and nitrate(III) ions in the waters from the studied springs did not generally
exceed 0.02 mgN � dm–3
and 0.01 mgN � dm–3
, respectively.
In the waters of the Wieprz River, the content of total nitrogen(TN) in the years
2005–2006 was 1.89 mgN � dm–3
; dissolved inorganic nitrogen accounted for ~82 % of
total nitrogen. In the winter period, dissolved inorganic forms accounted for over 85 %
of total nitrogen, whereas during the growing period the share of dissolved inorganic
forms decreased. The content of total nitrogen changed within quite a wide range from
~1 mgN � dm–3
to over 3 mgN � dm–3
.
The nitrogen balance in the upper Wieprz River catchment
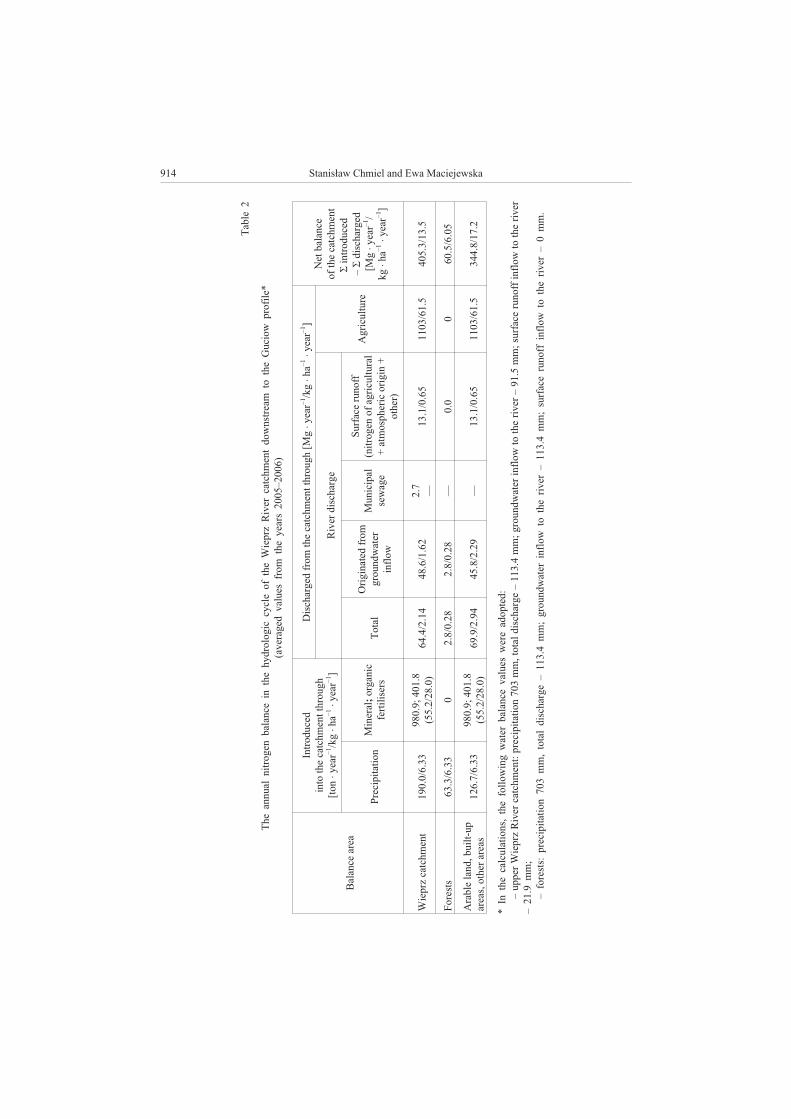
The amount of nitrogen introduced into the upper Wieprz River catchment in the
years 2005–2006 was 1572.7 Mg � year–1
(523.7 kg � ha–1
� year–1
); out of this pool,
precipitation nitrogen was 12.1 % (Table 2). Nitrogen deposition on the catchment
surface, with averaged precipitation of 703 mm from the years 2005–2006, was 6.33
kg � ha–1
� year–1
. This level was almost three times lower than the values recorded for
the Lublin province [11]. It indicates a relatively low nitrogen concentration in the
rainwater of the upper Wieprz River catchment.
The level of nitrogen introduced into the catchment in the form of mineral and
organic fertilisers was 1382.7 Mg � year–1
; hence, it was much higher than that from
precipitation. The consumption of mineral fertilisers on arable land was calculated
based on data of the Central Statistics Office in Warsaw, and it was, on the average,
55.2 kg � ha–1
� year–1
for the Lublin province in the years 2005–2006. In the case of
nitrogen introduced into the catchment in the form of mineral fertilisers, an assumption
was made that only arable land was fertilised at an amount of 28 kg � ha–1
� year–1
,
which corresponds to the averaged value for the Lublin province [11].
The level of nitrogen discharged from the upper Wieprz River catchment was 1167.3
Mg � year–1
(38.9 kg � ha–1
� year–1
), including 64.4 Mg � year–1
which was carried away
through the river system. The river transport of nitrogen was at a level defined for the
Wieprz River downstream to the Zwierzyniec profile (55.75 Mg � year–1
) for the years
1992–1997 [12] based on dissolved inorganic nitrogen forms. The main pool of nitrogen
discharged via the river system in the years 2005–2006 originated from agriculturally
used areas – 61.7 Mg � year–1
(3.08 kg � ha–1
� year–1
). From forest areas, only
2.8 Mg � year–1
(0.28 kg � ha–1
� year–1
) was discharged. The outflow of nitrogen
originating from the groundwater inflow to the Wieprz River was 48.6 Mg � year–1
(1.62 kg � ha–1
� year–1
). Together with water surface runoff, 13.1 Mg � year–1
of
nitrogen (0.65 kg � ha–1
� year–1
) was discharged through the Wieprz River. The results
of the calculations show that, on the average, 405.5 Mg � year–1
of nitrogen
(13.5 kg � ha–1
� year–1
) remains within the Wieprz River catchment, with a major
amount of nitrogen left remaining in agriculturally used soils.
Share of Precipitation Nitrogen in the River Discharge... 913
914 Stanis³aw Chmiel and Ewa Maciejewska
Table
2
The
annual
nit
rogen
bala
nce
inth
ehydrolo
gic
cycle
of
the
Wie
prz
Riv
er
catc
hm
ent
dow
nstr
eam
toth
eG
ucio
wprofil
e*
(averaged
valu
es
from
the
years
2005–2006)
Bala
nce
area
Intr
oduced
into
the
catc
hm
ent
through
[to
n�year
–1/k
g�ha
–1
�year
–1]
Dis
charged
from
the
catc
hm
ent
through
[M
g�year
–1/k
g�ha
–1
�year
–1]
Net
bala
nce
of
the
catc
hm
ent
�in
troduced
–�
dis
charged
[M
g�year
–1/
kg
�ha
–1
�year
–1]
Riv
er
dis
charge
Agric
ult
ure
Precip
itati
on
Min
eral;
organic
ferti
lisers
Tota
l
Orig
inate
dfrom
groundw
ate
r
inflo
w
Munic
ipal
sew
age
Surface
runoff
(nit
rogen
of
agric
ult
ural
+atm
ospheric
orig
in+
oth
er)
Wie
prz
catc
hm
ent
190.0
/6.3
3980.9
;401.8
(55.2
/28.0
)64.4
/2.1
448.6
/1.6
22.7
—13.1
/0.6
51103/6
1.5
405.3
/13.5
Forests
63.3
/6.3
30
2.8
/0.2
82.8
/0.2
8—
0.0
060.5
/6.0
5
Arable
land,buil
t-up
areas,oth
er
areas
126.7
/6.3
3980.9
;401.8
(55.2
/28.0
)69.9
/2.9
445.8
/2.2
9—
13.1
/0.6
51103/6
1.5
344.8
/17.2
*In
the
calc
ula
tions,
the
foll
ow
ing
wate
rbala
nce
valu
es
were
adopte
d:
–upper
Wie
prz
Riv
er
catc
hm
ent:
precip
itati
on
703
mm
,to
tal
dis
charge
–113.4
mm
;groundw
ate
rin
flo
wto
the
riv
er
–91.5
mm
;surface
runoff
inflo
wto
the
riv
er
–21.9
mm
;
–forests
:precip
itati
on
703
mm
,to
tal
dis
charge
–113.4
mm
;groundw
ate
rin
flo
wto
the
riv
er
–113.4
mm
;surface
runoff
inflo
wto
the
riv
er
–0
mm
.
Conclusions
The nitrogen balance made for the Wieprz River downstream to the Guciow profile
shows that nearly 90 % of the pool of this element introduced into the catchment
(1572.7 Mg � year–1
) was attributable to agriculture. Nitrogen reaching the substratum
with precipitation made up the remaining part. A major amount of nitrogen discharged
from the catchment (1167.4 Mg � year–1
) was also attributable to agriculture (approx
75 % of nitrogen introduced into the catchment), and it was associated with the
discharge of nitrogen contained in plant crops.
Nitrogen discharged from the Wieprz River catchment through the river system
accounted for approx 4.1 % of the pool of nitrogen introduced into the catchment area
(from precipitation and agriculture). Nitrogen of agricultural origin made up the main
pool of nitrogen discharged through the Wieprz River (53.3 Mg � year–1
), whereas
nitrogen from municipal waste discharge accounted for approx 4 %. The share of
precipitation nitrogen in the total nitrogen discharge via the Wieprz River was estimated
at 11.4 %. At periods when the river was fed by surface runoff waters, the share of
precipitation nitrogen in the river discharge increased up to ca 30 %.
The net balance of the Wieprz River catchment shows that approx. 25 % of nitrogen
introduced into the catchment area remained in the soil and plants as well as it
underwent denitrification processes.
References
[1] Berner E.K. and Berner R.: Global environmental: water, air and geochemical cycles. Prentice-Hall, Inc.,
New Jersey 1996, 376 pp.
[2] ¯elazny M., Che³micki W., Jaszczyñska B., Michno A., Pietrzak M., Raczak J. and Œwiêchowicz J.:
Dynamika zwi¹zków biogennych w wodach opadowych, powierzchniowych podziemnych w zlewniach
o ró¿nym u¿ytkowaniu na Pogórzu Wiœnickim. Inst. Geogr. i Gosp. Przestrz. UJ, Kraków 2005, 216 pp.
(in Polish).
[3] ¯urek A.: The estimation of the level of nitrate leaching in to groundwater based on the example of small
agricultural catchments at the foothills of the Carpathian Mountains. Gaz Woda Technika Sanitar. 2006,
(11) (in Polish).
[4] Sapek A., Sapek B. and Pietrzak S.: The nitrogen cycle and balance in Polish agriculture. Nawozy
Nawo¿. 2002, (1), 100–121.
[5] Igras J., Kopiñski J. and Lipiñski W.: Nutrient balances in Polish agriculture. Ann. Polish Chem. Soc.
2003, (2/II), 713–718.
[6] Dêbicki R., Chodorowski J. and Gawrysiak L.: Characteristics of the soil cover, [in:] Natural conditions
of the water cycle dynamics and fluvial transport rate in the upper Wieprz River catchment. Wyd.
UMCS, Lublin 2004, 33–40 (in Polish).
[7] Maruszczak H. and Œwieca A.: Geological and geomorphological characteristics, [in:] Natural
conditions of the water cycle dynamics and fluvial transport rate in the upper Wieprz River catchment.
Wyd. UMCS, Lublin 2004, 23–32 (in Polish).
[8] Stêpniewska S.: Variability in the upper Wieprz River discharge, [in:] The water cycle in the natural and
transformed environment. Hydrographic research in environmental knowledge, vol. VIII, Wyd. UMCS,
Lublin 2007, 513–520 (in Polish).
[9] Michalczyk Z.: Characteristics of water relations, [in:] Natural conditions of the water cycle dynamics
and fluvial transport rate in the upper Wieprz River catchment. Wyd. UMCS, Lublin 2004, 50–64 (in
Polish).
Share of Precipitation Nitrogen in the River Discharge... 915
[10] Chmiel S. and Maciejewska E.: Physicochemical features of rainwater at Guciów in the Roztocze region,
[in:] The water cycle in the natural and transformed environment. Hydrographic research in environ-
mental knowledge, vol. VIII, Wyd. UMCS, Lublin 2007, 133–141 (in Polish).
[11] Kopiñski J.: The gross nitrogen balance on the surface of a field as an agro-environmental indicator of
changes in the intensity of agricultural production in Poland. IUNG-PIB, Pu³awy, Studia i raporty 2007,
(4), 20–32 (in Polish).
[12] Œwieca A., Krukowska R. and Tucki A.: Spatial variations and variability in the concentration of
occurrence of dissolved inorganic nitrogen forms in river waters of the Wieprz River basin. Ann. UMCS,
sec. B., 2002, LVII(8), 127–154 (in Polish).
UDZIA£ AZOTU Z OPADÓW ATMOSFERYCZNYCH
W ODP£YWIE RZECZNYM GÓRNEGO WIEPRZA (ROZTOCZE, SE POLSKA)
Instytut Nauk o Ziemi
Uniwersytet Marii Curie-Sk³odowskiej w Lublinie
Abstrakt: Opieraj¹c siê na materia³ach hydrochemicznych, hydrometrycznych i meteorologicznych, spo-
rz¹dzono bilans azotu w zlewni górnego Wieprza obejmuj¹cy lata 2005–2006. Obliczenia wykaza³y, ¿e azot
wynoszony systemem rzecznym stanowi³ oko³o 4,1 % puli azotu wprowadzanego do zlewni Wieprza (1572,7
Mg � rok–1
). W ca³kowitym odp³ywie azotu rzek¹ Wieprz (64,4 Mg � rok–1
) udzia³ wyprowadzanego azotu
pochodz¹cego z opadów atmosferycznych oszacowano na 13,1 % (8,4 Mg � rok–1
). G³ówn¹ czêœæ azotu
wyprowadzanego systemem rzecznym stanowi³ azot pochodzenia rolniczego (53,3 Mg � rok–1
).
S³owa kluczowe: obieg wody, azot, opady atmosferyczne, rolnictwo
916 Stanis³aw Chmiel and Ewa Maciejewska
Aleksandra DRA¯BO1, Wies³aw SOBOTKA,
Zofia ANTOSZKIEWICZ and Karol WEBER
EFFECT OF THE CONCENTRATIONS AND QUALITY
OF PROTEIN IN DIETS FOR GROWING-FINISHING PIGS
ON NITROGEN EXCRETION TO THE ENVIRONMENT
WP£YW POZIOMU I JAKOŒCI BIA£KA
W MIESZANKACH PASZOWYCH DLA TUCZNIKÓW
NA WYDALANIE AZOTU DO ŒRODOWISKA
Abstract: The objective of this study was to determine the effect of the concentrations and quality of protein
in diets for growing-finishing pigs on total protein digestibility, and on the levels of nitrogen retention,
utilization and excretion to the environment. Digestibility and balance trials were conducted on 24 young
hybrid (Polish Large White x Polish Landrace) x Duroc) boars, placed in individual metabolism cages
equipped for quantitative collection of feces and urine. The boars were divided into three experimental
groups, of 8 animals each, and were fed grower and finisher diets differing in the concentrations of total
protein, lysine, methionine, threonine and tryptophan. Control diet 1 contained standard amounts of total
protein and essential amino acids, diet 2 contained reduced amounts of total protein (by 15 % to the standard
level) and essential amino acids, and diet 3 contained reduced amounts of total protein and standard (as in
control diet 1) amounts of essential amino acids.
It was found that a decrease in the levels of total protein and essential amino acids (lysine, methionine,
threonine and tryptophan) in grower diets negatively affected protein digestibility and nitrogen balance
parameters. The analyzed experimental factor had a beneficial influence on urinary and fecal nitrogen
excretion in pigs fed on finisher diets. The supplementation of diets with a decreased total protein content with
essential amino acids had no statistically significant effect on nitrogen balance. It was estimated that a 15 %
reduction to the standard level in total protein concentrations and a decrease in essential amino acid levels in
grower and finisher diets reduced nitrogen excretion to the environment by 5.38 to 16.81 %.
Keywords: various concentrations of protein and amino acids, digestibility, nitrogen balance, nitrogen
excretion, growing-finishing pigs
The conversion of plant products into foods of animal origin is accompanied by the
emissions of unused metabolites to the environment. The growing demand for meat
products leads to the intensification of animal production, and the consequent
E C O L O G I C A L C H E M I S T R Y A N D E N G I N E E R I N G A
Vol. 16, No. 8 2009
1Animal Nutrition and Feed Management, University of Warmia and Mazury in Olsztyn, ul.
M. Oczapowskiego 5, 10–719 Olsztyn, Poland, email: [email protected]
environmental pollution problems resulting primarily from increased nitrogen and
phosphorus emissions. Animal excreta contain large amounts of pollutants which get
into the air, soil and surface waters, thus contributing to the greenhouse effect, the
formation of acid precipitation and to the depletion of the stratospheric ozone layer [1].
Biogenic nitrogen-containing compounds that come from animal excreta penetrate into
the soil and inland waters, leading to gradual degradation of aquatic ecosystems.
The concentrations of total protein in feedstuffs and the quality of this nutrient in
diets for pigs have a decisive effect on the amounts of nitrogen excreted in feces and
urine. Müller [2] demonstrated that a decrease in the protein content of feed for pigs
allows to reduce nitrogen excretion by up to 40 %. According to this author,
environmental load from pig production can be effectively reduced by feeding
high-quality protein sources and supplementing rations with synthetic amino acids,
which are readily absorbed in the small intestine and used for protein accumulation in
the body. Any excess protein supplied in feed, above the requirements of the animals, is
metabolized to urea and excreted [3]. Urea nitrogen is broken down producing ammonia
which is emitted into the atmosphere, posing a serious threat to soil and groundwater.
According to Kirchgessner et al [4], the major environmental goal in pig production
should be to reduce the amount of nitrogen in urine that is mixed with feces to form
slurry.
The main criterion applied to determine the amount of protein in diets for pigs is the
adequate provision of essential amino acids, with particular attention given to limiting
amino acids, such as lysine, methionine, threonine and tryptophan. Other amino acids
may be supplied in excess of the animals’ needs. Lowering the protein content of feed
and balancing the ration to meet the dietary requirements of pigs at particular stages of
fattening enables to improve the utilization of this nutrient. However, complete diets
have to be precisely balanced with respect to essential amino acids, by selecting
appropriate feed components or supplementing low-protein diets with limiting amino
acids.
The objective of this study was to determine the effect of the concentrations and
quality of protein in diets for growing-finishing pigs on total protein digestibility, and
on the levels of nitrogen retention, utilization and excretion to the environment.
Materials and methods
Total protein digestibility and nitrogen balance were determined twice during
digestibility and balance trials conducted on 24 young hybrid (Polish Large White x
Polish Landrace) x Duroc) boars with average body weight of approximately 30 kg at
the beginning of experiment I, and approximately 85 kg at the beginning of experiment
II. The animals were placed in individual metabolism cages equipped for quantitative
collection of feces and urine. The boars were divided into three experimental groups, of
8 animals each, and were fed grower (experiment I) and finisher (experiment II) diets
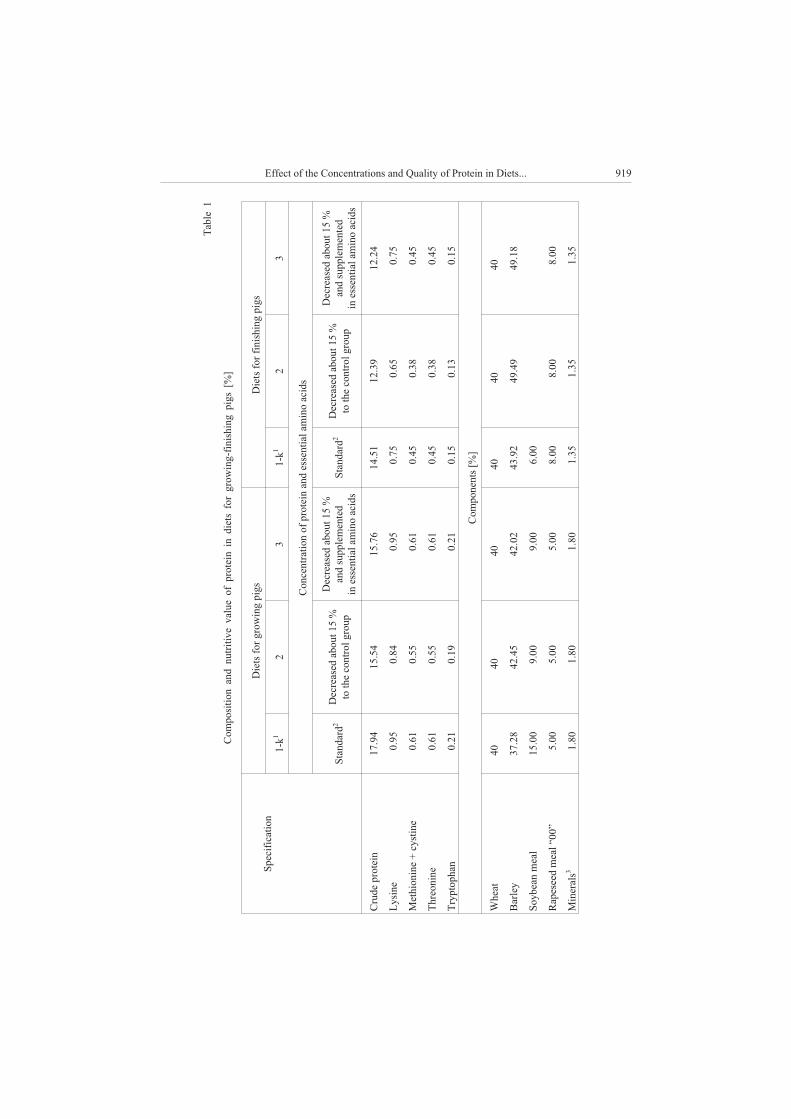
differing in the concentrations of total protein and amino acids (Table 1).
918 Aleksandra Dra¿bo et al
Effect of the Concentrations and Quality of Protein in Diets... 919
Table
1
Com
posit
ion
and
nutr
itiv
evalu
eof
prote
inin
die
tsfor
grow
ing-fin
ishin
gpig
s[%
]
Specif
icati
on
Die
tsfor
grow
ing
pig
sD
iets
for
fin
ishin
gpig
s
1-k
12
31-k
12
3
Concentr
ati
on
of
prote
inand
essenti
al
am
ino
acid
s
Sta
ndard
2D
ecreased
about
15
%
toth
econtr
ol
group
Decreased
about
15
%
and
supple
mente
d
inessenti
al
am
ino
acid
s
Sta
ndard
2D
ecreased
about
15
%
toth
econtr
ol
group
Decreased
about
15
%
and
supple
mente
d
inessenti
al
am
ino
acid
s
Crude
prote
in17.9
415.5
415.7
614.5
112.3
912.2
4
Lysin
e0.9
50.8
40.9
50.7
50.6
50.7
5
Meth
ionin
e+
cysti
ne
0.6
10.5
50.6
10.4
50.3
80.4
5
Threonin
e0.6
10.5
50.6
10.4
50.3
80.4
5
Trypto
phan
0.2
10.1
90.2
10.1
50.1
30.1
5
Com
ponents
[%
]
Wheat
40
40
40
40
40
40
Barle
y37.2
842.4
542.0
243.9
249.4
949.1
8
Soybean
meal
15.0
09.0
09.0
06.0
0
Rapeseed
meal
“00”
5.0
05.0
05.0
08.0
08.0
08.0
0
Min
erals
31.8
01.8
01.8
01.3
51.3
51.3
5
920 Aleksandra Dra¿bo et al
Specif
icati
on
Die
tsfor
grow
ing
pig
sD
iets
for
fin
ishin
gpig
s
1-k
12
31-k
12
3
Min
eral
–vit
am
inprem
ix0.7
00.7
00.7
00.5
00.5
00.5
0
L-ly
sin
eH
Cl
(78
%)
0.2
20.2
50.4
10.2
30.2
30.2
3
Dl-
meth
ionin
e(99
%)
——
0.1
5—
—0.0
4
Threonin
e—
—0.0
9—
—0.0
8
Trypto
phan
——
0.0
3—
—0.0
3
Rapeseed
oil
—0.8
00.8
0—
0.4
00.4
0
Nutr
itiv
evalu
e
Dig
esti
ble
prote
in[g/k
g]
149.0
0122.0
0130.0
0117.9
499.6
5100.4
7
Meta
boli
zable
energy
[M
J/k
g]
12.8
012.8
012.8
012.8
012.8
012.8
0
1C
ontr
ol
die
t;2
Valu
ecalc
ula
ted
based
on
Nutr
itio
nR
equir
em
ent
of
Pig
s(1993);
3L
imesto
ne
(0.8
/0.7
%),
dic
alc
ium
phosphate
(0.7
/0.4
%),salt
(0.3
/0.2
5%
).
Table
1cont.
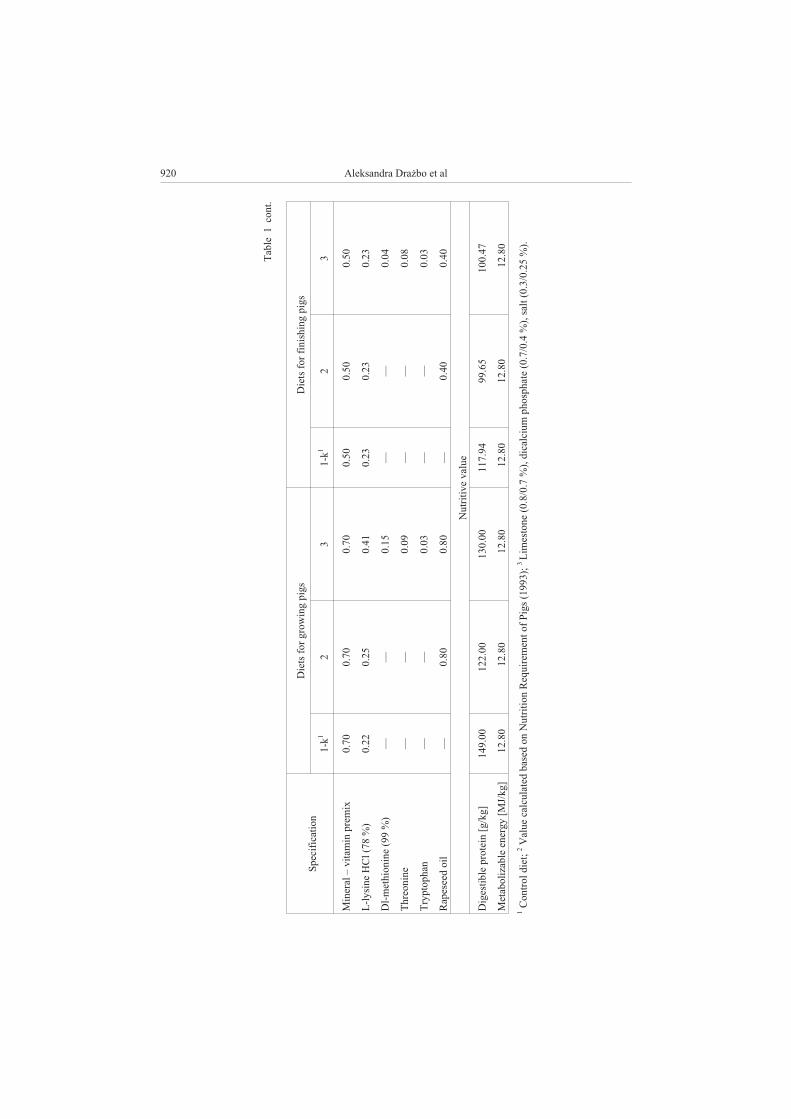
The daily allowance of grower and finisher diets was 2.3 kg and 3.0 kg per pig,
respectively. Feed was offered in wet form (feed to water ratio of 1:1), twice daily. The
nutritional value of diets was consistent with the Pig Nutrient Requirements [5].
During the experimental period proper, the entire amounts of feces and urine were
collected. 5 % samples of the total amount of feces excreted daily were collected for
analysis and frozen, and their total nitrogen content was determined at the completion of
the experimental period proper. Urine collected into containers was preserved with
sulfuric acid, and 5 % samples were assayed for total nitrogen content [6].
The digestible protein content of grower and finisher diets was determined based on
the digestibility coefficients calculated during digestibility trials. The levels of lysine,
methionine, cystine, threonine and tryptophan in diets were calculated based on the
concentrations of the above amino acids in feed raw materials used for diet formulation.
Nitrogen losses to the environment were determined based on daily nitrogen balance
and feed intake levels.
The results regarding protein digestibility and nitrogen balance were verified
statistically using a one-factor analysis of variance (ANOVA) and Duncan’s multiple
range test [7].
Results and discussion
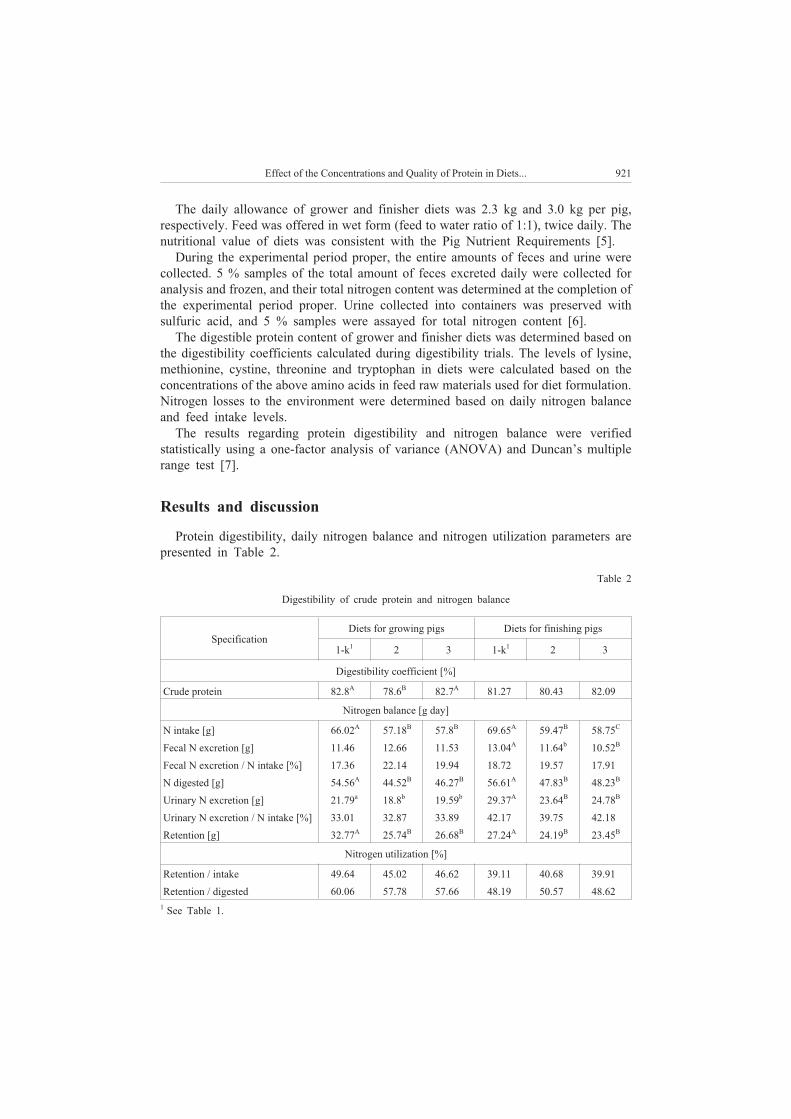
Protein digestibility, daily nitrogen balance and nitrogen utilization parameters are
presented in Table 2.
Table 2
Digestibility of crude protein and nitrogen balance
Specification
Diets for growing pigs Diets for finishing pigs
1-k1
2 3 1-k1
2 3
Digestibility coefficient [%]
Crude protein 82.8A
78.6B
82.7A
81.27 80.43 82.09
Nitrogen balance [g day]
N intake [g] 66.02A
57.18B
57.8B
69.65A
59.47B
58.75C
Fecal N excretion [g] 11.46 12.66 11.53 13.04A
11.64b
10.52B
Fecal N excretion / N intake [%] 17.36 22.14 19.94 18.72 19.57 17.91
N digested [g] 54.56A
44.52B
46.27B
56.61A
47.83B
48.23B
Urinary N excretion [g] 21.79a
18.8b
19.59b
29.37A
23.64B
24.78B
Urinary N excretion / N intake [%] 33.01 32.87 33.89 42.17 39.75 42.18
Retention [g] 32.77A
25.74B
26.68B
27.24A
24.19B
23.45B
Nitrogen utilization [%]
Retention / intake 49.64 45.02 46.62 39.11 40.68 39.91
Retention / digested 60.06 57.78 57.66 48.19 50.57 48.62
1See Table 1.
Effect of the Concentrations and Quality of Protein in Diets... 921
The digestibility of total protein in experimental grower and finisher diets was found
to vary depending on the experimental factor and diet type. A decrease in the content of
protein and amino acids limiting the biological value of protein in grower diet 2 resulted
in a significant decrease in the digestibility of this nutrient, from 82.8 % to 78.6 %.
Compared with finisher diet 2, the analyzed experimental factor had a statistically
non-significant effect. The supplementation of grower and finisher diets 3 with lysine,
methionine, threonine and tryptophan significantly improved total protein digestibility,
which increased from 78.6 % to 82.7 % in the grower diet, and from 80.43 % to
82.09 % in the finisher diet. Also in a study conducted by Wiêcek et al [8] on
growing-finishing pigs, total protein digestibility was affected by the levels of protein
and amino acids in mixed feed. The coefficient of protein digestibility was high, at
80 %.
Data concerning daily nitrogen balance (Table 2) show that nitrogen intake was
substantially higher in control group animals fed grower and finisher diets with standard
concentrations of protein and essential amino acids, in comparison with boars of
experimental groups 2 and 3 (by 8.84 and 8.22 g and by 10.18 and 10.9 g/day,
respectively). This resulted from a different total protein content of diets. An analysis of
fecal nitrogen excretion revealed that it was higher in pigs fed grower diet 2, with
decreased levels of protein and essential amino acids, and significantly lower in pigs
receiving finisher diet 2. The addition of lysine, methionine, threonine and tryptophan to
diets with a lower total protein content caused a further decrease in fecal nitrogen
excretion. The experimental factor contributed also to a considerable reduction in
urinary nitrogen excretion. This could indicate better balancing of the amino acid
composition of protein in experimental diets than in control diets.
Shriver et al [9] reported that the supplementation of a low-protein diet with lysine,
methionine, threonine, tryptophan, isoleucine and valine reduced fecal and urinary
nitrogen excretion. Rohr [10] added synthetic amino acids (lysine, methionine and
threonine) to diets for growing-finishing pigs, in which protein content was decreased
from 17.5 to 14 %, and achieved an approximately 30 % reduction in nitrogen
excretion.
The levels of nitrogen retention varied depending on the concentrations and quality
of protein. Regardless of the fattening stage, the decrease in the protein content of diets
lowered nitrogen retention in pigs of experimental groups 2 and 3. As regards the
grower diet, the lowest nitrogen retention was noted in group 2 animals (25.74 g), while
in the case of the finisher diet (with a decreased protein content, supplemented with
essential amino acids) – in group 3 animals (23.45 g). The highest nitrogen retention
was observed in pigs fed control diet 1 (32.77 and 27.24 g, respectively).
The best nitrogen utilization, in relation to nitrogen intake and digestion, was noted
in pigs fed a grower diet with standard concentrations of total protein and essential
amino acids (control diet 1). A decrease in the content of protein and amino acids in
diets negatively affected the analyzed parameters. Diet supplementation with essential
amino acids in group 3 slightly improved nitrogen utilization in relation to nitrogen
intake. Group 2 animals fed a finisher diet with a decreased content of protein and
amino acids were characterized by the best nitrogen utilization relative to nitrogen
922 Aleksandra Dra¿bo et al
intake and digestion. The lowest values of nitrogen utilization were observed in the
control group.
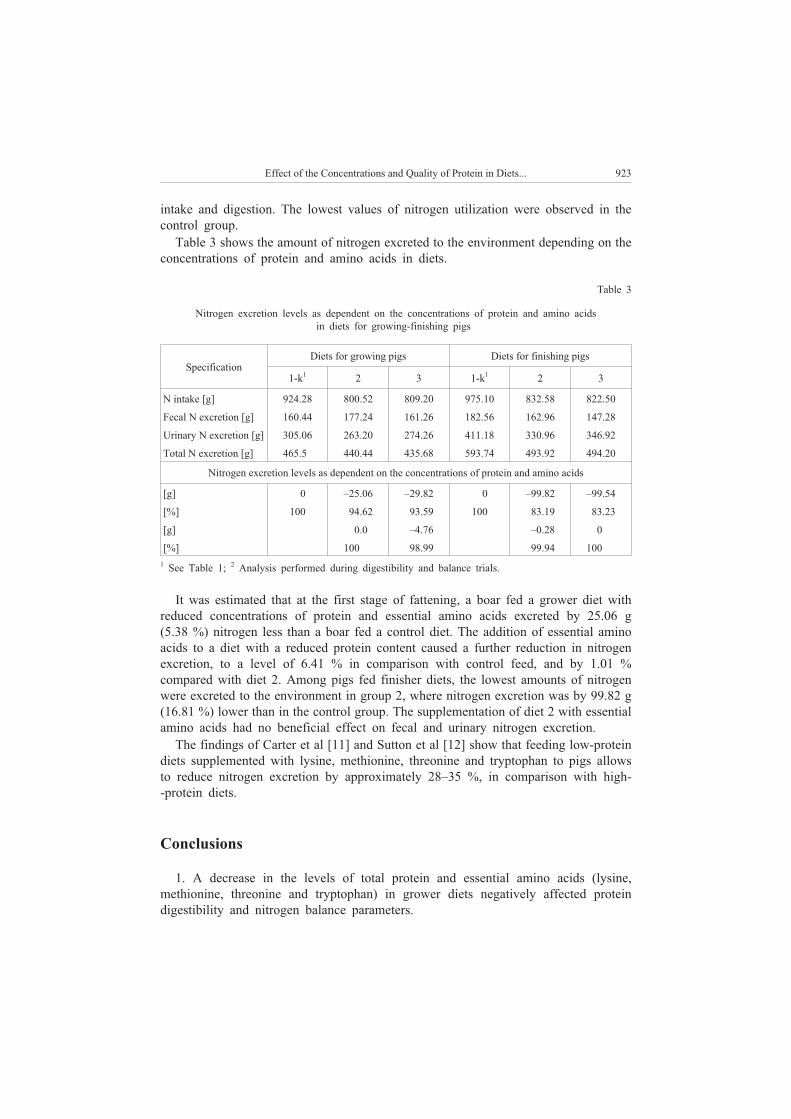
Table 3 shows the amount of nitrogen excreted to the environment depending on the
concentrations of protein and amino acids in diets.
Table 3
Nitrogen excretion levels as dependent on the concentrations of protein and amino acids
in diets for growing-finishing pigs
Specification
Diets for growing pigs Diets for finishing pigs
1-k1
2 3 1-k1
2 3
N intake [g] 924.28 800.52 809.20 975.10 832.58 822.50
Fecal N excretion [g] 160.44 177.24 161.26 182.56 162.96 147.28
Urinary N excretion [g] 305.06 263.20 274.26 411.18 330.96 346.92
Total N excretion [g] 465.5 440.44 435.68 593.74 493.92 494.20
Nitrogen excretion levels as dependent on the concentrations of protein and amino acids
[g] 0 –25.06 –29.82 0 –99.82 –99.54
[%] 100 –94.62 –93.59 100 –83.19 –83.23
[g] 0.0 –4.76 –0.28 0
[%] 100 –98.99 –99.94 100
1See Table 1;
2Analysis performed during digestibility and balance trials.
It was estimated that at the first stage of fattening, a boar fed a grower diet with
reduced concentrations of protein and essential amino acids excreted by 25.06 g
(5.38 %) nitrogen less than a boar fed a control diet. The addition of essential amino
acids to a diet with a reduced protein content caused a further reduction in nitrogen
excretion, to a level of 6.41 % in comparison with control feed, and by 1.01 %
compared with diet 2. Among pigs fed finisher diets, the lowest amounts of nitrogen
were excreted to the environment in group 2, where nitrogen excretion was by 99.82 g
(16.81 %) lower than in the control group. The supplementation of diet 2 with essential
amino acids had no beneficial effect on fecal and urinary nitrogen excretion.
The findings of Carter et al [11] and Sutton et al [12] show that feeding low-protein
diets supplemented with lysine, methionine, threonine and tryptophan to pigs allows
to reduce nitrogen excretion by approximately 28–35 %, in comparison with high-
-protein diets.
Conclusions
1. A decrease in the levels of total protein and essential amino acids (lysine,
methionine, threonine and tryptophan) in grower diets negatively affected protein
digestibility and nitrogen balance parameters.
Effect of the Concentrations and Quality of Protein in Diets... 923
2. A decrease in total protein content and dietary supplementation of essential amino
acids had a beneficial influence on urinary and fecal nitrogen excretion in pigs fed
finisher diets.
3. The supplementation of diets with a decreased total protein content with essential
amino acids had no statistically significant effect on nitrogen balance.
4. It was estimated that a 15 % reduction to the standard level in total protein
concentrations and a decrease in essential amino acid levels in grower and finisher diets
reduced nitrogen excretion to the environment by 5.38 to 16.81 %.
References
[1] Wiliams P.E.V.: Animal production and European pollution problems, Anim. Feed Sci. and Techn.
1995, 53, 135–144.
[2] Müller A.: Zrównowa¿yæ zawartoœæ aminokwasów w paszy, Top Agrar 1999, 1, 23–24.
[3] Jamroz D.: Zmniejszenie obci¹¿eñ œrodowiska poprzez modyfikacjê ¿ywienia zwierz¹t, Konf. Nauk.-
-Techn., CLPP “Pasze przemys³owe a ochrona œrodowiska”, Pu³awy 19–20.05.1997, 19–32.
[4] Kirchgessner M., Windisch W. and Roth F.X.: Mo¿liwoœæ ¿ywienia zwierz¹t w zmniejszaniu obci¹¿enia
œrodowiska przez rolnictwo, Akad. Roln, Wroc³aw 1994.
[5] Normy ¯ywienia Œwiñ., Wartoœæ pokarmowa pasz, Omnitech Press, Warszawa 1993.
[6] AOAC, Official Methods of Analysis, 16th
ed. Assoc. Offic. Anal. Chem. 1998, Arlington, VA.
[7] Stanisz A.: Przystêpny kurs statystyki z wykorzystaniem programu STATISTICA PL na przyk³adach
z medycyny, Wyd. Statsoft Polska, Kraków 2000, 1–401.
[8] Wiêcek J., Skomia³ J., Rekiel A. and Œliwiñski M.: Wp³yw poziomu bia³ka i aminokwasów w mie-
szankach dla tuczników na strawnoœæ sk³adników pokarmowych. LXX Zjazd Polskiego Towarzystwa
Zootechnicznego we Wroc³awiu. Komunikaty Naukowe PTZ, Warszawa 2005, 98.
[9] Shriver J.A., Carter S.D., Sutton A.I., Richert B.T., Senne B.W. and Pettey L.A.: Effects of adding fiber
sources to reduced crude protein, amino acids suplemented diets on nitrogen excretion, growth
performance nd carcass traits of finishing pigs, J. Anim. Sci. 2003, 81, 492–502.
[10] Rohr K.: Verringerung der Stickstoffausscheidung bei Rind, Schwein und Geflugel, Landbauforschung,
Volkenrode, Sonderheft 1992, 132, 39–53.
[11] Carter S.D., Cromwell G.L., Lindemann M.D., Turner W. and Bridges T.C.: Reducing N and P excretion
by dietary manipulation in growing and finishing pigs, J. Anim. Sci. 1996, 74 (Suppl. 1), 59. (Abstr.).
[12] Sutton A.L., Kephardt K.B., Patterson J.A., Mumma R., Kelly D.T., Bogus E., Jones D.D. and Heber A.:
Manipulating swine diets to reduce ammonia and odor emisions, Proc. 1st
Int.Conf. Air Pollution from
Agric. Operations, Kansan City, MO 1996, 445–452.
WP£YW POZIOMU I JAKOŒCI BIA£KA W MIESZANKACH PASZOWYCH
DLA TUCZNIKÓW NA WYDALANIE AZOTU DO ŒRODOWISKA
Katedra ¯ywienia Zwierz¹t i Paszoznawstwa
Uniwersytet Warmiñsko-Mazurski w Olsztynie
Abstrakt: Celem pracy by³o okreœlenie wp³ywu poziomu i jakoœci bia³ka w mieszankach paszowych dla
tuczników na strawnoœæ bia³ka ogólnego, retencjê azotu i jego wykorzystanie oraz na iloœæ wydalanego azotu
do œrodowiska. Materia³ doœwiadczalny w badaniach strawnoœciowo-bilansowych stanowi³y 24 wieprzki,
mieszañce ras (wbp x pbz) x Duroc. Tuczniki umieszczono w indywidualnych klatkach metabolicznych,
przystosowanych do iloœciowego zbierania ka³u i moczu. Zosta³y one podzielone na 3 grupy doœwiadczalne
po 8 osobników w ka¿dej i ¿ywione mieszankami Grower/Finiszer o ró¿nej koncentracji bia³ka ogólnego,
lizyny, metioniny, treoniny i tryptofanu. Mieszanka 1-K zawiera³a standardow¹ iloœæ bia³ka ogólnego
i aminokwasów egzogennych; mieszanka 2 mia³a obni¿ony o 15 % w stosunku do standardu poziom bia³ka
ogólnego i aminokwasów egzogennych; w mieszance 3 zmniejszona iloœæ bia³ka ogólnego zosta³a wzbo-
gacona w aminokwasy egzogenne do poziomu jak w mieszance 1-K.
924 Aleksandra Dra¿bo et al

Stwierdzono, ¿e obni¿enie poziomu bia³ka ogólnego i aminokwasów egzogennych (lizyny, metioniny,
treoniny i tryptofanu) w mieszance paszowej Grower dla tuczników wp³ynê³o ujemnie na strawnoœæ bia³ka
i parametry bilansu azotu. Odnotowano korzystny wp³yw analizowanego czynnika doœwiadczalnego na
wydalanie azotu w kale i moczu u tuczników otrzymuj¹cych paszê Finiszer. Wzbogacenie ocenianych
mieszanek paszowych o obni¿onym poziomie bia³ka ogólnego w aminokwasy egzogenne nie mia³o
statystycznie istotnego wp³ywu na gospodarkê azotow¹ w organizmie œwiñ. Oszacowano, ¿e redukcja
poziomu bia³ka ogólnego i aminokwasów egzogennych o 15 % w stosunku do iloœci standardowej
w mieszankach paszowych Grower/Finiszer zmniejsza wydalanie azotu do œrodowiska od 5,38 do 16,81 %.
S³owa kluczowe: ró¿ne poziomy bia³ka i aminokwasów, strawnoœæ, bilans azotu, wydalanie azotu, tuczniki
Effect of the Concentrations and Quality of Protein in Diets... 925

Marek GUGA£A1
and Krystyna ZARZECKA1
CONTENT OF NITRATES(V) IN POTATO TUBERS
IN CONDITIONS OF APPLICATION
OF NEW GENERATION INSECTICIDES
ZAWARTOŒÆ AZOTANÓW(V) W BULWACH ZIEMNIAKA
W WARUNKACH STOSOWANIA
INSEKTYCYDÓW NOWEJ GENERACJI
Abstract: Studies were carried out on the basis of a field experiment set upon the soil of the rye very good
complex. The experiment was designed as randomized sub-blocks with three replications. Experimental
factors included three cultivars of edible potato – Wiking, Mors, Zagiel, and six Colorado potato beetle
control methods using the following insecticides: Actara 25 WG at the rate of 80 g/ha, Regent 200 SC at the
rate of 0.1 dm3/ha, Calypso 480 SC at three rates: 0.05, 0.075 and 0.1 dm
3/ha, and a control object without
chemical protection. Nitrates(V) content in potato tubers was determined with ion-selective nitrate electrode
and silver-sliver chloride reference electrode. The content nitrates(V) depended on the cultivars and weather
conditions throughout the growing season. Tubers of Mors cultivar had the highest nitrates(V) content – on
average 168.2 mg/kg.
Keywords: potato, nitrates(V), insecticides, Colorado potato beetle
Among other foodstuff potato play an important role as staple food in human
nutrition in many countries, also in Poland [1–4]. The potato quality depends on
chemical composition, which modifies its nutritional value. Potato tubers contain not
only nutritional compounds but also substances adversely affecting our health [5]. From
the point of view of a consumer’s health, it is very important, that the tubers of potato
include the smallest possible content of nitrates(V) [6–9]. These compounds, under the
influence of the stomach’s bacterial flora, may undergo reduction to nitrates(III)
(nitrites), and these in turn are the precursors of nitrosamine, that may have
carcinogenic and mutagenesis action [10–12]. Accumulation of nitrates(V) in potato
tubers depending on many factors – cultivar properties [10, 12, 13], tillage, fertilization
and protection against agrophages [7, 9, 14, 15] and environmental conditions [8, 16].
E C O L O G I C A L C H E M I S T R Y A N D E N G I N E E R I N G A
Vol. 16, No. 8 2009
1Departament of Plant Cultivation, University of Podlasie, ul. B. Prusa 14, 08–110 Siedlce, Poland, phone
25 643 12 37, email: [email protected]; [email protected]
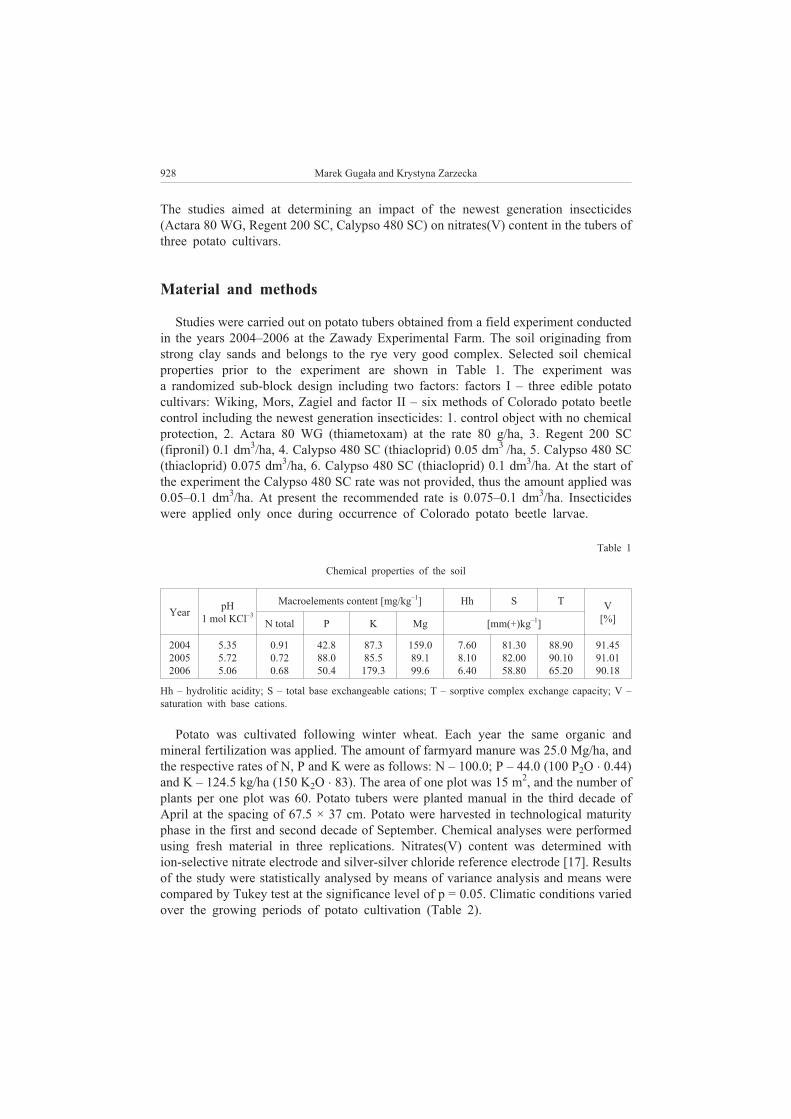
The studies aimed at determining an impact of the newest generation insecticides
(Actara 80 WG, Regent 200 SC, Calypso 480 SC) on nitrates(V) content in the tubers of
three potato cultivars.
Material and methods
Studies were carried out on potato tubers obtained from a field experiment conducted
in the years 2004–2006 at the Zawady Experimental Farm. The soil originading from
strong clay sands and belongs to the rye very good complex. Selected soil chemical
properties prior to the experiment are shown in Table 1. The experiment was
a randomized sub-block design including two factors: factors I – three edible potato
cultivars: Wiking, Mors, Zagiel and factor II – six methods of Colorado potato beetle
control including the newest generation insecticides: 1. control object with no chemical
protection, 2. Actara 80 WG (thiametoxam) at the rate 80 g/ha, 3. Regent 200 SC
(fipronil) 0.1 dm3/ha, 4. Calypso 480 SC (thiacloprid) 0.05 dm
3/ha, 5. Calypso 480 SC
(thiacloprid) 0.075 dm3/ha, 6. Calypso 480 SC (thiacloprid) 0.1 dm
3/ha. At the start of
the experiment the Calypso 480 SC rate was not provided, thus the amount applied was
0.05–0.1 dm3/ha. At present the recommended rate is 0.075–0.1 dm
3/ha. Insecticides
were applied only once during occurrence of Colorado potato beetle larvae.
Table 1
Chemical properties of the soil
YearpH
1 mol KCl–3
Macroelements content [mg/kg–1
] Hh S TV
[%]N total P K Mg [mm(+)kg
–1]
2004
2005
2006
5.35
5.72
5.06
0.91
0.72
0.68
42.8
88.0
50.4
87.3
85.5
179.3
159.0
89.1
99.6
7.60
8.10
6.40
81.30
82.00
58.80
88.90
90.10
65.20
91.45
91.01
90.18
Hh – hydrolitic acidity; S – total base exchangeable cations; T – sorptive complex exchange capacity; V –
saturation with base cations.
Potato was cultivated following winter wheat. Each year the same organic and
mineral fertilization was applied. The amount of farmyard manure was 25.0 Mg/ha, and
the respective rates of N, P and K were as follows: N – 100.0; P – 44.0 (100 P2O � 0.44)
and K – 124.5 kg/ha (150 K2O � 83). The area of one plot was 15 m2, and the number of
plants per one plot was 60. Potato tubers were planted manual in the third decade of
April at the spacing of 67.5 × 37 cm. Potato were harvested in technological maturity
phase in the first and second decade of September. Chemical analyses were performed
using fresh material in three replications. Nitrates(V) content was determined with
ion-selective nitrate electrode and silver-silver chloride reference electrode [17]. Results
of the study were statistically analysed by means of variance analysis and means were
compared by Tukey test at the significance level of p = 0.05. Climatic conditions varied
over the growing periods of potato cultivation (Table 2).
928 Marek Guga³a and Krystyna Zarzecka
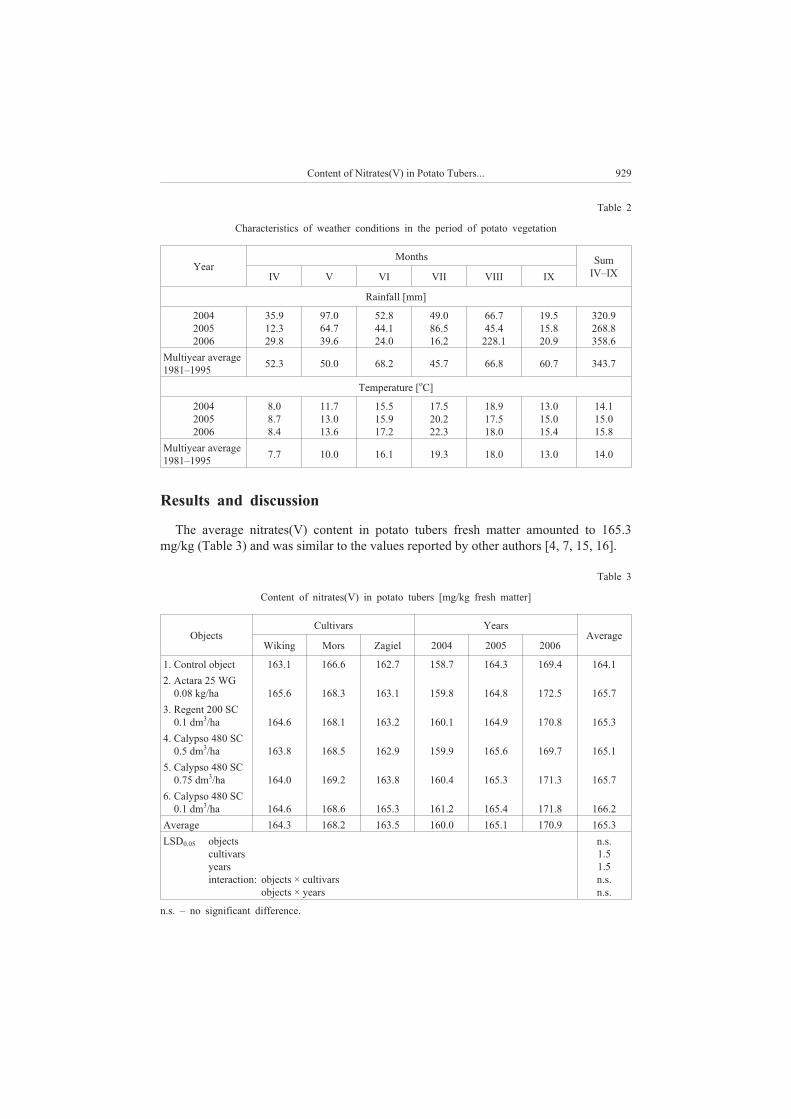
Table 2
Characteristics of weather conditions in the period of potato vegetation
Year
MonthsSum
IV–IXIV V VI VII VIII IX
Rainfall [mm]
2004
2005
2006
35.9
12.3
29.8
97.0
64.7
39.6
52.8
44.1
24.0
49.0
86.5
16.2
66.7
45.4
228.1
19.5
15.8
20.9
320.9
268.8
358.6
Multiyear average
1981–199552.3 50.0 68.2 45.7 66.8 60.7 343.7
Temperature [oC]
2004
2005
2006
8.0
8.7
8.4
11.7
13.0
13.6
15.5
15.9
17.2
17.5
20.2
22.3
18.9
17.5
18.0
13.0
15.0
15.4
14.1
15.0
15.8
Multiyear average
1981–19957.7 10.0 16.1 19.3 18.0 13.0 14.0
Results and discussion
The average nitrates(V) content in potato tubers fresh matter amounted to 165.3
mg/kg (Table 3) and was similar to the values reported by other authors [4, 7, 15, 16].
Table 3
Content of nitrates(V) in potato tubers [mg/kg fresh matter]
Objects
Cultivars Years
Average
Wiking Mors Zagiel 2004 2005 2006
1. Control object 163.1 166.6 162.7 158.7 164.3 169.4 164.1
2. Actara 25 WG
2. 0.08 kg/ha 165.6 168.3 163.1 159.8 164.8 172.5 165.7
3. Regent 200 SC
3. 0.1 dm3/ha 164.6 168.1 163.2 160.1 164.9 170.8 165.3
4. Calypso 480 SC
4. 0.5 dm3/ha 163.8 168.5 162.9 159.9 165.6 169.7 165.1
5. Calypso 480 SC
5. 0.75 dm3/ha 164.0 169.2 163.8 160.4 165.3 171.3 165.7
6. Calypso 480 SC
6. 0.1 dm3/ha 164.6 168.6 165.3 161.2 165.4 171.8 166.2
Average 164.3 168.2 163.5 160.0 165.1 170.9 165.3
LSD0.05 objects
cultivars
years
interaction: objects × cultivars
objects × years
n.s.
1.5
1.5
n.s.
n.s.
n.s. – no significant difference.
Content of Nitrates(V) in Potato Tubers... 929
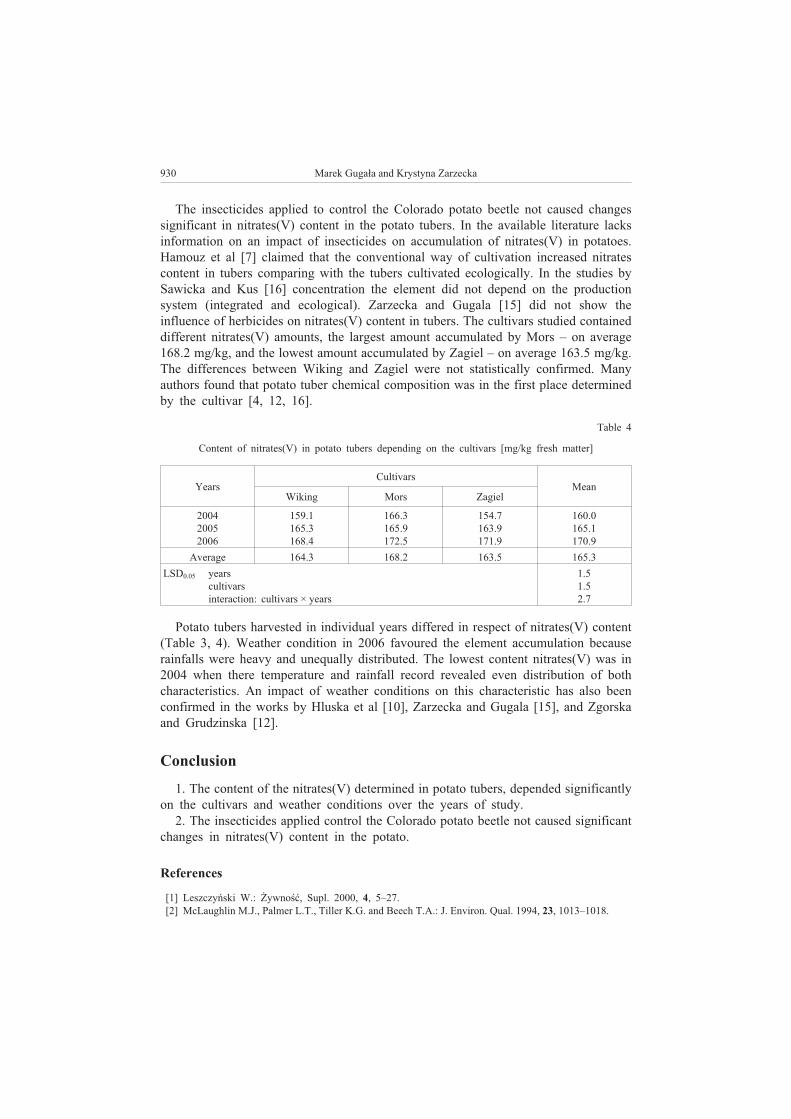
The insecticides applied to control the Colorado potato beetle not caused changes
significant in nitrates(V) content in the potato tubers. In the available literature lacks
information on an impact of insecticides on accumulation of nitrates(V) in potatoes.
Hamouz et al [7] claimed that the conventional way of cultivation increased nitrates
content in tubers comparing with the tubers cultivated ecologically. In the studies by
Sawicka and Kus [16] concentration the element did not depend on the production
system (integrated and ecological). Zarzecka and Gugala [15] did not show the
influence of herbicides on nitrates(V) content in tubers. The cultivars studied contained
different nitrates(V) amounts, the largest amount accumulated by Mors – on average
168.2 mg/kg, and the lowest amount accumulated by Zagiel – on average 163.5 mg/kg.
The differences between Wiking and Zagiel were not statistically confirmed. Many
authors found that potato tuber chemical composition was in the first place determined
by the cultivar [4, 12, 16].
Table 4
Content of nitrates(V) in potato tubers depending on the cultivars [mg/kg fresh matter]
Years
Cultivars
Mean
Wiking Mors Zagiel
2004
2005
2006
159.1
165.3
168.4
166.3
165.9
172.5
154.7
163.9
171.9
160.0
165.1
170.9
Average 164.3 168.2 163.5 165.3
LSD0.05 years
cultivars
interaction: cultivars × years
1.5
1.5
2.7
Potato tubers harvested in individual years differed in respect of nitrates(V) content
(Table 3, 4). Weather condition in 2006 favoured the element accumulation because
rainfalls were heavy and unequally distributed. The lowest content nitrates(V) was in
2004 when there temperature and rainfall record revealed even distribution of both
characteristics. An impact of weather conditions on this characteristic has also been
confirmed in the works by Hluska et al [10], Zarzecka and Gugala [15], and Zgorska
and Grudzinska [12].
Conclusion
1. The content of the nitrates(V) determined in potato tubers, depended significantly
on the cultivars and weather conditions over the years of study.
2. The insecticides applied control the Colorado potato beetle not caused significant
changes in nitrates(V) content in the potato.
References
[1] Leszczyñski W.: ¯ywnoœæ, Supl. 2000, 4, 5–27.
[2] McLaughlin M.J., Palmer L.T., Tiller K.G. and Beech T.A.: J. Environ. Qual. 1994, 23, 1013–1018.
930 Marek Guga³a and Krystyna Zarzecka
[3] Proœba-Bia³czyk U.: Sci. Agricult. Bohem. 2004, 35, 154–157.
[4] Rogoziñska I., Pawelzik E., Pobere¿ny J. and Delgado E.: Potato Res. 2005, 48, 167– 180.
[5] Lisiñska G.: Zesz. Probl. Post. Nauk Roln. 2006, 511, 81–94.
[6] Cieœlik E.: Przem. Spo¿ywczy 1992, 46(92), 266–267.
[7] Hamouz K., Lachman J., Dvoøák P. and Pivec V.: Plant Soil Environ. 2005, 51(9), 397–402.
[8] Pobere¿ny J.: Polish J. Natur. Sci. 2008, 23(2), 336–346.
[9] Rogoziñska I., Wojdy³a T. and Pobere¿ny J.: Polish J. Environ. Stud. 2000, 10, I Eco-med. Supl., 38–41.
[10] Hlušek j., Zrùst J. and Jùzl M.: Rostl. Vyroba 2000, 46(1), 17–21.
[11] Rembia³kowska E.: Jakoœæ ¿ywnoœci a rolnictwo ekologiczne. Warsztaty zorganizowane w ramach
projektu “Accompying Measure” do projektu “Flair-Flow Europe IV”. Kraków 2002, 13–28.
[12] Zgórska K. and Grudziñska M.: Zesz. Probl. Post. Nauk Roln. 2004, 500, 475–481.
[13] Ko³odziejczyk M., Szmigiel A. and Kie³basa S.: Fragm. Agron. 2007, 2(94), 142–150.
[14] Rêbarz K. and Borówczak F.: Zesz. Probl. Post. Nauk Roln. 2006, 511, 287–299.
[15] Zarzecka K. and Guga³a M.: Zesz. Probl. Post. Nauk Roln. 2006, 513, 575–582.
[16] Sawicka B. and Kuœ J.: Zesz. Probl. Post. Nauk Roln. 2002, 489, 273–282.
[17] Kolbe H. and Müller K.: Potato Res. 1987, 29, 333–334.
ZAWARTOŒÆ AZOTANÓW (V) W BULWACH ZIEMNIAKA
W WARUNKACH STOSOWANIA INSEKTYCYDÓW NOWEJ GENERACJI
Katedra Szczegó³owej Uprawy Roœlin
Akademia Podlaska w Siedlcach
Abstrakt: Badania przeprowadzono na podstawie doœwiadczenia polowego za³o¿onego na glebie kompleksu
¿ytniego bardzo dobrego. Doœwiadczenie za³o¿ono metod¹ losowanych podbloków w trzech powtórzeniach.
Czynnikami eksperymentu by³y trzy odmiany ziemniaka jadalnego (Wiking, Mors, ¯agiel), szeœæ sposobów
zwalczania stonki ziemniaczanej z udzia³em insektycydów (Actara 25 WG w dawce 80 g/ha, Regent 200 SC
w dawce 0,1 dm3/ha, Calypso 480 SC w dawkach 0,05; 0,075 i 0,1dm
3/ha) i obiekt kontrolny bez ochrony
chemicznej. Zawartoœæ azotanów(V) w bulwach ziemniaka oznaczono za pomoc¹ jonoselektywnej elektrody
azotanowej oraz chlorosrebrowej elektrody odniesienia. Zawartoœæ azotanów(V) zale¿a³a od uprawianych
odmian i warunków pogodowych w okresie wegetacji. Bulwy odmiany Mors cechowa³y siê najwiêksz¹
zawartoœci¹ azotanów(V) – œrednio 168,2 mg/kg.
S³owa kluczowe: ziemniak, azotany(V), insektycydy, stonka ziemniaczana
Content of Nitrates(V) in Potato Tubers... 931

Pawe³ HARASIM1
and Tadeusz FILIPEK1
NITROGEN CONTENT AND AMINO-ACID PROTEIN
COMPOSITION OF GRAIN OF RAPE FOLIAR
FERTILIZED WITH UREA AND MICROELEMENTS
ZAWARTOŒÆ AZOTU I SK£AD AMINOKWASOWY BIA£KA
NASION RZEPAKU JAREGO DOKARMIANEGO DOLISTNIE
MOCZNIKIEM I MIKROELEMENTAMI
Abstract: The field experiment was carried out over 2003–2005 on the lessive soil (Haplic Luvisols),
defective wheat complex, with a randomized block method in four random replications. The soil was
characterised with an acid reaction (pHKCl – 5.3) and a natural content of trace elements (characteristic for the
geochemical background). Licosmos “00” spring variety of rape was used as a test crop. The aim of this study
was to determine the effect of feeding urea and foliar nickel chelate EDTA-Ni(II) and Plonvit R on the content
of total nitrogen and amino acid composition of spring rape seeds. Nickel chelate influenced an increase in the
amount of amino acids in the seeds, but reduced the amount of protein.
Keywords: nitrogen, amino acids, rape, foliar application, urea, microelements
In the intensive agricultural production, foliar fertilization is one of the essential
technology of plants cultivation [1–3]. This form of fertilization concerns mainly the
microelements (Zn, Cu, Mn, Fe, B, Mo, and relatively recently nickel – Ni), and
sometimes also macroelements, especially nitrogen and magnesium. Oilseed rape
(Brassica napus oleifera) is an important crop for oil production and feed because of its
high fat content (40–50 %) and protein (20–30 %) content in seed [4]. The nutritional
value of each protein is determined by the amino acid composition, in particular by the
number of necessary amino acids [5]. A shortage of even one essential amino acid in the
diet, immediately affects the body as a negative balance of nitric eg total excreted
nitrogen exceeds the amount of nitrogen intaken. This indicates that the tissue protein is
degraded and is used to provide the missing amino acid for these proteins on
a “high-priority” that must be continuously synthesized [6]. The oil seed-meal, because
of its high protein content and its well-balanced composition of amino acids, may be
E C O L O G I C A L C H E M I S T R Y A N D E N G I N E E R I N G A
Vol. 16, No. 8 2009
1Departament of Agricultural and Environmental Chemistry, University of Life Sciences in Lublin,
ul. Akademicka 15, 20–950 Lublin, Poland, phone 81 445 60 27, email: [email protected]
used as a substitute for soybean pellets after extraction for farm animals, and contains
more sulphur amino acids (methionine and cystine), but slightly less lysine [7, 8].
Lysine in rapeseed pellets have to be especially protected with the highest seed
processing technology [9]. In 1991, nickel next to Fe, Mn, Cl, B, Zn, Cu, Co and Mo
was included into microelements [10]. Research shows that plants fed with urea with no
nickel access, can accumulate large amounts of urea due to reduced urease activity [11].
The addition of nickel increases the activity of urease located in leaves and prevents the
accumulation of urea [12, 13].
The aim of this study was to determine the influence of foliar feeding with urea and
nickel chelate EDTA-Ni(II) and Plonvit R for the total nitrogen content and endogenous
amino acid composition of spring rape seeds.
Materials and methods
The field experiment was carried out over 2003–2005 on the lessive soil (Haplic
Luvisols), defective wheat complex, with a randomized block method in four random
replications. Size of plots: 6 × 5 m = 30 m2
gross, including 5.2 × 3 m = 15.6 m2
to
harvest.
The soil was characterised with an acid reaction (pHKCl – 5.3) and a natural content
of trace elements (characteristic for the geochemical background). Licosmos “00”
spring variety of rape was used as a test crop. The following fertilization per one hectare
was used: soil application per 1 ha: pre-sowing, 75 kg N in ammonium nitrate (solid
form), 40 kg P in the form of triple superphosphate and 140 kg K in the form of
potassium salt; 60 kg N in the form of CO(NH2)2 (3 × 20 kg) according to the
experiment scheme (foliar application). Times of foliar feeding: (stage of development
of the crop according to BBA): I. Steam elongation (KD 33); II. inflorescence
emergence (KD 55); III. after flowering (KD 71).
Experimental objects:
1. urea (3 × 20 kg N � ha–1
) soil application in solid form + MgSO4 � H2O + water
(spray 3×);
2. urea (3 × 20 kg N � ha–1
) in a solution + MgSO4 � H2O;
3. urea (3 × 20 kg N � ha–1
) in a solution + chelate nickel + MgSO4 � H2O;
4. urea (3 × 19.9 kg N � ha–1
) in a solution + Plonvit R + MgSO4 � H2O;
5. urea (3 × 19.9 kg N � ha–1
) in a solution + Plonvit R + chelate nickel +
+ MgSO4 � H2O.
The concentration of urea solution used in all phases of plant development was 12 %.
Magnesium sulphate was used only in the spring period (3 % solution of magnesium
sulphate monohydrate). Plonvit R was used in quantities of 2 × dm3
ha–1
, and the Ni
chelate 2 × dm3
ha–1
(5 g Ni × 1 dm–3
). The content of elements [g � kg–1
] in Plonvit R
was as follows:
N Mg S Mn Fe Zn Cu B Ti Mo Na
100 18 16 5 5 6 1 5 0.3 0.05 10
934 Pawe³ Harasim and Tadeusz Filipek
Plant protection products Butisan Star 415 SC (metazachlor 333 g/dm3, chinomerak
83 g/dm3), Decis 2,5 EC (deltametryna 2.5 %), Owadofos 540 EC (fenitrotion 540
g/dm3), Karate Zeon 050 CS (lambda-cyhalotryna 50 g/dm
3) were used.
The weather conditions in the years of experiments were variable. The rainfalls were
quite diverse, and the air temperature in both years was similar to average from
perennial. The spring (except from May) and the first half of the summer year 2004 was
characterized by higher precipitation than perennial average. The emergence of rape
was good, plant development in this conditions was proper. High rainfalls which
occurred in July made the vegetative period longer and has the beneficial effect on rape.
In April of 2005 high precipitation deficiencies took place, and the second decade of
this month was cold with ground freeze up to –8oC occurred. The emergence of rape
was irregular. Higher rainfalls took place in May but due to periodical cold the
vegetation was not getting better as expected. However, June was quite hot with heavy
rains which made the harvest delayed.
The rape seed was harvested 26.08.2004 and 20.08.2005. In the rape seeds were
determined the total protein content with Kjel-Tec Auto Plus 1030 apparatus, using its
6.25 version. Moreover, the composition and content of amino acids was measured
using an ion exchange chromatography Microtechna 339 M apparatus in the Central
Apparatus Laboratory of Life Sciences University in Lublin. The results were
statistically analysed with variance analysis method with a level of significance
equalling 0.05. To compare the statistical significant differences the Tukey test was
used.
Results and discussion
Protein content in the seeds of rape is more diverse than the content of fat. The
amount of this component is mainly dependent on the level of fertilization as well as on
variety and weather. The higher accumulation of protein in seeds results from dry years
[14, 15]. Protein from immature seeds will be less rich in exogenous amino acids
(lysine), resulting in lower quality of pellets and pressed residues [16].
The average protein content of spring rape Licosmos variety was similar in all
objects apart of the third (Table 1), where nickel chelate was used in combination with
urea affect of the protein content reduction in seeds by 19.65 g � kg–1
in relation to
object with foliar used urea. Taking into account the fact that the object with Ni chelate,
but additionally fed with Plonvit R, there was no decrease, it can be supposed that the
plant took microelements (including nickel) in a more balanced way, and their
interaction influenced the larger protein content compared with the object where Plonvit
R was applied with urea by foliar application.
In examining the effects of different microelement fertilizers supplied by foliar
application to the plant, Palka et al [17] found that there was no significant variation in
protein content under the influence of foliar feeding. A factor that was influencing the
protein content was a variety, including the Licosmos variety, which was characterised
with the lowest at 22.41 %. The same result was reached in own studies (the average of
the experiment from two years).
Nitrogen Content and Amino-Acid Protein Composition of Grain... 935
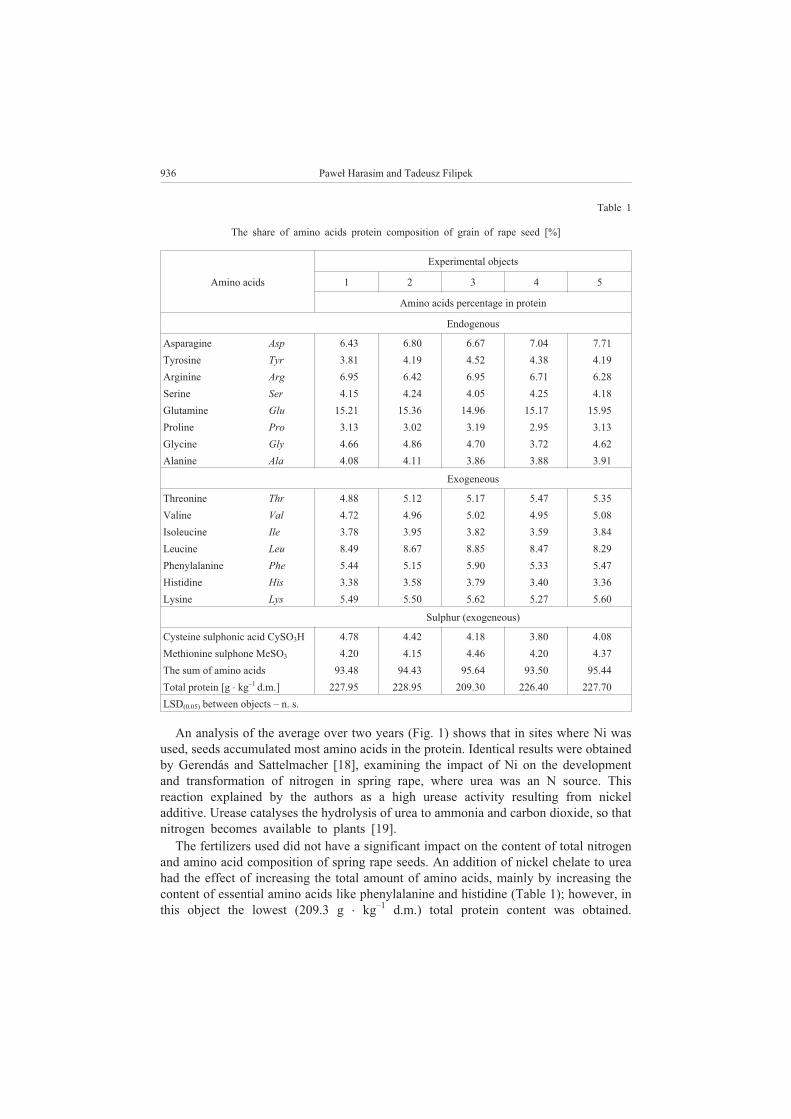
Table 1
The share of amino acids protein composition of grain of rape seed [%]
Amino acids
Experimental objects
1 2 3 4 5
Amino acids percentage in protein
Endogenous
Asparagine Asp 6.43 6.80 6.67 7.04 7.71
Tyrosine Tyr 3.81 4.19 4.52 4.38 4.19
Arginine Arg 6.95 6.42 6.95 6.71 6.28
Serine Ser 4.15 4.24 4.05 4.25 4.18
Glutamine Glu 15.21 15.36 14.96 15.17 15.95
Proline Pro 3.13 3.02 3.19 2.95 3.13
Glycine Gly 4.66 4.86 4.70 3.72 4.62
Alanine Ala 4.08 4.11 3.86 3.88 3.91
Exogeneous
Threonine Thr 4.88 5.12 5.17 5.47 5.35
Valine Val 4.72 4.96 5.02 4.95 5.08
Isoleucine Ile 3.78 3.95 3.82 3.59 3.84
Leucine Leu 8.49 8.67 8.85 8.47 8.29
Phenylalanine Phe 5.44 5.15 5.90 5.33 5.47
Histidine His 3.38 3.58 3.79 3.40 3.36
Lysine Lys 5.49 5.50 5.62 5.27 5.60
Sulphur (exogeneous)
Cysteine sulphonic acid CySO3H 4.78 4.42 4.18 3.80 4.08
Methionine sulphone MeSO3 4.20 4.15 4.46 4.20 4.37
The sum of amino acids 93.48 94.43 95.64 93.50 95.44
Total protein [g � kg–1
d.m.] 227.95 228.95 209.30 226.40 227.70
LSD(0.05) between objects – n. s.
An analysis of the average over two years (Fig. 1) shows that in sites where Ni was
used, seeds accumulated most amino acids in the protein. Identical results were obtained
by Gerendás and Sattelmacher [18], examining the impact of Ni on the development
and transformation of nitrogen in spring rape, where urea was an N source. This
reaction explained by the authors as a high urease activity resulting from nickel
additive. Urease catalyses the hydrolysis of urea to ammonia and carbon dioxide, so that
nitrogen becomes available to plants [19].
The fertilizers used did not have a significant impact on the content of total nitrogen
and amino acid composition of spring rape seeds. An addition of nickel chelate to urea
had the effect of increasing the total amount of amino acids, mainly by increasing the
content of essential amino acids like phenylalanine and histidine (Table 1); however, in
this object the lowest (209.3 g � kg–1
d.m.) total protein content was obtained.
936 Pawe³ Harasim and Tadeusz Filipek
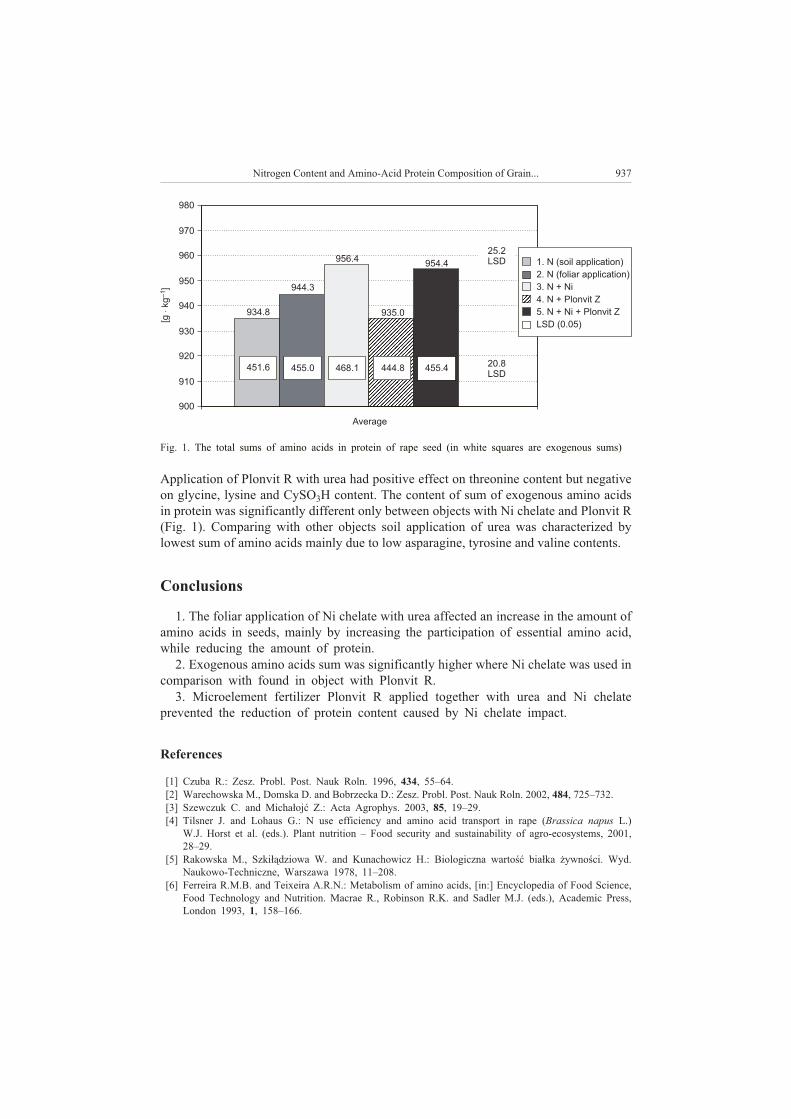
Application of Plonvit R with urea had positive effect on threonine content but negative
on glycine, lysine and CySO3H content. The content of sum of exogenous amino acids
in protein was significantly different only between objects with Ni chelate and Plonvit R
(Fig. 1). Comparing with other objects soil application of urea was characterized by
lowest sum of amino acids mainly due to low asparagine, tyrosine and valine contents.
Conclusions
1. The foliar application of Ni chelate with urea affected an increase in the amount of
amino acids in seeds, mainly by increasing the participation of essential amino acid,
while reducing the amount of protein.
2. Exogenous amino acids sum was significantly higher where Ni chelate was used in
comparison with found in object with Plonvit R.
3. Microelement fertilizer Plonvit R applied together with urea and Ni chelate
prevented the reduction of protein content caused by Ni chelate impact.
References
[1] Czuba R.: Zesz. Probl. Post. Nauk Roln. 1996, 434, 55–64.
[2] Warechowska M., Domska D. and Bobrzecka D.: Zesz. Probl. Post. Nauk Roln. 2002, 484, 725–732.
[3] Szewczuk C. and Micha³ojæ Z.: Acta Agrophys. 2003, 85, 19–29.
[4] Tilsner J. and Lohaus G.: N use efficiency and amino acid transport in rape (Brassica napus L.)
W.J. Horst et al. (eds.). Plant nutrition – Food security and sustainability of agro-ecosystems, 2001,
28–29.
[5] Rakowska M., Szki³¹dziowa W. and Kunachowicz H.: Biologiczna wartoœæ bia³ka ¿ywnoœci. Wyd.
Naukowo-Techniczne, Warszawa 1978, 11–208.
[6] Ferreira R.M.B. and Teixeira A.R.N.: Metabolism of amino acids, [in:] Encyclopedia of Food Science,
Food Technology and Nutrition. Macrae R., Robinson R.K. and Sadler M.J. (eds.), Academic Press,
London 1993, 1, 158–166.
Nitrogen Content and Amino-Acid Protein Composition of Grain... 937
980
970
960
950
940
930
920
910
900
[gkg
]�
–1
Average
1. N (soil application)
2. N (foliar application)
3. N + Ni
4. N + Plonvit Z
5. N + Ni + Plonvit Z
LSD (0.05)
451.6
934.8
455.0
944.3
468.1
956.4
444.8
935.0
455.4
954.4
20.8
LSD
25.2
LSD
Fig. 1. The total sums of amino acids in protein of rape seed (in white squares are exogenous sums)
[7] Tys J., Piekarski W., Jackowska I., Kaczor A., Zaj¹c G. and Starobrat P.: Acta Agrophys. 2003, 99,
1–153.
[8] Bell J.M.: J. Animal. Sci. 1984, 58, 996–1010.
[9] Bartkowiak-Broda I., Wa³kowski T. and Ogrodowczyk M.: Pamiêt. Pu³aw. 2005, 139, 7–25.
[10] Mahler R.L.: USDA Forest Service Proc. 2004, RMRS-P-33, 26–29.
[11] Gerendás J., Zhu Z. and Sattelmacher B.: J. Exp. Bot. 1998, 326(49), 1545–1554.
[12] Shimada N., Ando T., Tomiyama M. and Kaku H.: Jap. J. Soil Sci. Plant Nutr. 1980, 51, 493–496.
[13] Tan X.W., Ikeda H. and Oda M.: Sci. Hortcult. 2000, 84, 265–273.
[14] Kotecki A., Kozak M. and Malarz W.: Roœl. Oleis. 2004, 25, 97–107.
[15] Muœnicki C., Tobo³a P. and Muœnicki B.: Roœl. Oleis. 1999, 20(2), 457–469.
[16] Tys J. and Rybacki R.: Acta Agrophys. 2001, 44, 1–75.
[17] Pa³ka M., Bobrecka-Jamro D. and Jarecki W.: Acta Agrophys. 2003, 85, 277–287.
[18] Gerendás J. and Sattelmacher B.: Ann. Bot. 1999, 83, 65–71.
[19] Sirko A. and Brodzik R.: Acta Biochem. Polon. 2000, 47(4), 1189–1195.
ZAWARTOŒÆ AZOTU I SK£AD AMINOKWASOWY BIA£KA NASION RZEPAKU JAREGO
DOKARMIANEGO DOLISTNIE MOCZNIKIEM I MIKROELEMENTAMI
Katedra Chemii Rolnej i Œrodowiskowej
Uniwersytet Przyrodniczy w Lublinie
Abstrakt: Doœwiadczenie polowe przeprowadzono w latach 2003–2005 na glebie p³owej (Haplic Luvisols),
kompleks pszenny wadliwy, metod¹ bloków losowych w 4 powtórzeniach. Gleba mia³a odczyn kwaœny
(pHKCl – 5,3) i naturaln¹ (charakterystyczn¹ dla t³a geochemicznego) zawartoœæ pierwiastków œladowych.
Roœlin¹ testow¹ by³ rzepak jary odmiana “00” – Licosmos. Celem badañ by³o okreœlenie wp³ywu dokarmiania
dolistnego mocznikiem oraz chelatem niklu EDTA-Ni(II) i Plonvitem R na zawartoœæ azotu ogó³em i sk³ad
aminokwasowy nasion rzepaku jarego. Chelat niklu wp³ywa³ na zwiêkszenie sumy aminokwasów w na-
sionach, ale redukowa³ iloœæ bia³ka.
S³owa kluczowe: azot, aminokwasy, rzepak jary, dokarmianie dolistnie, mocznik, mikroelementy
938 Pawe³ Harasim and Tadeusz Filipek
Andrzej JAGUŒ1
INFLUENCE OF REED-BED TREATMENT PLANT
ON THE ENVIRONMENT PROTECTION
FROM NITROGEN CONTAMINATION
SKUTECZNOŒÆ TRZCINOWEJ OCZYSZCZALNI ŒCIEKÓW
W OCHRONIE ŒRODOWISKA
PRZED ZANIECZYSZCZENIEM ZWI¥ZKAMI AZOTU
Abstract: The paper presents efficiency of removal of nitrogen compounds in the reed-bed treatment plant in
Inwald (southern Poland) and the influence of discharge of purified sewage on the water quality of the
receiving watercourse (the Stawki stream). The research was carried out between 1998 and 2007. Average
yearly loads of nitrogen entering the treatment plant with raw sewage were: 650 kg Norg, 2156 kg N-NH4, 2.2
kg N-NO2 and 74 kg N-NO3. In purified sewage at the outflow, in turn, the amounts were: 234 kg Norg, 1867
kg N-NH4, 5.8 kg N-NO2 and 84 kg N-NO3. Organic nitrogen compounds were broken down efficiently in the
treatment plant, which was expressed by an average reduction of the Norg load in the inflow-outflow relation at
58 %. At the same time, absorption of ammonium compounds was inefficient – reduction of N-NH4 load was
below 20 % on average. The treatment plant showed practically no capabilities of absorption of nitrates(III
and V). Average concentrations of N-NH4 in the water of the Stawki stream were 0.25 mg/dm3
above the
point of discharge from the treatment plant, and 1.42 mg/dm3
below. Average concentrations of N-NO3 were
2.42 mg/dm3
above the discharge point, and 2.52 mg/dm3
below. Discharge of purified sewage caused
contamination of the receiving stream with ammonia. The results of the research show the need to reduce the
load of sewage coming to the treatment plant or improve the treatment technology.
Keywords: rural areas, reed-bed treatment plant, nutrients, nitrogen, quality of water
Hydrophyte sewage treatment technology has been in the point of interest in many
regions of Poland since the early 1990s, mainly due to its relatively low costs of
treatment plant construction and almost manless operation throughout the year.
Sanitation systems comprising hydrophyte treatment plants are mainly operated in rural
areas, both in individual households and in the form of sewage collectors. A wider use
of the technology is restricted by the need of a definite size of hydrobotanic beds, at
about 2–5 m2
per 1 equivalent person (E.P.). With poorly developed sewerage of rural
E C O L O G I C A L C H E M I S T R Y A N D E N G I N E E R I N G A
Vol. 16, No. 8 2009
1Institute of Environmental Protection and Engineering, University of Bielsko-Bia³a, ul. Willowa 2,
43–309 Bielsko-Bia³a, Poland, phone 33 827 91 87, email: [email protected]
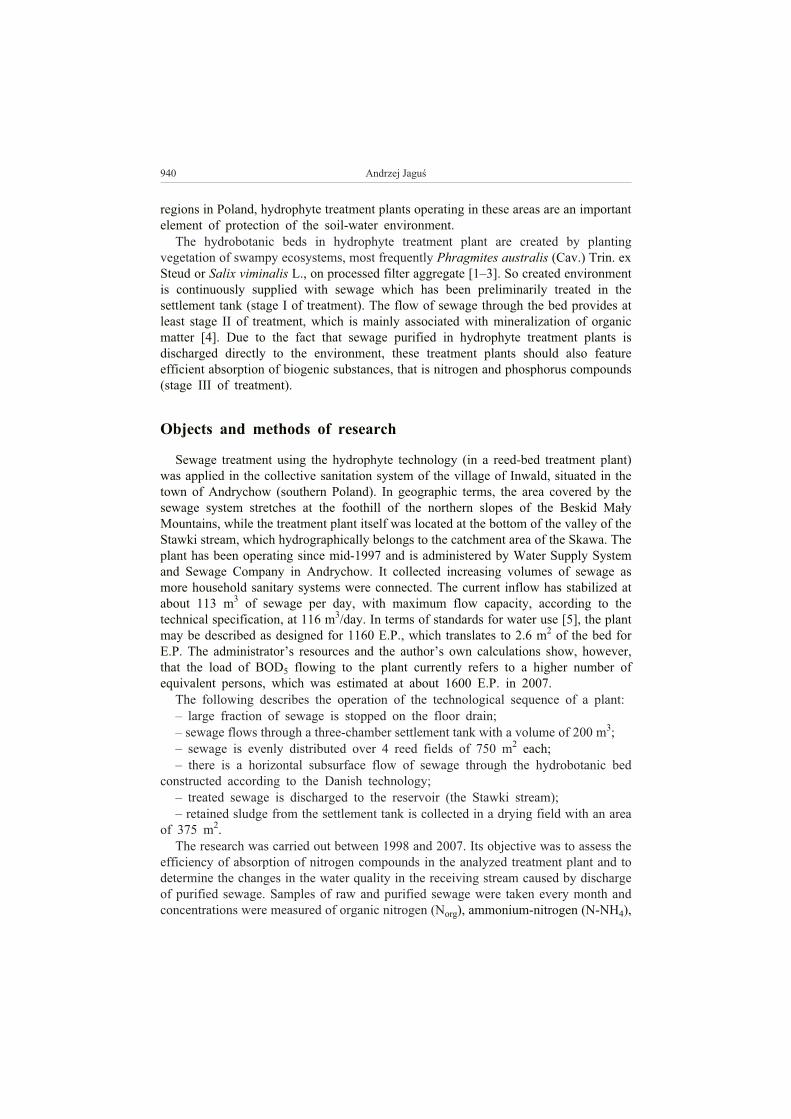
regions in Poland, hydrophyte treatment plants operating in these areas are an important
element of protection of the soil-water environment.
The hydrobotanic beds in hydrophyte treatment plant are created by planting
vegetation of swampy ecosystems, most frequently Phragmites australis (Cav.) Trin. ex
Steud or Salix viminalis L., on processed filter aggregate [1–3]. So created environment
is continuously supplied with sewage which has been preliminarily treated in the
settlement tank (stage I of treatment). The flow of sewage through the bed provides at
least stage II of treatment, which is mainly associated with mineralization of organic
matter [4]. Due to the fact that sewage purified in hydrophyte treatment plants is
discharged directly to the environment, these treatment plants should also feature
efficient absorption of biogenic substances, that is nitrogen and phosphorus compounds
(stage III of treatment).
Objects and methods of research
Sewage treatment using the hydrophyte technology (in a reed-bed treatment plant)
was applied in the collective sanitation system of the village of Inwald, situated in the
town of Andrychow (southern Poland). In geographic terms, the area covered by the
sewage system stretches at the foothill of the northern slopes of the Beskid Ma³y
Mountains, while the treatment plant itself was located at the bottom of the valley of the
Stawki stream, which hydrographically belongs to the catchment area of the Skawa. The
plant has been operating since mid-1997 and is administered by Water Supply System
and Sewage Company in Andrychow. It collected increasing volumes of sewage as
more household sanitary systems were connected. The current inflow has stabilized at
about 113 m3
of sewage per day, with maximum flow capacity, according to the
technical specification, at 116 m3/day. In terms of standards for water use [5], the plant
may be described as designed for 1160 E.P., which translates to 2.6 m2
of the bed for
E.P. The administrator’s resources and the author’s own calculations show, however,
that the load of BOD5 flowing to the plant currently refers to a higher number of
equivalent persons, which was estimated at about 1600 E.P. in 2007.
The following describes the operation of the technological sequence of a plant:
– large fraction of sewage is stopped on the floor drain;
– sewage flows through a three-chamber settlement tank with a volume of 200 m3;
– sewage is evenly distributed over 4 reed fields of 750 m2
each;
– there is a horizontal subsurface flow of sewage through the hydrobotanic bed
constructed according to the Danish technology;
– treated sewage is discharged to the reservoir (the Stawki stream);
– retained sludge from the settlement tank is collected in a drying field with an area
of 375 m2.
The research was carried out between 1998 and 2007. Its objective was to assess the
efficiency of absorption of nitrogen compounds in the analyzed treatment plant and to
determine the changes in the water quality in the receiving stream caused by discharge
of purified sewage. Samples of raw and purified sewage were taken every month and
concentrations were measured of organic nitrogen (Norg), ammonium-nitrogen (N-NH4),
940 Andrzej Jaguœ
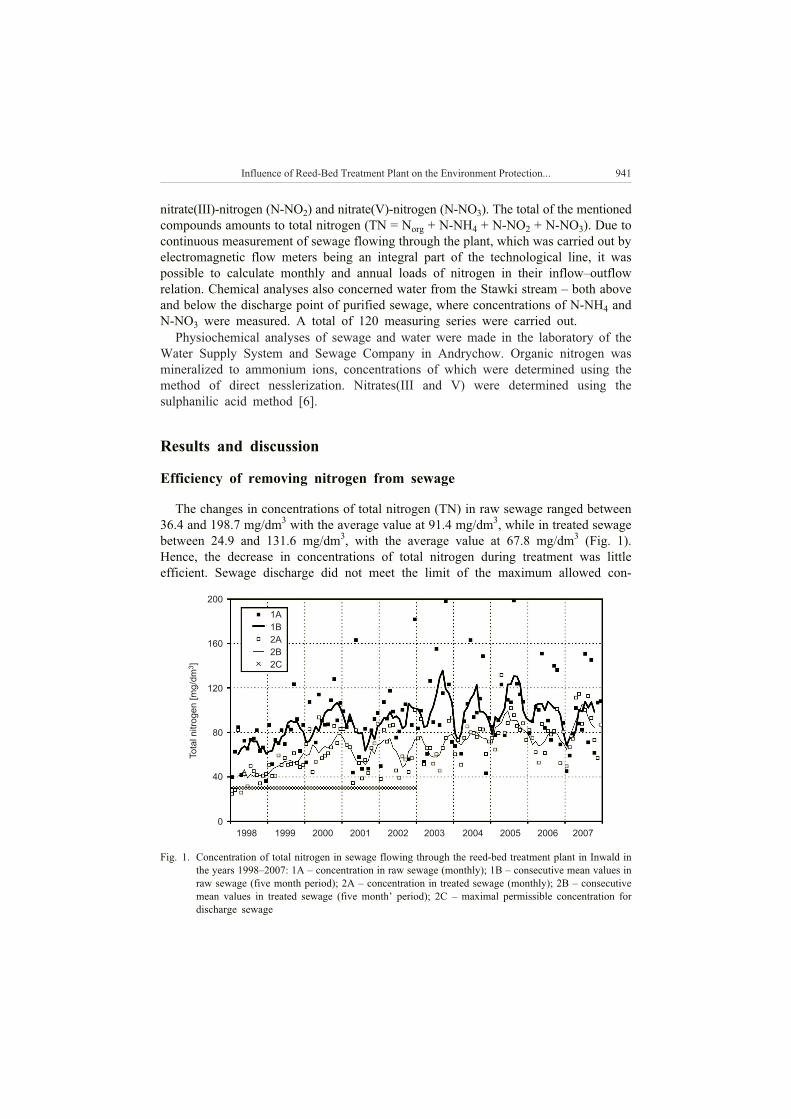
nitrate(III)-nitrogen (N-NO2) and nitrate(V)-nitrogen (N-NO3). The total of the mentioned
compounds amounts to total nitrogen (TN = Norg + N-NH4 + N-NO2 + N-NO3). Due to
continuous measurement of sewage flowing through the plant, which was carried out by
electromagnetic flow meters being an integral part of the technological line, it was
possible to calculate monthly and annual loads of nitrogen in their inflow–outflow
relation. Chemical analyses also concerned water from the Stawki stream – both above
and below the discharge point of purified sewage, where concentrations of N-NH4 and
N-NO3 were measured. A total of 120 measuring series were carried out.
Physiochemical analyses of sewage and water were made in the laboratory of the
Water Supply System and Sewage Company in Andrychow. Organic nitrogen was
mineralized to ammonium ions, concentrations of which were determined using the
method of direct nesslerization. Nitrates(III and V) were determined using the
sulphanilic acid method [6].
Results and discussion
Efficiency of removing nitrogen from sewage
The changes in concentrations of total nitrogen (TN) in raw sewage ranged between
36.4 and 198.7 mg/dm3
with the average value at 91.4 mg/dm3, while in treated sewage
between 24.9 and 131.6 mg/dm3, with the average value at 67.8 mg/dm
3(Fig. 1).
Hence, the decrease in concentrations of total nitrogen during treatment was little
efficient. Sewage discharge did not meet the limit of the maximum allowed con-
Influence of Reed-Bed Treatment Plant on the Environment Protection... 941
Fig. 1. Concentration of total nitrogen in sewage flowing through the reed-bed treatment plant in Inwald in
the years 1998–2007: 1A – concentration in raw sewage (monthly); 1B – consecutive mean values in
raw sewage (five month period); 2A – concentration in treated sewage (monthly); 2B – consecutive
mean values in treated sewage (five month’ period); 2C – maximal permissible concentration for
discharge sewage
1A
1B
2A
2B
2C
200
160
120
80
40
0
Tota
lnitro
gen
[mg/d
m]
3
1998 1999 2000 2001 2002 2003 2004 2005 2006 2007
centration of 30 mg/dm3
TN, which was in force until December 31, 2002 (Fig. 1). In
next years, no limits were, or have been until the present, established for concentrations
of total nitrogen in treatment plants with less than 2,000 E.P. discharging sewage to
running waters. It is worth mentioning that the variability of total nitrogen con-
centrations in treated sewage was characterized by an increasing tendency, with
fluctuations showing higher effectiveness in summer seasons (Fig. 1). That should be
associated with intensified process of assimilation during the vegetative season of the
reed.
Loads of nitrogen discharged with raw sewage into the treatment plant, as well as
amounts of sewage, increased in consecutive years of research. In 1998, the inflowing
load of total nitrogen was nearly 1100 kg, while in years 2005–2007 it was about 4000
kg/year. Increased loads were accompanied by a drop in efficiency of removing
nitrogen from sewage. Reduction of the total nitrogen load was low and amounted to
26 % on average. Only 6.7 % of the inflowing load was removed in the treatment
process in the last year of the research (2007). Such poor efficiency of nitrogen removal
is featured by many hydrophyte treatment plants in Poland [4, 7], especially those with
horizontal subsurface flow of sewage, as it is in Inwald. Performance of treatment plants
with vertical flow is usually higher [8, 9].
The substance that was removed from sewage most efficiently was nitrogen
contained in organic compounds (Table 1).
Table 1
Nitrogen removal effectiveness in the reed-bed treatment plant in Inwald – annual loads of nitrogen
in raw sewage (inflow) and in treated sewage (outflow)
Year
Organic nitrogen
Norg
Ammonium-nitrogen
N-NH4
Nitrate(III)-nitrogen
N-NO2
Nitrate(V)-nitrogen
N-NO3
inflow
load
[kg]
outflow
load
[%]*
inflow
load
[kg]
outflow
load
[%]*
inflow
load
[kg]
outflow
load
[%]*
inflow
load
[kg]
outflow
load
[%]*
1998 150 64.1 904 63.6 1.31 32.1 37.1 70.5
1999 173 54.9 1123 66.2 0.58 127.6 36.0 63.0
2000 266 58.1 1735 79.8 1.73 112.7 54.3 108.2
2001 313 36.5 1768 80.3 2.25 160.0 54.5 163.3
2002 650 26.4 2126 73.3 0.43 1051.2 57.2 226.2
2003 679 37.5 2641 72.1 1.29 327.1 81.9 129.9
2004 922 33.7 2685 90.6 4.25 197.9 110.1 107.0
2005 1124 38.6 3127 95.1 1.96 611.7 107.8 101.5
2006 1410 22.5 2590 101.9 2.41 473.0 98.2 97.1
2007 814 48.8 2863 106.2 5.54 187.5 107.8 82.2
* Inflow load value [kg] = 100%.
The average yearly reduction of the Norg load was 58 %. Only in the initial stage of
operation of the treatment plant (1998–2000) was it noticeably lower – at about
35–45 %. Analyses of monthly loads showed that only in few cases was the load of Norg
discharged into the receiving stream higher than that inflowing with raw sewage. This
942 Andrzej Jaguœ
occurred in winter seasons, among other factors, the reason was the increased volume of
organic matter coming from decayed vegetation. In spite of that, that fact is hydrophyte
treatment plants are efficient in mineralization of organic master, which is determined by
a significant decrease in BOD5 and COD in sewage in the process of purification [4, 10].
Removal of ammonium-nitrogen from sewage was very poor in the treatment plant
(Table 1). The average reduction of N-NH4 load in the inflow–outflow relation was at
18 % and was decreasing during the research period. The treatment plant did not reduce
the load of ammonium-nitrogen in years 2006–2007. The situation was even worse
concerning nitrate(III)-nitrogen. The loads of N-NO2 that left the plant were higher than
those inflowing (Table 1). These results prove very poor intensity of the nitrification
process and, indirectly, possibly low oxygenation of the hydrobotanic bed. Insufficient
oxidation of ammonia and nitrates(III) is reported in many hydrophyte treatment plants
in Poland [4, 9].
The analyzed plant was also incapable of absorbing nitrate(V)-nitrogen from
inflowing sewage (Table 1). The loads were reduced at 30–40 % only in the initial stage
of the research (1998–1999). Generally, sewage was subject to an increased burden of
nitrate(V)-nitrogen coming among others from nitrification. Hence, not only the process
of nitrification was little efficient in the treatment plant. That was also the case of the
process of denitrification, that is reduction of nitrates(V) to N2O and N2. It was no
sooner than the last year of research that the load of nitrate-nitrogen was reduced to
82.2 % of the inflowing load (the reduction rate was at 17.8 %).
Contamination of the receiving stream
The receiving watercourse for sewage purified in the Inwald treatment plant is the
Stawki stream – discharge takes place at the outlet section. The catchment area of the
stream is typically agricultural. According to the information from the technical-legal
documentation of the treatment plant [11], contamination of water in the Stawki stream
with organic substances improved as the result of connecting about 30 % buildings in
the catchment area to the sewerage system. It should be assumed, however, that
discharge of purified sewage influences the water quality in the stream below the
treatment plant.
The average low flow in the stream above the sewage discharge zone is estimated at
1898 m3/day [11], whereas the amount of discharged sewage did not exceed 113 m
3/day
during the research. In years 1998–2007, the average yearly amount of nitrogen
inflowing with purified sewage to the stream was: 234 kg Norg, 1867 kg N-NH4, 5.8 kg
N-NO2 and 84 kg N-NO3. These amounts were inflowing as a solution which contained,
on average, 7.18 mg/dm3
Norg, 57.7 mg/dm3
N-NH4, 0.16 mg/dm3
N-NO2 and 2.7
mg/dm3
N-NO3.
During the research, concentrations of ammonium-nitrogen (N-NH4) in the Stawki
stream above the sewage discharge point ranges from 0.02 to 2.28 mg/dm3
and was 0.25
mg/dm3
on average. In most measurements, concentrations were typical of clean waters
[12]. In consecutive years, average yearly concentrations ranged between 0.15 and 0.54
mg/dm3
(Fig. 2). As the result of inflow of purified sewage, where the concentration of
Influence of Reed-Bed Treatment Plant on the Environment Protection... 943
N-NH4 ranged between 19.7–113.0 mg/dm3, the concentration of ammonium-nitrogen
in the water of the stream increased noticeably. The concentration measured in water
below the sewage discharge point was 0.04–9.8 mg/dm3, and average yearly values
were between 0.4 and 3.4 mg/dm3
(Fig. 2). Hence, these were often contaminated
waters [12].
The amounts of nitrate-nitrogen (N-NO3) in waters of the Stawki stream above the
plant ranged between 0.1 and 8.5 mg/dm3
(average 2.4 mg/dm3). Periodically, the
concentrations were very high, which results from agricultural activities in the
catchment. Average yearly concentrations were between 1.7 and 3.8 mg/dm3
(Fig. 2).
Sewage discharge had little effect on changes in the water quality of the stream, as
concentrations of N-NO3 were not significantly higher (0.5–11.8 mg/dm3) in purified
sewage than those in water of the stream. Below the discharge point, water of the stream
averagely contained 2.5 mg/dm3
of N-NO3 – measurements showed results ranging
between 0.6 and 7.8 mg/dm3, and average yearly values were between 2.1 and 4.7
mg/dm3
(Fig. 2). Occasionally, concentrations of N-NO3 in water were lower after
collecting purified sewage. The reported concentrations of nitrate-nitrogen in water of
the Stawki stream often suggested its eutrophication. Running waters are regarded as
eutrophicated if the average yearly concentration of N-NO3 exceeds 2.2 mg/dm3
[13].
Conclusions
The studies carried out in years 1998–2007 show that the reed-bed treatment plant in
Inwald with horizontal subsurface flow of sewage through the hydrobotanic bed was
944 Andrzej Jaguœ
Fig. 2. Average annual ammonium- and nitrate(V)-nitrogen concentration in Stawki stream – above and
below discharge point from reed-bed treatment plant in Inwald
1998 1999 2000 2001 2002 2003 2004 2005 2006 2007
Am
moniu
m-n
itro
gen
[mg/d
m]
3N
itrate
-nitro
gen
[mg/d
m]
3
5.0 5.0
4.5 4.5
4.0 4.0
3.5 3.5
3.0 3.0
2.5 2.5
2.0 2.0
1.5 1.5
1.0 1.0
0.5 0.5
0.0 0.0
N-NH (above discharge)4
N-NH (below discharge)
N-NO (above discharge)
N-NO (below discharge)
4
3
3
little efficient in terms of environmental protection from contamination with nitrogen
compounds. Only organic nitrogen compounds were efficiently removed from sewage.
Nitrification was not very intense, so the reduction rate of the load of ammonium-
-nitrogen in sewage was low, and in case of nitrate(III)-nitrogen, an increase of its load
in sewage was observed in the process of purification. The plant was also incapable of
removing nitrate(V)-nitrogen – assimilation by vegetation and denitrification did not
result in a decreased load of N-NO3 in purified sewage. As the result, discharge of
purified sewage had a negative impact on the water quality of the receiving stream – an
influence on contamination of water with ammonium-nitrogen was reported during the
research.
The above results show that it is necessary to decrease the load of contaminants
flowing into the plant (by reducing the volume of sewage) or improve the technological
line of the plant regarding stage III of treatment. In spite of that, the discussed treatment
plant and other objects of that type should be regarded as an important element of
protection of the rural environment, especially in areas completely lacking any
sewerage system.
References
[1] Obarska-Pempkowiak H.: Oczyszczalnie hydrofitowe, Gdañsk 2002.
[2] Scholz M. and Jing Xu: Bioresource Technol. 2002, 83, 71–79.
[3] Vymazal J.: Ecol. Eng. 2002, 18, 633–646.
[4] Sikorski M.: Gospodarka œciekami bytowymi na wsi jako czynnik ochrony œrodowiska. Falenty 1998.
[5] Rozporz¹dzenie Ministra Infrastruktury w sprawie okreœlenia przeciêtnych norm zu¿ycia wody, DzU
2002, nr 8, poz. 70.
[6] Hermanowicz W., Dojlido J., Do¿añska W., Koziorowski B. and Zerbe J.: Fizyczno-chemiczne badanie
wody i œcieków, Warszawa 1999.
[7] Biernacka E. and Obarska-Pempkowiak H.: Zesz. Nauk. Akad. Roln. we Wroc³awiu 1996, 13(1),
133–144.
[8] Kowalik P.: Wiadomoœci Melioracyjne i £¹karskie 1996, 1, 15–20.
[9] Soroko M.: Woda – Œrodowisko – Obszary Wiejskie 2001, 1(1), 173–186.
[10] Jaguœ A. and Rzêta³a M.: Regional aspects of land use, Chernivtsy–Sosnowiec 2002, 73–86.
[11] Nawieœniak T. and Waluœ E.: Operat wodno-prawny na odprowadzanie œcieków oczyszczonych z
hydrobotanicznej oczyszczalni œcieków w Inwa³dzie, Bielsko-Bia³a 2005.
[12] Dojlido J.: Chemia wód powierzchniowych, Bia³ystok 1995.
[13] Rozporz¹dzenie Ministra Œrodowiska w sprawie kryteriów wyznaczania wód wra¿liwych na zanie-
czyszczenie zwi¹zkami azotu ze Ÿróde³ rolniczych, DzU 2002, nr 241, poz. 2093.
SKUTECZNOŒÆ TRZCINOWEJ OCZYSZCZALNI ŒCIEKÓW W OCHRONIE ŒRODOWISKA
PRZED ZANIECZYSZCZENIEM ZWI¥ZKAMI AZOTU
Instytut Ochrony i In¿ynierii Œrodowiska
Akademia Techniczno-Humanistyczna w Bielsku-Bia³ej
Abstrakt: W artykule przedstawiono efektywnoœæ zatrzymywania zwi¹zków azotu w trzcinowej oczyszczalni
œcieków w Inwa³dzie (po³udniowa Polska) i jednoczeœnie wp³yw zrzutu oczyszczonych œcieków na jakoœæ
wód odbiornika (potok Stawki). Badania prowadzono w latach 1998–2007. Œrednie roczne ³adunki azotu
dop³ywaj¹ce do oczyszczalni w œciekach surowych wynosi³y: 650 kg Norg, 2156 kg N-NH4, 2,2 kg N-NO2 i 74
kg N-NO3. W œciekach oczyszczonych œredniorocznie odp³ywa³o natomiast: 234 kg Norg, 1867 kg N-NH4, 5,8
Influence of Reed-Bed Treatment Plant on the Environment Protection... 945
kg N-NO2 i 84 kg N-NO3. W oczyszczalni nastêpowa³ efektywny rozk³ad azotowych zwi¹zków organicznych,
co wyra¿a³a przeciêtna 58 % redukcja ³adunku Norg w relacji dop³yw–odp³yw. Równoczeœnie zatrzymywanie
zwi¹zków amonowych by³o ma³o skuteczne – œrednia redukcja ³adunku N-NH4 mniej ni¿ 20 %. Oczysz-
czalnia praktycznie nie wykazywa³a zdolnoœci akumulowania zwi¹zków azotanowych(III i V). Stê¿enie
N-NH4 w wodzie potoku Stawki powy¿ej miejsca zrzutu z oczyszczalni wynosi³o œrednio 0,25 mg/dm3,
a poni¿ej 1,42 mg/dm3. Z kolei œrednie stê¿enie N-NO3 powy¿ej zrzutu by³o równe 2,42 mg/dm
3, a poni¿ej
2,52 mg/dm3. Zrzut oczyszczonych œcieków powodowa³ zanieczyszczenie wód odbiornika amoniakiem.
Wyniki badañ wskazuj¹ na potrzebê zmniejszenia obci¹¿enia oczyszczalni lub udoskonalenia technologii
oczyszczania.
S³owa kluczowe: obszary wiejskie, trzcinowa oczyszczalnia œcieków, substancje biogenne, azot, jakoœæ wód
946 Andrzej Jaguœ
Jan KUCHARSKI1, Ma³gorzata BAÆMAGA
1
and Jadwiga WYSZKOWSKA1
EFFECT OF SOIL CONTAMINATION WITH HERBICIDES
ON THE NITRIFICATION PROCESS
WP£YW ZANIECZYSZCZENIA GLEBY HERBICYDAMI
NA PRZEBIEG PROCESU NITRYFIKACJI
Abstract: The objective of this study was to determine the effect of soil contamination with herbicides on the
course of the nitrification process. The experiment was carried out in nine replications, on typical brown soil
developed from loamy sand with pH 6.5, hydrolytic acidity of 8.25 mmol(+) kg–1
, total exchangeable alkaline
cations of 78 mmol(+) kg–1
and organic carbon content of 6.3 g kg–1
. The experimental variables were: type of
herbicide (Harpun 500 SC, Faworyt 300 SL, Akord 180 OF and Mocarz 75 WG), herbicide application dose
expressed as a multiple of the dose recommended by the manufacturer (0 – control, 1 – dose recommended by
the manufacturer, and doses 50, 100, 150 and 200 higher than recommended by the manufacturer), dose of
nitrogen in the form of (NH4)2SO4 (0 and 300 mg N kg–1
soil) and soil incubation time (14, 28, 42, 56 and 70
days). Soil samples weighing 50 g were incubated in a thermostat at a temperature of 25oC throughout the
experiment. Soil moisture content was maintained constant at 60 % capillary water capacity.
The study showed that the nitrification process was affected by the type and dose of the applied herbicide
as well as the time of the analysis. Lower levels of nitrified nitrogen were observed in soil contaminated with
Harpun 500 SC, Akord 180 OF and Mocarz 75 WG herbicides, while Faworyt 300 SL increased the rate of
nitrification. The inhibitory effect of the tested herbicides was significantly minimized over time.
Keywords: nitrification, soil pollution, herbicides
Herbicides are one of the main anthropogenic factors that substantially contribute to
the degradation of the soil environment. Excessive herbicide use poses an immense
environmental threat which may inhibit the growth of plants and living organisms [1–3].
By reacting with soil colonized by microbial communities, herbicides may modify
nitrogen transformation in soil [4]. Nitrification is a very important process in the
natural circulation of nitrogen [5, 6]. As the result of the above processes involving
microbes, ammonia nitrogen is oxidized to nitrate nitrogen. This process may increase
the levels of nitrogen easily available to plants and soil organisms [7, 8]. Produced by
nitrification NO3
–ions are characterized by high mobility in the soil environment, and
they may contribute to considerable nitrogen loss and environmental pollution [7,
E C O L O G I C A L C H E M I S T R Y A N D E N G I N E E R I N G A
Vol. 16, No. 8 2009
1Department of Microbiology, University of Warmia and Mazury in Olsztyn, pl. £ódzki 3, 10–727
Olsztyn, Poland, email: [email protected]
9–12]. The transformation of nitrogen compounds is determined by: soil type, soil
moisture content, soil pH, organic substance content, soil microbiological and enzymatic
activity [13, 14]. According to reference data [7, 15, 16], the nitrification process is
highly sensitive to soil pollution, and it is particularly influenced by biocides. For this
reason, nitrification rate is a good indicator of soil pollution with chemical compounds
[17, 18].
The objective of this study was to determine the effect of soil contamination with
Harpun 500 SC, Faworyt 300 SL, Akord 180 OF and Mocarz 75 WG herbicides on the
nitrification process.
Materials and methods
A laboratory experiment was performed with samples of typical brown soil with a
granulometric composition of loamy sand with pH 6.5, hydrolytic acidity of 8.25
mmol(+) kg–1
, total exchangeable alkaline cations of 78 mmol(+) kg–1
and organic
carbon content of 6.3 g kg–1
. The experimental variables were:
1) type of herbicide: Harpun 500 SC, Faworyt 300 SL, Akord 180 OF and Mocarz 75
WG;
2) herbicide application dose expressed as a multiple of the dose recommended by
the manufacturer: 0 – control, 1 – dose recommended by the manufacturer, and doses
50, 100, 150 and 200 higher than recommended by the manufacturer;
3) dose of nitrogen in the form of (NH4)2SO4 in mg N kg–1
soil: 0, 300;
4) soil incubation time in days: 14, 28, 42, 56, 70.
The applied herbicides comprised the following active substances: Harpun 500 SC –
isoproturon (urea derivative – 500 g dm–3
), Faworyt 300 SL – chlopyralid (mono-
ethanolamine salt – 300 g dm–3
), Akord 180 OF – phenmedipham, desmedipham
(phenylcarbamate group compounds – each 60 g dm–3
) and ethofumesate (benzofuran
derivative – 60 g dm–3
), Mocarz 75 WG – tritosulfuron (sulfonylurea derivative – 25 %)
and dicamba (benzoic acid derivative – 50 %).
The experiment was conducted in 9 replications. 50 g of air-dried soil was placed in
each in 100 cm3
beakers. Herbicides (variables 1 and 2) and an aqueous solution of
(NH4)2SO4 (variable 3) were added, and all components were thoroughly mixed with
soil. The moisture content of soil was brought to 60 % maximum water capacity, and
the beakers were incubated in a thermostat at a temperature of 25oC. Soil moisture
levels were monitored throughout the experiment and losses were supplemented with
distilled water. The incubation process was interrupted on different days of the
experiment (variable 4) and N-NH4
+and N-NO3
–levels were determined in the soil.
Mineral nitrogen was extracted with the use of a 1 % aqueous solution of K2SO4. The
soil to extractor ratio was 1:5. The content of N-NH4
+ions was determined with the
application of Nessler’s reagent, and N-NO3
–levels – with the use of phenoldisulfonic
acid.
In this study, only the concentrations of nitrate(V) nitrogen were determined,
as ammonia nitrogen content was inversely proportional to nitrate nitrogen levels.
The quantity of nitrified nitrogen was calculated based on the following formula [19]:
948 Jan Kucharski et al
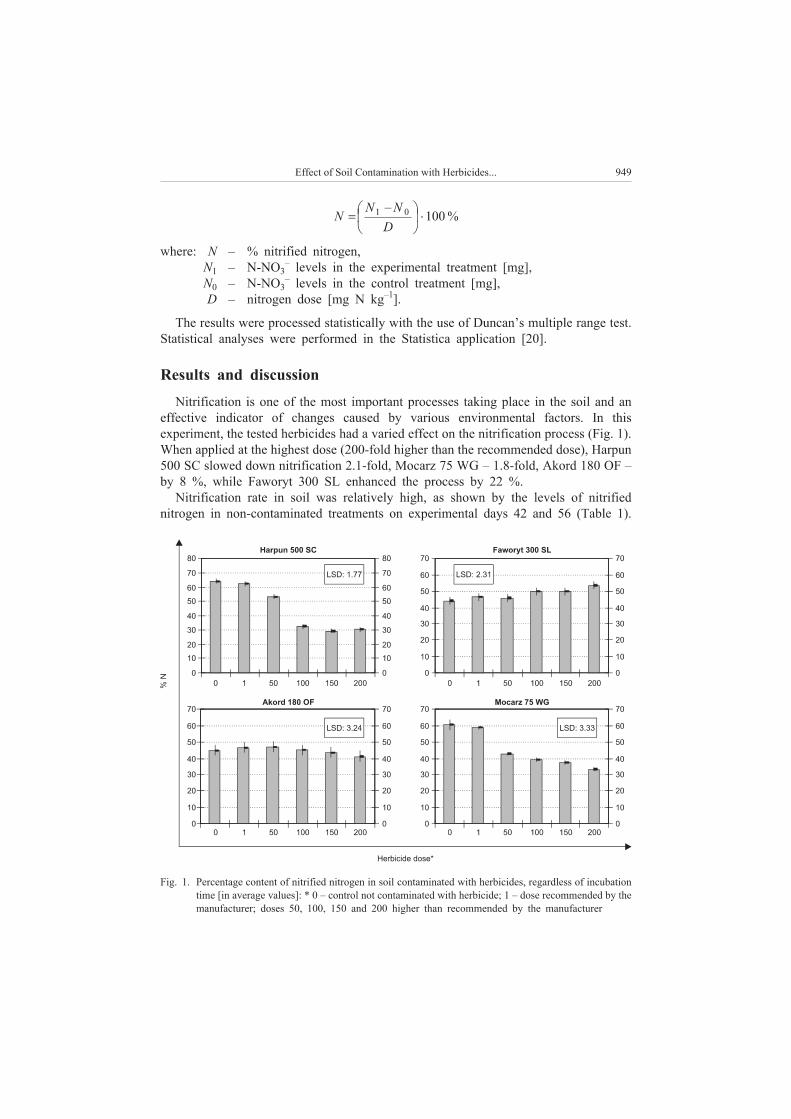
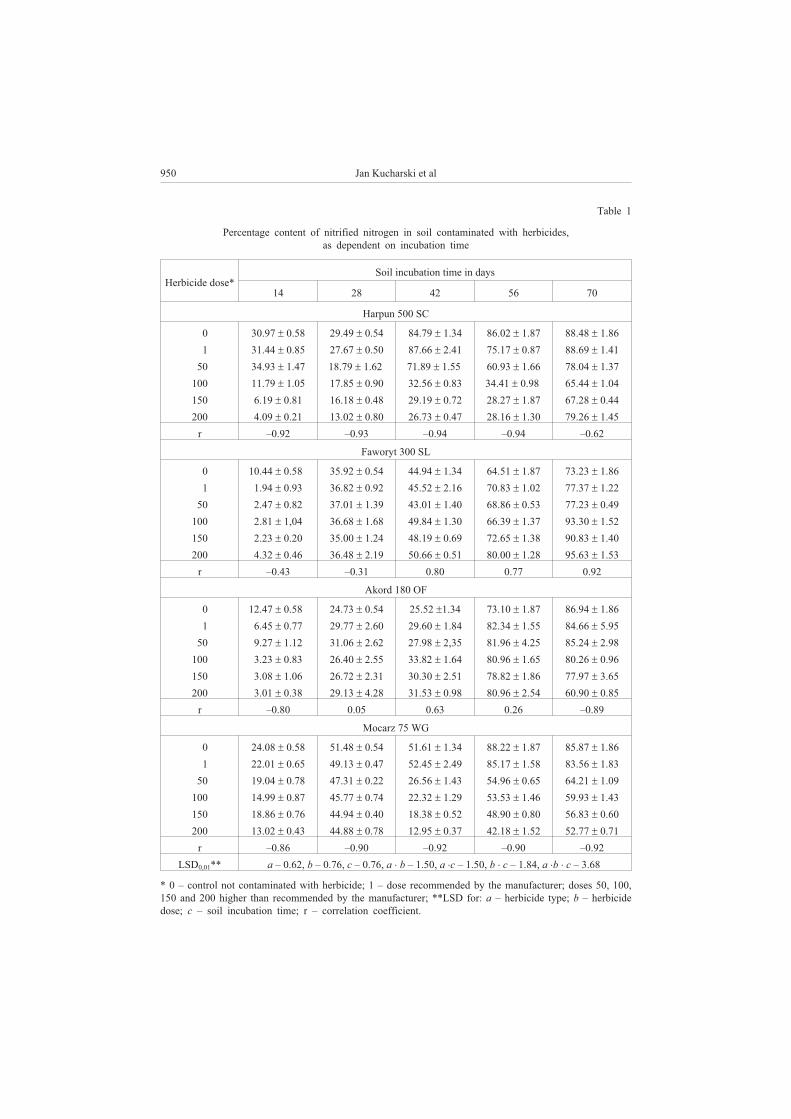
950 Jan Kucharski et al
Table 1
Percentage content of nitrified nitrogen in soil contaminated with herbicides,
as dependent on incubation time
Herbicide dose*
Soil incubation time in days
14 28 42 56 70
Harpun 500 SC
0 30.97 � 0.58 29.49 � 0.54 84.79 � 1.34 86.02 � 1.87 88.48 � 1.86
1 31.44 � 0.85 27.67 � 0.50 87.66 � 2.41 75.17 � 0.87 88.69 � 1.41
50 34.93 � 1.47 18.79 � 1.62 71.89 � 1.55 60.93 � 1.66 78.04 � 1.37
100 11.79 � 1.05 17.85 � 0.90 32.56 � 0.83 34.41 � 0.98 65.44 � 1.04
150 6.19 � 0.81 16.18 � 0.48 29.19 � 0.72 28.27 � 1.87 67.28 � 0.44
200 4.09 � 0.21 13.02 � 0.80 26.73 � 0.47 28.16 � 1.30 79.26 � 1.45
r –0.92 –0.93 –0.94 –0.94 –0.62
Faworyt 300 SL
0 10.44 � 0.58 35.92 � 0.54 44.94 � 1.34 64.51 � 1.87 73.23 � 1.86
1 1.94 � 0.93 36.82 � 0.92 45.52 � 2.16 70.83 � 1.02 77.37 � 1.22
50 2.47 � 0.82 37.01 � 1.39 43.01 � 1.40 68.86 � 0.53 77.23 � 0.49
100 2.81 � 1,04 36.68 � 1.68 49.84 � 1.30 66.39 � 1.37 93.30 � 1.52
150 2.23 � 0.20 35.00 � 1.24 48.19 � 0.69 72.65 � 1.38 90.83 � 1.40
200 4.32 � 0.46 36.48 � 2.19 50.66 � 0.51 80.00 � 1.28 95.63 � 1.53
r –0.43 –0.31 0.80 0.77 0.92
Akord 180 OF
0 12.47 � 0.58 24.73 � 0.54 25.52 �1.34 73.10 � 1.87 86.94 � 1.86
1 6.45 � 0.77 29.77 � 2.60 29.60 � 1.84 82.34 � 1.55 84.66 � 5.95
50 9.27 � 1.12 31.06 � 2.62 27.98 � 2,35 81.96 � 4.25 85.24 � 2.98
100 3.23 � 0.83 26.40 � 2.55 33.82 � 1.64 80.96 � 1.65 80.26 � 0.96
150 3.08 � 1.06 26.72 � 2.31 30.30 � 2.51 78.82 � 1.86 77.97 � 3.65
200 3.01 � 0.38 29.13 � 4.28 31.53 � 0.98 80.96 � 2.54 60.90 � 0.85
r –0.80 0.05 0.63 0.26 –0.89
Mocarz 75 WG
0 24.08 � 0.58 51.48 � 0.54 51.61 � 1.34 88.22 � 1.87 85.87 � 1.86
1 22.01 � 0.65 49.13 � 0.47 52.45 � 2.49 85.17 � 1.58 83.56 � 1.83
50 19.04 � 0.78 47.31 � 0.22 26.56 � 1.43 54.96 � 0.65 64.21 � 1.09
100 14.99 � 0.87 45.77 � 0.74 22.32 � 1.29 53.53 � 1.46 59.93 � 1.43
150 18.86 � 0.76 44.94 � 0.40 18.38 � 0.52 48.90 � 0.80 56.83 � 0.60
200 13.02 � 0.43 44.88 � 0.78 12.95 � 0.37 42.18 � 1.52 52.77 � 0.71
r –0.86 –0.90 –0.92 –0.90 –0.92
LSD0,01** a – 0.62, b – 0.76, c – 0.76, a � b – 1.50, a �c – 1.50, b � c – 1.84, a �b � c – 3.68
* 0 – control not contaminated with herbicide; 1 – dose recommended by the manufacturer; doses 50, 100,
150 and 200 higher than recommended by the manufacturer; **LSD for: a – herbicide type; b – herbicide
dose; c – soil incubation time; r – correlation coefficient.
Harpun 500 SC and Mocarz 75 WG did not have a lasting, negative effect on
nitrification because on day 14, the highest dose of Harpun 500 SC slowed down the
nitrification process nearly 8-fold, on day 70 – only 1.1-fold, while the highest dose of
Mocarz 75 WG inhibited the process 1.8-fold on day 14 and 1.6-fold on day 70. Akord
180 OF had a similar effect on the nitrification process as the above herbicides in the
first 14 days of the experiment. During that time, when applied at the highest dose,
Akord 180 OF slowed down the nitrification process 4-fold. The product’s adverse
effect on nitrification ceased on day 28, and it continued to have a stimulating effect on
the process toward the end of the experiment, except for day 70. Faworyt 300 SL had a
completely different effect as it stimulated the nitrification process throughout the entire
experiment (70 days).
Soil pollution with chemicals often disturbs the nitrification process [18, 21–24]. The
results of this experiment indicate that the application of increasing doses of Harpun
500 SC, Akord 180 OF and Mocarz 75 WG had an adverse impact on the analyzed
process. According to Kinney et al [25], soil pollution with biocides may inhibit
nitrification. The above authors studied two fungicides (mancozeb and chlorothalonil)
and one herbicide (prosulfuron) which were applied at 0.02 and 10-fold the recom-
mended dose. They observed that growing biocide doses reduced nitrification rate by
20 % to 98 %. The lowest dose inhibited the process in a range of 10–62 %. The above
is indicative of the toxic effect of herbicides on nitrifying bacteria. Different results
were reported by Stratton and Stewart [26] in whose study glyphosat did not have an
adverse effect on the nitrification process. The results of this experiment also indicate
that not all herbicides are capable of slowing down nitrification. In this study, Faworyt
300 SL did not affect the investigated process.
Conclusions
1. Soil contamination with Harpun 500 SC, Akord 180 OF, Mocarz 75 WG and
Faworyt 300 SL herbicides had a significant effect on the nitrification process. Harpun
500 SC, Akord 180 OF and Mocarz 75 WG inhibited nitrification, while Faworyt 300
SL stimulated the process.
2. The changes in the nitrification process induced by herbicides were not permanent
and they were gradually minimized towards the end of the experiment.
References
[1] Menon P., Gopol M. and Parsad R.: Agric. Ecosyst. Environ. 2005, 108, 73–83.
[2] Österreicher-Cunha P., Langenbach T., Torres J.P.M., Lima A.L.C., De Campos T.M.P., Vargas E.A.
and Wagener A.R.: Environ. Res. 2003, 93, 316–327.
[3] Sánchez M.E., Estrada I.B., Martinez O., Martin-Villacorta J., Aller A. and Morán A.: Chemosphere
2004, 57, 673–679.
[4] Kara E.E., Aril M. and Uygur v.: Biol. Fertil. Soils 2004, 39, 474–478.
[5] Drazkiewicz M.: Folia Mikrobiol. 1996, 41(1), 76–80.
[6] Zhu W. and Carreiro M.M.: Soil Biol. Biochem. 1999, 31, 1091–1100.
[7] Chao W.L., Gan K.D. and Chao C.C.: Biol. Fertil. Soils. 1993, 15, 87–90.
Effect of Soil Contamination with Herbicides... 951
[8] Sauveàa S., Dumestrea A., Mcbridea M., Gillettc J.W., Berthelinb J. and Hendershotd W.: Appl. Soil
Ecol. 1999, 12, 29–39.
[9] Barth G., Tucher S. and Schmidhalter U.: Biol. Fertil. Soils 2001, 34, 98–102.
[10] Kostov O. and Cleemput O.: Biol. Fertil. Soils 2001, 33, 10–16.
[11] Dollhopf S.L., Hyun J., Smith A.C., Adams H.J., O’Brien S. and Kostka J.E.: Amer. Soc. Microbiol.
2005, 71(1), 240–246.
[12] Subbarao G.V., Ishikawa T., Ito O., Nakahara K., Wang H.Y. and Berry W.L.: Plant Soil 2006, 288,
101–112.
[13] Castaldi S., Carfora A., Fiorentino A., Natale A., Messere A., Miglietta F. and Cotrufo M.F.: Plant Soil
2009, 315, 273–283.
[14] Qian C. and Cai Z.: Plant Soil 2007, 300, 197–205.
[15] Martens D.A. and Bremner J.M.: Biol. Fertil. Soils 1994, 17, 309–313.
[16] Pietril J.C.A. and Brookes P.C.: Soil Biol. Biochem. 2008, 40, 797–802.
[17] Barabasz W.: Post. Mikrobiol. 1992, 31(1), 3–29.
[18] Wyszkowska J., Kucharski J. and Kucharski M.: Zesz. Probl. Post. Nauk Roln. 2006, 515, 439–445.
[19] Wyszkowska J.: Wyd. UWM., Rozprawy i Monografie 2002, 65, 134 pp.
[20] Statsoft. Inc. 2006. Statistica (data analysis software), ver. 6.0. www.statsoft.com.
[21] Wyszkowska J., Kucharski M., Kucharski J. and Borowik A.: Acta Agric. Silv. ser. Agr. 2006, 49,
507–515.
[22] Barabasz W., Albiñska D., Jaskowska M. and Lipiec J.: Polish J. Environ. Stud. 2002, 11(3), 193–198.
[23] Bottomley P.J., Taylor A.E., Boyle S.A., McMahon S.K., Rich J.J., Cromack Jr. K. and Myrold D.D.:
Microb. Ecol. 2004, 48, 500–508.
[24] Brierley E.D., Wood M. and Shaw P.J.A.: Plant Soil 2001, 229, 97–104.
[25] Kinney C.A., Mandernack K.W. and Mosier A.R.: Soil Biol. Biochem. 2005, 37, 837–850.
[26] Stratton G.W. and Stawart K.E.: Water, Air Soil Pollut. 1991, 60, 231–247.
WP£YW ZANIECZYSZCZENIA GLEBY HERBICYDAMI
NA PRZEBIEG PROCESU NITRYFIKACJI
Katedra Mikrobiologii, Uniwersytet Warmiñsko-Mazurski w Olsztynie
Abstrakt: Celem badañ by³o okreœlenie wp³ywu zanieczyszczenia gleby herbicydami na przebieg procesu
nitryfikacji. Doœwiadczenie przeprowadzono w dziewiêciu powtórzeniach na glebie brunatnej w³aœciwej
wytworzonej z piasku gliniastego o pH 6,5, kwasowoœci hydrolitycznej – 8,25 mmol(+) kg–1
, sumie
zasadowych kationów wymiennych – 78 mmol(+) kg–1
, zawartoœci wêgla organicznego – 6,3 g kg–1
.
Czynnikami zmiennymi by³y: rodzaj herbicydu (Harpun 500 SC, Faworyt 300 SL, Akord 180 OF
i Mocarz 75 WG); dawki herbicydów wyra¿one jako wielokrotnoœæ dawki zalecanej przez producenta (0 –
kontrola, 1 – dawka zalecana przez producenta, dawki 50-, 100-, 150- i 200-krotnie wiêksze od zalecanej
przez producenta); dawka azotu w postaci (NH4)2SO4 (0 i 300 mg N kg–1
gleby) oraz czas inkubacji gleby (14,
28, 42, 56 i 70 dni). Przez ca³y okres trwania doœwiadczenia próbki glebowe o masie 50 g inkubowano
w termostacie w temperaturze 25oC, utrzymuj¹c sta³¹ wilgotnoœæ gleby na poziomie 60 % kapilarnej
pojemnoœci wodnej.
Z przeprowadzonych badañ wynika, ¿e proces nitryfikacji uzale¿niony by³ od rodzaju herbicydu i jego
dawki, a tak¿e od terminu wykonanych analiz. Zmniejszenie iloœci znitryfikowanego azotu odnotowano
w glebie zanieczyszczonej herbicydami: Harpun 500 SC, Akord 180 OF i Mocarz 75 WG, natomiast Faworyt
300 SL spowodowa³ zwiêkszenie tempa nitryfikacji. Wraz z up³ywem czasu trwania doœwiadczenia
inhibicyjny wp³yw testowanych preparatów istotnie ulega³ zmniejszeniu.
S³owa kluczowe: nitryfikacja, zanieczyszczenie gleby, herbicydy
952 Jan Kucharski et al
Jan KUCHARSKI1, Agnieszka WYRWA£
1,
Edyta BOROS1
and Jadwiga WYSZKOWSKA1
NITRIFICATION PROCESS AS AN INDICATOR
OF SOIL CONTAMINATION WITH HEAVY METALS
PROCES NITRYFIKACJI WSKA�NIKIEM ZANIECZYSZCZENIA GLEB
METALAMI CIʯKIMI
Abstract: The effect of soil contamination with heavy metals on the nitrification process was determined in
a laboratory experiment. The study involved samples of typical brown soil with a granulometric composition
of loamy sand, collected from the arable and humus horizon. The experiment was performed in three
replications. Soil samples were contaminated with the following amounts of nickel chloride, copper chloride
and zinc chloride: 0, 100, 300, 600 mg Me kg–1
soil. Nitrogen was supplied in the form of ammonium sulfate
at a dose of 0, 250 mg N kg–1
soil. The pollutants were thoroughly mixed with the samples, and soil moisture
content was brought to 50 % capillary water capacity. Samples were incubated in a thermostat at
a temperature of 25oC for 42 days. N-NH4
+and N-NO3
–levels in the soil were determined on experimental
days 1, 14, 28 and 42.
Soil contamination with heavy metals (Ni2+
, Cu2+
, Zn2+
) significantly reduced the rate of nitrification. On
the 42nd
day of the experiment, the tested metals inhibited nitrification by 1 % to 15 % when the administered
dose was 100 mg kg–1
soil, and by 14 % to 40 % when the pollutant dose reached 300 mg kg–1
soil. The
highest level of contamination at 600 mg kg–1
inhibited nitrification by 70 % to 72 %. The process was most
adversely affected by nickel, it was less influenced by copper, while zinc had the least effect on nitrification.
A close correlation between the nitrification process and the degree and type of soil pollution with heavy
metals renders nitrification rate a highly objective parameter in the evaluation of soil contamination.
Keywords: heavy metals, soil, nitrification, nickel, copper, zinc
When released to the natural environment, heavy metals are accumulated in the soil
and they affect its biological activity [1, 2]. The availability of nutrients for plants
is determined – mainly by microorganisms. Nitrogen-transforming microbes play
a particularly important role in this process from the agricultural point of view [3–5].
Most relevant studies focus on nitrogen mineralization activity and nitrification [6–8].
Nitrification is a process taking place in soil, water and effluents. During this process,
ammonium nitrogen (NH4
+) is oxidized to nitrate nitrogen (NO3
–) [9–11]. The micro-
E C O L O G I C A L C H E M I S T R Y A N D E N G I N E E R I N G A
Vol. 16, No. 8 2009
1Department of Microbiology, University of Warmia and Mazury in Olsztyn, pl. £ódzki 3, 10–727
Olsztyn, Poland, email: [email protected]
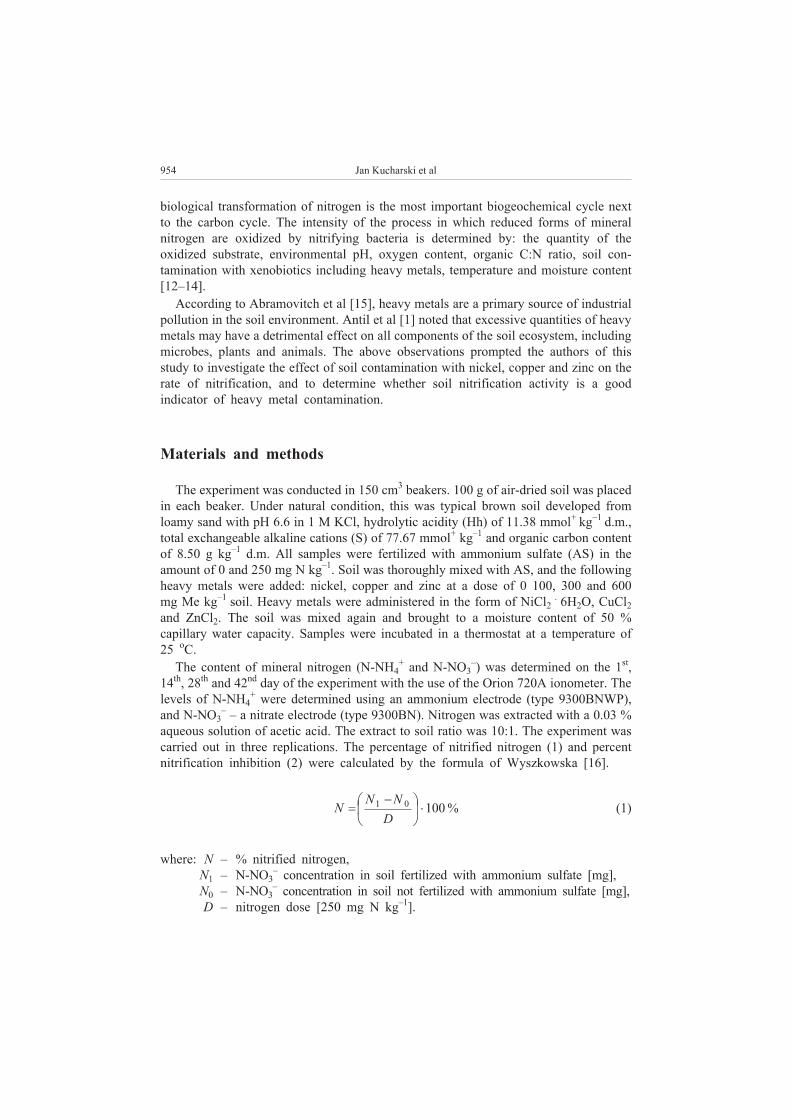
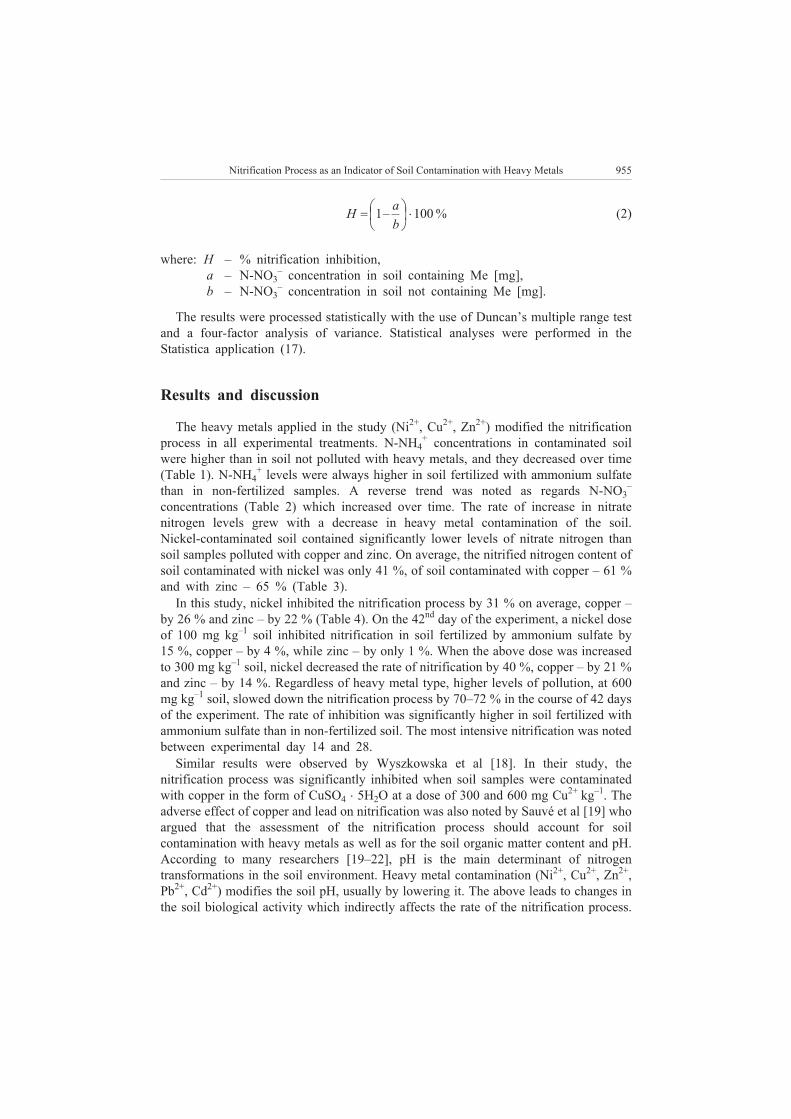
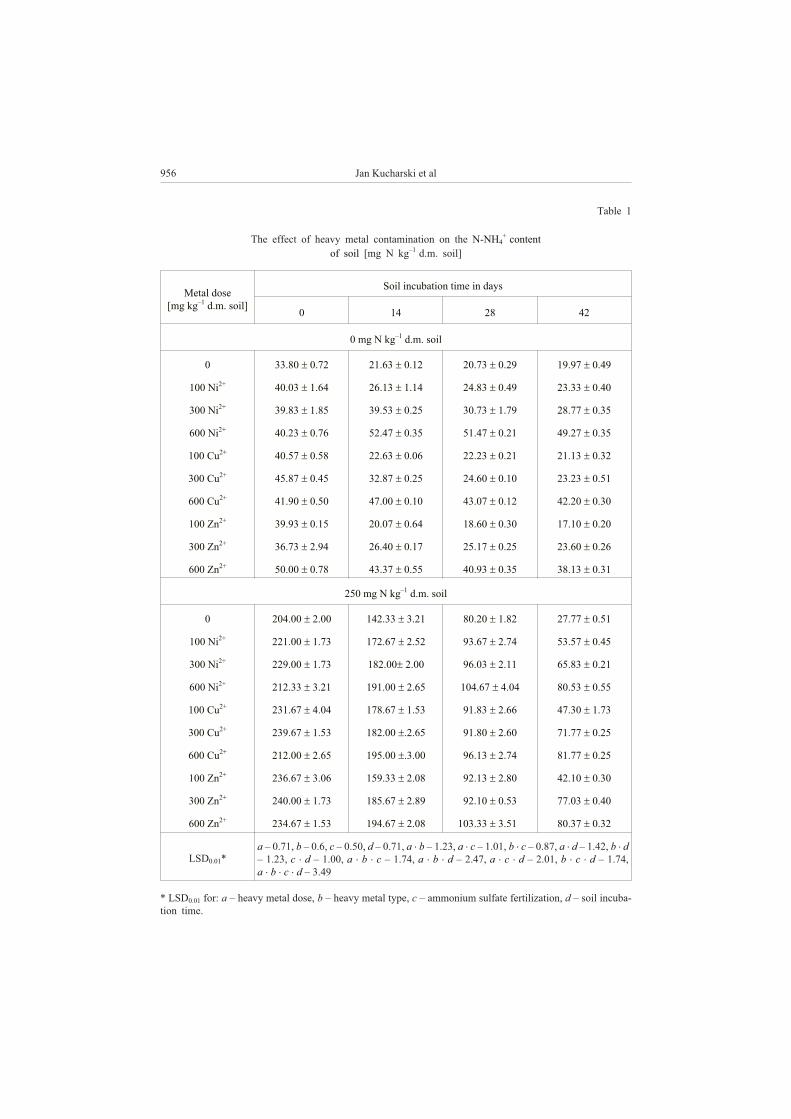
956 Jan Kucharski et al
Table 1
The effect of heavy metal contamination on the N-NH4
+content
of soil [mg N kg–1
d.m. soil]
Metal dose
[mg kg–1
d.m. soil]
Soil incubation time in days
0 14 28 42
0 mg N kg–1
d.m. soil
0 33.80 � 0.72 21.63 � 0.12 20.73 � 0.29 19.97 � 0.49
100 Ni2+
40.03 � 1.64 26.13 � 1.14 24.83 � 0.49 23.33 � 0.40
300 Ni2+
39.83 � 1.85 39.53 � 0.25 30.73 � 1.79 28.77 � 0.35
600 Ni2+
40.23 � 0.76 52.47 � 0.35 51.47 � 0.21 49.27 � 0.35
100 Cu2+
40.57 � 0.58 22.63 � 0.06 22.23 � 0.21 21.13 � 0.32
300 Cu2+
45.87 � 0.45 32.87 � 0.25 24.60 � 0.10 23.23 � 0.51
600 Cu2+
41.90 � 0.50 47.00 � 0.10 43.07 � 0.12 42.20 � 0.30
100 Zn2+
39.93 � 0.15 20.07 � 0.64 18.60 � 0.30 17.10 � 0.20
300 Zn2+
36.73 � 2.94 26.40 � 0.17 25.17 � 0.25 23.60 � 0.26
600 Zn2+
50.00 � 0.78 43.37 � 0.55 40.93 � 0.35 38.13 � 0.31
250 mg N kg–1
d.m. soil
0 204.00 � 2.00 142.33 � 3.21 80.20 � 1.82 27.77 � 0.51
100 Ni2+
221.00 � 1.73 172.67 � 2.52 93.67 � 2.74 53.57 � 0.45
300 Ni2+
229.00 � 1.73 182.00� 2.00 96.03 � 2.11 65.83 � 0.21
600 Ni2+
212.33 � 3.21 191.00 � 2.65 104.67 � 4.04 80.53 � 0.55
100 Cu2+
231.67 � 4.04 178.67 � 1.53 91.83 � 2.66 47.30 � 1.73
300 Cu2+
239.67 � 1.53 182.00 �.2.65 91.80 � 2.60 71.77 � 0.25
600 Cu2+
212.00 � 2.65 195.00 �.3.00 96.13 � 2.74 81.77 � 0.25
100 Zn2+
236.67 � 3.06 159.33 � 2.08 92.13 � 2.80 42.10 � 0.30
300 Zn2+
240.00 � 1.73 185.67 � 2.89 92.10 � 0.53 77.03 � 0.40
600 Zn2+
234.67 � 1.53 194.67 � 2.08 103.33 � 3.51 80.37 � 0.32
LSD0.01*
a – 0.71, b – 0.6, c – 0.50, d – 0.71, a � b – 1.23, a � c – 1.01, b � c – 0.87, a � d – 1.42, b � d
– 1.23, c � d – 1.00, a � b � c – 1.74, a � b � d – 2.47, a � c � d – 2.01, b � c � d – 1.74,
a � b � c � d – 3.49
* LSD0.01 for: a – heavy metal dose, b – heavy metal type, c – ammonium sulfate fertilization, d – soil incuba-
tion time.
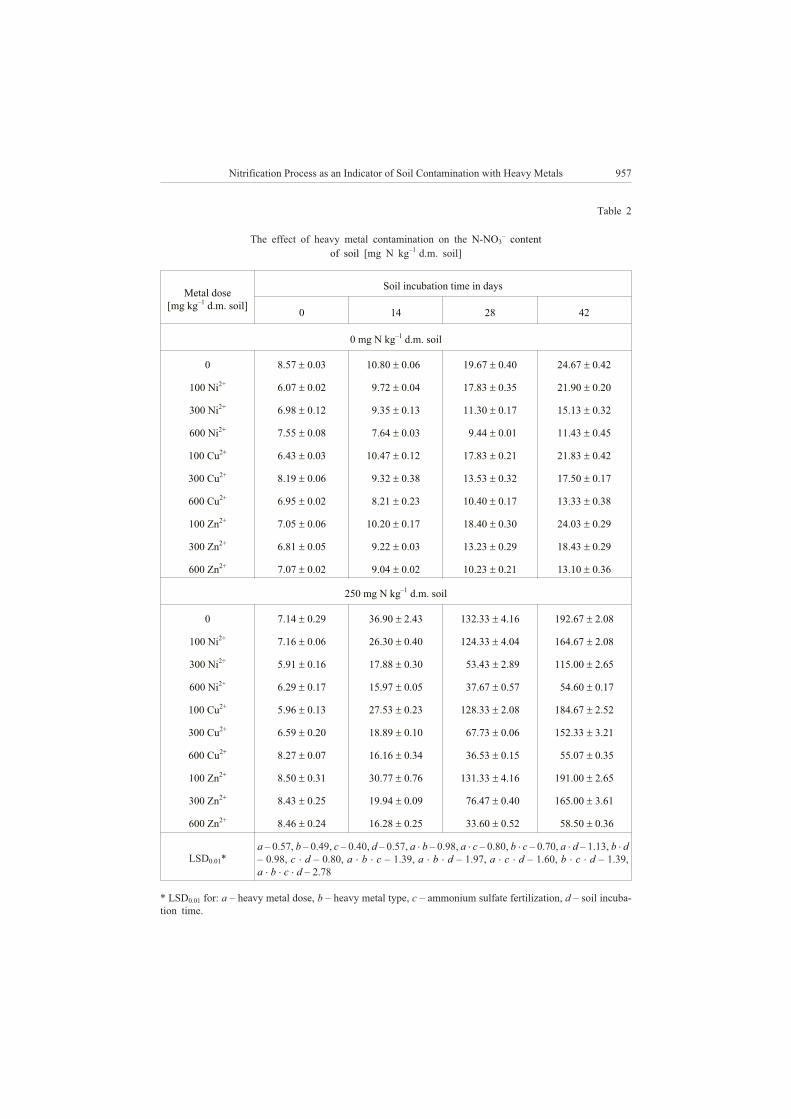
Nitrification Process as an Indicator of Soil Contamination with Heavy Metals 957
Table 2
The effect of heavy metal contamination on the N-NO3
–content
of soil [mg N kg–1
d.m. soil]
Metal dose
[mg kg–1
d.m. soil]
Soil incubation time in days
0 14 28 42
0 mg N kg–1
d.m. soil
0 8.57 � 0.03 10.80 � 0.06 19.67 � 0.40 24.67 � 0.42
100 Ni2+
6.07 � 0.02 9.72 � 0.04 17.83 � 0.35 21.90 � 0.20
300 Ni2+
6.98 � 0.12 9.35 � 0.13 11.30 � 0.17 15.13 � 0.32
600 Ni2+
7.55 � 0.08 7.64 � 0.03 9.44 � 0.01 11.43 � 0.45
100 Cu2+
6.43 � 0.03 10.47 � 0.12 17.83 � 0.21 21.83 � 0.42
300 Cu2+
8.19 � 0.06 9.32 � 0.38 13.53 � 0.32 17.50 � 0.17
600 Cu2+
6.95 � 0.02 8.21 � 0.23 10.40 � 0.17 13.33 � 0.38
100 Zn2+
7.05 � 0.06 10.20 � 0.17 18.40 � 0.30 24.03 � 0.29
300 Zn2+
6.81 � 0.05 9.22 � 0.03 13.23 � 0.29 18.43 � 0.29
600 Zn2+
7.07 � 0.02 9.04 � 0.02 10.23 � 0.21 13.10 � 0.36
250 mg N kg–1
d.m. soil
0 7.14 � 0.29 36.90 � 2.43 132.33 � 4.16 192.67 � 2.08
100 Ni2+
7.16 � 0.06 26.30 � 0.40 124.33 � 4.04 164.67 � 2.08
300 Ni2+
5.91 � 0.16 17.88 � 0.30 53.43 � 2.89 115.00 � 2.65
600 Ni2+
6.29 � 0.17 15.97 � 0.05 37.67 � 0.57 54.60 � 0.17
100 Cu2+
5.96 � 0.13 27.53 � 0.23 128.33 � 2.08 184.67 � 2.52
300 Cu2+
6.59 � 0.20 18.89 � 0.10 67.73 � 0.06 152.33 � 3.21
600 Cu2+
8.27 � 0.07 16.16 � 0.34 36.53 � 0.15 55.07 � 0.35
100 Zn2+
8.50 � 0.31 30.77 � 0.76 131.33 � 4.16 191.00 � 2.65
300 Zn2+
8.43 � 0.25 19.94 � 0.09 76.47 � 0.40 165.00 � 3.61
600 Zn2+
8.46 � 0.24 16.28 � 0.25 33.60 � 0.52 58.50 � 0.36
LSD0.01*
a – 0.57, b – 0.49, c – 0.40, d – 0.57, a � b – 0.98, a � c – 0.80, b � c – 0.70, a � d – 1.13, b � d
– 0.98, c � d – 0.80, a � b � c – 1.39, a � b � d – 1.97, a � c � d – 1.60, b � c � d – 1.39,
a � b � c � d – 2.78
* LSD0.01 for: a – heavy metal dose, b – heavy metal type, c – ammonium sulfate fertilization, d – soil incuba-
tion time.
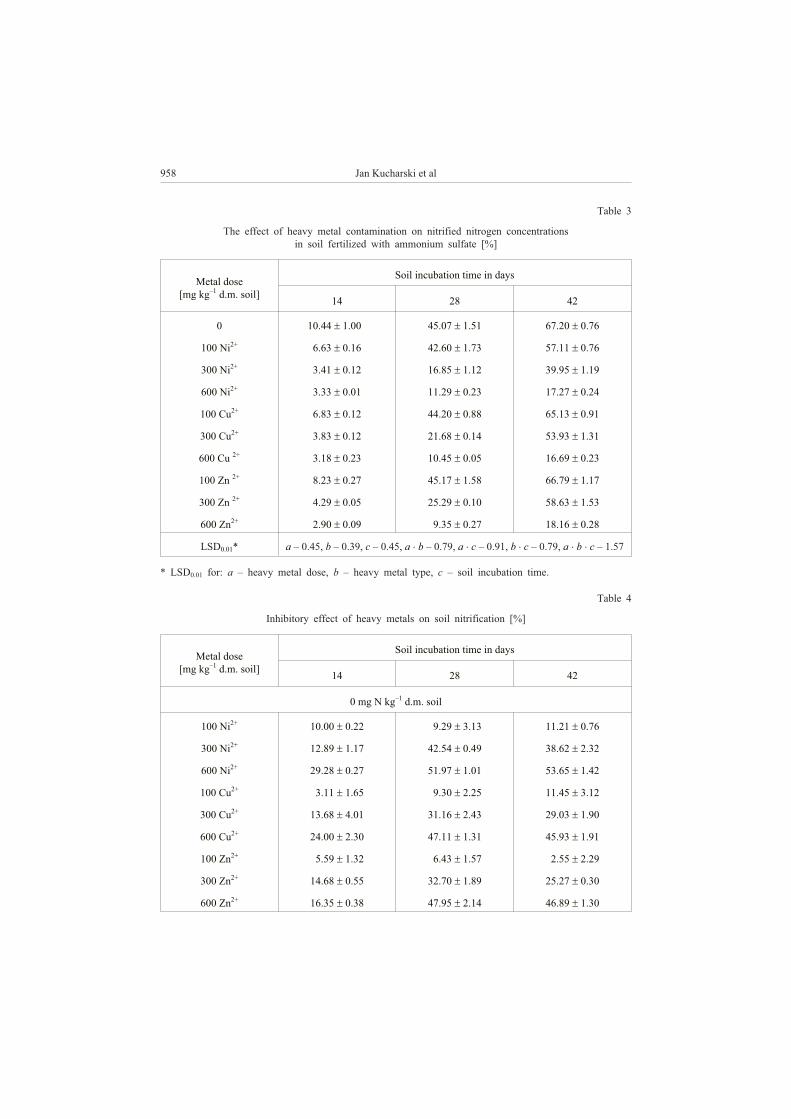
958 Jan Kucharski et al
Table 3
The effect of heavy metal contamination on nitrified nitrogen concentrations
in soil fertilized with ammonium sulfate [%]
Metal dose
[mg kg–1
d.m. soil]
Soil incubation time in days
14 28 42
0 10.44 � 1.00 45.07 � 1.51 67.20 � 0.76
100 Ni2+
6.63 � 0.16 42.60 � 1.73 57.11 � 0.76
300 Ni2+
3.41 � 0.12 16.85 � 1.12 39.95 � 1.19
600 Ni2+
3.33 � 0.01 11.29 � 0.23 17.27 � 0.24
100 Cu2+
6.83 � 0.12 44.20 � 0.88 65.13 � 0.91
300 Cu2+
3.83 � 0.12 21.68 � 0.14 53.93 � 1.31
600 Cu2+
3.18 � 0.23 10.45 � 0.05 16.69 � 0.23
100 Zn2+
8.23 � 0.27 45.17 � 1.58 66.79 � 1.17
300 Zn2+
4.29 � 0.05 25.29 � 0.10 58.63 � 1.53
600 Zn2+
2.90 � 0.09 9.35 � 0.27 18.16 � 0.28
LSD0.01* a – 0.45, b – 0.39, c – 0.45, a � b – 0.79, a � c – 0.91, b � c – 0.79, a � b � c – 1.57
* LSD0.01 for: a – heavy metal dose, b – heavy metal type, c – soil incubation time.
Table 4
Inhibitory effect of heavy metals on soil nitrification [%]
Metal dose
[mg kg–1
d.m. soil]
Soil incubation time in days
14 28 42
0 mg N kg–1
d.m. soil
100 Ni2+
10.00 � 0.22 9.29 � 3.13 11.21 � 0.76
300 Ni2+
12.89 � 1.17 42.54 � 0.49 38.62 � 2.32
600 Ni2+
29.28 � 0.27 51.97 � 1.01 53.65 � 1.42
100 Cu2+
3.11 � 1.65 9.30 � 2.25 11.45 � 3.12
300 Cu2+
13.68 � 4.01 31.16 � 2.43 29.03 � 1.90
600 Cu2+
24.00 � 2.30 47.11 � 1.31 45.93 � 1.91
100 Zn2+
5.59 � 1.32 6.43 � 1.57 2.55 � 2.29
300 Zn2+
14.68 � 0.55 32.70 � 1.89 25.27 � 0.30
600 Zn2+
16.35 � 0.38 47.95 � 2.14 46.89 � 1.30
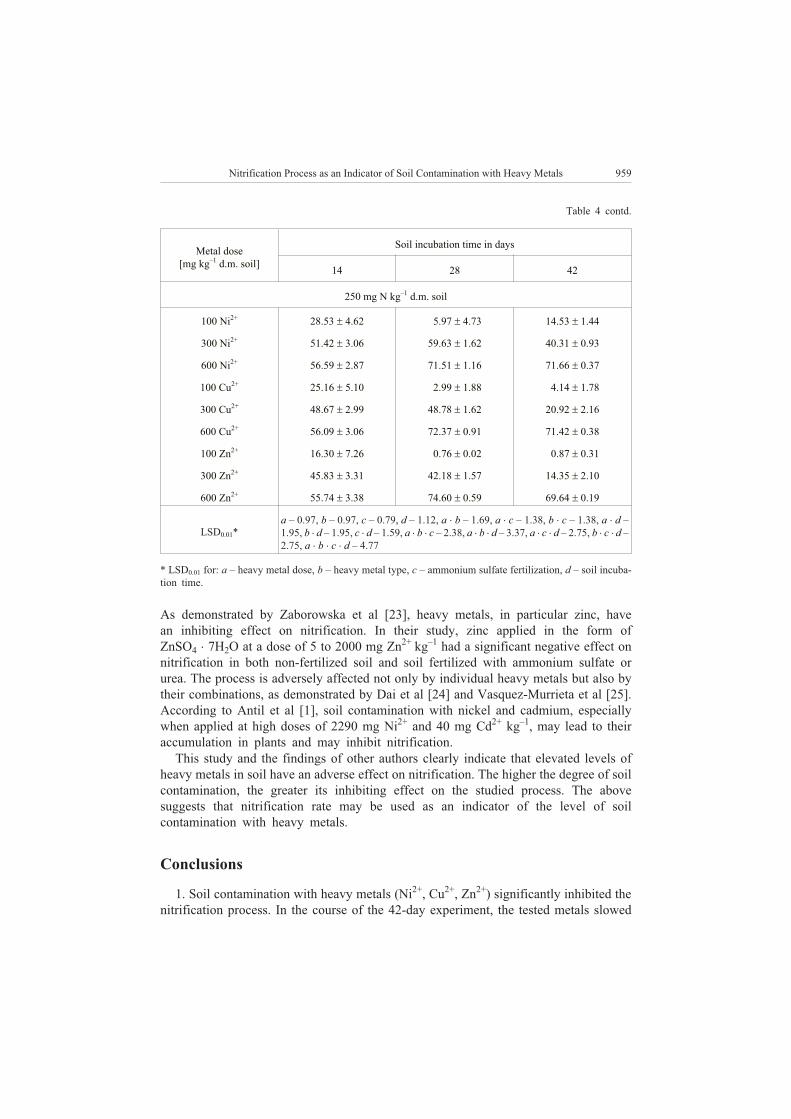
As demonstrated by Zaborowska et al [23], heavy metals, in particular zinc, have
an inhibiting effect on nitrification. In their study, zinc applied in the form of
ZnSO4 � 7H2O at a dose of 5 to 2000 mg Zn2+
kg–1
had a significant negative effect on
nitrification in both non-fertilized soil and soil fertilized with ammonium sulfate or
urea. The process is adversely affected not only by individual heavy metals but also by
their combinations, as demonstrated by Dai et al [24] and Vasquez-Murrieta et al [25].
According to Antil et al [1], soil contamination with nickel and cadmium, especially
when applied at high doses of 2290 mg Ni2+
and 40 mg Cd2+
kg–1
, may lead to their
accumulation in plants and may inhibit nitrification.
This study and the findings of other authors clearly indicate that elevated levels of
heavy metals in soil have an adverse effect on nitrification. The higher the degree of soil
contamination, the greater its inhibiting effect on the studied process. The above
suggests that nitrification rate may be used as an indicator of the level of soil
contamination with heavy metals.
Conclusions
1. Soil contamination with heavy metals (Ni2+
, Cu2+
, Zn2+
) significantly inhibited the
nitrification process. In the course of the 42-day experiment, the tested metals slowed
Nitrification Process as an Indicator of Soil Contamination with Heavy Metals 959
Metal dose
[mg kg–1
d.m. soil]
Soil incubation time in days
14 28 42
250 mg N kg–1
d.m. soil
100 Ni2+
28.53 � 4.62 5.97 � 4.73 14.53 � 1.44
300 Ni2+
51.42 � 3.06 59.63 � 1.62 40.31 � 0.93
600 Ni2+
56.59 � 2.87 71.51 � 1.16 71.66 � 0.37
100 Cu2+
25.16 � 5.10 2.99 � 1.88 4.14 � 1.78
300 Cu2+
48.67 � 2.99 48.78 � 1.62 20.92 � 2.16
600 Cu2+
56.09 � 3.06 72.37 � 0.91 71.42 � 0.38
100 Zn2+
16.30 � 7.26 0.76 � 0.02 0.87 � 0.31
300 Zn2+
45.83 � 3.31 42.18 � 1.57 14.35 � 2.10
600 Zn2+
55.74 � 3.38 74.60 � 0.59 69.64 � 0.19
LSD0.01*
a – 0.97, b – 0.97, c – 0.79, d – 1.12, a � b – 1.69, a � c – 1.38, b � c – 1.38, a � d –
1.95, b � d – 1.95, c � d – 1.59, a � b � c – 2.38, a � b � d – 3.37, a � c � d – 2.75, b � c � d –
2.75, a � b � c � d – 4.77
* LSD0.01 for: a – heavy metal dose, b – heavy metal type, c – ammonium sulfate fertilization, d – soil incuba-
tion time.
Table 4 contd.
down nitrification by 1 % to 15 % when applied at a dose of 100 mg kg–1
soil, and by
14 % to 40 % at a dose of 300 mg kg–1
soil. The highest contamination level of 600 mg
Me kg–1
soil inhibited nitrification by 70 % to 72 %.
2. Nitrification was most adversely affected by nickel, it was less influenced by
copper, while zinc had the least effect on the process.
3. A close correlation between the nitrification process and the degree and type of
soil pollution with heavy metals renders nitrification rate a highly objective parameter
in the evaluation of soil contamination.
References
[1] Antil R.S., Gupta A.P. and Narwal R.P.: Urban Water, 2001, 3, 299–302.
[2] Omar S.A. and Ismail M.A.: Folia Microbiol. 1999, 44(2), 205–212.
[3] Barabasz W., Albiñska D., Jaœkowska M. and Lipiec J.: Polish J. Environ. Stud. 2002, 11(3), 193–198.
[4] Barabasz W. : Post. Mikrob. 1992, 31(1), 3–29.
[5] Brierley E.D.R. and Wood M.: Soil Biol. Biochem. 2001, 33, 1403–1409.
[6] Burger M. and Jackson E.: Soil Biol. Biochem. 2003, 35, 29–36.
[7] Maccarty G.W.: Biol. Fertil. Soils, 1999, 29, 1–9.
[8] Mercik S., Korschens M., Bielawski W., Russel S. and Rumpel J.: Ann. W. Agr. U. SGGW Agr. 1995,
29, 27–35.
[9] Dincer A.R. and Kargi F.: Enzym. Microbiol. Technol. 2000, 27, 37–42.
[10] Kucharski J.: Znaczenie procesu nitryfikacji, [in:] Mikrobiologia na prze³omie wieków. Siwicki A. (ed.).
Wyd. UWM, Olsztyn 2000, 37–40.
[11] Simek M.: Rostl. Vyroba, 2000, 46(9), 385–395.
[12] Deni J. and Penninckx M.J.: Appl. Environ. Microbiol. 1999, 65(9), 4008–4013.
[13] Przybulewska K., Nowak A. and Stopa K.: Zesz. Probl. Post. Nauk. Roln. 2003, 492, 287–293.
[14] Wyszkowska J. and Kucharski J.: Rocz. Glebozn. 2004, 55(2), 517–525.
[15] Abramovitch R.A., Chang Qing L., Hicks E. and Sinard J.: Chemosphere 2003, 53, 1077–1085.
[16] Wyszkowska J.: Biologiczne w³aœciwoœci gleby zanieczyszczonej chromem szeœciowartoœciowym,
Rozprawy i monografie, Wyd. UWM, Olsztyn 2002, 65, 1–134.
[17] Statsoft, Inc. Statistica (data analysis software system), version 6.0. www.statsoft.com. 2006.
[18] Wyszkowska J., Kucharski J. and Kucharski M.: Zesz. Probl. Post. Nauk Roln. 2006, 515, 439–445.
[19] Sauvé S., Dumestre A., McBride M., Gillett J.W., Berthelin J. and Hendershot W.: Appl. Soil Ecol.
1999, 12, 29–39.
[20] De Boer W. and Kowalchuk G.A.: Soil Biol. Biochem. 2001, 33, 853–866.
[21] Kashem M.A. and Singh B.R.: Nutr. Cycl. Agroecosys. 2001, 61, 247–255.
[22] Kyveryga P.M., Blackmer A.M., Ellsworth J.W. and Isla R.: Soil Sci. Soc. Amer. J. 2004, 68(2),
545–551.
[23] Zaborowska M., Wyszkowska J. and Kucharski J.: EJPAU, 2007, 10(4), #9.
[24] Dai J., Becquer T., Rouiller H. J., Reversat G., Bernhard-Reversat F. and Lavelle P.: Appl. Soil Ecol.
2004, 25, 99–109.
[25] Vasquez-Murrieta M.S., Cruz-Mondragón C., Trujillo-Tapia N., Herrera-Arreola G., Govaerts B., Van
Cleemput O. and Dendooven L.: Soil Biol. Biochem. 2006, 38, 931–940.
PROCES NITRYFIKACJI
WSKA�NIKIEM ZANIECZYSZCZENIA GLEB METALAMI CIʯKIMI
Katedra mikrobiologii, Uniwersytet Warmiñsko-Mazurski w Olsztynie
Abstrakt: W doœwiadczeniu laboratoryjnym okreœlono wp³yw zanieczyszczenia gleby metalami ciê¿kimi na
przebieg procesu nitryfikacji. W badaniach wykorzystano próbki gleby pobrane z poziomu ornopróch-
960 Jan Kucharski et al
nicznego. W stanie naturalnym by³a to gleba brunatna w³aœciwa o sk³adzie granulometrycznym piasku
gliniastego. Doœwiadczenie wykonano w trzech powtórzeniach. Próbki glebowe zanieczyszczono chlorkiem
niklu, chlorkiem miedzi i chlorkiem cynku w nastêpuj¹cych dawkach: 0, 100, 300, 600 mg Me kg–1
gleby.
Azot wprowadzono w iloœci: 0, 250 mg N kg–1
gleby w postaci siarczanu amonu. Nastêpnie po dok³adnym
wymieszaniu, doprowadzono wilgotnoœæ gleby do 50 % kapilarnej pojemnoœci wodnej. Tak przygotowan¹
glebê inkubowano w cieplarce w temperaturze 25oC przez 42 dni. W dniu za³o¿enia doœwiadczenia oraz w 14,
28 i 42 dniu w glebie oznaczono zawartoϾ N-NH4
+i N-NO3
–.
Stwierdzono, ¿e zanieczyszczenie gleby metalami ciê¿kimi (Ni2+
, Cu2+
, Zn2+
) przyczyni³o siê do
znacznego zmniejszenia intensywnoœci nitryfikacji. Testowane metale w 42 dniu trwania doœwiadczenia
hamowa³y nitryfikacjê w zakresie od 1 do 15 %, gdy by³y stosowane w dawce 100 mg kg–1
gleby i od 14 %
do 40 %, gdy dodano je do gleby w iloœci 300 mg kg–1
gleby. Zanieczyszczenie najwiêksze – 600 mg Me kg–1
gleby hamowa³o nitryfikacjê w zakresie od 70 do 72 %. Najbardziej niekorzystnie na proces nitryfikacji
wp³ywa³ nikiel, nieco s³abiej – miedŸ i najs³abiej – cynk. Œcis³a zale¿noœæ intensywnoœci nitryfikacji od
stopnia i rodzaju zanieczyszczenia gleby metalami ciê¿kimi czyni pomiar intensywnoœci nitryfikacji
obiektywnym parametrem oceny stanu zanieczyszczenia gleb metalami ciê¿kimi.
S³owa kluczowe: metale ciê¿kie, gleba, nitryfikacja, nikiel, miedŸ, cynk
Nitrification Process as an Indicator of Soil Contamination with Heavy Metals 961

Jan KUCHARSKI1, Jadwiga WYSZKOWSKA
1
and Agata BOROWIK1
NITRIFICATION PROCESS IN SOIL
CONTAMINATED WITH BENZENE
PROCES NITRYFIKACJI W GLEBIE
ZANIECZYSZCZONEJ BENZENEM
Abstract: A laboratory experiment was conducted to determine the effect of light loam contamination with
benzene doses of 0, 250, 500, 750 and 1000 mm3
� kg–1
d.m. soil on the nitrification process. The N-NH4
+and
N-NO3
–content of soil was measured at 7-day intervals over a period of 28 days. The soil nitrifying activity
and nitrifying bacteria counts (MPN) were also determined.
The results of the study indicate that soil contamination with benzene in quantities exceeding 250
mm3
� kg–1
d.m. soil inhibits the nitrification process. The highest level of benzene pollution (1000 mm3
� kg–1
)
reduced the populations of phase II nitrifying bacteria 38-fold and lowered the soil nitrifying activity 3.6-fold.
Benzene had a more toxic effect on phase II than phase I nitrifying of bacteria which could lead to the
excessive accumulation of NO2
–in soil contaminated with the studied hydrocarbon.
Keywords: benzene, nitrification, nitrifying bacteria, nitrifying activity
The nitrification process is one of the key stages in the nitrogen biogeochemical
cycle [1]. It takes place with the involvement of both chemolithotrophic and chemo-
organotrophic bacteria which are responsible for autotrophic and heterotrophic nitrifica-
tion, respectively [2, 3]. The oxidation of N-NH4
+to N-NO3
–is more intense when it
involves chemolithotrophic bacteria than a varied group of chemoorganotrophic
microbes [3]. The growth of chemolithotrophs oxidizing reduced nitrogen compounds is
limited by the soil pH [2]. Soil acidification significantly reduces those bacterial
populations and changes the NH4
+to NO3
–ratio in the soil at the expense of nitrate ions.
Although they contribute less to the nitrification process, chemoorganotrophic nitrifiers
are found in soils marked by a wider pH spectrum, and they are capable of oxidizing
reduced nitrogen compounds even in highly acidic soils.
The nitrification process may be analyzed on various levels. The higher the
nitrification intensity, the more fertile the soil, but the soil fertility and nitrifying activity
E C O L O G I C A L C H E M I S T R Y A N D E N G I N E E R I N G A
Vol. 16, No. 8 2009
1Department of Microbiology, University of Warmia and Mazury in Olsztyn, pl. £ódzki 3, 10–727 Olsztyn,
Poland, email: [email protected]; [email protected]; [email protected]
are largely determined by its physical and chemical properties rather than the
nitrification process alone. Nitrification results in nitrogen loss due to N2O production,
NO3
–leaching and denitrification which may take place in oxygen deficient soil niches
[4, 5]. It may also contribute to higher nitrate accumulation in farming products [1].
Fertile soils with a neutral and lightly acidic pH are subject mostly to autotrophic
nitrification. The process may be slowed down by various factors affecting not only the
soil pH, but also its moisture content, temperature, content of organic matter, mineral
and organic pollutants. Mineral pollutants are inclusive of heavy metals [6, 7], while
organic contaminants consist of pesticides [8], oil-derivative substances [9] and
hydrocarbons [10].
Oil-derivative substances are the main source of environmental pollution with
benzene, toluene, ethylbenzene and xylene [11]. Benzene is absorbed by colloids in soil
[12] and it is highly biodegradable [13–16]. Benzene may affect the microbiological and
biochemical activity of soil both directly and indirectly through metabolites resulting
from its transformation [14].
The objective of this study was to determine the effect of soil contamination with
benzene on the nitrification process.
Materials and methods
A laboratory experiment was conducted in 6 replications. 100 g of air-dried soil
screened through a 2 mm mesh sieve was placed in 150 cm3
beakers. Under natural
conditions, it was typical brown soil developed from light loam (sand – 49 %, silt and
clay fraction – 37 %, pHKCl – 6.5, Corg – 7.1 g kg–1
, total N – 0.58 g kg–1
; hydrolytic
acidity – 1.28 cmol(+)
kg–1
, total exchangeable alkaline cations – 13.26 cmol(+)
kg–1
d.m.
soil).
The variable experimental factors were:
1) level of benzene contamination: 0, 250, 500, 750 and 1000 mm3
kg–1
d.m. soil;
2) ammonium sulfate dose in mg N kg–1
d.m. soil: 0 and 250;
3) soil incubation time in days: 0, 7, 14, 21 and 28.
Soil samples were contaminated with benzene (variable 1) and (NH4)2SO4 (variable
2). All components were thoroughly mixed, and the moisture content of soil was
brought to 60 % capillary water capacity with the use of distilled water. The beakers
were incubated at a temperature of 25oC (variable 3). The incubation process was
interrupted on different days of the experiment (variable 3), and N-NH4
+and N-NO3
–
levels were determined in the soil. The content of ammonia nitrogen was determined
with Nessler’s reagent, and the content of nitrate nitrogen – with phenoldisulfonic acid.
Mineral nitrogen was extracted with a 1 % aqueous K2SO4 solution. The extractor to
soil ratio was 5:1. The detailed procedure of extracting mineral nitrogen and
determining N-NH4
+and N-NO3
–concentrations is presented in a previous study [10].
Soil samples were also analyzed to determine the most probable number (MPN) of
phase I and II nitrifying bacteria by the serial dilution method [17], and nitrifying
activity – by the Kandeler method [18].
964 Jan Kucharski et al
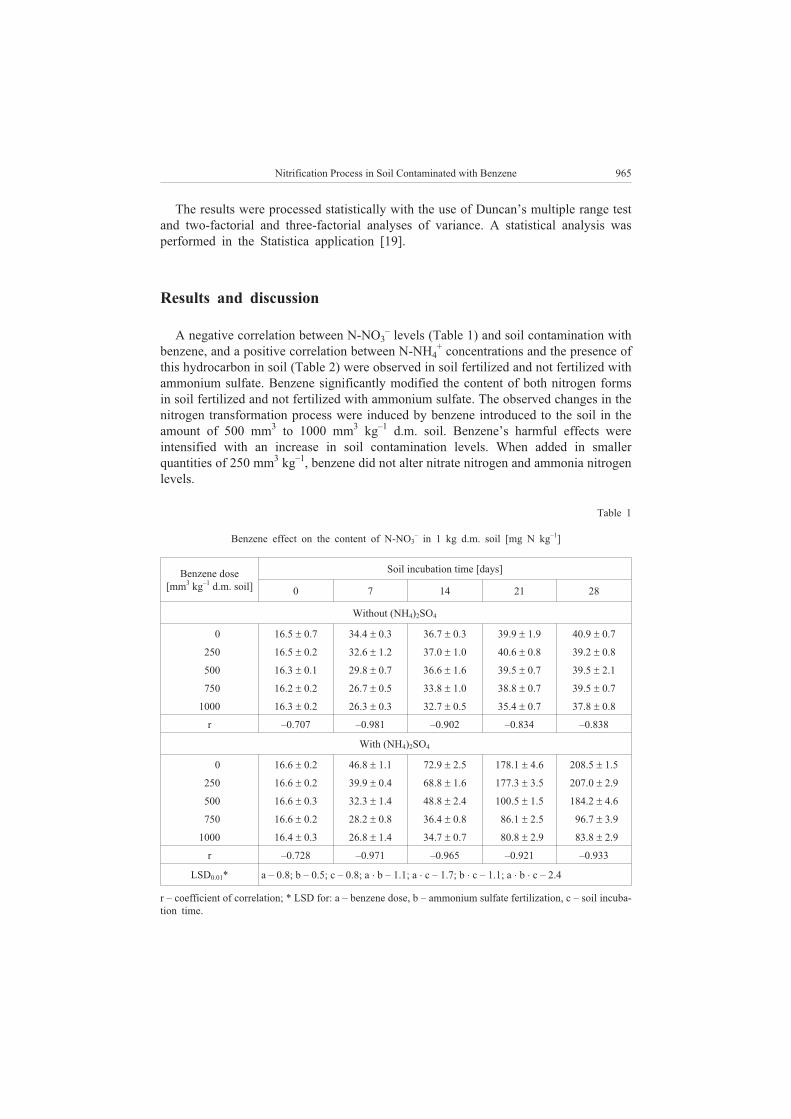
The results were processed statistically with the use of Duncan’s multiple range test
and two-factorial and three-factorial analyses of variance. A statistical analysis was
performed in the Statistica application [19].
Results and discussion
A negative correlation between N-NO3
–levels (Table 1) and soil contamination with
benzene, and a positive correlation between N-NH4
+concentrations and the presence of
this hydrocarbon in soil (Table 2) were observed in soil fertilized and not fertilized with
ammonium sulfate. Benzene significantly modified the content of both nitrogen forms
in soil fertilized and not fertilized with ammonium sulfate. The observed changes in the
nitrogen transformation process were induced by benzene introduced to the soil in the
amount of 500 mm3
to 1000 mm3
kg–1
d.m. soil. Benzene’s harmful effects were
intensified with an increase in soil contamination levels. When added in smaller
quantities of 250 mm3
kg–1
, benzene did not alter nitrate nitrogen and ammonia nitrogen
levels.
Table 1
Benzene effect on the content of N-NO3
–in 1 kg d.m. soil [mg N kg
–1]
Benzene dose
[mm3
kg–1
d.m. soil]
Soil incubation time [days]
0 7 14 21 28
Without (NH4)2SO4
0 16.5 � 0.7 34.4 � 0.3 36.7 � 0.3 39.9 � 1.9 40.9 � 0.7
250 16.5 � 0.2 32.6 � 1.2 37.0 � 1.0 40.6 � 0.8 39.2 � 0.8
500 16.3 � 0.1 29.8 � 0.7 36.6 � 1.6 39.5 � 0.7 39.5 � 2.1
750 16.2 � 0.2 26.7 � 0.5 33.8 � 1.0 38.8 � 0.7 39.5 � 0.7
1000 16.3 � 0.2 26.3 � 0.3 32.7 � 0.5 35.4 � 0.7 37.8 � 0.8
r –0.707 –0.981 –0.902 –0.834 –0.838
With (NH4)2SO4
0 16.6 � 0.2 46.8 � 1.1 72.9 � 2.5 178.1 � 4.6 208.5 � 1.5
250 16.6 � 0.2 39.9 � 0.4 68.8 � 1.6 177.3 � 3.5 207.0 � 2.9
500 16.6 � 0.3 32.3 � 1.4 48.8 � 2.4 100.5 � 1.5 184.2 � 4.6
750 16.6 � 0.2 28.2 � 0.8 36.4 � 0.8 86.1 � 2.5 96.7 � 3.9
1000 16.4 � 0.3 26.8 � 1.4 34.7 � 0.7 80.8 � 2.9 83.8 � 2.9
r –0.728 –0.971 –0.965 –0.921 –0.933
LSD0.01* a – 0.8; b – 0.5; c – 0.8; a � b – 1.1; a � c – 1.7; b � c – 1.1; a � b � c – 2.4
r – coefficient of correlation; * LSD for: a – benzene dose, b – ammonium sulfate fertilization, c – soil incuba-
tion time.
Nitrification Process in Soil Contaminated with Benzene 965
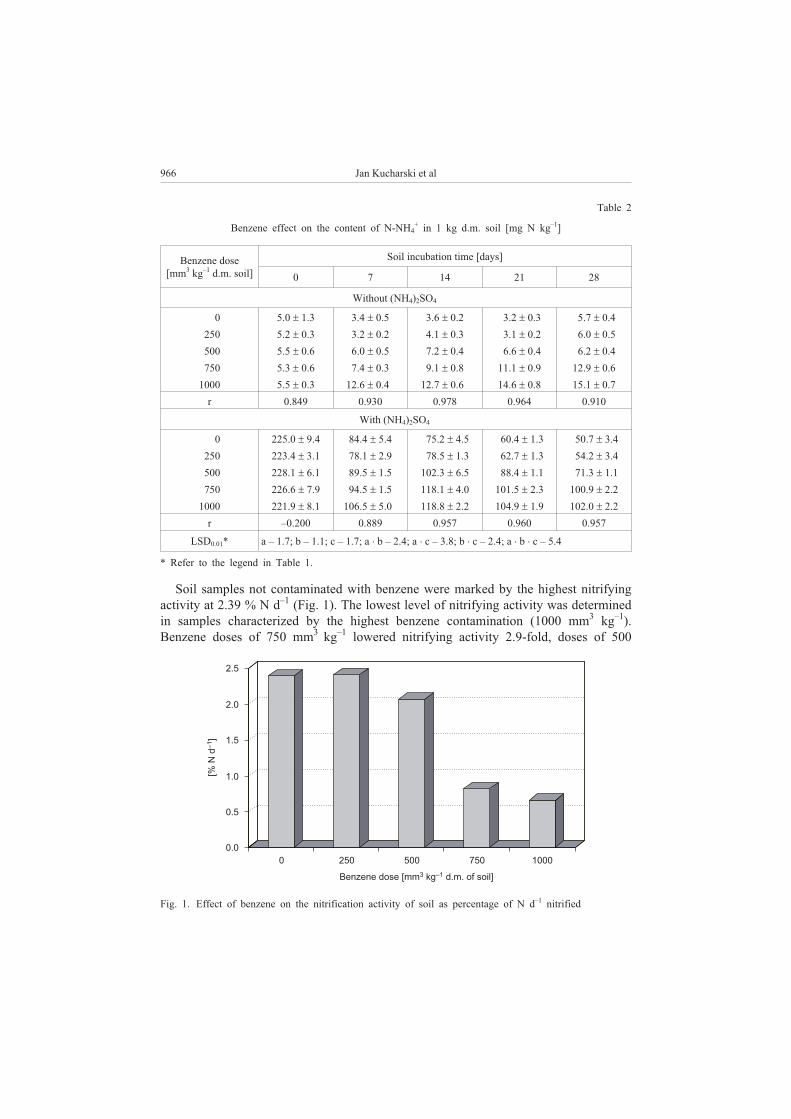
Table 2
Benzene effect on the content of N-NH4
+in 1 kg d.m. soil [mg N kg
–1]
Benzene dose
[mm3
kg–1
d.m. soil]
Soil incubation time [days]
0 7 14 21 28
Without (NH4)2SO4
0 5.0 � 1.3 3.4 � 0.5 3.6 � 0.2 3.2 � 0.3 5.7 � 0.4
250 5.2 � 0.3 3.2 � 0.2 4.1 � 0.3 3.1 � 0.2 6.0 � 0.5
500 5.5 � 0.6 6.0 � 0.5 7.2 � 0.4 6.6 � 0.4 6.2 � 0.4
750 5.3 � 0.6 7.4 � 0.3 9.1 � 0.8 11.1 � 0.9 12.9 � 0.6
1000 5.5 � 0.3 12.6 � 0.4 12.7 � 0.6 14.6 � 0.8 15.1 � 0.7
r 0.849 0.930 0.978 0.964 0.910
With (NH4)2SO4
0 225.0 � 9.4 84.4 � 5.4 75.2 � 4.5 60.4 � 1.3 50.7 � 3.4
250 223.4 � 3.1 78.1 � 2.9 78.5 � 1.3 62.7 � 1.3 54.2 � 3.4
500 228.1 � 6.1 89.5 � 1.5 102.3 � 6.5 88.4 � 1.1 71.3 � 1.1
750 226.6 � 7.9 94.5 � 1.5 118.1 � 4.0 101.5 � 2.3 100.9 � 2.2
1000 221.9 � 8.1 106.5 � 5.0 118.8 � 2.2 104.9 � 1.9 102.0 � 2.2
r –0.200 0.889 0.957 0.960 0.957
LSD0.01* a – 1.7; b – 1.1; c – 1.7; a � b – 2.4; a � c – 3.8; b � c – 2.4; a � b � c – 5.4
* Refer to the legend in Table 1.
Soil samples not contaminated with benzene were marked by the highest nitrifying
activity at 2.39 % N d–1
(Fig. 1). The lowest level of nitrifying activity was determined
in samples characterized by the highest benzene contamination (1000 mm3
kg–1
).
Benzene doses of 750 mm3
kg–1
lowered nitrifying activity 2.9-fold, doses of 500
966 Jan Kucharski et al
Fig. 1. Effect of benzene on the nitrification activity of soil as percentage of N d–1
nitrified
0 250 500 750 1000
2.5
2.0
1.5
1.0
0.5
0.0
[%N
d]
–1
Benzene dose [mm kg d.m. of soil]3 –1
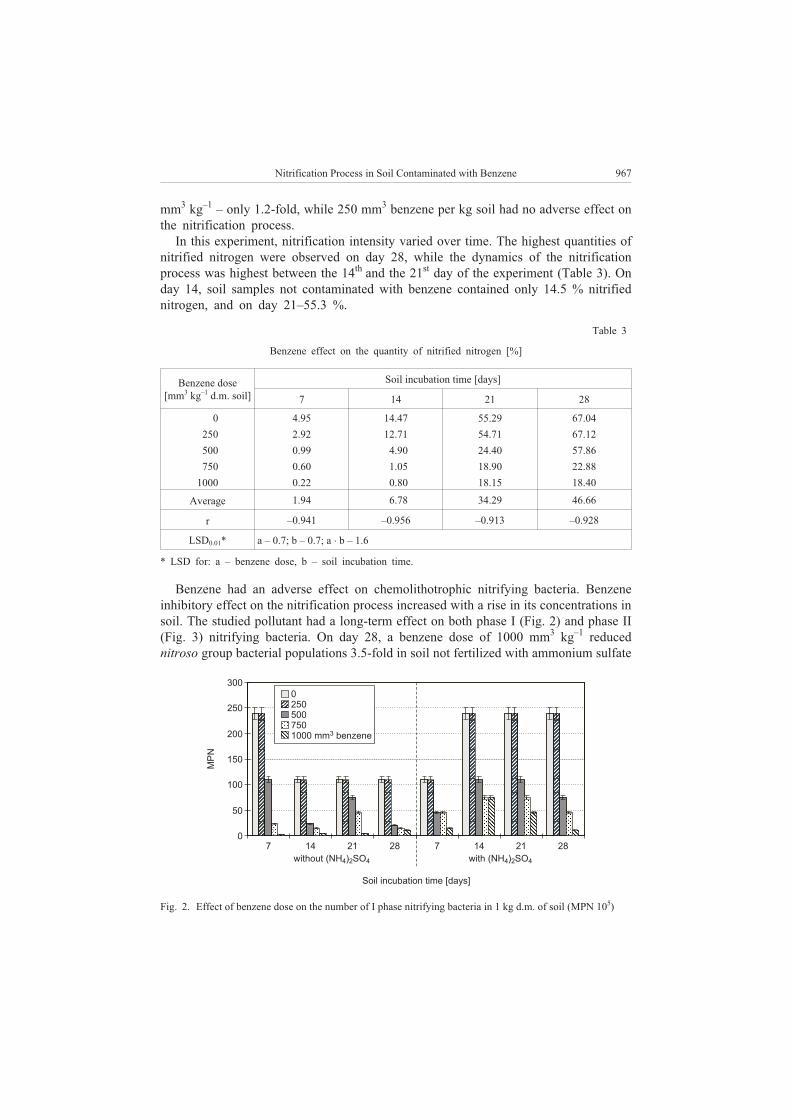
mm3
kg–1
– only 1.2-fold, while 250 mm3
benzene per kg soil had no adverse effect on
the nitrification process.
In this experiment, nitrification intensity varied over time. The highest quantities of
nitrified nitrogen were observed on day 28, while the dynamics of the nitrification
process was highest between the 14th
and the 21st
day of the experiment (Table 3). On
day 14, soil samples not contaminated with benzene contained only 14.5 % nitrified
nitrogen, and on day 21–55.3 %.
Table 3
Benzene effect on the quantity of nitrified nitrogen [%]
Benzene dose
[mm3
kg–1
d.m. soil]
Soil incubation time [days]
7 14 21 28
0 4.95 14.47 55.29 67.04
250 2.92 12.71 54.71 67.12
500 0.99 4.90 24.40 57.86
750 0.60 1.05 18.90 22.88
1000 0.22 0.80 18.15 18.40
Average 1.94 6.78 34.29 46.66
r –0.941 –0.956 –0.913 –0.928
LSD0.01* a – 0.7; b – 0.7; a � b – 1.6
* LSD for: a – benzene dose, b – soil incubation time.
Benzene had an adverse effect on chemolithotrophic nitrifying bacteria. Benzene
inhibitory effect on the nitrification process increased with a rise in its concentrations in
soil. The studied pollutant had a long-term effect on both phase I (Fig. 2) and phase II
(Fig. 3) nitrifying bacteria. On day 28, a benzene dose of 1000 mm3
kg–1
reduced
nitroso group bacterial populations 3.5-fold in soil not fertilized with ammonium sulfate
Nitrification Process in Soil Contaminated with Benzene 967
0
250
500
750
1000 mm benzene3
7 14 21 28 7 14 21 28
without (NH ) SO4 2 4 with (NH ) SO4 2 4
Soil incubation time [days]
300
250
200
150
100
50
0
MP
N
Fig. 2. Effect of benzene dose on the number of I phase nitrifying bacteria in 1 kg d.m. of soil (MPN 105)
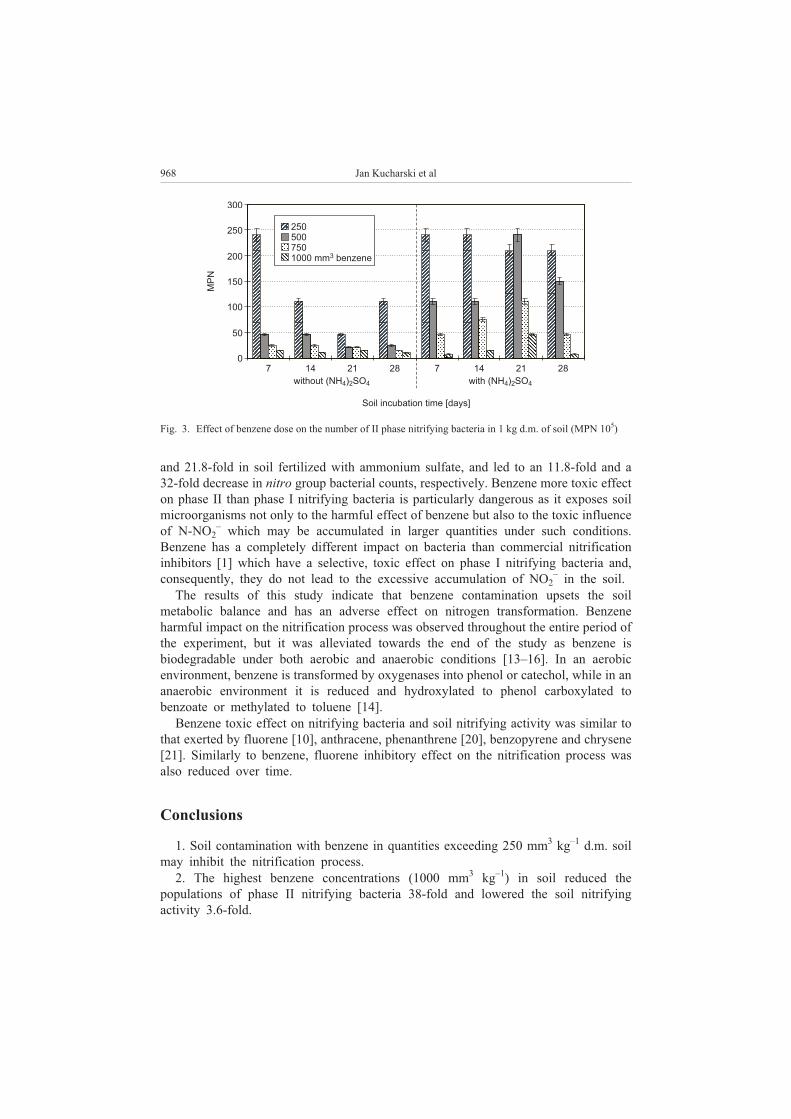
and 21.8-fold in soil fertilized with ammonium sulfate, and led to an 11.8-fold and a
32-fold decrease in nitro group bacterial counts, respectively. Benzene more toxic effect
on phase II than phase I nitrifying bacteria is particularly dangerous as it exposes soil
microorganisms not only to the harmful effect of benzene but also to the toxic influence
of N-NO2
–which may be accumulated in larger quantities under such conditions.
Benzene has a completely different impact on bacteria than commercial nitrification
inhibitors [1] which have a selective, toxic effect on phase I nitrifying bacteria and,
consequently, they do not lead to the excessive accumulation of NO2
–in the soil.
The results of this study indicate that benzene contamination upsets the soil
metabolic balance and has an adverse effect on nitrogen transformation. Benzene
harmful impact on the nitrification process was observed throughout the entire period of
the experiment, but it was alleviated towards the end of the study as benzene is
biodegradable under both aerobic and anaerobic conditions [13–16]. In an aerobic
environment, benzene is transformed by oxygenases into phenol or catechol, while in an
anaerobic environment it is reduced and hydroxylated to phenol carboxylated to
benzoate or methylated to toluene [14].
Benzene toxic effect on nitrifying bacteria and soil nitrifying activity was similar to
that exerted by fluorene [10], anthracene, phenanthrene [20], benzopyrene and chrysene
[21]. Similarly to benzene, fluorene inhibitory effect on the nitrification process was
also reduced over time.
Conclusions
1. Soil contamination with benzene in quantities exceeding 250 mm3
kg–1
d.m. soil
may inhibit the nitrification process.
2. The highest benzene concentrations (1000 mm3
kg–1
) in soil reduced the
populations of phase II nitrifying bacteria 38-fold and lowered the soil nitrifying
activity 3.6-fold.
968 Jan Kucharski et al
Fig. 3. Effect of benzene dose on the number of II phase nitrifying bacteria in 1 kg d.m. of soil (MPN 105)
250
500
750
1000 mm benzene3
7 14 21 28 7 14 21 28
without (NH ) SO4 2 4 with (NH ) SO4 2 4
Soil incubation time [days]
300
250
200
150
100
50
0
MP
N
3. Benzene has a more toxic effect on phase II than phase I nitrifying bacteria. The
above contributes to the harmful impact of this hydrocarbon on soil microorganisms –
by creating an environment conducive to the accumulation of NO2
–ions, benzene has
a destructive influence on many bacteria.
References
[1] Fillery J.R.P.: Plant Soil 2007, 294, 1–7.
[2] De Boer and Kowalchuk G.A.: Soil Biol. Biochem. 2001, 33, 853–866.
[3] Islam A., Chen D., and White R.E.: Soil Biol. Biochem. 2007, 39, 972–975.
[4] Mathieu O., Henault C., Leveque J., Baujard E., Milloux M.J. and Andreux F.: Environ. Pollut. 2006,
144, 933–940.
[5] Meyer R.L., Allen D.E. and Schmidt S.: Marine Chem. 2008, 110, 68–76.
[6] Sauve S., Dumestre A., McBride M., Gillett J.W., Berthelin J. and Hendershot W.: Appl. Soil Ecol.
1999, 12, 29–39.
[7] Wyszkowska J., Kucharski M. and Kucharski J.: Ekol. Techn. 2008, 16, 195–200.
[8] Kara E.E., Arli M. and Uygur V.: Biol. Fertil. Soils 2004, 39, 474–478.
[9] Kucharski J., Jastrzêbska E. and Wyszkowska J.: Acta Agrar.. Silv., Ser. Agrar. 2004, 42, 249–255.
[10] Kucharski J., Wyszkowska J. and Borowik A.: Roczn. Glebozn. 2008, 59, 147–153.
[11] Ezquerro O., Ortiz G., Pons B. and Tena M.T.: J. Chromatogr. 2004, 1035, 17–22.
[12] Kim S.B., Ha H.C., Choi N.C. and Kim D.J.: Hydrol. Proces. 2006, 20, 4307–4316.
[13] Kim J.M., Le N.T., Chung B.S., Park J.H., Bae J.W., Madsen E.L. and Jeon C.O.: Appl. Environ.
Microbiol. 2008, 74, 7313–7320.
[14] Tan N.N.C.G., Van Doesburg W., Langenhoff A.A.M. and Stams A.J. M.: Biodegradation 2006, 10,
11–17.
[15] Genovese M., Denaro R., Cappello S., Marco D.G., Spada G.L., Giuliano L., Genovese L. and Yakimow
M.M.: J. Appl. Mircobiol. 2008, 105, 1694–1702.
[16] Franzmann P.D., Zappia L.R., Power T.R., Davis G.B. and Patterson B.M.: FEMS Microbiol. Ecol.
1999, 30, 67–76.
[17] PN-77 C-04615/20. Water and sewage. Microbiological tests. Determination of autotrophic nitrifying
bacteria in liquid medium cultures (in Polish).
[18] Kandeler E.: Nitrification during long-term incubation, [in:] Schinner F., Ohlinger R., Kandeler E. and
Margesin R. (eds), Methods in soil biology, Springer-Verlag, Berlin–Heidelberg, Germany 1996,
149–151.
[19] StatSoft, Inc.: STATISTICA (data analysis software system), 2006, version 7.1. www.statsoft.com.
[20] Barajas-Aceves M., Vera-Aguilar E. and Bernal M.P.: Biosour. Technol. 2002, 85, 217–223.
[21] Cervelli S., Di Giovanni F., Perna C. and Perret D.: Water, Air, Soil Pollut. 2000, 124, 125–139.
PROCES NITRYFIKACJI W GLEBIE ZANIECZYSZCZONEJ BENZENEM
Katedra Mikrobiologii, Uniwersytet Warmiñsko-Mazurski w Olsztynie
Abstrakt: W doœwiadczeniu laboratoryjnym badano wp³yw zanieczyszczenia gliny lekkiej benzenem
w dawkach: 0, 250, 500, 750 i 1000 mm3
� kg–1
s.m. gleby na przebieg procesu nitryfikacji. Przez 28 dni
w odstêpach 7-dniowych oznaczano zawartoœæ N-NH4
+i N-NO3
–w glebie. Okreœlano tak¿e aktywnoœæ
nitryfikacyjn¹ gleby oraz miano (NPL) bakterii nitryfikacyjnych.
Stwierdzono, ¿e zanieczyszczenie gleby benzenem w iloœciach wiêkszych od 250 mm3
� kg–1
s.m. gleby
powoduje zak³ócenia w przebiegu procesu nitryfikacji. Najwiêksze zanieczyszczenie gleby benzenem (1000
mm3
� kg–1
) 38-krotnie zmniejsza³o liczebnoœæ bakterii II fazy nitryfikacji i 3,6-krotnie obni¿a³o aktywnoœæ
nitryfikacyjn¹ gleby. Benzen okaza³ siê bardziej toksyczny dla bakterii II fazy nitryfikacji ni¿ dla bakterii
I fazy, co w przypadku zanieczyszczenia nim gleby mo¿e doprowadziæ do nadmiernej kumulacji NO2
–.
S³owa kluczowe: benzen, nitryfikacja, bakterie nitryfikacyjne, aktywnoœæ nitryfikacyjna
Nitrification Process in Soil Contaminated with Benzene 969

Miros³aw ORZECHOWSKI1
MINERALIZATION OF ORGANIC NITROGEN COMPOUNDS
IN ALLUVIAL AND DELUVIAL SOILS
OF MORAINIC, RIVERINE AND DELTA LANDSCAPES
MINERALIZACJA ORGANICZNYCH ZWI¥ZKÓW AZOTU
W GLEBACH NAP£YWOWYCH OBSZARÓW M£ODOGLACJALNYCH
W KRAJOBRAZIE MORENOWYM DOLIN RZECZNYCH I DELTOWYM
Abstract: The process of mineralization of organic nitrogen compounds in alluvial and deluvial soils of
morainic, riverine and delta landscapes was studied. The research was carried out in autumn 2008, after
growing season. Inorganic nitrogen compounds were determined by adding 1 % K2SO4 after incubation of soil
samples. Furthermore, the redox potential (Eh) and the oxygen diffusion rate (ODR) were measured and rH
factor was calculated. The results show that the most beneficial soil-site conditions for the mineralization of
organic nitrogen compounds are in deluvial soils in the landscape of lakeland hills. In these soils the amount
of nitrogen compounds converted to inorganic forms was the highest and the content of N-NO3 was low and
medium according to the established standards. The value of Eh potential amounted to 390 mV and the
oxygen diffusion rate to 74.2 �g m–2
s–1
. The N-NO3:N-NH4 ratio exceeded 1.0. In surface horizons of alluvial
soils of riverine and delta landscapes, despite higher quantities of organic matter and total nitrogen than in
deluvial soils, the amounts of inorganic nitrogen compounds were similar. In subsurface horizons of alluvial
soils, small amounts of inorganic nitrogen compounds were released and the N-NO3:N-NH4 ratio was below
one. Different site conditions, in which process of mineralization of organic nitrogen compounds took place,
led to statistically significant differences between deluvial and alluvial soils, taking into consideration the
content of N-NO3 and the sum of N-NO3 and N-NH4.
Keywords: alluvial soils, deluvial soils, nitrates, ammonium, morainic landscape, riverine landscape, delta
landscape
The land relief of young glacial region of northern Poland was shaped during the
Vistula glaciation. The soil cover was formed in postglacial period and was protected by
natural forest vegetation. The development of agriculture caused changes in land use
and intensification of anthropogenic denudation processes [1, 2]. Deluvial and alluvial
E C O L O G I C A L C H E M I S T R Y A N D E N G I N E E R I N G A
Vol. 16, No. 8 2009
1Department of Soil Science and Soil Protection, Faculty of Environmental Management and Agriculture,
University Warmia and Mazury in Olsztyn, pl. £ódzki 3, 10–719 Olsztyn, Poland, phone 89 523 48 46, email:
soils were formed by the slope and riverine holocene deposits. These soils are situated
in local depressions and in river valleys and therefore play an important role in the
circulation and transformation of biogens. In catena sequence, deluvial soils occur at the
foot of the slope between eroded soils on the slope and soils in depression. These soils
play a role as biogeochemical barriers and are important in environmental protection. It
should be stressed that deluvial and alluvial deposits often cover organic soils occurring
in depressions and diminish the rate of organic matter mineralization [3, 4].
Research on mineralization of nitrogen compounds in peat-muck soils is widespread
in the literature [5–9]. However studies concerning transformations of nitrogen
compounds in mineral and organic-mineral soils are rare [10, 11]. In the process of
mineralization of organic matter, which rate depends on the range of site factors, large
quantities of nitrates (N-NO3) and ammonium (N-NH4) may be released [5]. The
nitrate-nitrogen that is not uptaken by plants, may infiltrate and contaminate ground-
water after growing season as well as when the amount of N-NO3 in the soil exceeds
plant needs [8, 11, 12].
Taking into consideration an important role of alluvial and deluvial soils in the
process of transformation of nitrogen compounds and the range of site factors affecting
this process, the research should be carried out with regard to various soil-site
conditions [7, 9, 10, 13]. The aim of the paper was to study the process of
mineralization of organic nitrogen compounds in alluvial and deluvial soils of morainic,
riverine and delta landscapes of north-eastern Poland.
Materials and methods
The research was carried out in alluvial and deluvial soils of young glacial
landscapes of north-eastern Poland using catena approach. The soils of the following
landscapes: morainic hills and plains, lakeland hills, riverine and delta were chosen [14,
15]. In the landscape of morainic hills and plains, comprising Sepopol Plain and small
area of Mazurian Lakeland, Troksy site is located. In the landscape of lakeland hills,
comprising major part of Mazurian Lakeland, Lutry, Nawiady and Linowo sites are
situated. In delta landscape, at Vistula and Pasleka estuary, Jeglownik and Braniewo
sites are located. In riverine landscape, at Olsztyn Lakeland and Sepopol Plain,
Rownina Gorna and Smolajny sites were chosen.
The results of the analysis of mineralization of organic nitrogen compounds in
studied soils, regarding site conditions, are shown in chosen, representative pedons
(Table 1, 2). Whereas in Table 3 and 4, the content of inorganic nitrogen compounds as
well as mean values are presented for each horizon of studied soils.
The process of mineralization of nitrogen compounds was examined in autumn 2008
(at the turn of November and December), after growing season. In collected soil
samples the following properties were analyzed: texture of mineral formations by
hydrometer method of Casagrande modified by Proszyñski, soil reaction in water and
potassium chloride, potentiometrically, moisture content during sampling after drying to
constant weight at 105oC, soil specific density of mineral formations by pycnometric
972 Miros³aw Orzechowski
method, soil specific density of organic formations by calculation according to the
formula suggested by Okruszko [16]:
SD = 0.011 × A + 1.451
SD – specific density; A – ash content, after dry ashing of soil samples at a temperature
of 550oC.
Bulk density and total porosity were determined in a 100 cm3
undisturbed core
sample. Humus content was measured by the Tiurin method and total nitrogen by the
Kjeldahl method. For the analysis of inorganic nitrogen compounds (N-NO3 and
N-NH4), undisturbed soil samples in 100 cm3
cores were used. Nitrogen compounds
were determined in an extract of 1 % K2SO4 after 14-day incubation of soil samples at a
temerature of 28oC. For N-NO3 determination, phenol disulphonic acid was used and
for N-NH4, Nessler’s reagent was applied [5]. Furthermore, the redox potential (Eh) and
the oxygen diffusion rate (ODR) were measured and rH factor was calculated on the
base of redox potential Eh and soil reaction according to the formula:
rH = (Eh x 29–1
) + 2pH.
Statistical analyses were conducted using Statistica 8.0. The significance tests and
correlation analyses were applied [17].
Results
Landscape of morainic hills and plains
In the landscape of morainic hills and plains, land denivelation and the erosion risk
are low. At Troksy site, humous deluvial soils, shallow and of medium depth, which
evolved from eroded black earths occur. They are used as arable fields. The soils were
developed from heavy loam and among all studied soils contained the highest amounts
of clay (� < 0.002 mm), ranging between 28 % and 32 %. The amount of organic
matter varied between 75.5 g � kg–1
and 99.0 g � kg–1
(Table 1). The groundwater level
was high, at a depth of 0.68 m. The content of air in Ap horizon was low and amounted
to 7.3 %, value of Eh potential did not exceed 300 mV (280 mV) and the oxygen
diffusion rate (ODR) was below 70 �g � m–2
� s–1
amounting to 51.2 �g � m–2
� s–1
(Table 2). The values of the analyzed factors suggest bad air conditions in the soils
(predominance of reduction processes). Despite high content of organic matter, the
amounts of nitrogen compounds released in deluvial deposits were small and amounted
to 9.35–9.08 mg � kg–1
. In deluvial soils, in autumn 2004, the amount of released
ammonium was higher [10]. More ammonium was released in peat lying underneath (on
average 22.75 mg � kg–1
).
The N-NO3:N-NH4 ratio is an indicator of the conditions of organic matter
mineralisation. It can be concluded that in studied soils beneficial conditions for
nitrification were in Ap horizon, where the ratio was equal to 2.41. In subsurface
horizons this ratio was below 1.0.
Mineralization of Organic Nitrogen Compounds in Alluvial and Deluvial Soils... 973
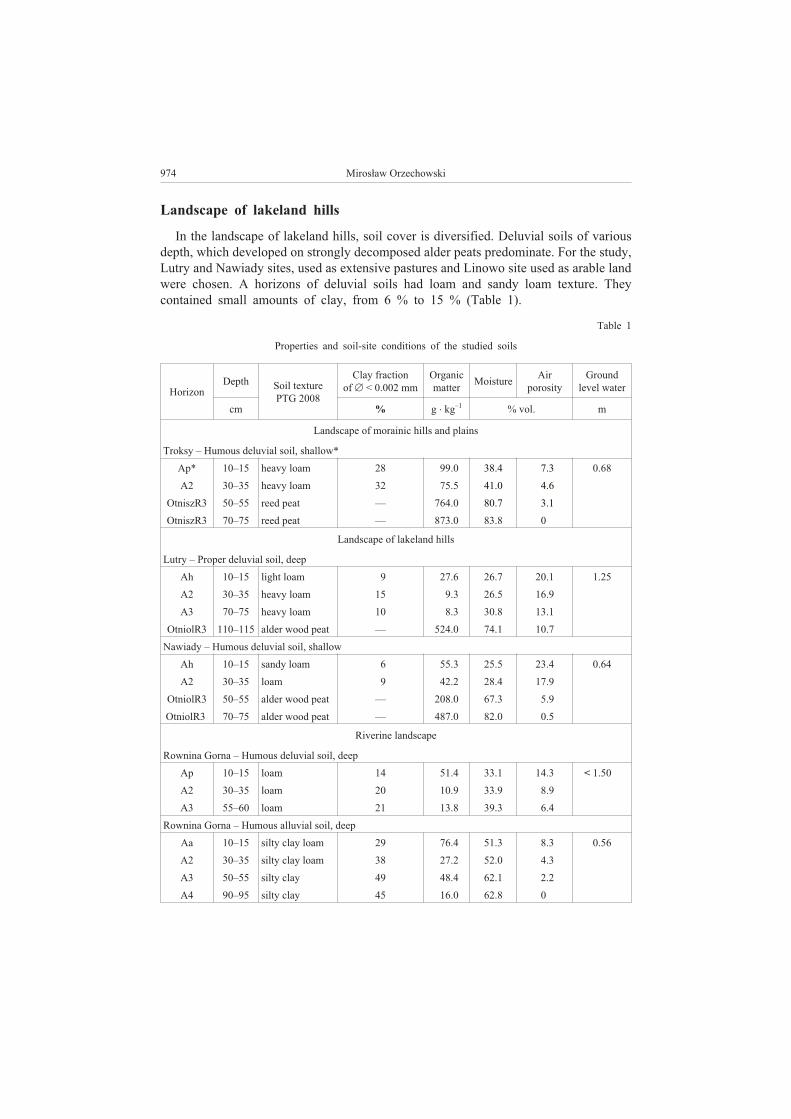
Landscape of lakeland hills
In the landscape of lakeland hills, soil cover is diversified. Deluvial soils of various
depth, which developed on strongly decomposed alder peats predominate. For the study,
Lutry and Nawiady sites, used as extensive pastures and Linowo site used as arable land
were chosen. A horizons of deluvial soils had loam and sandy loam texture. They
contained small amounts of clay, from 6 % to 15 % (Table 1).
Table 1
Properties and soil-site conditions of the studied soils
Horizon
DepthSoil texture
PTG 2008
Clay fraction
of � < 0.002 mm
Organic
matterMoisture
Air
porosity
Ground
level water
cm % g � kg–1
% vol. m
Landscape of morainic hills and plains
Troksy – Humous deluvial soil, shallow*
Ap* 10–15 heavy loam 28 99.0 38.4 7.3 0.68
A2 30–35 heavy loam 32 75.5 41.0 4.6
OtniszR3 50–55 reed peat — 764.0 80.7 3.1
OtniszR3 70–75 reed peat — 873.0 83.8 0
Landscape of lakeland hills
Lutry – Proper deluvial soil, deep
Ah 10–15 light loam 9 27.6 26.7 20.1 1.25
A2 30–35 heavy loam 15 9.3 26.5 16.9
A3 70–75 heavy loam 10 8.3 30.8 13.1
OtniolR3 110–115 alder wood peat — 524.0 74.1 10.7
Nawiady – Humous deluvial soil, shallow
Ah 10–15 sandy loam 6 55.3 25.5 23.4 0.64
A2 30–35 loam 9 42.2 28.4 17.9
OtniolR3 50–55 alder wood peat — 208.0 67.3 5.9
OtniolR3 70–75 alder wood peat — 487.0 82.0 0.5
Riverine landscape
Rownina Gorna – Humous deluvial soil, deep
Ap 10–15 loam 14 51.4 33.1 14.3 < 1.50<
A2 30–35 loam 20 10.9 33.9 8.9
A3 55–60 loam 21 13.8 39.3 6.4
Rownina Gorna – Humous alluvial soil, deep
Aa 10–15 silty clay loam 29 76.4 51.3 8.3 0.56
A2 30–35 silty clay loam 38 27.2 52.0 4.3
A3 50–55 silty clay 49 48.4 62.1 2.2
A4 90–95 silty clay 45 16.0 62.8 0
974 Miros³aw Orzechowski
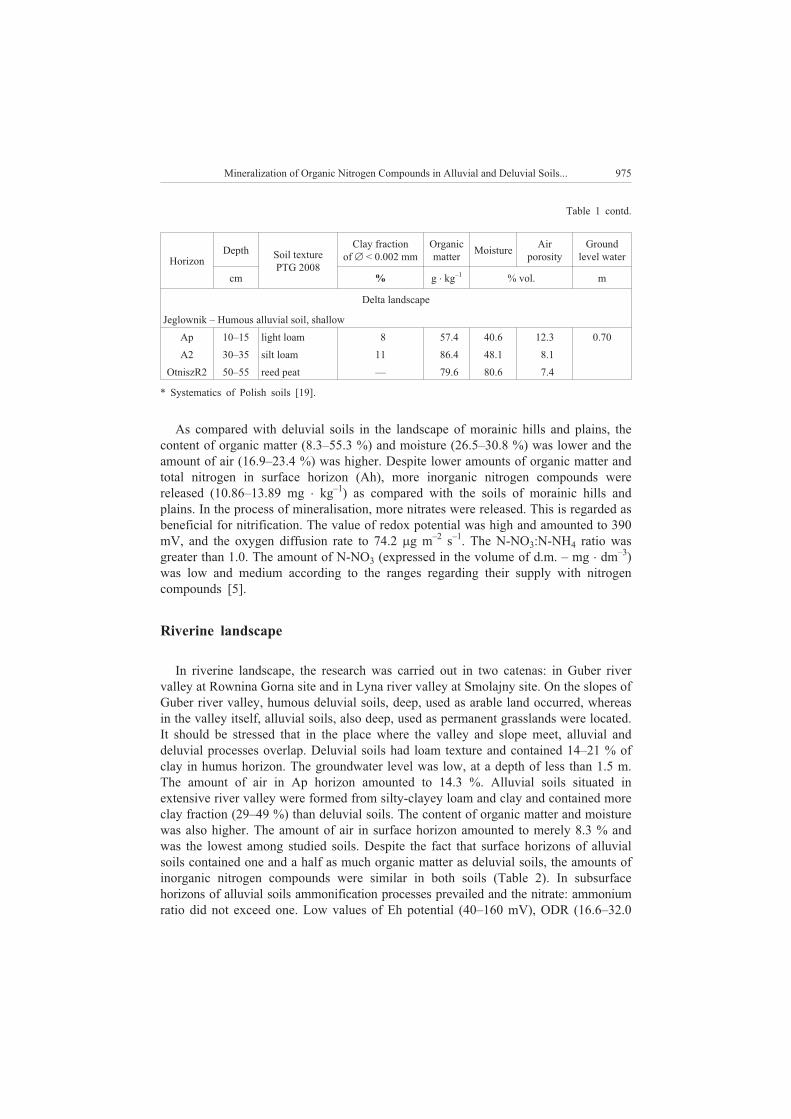
Horizon
DepthSoil texture
PTG 2008
Clay fraction
of � < 0.002 mm
Organic
matterMoisture
Air
porosity
Ground
level water
cm % g � kg–1
% vol. m
Delta landscape
Jeglownik – Humous alluvial soil, shallow
Ap 10–15 light loam 8 57.4 40.6 12.3 0.70
A2 30–35 silt loam 11 86.4 48.1 8.1
OtniszR2 50–55 reed peat — 79.6 80.6 7.4
* Systematics of Polish soils [19].
As compared with deluvial soils in the landscape of morainic hills and plains, the
content of organic matter (8.3–55.3 %) and moisture (26.5–30.8 %) was lower and the
amount of air (16.9–23.4 %) was higher. Despite lower amounts of organic matter and
total nitrogen in surface horizon (Ah), more inorganic nitrogen compounds were
released (10.86–13.89 mg � kg–1
) as compared with the soils of morainic hills and
plains. In the process of mineralisation, more nitrates were released. This is regarded as
beneficial for nitrification. The value of redox potential was high and amounted to 390
mV, and the oxygen diffusion rate to 74.2 �g m–2
s–1
. The N-NO3:N-NH4 ratio was
greater than 1.0. The amount of N-NO3 (expressed in the volume of d.m. – mg � dm–3
)
was low and medium according to the ranges regarding their supply with nitrogen
compounds [5].
Riverine landscape
In riverine landscape, the research was carried out in two catenas: in Guber river
valley at Rownina Gorna site and in Lyna river valley at Smolajny site. On the slopes of
Guber river valley, humous deluvial soils, deep, used as arable land occurred, whereas
in the valley itself, alluvial soils, also deep, used as permanent grasslands were located.
It should be stressed that in the place where the valley and slope meet, alluvial and
deluvial processes overlap. Deluvial soils had loam texture and contained 14–21 % of
clay in humus horizon. The groundwater level was low, at a depth of less than 1.5 m.
The amount of air in Ap horizon amounted to 14.3 %. Alluvial soils situated in
extensive river valley were formed from silty-clayey loam and clay and contained more
clay fraction (29–49 %) than deluvial soils. The content of organic matter and moisture
was also higher. The amount of air in surface horizon amounted to merely 8.3 % and
was the lowest among studied soils. Despite the fact that surface horizons of alluvial
soils contained one and a half as much organic matter as deluvial soils, the amounts of
inorganic nitrogen compounds were similar in both soils (Table 2). In subsurface
horizons of alluvial soils ammonification processes prevailed and the nitrate: ammonium
ratio did not exceed one. Low values of Eh potential (40–160 mV), ODR (16.6–32.0
Mineralization of Organic Nitrogen Compounds in Alluvial and Deluvial Soils... 975
Table 1 contd.
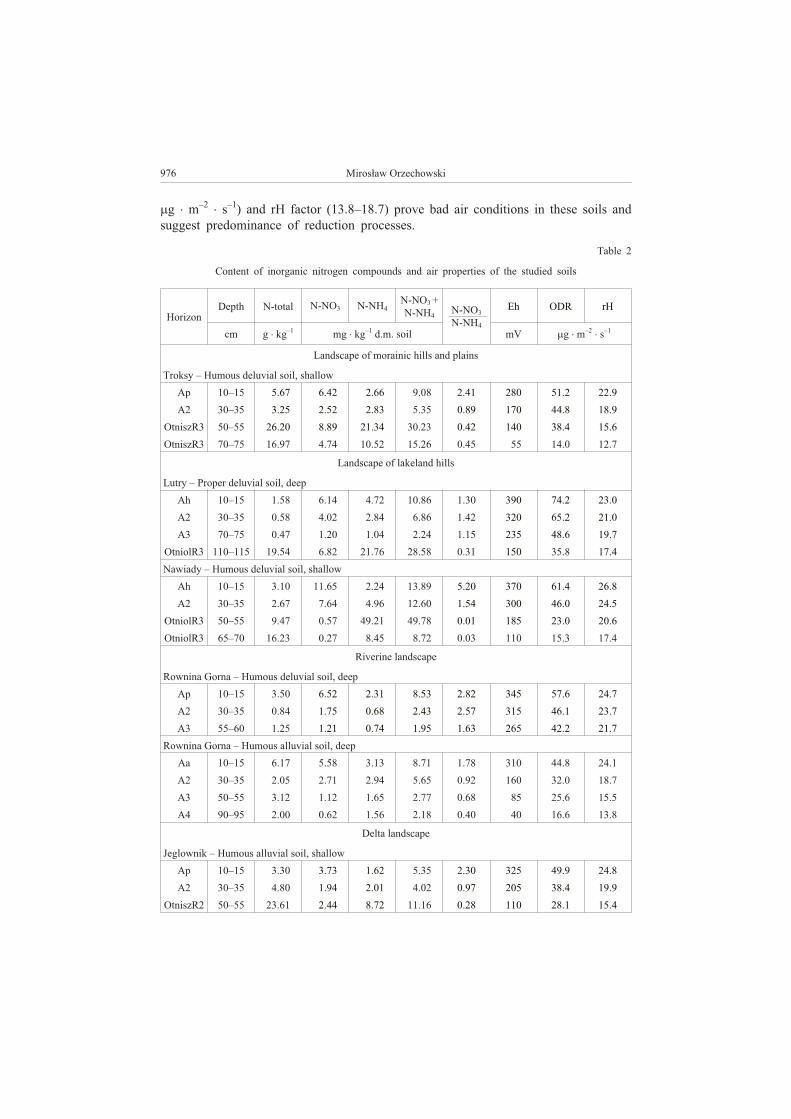
�g � m–2
� s–1
) and rH factor (13.8–18.7) prove bad air conditions in these soils and
suggest predominance of reduction processes.
Table 2
Content of inorganic nitrogen compounds and air properties of the studied soils
Horizon
Depth N-total N-NO3 N-NH4
N-NO3 +
N-NH4N-NO3
N-NH4
Eh ODR rH
cm g � kg–1
mg � kg–1
d.m. soil mV �g � m–2
� s–1
Landscape of morainic hills and plains
Troksy – Humous deluvial soil, shallow
Ap 10–15 5.67 6.42 2.66 9.08 2.41 280 51.2 22.9
A2 30–35 3.25 2.52 2.83 5.35 0.89 170 44.8 18.9
OtniszR3 50–55 26.20 8.89 21.34 30.23 0.42 140 38.4 15.6
OtniszR3 70–75 16.97 4.74 10.52 15.26 0.45 55 14.0 12.7
Landscape of lakeland hills
Lutry – Proper deluvial soil, deep
Ah 10–15 1.58 6.14 4.72 10.86 1.30 390 74.2 23.0
A2 30–35 0.58 4.02 2.84 6.86 1.42 320 65.2 21.0
A3 70–75 0.47 1.20 1.04 2.24 1.15 235 48.6 19.7
OtniolR3 110–115 19.54 6.82 21.76 28.58 0.31 150 35.8 17.4
Nawiady – Humous deluvial soil, shallow
Ah 10–15 3.10 11.65 2.24 13.89 5.20 370 61.4 26.8
A2 30–35 2.67 7.64 4.96 12.60 1.54 300 46.0 24.5
OtniolR3 50–55 9.47 0.57 49.21 49.78 0.01 185 23.0 20.6
OtniolR3 65–70 16.23 0.27 8.45 8.72 0.03 110 15.3 17.4
Riverine landscape
Rownina Gorna – Humous deluvial soil, deep
Ap 10–15 3.50 6.52 2.31 8.53 2.82 345 57.6 24.7
A2 30–35 0.84 1.75 0.68 2.43 2.57 315 46.1 23.7
A3 55–60 1.25 1.21 0.74 1.95 1.63 265 42.2 21.7
Rownina Gorna – Humous alluvial soil, deep
Aa 10–15 6.17 5.58 3.13 8.71 1.78 310 44.8 24.1
A2 30–35 2.05 2.71 2.94 5.65 0.92 160 32.0 18.7
A3 50–55 3.12 1.12 1.65 2.77 0.68 85 25.6 15.5
A4 90–95 2.00 0.62 1.56 2.18 0.40 40 16.6 13.8
Delta landscape
Jeglownik – Humous alluvial soil, shallow
Ap 10–15 3.30 3.73 1.62 5.35 2.30 325 49.9 24.8
A2 30–35 4.80 1.94 2.01 4.02 0.97 205 38.4 19.9
OtniszR2 50–55 23.61 2.44 8.72 11.16 0.28 110 28.1 15.4
976 Miros³aw Orzechowski
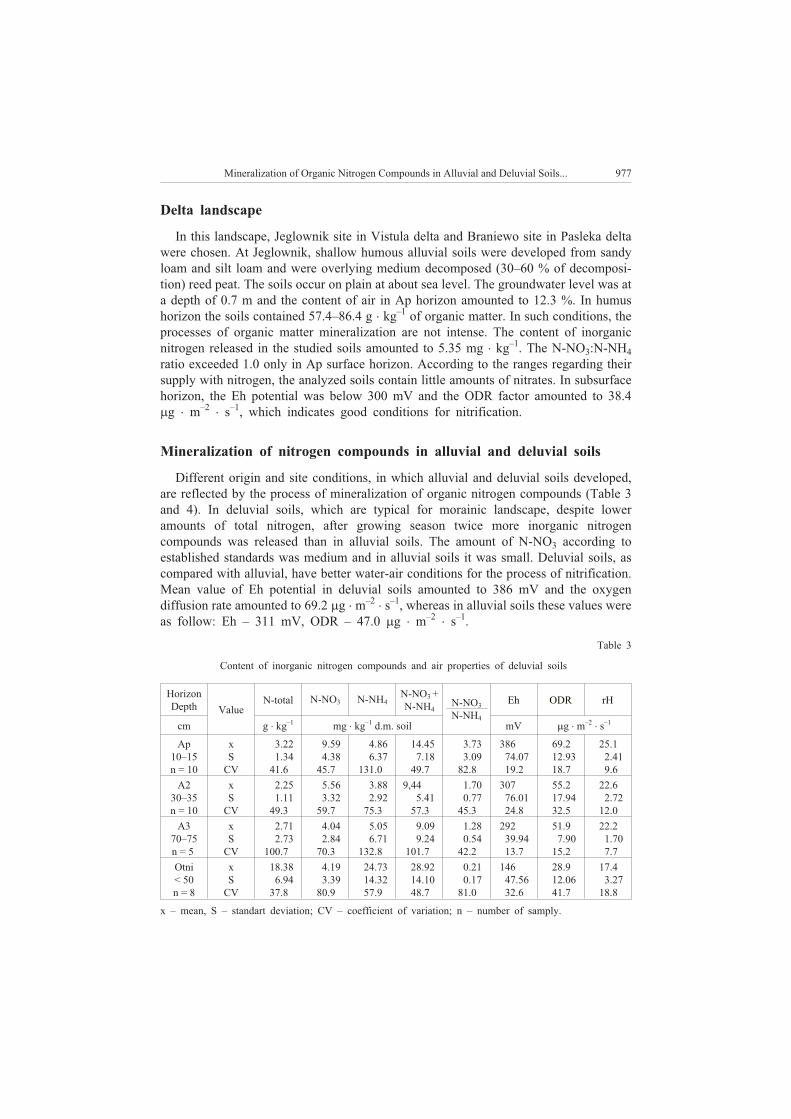
Delta landscape
In this landscape, Jeglownik site in Vistula delta and Braniewo site in Pasleka delta
were chosen. At Jeglownik, shallow humous alluvial soils were developed from sandy
loam and silt loam and were overlying medium decomposed (30–60 % of decomposi-
tion) reed peat. The soils occur on plain at about sea level. The groundwater level was at
a depth of 0.7 m and the content of air in Ap horizon amounted to 12.3 %. In humus
horizon the soils contained 57.4–86.4 g � kg–1
of organic matter. In such conditions, the
processes of organic matter mineralization are not intense. The content of inorganic
nitrogen released in the studied soils amounted to 5.35 mg � kg–1
. The N-NO3:N-NH4
ratio exceeded 1.0 only in Ap surface horizon. According to the ranges regarding their
supply with nitrogen, the analyzed soils contain little amounts of nitrates. In subsurface
horizon, the Eh potential was below 300 mV and the ODR factor amounted to 38.4
�g � m–2
� s–1
, which indicates good conditions for nitrification.
Mineralization of nitrogen compounds in alluvial and deluvial soils
Different origin and site conditions, in which alluvial and deluvial soils developed,
are reflected by the process of mineralization of organic nitrogen compounds (Table 3
and 4). In deluvial soils, which are typical for morainic landscape, despite lower
amounts of total nitrogen, after growing season twice more inorganic nitrogen
compounds was released than in alluvial soils. The amount of N-NO3 according to
established standards was medium and in alluvial soils it was small. Deluvial soils, as
compared with alluvial, have better water-air conditions for the process of nitrification.
Mean value of Eh potential in deluvial soils amounted to 386 mV and the oxygen
diffusion rate amounted to 69.2 �g � m–2
� s–1
, whereas in alluvial soils these values were
as follow: Eh – 311 mV, ODR – 47.0 �g � m–2
� s–1
.
Table 3
Content of inorganic nitrogen compounds and air properties of deluvial soils
Horizon
Depth Value
N-total N-NO3 N-NH4
N-NO3 +
N-NH4N-NO3
N-NH4
Eh ODR rH
cm g � kg–1
mg � kg–1
d.m. soil mV �g � m–2
� s–1
Ap
10–15
n = 10
x
S
CV
3.22
1.34
41.6
9.59
4.38
45.7
4.86
6.37
131.0
14.45
7.18
49.7
3.73
3.09
82.8
386
74.07
19.2
69.2
12.93
18.7
25.1
2.41
9.6
A2
30–35
n = 10
x
S
CV
2.25
1.11
49.3
5.56
3.32
59.7
3.88
2.92
75.3
9,44
5.41
57.3
1.70
0.77
45.3
307
76.01
24.8
55.2
17.94
32.5
22.6
2.72
12.0
A3
70–75
n = 5
x
S
CV
2.71
2.73
100.7
4.04
2.84
70.3
5.05
6.71
132.8
9.09
9.24
101.7
1.28
0.54
42.2
292
39.94
13.7
51.9
7.90
15.2
22.2
1.70
7.7
Otni
< 50
n = 8
x
S
CV
18.38
6.94
37.8
4.19
3.39
80.9
24.73
14.32
57.9
28.92
14.10
48.7
0.21
0.17
81.0
146
47.56
32.6
28.9
12.06
41.7
17.4
3.27
18.8
x – mean, S – standart deviation; CV – coefficient of variation; n – number of samply.
Mineralization of Organic Nitrogen Compounds in Alluvial and Deluvial Soils... 977
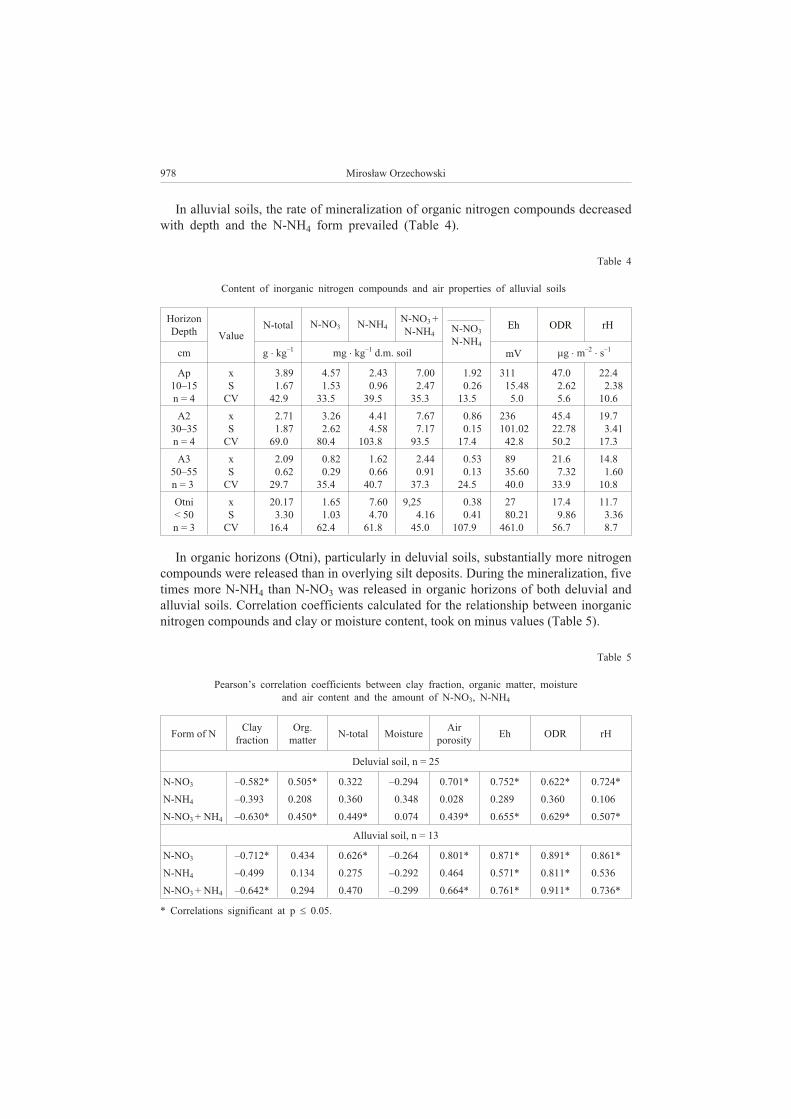
In alluvial soils, the rate of mineralization of organic nitrogen compounds decreased
with depth and the N-NH4 form prevailed (Table 4).
Table 4
Content of inorganic nitrogen compounds and air properties of alluvial soils
Horizon
DepthValue
N-total N-NO3 N-NH4
N-NO3 +
N-NH4N-NO3
N-NH4
Eh ODR rH
cm g � kg–1
mg � kg–1
d.m. soil mV �g � m–2
� s–1
Ap
10–15
n = 4
x
S
CV
3.89
1.67
42.9
4.57
1.53
33.5
2.43
0.96
39.5
7.00
2.47
35.3
1.92
0.26
13.5
311
15.48
5.0
47.0
2.62
5.6
22.4
2.38
10.6
A2
30–35
n = 4
x
S
CV
2.71
1.87
69.0
3.26
2.62
80.4
4.41
4.58
103.8
7.67
7.17
93.5
0.86
0.15
17.4
236
101.02
42.8
45.4
22.78
50.2
19.7
3.41
17.3
A3
50–55
n = 3
x
S
CV
2.09
0.62
29.7
0.82
0.29
35.4
1.62
0.66
40.7
2.44
0.91
37.3
0.53
0.13
24.5
89
35.60
40.0
21.6
7.32
33.9
14.8
1.60
10.8
Otni
< 50
n = 3
x
S
CV
20.17
3.30
16.4
1.65
1.03
62.4
7.60
4.70
61.8
9,25
4.16
45.0
0.38
0.41
107.9
27
80.21
461.0
17.4
9.86
56.7
11.7
3.36
8.7
In organic horizons (Otni), particularly in deluvial soils, substantially more nitrogen
compounds were released than in overlying silt deposits. During the mineralization, five
times more N-NH4 than N-NO3 was released in organic horizons of both deluvial and
alluvial soils. Correlation coefficients calculated for the relationship between inorganic
nitrogen compounds and clay or moisture content, took on minus values (Table 5).
Table 5
Pearson’s correlation coefficients between clay fraction, organic matter, moisture
and air content and the amount of N-NO3, N-NH4
Form of NClay
fraction
Org.
matterN-total Moisture
Air
porosityEh ODR rH
Deluvial soil, n = 25
N-NO3 –0.582* 0.505* 0.322* –0.294 0.701* 0.752* 0.622* 0.724*
N-NH4 –0.393* 0.208* 0.360* 0.348 0.028* 0.289* 0.360* 0.106*
N-NO3 + NH4 –0.630* 0.450* 0.449* 0.074 0.439* 0.655* 0.629* 0.507*
Alluvial soil, n = 13
N-NO3 –0.712* 0.434 0.626* –0.264 0.801* 0.871* 0.891* 0.861*
N-NH4 –0.499* 0.134 0.275* –0.292 0.464* 0.571* 0.811* 0.536*
N-NO3 + NH4 –0.642* 0.294 0.470* –0.299 0.664* 0.761* 0.911* 0.736*
* Correlations significant at p � 0.05.
978 Miros³aw Orzechowski
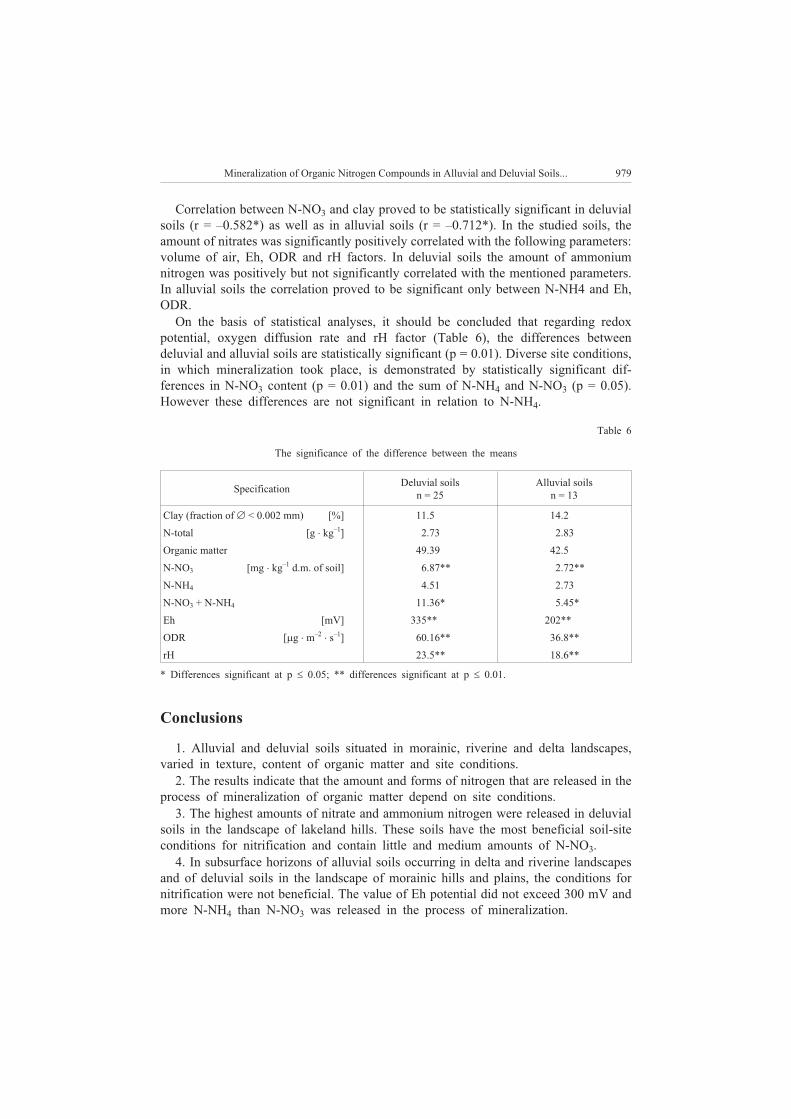
Correlation between N-NO3 and clay proved to be statistically significant in deluvial
soils (r = –0.582*) as well as in alluvial soils (r = –0.712*). In the studied soils, the
amount of nitrates was significantly positively correlated with the following parameters:
volume of air, Eh, ODR and rH factors. In deluvial soils the amount of ammonium
nitrogen was positively but not significantly correlated with the mentioned parameters.
In alluvial soils the correlation proved to be significant only between N-NH4 and Eh,
ODR.
On the basis of statistical analyses, it should be concluded that regarding redox
potential, oxygen diffusion rate and rH factor (Table 6), the differences between
deluvial and alluvial soils are statistically significant (p = 0.01). Diverse site conditions,
in which mineralization took place, is demonstrated by statistically significant dif-
ferences in N-NO3 content (p = 0.01) and the sum of N-NH4 and N-NO3 (p = 0.05).
However these differences are not significant in relation to N-NH4.
Table 6
The significance of the difference between the means
SpecificationDeluvial soils
n = 25
Alluvial soils
n = 13
Clay (fraction of � < 0.002 mm) [%] 11.5 14.2
N-total [g � kg–1
] 2.73 2.83
Organic matter 49.39 42.5
N-NO3 [mg � kg–1
d.m. of soil] 6.87** 2.72**
N-NH4 4.51 2.73
N-NO3 + N-NH4 11.36* 5.45*
Eh [mV] 335** 202**
ODR [�g � m–2
� s–1
] 60.16** 36.8**
rH 23.5** 18.6**
* Differences significant at p � 0.05; ** differences significant at p � 0.01.
Conclusions
1. Alluvial and deluvial soils situated in morainic, riverine and delta landscapes,
varied in texture, content of organic matter and site conditions.
2. The results indicate that the amount and forms of nitrogen that are released in the
process of mineralization of organic matter depend on site conditions.
3. The highest amounts of nitrate and ammonium nitrogen were released in deluvial
soils in the landscape of lakeland hills. These soils have the most beneficial soil-site
conditions for nitrification and contain little and medium amounts of N-NO3.
4. In subsurface horizons of alluvial soils occurring in delta and riverine landscapes
and of deluvial soils in the landscape of morainic hills and plains, the conditions for
nitrification were not beneficial. The value of Eh potential did not exceed 300 mV and
more N-NH4 than N-NO3 was released in the process of mineralization.
Mineralization of Organic Nitrogen Compounds in Alluvial and Deluvial Soils... 979
5. During mineralization of organic nitrogen compounds, twice more nitrates and
ammonium were released in deluvial soils than in alluvial soils.
Acknowledgement
This paper was financed from the financial resources of the years 2007–2009 as research project, No
N N305 2776 33.
References
[1] Sienkiewicz M.: Rozwój denudacji antropogenicznej w œrodkowej czêœci Polski Pó³nocnej. UM, Toruñ
1998, 103.
[2] Starkel L.: Przegl. Geograf. 1988, 60(3), 251–265.
[3] Bieniek B.: W³aœciwoœci i rozwój gleb nap³ywowych Pojezierza Mazurskiego. Acta Acad. Agricult.
Tech. Olst., Agricultura, Suppl. B, 1997, 64, 80.
[4] Orzechowski M., Smólczyñski S. and Sowiñski P.: Roczn. Glebozn. 2004, 55(2), 311–320.
[5] Gotkiewicz J.: Zró¿nicowanie intensywnoœci mineralizacja azotu w glebach organicznych zwi¹zane
z odrêbnoœci¹ warunków siedliskowych. Rozpr. habilit. IMUZ, Falenty 1983, 111.
[5] Gotkiewicz J.: Bibl. Wiad. IMUZ 1987, 68, 43–55.
[6] Gotkiewicz J.: Zesz. Probl. Post. Nauk Roln. 1996, 440, 121–129.
[7] Pawluczuk J.: Ann. UMCS, Sec. E, 2004, 59(2), 559–567.
[8] Maciak F.: Zesz. Probl. Post. Nauk Roln. 1977, 186, 119–142.
[9] Smólczyñski S.: Zesz. Probl. Post. Nauk Roln. 2006, 513, 413–421.
[9] Turbiak J. and Miatkowski Z.: Zesz. Probl. Post. Nauk Roln. 2006, 513, 507–513.
[10] Orzechowski M.: Zesz. Probl. Post. Nauk Roln. 2006, 513, 1285–292.
[11] Sapek B.: Zesz. Probl. Post. Nauk Roln. 1996, 440, 331–341.
[12] Gotkiewicz J. and Gotkiewicz M.: Bibl. Wiad. IMUZ 1987, 77, 59–76.
[13] Pawluczuk J.: Roczn. Glebozn. 2006, 59(1), 183–190.
[14] Kondracki J.: Geografia fizyczna Polski. PWN, Warszawa 1988, 463.
[15] Gotkiewicz J. and Smo³ucha J.: Zesz. Probl. Post. Nauk Roln. 1996, 331, 119–136.
[16] Okruszko H.: Wiad. IMUZ 1971, 10(1), 47–54.
[17] StatSoft, Inc.: 2007, STATISTICA, version 8.
[18] Smólczyñski S. and Orzechowski M.: Water-Environ.-Rural Area 2009, 9(1), 141–150.
[19] Systematyka gleb Polski. Roczn. Glebozn. 1989, 40(3/4), 150.
MINERALIZACJA ORGANICZNYCH ZWI¥ZKÓW AZOTU
W GLEBACH NAP£YWOWYCH OBSZARÓW M£ODOGLACJALNYCH
W KRAJOBRAZIE MORENOWYM DOLIN RZECZNYCH I DELTOWYM
Katedra Gleboznawstwa i Ochrony Gleb
Uniwersytet Warmiñsko-Mazurski w Olsztynie
Abstrakt: W glebach deluwialnych i aluwialnych w krajobrazie morenowym, dolin rzecznych i deltowym
badano przebieg procesu mineralizacji organicznych zwi¹zków azotu. Badania prowadzono jesieni¹ 2008 r.,
po zakoñczeniu wegetacji. Azot mineralny oznaczono po inkubacji w wyci¹gu glebowym 1 % K2SO4.
Ponadto wykonano pomiar potencja³u redoks (Eh), natê¿enia dyfuzji tlenu (ODR) i obliczono wskaŸnik rH.
Wyniki badañ wskazuj¹, ¿e najkorzystniejsze warunki siedliskowo-glebowe do przebiegu procesu
mineralizacji organicznych zwi¹zków azotu wystêpowa³y w glebach deluwialnych w krajobrazie pagór-
kowatym pojeziernym. W glebach tych uwalnia³o siê najwiêcej azotu mineralnego, wed³ug przyjêtych norm
zawartoœæ azotu N-NO3 by³a ma³a i œrednia. Wartoœæ potencja³u Eh dochodzi³a do 390 mV, a natê¿enia dyfuzji
tlenu do 74.2 �g � m–2
� s–1
. Stosunek azotu N-NO3:N-NH4 kszta³towa³ siê powy¿ej jednoœci. W poziomach
powierzchniowych gleb aluwialnych w krajobrazie dolin rzecznych i deltowym pomimo wiêkszej zawartoœæ
980 Miros³aw Orzechowski

materii organicznej i N-ogólnego ni¿ glebach deluwialnych, iloœci uwalnianych mineralnych form azotu by³y
zbli¿one. W poziomach podpowierzchniowych gleb aluwialnych uwalnia³y siê bardzo ma³e iloœci azotu
mineralnego, a stosunek azotu azotanowego do amonowego nie przekracza³ jednoœci. Zró¿nicowane warunki
siedliskowe, w których przebiega³y procesy mineralizacji zwi¹zków azotu, spowodowa³y, ¿e miêdzy glebach
deluwialnych i aluwialnych wstêpuj¹ statystycznie istotne ró¿nice w zawartoœæ azotu N-NO3 oraz sumy
N-NO3 + N-NH4.
S³owa kluczowe: gleby aluwialne, gleby deluwialne, azot azotanowy, azot amonowy, krajobraz morenowy,
dolin rzecznych, deltowy
Mineralization of Organic Nitrogen Compounds in Alluvial and Deluvial Soils... 981

Apolonia OSTROWSKA1
and Gra¿yna PORÊBSKA1
MINERAL COMPOSITION OF PLANTS
AS AN INDICATOR OF THEIR QUALITY
IN NITROGEN STRESS CONDITION
SK£AD MINERALNY ROŒLIN JAKO WSKA�NIK ICH JAKOŒCI
W WARUNKACH NADMIARU AZOTU W ŒRODOWISKU
Abstract: The aim of this paper is to determine: relationships between the size of yield and the use of
nitrogen necessary to its production for the assessment of N excess in the environment, and whether and to
what extent the mineral composition of yield may be used as an indicator of N excess and the quality of
yields. No correlation was found between the rye grain and potato tubers yield sizes and the content of N, P,
K, Ca and Mg in a mass unit. N excess in the rye growth environment elevated N accumulation in comparable
grain yields and leads to a disorder of between element relationships. N share in the sum of accumulated
elements was found to increase to above 75 %, and, in some drastic cases, to even more than 80 %. At the
same time, shares of the remaining elements were found to decline, in particular those of Ca and Mg.
A similar effect of soil N excess was found in potatoes. Plant mineral composition taking into account the
between element relationships may be used as an index of N excess in the environment and thus as an index of
plant quality with respect to qualitative-quantitative stream of mineral elements entering the trophic chain.
Keywords: rye, potatoes, yield, nitrogen, mineral composition
The effect of N excess on the forest environment has been dealt with by numerous
authors. The studies have focused, among other things, on establishing the so-called
critical N values for a given state of the environment [1–4], N metabolism in plants
[5–10], disorders of mineral composition in the tree foliage [2, 3, 11] as well as nitrate
leaching to surface and ground waters [12–15]. The effect of N excess on soils and
crops has been examined mainly from the view point of nitrate leaching to surface and
ground waters [16–18], although some studies dealt with the evaluation of N excess and
its effects within a definite natural space, eg farm holding, region [19].
Estimation of the effect of N or any other single element on soil and plant properties,
on the basis of either its uptake by plants, its metabolism or accumulation and
transformation in the soil, constitutes only a part in the evaluation of element flow
E C O L O G I C A L C H E M I S T R Y A N D E N G I N E E R I N G A
Vol. 16, No. 8 2009
1Institute of Environmental Protection, ul. Krucza 5/11, 00–548 Warszawa, Poland, phone 22 625 10 05
ext. 38, email: [email protected]
disturbances in the environment [10, 20, 21]. Disorders of relations between elements
resulting from the input of specific elements (deposition, waste, fertilizers) at the level
of primary production project onto successive links of the trophic chain including
humans. However, this important question has not so far been given enough attention in
the literature. The authors have been dealing with the subject for many years.
The aim of this paper is to determine:
– relationships between the size of yield and the use of N necessary to its production
for the assessment of N excess in the environment,
– whether and to what extent the mineral composition of yield may be used as an
indicator of N excess and the quality of yields.
Materials and methods
Yields of rye and potatoes were analyzed as well as their chemical composition. To
this end comprehensive data were acquired from the Institute of Crops, Fertilization and
Soil Study. The data were already earlier described in the papers concerning chemical
composition of plants [20], element flow between soil and plant [22, 23], and
possibilities for estimating mineral composition of primary agricultural products with
regard to the relationships between elements [21]. In this paper the effect of N excess
was examined.
Chemical composition was examined of more than 200 rye samples (grain and straw)
along with the same number of potato samples collected in the years 1976–1981 at
model farm holdings situated in various regions of Poland. The plants were cultivated
under similar agrotechnical and fertilization conditions. In the paper, solely rye grain
and potato tubers were analyzed since the chemical composition of seeds (rye) is widely
deemed to be most stable. Simultaneously the relationships were examined between the
size of crop and the amount of N used for its production as nitrogen in agricultural
production is regarded as one of the basic yield producing factors.
The interpretation of plant mineral composition was made by the author’s own ANE
method (Accumulation of Nutrient Elements). The above method is based on the
analysis of elements contained in plants as both the � (sum) of all elements in a mass
unit and the share of each element in this sum [24].
Coefficients of correlation between the crop size and the content of N, P, K, Ca and
Mg in a mass unit of rye were calculated for all the samples analyzed and for five
collective groups of samples representing crops only slightly differing in size. In the
case of potatoes the correlation coefficients were calculated only for the collective
groups of crops of approximately the same size.
Results
No correlation was found when comparing yield size and chemical composition in
a mass unit of grain yield (Table 1).
984 Apolonia Ostrowska and Gra¿yna Porêbska
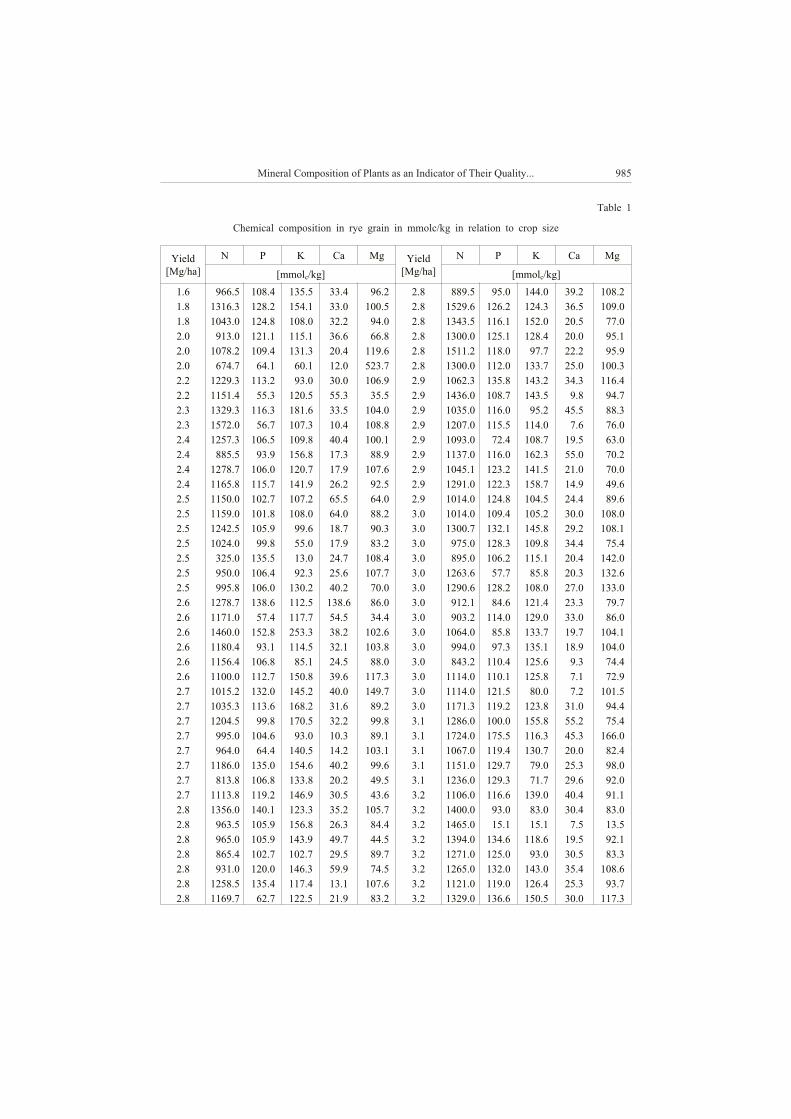
Table 1
Chemical composition in rye grain in mmolc/kg in relation to crop size
Yield
[Mg/ha]
N P K Ca Mg Yield
[Mg/ha]
N P K Ca Mg
[mmolc/kg] [mmolc/kg]
1.6 966.5 108.4 135.5 33.4 96.2 2.8 889.5 95.0 144.0 39.2 108.2
1.8 1316.3 128.2 154.1 33.0 100.5 2.8 1529.6 126.2 124.3 36.5 109.0
1.8 1043.0 124.8 108.0 32.2 94.0 2.8 1343.5 116.1 152.0 20.5 77.0
2.0 913.0 121.1 115.1 36.6 66.8 2.8 1300.0 125.1 128.4 20.0 95.1
2.0 1078.2 109.4 131.3 20.4 119.6 2.8 1511.2 118.0 97.7 22.2 95.9
2.0 674.7 64.1 60.1 12.0 523.7 2.8 1300.0 112.0 133.7 25.0 100.3
2.2 1229.3 113.2 93.0 30.0 106.9 2.9 1062.3 135.8 143.2 34.3 116.4
2.2 1151.4 55.3 120.5 55.3 35.5 2.9 1436.0 108.7 143.5 9.8 94.7
2.3 1329.3 116.3 181.6 33.5 104.0 2.9 1035.0 116.0 95.2 45.5 88.3
2.3 1572.0 56.7 107.3 10.4 108.8 2.9 1207.0 115.5 114.0 7.6 76.0
2.4 1257.3 106.5 109.8 40.4 100.1 2.9 1093.0 72.4 108.7 19.5 63.0
2.4 885.5 93.9 156.8 17.3 88.9 2.9 1137.0 116.0 162.3 55.0 70.2
2.4 1278.7 106.0 120.7 17.9 107.6 2.9 1045.1 123.2 141.5 21.0 70.0
2.4 1165.8 115.7 141.9 26.2 92.5 2.9 1291.0 122.3 158.7 14.9 49.6
2.5 1150.0 102.7 107.2 65.5 64.0 2.9 1014.0 124.8 104.5 24.4 89.6
2.5 1159.0 101.8 108.0 64.0 88.2 3.0 1014.0 109.4 105.2 30.0 108.0
2.5 1242.5 105.9 99.6 18.7 90.3 3.0 1300.7 132.1 145.8 29.2 108.1
2.5 1024.0 99.8 55.0 17.9 83.2 3.0 975.0 128.3 109.8 34.4 75.4
2.5 325.0 135.5 13.0 24.7 108.4 3.0 895.0 106.2 115.1 20.4 142.0
2.5 950.0 106.4 92.3 25.6 107.7 3.0 1263.6 57.7 85.8 20.3 132.6
2.5 995.8 106.0 130.2 40.2 70.0 3.0 1290.6 128.2 108.0 27.0 133.0
2.6 1278.7 138.6 112.5 138.6 86.0 3.0 912.1 84.6 121.4 23.3 79.7
2.6 1171.0 57.4 117.7 54.5 34.4 3.0 903.2 114.0 129.0 33.0 86.0
2.6 1460.0 152.8 253.3 38.2 102.6 3.0 1064.0 85.8 133.7 19.7 104.1
2.6 1180.4 93.1 114.5 32.1 103.8 3.0 994.0 97.3 135.1 18.9 104.0
2.6 1156.4 106.8 85.1 24.5 88.0 3.0 843.2 110.4 125.6 9.3 74.4
2.6 1100.0 112.7 150.8 39.6 117.3 3.0 1114.0 110.1 125.8 7.1 72.9
2.7 1015.2 132.0 145.2 40.0 149.7 3.0 1114.0 121.5 80.0 7.2 101.5
2.7 1035.3 113.6 168.2 31.6 89.2 3.0 1171.3 119.2 123.8 31.0 94.4
2.7 1204.5 99.8 170.5 32.2 99.8 3.1 1286.0 100.0 155.8 55.2 75.4
2.7 995.0 104.6 93.0 10.3 89.1 3.1 1724.0 175.5 116.3 45.3 166.0
2.7 964.0 64.4 140.5 14.2 103.1 3.1 1067.0 119.4 130.7 20.0 82.4
2.7 1186.0 135.0 154.6 40.2 99.6 3.1 1151.0 129.7 79.0 25.3 98.0
2.7 813.8 106.8 133.8 20.2 49.5 3.1 1236.0 129.3 71.7 29.6 92.0
2.7 1113.8 119.2 146.9 30.5 43.6 3.2 1106.0 116.6 139.0 40.4 91.1
2.8 1356.0 140.1 123.3 35.2 105.7 3.2 1400.0 93.0 83.0 30.4 83.0
2.8 963.5 105.9 156.8 26.3 84.4 3.2 1465.0 15.1 15.1 7.5 13.5
2.8 965.0 105.9 143.9 49.7 44.5 3.2 1394.0 134.6 118.6 19.5 92.1
2.8 865.4 102.7 102.7 29.5 89.7 3.2 1271.0 125.0 93.0 30.5 83.3
2.8 931.0 120.0 146.3 59.9 74.5 3.2 1265.0 132.0 143.0 35.4 108.6
2.8 1258.5 135.4 117.4 13.1 107.6 3.2 1121.0 119.0 126.4 25.3 93.7
2.8 1169.7 62.7 122.5 21.9 83.2 3.2 1329.0 136.6 150.5 30.0 117.3
Mineral Composition of Plants as an Indicator of Their Quality... 985
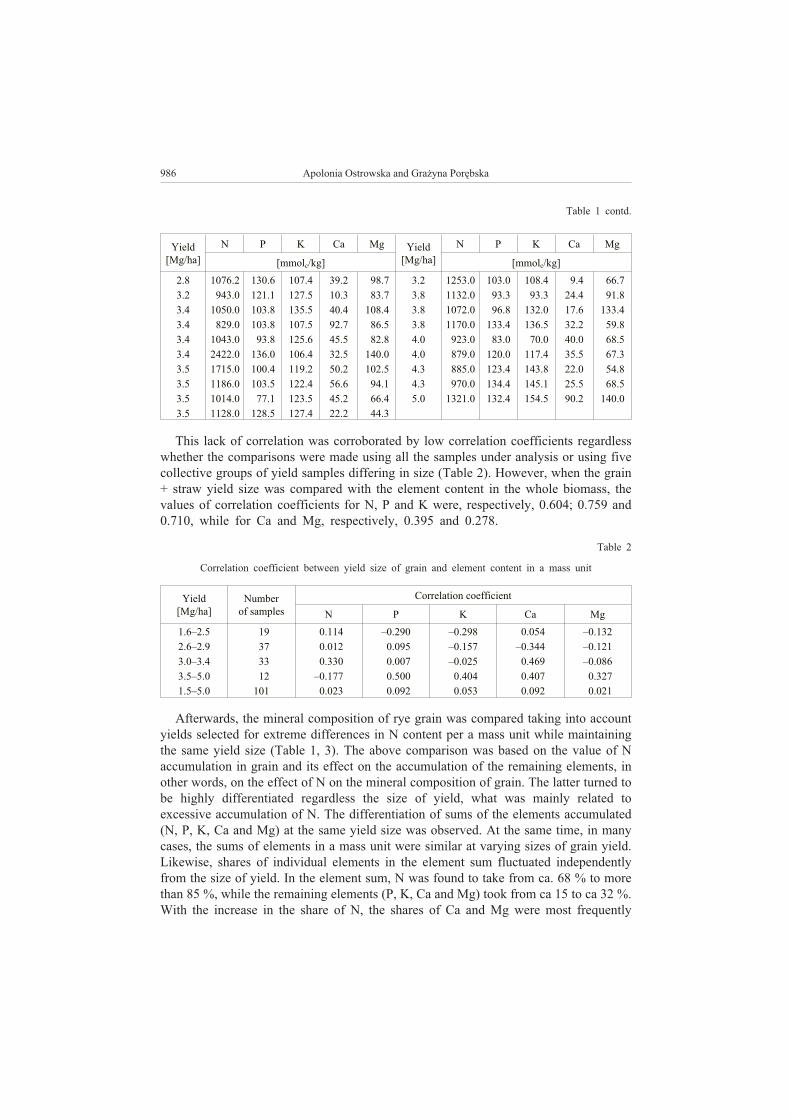
Yield
[Mg/ha]
N P K Ca Mg Yield
[Mg/ha]
N P K Ca Mg
[mmolc/kg] [mmolc/kg]
2.8 1076.2 130.6 107.4 39.2 98.7 3.2 1253.0 103.0 108.4 9.4 66.7
3.2 943.0 121.1 127.5 10.3 83.7 3.8 1132.0 93.3 93.3 24.4 91.8
3.4 1050.0 103.8 135.5 40.4 108.4 3.8 1072.0 96.8 132.0 17.6 133.4
3.4 829.0 103.8 107.5 92.7 86.5 3.8 1170.0 133.4 136.5 32.2 59.8
3.4 1043.0 93.8 125.6 45.5 82.8 4.0 923.0 83.0 70.0 40.0 68.5
3.4 2422.0 136.0 106.4 32.5 140.0 4.0 879.0 120.0 117.4 35.5 67.3
3.5 1715.0 100.4 119.2 50.2 102.5 4.3 885.0 123.4 143.8 22.0 54.8
3.5 1186.0 103.5 122.4 56.6 94.1 4.3 970.0 134.4 145.1 25.5 68.5
3.5 1014.0 77.1 123.5 45.2 66.4 5.0 1321.0 132.4 154.5 90.2 140.0
3.5 1128.0 128.5 127.4 22.2 44.3
This lack of correlation was corroborated by low correlation coefficients regardless
whether the comparisons were made using all the samples under analysis or using five
collective groups of yield samples differing in size (Table 2). However, when the grain
+ straw yield size was compared with the element content in the whole biomass, the
values of correlation coefficients for N, P and K were, respectively, 0.604; 0.759 and
0.710, while for Ca and Mg, respectively, 0.395 and 0.278.
Table 2
Correlation coefficient between yield size of grain and element content in a mass unit
Yield
[Mg/ha]
Number
of samples
Correlation coefficient
N P K Ca Mg
1.6–2.5 19 –0.114 –0.290 –0.298 –0.054 –0.132
2.6–2.9 37 –0.012 –0.095 –0.157 –0.344 –0.121
3.0–3.4 33 –0.330 –0.007 –0.025 –0.469 –0.086
3.5–5.0 12 –0.177 –0.500 –0.404 –0.407 –0.327
1.5–5.0 101 –0.023 –0.092 –0.053 –0.092 –0.021
Afterwards, the mineral composition of rye grain was compared taking into account
yields selected for extreme differences in N content per a mass unit while maintaining
the same yield size (Table 1, 3). The above comparison was based on the value of N
accumulation in grain and its effect on the accumulation of the remaining elements, in
other words, on the effect of N on the mineral composition of grain. The latter turned to
be highly differentiated regardless the size of yield, what was mainly related to
excessive accumulation of N. The differentiation of sums of the elements accumulated
(N, P, K, Ca and Mg) at the same yield size was observed. At the same time, in many
cases, the sums of elements in a mass unit were similar at varying sizes of grain yield.
Likewise, shares of individual elements in the element sum fluctuated independently
from the size of yield. In the element sum, N was found to take from ca. 68 % to more
than 85 %, while the remaining elements (P, K, Ca and Mg) took from ca 15 to ca 32 %.
With the increase in the share of N, the shares of Ca and Mg were most frequently
986 Apolonia Ostrowska and Gra¿yna Porêbska
Table 1 contd.
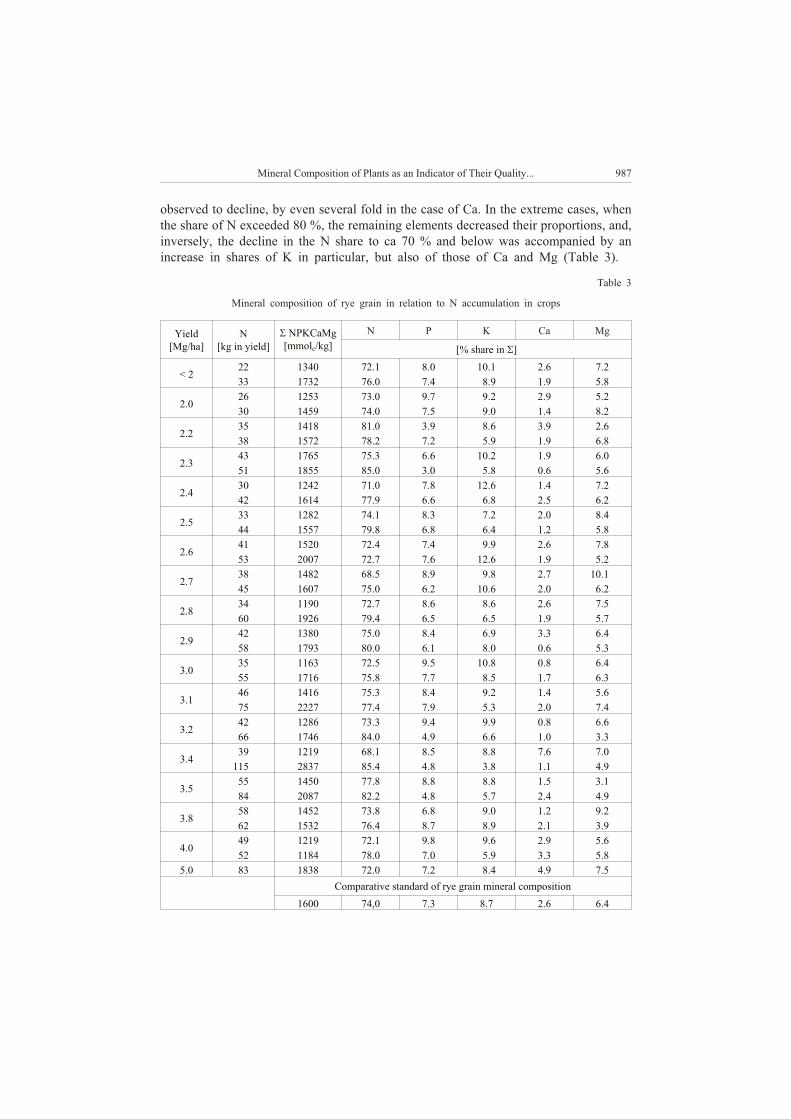
observed to decline, by even several fold in the case of Ca. In the extreme cases, when
the share of N exceeded 80 %, the remaining elements decreased their proportions, and,
inversely, the decline in the N share to ca 70 % and below was accompanied by an
increase in shares of K in particular, but also of those of Ca and Mg (Table 3).
Table 3
Mineral composition of rye grain in relation to N accumulation in crops
Yield
[Mg/ha]
N
[kg in yield]
� NPKCaMg
[mmolc/kg]
N P K Ca Mg
[% share in �]
< 222 1340 72.1 8.0 10.1 2.6 7.2
33 1732 76.0 7.4 8.9 1.9 5.8
2.026 1253 73.0 9.7 9.2 2.9 5.2
30 1459 74.0 7.5 9.0 1.4 8.2
2.235 1418 81.0 3.9 8.6 3.9 2.6
38 1572 78.2 7.2 5.9 1.9 6.8
2.343 1765 75.3 6.6 10.2 1.9 6.0
51 1855 85.0 3.0 5.8 0.6 5.6
2.430 1242 71.0 7.8 12.6 1.4 7.2
42 1614 77.9 6.6 6.8 2.5 6.2
2.533 1282 74.1 8.3 7.2 2.0 8.4
44 1557 79.8 6.8 6.4 1.2 5.8
2.641 1520 72.4 7.4 9.9 2.6 7.8
53 2007 72.7 7.6 12.6 1.9 5.2
2.738 1482 68.5 8.9 9.8 2.7 10.1
45 1607 75.0 6.2 10.6 2.0 6.2
2.834 1190 72.7 8.6 8.6 2.6 7.5
60 1926 79.4 6.5 6.5 1.9 5.7
2.942 1380 75.0 8.4 6.9 3.3 6.4
58 1793 80.0 6.1 8.0 0.6 5.3
3.035 1163 72.5 9.5 10.8 0.8 6.4
55 1716 75.8 7.7 8.5 1.7 6.3
3.146 1416 75.3 8.4 9.2 1.4 5.6
75 2227 77.4 7.9 5.3 2.0 7.4
3.242 1286 73.3 9.4 9.9 0.8 6.6
66 1746 84.0 4.9 6.6 1.0 3.3
3.439 1219 68.1 8.5 8.8 7.6 7.0
115 2837 85.4 4.8 3.8 1.1 4.9
3.555 1450 77.8 8.8 8.8 1.5 3.1
84 2087 82.2 4.8 5.7 2.4 4.9
3.858 1452 73.8 6.8 9.0 1.2 9.2
62 1532 76.4 8.7 8.9 2.1 3.9
4.049 1219 72.1 9.8 9.6 2.9 5.6
52 1184 78.0 7.0 5.9 3.3 5.8
5.0 83 1838 72.0 7.2 8.4 4.9 7.5
Comparative standard of rye grain mineral composition
1600 74,0 7.3 8.7 2.6 6.4
Mineral Composition of Plants as an Indicator of Their Quality... 987
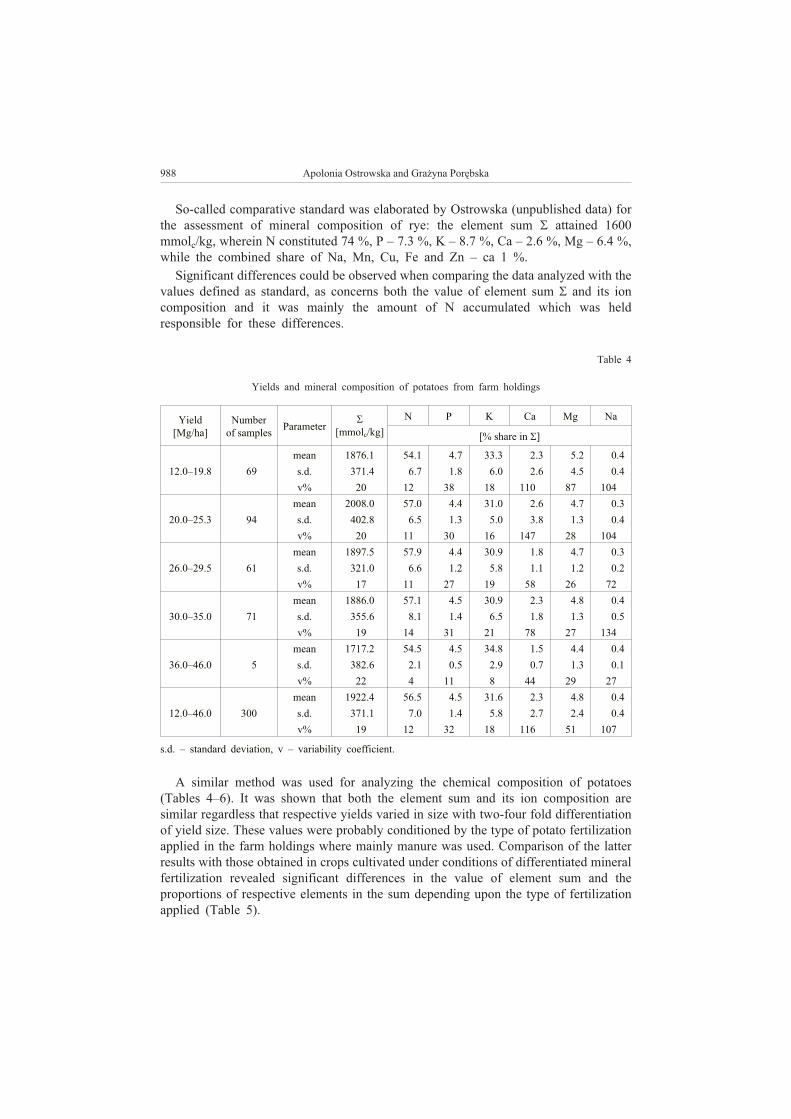
So-called comparative standard was elaborated by Ostrowska (unpublished data) for
the assessment of mineral composition of rye: the element sum � attained 1600
mmolc/kg, wherein N constituted 74 %, P – 7.3 %, K – 8.7 %, Ca – 2.6 %, Mg – 6.4 %,
while the combined share of Na, Mn, Cu, Fe and Zn – ca 1 %.
Significant differences could be observed when comparing the data analyzed with the
values defined as standard, as concerns both the value of element sum � and its ion
composition and it was mainly the amount of N accumulated which was held
responsible for these differences.
Table 4
Yields and mineral composition of potatoes from farm holdings
Yield
[Mg/ha]
Number
of samplesParameter
�
[mmolc/kg]
N P K Ca Mg Na
[% share in �]
12.0–19.8 69
mean 1876.1 54.1 4.7 33.3 2.3 5.2 0.4
s.d. 371.4 6.7 1.8 6.0 2.6 4.5 0.4
v% 20 12 38 18 110 87 104
20.0–25.3 94
mean 2008.0 57.0 4.4 31.0 2.6 4.7 0.3
s.d. 402.8 6.5 1.3 5.0 3.8 1.3 0.4
v% 20 11 30 16 147 28 104
26.0–29.5 61
mean 1897.5 57.9 4.4 30.9 1.8 4.7 0.3
s.d. 321.0 6.6 1.2 5.8 1.1 1.2 0.2
v% 17 11 27 19 58 26 72
30.0–35.0 71
mean 1886.0 57.1 4.5 30.9 2.3 4.8 0.4
s.d. 355.6 8.1 1.4 6.5 1.8 1.3 0.5
v% 19 14 31 21 78 27 134
36.0–46.0 5
mean 1717.2 54.5 4.5 34.8 1.5 4.4 0.4
s.d. 382.6 2.1 0.5 2.9 0.7 1.3 0.1
v% 22 4 11 8 44 29 27
12.0–46.0 300
mean 1922.4 56.5 4.5 31.6 2.3 4.8 0.4
s.d. 371.1 7.0 1.4 5.8 2.7 2.4 0.4
v% 19 12 32 18 116 51 107
s.d. – standard deviation, v – variability coefficient.
A similar method was used for analyzing the chemical composition of potatoes
(Tables 4–6). It was shown that both the element sum and its ion composition are
similar regardless that respective yields varied in size with two-four fold differentiation
of yield size. These values were probably conditioned by the type of potato fertilization
applied in the farm holdings where mainly manure was used. Comparison of the latter
results with those obtained in crops cultivated under conditions of differentiated mineral
fertilization revealed significant differences in the value of element sum and the
proportions of respective elements in the sum depending upon the type of fertilization
applied (Table 5).
988 Apolonia Ostrowska and Gra¿yna Porêbska
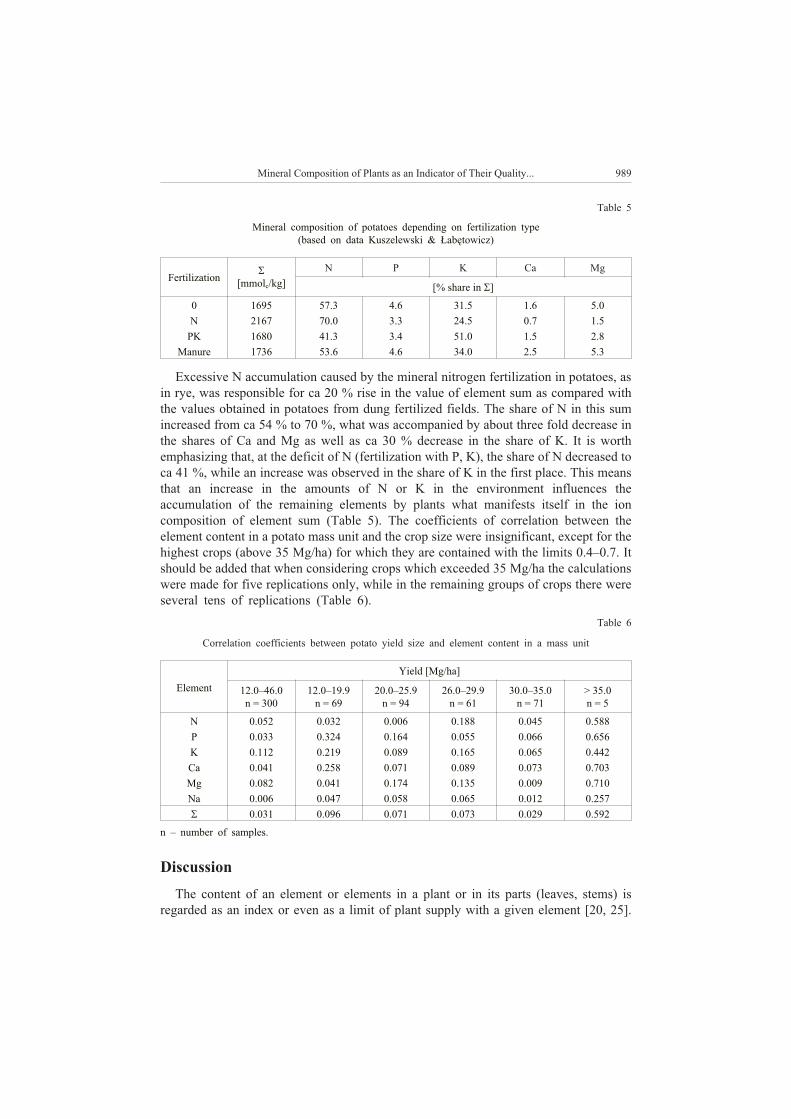
Table 5
Mineral composition of potatoes depending on fertilization type
(based on data Kuszelewski & £abêtowicz)
Fertilization�
[mmolc/kg]
N P K Ca Mg
[% share in �]
0 1695 57.3 4.6 31.5 1.6 5.0
N 2167 70.0 3.3 24.5 0.7 1.5
PK 1680 41.3 3.4 51.0 1.5 2.8
Manure 1736 53.6 4.6 34.0 2.5 5.3
Excessive N accumulation caused by the mineral nitrogen fertilization in potatoes, as
in rye, was responsible for ca 20 % rise in the value of element sum as compared with
the values obtained in potatoes from dung fertilized fields. The share of N in this sum
increased from ca 54 % to 70 %, what was accompanied by about three fold decrease in
the shares of Ca and Mg as well as ca 30 % decrease in the share of K. It is worth
emphasizing that, at the deficit of N (fertilization with P, K), the share of N decreased to
ca 41 %, while an increase was observed in the share of K in the first place. This means
that an increase in the amounts of N or K in the environment influences the
accumulation of the remaining elements by plants what manifests itself in the ion
composition of element sum (Table 5). The coefficients of correlation between the
element content in a potato mass unit and the crop size were insignificant, except for the
highest crops (above 35 Mg/ha) for which they are contained with the limits 0.4–0.7. It
should be added that when considering crops which exceeded 35 Mg/ha the calculations
were made for five replications only, while in the remaining groups of crops there were
several tens of replications (Table 6).
Table 6
Correlation coefficients between potato yield size and element content in a mass unit
Element
Yield [Mg/ha]
12.0–46.0
n = 300
12.0–19.9
n = 69
20.0–25.9
n = 94
26.0–29.9
n = 61
30.0–35.0
n = 71
> 35.0
n = 5
N 0.052 0.032 0.006 0.188 0.045 0.588
P 0.033 0.324 0.164 0.055 0.066 0.656
K 0.112 0.219 0.089 0.165 0.065 0.442
Ca 0.041 0.258 0.071 0.089 0.073 0.703
Mg 0.082 0.041 0.174 0.135 0.009 0.710
Na 0.006 0.047 0.058 0.065 0.012 0.257
� 0.031 0.096 0.071 0.073 0.029 0.592
n – number of samples.
Discussion
The content of an element or elements in a plant or in its parts (leaves, stems) is
regarded as an index or even as a limit of plant supply with a given element [20, 25].
Mineral Composition of Plants as an Indicator of Their Quality... 989
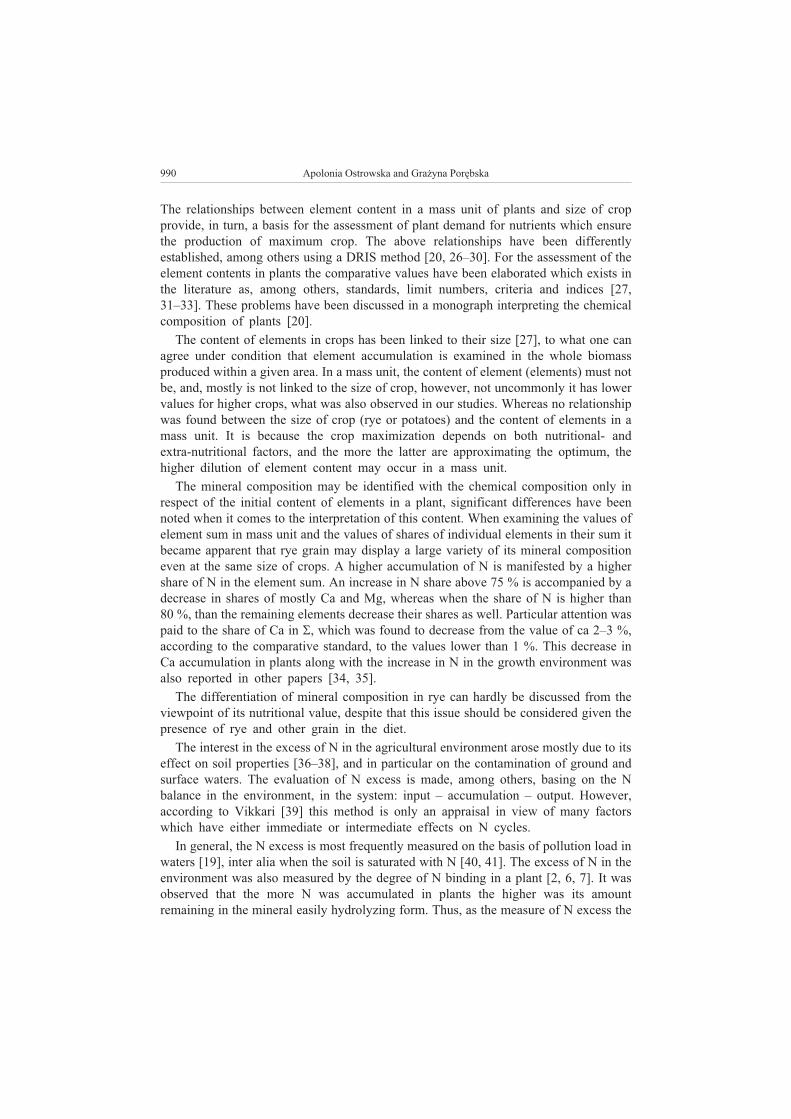
The relationships between element content in a mass unit of plants and size of crop
provide, in turn, a basis for the assessment of plant demand for nutrients which ensure
the production of maximum crop. The above relationships have been differently
established, among others using a DRIS method [20, 26–30]. For the assessment of the
element contents in plants the comparative values have been elaborated which exists in
the literature as, among others, standards, limit numbers, criteria and indices [27,
31–33]. These problems have been discussed in a monograph interpreting the chemical
composition of plants [20].
The content of elements in crops has been linked to their size [27], to what one can
agree under condition that element accumulation is examined in the whole biomass
produced within a given area. In a mass unit, the content of element (elements) must not
be, and, mostly is not linked to the size of crop, however, not uncommonly it has lower
values for higher crops, what was also observed in our studies. Whereas no relationship
was found between the size of crop (rye or potatoes) and the content of elements in a
mass unit. It is because the crop maximization depends on both nutritional- and
extra-nutritional factors, and the more the latter are approximating the optimum, the
higher dilution of element content may occur in a mass unit.
The mineral composition may be identified with the chemical composition only in
respect of the initial content of elements in a plant, significant differences have been
noted when it comes to the interpretation of this content. When examining the values of
element sum in mass unit and the values of shares of individual elements in their sum it
became apparent that rye grain may display a large variety of its mineral composition
even at the same size of crops. A higher accumulation of N is manifested by a higher
share of N in the element sum. An increase in N share above 75 % is accompanied by a
decrease in shares of mostly Ca and Mg, whereas when the share of N is higher than
80 %, than the remaining elements decrease their shares as well. Particular attention was
paid to the share of Ca in �, which was found to decrease from the value of ca 2–3 %,
according to the comparative standard, to the values lower than 1 %. This decrease in
Ca accumulation in plants along with the increase in N in the growth environment was
also reported in other papers [34, 35].
The differentiation of mineral composition in rye can hardly be discussed from the
viewpoint of its nutritional value, despite that this issue should be considered given the
presence of rye and other grain in the diet.
The interest in the excess of N in the agricultural environment arose mostly due to its
effect on soil properties [36–38], and in particular on the contamination of ground and
surface waters. The evaluation of N excess is made, among others, basing on the N
balance in the environment, in the system: input – accumulation – output. However,
according to Vikkari [39] this method is only an appraisal in view of many factors
which have either immediate or intermediate effects on N cycles.
In general, the N excess is most frequently measured on the basis of pollution load in
waters [19], inter alia when the soil is saturated with N [40, 41]. The excess of N in the
environment was also measured by the degree of N binding in a plant [2, 6, 7]. It was
observed that the more N was accumulated in plants the higher was its amount
remaining in the mineral easily hydrolyzing form. Thus, as the measure of N excess the
990 Apolonia Ostrowska and Gra¿yna Porêbska
ratio of N total to N mineral may be used, which under conditions of nitrogen stress
may approximate the value of 1 [9, 10]. The excess of N has also been measured by
determining the level of the so-called critical load for N deposition above which
negative effects are manifested in the forest environment [42], and by the ratio of C:N,
which shows N binding in the soil organic matter [15, 41, 43].
N content and its transformation in plant and soil have been studied by many authors.
However, there is lack of papers concerning the mineral composition of plants taking
into account the disorders of between elements relationships resulting from excess or
deficit of individual elements. From our studies the conclusion can be drawn that the
sum of elements accumulated in a mass unit constitutes an index of plant nutrient
supply. The share of elements in their sum constitutes, in turn, an index of either excess
or deficit of respective elements, in particular of N in the environment. The mineral
composition of plants in general may be regarded as an index of plant quality with
respect to the amount of elements entering the trophic chain and the between element
relationships.
Conclusions
1. Disorders in the mineral composition of plants, and especially those in the
relationships between elements in their sum accumulated in a mass unit are an index of
excess/deficit of an element (elements) in the environment.
2. The mineral composition of rye and potatoes differs with respect to both the
element sum and the share of elements in their sum independently from the yield size,
but it depends on the amount of N accumulated.
3. The excess of N in the environment brings about its excessive accumulation in the
crop; crops of the same size may differ as much as twice with respect to N
accumulation.
4. No correlation was found between the crop size and the content of N, P, K, Ca and
Mg in a mass unit in both rye grain and potato tubers, however, there was a correlation
between the crop size and accumulation of N, P and K in these crops.
References
[1] Augustin S., Bolte A., Holzhausen M. and Wolff B.: Eur. J. Forest Res. 2005, 124, 289–300.
[2] Elvir J.A., Wiersma G.B., Day M.E., Greenwood M.S. and Fernandez I.J.: Forest Ecol. Manage. 2006,
221, 207–214.
[3] Ostrowska A., Porêbska G., Sienkiewicz J., Borzyszkowski J. and Król H.: Soil and plant properties in
environmental monitoring. IOŒ Warszawa 2006, 1–159 (in Polish).
[4] Sirulnik A.G., Allen E.B., Meixner T. and Allen M.F.: Soil Biol. Biochem. 2007, 29, 24–32.
[5] Collier M.D., Fotelli M.N., Nahm M., Kopriva S., Rennenberg H., Hanke D.E. and Geßler A.: Plant,
Cell, Environ. 2003, 26, 1549–1560.
[6] Fotelli M.N., Nahm M., Heidenfelder A., Papen H., Rennenberg H. and Geßler A.: New Phytologist
2002, 154, 85–97.
[7] Nahm M., Holst T., Matzarakis A., Mayer H., Rennenberg H. and Geßler A.: Eur. J. Forest Res. 2006,
125, 1–14.
[8] Rothstein D.E. and Cregg B.M.: Forest Ecol. Manage. 2005, 219, 69–80.
[9] Ostrowska A.: Roczn. Glebozn. 1974, XXV, suppl. 133–142.
Mineral Composition of Plants as an Indicator of Their Quality... 991
[10] Ostrowska A. and Porêbska G.: Arch. Environ. Protect. 2008, 34(3), 193–200.
[11] Hendriks C.M.A., de Vries W. and van den Burg J.: Effects of acid deposition on 150 forest stands in the
Netherlands. Relationships between forest vitality characteristics and the chemical composition of
foliage, humus layer, mineral soil and soil solution. Raport 69.2. DLO Winand Staring Centre,
Wageningen 1994.
[12] Herrmann M., Pust J. and Pott R.: Plant Soil 2005, 273, 129–137.
[13] Van der Salm C., de Vries W., Reinds G.J. and Diese N.B.: Forest Ecol. Manage. 2007, 238, 81–91.
[14] Rothe A., Huber Ch., Kreutzer K. and Weis W.: Plant Soil 2002, 240, 33–45.
[15] Dise N.B., Matzner E. and Forsius M.: Environ. Pollut. 1998, 102, 453–456.
[16] Sapek A.: Groundwater from meadow soils as a link of nitrogen and phosphorus cycle in the
environment, [in:] Element cycling in the Environment. Monography t. III, IOΠWarszawa 2005,
190–193 (in Polish).
[17] Munoz-Carpena R., Ritter A., Bosch D.D. Schaffer B. and Potter T.L.: Agric. Water Manage. 2008, 95,
633–644.
[18] Entry J.A. and Sojka R.E.: J. Environ. Manage. 2008, 87, 364–372.
[19] Sapek B.: Estimation of environmental risk in the light of soil and water monitoring within farm, [in:]
Element cycling in the Environment. Monography, t. I, IOŒ Warszawa 2001, 295–304 (in Polish).
[20] Ostrowska A. and Porêbska G.: Chemical composition of plants its interpretation and application in the
environmental protection. Monography. IOΠWarszawa 2002 (in Polish).
[21] Ostrowska A.: Polish J. Environ. Stud. 1999, 8, supl. II, 51–56.
[22] Ostrowska A.: Post. Nauk Roln. 2005, 4, 119–131 (in Polish).
[23] Ostrowska A.: Element cycling in the environment, distortions and environmental risk involved, [in:]
Element cycling in the Environment, II International Scientific-Technical Conference, Warsaw 27–29
October 1997, IOŒ Warszawa 1997, 105–116.
[24] Ostrowska A.: Application of ANE value and of shares of individual elements in this value for
determining the difference between various plant species. Genetic aspects of plant mineral nutrition.
Martinus Nijhoff Public. 27, 1987.
[25] Bell P.F., Vaughn A. and Bourgeois W.J.: J. Plant Nutr. 1997, 20(6), 733–743.
[26] Kenworthy A.L.: Soil Sci. Soc. Amer. Spec. Pub. 1967, vol. 2.
[27] Mercik S., Sommer K. and Rossing K.: Roczn. Nauk Roln. 1993, Ser. A, 110(1–2), 33–57 (in Polish).
[28] Sumner M.E.: Soil Sci. Amer. J. 1981, 45, 87–90.
[29] Walworth J.L. and Sumner M.E.: Adv. Plant Nutr. 1986, 3, 193–241.
[30] Walworth J.L. and Sumner M.E.: Adv. Soil Sci. 1987, 6, 149–188.
[31] Parent L.E., Poirier M. and Asselin M.: J. Plant Nutr. 1995, 18(5), 1013–1025.
[32] Montanez L. and Sanz M.: J. Plant Nutr. 1994, 17(10), 1647–1657.
[33] Ingestad T.: Physiol. Plant. 1979, 45, 373–380.
[34] Ostrowska A.: Effect of nutrition conditions on ionic proportions in plants on the examine of common
pine (Pinus silvestris L). Inst. Warzywn., Skierniewice 1985 (in Polish).
[35] Perakis S.S., Maguire D.A., Bullen T.D., Cromack K., Waring R.H. and Boyle J.R.: Ecosystems 2006, 9,
63–74.
[36] Ostrowska A. and Porêbska G.: Polish J. Soil Sci. 2001, XXXIV/1, 35–42.
[37] Qian Ch. and Cai Z.: Plant Soil 2007, 300, 197–205.
[38] Prietzel J., Stetter U., Klemmt H.J. and Rehfuess K.E.: Plant Soil 2006, 289, 153–170.
[39] Yli-Viikari A., Hietala-Koivu R., Huusela-Veistola E., Hyvonen T., Perala P. and Turtola E.: Ecol.
Indicators 2007, 7, 150–163.
[40] Aber J.D. and Magill A.H.: Forest Ecol. Manage. 2004, 196, 1–5.
[41] Rowe E.C., Evans C.D., Emmett B.A., Reynolds B., Helliwell R.C., Coull M.C. and Curtis C.J.: Water,
Air, Soil Pollut. 2006, 177, 335–347.
[42] Groffman P.M., Baron J.S., Blett T., Gold A.J., Goodman I., Gunderson L.H., Levinson B.M., Palmer
M.A., Paerl H.W., Peterson G.D., LeRoy Poff N., Rejeski D.W., Reynolds J.F., Turner M.G., Weathers
K.C. and Wiens J.: Ecosystems 2006, 9, 1–13.
[43] Evans Ch.D., Reynolds B., Jenkins A., Helliwell R.C., Curtis Ch.J., Goodale Ch.L., Ferrier R.C.,
Emmett B.A., Pilkington M.G., Caporn S.J.M., Carroll J.A., Norris D., Davies J. and Coull M.C.:
Ecosystems 2006, 9(3), 453–462.
992 Apolonia Ostrowska and Gra¿yna Porêbska
SK£AD MINERALNY ROŒLIN JAKO WSKA�NIK ICH JAKOŒCI
W WARUNKACH NADMIARU AZOTU W ŒRODOWISKU
Instytut Ochrony Œrodowiska, Warszawa
Abstrakt: Celem pracy by³o ustalenie zwi¹zków miêdzy iloœci¹ plonów i zu¿yciem azotu na ich
wyprodukowanie z punktu widzenia oceny nadmiaru azotu w œrodowisku oraz ustalenie, czy i na ile sk³ad
mineralny plonów mo¿e byæ wskaŸnikiem jego nadmiaru. Nie stwierdzono korelacji miêdzy plonem ziarna
ani ziemniaków a zawartoœci¹ N, P, K, Ca i Mg w jednostce masy. Nadmiar azotu w œrodowisku wzrostu ¿yta
powoduje jego wiêksz¹ akumulacjê w plonach ziarna tej samej iloœci oraz zaburzenie relacji miêdzy
sk³adnikami. Udzia³ azotu w sumie akumulowanych sk³adników wzrasta powy¿ej 75 %, a w drastycznych
przypadkach powy¿ej 80 %, zaœ udzia³y pozosta³ych sk³adników s¹ redukowane, zw³aszcza udzia³ Ca i Mg.
Podobny efekt nadmiaru azotu wystêpuje tak¿e w ziemniakach. Sk³ad mineralny roœlin pod wzglêdem relacji
miêdzy sk³adnikami mo¿e byæ wskaŸnikiem nadmiaru azotu w œrodowisku, a tym samym ich jakoœci pod
wzglêdem iloœciowo-jakoœciowego strumienia sk³adników mineralnych wchodz¹cych do ³añcucha troficznego.
S³owa kluczowe: ¿yto, ziemniaki, iloœæ plonu, azot, sk³ad mineralny
Mineral Composition of Plants as an Indicator of Their Quality... 993

Anna P£AZA1, Feliks CEGLAREK,
Barbara G¥SIOROWSKA, Danuta BURACZYÑSKA
and Milena Anna KRÓLIKOWSKA
EFFECT OF INTERCROPS
ON THE CONTENT OF MINERAL NITROGEN IN SOIL
IN AUTUMN AND SPRING
WP£YW MIÊDZYPLONÓW NA ZAWARTOŒÆ AZOTU MINERALNEGO
W GLEBIE JESIENI¥ I WIOSN¥
Abstract: The aim of the present research was to determine the influence of undersown crops and stubble
crops on the content of mineral forms of nitrogen in soil profile in autumn and spring.
Field experiments were carried out at the Experimental Farm in Zawady, owned by the University of
Podlasie in Siedlce. The following combinations of intercrops were taken into account: control object (without
intercrop), undersown crops – biomass plowed down in autumn (white clover, Italian ryegrass), stubble crop –
biomass plowed down in autumn (oil radish), stubble crop – biomass left in the form of mulch (oil radish) till
spring. The content of nitrate and ammonia ions were determined twice, ie in autumn and spring, in two layers
of soil (0–30 and 31–60 cm). The results pointed out that, putting the intercrops into the cultivation limited the
content of mineral nitrogen in soil in autumn, and increased in spring. The highest concentration of nitrate and
ammonia ions was noted in soil in spring, when white clover was plowed down. When the surface of soil was
mulched with stubble crop from white mustard in the time of winter, it decreased the content of mineral
nitrogen in spring.
Keywords: undersown crop, stubble crop, mulch, mineral nitrogen, soil
In today’s agriculture more and more attention is paid to protect the soil environ-
ment. A special role is attributed to the intercrops, which may be regarded as
“accumulators” of unused nutrients in forecrop to plants subsequently incoming in the
crop rotation. Its leaching into groundwater of the areas covered with flora or litter is
several times smaller than the soil remaining in the black fallow [1–5]. Stubble crops
prolongs the duration of cover crops, and undersown crops moreover increases the
compactness of cornfield. On this basis, it appears that the contamination of agricultural
activity of watercourse and water tanks from farms growing the intercrops is smaller
than from farms growing plants only in the main yield [2, 5]. It is recommended to
E C O L O G I C A L C H E M I S T R Y A N D E N G I N E E R I N G A
Vol. 16, No. 8 2009
1Department of Plant Cultivation, University of Podlasie, ul. B. Prusa 14, 08–110 Siedlce, Poland, email:
leave the stubble crops for a period of winter in the form of mulch [3, 6, 7]. This
solution should reduce the leaching of nitrates from the soil during the autumn–winter
period. Still there is a little on the subject of the experimental data. So there emerges
a need to conduct a study to determine the effect of undersown crops and stubble crops
on the content of mineral forms of nitrogen in the soil profile in spring and autumn.
Material and methods
Field experiments were carried out in 2000–2003 at the Experimental Farm in
Zawady, owned by the University of Podlasie in Siedlce. The researches were carried
out on a soil which was rated to autogenic soil, russet soil order, fawn soil type made
from hard sandy loam. This experiment was established on a very good cereal complex
soil, belonging to the quality class IVa. The arable layer of soil characterized with pH
6.4–6.6, Hh 0.916–0.921 cmol(+) � kg–1
, S 10.87–10.92 cmol(+) � kg–1
, T 11.79–11.84
cmol(+) � kg–1
, V 92.20–92.23 %, and the content of Ntot 0.684–0.695 g � kg–1
, in it
N-NH4 4.39–4.47 mg � kg–1
and N-NO3 7.18–7.26 mg � kg–1
, assimilable forms:
P 50.2–50.8 mg � kg–1
, K 112.5–113.7 mg � kg–1
and Mg 53.5–54.2 mg � kg–1
. The
experiment was a three-replicate split blocks design. The size of plot at the beginning
was 20 m2, and during the harvest it was 15 m
2. The following combinations of
intercrops were taken into account: control object (without intercrop cultivation),
undersown crops – biomass plowed down in autumn (white clover 18 kg ha–1
, Italian
ryegrass 30 kg ha–1
), stubble crop – biomass plowed down in autumn (oil radish
30 kg ha–1
), stubble crop – biomass left in the form of mulch till spring (oil radish
30 kg ha–1
). Undersown crops were sown into spring barley cultivated for grain, and
stubble crops were sown after its harvest. In early spring mineral fertilizers were used:
60 kg N, 39.6 kg P and 99.6 kg K per 1 ha. Spring barley was sown in the first decade
of April. Undersown crops were sown into spring barley by the seeder across the rows
in a day of sowing of protective plant. The harvest of spring barley was made in the
third decade of July. After the harvest of spring barley on each plot which was assigned
to undersown crops cultivation the mineral fertilization was used: 60 kg N � ha–1
,
13.2 kg P � ha–1
and 49.8 kg K � ha–1
. Oil radish which was cultivated in stubble catch
crop was sown in the first decade of August. In autumn, in third decade of October,
from each plot of undersown crop mean samples of fresh mass and after harvest
remnants were collected with its root mass from 30 cm of soil layer to establish the
yield of dry mass. Intercrops which were grown produced per 1 ha the following
quantities of dry mass: white clover 5.2 Mg ha–1
, Italian ryegrass 6.3 Mg ha–1
and oil
radish 4.4 Mg ha–1
. On the control object from the harvesting of spring barley to the late
autumn black fallow was maintained. Soil attempts, from each plot were collected
twice, ie in autumn (the third decade of October) and in spring (the first decade of
April), from two layers of soil (0–30 and 31–60 cm) to denote the contents of
ammonium and nitrate ions by calorimeter method [8]. Soil sample were collected by
using of soil gimlet. After soil sample collection (about 200 g) it was placed in a plastic
bag. These samples were kept in the refrigerated storage until the analysis. Received
results of researches were drawn up statistically. Average for significant sources of
variation were compared with the Tukey test.
996 Anna P³aza et al
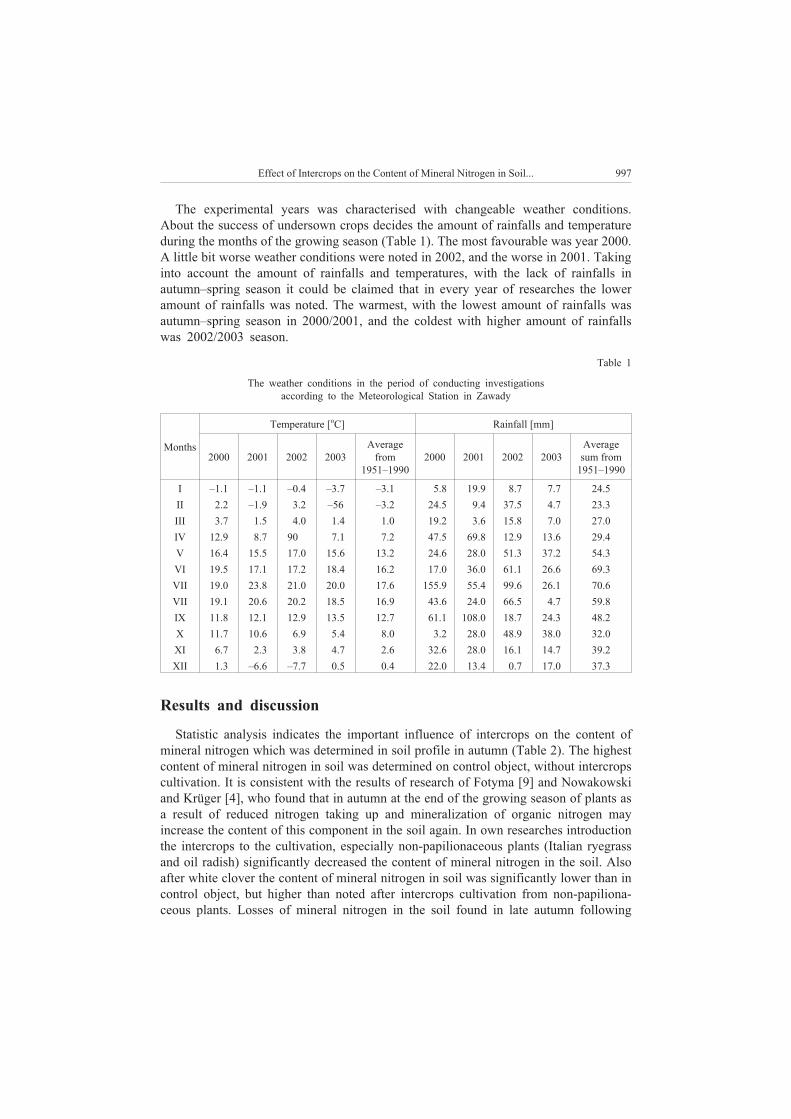
The experimental years was characterised with changeable weather conditions.
About the success of undersown crops decides the amount of rainfalls and temperature
during the months of the growing season (Table 1). The most favourable was year 2000.
A little bit worse weather conditions were noted in 2002, and the worse in 2001. Taking
into account the amount of rainfalls and temperatures, with the lack of rainfalls in
autumn–spring season it could be claimed that in every year of researches the lower
amount of rainfalls was noted. The warmest, with the lowest amount of rainfalls was
autumn–spring season in 2000/2001, and the coldest with higher amount of rainfalls
was 2002/2003 season.
Table 1
The weather conditions in the period of conducting investigations
according to the Meteorological Station in Zawady
Months
Temperature [oC] Rainfall [mm]
2000 2001 2002 2003
Average
from
1951–1990
2000 2001 2002 2003
Average
sum from
1951–1990
I –1.1 –1.1 –0.4 –3.7 –3.1 5.8 19.9 8.7 7.7 24.5
II 2.2 –1.9 3.2 –56 –3.2 24.5 9.4 37.5 4.7 23.3
III 3.7 1.5 4.0 1.4 1.0 19.2 3.6 15.8 7.0 27.0
IV 12.9 8.7 90 7.1 7.2 47.5 69.8 12.9 13.6 29.4
V 16.4 15.5 17.0 15.6 13.2 24.6 28.0 51.3 37.2 54.3
VI 19.5 17.1 17.2 18.4 16.2 17.0 36.0 61.1 26.6 69.3
VII 19.0 23.8 21.0 20.0 17.6 155.9 55.4 99.6 26.1 70.6
VII 19.1 20.6 20.2 18.5 16.9 43.6 24.0 66.5 4.7 59.8
IX 11.8 12.1 12.9 13.5 12.7 61.1 108.0 18.7 24.3 48.2
X 11.7 10.6 6.9 5.4 8.0 3.2 28.0 48.9 38.0 32.0
XI 6.7 2.3 3.8 4.7 2.6 32.6 28.0 16.1 14.7 39.2
XII 1.3 –6.6 –7.7 0.5 0.4 22.0 13.4 0.7 17.0 37.3
Results and discussion
Statistic analysis indicates the important influence of intercrops on the content of
mineral nitrogen which was determined in soil profile in autumn (Table 2). The highest
content of mineral nitrogen in soil was determined on control object, without intercrops
cultivation. It is consistent with the results of research of Fotyma [9] and Nowakowski
and Krüger [4], who found that in autumn at the end of the growing season of plants as
a result of reduced nitrogen taking up and mineralization of organic nitrogen may
increase the content of this component in the soil again. In own researches introduction
the intercrops to the cultivation, especially non-papilionaceous plants (Italian ryegrass
and oil radish) significantly decreased the content of mineral nitrogen in the soil. Also
after white clover the content of mineral nitrogen in soil was significantly lower than in
control object, but higher than noted after intercrops cultivation from non-papiliona-
ceous plants. Losses of mineral nitrogen in the soil found in late autumn following
Effect of Intercrops on the Content of Mineral Nitrogen in Soil... 997
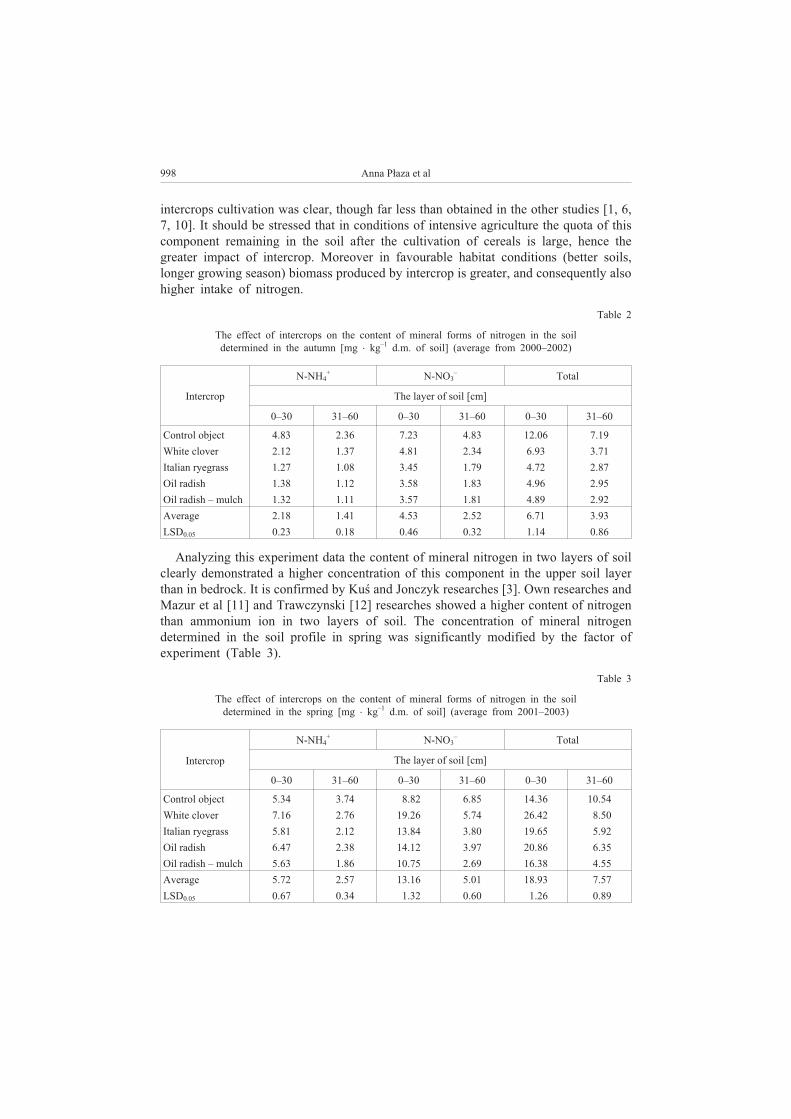
intercrops cultivation was clear, though far less than obtained in the other studies [1, 6,
7, 10]. It should be stressed that in conditions of intensive agriculture the quota of this
component remaining in the soil after the cultivation of cereals is large, hence the
greater impact of intercrop. Moreover in favourable habitat conditions (better soils,
longer growing season) biomass produced by intercrop is greater, and consequently also
higher intake of nitrogen.
Table 2
The effect of intercrops on the content of mineral forms of nitrogen in the soil
determined in the autumn [mg � kg–1
d.m. of soil] (average from 2000–2002)
Intercrop
N-NH4
+N-NO3
–Total
The layer of soil [cm]
0–30 31–60 0–30 31–60 0–30 31–60
Control object 4.83 2.36 7.23 4.83 12.06 7.19
White clover 2.12 1.37 4.81 2.34 6.93 3.71
Italian ryegrass 1.27 1.08 3.45 1.79 4.72 2.87
Oil radish 1.38 1.12 3.58 1.83 4.96 2.95
Oil radish – mulch 1.32 1.11 3.57 1.81 4.89 2.92
Average 2.18 1.41 4.53 2.52 6.71 3.93
LSD0.05 0.23 0.18 0.46 0.32 1.14 0.86
Analyzing this experiment data the content of mineral nitrogen in two layers of soil
clearly demonstrated a higher concentration of this component in the upper soil layer
than in bedrock. It is confirmed by Kuœ and Jonczyk researches [3]. Own researches and
Mazur et al [11] and Trawczynski [12] researches showed a higher content of nitrogen
than ammonium ion in two layers of soil. The concentration of mineral nitrogen
determined in the soil profile in spring was significantly modified by the factor of
experiment (Table 3).
Table 3
The effect of intercrops on the content of mineral forms of nitrogen in the soil
determined in the spring [mg � kg–1
d.m. of soil] (average from 2001–2003)
Intercrop
N-NH4
+N-NO3
–Total
The layer of soil [cm]
0–30 31–60 0–30 31–60 0–30 31–60
Control object 5.34 3.74 8.82 6.85 14.36 10.54
White clover 7.16 2.76 19.26 5.74 26.42 8.50
Italian ryegrass 5.81 2.12 13.84 3.80 19.65 5.92
Oil radish 6.47 2.38 14.12 3.97 20.86 6.35
Oil radish – mulch 5.63 1.86 10.75 2.69 16.38 4.55
Average 5.72 2.57 13.16 5.01 18.93 7.57
LSD0.05 0.67 0.34 1.32 0.60 1.26 0.89
998 Anna P³aza et al
Introduction of intercrops into the cultivation significantly increased the content of
mineral nitrogen in the soil, especially after white clover plowing down. This positive
impact which aim is to stimulate the processes of mineralization of organic nitrogen in
the soil, referred to as “priming effect” [7, 9, 12]. Significantly lower content of mineral
nitrogen in the soil was recorded after plowing down of the non-papilionaceous plants,
and the lowest after oil radish left in the form of mulch till spring. Kuœ and Joñczyk [3]
and Nowakowski and Krüger [4] claimed that intercrop biomass left till spring on the
surface of the field is degraded slower than on objects with ploughing. It has shown that
the use of such a solution poses less risk of potential loss of nitrogen from the soil
during the autumn–winter period. Analyzing the content of mineral forms of nitrogen in
the soil, in spring and autumn higher concentration of nitrate ions was noted than
ammonium ions. It is similar to Möler and Stiner [7] and Mazur et al [11] researches. It
should be noted, that problems with limiting the losses of nitrogen in the soil, including
the cultivation of intercrops, gain a particular relevance in recent period.
Conclusion
1. Intercrops introduction into the cultivation significantly reduced the content of
mineral nitrogen in the soil in autumn, and increased in spring. The highest
concentration of nitrate and ammonium ions was noted in soil in spring, after white
clover plowing.
2. Mulching the surface of the soil in the period of winter by stubble crop from oil
radish significantly decreased the content of mineral nitrogen in the soil in spring. In
autumn and spring, on every object the highest concentration of nitrate ions was noted
than ammonium ions.
3. The top layer of soil characterized with higher mineral nitrogen content than the
lower layer.
References
[1] Buchner W. and Apel B.: Top Agrar. 1989, 6, 52–56.
[2] Duer I.: Fragm. Agronom. 1996, 1(49), 29–43.
[3] Kuœ J. and Joñczyk K.: Roczn. Nauk Roln., 1999, Ser. A, 114(3–4), 83–95.
[4] Nowakowski M. and Krüger K.W.: Biul. Inst. Hodow. Aklim. Roœl. 1997, 202, 105–115.
[5] Songin W.: Post. Nauk Roln. 1998, 2, 43–51.
[6] Jackson L.E., Wyland L.J. and Stivers L.J.: J. Agric. Sci. 1993, 121, 55–62.
[7] Möler K. and Stinner W.: Eur. J. Agronom. 2009, 30, 1–16.
[8] Ostrowska A., Gawliñski S. and Szczubia³ka Z.: Metody analizy i oceny w³aœciwoœci gleb i roœlin. Inst.
Ochr. Œrod., Warszawa rok???, 331 pp. (in Polish).
[9] Fotyma E.: Zesz. Probl. Post. Nauk Roln. 1996, 440, 89–100.
[10] Hansen B., Kristensen E.S., Grant R., Hogh-Jensen H., Simmelsgaard S.E. and Olsen J.E.: Eur.
J. Agronom. 2000, 13, 65–82.
[11] Mazur T., Wojtas A., S¹dej W. and Mazur Z.: Zesz. Probl. Post. Nauk Roln. 1996, 440, 257–261.
[12] Trawczyñski C.: Biul. Inst. Hodow. Aklim. Roœl. 2001, 217, 177–185.
Effect of Intercrops on the Content of Mineral Nitrogen in Soil... 999
WP£YW MIÊDZYPLONÓW NA ZAWARTOŒÆ AZOTU MINERALNEGO
W GLEBIE JESIENI¥ I WIOSN¥
Katedra Szczegó³owej Uprawy Roœlin
Akademia Podlaska w Siedlcach
Abstrakt: Celem przeprowadzonych badañ by³o okreœlenie wp³ywu wsiewek miêdzyplonowych i miêdzy-
plonów œcierniskowych na zawartoœæ mineralnych form azotu oznaczonego w profilu glebowym jesieni¹
i wiosn¹.
Badania polowe przeprowadzono w RSD w Zawadach nale¿¹cej do Akademii Podlaskiej w Siedlcach.
W doœwiadczeniu badano nastêpuj¹ce kombinacje miêdzyplonów: obiekt kontrolny (bez miêdzyplonu),
wsiewka miêdzyplonowa – biomasa przyorana jesieni¹ (koniczyna bia³a, ¿ycica wielokwiatowa), miêdzyplon
œcierniskowy – biomasa przyorana jesieni¹ (rzodkiew oleista), miêdzyplon œcierniskowy – biomasa pozosta-
wiona do wiosny w formie mulczu (rzodkiew oleista). Zawartoœæ jonów amonowych i azotanowych
oznaczono dwukrotnie, tj. jesieni¹ i wiosn¹, w dwóch warstwach gleby (0–30 i 31–60 cm). Otrzymane wyniki
pozwalaj¹ stwierdziæ, i¿ wprowadzenie do uprawy miêdzyplonów zmniejsza³o zawartoœæ azotu mineralnego
w glebie jesieni¹, a zwiêksza³o wiosn¹. Najwiêksze stê¿enie jonów amonowych i azotanowych odnotowano
w glebie wiosn¹, po przyoraniu koniczyny bia³ej. Mulczowanie powierzchni gleby w okresie zimy
miêdzyplonem œcierniskowym z rzodkwi oleistej zmniejsza³o zawartoœæ azotu mineralnego wiosn¹.
S³owa kluczowe: wsiewka miêdzyplonowa, miêdzyplon œcierniskowy, mulcz, azot mineralny, gleba
1000 Anna P³aza et al
Wiera S¥DEJ1, Teresa BOWSZYS
2
and Anna NAMIOTKO1
LEACHING OF NITROGEN FORMS
FROM SOIL FERTILIZED WITH SEWAGE SLUDGE
WYMYWANIE FORM AZOTU
Z GLEBY NAWO¯ONEJ OSADAMI ŒCIEKOWYMI
Abstract: The aim of the study has been to evaluate the extent of loss of various nitrogen forms leached from
soil fertilized with sewage sludge, farmyard manure and NPK. Sewage sludge and FYM were applied as a
single dose of 10 Mg � ha–1
or two doses, each of 5 Mg � ha–1
. It has been demonstrated that all the objects
fertilized with sewage sludge of sewage based composts experienced more severe leaching of total nitrogen
and nitrogen forms compared with the control. More total nitrogen was leached from soil to which sewage
sludge was introduced as a dose divided into two applications (2 × 5 Mg � ha–1
) than from soil which received
a single rate of this fertilizer (10 Mg � ha–1
). Nitrate(V) nitrogen dominated among the mineral forms of
nitrogen in soil filtrate. Higher loss of this nitrogen form occurred in treatments receiving compost made from
sewage sludge with straw (10 Mg � ha–1
) or dried and granulated sewage sludge than when composted sewage
sludge or traditional fertilization were applied. Water was more polluted with N-NH4
+when sewage sludge
compost was used, but when it was made with straw, N-NO2
–was the predominant water pollutant.
Keywords: nitrogen leaching, sewage sludge, compost, soil
Soil fertilization with rates of nutrients higher than demanded by crops may cause
changes in the ionic equilibrium of soil solution and contribute to migration of nutrients
to surface and groundwater. Thus, it is necessary to determine the level of loss of
nutrients in order to guarantee suitable crop nutrition while protecting natural
environment from pollution. Being a source of nutrients and organic matter, sludge
from wastewater treatment plants can be used to fertilize soil, once it meets the norms
established to monitor the content of heavy metals and pathogenic microorganisms.
Amounts of nitrogen washed from soil depend on several factors, including types and
rates of fertilizers. Many authors claim that there is positive correlation between the rate
E C O L O G I C A L C H E M I S T R Y A N D E N G I N E E R I N G A
Vol. 16, No. 8 2009
1Department of Environmental Chemistry, University of Warmia and Mazury in Olsztyn, pl. £ódzki 4,
10–727 Olsztyn, Poland, email: [email protected]
2Department of Agricultural Chemistry and Environment Protection, University of Warmia and Mazury in
Olsztyn, ul. M. Oczapowskiego 8, 10–719 Olsztyn, Poland.
of fertilizers and the leaching of nutrients from soil [1]. Many authors indicate that there
is a relationship between rates of fertilizers and amounts of nutrients leached from soil
[2–6]. The concentration of nitrogen in soil leachate is also conditioned by the type of
soil. Mineral forms of this element are highly mobile, particularly when their uptake by
plants is limited or when high rates of fertilizers are introduced to light soils [7].
Migrating downwards the soil profile, nutrients and rainfall can reach groundwater and,
eventually, surface water. One way to monitor quality of this water is via lysimetric
tests [8].
The aim of the present study has been to determine the loss of total nitrogen and
nitrogen forms from soil fertilized with sewage sludge versus analogous loss when
natural and mineral fertilizers are used.
Material and methods
In order to evaluate the effect of sewage sludge on potential leaching of nutrients
from soil, a model lysimetric experiment has been performed under controlled
laboratory conditions. The experiment was established as strict field trials, during which
composted sewage sludge, sewage sludge with straw as well as dried and granulated
sludge were examined. The effect produced by sewage sludge was compared with the
one obtained when conventional fertilization, consisting of FYM or NPK, was used.
Sewage sludge and FYM were applied as a single rate of 10 Mg � ha–1
in the first year of
the experiment, or an identical dose divided into two treatments, each of 5 Mg � ha–1
,
introduced to soil in the first and third year of the trials. The soil used in this lysimetric
experiment was sampled from three soil horizons: 0–30 cm, 31–60 cm and 61–90 cm.
While filling lysimeters with soil material, the original position of soil genetic layers
was maintained so as to create conditions as close as possible to the ones in the field. In
total, each cylinder was filled with 7.5 kg soil, ie 2.5 kg from each soil horizon.
For washing the soil, redistilled water was used in the amount corresponding to the
average annual rainfall in the province of Warmia and Mazury (605 mm).
The following determinations were made in the soil filtrate: total nitrogen by
Kjedahl’s method, ammonia nitrogen by colorimetry with Nessler’s reagent, nitrate(V)
nitrogen using an ion-selective electrode, nitrate(III) nitrogen by colorimetry with
sulphanilic acid and 1-naphthylamine. Organic nitrogen was calculated as a difference
between total and mineral nitrogen.
Results and discussion
In most of the treatments fertilized with sewage sludge or sludge composts, the
amounts of total nitrogen and nitrogen forms leached from soil were lower than in the
control objects or the treatments involving mineral fertilization (Tables 1–6). The
amounts of leached forms of nitrogen in fertilized objects were varied and depended on
the type of a fertilizer and its application method. More total nitrogen was leached from
the soil to which fertilizers were introduced in doses divided into two applications
(2 × 5 Mg � ha–1
) compared with the one which received the same rate of fertilizers
1002 Wiera S¹dej et al
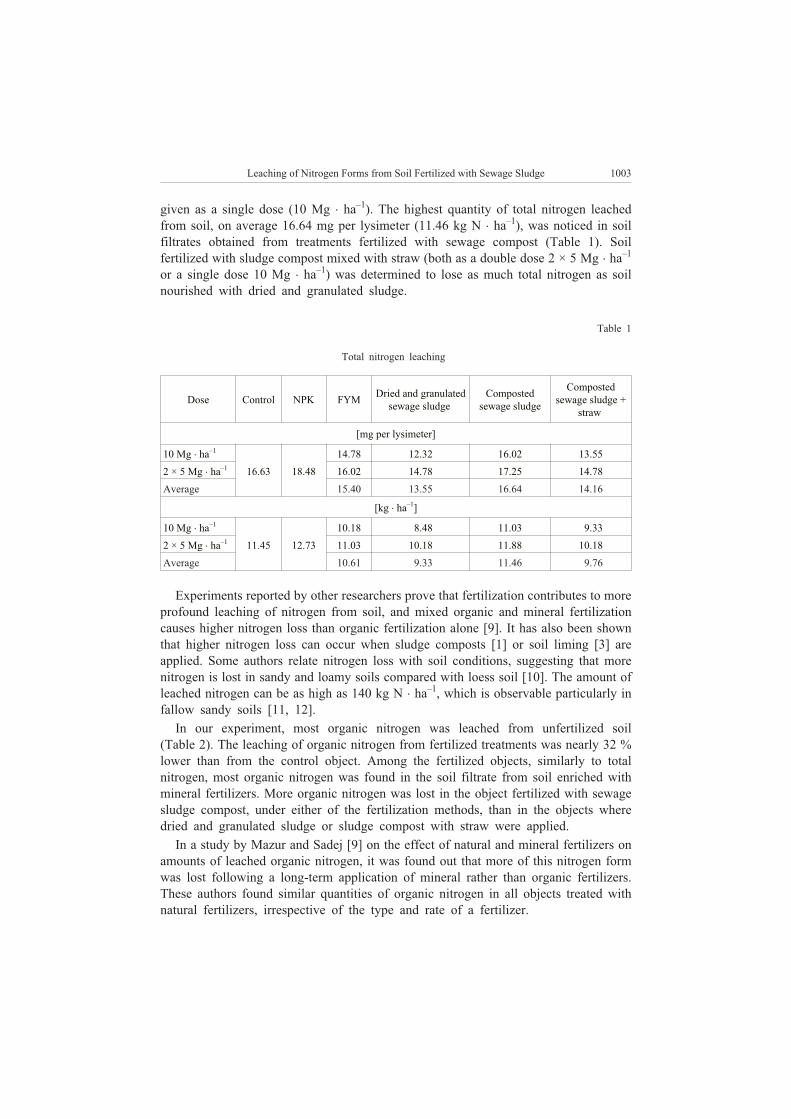
given as a single dose (10 Mg � ha–1
). The highest quantity of total nitrogen leached
from soil, on average 16.64 mg per lysimeter (11.46 kg N � ha–1
), was noticed in soil
filtrates obtained from treatments fertilized with sewage compost (Table 1). Soil
fertilized with sludge compost mixed with straw (both as a double dose 2 × 5 Mg � ha–1
or a single dose 10 Mg � ha–1
) was determined to lose as much total nitrogen as soil
nourished with dried and granulated sludge.
Table 1
Total nitrogen leaching
Dose Control NPK FYMDried and granulated
sewage sludge
Composted
sewage sludge
Composted
sewage sludge +
straw
[mg per lysimeter]
10 Mg � ha–1
16.63 18.48
14.78 12.32 16.02 13.55
2 × 5 Mg � ha–1
16.02 14.78 17.25 14.78
Average 15.40 13.55 16.64 14.16
[kg � ha–1
]
10 Mg � ha–1
11.45 12.73
10.18 8.48 11.03 9.33
2 × 5 Mg � ha–1
11.03 10.18 11.88 10.18
Average 10.61 9.33 11.46 9.76
Experiments reported by other researchers prove that fertilization contributes to more
profound leaching of nitrogen from soil, and mixed organic and mineral fertilization
causes higher nitrogen loss than organic fertilization alone [9]. It has also been shown
that higher nitrogen loss can occur when sludge composts [1] or soil liming [3] are
applied. Some authors relate nitrogen loss with soil conditions, suggesting that more
nitrogen is lost in sandy and loamy soils compared with loess soil [10]. The amount of
leached nitrogen can be as high as 140 kg N � ha–1
, which is observable particularly in
fallow sandy soils [11, 12].
In our experiment, most organic nitrogen was leached from unfertilized soil
(Table 2). The leaching of organic nitrogen from fertilized treatments was nearly 32 %
lower than from the control object. Among the fertilized objects, similarly to total
nitrogen, most organic nitrogen was found in the soil filtrate from soil enriched with
mineral fertilizers. More organic nitrogen was lost in the object fertilized with sewage
sludge compost, under either of the fertilization methods, than in the objects where
dried and granulated sludge or sludge compost with straw were applied.
In a study by Mazur and Sadej [9] on the effect of natural and mineral fertilizers on
amounts of leached organic nitrogen, it was found out that more of this nitrogen form
was lost following a long-term application of mineral rather than organic fertilizers.
These authors found similar quantities of organic nitrogen in all objects treated with
natural fertilizers, irrespective of the type and rate of a fertilizer.
Leaching of Nitrogen Forms from Soil Fertilized with Sewage Sludge 1003
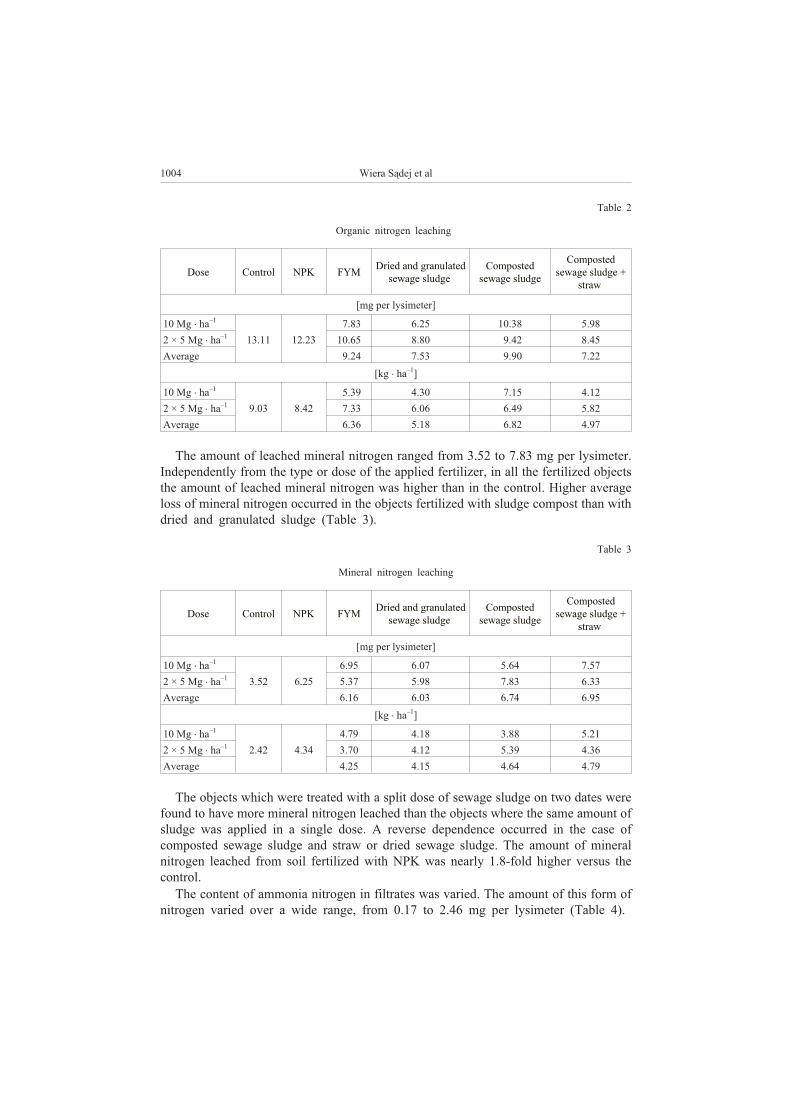
Table 2
Organic nitrogen leaching
Dose Control NPK FYMDried and granulated
sewage sludge
Composted
sewage sludge
Composted
sewage sludge +
straw
[mg per lysimeter]
10 Mg � ha–1
13.11 12.23
7.83 6.25 10.38 5.98
2 × 5 Mg � ha–1
10.65 8.80 9.42 8.45
Average 9.24 7.53 9.90 7.22
[kg � ha–1
]
10 Mg � ha–1
9.03 8.42
5.39 4.30 7.15 4.12
2 × 5 Mg � ha–1
7.33 6.06 6.49 5.82
Average 6.36 5.18 6.82 4.97
The amount of leached mineral nitrogen ranged from 3.52 to 7.83 mg per lysimeter.
Independently from the type or dose of the applied fertilizer, in all the fertilized objects
the amount of leached mineral nitrogen was higher than in the control. Higher average
loss of mineral nitrogen occurred in the objects fertilized with sludge compost than with
dried and granulated sludge (Table 3).
Table 3
Mineral nitrogen leaching
Dose Control NPK FYMDried and granulated
sewage sludge
Composted
sewage sludge
Composted
sewage sludge +
straw
[mg per lysimeter]
10 Mg � ha–1
3.52 6.25
6.95 6.07 5.64 7.57
2 × 5 Mg � ha–1
5.37 5.98 7.83 6.33
Average 6.16 6.03 6.74 6.95
[kg � ha–1
]
10 Mg � ha–1
2.42 4.34
4.79 4.18 3.88 5.21
2 × 5 Mg � ha–1
3.70 4.12 5.39 4.36
Average 4.25 4.15 4.64 4.79
The objects which were treated with a split dose of sewage sludge on two dates were
found to have more mineral nitrogen leached than the objects where the same amount of
sludge was applied in a single dose. A reverse dependence occurred in the case of
composted sewage sludge and straw or dried sewage sludge. The amount of mineral
nitrogen leached from soil fertilized with NPK was nearly 1.8-fold higher versus the
control.
The content of ammonia nitrogen in filtrates was varied. The amount of this form of
nitrogen varied over a wide range, from 0.17 to 2.46 mg per lysimeter (Table 4).
1004 Wiera S¹dej et al
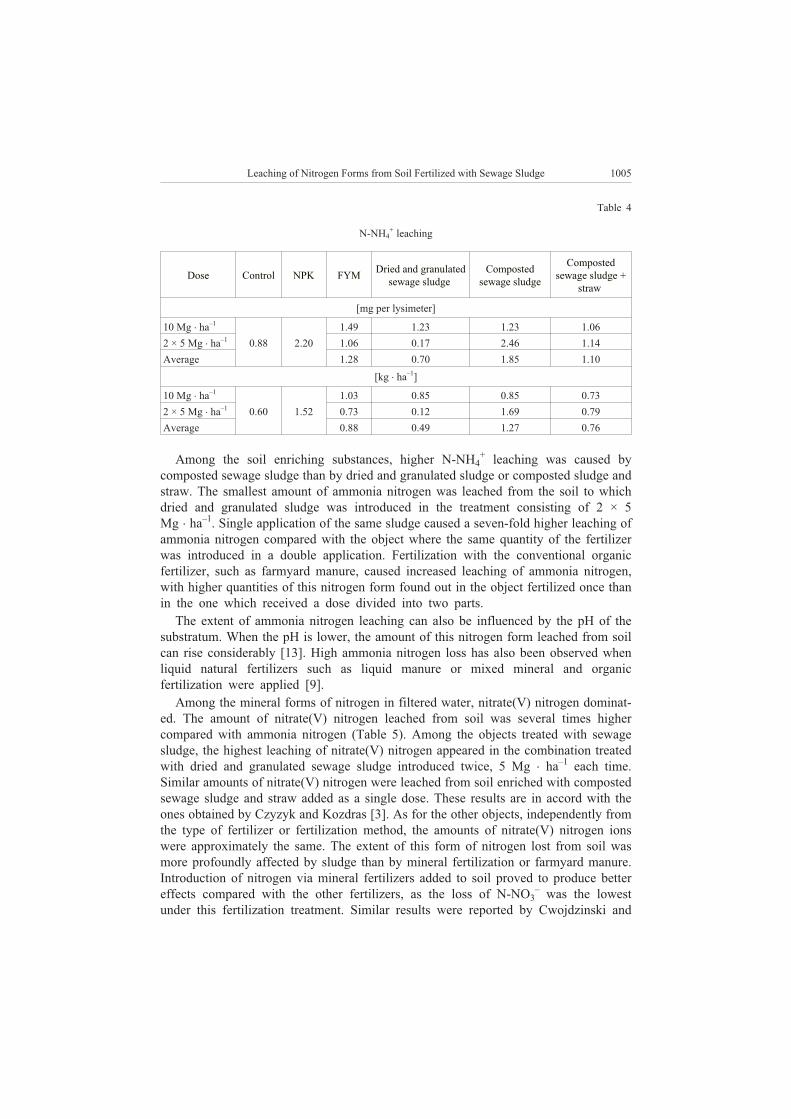
Table 4
N-NH4
+leaching
Dose Control NPK FYMDried and granulated
sewage sludge
Composted
sewage sludge
Composted
sewage sludge +
straw
[mg per lysimeter]
10 Mg � ha–1
0.88 2.20
1.49 1.23 1.23 1.06
2 × 5 Mg � ha–1
1.06 0.17 2.46 1.14
Average 1.28 0.70 1.85 1.10
[kg � ha–1
]
10 Mg � ha–1
0.60 1.52
1.03 0.85 0.85 0.73
2 × 5 Mg � ha–1
0.73 0.12 1.69 0.79
Average 0.88 0.49 1.27 0.76
Among the soil enriching substances, higher N-NH4
+leaching was caused by
composted sewage sludge than by dried and granulated sludge or composted sludge and
straw. The smallest amount of ammonia nitrogen was leached from the soil to which
dried and granulated sludge was introduced in the treatment consisting of 2 × 5
Mg � ha–1
. Single application of the same sludge caused a seven-fold higher leaching of
ammonia nitrogen compared with the object where the same quantity of the fertilizer
was introduced in a double application. Fertilization with the conventional organic
fertilizer, such as farmyard manure, caused increased leaching of ammonia nitrogen,
with higher quantities of this nitrogen form found out in the object fertilized once than
in the one which received a dose divided into two parts.
The extent of ammonia nitrogen leaching can also be influenced by the pH of the
substratum. When the pH is lower, the amount of this nitrogen form leached from soil
can rise considerably [13]. High ammonia nitrogen loss has also been observed when
liquid natural fertilizers such as liquid manure or mixed mineral and organic
fertilization were applied [9].
Among the mineral forms of nitrogen in filtered water, nitrate(V) nitrogen dominat-
ed. The amount of nitrate(V) nitrogen leached from soil was several times higher
compared with ammonia nitrogen (Table 5). Among the objects treated with sewage
sludge, the highest leaching of nitrate(V) nitrogen appeared in the combination treated
with dried and granulated sewage sludge introduced twice, 5 Mg � ha–1
each time.
Similar amounts of nitrate(V) nitrogen were leached from soil enriched with composted
sewage sludge and straw added as a single dose. These results are in accord with the
ones obtained by Czyzyk and Kozdras [3]. As for the other objects, independently from
the type of fertilizer or fertilization method, the amounts of nitrate(V) nitrogen ions
were approximately the same. The extent of this form of nitrogen lost from soil was
more profoundly affected by sludge than by mineral fertilization or farmyard manure.
Introduction of nitrogen via mineral fertilizers added to soil proved to produce better
effects compared with the other fertilizers, as the loss of N-NO3
–was the lowest
under this fertilization treatment. Similar results were reported by Cwojdzinski and
Leaching of Nitrogen Forms from Soil Fertilized with Sewage Sludge 1005
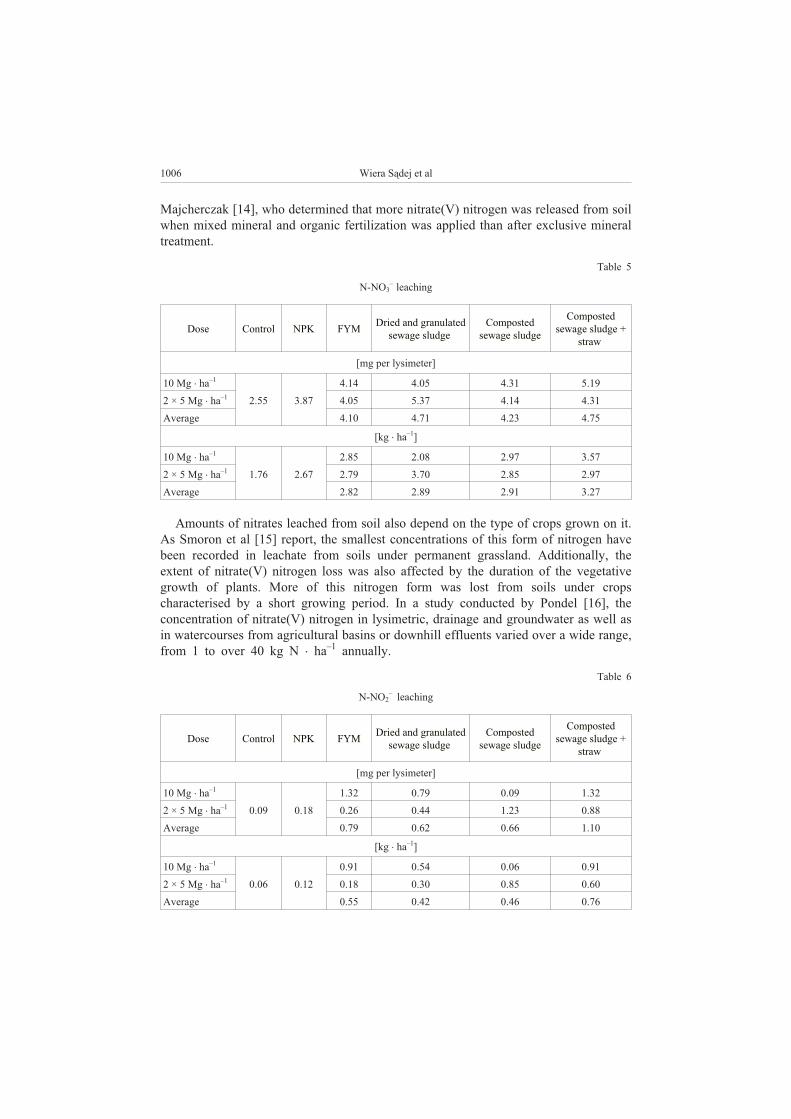
Majcherczak [14], who determined that more nitrate(V) nitrogen was released from soil
when mixed mineral and organic fertilization was applied than after exclusive mineral
treatment.
Table 5
N-NO3
–leaching
Dose Control NPK FYMDried and granulated
sewage sludge
Composted
sewage sludge
Composted
sewage sludge +
straw
[mg per lysimeter]
10 Mg � ha–1
2.55 3.87
4.14 4.05 4.31 5.19
2 × 5 Mg � ha–1
4.05 5.37 4.14 4.31
Average 4.10 4.71 4.23 4.75
[kg � ha–1
]
10 Mg � ha–1
1.76 2.67
2.85 2.08 2.97 3.57
2 × 5 Mg � ha–1
2.79 3.70 2.85 2.97
Average 2.82 2.89 2.91 3.27
Amounts of nitrates leached from soil also depend on the type of crops grown on it.
As Smoron et al [15] report, the smallest concentrations of this form of nitrogen have
been recorded in leachate from soils under permanent grassland. Additionally, the
extent of nitrate(V) nitrogen loss was also affected by the duration of the vegetative
growth of plants. More of this nitrogen form was lost from soils under crops
characterised by a short growing period. In a study conducted by Pondel [16], the
concentration of nitrate(V) nitrogen in lysimetric, drainage and groundwater as well as
in watercourses from agricultural basins or downhill effluents varied over a wide range,
from 1 to over 40 kg N � ha–1
annually.
Table 6
N-NO2
–leaching
Dose Control NPK FYMDried and granulated
sewage sludge
Composted
sewage sludge
Composted
sewage sludge +
straw
[mg per lysimeter]
10 Mg � ha–1
0.09 0.18
1.32 0.79 0.09 1.32
2 × 5 Mg � ha–1
0.26 0.44 1.23 0.88
Average 0.79 0.62 0.66 1.10
[kg � ha–1
]
10 Mg � ha–1
0.06 0.12
0.91 0.54 0.06 0.91
2 × 5 Mg � ha–1
0.18 0.30 0.85 0.60
Average 0.55 0.42 0.46 0.76
1006 Wiera S¹dej et al
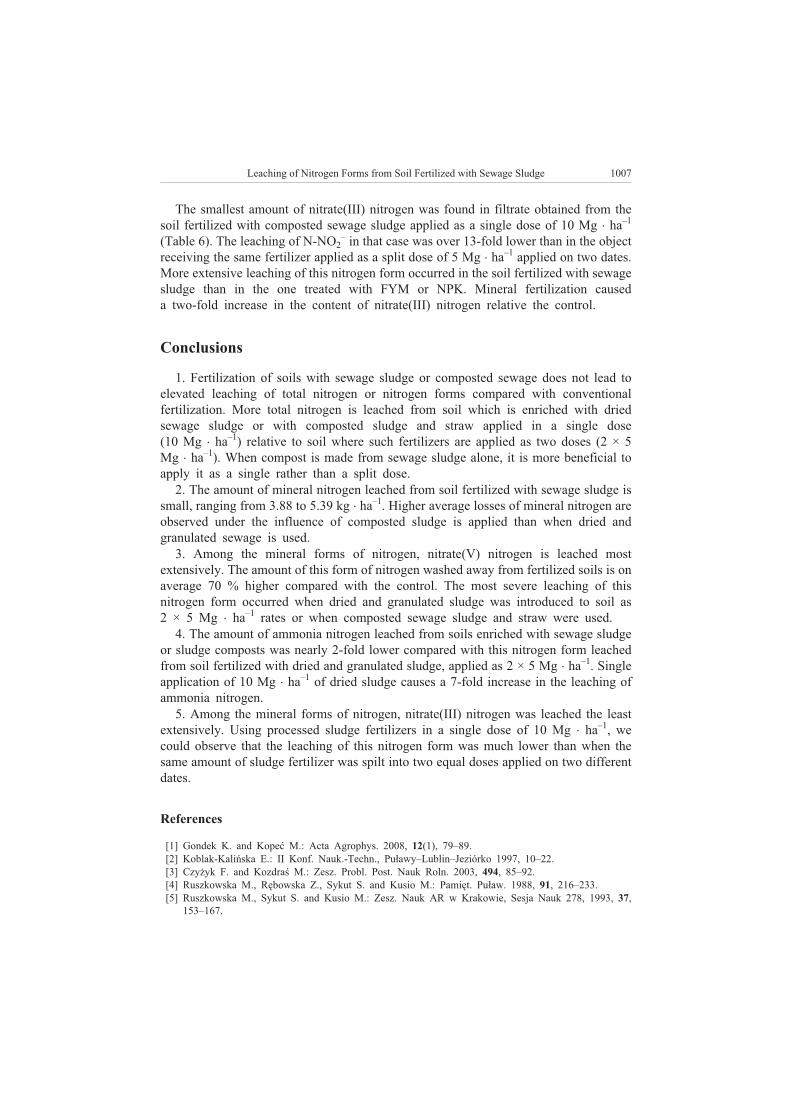
The smallest amount of nitrate(III) nitrogen was found in filtrate obtained from the
soil fertilized with composted sewage sludge applied as a single dose of 10 Mg � ha–1
(Table 6). The leaching of N-NO2
–in that case was over 13-fold lower than in the object
receiving the same fertilizer applied as a split dose of 5 Mg � ha–1
applied on two dates.
More extensive leaching of this nitrogen form occurred in the soil fertilized with sewage
sludge than in the one treated with FYM or NPK. Mineral fertilization caused
a two-fold increase in the content of nitrate(III) nitrogen relative the control.
Conclusions
1. Fertilization of soils with sewage sludge or composted sewage does not lead to
elevated leaching of total nitrogen or nitrogen forms compared with conventional
fertilization. More total nitrogen is leached from soil which is enriched with dried
sewage sludge or with composted sludge and straw applied in a single dose
(10 Mg � ha–1
) relative to soil where such fertilizers are applied as two doses (2 × 5
Mg � ha–1
). When compost is made from sewage sludge alone, it is more beneficial to
apply it as a single rather than a split dose.
2. The amount of mineral nitrogen leached from soil fertilized with sewage sludge is
small, ranging from 3.88 to 5.39 kg � ha–1
. Higher average losses of mineral nitrogen are
observed under the influence of composted sludge is applied than when dried and
granulated sewage is used.
3. Among the mineral forms of nitrogen, nitrate(V) nitrogen is leached most
extensively. The amount of this form of nitrogen washed away from fertilized soils is on
average 70 % higher compared with the control. The most severe leaching of this
nitrogen form occurred when dried and granulated sludge was introduced to soil as
2 × 5 Mg � ha–1
rates or when composted sewage sludge and straw were used.
4. The amount of ammonia nitrogen leached from soils enriched with sewage sludge
or sludge composts was nearly 2-fold lower compared with this nitrogen form leached
from soil fertilized with dried and granulated sludge, applied as 2 × 5 Mg � ha–1
. Single
application of 10 Mg � ha–1
of dried sludge causes a 7-fold increase in the leaching of
ammonia nitrogen.
5. Among the mineral forms of nitrogen, nitrate(III) nitrogen was leached the least
extensively. Using processed sludge fertilizers in a single dose of 10 Mg � ha–1
, we
could observe that the leaching of this nitrogen form was much lower than when the
same amount of sludge fertilizer was spilt into two equal doses applied on two different
dates.
References
[1] Gondek K. and Kopeæ M.: Acta Agrophys. 2008, 12(1), 79–89.
[2] Koblak-Kaliñska E.: II Konf. Nauk.-Techn., Pu³awy–Lublin–Jeziórko 1997, 10–22.
[3] Czy¿yk F. and Kozdraœ M.: Zesz. Probl. Post. Nauk Roln. 2003, 494, 85–92.
[4] Ruszkowska M., Rêbowska Z., Sykut S. and Kusio M.: Pamiêt. Pu³aw. 1988, 91, 216–233.
[5] Ruszkowska M., Sykut S. and Kusio M.: Zesz. Nauk AR w Krakowie, Sesja Nauk 278, 1993, 37,
153–167.
Leaching of Nitrogen Forms from Soil Fertilized with Sewage Sludge 1007
[6] Mazur T.: Materia³y Sympozjum nt. Przyrodnicze i antropogeniczne przyczyny oraz skutki zakwaszenia
gleb. Wyd. AR, Lublin 1993, 19–26.
[7] Pondel H., Ruszkowska M., Sykut S. and Terelak H.: Roczn. Glebozn. 1991, XLII(3/4), 97–107.
[8] Sykut S. and Ruszkowska M.: Zesz. Probl. Post. Nauk Roln. 1996, 440, 375–379.
[9] Mazur T. and S¹dej W.: Folia Univ. Agric. Stetin, AR-T Olsztyn 1999, 257–261.
[10] Sykut S.: Pamiêt. Pu³aw. 1993, 103, 11–33.
[11] Mroczkowski W., Sykut S. and Ruszkowska M.: Pamiêt. Pu³aw. 1997, 111, 89–102.
[12] Terelak H., Terelak-Motowicka T., Sadurski W. and Tujaka A.: Stan i antropogeniczne zmiany jakoœci
wód w Polsce. Wyd. Uniwersytetu £ódzkiego, £ódŸ 2000, 269–277.
[13] Spychaj-Fabisiak E. and Murawska B.: Zesz. Probl. Post. Nauk Roln. 1994, 414, 21–28.
[14] Cwojdziñski W. and Majcherczak E.: Zesz. Probl. Post. Nauk Roln. 1993, 411, 107–112.
[15] Smoroñ S., Kopeæ S. and Misztal A.: Zesz. Probl. Post. Nauk Roln. 1996, 440, 367–374.
[16] Pondel H.: Some aspects of chemical contamination of soil. MAB Scope. Wyd. PAN, Warszawa 1989,
11–39.
WYMYWANIE FORM AZOTU Z GLEBY NAWO¯ONEJ OSADAMI ŒCIEKOWYMI
Katedra Chemii Œrodowiska, Uniwersytet Warmiñsko-Mazurski w Olsztynie
Katedra Chemii Rolnej i Ochrony Œrodowiska, Uniwersytet Warmiñsko-Mazurski w Olsztynie
Abstrakt: Celem badañ by³o okreœlenie iloœci strat ró¿nych form azotu na drodze wymycia z gleby
nawo¿onej osadami œciekowymi, obornikiem i NPK. Osady œciekowe i obornik zastosowano jednorazowo
w dawce 10 Mg � ha–1
oraz dwukrotnie po 5 Mg � ha–1
w pierwszym i w trzecim roku doœwiadczenia.
Wykazano, ¿e we wszystkich obiektach, na których stosowano dodatki u¿yŸniaj¹ce w postaci osadów
œciekowych lub kompostów z nich wytworzonych wymycie azotu ogó³em i jego form by³o wiêksze
w porównaniu z obiektem kontrolnym. Wiêksze iloœci azotu ogó³em wymyto z gleby, do której wprowadzano
osady œciekowe w dawce podzielonej na dwie czêœci (2 × 5 Mg � ha–1
) w porównaniu do gleby, gdzie
zastosowano je w dawce jednorazowej (10 Mg � ha–1
). Spoœród mineralnych form azotu w wodach
przesi¹kowych dominowa³ azot azotanowy(V). Wiêksze straty tej formy azotu notowano w obiektach
nawo¿onych kompostem z osadu œciekowego z dodatkiem s³omy (10 Mg � ha–1
) oraz wysuszonym
i zgranulowanym osadem œciekowym (2 × 5 Mg � ha–1
) w porównaniu z kompostowanym osadem œciekowym
oraz nawo¿eniem tradycyjnym. Do zanieczyszczenia wody N-NH4
+w najwiêkszym stopniu przyczyni³ siê
kompost z samych osadów œciekowych, natomiast N-NO2
–kompost ten z dodatkiem s³omy.
S³owa kluczowe: wymywanie azotu, osady œciekowe, kompost, gleba
1008 Wiera S¹dej et al
S³awomir SMÓLCZYÑSKI1
MINERALIZATION OF NITROGEN COMPOUNDS
IN UPPER-SILTED ORGANIC SOILS
OF NORTH-EASTERN POLAND
MINERALIZACJA ZWI¥ZKÓW AZOTU
W ODGÓRNIE NAMULONYCH GLEBACH ORGANICZNYCH
POLSKI PÓ£NOCNO-WSCHODNIEJ
Abstract: The paper deals with the changes in the content of nitrate and ammonium nitrogen after incubation
of undisturbed soil samples, the redox potential (Eh), and oxygen diffusion rate (ODR) in mucky and
peat-muck soils, strongly and slightly silted, occurring in two young glacial landscapes (morainic and of
ice-dammed lakes). The highest amounts of inorganic nitrogen were released in slightly silted peat-muck
soils, and the least in mucky soils. In the soils of the landscape of ice-dammed lakes, the redox potential, the
oxygen diffusion rate and amounts of inorganic nitrogen were lower than in the soils of morainic landscape.
The amount of nitrate nitrogen (N-NO3) in soil surface layers oscillated between 4.65 mg � dm–3
and 15.08
mg � dm–3
in the landscape of ice-dammed lakes and between 6.49 mg � dm–3
and 18.23 mg � dm–3
in morainic
landscape. These values suggest that the analysed soils contain very little and medium amounts of nitrates.
Deluvial deposits which accumulated on the surface of organic soils were diminishing the rate of organic
matter mineralization in subsurface peat formations.
Keywords: N-NO3, N-NH4, mucky soils, strongly and slightly silted peat-muck soils, morainic landscape,
landscape of ice-dammed lakes
There is clear distinction between organic soils formed in numerous, irregularly
situated depressions of young glacial landscape of north-eastern Poland and such soils
in other regions of Poland. The relief induces slope denudation processes which
contribute to accumulation of deluvial deposits on the soil surface, of various thickness
and texture as well as to silting of soils surface layers occurring farther from the slope.
Consequently, specific soil sequence of mucky and silted peat-muck soils is found [1].
As these soils are formed close to the slopes, they play an important role in nutrients
cycles in young glacial landscape [2, 3]. Moreover, as they contain substantial amounts
E C O L O G I C A L C H E M I S T R Y A N D E N G I N E E R I N G A
Vol. 16, No. 8 2009
1Departament of Soil Science and Soil Protection, Faculty of Environmental Management and
Agriculture, University of Warmia and Mazury in Olsztyn, 10–719 Olsztyn, Poland, phone 89 523 48 46,
email: [email protected]
of organic matter, they can release great amounts of inorganic nitrogen compounds
(N-NO3 and N-NH4) [4]. The nitrates that are not uptaken by plants are washed out
from the soil profile and contribute to contamination of groundwater and surface waters
[5].
Mineralization of organic nitrogen compounds depends on various site factors (soil
moisture, temperature, type of soil formation, degree of transformation by soil-forming
processes and land use) [6] and occurs with seasonal variation, also in winter [7–9]. The
intensity of release of mineral nitrogen compounds in organic soils which are modified
by deluvial process has not been thoroughly analyzed [9].
The aim of the study was to measure the amounts of inorganic nitrogen released in a
toposequence of upper-silted mucky soils and peat-muck soils with different degree of
silting. The deluvial silts of the soils studied, have different texture and are situated in
two different young glacial landscapes: morainic and of ice-dammed lakes.
Materials and methods
For this study, three land depressions in two landscapes were selected. First one is
located in the landscape of ice-dammed lakes in Sepopol Plain (Reszel site) and two
other in morainic landscape in Olsztyn Lakeland (Lutry site) and in Mragowo Lakeland
(Prusinowo site). Along the transect, from the slope to the peatland, the following soil
sequence was found: mucky soils, strongly and slightly silted peat-muck soils. In mucky
soils, the surface horizon has thickness of 30 cm and consists of organic-mineral
deluvium. It contains 10–20 % of organic matter (mean content of organic matter is
given in Tables 4–6). In peat-muck soils, the thickness of muck layers is of 25–33 cm,
and the muck-forming process is medium advanced.
At Reszel site, on the slopes surrounding the peatland, black earths that were formed
from clay occur. In a depression, four soil profiles were studied. Two of them were
classified as mucky soils. Deluvial deposit was underlain by the muck layer of the
thickness of 15–20 cm. Medium decomposed reed peat lay underneath. Peat-muck soils
were also developed from reed peat. Black earths, mucky soils and strongly silted
peat-muck soils are drained and used as arable fields. Slightly silted peat-muck soils are
not cultivated.
The soils on the slopes at Lutry site were formed from sandy loam. Mucky soils and
strongly silted peat-muck soils (two soil profiles) were formed on strongly decomposed
alder peats of small thickness, overlying clayey gyttia at a depth of 85 cm. Slightly
silted peat-muck soils were formed on sedge peats that overlie alder peats at a depth of
52 cm. The subsoil at a depth of 80 cm consists of organic gyttia lying on calcareous
gyttia deposits. The soils at Lutry site are used as pastures.
Mucky soils and peat muck soils at Prusinowo site were formed on strongly
decomposed alder peats underlain by medium decomposed reed peats at a depth of
60–140 cm. Calcareous gyttia lies beneath. The soils are used as grasslands.
The research was carried out in summer and winter 2007 and in spring, summer and
autumn 2008. Mineral nitrogen compounds were analyzed in a 100 cm3
undisturbed
core samples (in four replicates) taken from surface horizons (5–10 cm and 15–20 cm)
1010 S³awomir Smólczyñski
and from peat formations underneath. Inorganic nitrogen compounds were determined
in a soil extract of 1 % K2SO4 after 14-day incubation at a temperature of 28oC [6, 11].
During incubation, actual soil moisture content was maintained (soil moisture content at
sampling time). For N-NO3 determination, phenoldisulphonic acid was used and for
N-NH4, Nessler’s reagent was applied.
Furthermore, basic soil physical properties (loss-on-ignition, bulk density, specific
density, moisture at sampling time, total porosity) were determined. The oxygen
diffusion rate (ODR) and the redox potential (Eh) were measured in field conditions.
The rH factor was calculated on the base of Eh and pH according to the formula:
rH = Eh � 29–1
+2pH.
Statistical analyses were conducted with Statitsica 8.0.
Results and discussion
The amount of released nitrate and ammonium nitrogen as well as the values of the
parameters determining water-air properties of soils (groundwater level, moisture
content, air content, ODR, Eh) showed seasonal variations (Tables 1–3). The results for
surface layers (5–10 cm) of some chosen soil profiles (mucky soils, strongly and
slightly silted peat-muck soils), demonstrating the highest dynamics of moisture and air
conditions, were presented.
The lowest groundwater level was reported for the soils at Lutry site in summer 2008
(0.90–1.15 m below ground level) and in autumn 2008 (0.85–1.05 m below ground
level) (Table 1). In summer 2007 and spring 2008, the groundwater level was high and
oscillated between 0.25 and 0.378 m below ground level. In the soils at Prusinowo site,
this level was the lowest in summer 2008 (0.72–0.90 m below ground level) (Table 2)
whereas in other seasons it oscillated between 0.35 and 0.60 m below ground level. In
the soils at Reszel site, in autumn 2008, the groundwater dropped to 0.90 m below
ground level (Table 3) and in other seasons it was between 0.35 and 0.65 m below
ground level. At the studied sites, irrespective of the season, the highest groundwater
level was observed in slightly silted peat-muck soils.
The drying of surface horizons was accompanied by the decrease of groundwater
level. In summer 2008, the amount of air (39.4 % vol.) in strongly silted muck horizons
at Lutry site was equal to half of total porosity (Table 1). In the periods when soils were
drying, an increase of ODR factor was observed. In each season, the redox potential
(Eh) also showed variations. However the Eh values were not related to the moisture or
air content in the soil, but resulted from various resistance of the studied formation to
oxidation and reduction processes.
The amounts of inorganic nitrogen that were released in the soils, beside seasonal
variations, depended on the soil type and site (Tables 1–3). In Tables 1–3, the content of
nitrogen compounds is expressed in mg � dm–3
of soil dry matter in order to compare the
studied soils to abundance classes suggested by Gotkiewicz [6].
The highest amounts of mineral nitrogen (N-NO3 and N-NH4) were released during
summer and autumn 2008. The relationship between N-NO3 and N-NH4 was typical. In
spring and winter the N-NO3 : N-NH4 ratio exceeded 1.0, which indicates good
Mineralization of Nitrogen Compounds in Upper-Silted Organic Soils... 1011
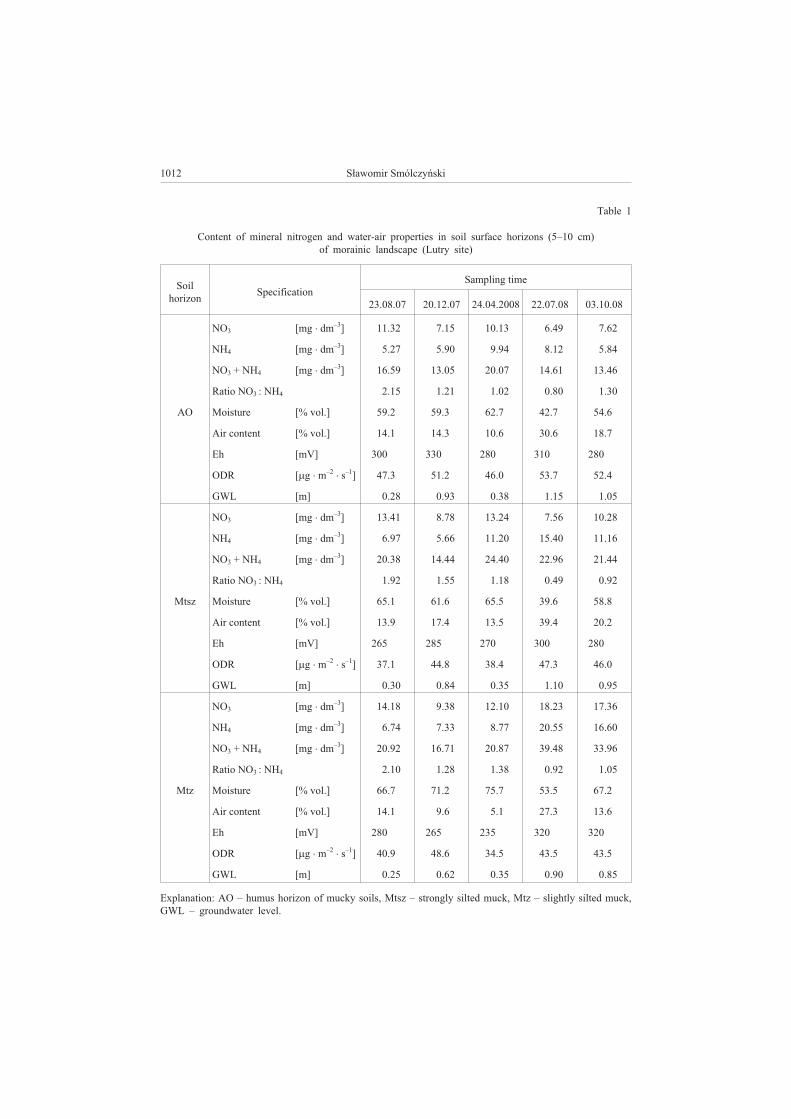
1012 S³awomir Smólczyñski
Table 1
Content of mineral nitrogen and water-air properties in soil surface horizons (5–10 cm)
of morainic landscape (Lutry site)
Soil
horizonSpecification
Sampling time
23.08.07 20.12.07 24.04.2008 22.07.08 03.10.08
AO
NO3 [mg � dm–3
] 11.32 7.15 10.13 6.49 7.62
NH4 [mg � dm–3
] 5.27 5.90 9.94 8.12 5.84
NO3 + NH4 [mg � dm–3
] 16.59 13.05 20.07 14.61 13.46
Ratio NO3 : NH4 2.15 1.21 1.02 0.80 1.30
Moisture [% vol.] 59.2 59.3 62.7 42.7 54.6
Air content [% vol.] 14.1 14.3 10.6 30.6 18.7
Eh [mV] 300 330 280 310 280
ODR [�g � m–2
� s–1
] 47.3 51.2 46.0 53.7 52.4
GWL [m] 0.28 0.93 0.38 1.15 1.05
Mtsz
NO3 [mg � dm–3
] 13.41 8.78 13.24 7.56 10.28
NH4 [mg � dm–3
] 6.97 5.66 11.20 15.40 11.16
NO3 + NH4 [mg � dm–3
] 20.38 14.44 24.40 22.96 21.44
Ratio NO3 : NH4 1.92 1.55 1.18 0.49 0.92
Moisture [% vol.] 65.1 61.6 65.5 39.6 58.8
Air content [% vol.] 13.9 17.4 13.5 39.4 20.2
Eh [mV] 265 285 270 300 280
ODR [�g � m–2
� s–1
] 37.1 44.8 38.4 47.3 46.0
GWL [m] 0.30 0.84 0.35 1.10 0.95
Mtz
NO3 [mg � dm–3
] 14.18 9.38 12.10 18.23 17.36
NH4 [mg � dm–3
] 6.74 7.33 8.77 20.55 16.60
NO3 + NH4 [mg � dm–3
] 20.92 16.71 20.87 39.48 33.96
Ratio NO3 : NH4 2.10 1.28 1.38 0.92 1.05
Moisture [% vol.] 66.7 71.2 75.7 53.5 67.2
Air content [% vol.] 14.1 9.6 5.1 27.3 13.6
Eh [mV] 280 265 235 320 320
ODR [�g � m–2
� s–1
] 40.9 48.6 34.5 43.5 43.5
GWL [m] 0.25 0.62 0.35 0.90 0.85
Explanation: AO – humus horizon of mucky soils, Mtsz – strongly silted muck, Mtz – slightly silted muck,
GWL – groundwater level.
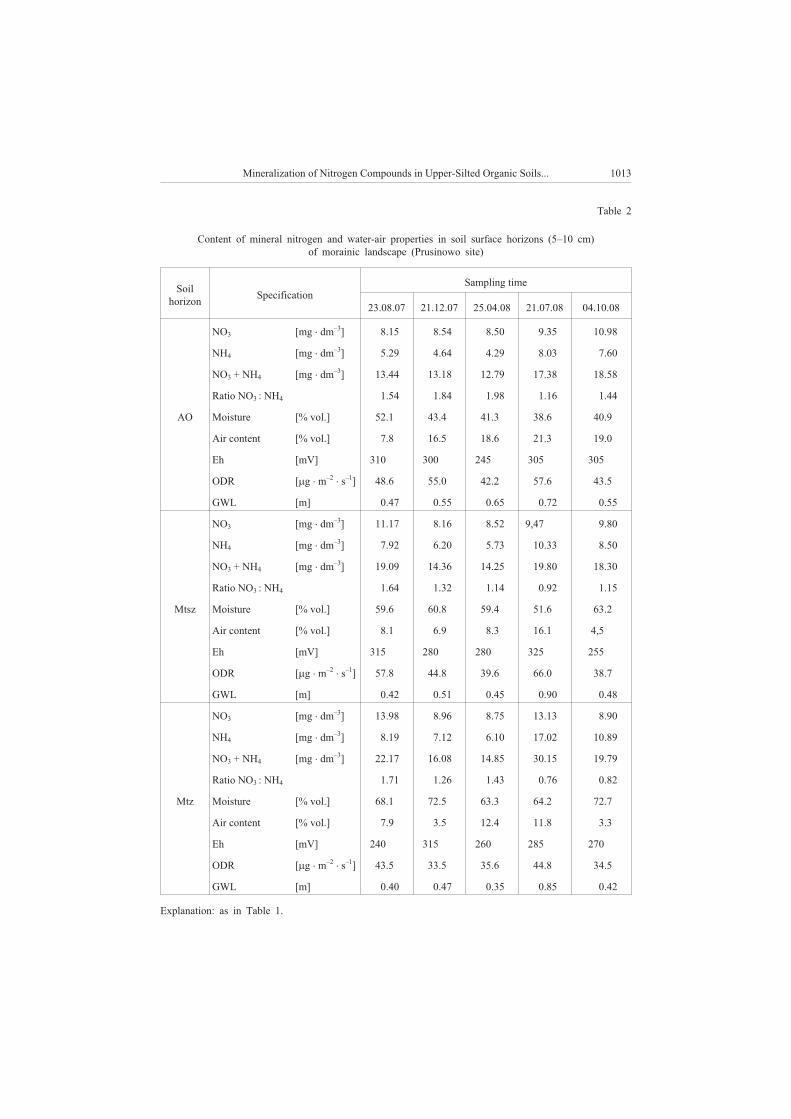
Mineralization of Nitrogen Compounds in Upper-Silted Organic Soils... 1013
Table 2
Content of mineral nitrogen and water-air properties in soil surface horizons (5–10 cm)
of morainic landscape (Prusinowo site)
Soil
horizonSpecification
Sampling time
23.08.07 21.12.07 25.04.08 21.07.08 04.10.08
AO
NO3 [mg � dm–3
] 8.15 8.54 8.50 9.35 10.98
NH4 [mg � dm–3
] 5.29 4.64 4.29 8.03 7.60
NO3 + NH4 [mg � dm–3
] 13.44 13.18 12.79 17.38 18.58
Ratio NO3 : NH4 1.54 1.84 1.98 1.16 1.44
Moisture [% vol.] 52.1 43.4 41.3 38.6 40.9
Air content [% vol.] 7.8 16.5 18.6 21.3 19.0
Eh [mV] 310 300 245 305 305
ODR [�g � m–2
� s–1
] 48.6 55.0 42.2 57.6 43.5
GWL [m] 0.47 0.55 0.65 0.72 0.55
Mtsz
NO3 [mg � dm–3
] 11.17 8.16 8.52 9,47 9.80
NH4 [mg � dm–3
] 7.92 6.20 5.73 10.33 8.50
NO3 + NH4 [mg � dm–3
] 19.09 14.36 14.25 19.80 18.30
Ratio NO3 : NH4 1.64 1.32 1.14 0.92 1.15
Moisture [% vol.] 59.6 60.8 59.4 51.6 63.2
Air content [% vol.] 8.1 6.9 8.3 16.1 4,5
Eh [mV] 315 280 280 325 255
ODR [�g � m–2
� s–1
] 57.8 44.8 39.6 66.0 38.7
GWL [m] 0.42 0.51 0.45 0.90 0.48
Mtz
NO3 [mg � dm–3
] 13.98 8.96 8.75 13.13 8.90
NH4 [mg � dm–3
] 8.19 7.12 6.10 17.02 10.89
NO3 + NH4 [mg � dm–3
] 22.17 16.08 14.85 30.15 19.79
Ratio NO3 : NH4 1.71 1.26 1.43 0.76 0.82
Moisture [% vol.] 68.1 72.5 63.3 64.2 72.7
Air content [% vol.] 7.9 3.5 12.4 11.8 3.3
Eh [mV] 240 315 260 285 270
ODR [�g � m–2
� s–1
] 43.5 33.5 35.6 44.8 34.5
GWL [m] 0.40 0.47 0.35 0.85 0.42
Explanation: as in Table 1.
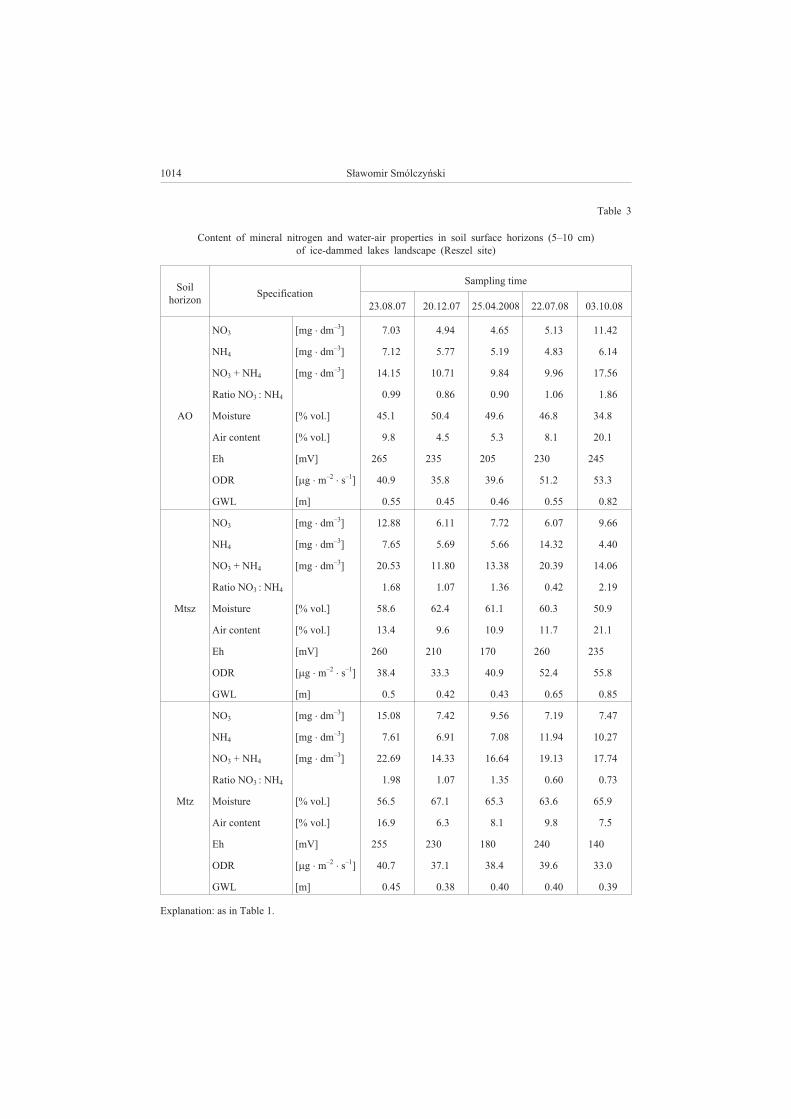
1014 S³awomir Smólczyñski
Table 3
Content of mineral nitrogen and water-air properties in soil surface horizons (5–10 cm)
of ice-dammed lakes landscape (Reszel site)
Soil
horizonSpecification
Sampling time
23.08.07 20.12.07 25.04.2008 22.07.08 03.10.08
AO
NO3 [mg � dm–3
] 7.03 4.94 4.65 5.13 11.42
NH4 [mg � dm–3
] 7.12 5.77 5.19 4.83 6.14
NO3 + NH4 [mg � dm–3
] 14.15 10.71 9.84 9.96 17.56
Ratio NO3 : NH4 0.99 0.86 0.90 1.06 1.86
Moisture [% vol.] 45.1 50.4 49.6 46.8 34.8
Air content [% vol.] 9.8 4.5 5.3 8.1 20.1
Eh [mV] 265 235 205 230 245
ODR [�g � m–2
� s–1
] 40.9 35.8 39.6 51.2 53.3
GWL [m] 0.55 0.45 0.46 0.55 0.82
Mtsz
NO3 [mg � dm–3
] 12.88 6.11 7.72 6.07 9.66
NH4 [mg � dm–3
] 7.65 5.69 5.66 14.32 4.40
NO3 + NH4 [mg � dm–3
] 20.53 11.80 13.38 20.39 14.06
Ratio NO3 : NH4 1.68 1.07 1.36 0.42 2.19
Moisture [% vol.] 58.6 62.4 61.1 60.3 50.9
Air content [% vol.] 13.4 9.6 10.9 11.7 21.1
Eh [mV] 260 210 170 260 235
ODR [�g � m–2
� s–1
] 38.4 33.3 40.9 52.4 55.8
GWL [m] 0.5 0.42 0.43 0.65 0.85
Mtz
NO3 [mg � dm–3
] 15.08 7.42 9.56 7.19 7.47
NH4 [mg � dm–3
] 7.61 6.91 7.08 11.94 10.27
NO3 + NH4 [mg � dm–3
] 22.69 14.33 16.64 19.13 17.74
Ratio NO3 : NH4 1.98 1.07 1.35 0.60 0.73
Moisture [% vol.] 56.5 67.1 65.3 63.6 65.9
Air content [% vol.] 16.9 6.3 8.1 9.8 7.5
Eh [mV] 255 230 180 240 140
ODR [�g � m–2
� s–1
] 40.7 37.1 38.4 39.6 33.0
GWL [m] 0.45 0.38 0.40 0.40 0.39
Explanation: as in Table 1.
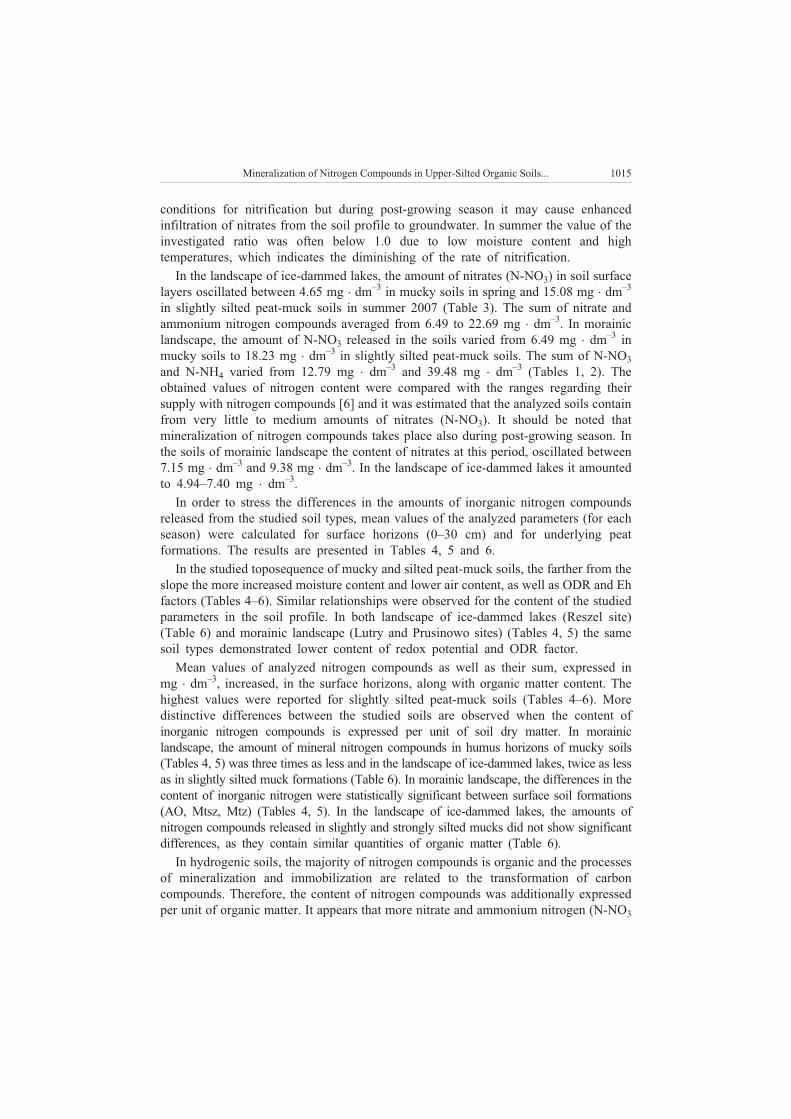
conditions for nitrification but during post-growing season it may cause enhanced
infiltration of nitrates from the soil profile to groundwater. In summer the value of the
investigated ratio was often below 1.0 due to low moisture content and high
temperatures, which indicates the diminishing of the rate of nitrification.
In the landscape of ice-dammed lakes, the amount of nitrates (N-NO3) in soil surface
layers oscillated between 4.65 mg � dm–3
in mucky soils in spring and 15.08 mg � dm–3
in slightly silted peat-muck soils in summer 2007 (Table 3). The sum of nitrate and
ammonium nitrogen compounds averaged from 6.49 to 22.69 mg � dm–3
. In morainic
landscape, the amount of N-NO3 released in the soils varied from 6.49 mg � dm–3
in
mucky soils to 18.23 mg � dm–3
in slightly silted peat-muck soils. The sum of N-NO3
and N-NH4 varied from 12.79 mg � dm–3
and 39.48 mg � dm–3
(Tables 1, 2). The
obtained values of nitrogen content were compared with the ranges regarding their
supply with nitrogen compounds [6] and it was estimated that the analyzed soils contain
from very little to medium amounts of nitrates (N-NO3). It should be noted that
mineralization of nitrogen compounds takes place also during post-growing season. In
the soils of morainic landscape the content of nitrates at this period, oscillated between
7.15 mg � dm–3
and 9.38 mg � dm–3
. In the landscape of ice-dammed lakes it amounted
to 4.94–7.40 mg � dm–3
.
In order to stress the differences in the amounts of inorganic nitrogen compounds
released from the studied soil types, mean values of the analyzed parameters (for each
season) were calculated for surface horizons (0–30 cm) and for underlying peat
formations. The results are presented in Tables 4, 5 and 6.
In the studied toposequence of mucky and silted peat-muck soils, the farther from the
slope the more increased moisture content and lower air content, as well as ODR and Eh
factors (Tables 4–6). Similar relationships were observed for the content of the studied
parameters in the soil profile. In both landscape of ice-dammed lakes (Reszel site)
(Table 6) and morainic landscape (Lutry and Prusinowo sites) (Tables 4, 5) the same
soil types demonstrated lower content of redox potential and ODR factor.
Mean values of analyzed nitrogen compounds as well as their sum, expressed in
mg � dm–3
, increased, in the surface horizons, along with organic matter content. The
highest values were reported for slightly silted peat-muck soils (Tables 4–6). More
distinctive differences between the studied soils are observed when the content of
inorganic nitrogen compounds is expressed per unit of soil dry matter. In morainic
landscape, the amount of mineral nitrogen compounds in humus horizons of mucky soils
(Tables 4, 5) was three times as less and in the landscape of ice-dammed lakes, twice as less
as in slightly silted muck formations (Table 6). In morainic landscape, the differences in the
content of inorganic nitrogen were statistically significant between surface soil formations
(AO, Mtsz, Mtz) (Tables 4, 5). In the landscape of ice-dammed lakes, the amounts of
nitrogen compounds released in slightly and strongly silted mucks did not show significant
differences, as they contain similar quantities of organic matter (Table 6).
In hydrogenic soils, the majority of nitrogen compounds is organic and the processes
of mineralization and immobilization are related to the transformation of carbon
compounds. Therefore, the content of nitrogen compounds was additionally expressed
per unit of organic matter. It appears that more nitrate and ammonium nitrogen (N-NO3
Mineralization of Nitrogen Compounds in Upper-Silted Organic Soils... 1015
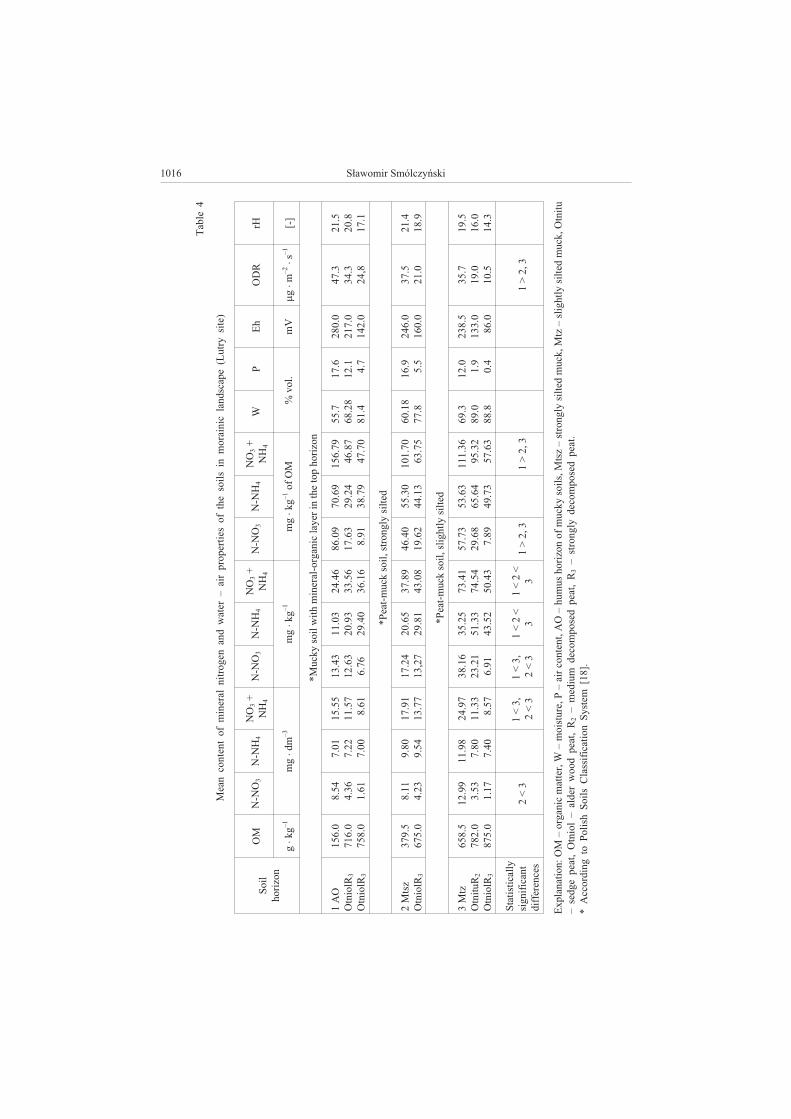
1016 S³awomir Smólczyñski
Table
4
Mean
conte
nt
of
min
eral
nit
rogen
and
wate
r–
air
properti
es
of
the
soil
sin
morain
icla
ndscape
(L
utr
ysit
e)
Soil
horiz
on
OM
N-N
O3
N-N
H4
NO
3+
NH
4
N-N
O3
N-N
H4
NO
3+
NH
4
N-N
O3
N-N
H4
NO
3+
NH
4
WP
Eh
OD
RrH
g�kg
–1
mg
�dm
–3
mg
�kg
–1
mg
�kg
–1
of
OM
%vol.
mV
�g
�m
–2
�s
–1
[-]
*M
ucky
soil
wit
hm
ineral-
organic
layer
inth
eto
phoriz
on
1A
O
Otn
iolR
3
Otn
iolR
3
156.0
716.0
758.0
8.5
4
4.3
6
1.6
1
7.0
1
7.2
2
7.0
0
15.5
5
11.5
7
8.6
1
13.4
3
12.6
3
6.7
6
11.0
3
20.9
3
29.4
0
24.4
6
33.5
6
36.1
6
86.0
9
17.6
3
8.9
1
70.6
9
29.2
4
38.7
9
156.7
9
46.8
7
47.7
0
55.7
68.2
8
81.4
17.6
12.1
4.7
280.0
217.0
142.0
47.3
34.3
24,8
21.5
20.8
17.1
*P
eat-
muck
soil
,str
ongly
sil
ted
2M
tsz
Otn
iolR
3
379.5
675.0
8.1
1
4.2
3
9.8
0
9.5
4
17.9
1
13.7
7
17.2
4
13,2
7
20.6
5
29.8
1
37.8
9
43.0
8
46.4
0
19.6
2
55.3
0
44.1
3
101.7
0
63.7
5
60.1
8
77.8
16.9
5.5
246.0
160.0
37.5
21.0
21.4
18.9
*P
eat-
muck
soil
,sli
ghtl
ysil
ted
3M
tz
Otn
ituR
2
Otn
iolR
3
658.5
782.0
875.0
12.9
9
3.5
3
1.1
7
11.9
8
7.8
0
7.4
0
24.9
7
11.3
3
8.5
7
38.1
6
23.2
1
6.9
1
35.2
5
51.3
3
43.5
2
73.4
1
74.5
4
50.4
3
57.7
3
29.6
8
7.8
9
53.6
3
65.6
4
49.7
3
111.3
6
95.3
2
57.6
3
69.3
89.0
88.8
12.0
1.9
0.4
238.5
133.0
86.0
35.7
19.0
10.5
19.5
16.0
14.3
Sta
tisti
call
y
sig
nif
icant
dif
ferences
2<
31
<3,
2<
3
1<
3,
2<
3
1<
2<
3
1<
2<
31
>2,3
1>
2,3
1>
2,3
Expla
nati
on:
OM
–organic
matt
er,
W–
mois
ture,
P–
air
conte
nt,
AO
–hum
us
horiz
on
of
mucky
soil
s,
Mts
z–
str
ongly
sil
ted
muck,
Mtz
–sli
ghtl
ysil
ted
muck,
Otn
itu
–sedge
peat,
Otn
iol
–ald
er
wood
peat,
R2
–m
ediu
mdecom
posed
peat,
R3
–str
ongly
decom
posed
peat.
*A
ccordin
gto
Poli
sh
Soil
sC
lassif
icati
on
Syste
m[18].
Mineralization of Nitrogen Compounds in Upper-Silted Organic Soils... 1017
Table
5
Mean
conte
nt
of
min
eral
nit
rogen
and
wate
r–
air
properti
es
of
the
soil
inm
orain
icla
ndscape
(P
rusin
ow
osit
e)
Soil
horiz
on
OM
N-N
O3
N-N
H4
NO
3+
NH
4
N-N
O3
N-N
H4
NO
3+
NH
4
N-N
O3
N-N
H4
NO
3+
NH
4
WP
Eh
OD
RrH
g�kg
–1
mg
�dm
–3
mg
�kg
–1
mg
�kg
–1
of
OM
%vol.
mV
�g
�m
–2
�s
–1
[-]
*M
ucky
soil
wit
hm
ineral-
organic
layer
inth
eto
phoriz
on
1A
O
Otn
iolR
3
Otn
iszR
2
156.0
754.0
828.0
8.9
4
2.6
6
0.7
8
6.2
3
8.2
3
9.1
4
15.1
7
10.8
9
9.9
3
8.5
6
10.3
5
3.5
9
7.7
9
33.3
1
42.5
4
16.3
5
43.6
6
46.1
3
55.5
6
13.8
8
4.3
3
50.7
0
44.7
9
51.4
4
106.2
7
56.6
8
55.7
8
46.0
83.8
88.0
13.1
3.6
0.0
265.5
186.0
97.0
46.2
32.2
19.7
21.4
18.2
15.1
*P
eat-
muck
soil
,str
ongly
sil
ted
2M
tsz
Otn
iolR
3
Otn
iszR
2
325.0
718.0
825.0
9.0
5
6.2
7
1.0
9
8.4
7
10.0
6
9.4
8
17.5
2
16.3
3
10.7
13.6
1
22.2
0
13.4
7
12.8
3
36.2
9
48.7
9
26.4
4
58.4
9
62.2
6
4196
30.3
9
16.1
7
39.6
49.6
6
59.1
3
81.6
0
80.0
5
75.3
0
63.5
76,7
87.4
6.1
3.8
0.5
273.5
155.0
76.8
42.7
26.3
18.3
22.5
18.0
14.4
*P
eat-
muck
soil
,sli
ghtl
ysil
ted
3M
tz
Otn
iolR
3
Otn
iszR
2
620.0
816.0
838.0
9.5
9
2.1
4
0.8
1
10.9
8
10.3
4
9.6
2
20.5
7
12.4
8
9.8
4
24.8
7
16.3
2
13.5
9
28.9
8
48.1
9
50.3
6
53.8
5
64.5
1
63.9
5
40.2
2
20.0
0
16.2
1
46.2
8
59.0
5
60.9
0
86.5
1
79.0
5
76.3
1
72.7
84.6
87.9
6.4
1.9
0.6
2
261.0
186.0
78.0
35.8
32.2
16.9
21.7
18.2
15.3
Sta
tisti
call
y
sig
nif
icant
dif
ferences
1<
2,3
1<
2,3
1<
2<
<3
1<
2<
<3
1<
2<
<3
1>
2,3
1>
2,3
1>
2,3
Expla
nati
on:
OM
–organic
matt
er,
W–
mois
ture,
P–
air
conte
nt,
AO
–hum
us
horiz
on
of
mucky
soil
s,
Mts
z–
str
ongly
sil
ted
muck,
Mtz
–sli
ghtl
ysil
ted
muck,
Otn
iol
–ald
er
wood
peat,
Otn
isz
–reed
peat,
R2
–m
ediu
mdecom
posed
peat,
R3
–str
ongly
decom
posed
peat.
*A
ccordin
gto
Poli
sh
Soil
sC
lassif
icati
on
Syste
m[18].
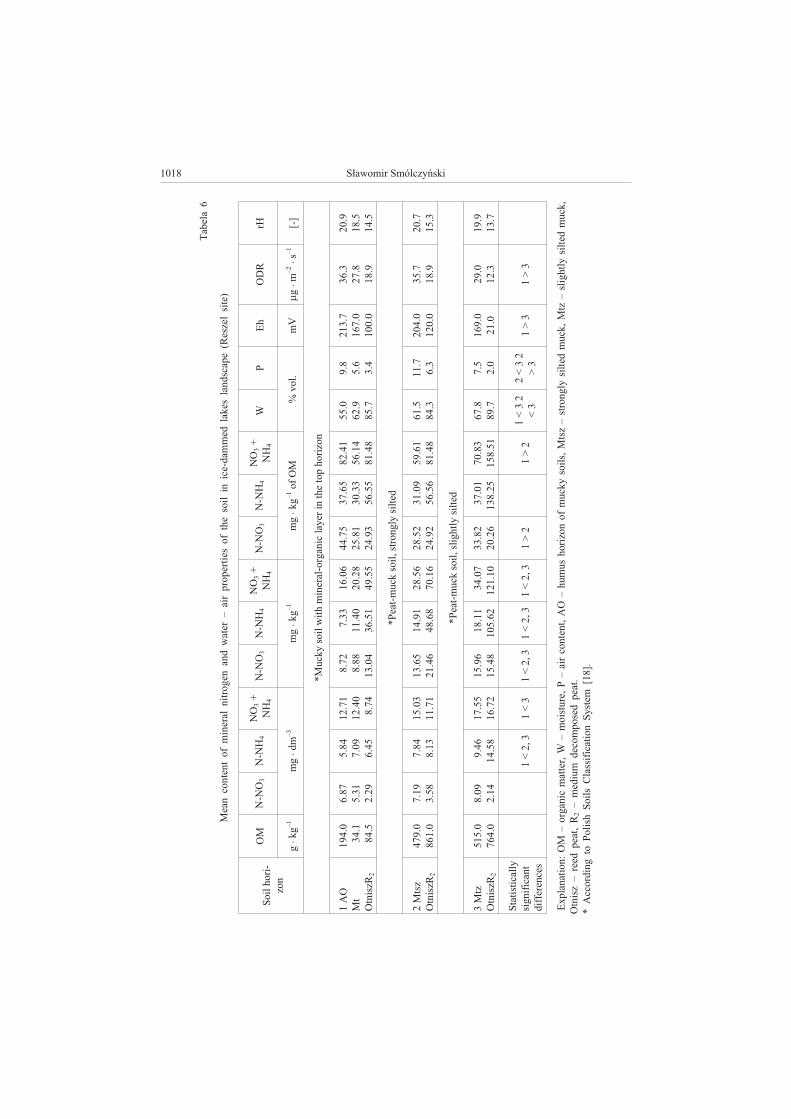
1018 S³awomir Smólczyñski
Tabela
6
Mean
conte
nt
of
min
eral
nit
rogen
and
wate
r–
air
properti
es
of
the
soil
inic
e-dam
med
lakes
landscape
(R
eszel
sit
e)
Soil
hori-
zon
OM
N-N
O3
N-N
H4
NO
3+
NH
4
N-N
O3
N-N
H4
NO
3+
NH
4
N-N
O3
N-N
H4
NO
3+
NH
4
WP
Eh
OD
RrH
g�kg
–1
mg
�dm
–3
mg
�kg
–1
mg
�kg
–1
of
OM
%vol.
mV
�g
�m
–2
�s
–1
[-]
*M
ucky
soil
wit
hm
ineral-
organic
layer
inth
eto
phoriz
on
1A
O
Mt
Otn
iszR
2
194.0
34.1
84.5
6.8
7
5.3
1
2.2
9
5.8
4
7.0
9
6.4
5
12.7
1
12.4
0
8.7
4
8.7
2
8.8
8
13.0
4
7.3
3
11.4
0
36.5
1
16.0
6
20.2
8
49.5
5
44.7
5
25.8
1
24.9
3
37.6
5
30.3
3
56.5
5
82.4
1
56.1
4
81.4
8
55.0
62.9
85.7
9.8
5.6
3.4
213.7
167.0
100.0
36.3
27.8
18.9
20.9
18.5
14.5
*P
eat-
muck
soil
,str
ongly
sil
ted
2M
tsz
Otn
iszR
2
479.0
861.0
7.1
9
3.5
8
7.8
4
8.1
3
15.0
3
11.7
1
13.6
5
21.4
6
14.9
1
48.6
8
28.5
6
70.1
6
28.5
2
24.9
2
31.0
9
56.5
6
59.6
1
81.4
8
61.5
84.3
11.7
6.3
204.0
120.0
35.7
18.9
20.7
15.3
*P
eat-
muck
soil
,sli
ghtl
ysil
ted
3M
tz
Otn
iszR
2
515.0
764.0
8.0
9
2.1
4
9.4
6
14.5
8
17.5
5
16.7
2
15.9
6
15.4
8
18.1
1
105.6
2
34.0
7
121.1
0
33.8
2
20.2
6
37.0
1
138.2
5
70.8
3
158.5
1
67.8
89.7
7.5
2.0
169.0
21.0
29.0
12.3
19.9
13.7
Sta
tisti
call
y
sig
nif
icant
dif
ferences
1<
2,3
1<
31
<2,3
1<
2,3
1<
2,3
1>
21
>2
1<
32
<3
2<
32
>3
1>
31
>3
Expla
nati
on:
OM
–organic
matt
er,
W–
mois
ture,
P–
air
conte
nt,
AO
–hum
us
horiz
on
of
mucky
soil
s,
Mts
z–
str
ongly
sil
ted
muck,
Mtz
–sli
ghtl
ysil
ted
muck,
Otn
isz
–reed
peat,
R2
–m
ediu
mdecom
posed
peat.
*A
ccordin
gto
Poli
sh
Soil
sC
lassif
icati
on
Syste
m[18].
and N-NH4) is released in organic-mineral formations of mucky soils (AO) than in
mucks (Mtsz, Mtz), and the differences between them turned to be statistically
significant. The results indicate high intensity of organic matter mineralization in
organic-mineral (AO) formations despite the fact they contain several times less organic
matter than mucks. Similar results were reported by Lachacz [12], who applied the same
incubation method, and found that muck-like formations demonstrate greater intensity
of mineralization than mucks which contain substantially more organic matter. In
studied AO formations of mucky soils, the sum of inorganic nitrogen compounds,
expressed in mg � kg–1
of organic matter, was from twice to four times lower as
compared with muck-like formations [12]. However it should be stated that muck-like
formations lack clayey fraction and have specific humus compounds.
It should also be noted that the amount of inorganic nitrogen compounds [mg � kg–1
of organic matter] released in the soils of ice-dammed lakes is considerably lower than
in the soils of morainic landscape (Tables 4–6). The differences between mucky soils
and strongly silted peat-muck soils of both landscapes were statistically significant. It
indicates differences in the quality of soil organic matter subjected to the process of
mineralization, which was also found by Lachacz [12]. It can be assumed that
fine-grained texture of deluvial deposits can have an influence on the mineralization of
organic matter, despite adverse soil water and air conditions (lower values of ODR and
Eh) in the landscape of ice-dammed lakes. Great amounts of colloidal clay fraction,
allow formation of humus and clay minerals bondings. These bonds are strong and
resistant to mineralization [13]. The diminishing rate of organic matter mineralization
by adding clay minerals was reported by Liwski and Maciak [14] in laboratory
conditions. In morainic landscape, deluvial deposits accumulated at the foot of the slope
demonstrate variation of texture and often lack clay fraction [15].
It should also be stressed that lower amounts of inorganic nitrogen compounds were
released in peat formation underlying deluvial deposits of mucky soils than in
peat-muck soils (Tables 4–6). It proves the statement [16, 17] that deluvial deposits
protect peat formations lying beneath against processes of mineralization. It is
particularly important in case of alder peats, which are most susceptible to trans-
formations.
Conclusions
1. The amounts of nitrate(V) and ammonium nitrogen in upper-silted mucky soils as
well as in slightly and strongly silted peat-muck soils, showed seasonal variations and
dependence on the soil type and landscape position.
2. The content of nitrates in the studied soils was from very little to medium. The
highest quantities of inorganic nitrogen were released in slightly silted peat-muck soils
and the least in mucky soils.
3. In the landscape of ice-dammed lakes, soil water-air conditions were adverse and
the amount of inorganic nitrogen was lower than in the soils of morainic landscape.
Slow rate of organic matter mineralization can result from formation of organic-mineral
bonds.
Mineralization of Nitrogen Compounds in Upper-Silted Organic Soils... 1019
4. Deluvial deposits lying on the surface of organic soils diminished the rate of
organic matter mineralization in peat formations beneath.
Acknowledgement
This paper was financed from the financial resources of the years 2007–2009 as a research project No.
N N305 2776 33
References
[1] Piaœcik H., Sowiñski P., Orzechowski M. and Smólczyñski S.: Zesz. Probl. Post. Nauk Roln. 2001, 476,
491–496.
[2] Gotkiewicz J., Hutorowicz H., Lossow K., Mosiej J., Paw³at H., Szymczak T. and Traczyk T.: Czynniki
kszta³tuj¹ce obieg wody i biogenów w krajobrazie m³odoglacjalnym, [in:] Obieg wody i bariery
biogeochemiczne w krajobrazie rolniczym. UAM, Poznañ 1990, 188.
[3] Gotkiewicz J., Piaœcik H. and Sapek A.: Zesz. Probl. Post. Nauk Roln. 1992, 401, 311–320.
[4] Gotkiewicz J. and Gotkiewicz M.: Bibl. Wiad. IMUZ, 1991, 77, 59–77.
[5] Sapek B.: Zesz. Probl. Post. Nauk Roln. 1996, 440, 331–341.
[6] Gotkiewicz J.: Zró¿nicowanie intensywnoœci mineralizacji azotu w glebach organicznych zwi¹zane
z odrêbnoœci¹ warunków siedliskowych. Rozpr. habilit. IMUZ, Falenty 1983, 111.
[7] Pawluczuk J.: Ann. UMCS, Sec. E, 2004, 59(2), 559–567.
[8] Smólczyñski S.: Zesz. Probl. Post. Nauk Roln. 2006, 513, 413–421.
[9] Smólczyñski S. and Orzechowski M.: Water – Environment-Rural Areas 2009, 9(1) (25), 121–150.
[10] Piaœcik H. and Gotkiewicz J.: Zesz. Probl. Post. Nauk Roln. 2001, 478, 511–518.
[11] Gotkiewicz, J.: Rocz. Nauk. Roln., Ser. F 1974, 78(4), 25–34.
[12] £achacz A.: Geneza i w³aœciwoœci p³ytkich gleb organogenicznych na sandrze mazursko-kurpiowskim.
Rozprawy i monografie 49, UWM, Olsztyn 2001, 119.
[13] Walczyna J.: Roczn. Glebozn. 1974, 25(2), 179–200.
[14] Liwski S. and Maciak F.: Zesz. Probl. Post. Nauk Roln. 1973, 146, 187–208.
[15] Bieniek B.: W³aœciwoœci i rozwój gleb nap³ywowych Pojezierza Mazurskiego. Acta Acad. Agricult. Tech.
Olst., Agricultura, Suppl. B, 1997, 64, 80.
[16] Gotkiewicz J., Okruszko H. and Smo³ucha J.: Zesz. Probl. Post. Nauk Roln. 1996, 431, 181–201.
[17] Orzechowski M. and Smólczyñski S.: Zesz. Probl. Post. Nauk Roln. 2002, 487, 205–212.
[18] Systematyka gleb Polski. Roczn. Glebozn. 1989, 40(3/4), 150.
MINERALIZACJA ZWI¥ZKÓW AZOTU W ODGÓRNIE NAMULONYCH
GLEBACH ORGANICZNYCH POLSKI PÓ£NOCNO-WSCHODNIEJ
Katedra Gleboznawstwa i Ochrony Gleby, Uniwersytet Warmiñko-Mazurski w Olsztynie
Abstrakt: W glebach namurszowych oraz silnie i s³abo zamulonych glebach torfowo-murszowych po³o-
¿onych w dwóch strefach krajobrazu m³odoglacjalnego (morenowej i zastoiskowej) oznaczono: zawartoœæ
azotu azotanowego i amonowego po inkubacji próbek o zachowanej strukturze, potencja³ oksydoredukcyjny
(Eh) oraz natê¿enie dyfuzji tlenu (ODR).
Najwiêksze iloœci azotu mineralnego w uwalnia³y siê w s³abo zamulonych glebach torfowo-murszowych,
a najmniejsze w glebach namurszowych. W glebach krajobrazu zastoiskowego wartoœci potencja³u redoks
(Eh), natê¿enia dyfuzji tlenu (ODR) oraz iloœci azotu mineralnego by³y mniejsze ni¿ w glebach krajobrazu
morenowego. ZawartoϾ azotu azotanowego (N-NO3) w warstwach wierzchnich gleb w krajobrazie
zastoiskowym waha³a siê od 4,65 w mg � dm–3
do 15,08 mg � dm–3
, a w krajobrazie morenowym od 6,49
mg � dm–3
do 18,23 w mg � dm–3
i mieœci³a siê w zakresie zasobnoœci od bardzo ma³ej do œredniej. Namu³y
deluwialne zalegaj¹ce na powierzchni gleb organicznych ogranicza³y proces mineralizacji materii organicznej
g³êbiej zalegaj¹cych utworów torfowych.
S³owa kluczowe: azot azotanowy(V), azot amonowy, gleby namurszowe, torfowo-murszowe silnie i s³abo
zamulone, krajobraz morenowy, krajobraz zastoiskowy
1020 S³awomir Smólczyñski
Cezary TRAWCZYÑSKI1
INFLUENCE OF DRIP IRRIGATION
AND FERTIGATION ON THE YIELD OF POTATO TUBERS
AND CONTENT OF NITROGEN MINERAL IN THE SOIL
WP£YW NAWADNIANIA KROPLOWEGO
I FERTYGACJI NA PLON BULW ZIEMNIAKA
I ZAWARTOή AZOTU MINERALNEGO W GLEBIE
Abstract: The field experiment was conducted in the years 2006–2008 at Plant Breeding and Acclimatization
Institute, Division Jadwisin on the light and acid soil. The aim of the research was to compare tubers yield and
content of mineral nitrogen in the soil after harvest of potato by different doses in solid (100 i 150 kg N � ha–1
)
and liquid nitrogen form – fertigation (mean of 43.0 kg N � ha–1
) to the soil applied. The control was object
non-fertilized and non-irrigated. The objects were divided on: irrigated and non-irrigated. Drip irrigation
method in this experiment was applied. The nitrogen dose in fertigation form by using computer program DSS
was established. The doses of water and dates of their application by using tensiometer were established. The
soil for examination was taken from the layer of 0–30 and 30–60 cm. Analyses of nitrate and ammonium ions
contents were carried out by reflection spectroscopy using RQ flex Merck reflectometr. The yield of tubers on
irrigated object by using fertilizer program DSS was about 47 % higher than on the control object but content
of mineral nitrogen in the soil on this object was smaller than on the control. Application nitrogen dose of 150
kg N � ha–1
on non-irrigated object, in all investigation years was the cause high cumulation of mineral
nitrogen in the soil after harvest of potato. In second years of investigation (2007) already after applied dose
of 100 kg N � ha–1
on non-irrigated conditions high level of mineral nitrogen in the soil was faound. Nitrogen
surplus may be leached from the soil into groundwater in the autumn and winter period.
Keywords: potato, drip irrigation, fertigation, yield of tubers, soil, mineral nitrogen
A low coefficient of nitrogen utilization by the potato plant from the applied
fertilizers, amounting to up to 50 % [1, 2], results in more and more attention being paid
to the effects of mineral forms of nitrogen on the soil environment, principally after the
end of the plant vegetation period. A large amount of mineral nitrogen remaining after
the plant harvesting presents a hazard of washing out of this component during the
autumn/winter season, which poses a risk to groundwater [3, 4]. Lability of the mineral
forms of nitrogen in the soils is the reason why nitrogen should ideally be applied
during the stages of the highest potato plants’ demand for this component. Application
E C O L O G I C A L C H E M I S T R Y A N D E N G I N E E R I N G A
Vol. 16, No. 8 2009
1Plant Breeding and Aclimatization Institute, Division Jadwisin, ul. Szaniawskiego 15, 05–140 Serock,
Poland, email: [email protected]
of several supplementary doses of nitrogen during the plant vegetation period is
considered to be one of the factors optimizing fertilization with this component and
creates favourable conditions for both the appropriate yield to be obtained and
accumulation of nitrates in the soil to be reduced [5–7]. The factors which significantly
limit nitrogen utilization by the plants from the applied fertilizers may include rainfall
deficiency as well as unfavourable rainfall distribution during the period of tuber weight
increase [8]. In order to limit the unfavourable effects of the water factor, irrigation of
potato plantations is introduced. Drip irrigation is considered to be the most precise
since it does not result in washing away of furrows; moreover, water is not poured over
the aboveground parts of the potato plant and the devices incorporated in the system
allow precise fertilization at the time of irrigation [9].
The aim of the research was to compare tubers yield and content of mineral nitrogen
in the soil after harvest of potatoes by different doses of solid and liquid nitrogen form
(fertigation established by using computer program DSS) in drip irrigation conditions
and natural soil moisture.
Material and methods
The field experiment was conducted in the years 2006–2008 at Plant Breeding and
Acclimatization Institute, Division Jadwisin on the light and acid soil by light loamy
sand soil texture. Top layer of the soil contained high amounts of available phosphorus,
low to medium of potassium and low to high of magnesium forms. The content of
mineral nitrogen in spring in soil layer of 0–60 cm ranged from 40.9 to 67.1 kg � ha–1
.
The research years rainfall deficit in accumulation period of potato tubers yield were
recorded. In the years of 2006 and 2008 rainfall deficit in June and July was recorded,
but in 2007 years only in July was found (Table 1).
Table 1
The climate conditions of the vegetation periods in Jadwisin. Years 2006–2008
Year
Deviations from long term average
Rainfalls in mm and month Temperature inoC and month
V VI VII VIII IX V VI VII VIII IX
2006
2007
2008
–0.6
–26.4
–10.9
–26.1
–32.6
–33.5
–63.8
–18.9
–4.2
94.1
12.3
18.9
–37.5
–52.7
–2.2
–0.9
–0.5
–0.0
–1.3
–0.8
–0.6
–3.6
–0.8
–0.3
–0.7
–0.0
–0.1
–1.6
–2.3
–1.5
Combinations system was following: A. Without NPK, without irrigation (control
object); B. 100 kg N � ha–1
+ 34.9 kg P � ha–1
+ 99.6 kg K � ha–1
, without irrigation;
C. 150 kg N � ha–1
+ 34.9 kg P � ha–1
+ 99.6 kg K � ha–1
, without irrigation; D. Dose of N
according to DSS system (fertigation) + 34.9 kg P � ha–1
+ 99.6 kg K � ha–1
+ irrigation;
E. 100 kg N � ha–1
+ 34.9 kg P � ha–1
+ 99.6 kg K � ha–1
+ irrigation; F. 150 kg N � ha–1
+
+ 34.9 kg P � ha–1
+ 99.6 kg K � ha–1
+ irrigation.
The organic fertilization consisted in using straw in dose about 5 Mg � ha–1
and
aftercrop of white mustard in dose about 23.4 Mg � ha–1
. The phosphorus (triple
1022 Cezary Trawczyñski
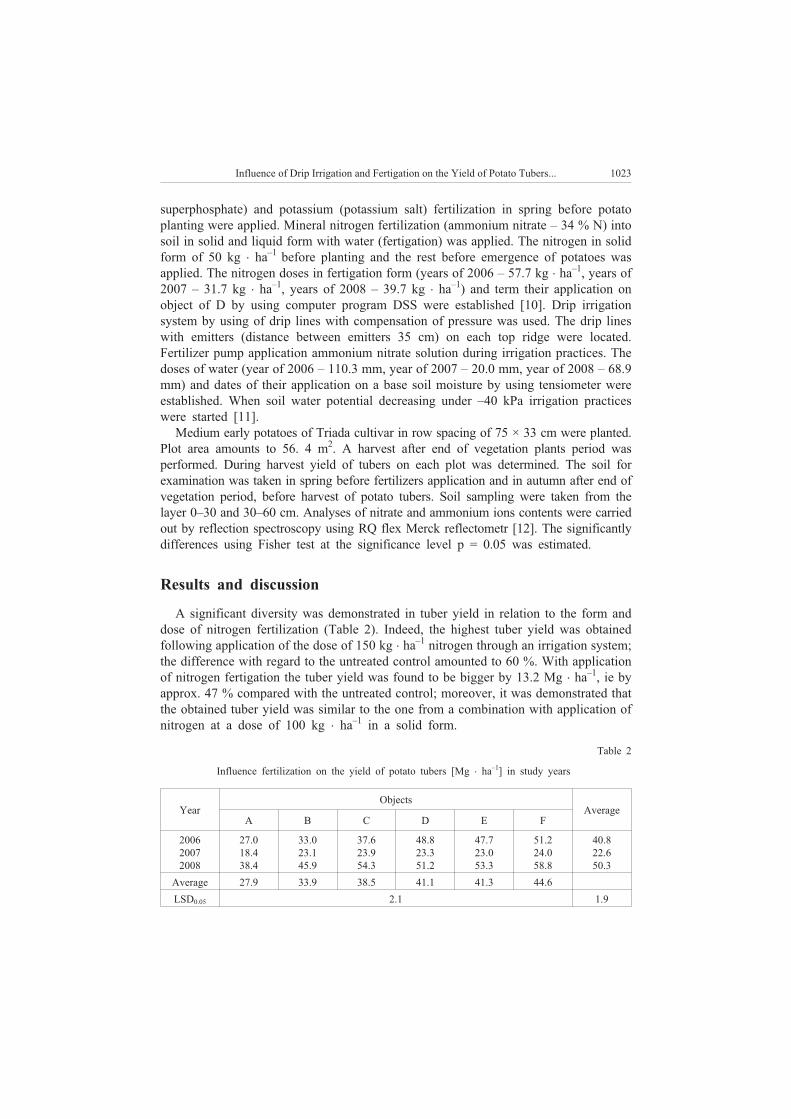
superphosphate) and potassium (potassium salt) fertilization in spring before potato
planting were applied. Mineral nitrogen fertilization (ammonium nitrate – 34 % N) into
soil in solid and liquid form with water (fertigation) was applied. The nitrogen in solid
form of 50 kg � ha–1
before planting and the rest before emergence of potatoes was
applied. The nitrogen doses in fertigation form (years of 2006 – 57.7 kg � ha–1
, years of
2007 – 31.7 kg � ha–1
, years of 2008 – 39.7 kg � ha–1
) and term their application on
object of D by using computer program DSS were established [10]. Drip irrigation
system by using of drip lines with compensation of pressure was used. The drip lines
with emitters (distance between emitters 35 cm) on each top ridge were located.
Fertilizer pump application ammonium nitrate solution during irrigation practices. The
doses of water (year of 2006 – 110.3 mm, year of 2007 – 20.0 mm, year of 2008 – 68.9
mm) and dates of their application on a base soil moisture by using tensiometer were
established. When soil water potential decreasing under –40 kPa irrigation practices
were started [11].
Medium early potatoes of Triada cultivar in row spacing of 75 × 33 cm were planted.
Plot area amounts to 56. 4 m2. A harvest after end of vegetation plants period was
performed. During harvest yield of tubers on each plot was determined. The soil for
examination was taken in spring before fertilizers application and in autumn after end of
vegetation period, before harvest of potato tubers. Soil sampling were taken from the
layer 0–30 and 30–60 cm. Analyses of nitrate and ammonium ions contents were carried
out by reflection spectroscopy using RQ flex Merck reflectometr [12]. The significantly
differences using Fisher test at the significance level p = 0.05 was estimated.
Results and discussion
A significant diversity was demonstrated in tuber yield in relation to the form and
dose of nitrogen fertilization (Table 2). Indeed, the highest tuber yield was obtained
following application of the dose of 150 kg � ha–1
nitrogen through an irrigation system;
the difference with regard to the untreated control amounted to 60 %. With application
of nitrogen fertigation the tuber yield was found to be bigger by 13.2 Mg � ha–1
, ie by
approx. 47 % compared with the untreated control; moreover, it was demonstrated that
the obtained tuber yield was similar to the one from a combination with application of
nitrogen at a dose of 100 kg � ha–1
in a solid form.
Table 2
Influence fertilization on the yield of potato tubers [Mg � ha–1
] in study years
Year
Objects
Average
A B C D E F
2006
2007
2008
27.0
18.4
38.4
33.0
23.1
45.9
37.6
23.9
54.3
48.8
23.3
51.2
47.7
23.0
53.3
51.2
24.0
58.8
40.8
22.6
50.3
Average 27.9 33.9 38.5 41.1 41.3 44.6
LSD0.05 2.1 1.9
Influence of Drip Irrigation and Fertigation on the Yield of Potato Tubers... 1023
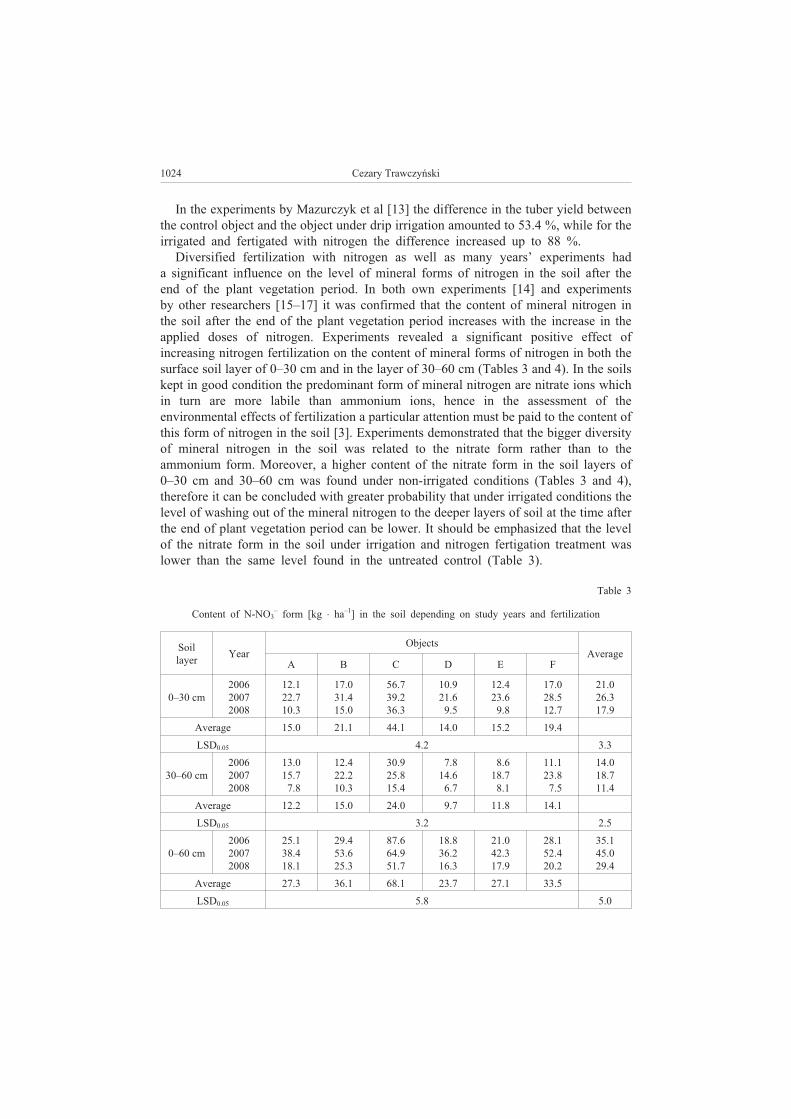
In the experiments by Mazurczyk et al [13] the difference in the tuber yield between
the control object and the object under drip irrigation amounted to 53.4 %, while for the
irrigated and fertigated with nitrogen the difference increased up to 88 %.
Diversified fertilization with nitrogen as well as many years’ experiments had
a significant influence on the level of mineral forms of nitrogen in the soil after the
end of the plant vegetation period. In both own experiments [14] and experiments
by other researchers [15–17] it was confirmed that the content of mineral nitrogen in
the soil after the end of the plant vegetation period increases with the increase in the
applied doses of nitrogen. Experiments revealed a significant positive effect of
increasing nitrogen fertilization on the content of mineral forms of nitrogen in both the
surface soil layer of 0–30 cm and in the layer of 30–60 cm (Tables 3 and 4). In the soils
kept in good condition the predominant form of mineral nitrogen are nitrate ions which
in turn are more labile than ammonium ions, hence in the assessment of the
environmental effects of fertilization a particular attention must be paid to the content of
this form of nitrogen in the soil [3]. Experiments demonstrated that the bigger diversity
of mineral nitrogen in the soil was related to the nitrate form rather than to the
ammonium form. Moreover, a higher content of the nitrate form in the soil layers of
0–30 cm and 30–60 cm was found under non-irrigated conditions (Tables 3 and 4),
therefore it can be concluded with greater probability that under irrigated conditions the
level of washing out of the mineral nitrogen to the deeper layers of soil at the time after
the end of plant vegetation period can be lower. It should be emphasized that the level
of the nitrate form in the soil under irrigation and nitrogen fertigation treatment was
lower than the same level found in the untreated control (Table 3).
Table 3
Content of N-NO3
–form [kg � ha
–1] in the soil depending on study years and fertilization
Soil
layerYear
Objects
Average
A B C D E F
0–30 cm
2006
2007
2008
12.1
22.7
10.3
17.0
31.4
15.0
56.7
39.2
36.3
10.9
21.6
9.5
12.4
23.6
9.8
17.0
28.5
12.7
21.0
26.3
17.9
Average 15.0 21.1 44.1 14.0 15.2 19.4
LSD0.05 4.2 3.3
30–60 cm
2006
2007
2008
13.0
15.7
7.8
12.4
22.2
10.3
30.9
25.8
15.4
7.8
14.6
6.7
8.6
18.7
8.1
11.1
23.8
7.5
14.0
18.7
11.4
Average 12.2 15.0 24.0 9.7 11.8 14.1
LSD0.05 3.2 2.5
0–60 cm
2006
2007
2008
25.1
38.4
18.1
29.4
53.6
25.3
87.6
64.9
51.7
18.8
36.2
16.3
21.0
42.3
17.9
28.1
52.4
20.2
35.1
45.0
29.4
Average 27.3 36.1 68.1 23.7 27.1 33.5
LSD0.05 5.8 5.0
1024 Cezary Trawczyñski
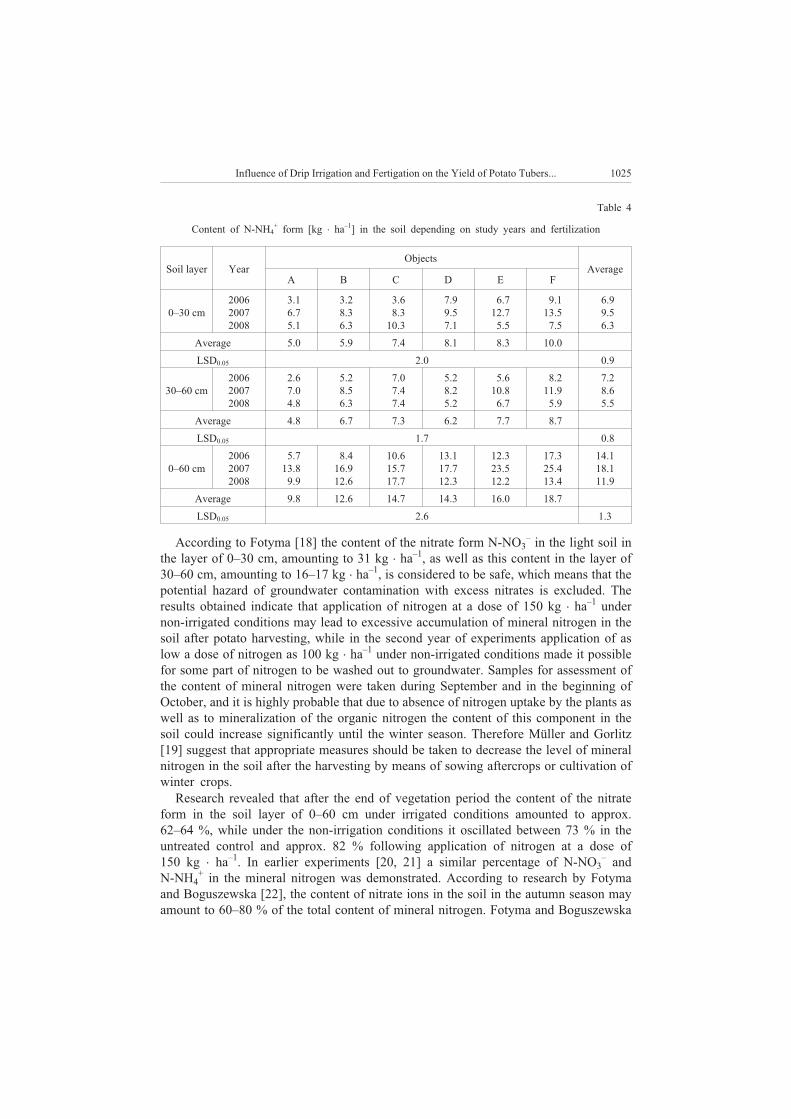
Table 4
Content of N-NH4
+form [kg � ha
–1] in the soil depending on study years and fertilization
Soil layer Year
Objects
Average
A B C D E F
0–30 cm
2006
2007
2008
3.1
6.7
5.1
3.2
8.3
6.3
3.6
8.3
10.3
7.9
9.5
7.1
6.7
12.7
5.5
9.1
13.5
7.5
6.9
9.5
6.3
Average 5.0 5.9 7.4 8.1 8.3 10.0
LSD0.05 2.0 0.9
30–60 cm
2006
2007
2008
2.6
7.0
4.8
5.2
8.5
6.3
7.0
7.4
7.4
5.2
8.2
5.2
5.6
10.8
6.7
8.2
11.9
5.9
7.2
8.6
5.5
Average 4.8 6.7 7.3 6.2 7.7 8.7
LSD0.05 1.7 0.8
0–60 cm
2006
2007
2008
5.7
13.8
9.9
8.4
16.9
12.6
10.6
15.7
17.7
13.1
17.7
12.3
12.3
23.5
12.2
17.3
25.4
13.4
14.1
18.1
11.9
Average 9.8 12.6 14.7 14.3 16.0 18.7
LSD0.05 2.6 1.3
According to Fotyma [18] the content of the nitrate form N-NO3
–in the light soil in
the layer of 0–30 cm, amounting to 31 kg � ha–1
, as well as this content in the layer of
30–60 cm, amounting to 16–17 kg � ha–1
, is considered to be safe, which means that the
potential hazard of groundwater contamination with excess nitrates is excluded. The
results obtained indicate that application of nitrogen at a dose of 150 kg � ha–1
under
non-irrigated conditions may lead to excessive accumulation of mineral nitrogen in the
soil after potato harvesting, while in the second year of experiments application of as
low a dose of nitrogen as 100 kg � ha–1
under non-irrigated conditions made it possible
for some part of nitrogen to be washed out to groundwater. Samples for assessment of
the content of mineral nitrogen were taken during September and in the beginning of
October, and it is highly probable that due to absence of nitrogen uptake by the plants as
well as to mineralization of the organic nitrogen the content of this component in the
soil could increase significantly until the winter season. Therefore Müller and Gorlitz
[19] suggest that appropriate measures should be taken to decrease the level of mineral
nitrogen in the soil after the harvesting by means of sowing aftercrops or cultivation of
winter crops.
Research revealed that after the end of vegetation period the content of the nitrate
form in the soil layer of 0–60 cm under irrigated conditions amounted to approx.
62–64 %, while under the non-irrigation conditions it oscillated between 73 % in the
untreated control and approx. 82 % following application of nitrogen at a dose of
150 kg � ha–1
. In earlier experiments [20, 21] a similar percentage of N-NO3
–and
N-NH4
+in the mineral nitrogen was demonstrated. According to research by Fotyma
and Boguszewska [22], the content of nitrate ions in the soil in the autumn season may
amount to 60–80 % of the total content of mineral nitrogen. Fotyma and Boguszewska
Influence of Drip Irrigation and Fertigation on the Yield of Potato Tubers... 1025
[22] also emphasized that in a case of a high percentage of nitrate form in the soil in the
autumn season one should take into account the possibility of more intense washing
away of this form than in case of a lower percentage of this form in the total content of
the mineral nitrogen in the soil.
Conclusion
1. The yield of tubers on irrigated object by using fertilizer program DSS was about
47 % higher than on the control object (without fertilization and irrigation).
2. The irrigation significantly decreased content of mineral nitrogen, mainly nitrate
form in the soil after end of vegetation period.
3. The nitrogen application in fertigation form decreased level of mineral nitrogen in
the soil and reduced risk nitrates leached from the soil into groundwater in the autumn
and winter period.
4. Application nitrogen dose of 150 kg � ha–1
in all investigation years and dose of
100 kg � ha–1
(years of 2007) without irrigation was the cause high cumulate of mineral
nitrogen in the soil after harvest of potatoes.
References
[1] Lis B., Mazurczyk W., Trawczyñski C. and Wierzbicka A.: Zesz. Probl. Post. Nauk Roln. 2002, 489,
165–174.
[2] Neeteson J.J.: Netherlands J. Agric. Sci. 1989, 37, 143–155.
[3] Fotyma E., Wilkos G. and Pietruch Cz.: Test glebowy azotu mineralnego – mo¿liwoœci praktycznego
wykorzystania. Mat. szkol. 1998, 69/98, 48 pp.
[4] Vos. J. and Mackerron D.K.L.: Basic concepts of the management of supply of nitrogen and water in
potato production, [in:] Management of nitrogen and water in potato production. Haverkart A.J.,
Mackerron D.K.L. (eds). Wageningen Pres, Wageningen 2000, 136–154.
[5] Czuba R.: Zesz. Probl. Post. Nauk Roln. 1996, 440, 65–73.
[6] Goffart J.P. and Guiot J.: Influence of timing and type of N-fertilization on N-uptake and yield of potato
and on soil mineral nitrogen status in Belgian Loam soil. 13th
Trien. Conf. EAPR, Veldhoven,
Netherlands 1996, 391–392.
[7] Trawczyñski C. and Grzeœkiewicz H.: Biul. Inst. Hodow. Aklimat. Roœl. 2000, 213, 149–155.
[8] Lis B. and Wierzejska-Bujakowska A.: Biul. Inst. Hodow. Aklimat. Roœl. 2000, 213, 87–98.
[9] £uszczyk K.: Ziemniak Polski 2004, 2, 16–19.
[10] Batillani A., Hansen S. and Plauborg F.: Decision Support System (DSS), 2006 <fertorganic.org>.
[11] Haverkort A.J. and MacKerron D.K.L.: Management of nitrogen and water in potato production.
Wageningen. Pres., Wageningen 2000, 353 pp.
[12] Instrukcja do reflektometrycznej metody oznaczania jonów azotanowych i amonowych. Merck Sp.
z o.o., 8 pp.
[13] Mazurczyk W., G³uska A., Trawczyñski C., Nowacki W. and Zarzyñska K.: Roczn. AR Poznan. 2006,
CCCLXXX, Roln. 66, 235–241.
[14] Trawczyñski C.: Biul. Inst. Hodow. Aklimat. Roœl. 2001, 217, 177–185.
[15] Cieæko Z., Wyszkowski M. and Szaga³a J.: Zesz. Probl. Post. Nauk Roln. 1996, 440, 27–33.
[16] Fotyma M., Fotyma E. and Stuczyñski T.: Naw. Nawo¿. 1999, 1, 44–58.
[17] £abêtowicz J.: Zesz. Probl. Post. Nauk Roln. 1995, 421a, 245–251.
[18] Fotyma E.: Naw. Nawo¿. 2000, 3a, 17–37.
[19] Müller S. and Gorlitz H.: Fragm. Agronom. 1990, 1, 23–35.
[20] Trawczyñski C.: Ann. UMCS 2004, Sec. E, 59(2), 687–696.
[21] Trawczyñski C.: Biul. Inst. Hodow. Aklimat. Roœl. 2007, 246, 83–93.
1026 Cezary Trawczyñski
[22] Fotyma E. and Boguszewska M.: Zawartoœæ azotu mineralnego w glebach Polski jako wskaŸnik stanu
œrodowiska rolniczego. Mat. Konf. Nauk. nt. “Dobre praktyki w produkcji rolniczej” 1, IUNG, Pu³awy
1998, 61–70.
WP£YW NAWADNIANIA KROPLOWEGO I FERTYGACJI
NA PLON BULW ZIEMNIAKA I ZAWARTOή AZOTU MINERALNEGO W GLEBIE
Instytut Hodowli i Aklimatyzacji Roœlin, Oddzia³ Jadwisin
Abstrakt: Doœwiadczenie polowe przeprowadzono w latach 2006–2008 w Instytucie Hodowli i Aklimaty-
zacji Roœlin, Oddzia³ Jadwisin na glebie lekkiej, kwaœnej. Celem badañ by³o porównanie wp³ywu na plon
bulw i zawartoœæ azotu mineralnego w glebie po zakoñczeniu wegetacji ziemniaków zró¿nicowanego
nawo¿enia azotem stosowanego do gleby w formie sta³ej (100 i 150 kg N � ha–1
) i p³ynnej – fertygacja
(œrednio 43.0 kg N � ha–1
). Kontrolê stanowi³ obiekt bez nawo¿enia NPK i nienawadniany. Kombinacje
podzielono na: nawadniane i nienawadniane. Nawadnianie prowadzono metod¹ kroplow¹. Dawkê azotu
w formie fertygacji ustalono przy wykorzystaniu komputerowego programu nawozowego DSS. Dawki wody
oraz terminy ich stosowania ustalono na podstawie wilgotnoœci gleby przy u¿yciu tensjometrów. Glebê do
badañ pobierano z warstwy gleby 0–30 i 30–60 cm. Oznaczenie zawartoœci jonów azotanowych i amonowych
wykonano reflektometrycznie przy u¿yciu reflektometru RQ flex Merck. Plon bulw uzyskany na kombinacji
nawadnianej z wykorzystaniem programu nawozowego DSS by³ o oko³o 47 % wiêkszy ni¿ na kontroli,
a zawartoœæ azotu mineralnego w glebie na tej kombinacji mniejsza w porównaniu do kontroli. Zastosowanie
dawki azotu 150 kg N � ha–1
bez nawadniania, we wszystkich badanych latach, przyczyni³o siê do du¿ej
kumulacji azotu mineralnego w glebie po zbiorze ziemniaków. W drugim roku badañ (2007) ju¿ po
zastosowaniu dawki 100 kg N � ha–1
bez nawadniania stwierdzono wysoki poziom azotu mineralnego
w glebie. Nadmiar tego azotu mo¿e byæ wyp³ukany z gleby do wód gruntowych w okresie jesienno-
-zimowym.
S³owa kluczowe: ziemniak, nawadnianie kroplowe, fertygacja, plon bulw, gleba, azot mineralny
Influence of Drip Irrigation and Fertigation on the Yield of Potato Tubers... 1027

Kazimierz WARMIÑSKI1
and Agnieszka Bʌ1
DIURNAL AND SEASONAL VARIATIONS
IN THE NO2 PHOTOLYSIS RATE CONSTANT,
NO TITRATION RATE CONSTANT
AND THE NO2/NO RATIO IN AMBIENT AIR
IN THE CITY OF OLSZTYN
DOBOWA I SEZONOWA ZMIENNOŒÆ STA£YCH SZYBKOŒCI REAKCJI
FOTOLIZY NO2 I TITRACJI NO ORAZ STOSUNKU NO2/NO
W POWIETRZU ATMOSFERYCZNYM OLSZTYNA
Abstract: The paper presents diurnal and seasonal variations in the NO2 photolysis rate constant (JNO2), NO
titration rate constant (k3) and the NO2/NO molecular ratio determined experimentally and calculated for the
photostationary state in atmospheric air in the city of Olsztyn (NE Poland). Diurnal variations in the titration
rate constant ranged from 20.8 to 25.3 ppm–1
min–1
in the summer (June 2008), and from 16.5 to 17.2
ppm–1
min–1
in the winter (December 2008). The values of the JNO2
constant, which is dependent on the total
solar radiation (TSR) and the solar zenith angle (SZA), ranged from zero in night hours to 0.071 min–1
at
12:00 noon local time in the winter and to 0.254 min–1
11:00 a.m. local time in the summer. The NO2/NO
ratio (both observed and calculated) showed characteristic diurnal variations, reaching a minimum around
noon. The determined NO2/NO ratio was found to be higher than the calculated NO2/NO ratio both in the
summer and winter. The lowest values of the calculated NO2/NO ratio were noted in June, with an average of
0.0407 at 12:00 noon, which was 176-fold lower than the value determined experimentally. This points to the
significance of NO oxidation to NO2 with the participation of volatile organic compounds (VOCs) and/or
carbon monoxide.
Keywords: NO2 photolysis, NO titration, rate constant, NO2/NO ratio, tropospheric photochemistry,
tropospheric ozone
Nitrogen oxides (NOx), including nitric oxide (NO) and nitrogen dioxide (NO2), are
the primary air pollutants [1, 2]. The largest global sources of nitrogen oxides are fossil
fuel combustion (20–25 Tg N-NOx per year) and biomass combustion in tropical and
subtropical regions (2–13 Tg N-NOx per year) [3, 4]. Natural sources also contribute to
the total NOx balance (eg soil emissions and atmospheric discharges – 3–21 and 2–20
E C O L O G I C A L C H E M I S T R Y A N D E N G I N E E R I N G A
Vol. 16, No. 8 2009
1Department of Air Protection and Environmental Toxicology, University of Warmia and Mazury in
Olsztyn, pl. £ódzki 2, 10–726 Olsztyn, Poland, phone 89 523 33 36, email: [email protected]
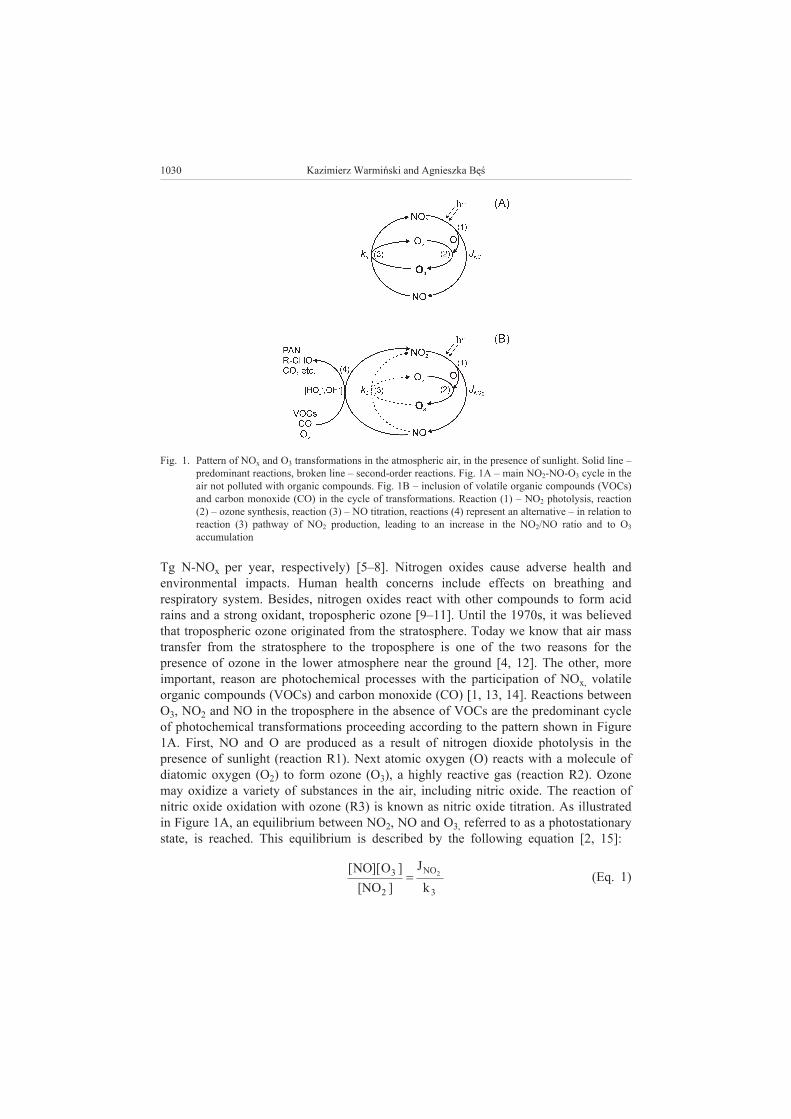
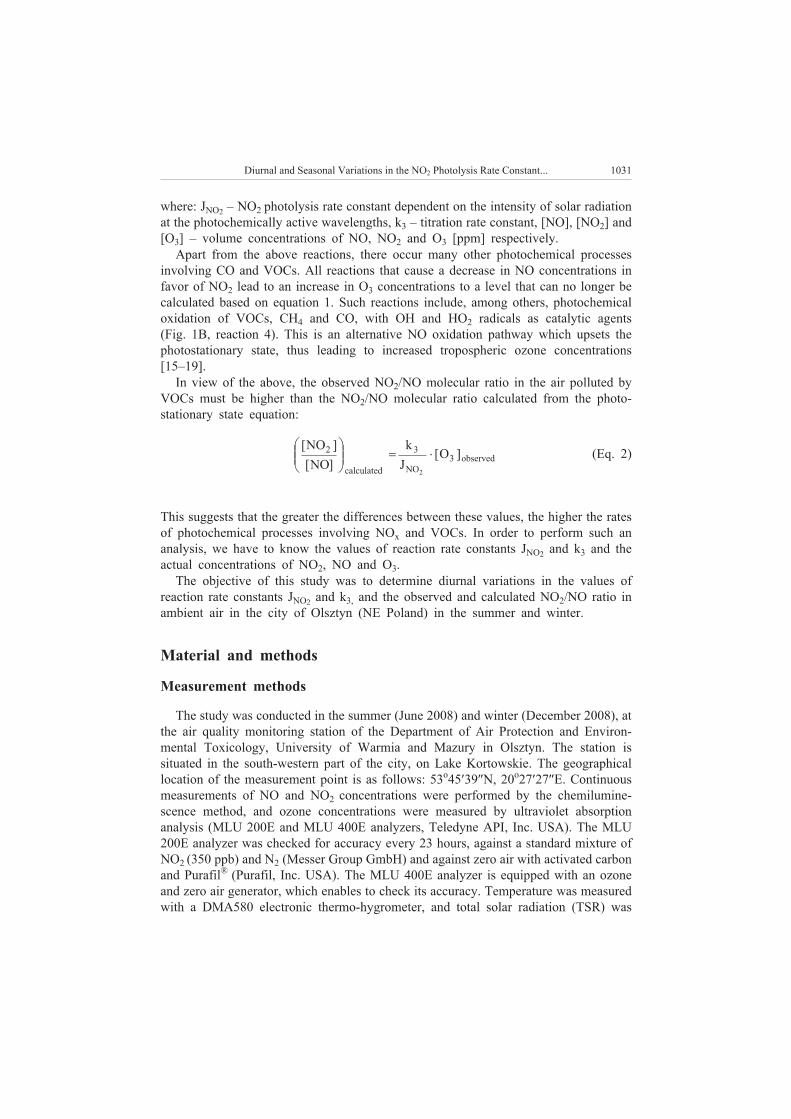
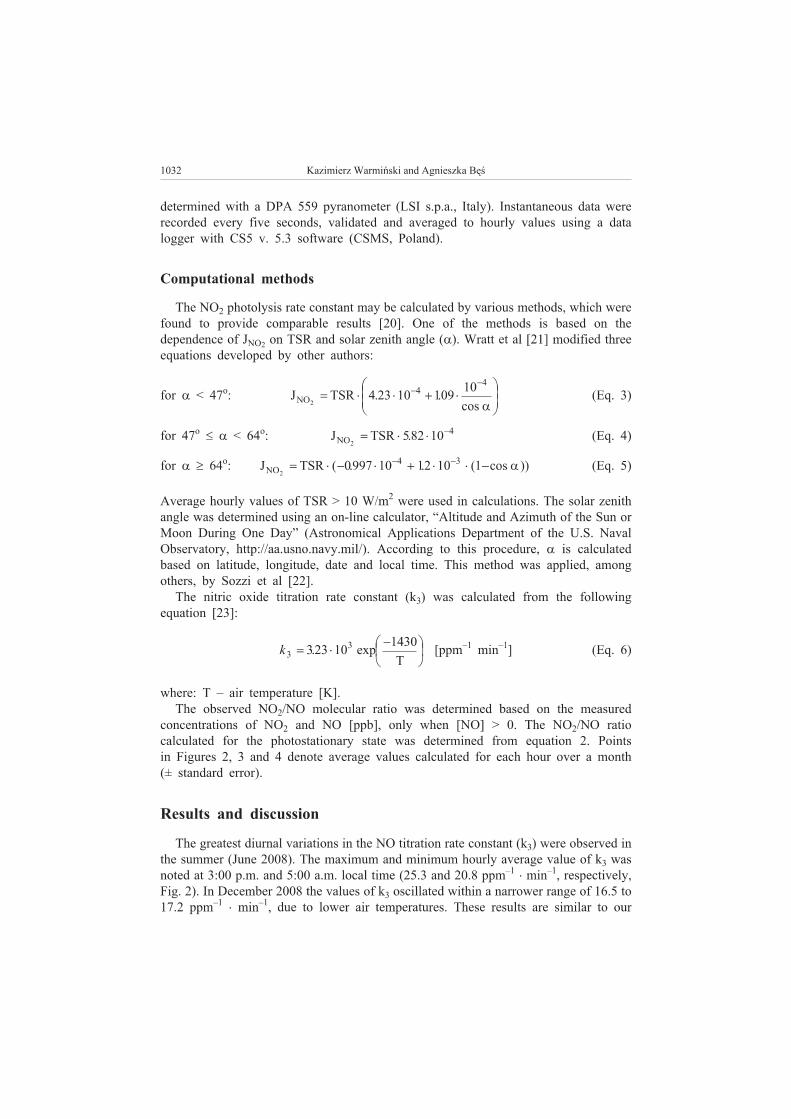
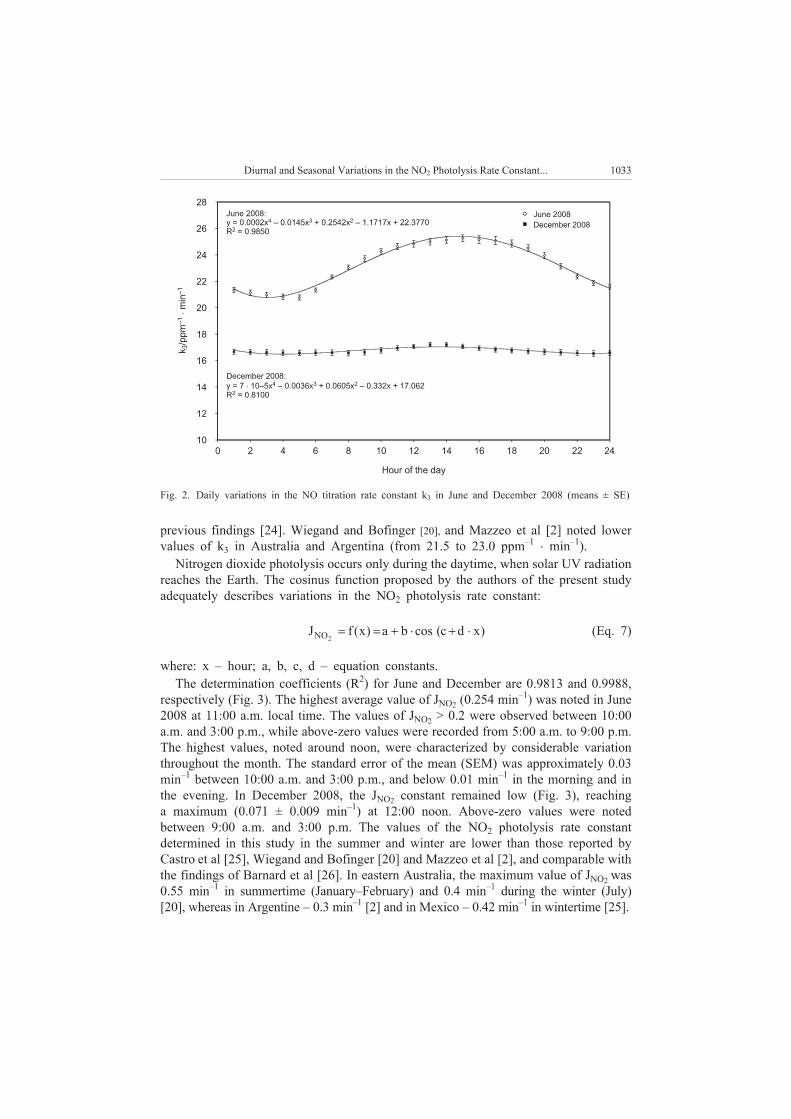
The fact that higher values of k3 and JNO2were recorded in Australia and Argentina
than in Poland results from latitude differences. Poland is situated farther from the
equator than Australia and Argentina, and therefore the altitude of the Sun and the
intensity of UV (actinic) radiation are lower in Poland. The results obtained by Barnard
et al [26] are comparable with our findings because Arizona (USA) and Poland are
situated at a similar latitude.
At the next stage of our study, we compared the experimentally determined NO2/NO
molecular ratio with that calculated for the photostationary state. It was found that the
NO2/NO ratio (both measured and calculated) showed characteristic diurnal variations,
reaching a minimum around noon (Figs. 4 and 5). The measured NO2/NO ratio was
higher than the calculated NO2/NO ratio both in the summer and winter, which is
indicative of photochemical reactions with the participation of VOCs and NOx. In June
2008, the lowest value of the calculated NO2/NO ratio (0.0407) was noted at 12:00
noon. It was 176-fold lower than the value determined experimentally (Fig. 4). In
December 2008 these differences were much smaller. The lowest calculated NO2/NO
ratio (< 0.40) was recorded at 12:00 noon and 1:00 p.m., and it was only twofold lower
than the actual value (Fig. 5). Warmiñski and Rogalski [24] reported higher NO2/NO
ratios, but the differences determined between the measured and calculated values in
summertime (July 2006) were smaller than in this study.
Both NO2 photolysis and NO oxidation to NO2 occur at a faster rate in the summer
than in the winter. The lowest differences between the observed and calculated NO2/NO
ratio are observed in the morning and in the evening, when the rate of photochemical
reactions is slow. In the atmosphere free from hydrocarbon pollution, both parameters
should be at a similar level, even around noon. The relationships between O3, NO2 and
1034 Kazimierz Warmiñski and Agnieszka Bêœ
0.35
0.30
0.25
0.20
0.15
0.10
0.05
0
0 2 4 6 8 10 12 14 16 18 20 22 24
June 2008
December 2008
Hour of the day
J/
NO
2m
in–
1
June 2008:
y = 0.0.1176 + 0.1289 cos (3.8980 – 0.3094x)
R = 0.9813
�
2
December 2008:
y = 0.0180 – 0.0536 cos (3.2358 – 0.5277x)
R = 0.9988
�
2
Fig. 3. Daily variations in the NO2 phytolysis rate constant JNO2in June and December 2008 (means ± SE)
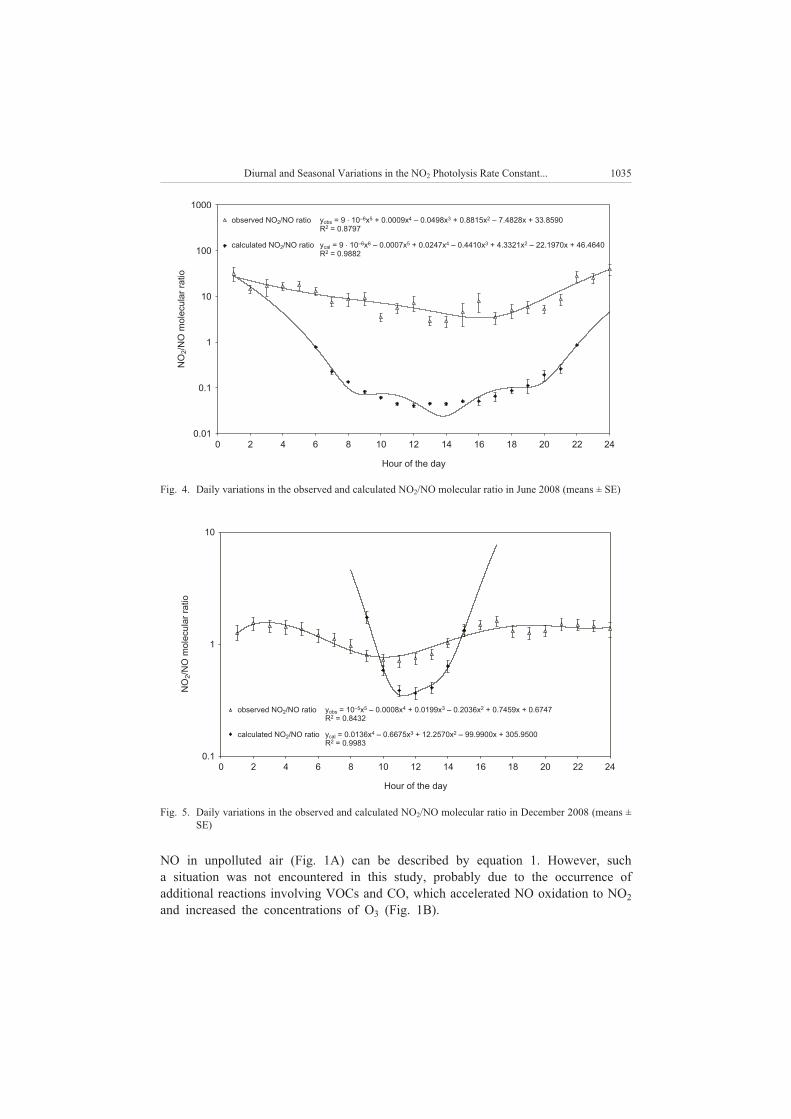
NO in unpolluted air (Fig. 1A) can be described by equation 1. However, such
a situation was not encountered in this study, probably due to the occurrence of
additional reactions involving VOCs and CO, which accelerated NO oxidation to NO2
and increased the concentrations of O3 (Fig. 1B).
Diurnal and Seasonal Variations in the NO2 Photolysis Rate Constant... 1035
1000
100
10
1
0.1
0.01
0 2 4 6 8 10 12 14 16 18 20 22 24
Hour of the day
NO
/NO
mole
cula
rra
tio
2
observed NO /NO ratio2 y = 9 10 x + 0.0009x – 0.0498x + 0.8815x – 7.4828x + 33.8590
R = 0.8797
obs–6 5 4 3 2
2
�
calculated NO /NO ratio2 y =cal 9 10 x – 0.0007x + 0.0247x – 0.4410x + 4.3321x – 22.1970x + 46.4640
R = 0.9882
�
–6 6 5 4 3 2
2
Fig. 4. Daily variations in the observed and calculated NO2/NO molecular ratio in June 2008 (means ± SE)
10
1
0.1
0 2 4 6 8 10 12 14 16 18 20 22 24
Hour of the day
NO
/NO
mole
cula
rra
tio
2
observed NO /NO ratio2 y = 10 x – 0.0008x + 0.0199x – 0.2036x + 0.7459x + 0.6747
R = 0.8432
obs–5 5
2
4 3 2
calculated NO /NO ratio2 y = 0.0136cal x – 0.6675x + 12.2570x – 99.9900x + 305.9500
R = 0.9983
4 3 2
2
Fig. 5. Daily variations in the observed and calculated NO2/NO molecular ratio in December 2008 (means ±
SE)
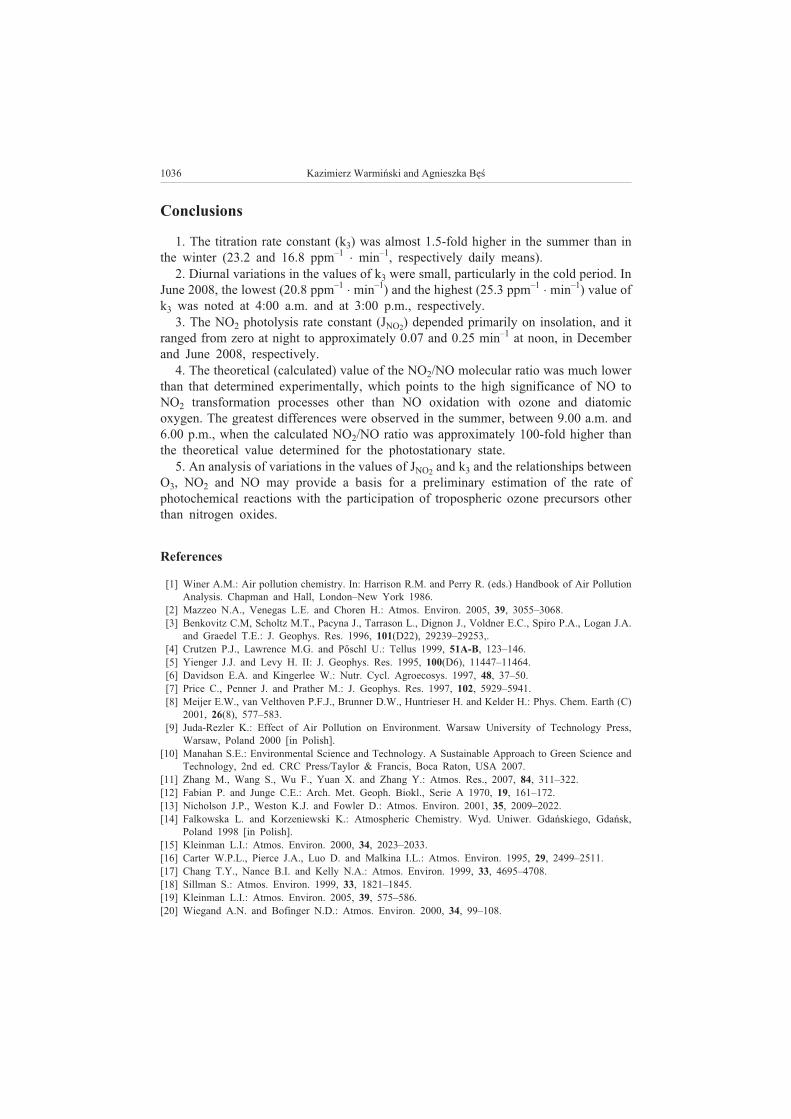
Conclusions
1. The titration rate constant (k3) was almost 1.5-fold higher in the summer than in
the winter (23.2 and 16.8 ppm–1
� min–1
, respectively daily means).
2. Diurnal variations in the values of k3 were small, particularly in the cold period. In
June 2008, the lowest (20.8 ppm–1
� min–1
) and the highest (25.3 ppm–1
� min–1
) value of
k3 was noted at 4:00 a.m. and at 3:00 p.m., respectively.
3. The NO2 photolysis rate constant (JNO2) depended primarily on insolation, and it
ranged from zero at night to approximately 0.07 and 0.25 min–1
at noon, in December
and June 2008, respectively.
4. The theoretical (calculated) value of the NO2/NO molecular ratio was much lower
than that determined experimentally, which points to the high significance of NO to
NO2 transformation processes other than NO oxidation with ozone and diatomic
oxygen. The greatest differences were observed in the summer, between 9.00 a.m. and
6.00 p.m., when the calculated NO2/NO ratio was approximately 100-fold higher than
the theoretical value determined for the photostationary state.
5. An analysis of variations in the values of JNO2and k3 and the relationships between
O3, NO2 and NO may provide a basis for a preliminary estimation of the rate of
photochemical reactions with the participation of tropospheric ozone precursors other
than nitrogen oxides.
References
[1] Winer A.M.: Air pollution chemistry. In: Harrison R.M. and Perry R. (eds.) Handbook of Air Pollution
Analysis. Chapman and Hall, London–New York 1986.
[2] Mazzeo N.A., Venegas L.E. and Choren H.: Atmos. Environ. 2005, 39, 3055–3068.
[3] Benkovitz C.M, Scholtz M.T., Pacyna J., Tarrason L., Dignon J., Voldner E.C., Spiro P.A., Logan J.A.
and Graedel T.E.: J. Geophys. Res. 1996, 101(D22), 29239–29253,.
[4] Crutzen P.J., Lawrence M.G. and Põschl U.: Tellus 1999, 51A-B, 123–146.
[5] Yienger J.J. and Levy H. II: J. Geophys. Res. 1995, 100(D6), 11447–11464.
[6] Davidson E.A. and Kingerlee W.: Nutr. Cycl. Agroecosys. 1997, 48, 37–50.
[7] Price C., Penner J. and Prather M.: J. Geophys. Res. 1997, 102, 5929–5941.
[8] Meijer E.W., van Velthoven P.F.J., Brunner D.W., Huntrieser H. and Kelder H.: Phys. Chem. Earth (C)
2001, 26(8), 577–583.
[9] Juda-Rezler K.: Effect of Air Pollution on Environment. Warsaw University of Technology Press,
Warsaw, Poland 2000 [in Polish].
[10] Manahan S.E.: Environmental Science and Technology. A Sustainable Approach to Green Science and
Technology, 2nd ed. CRC Press/Taylor & Francis, Boca Raton, USA 2007.
[11] Zhang M., Wang S., Wu F., Yuan X. and Zhang Y.: Atmos. Res., 2007, 84, 311–322.
[12] Fabian P. and Junge C.E.: Arch. Met. Geoph. Biokl., Serie A 1970, 19, 161–172.
[13] Nicholson J.P., Weston K.J. and Fowler D.: Atmos. Environ. 2001, 35, 2009–2022.
[14] Falkowska L. and Korzeniewski K.: Atmospheric Chemistry. Wyd. Uniwer. Gdañskiego, Gdañsk,
Poland 1998 [in Polish].
[15] Kleinman L.I.: Atmos. Environ. 2000, 34, 2023–2033.
[16] Carter W.P.L., Pierce J.A., Luo D. and Malkina I.L.: Atmos. Environ. 1995, 29, 2499–2511.
[17] Chang T.Y., Nance B.I. and Kelly N.A.: Atmos. Environ. 1999, 33, 4695–4708.
[18] Sillman S.: Atmos. Environ. 1999, 33, 1821–1845.
[19] Kleinman L.I.: Atmos. Environ. 2005, 39, 575–586.
[20] Wiegand A.N. and Bofinger N.D.: Atmos. Environ. 2000, 34, 99–108.
1036 Kazimierz Warmiñski and Agnieszka Bêœ
[21] Wratt D.S., Hadfield M.G., Jones M.T., Johnson G.M. and McBurney I.: Ecol. Modell. 1992, 64,
185–203.
[22] Sozzi R., Salcido A, Flores R.S. and Georgiadis T.: Atmos. Res. 1999, 50, 53–68.
[23] Seinfeld J.H. and Pandis S.N.: Atmospheric Chemistry and Physics. From Air Pollution to Climate
Changes. Wiley, New York 1998.
[24] Warmiñski K. and Rogalski L.: Polish J. Environ. Stud. 2007, 16(3B), 497–502.
[25] Castro T., Ruiz-Suarez L.G., Ruiz-Suarez J.C., Molina M.J. and Montero M.: Atmos. Environ. 1997, 31,
609–620.
[26] Barnard J.C., Chapman E.G., Fast J.D., Schmelzer J.R., Slusser J.R. and Shetter R.E.: Atmos. Environ.
2004, 38, 3393–3403.
DOBOWA I SEZONOWA ZMIENNOŒÆ STA£YCH SZYBKOŒCI REAKCJI
FOTOLIZY NO2 I TITRACJI NO ORAZ STOSUNKU NO2/NO
W POWIETRZU ATMOSFERYCZNYM OLSZTYNA
Katedra Ochrony Powietrza i Toksykologii Œrodowiska
Uniwersytet Warmiñsko-Mazurski w Olsztynie
Abstrakt: W pracy przedstawiono wyniki zmiennoœci sta³ych szybkoœci reakcji fotolizy NO2 (JNO2) i titracji
NO (k3), a tak¿e stosunku stê¿eñ NO2/NO wyznaczonego eksperymentalnie oraz obliczonego dla stanu
fotostacjonarnego w powietrzu atmosferycznym Olsztyna. Sta³a titracji w miesi¹cu letnim (czerwiec 2008 r.)
waha³a siê w ci¹gu doby w zakresie od 20.8 do 25.3 ppm–1
� min–1
, natomiast w miesi¹cu zimowym (grudzieñ
2008 r.) – w zakresie od 16.5 do 17.2 ppm–1
� min–1
. Z kolei sta³a JNO2, która zale¿y od natê¿enia ca³kowitego
promieniowania s³onecznego i k¹ta zenitalnego S³oñca, waha³a siê od zera w godzinach nocnych do
0.071 min–1
o godzinie 12:00 czasu lokalnego zim¹ i 0.254 min–1
o godz. 11:00 latem. Stosunek NO2/NO
wykazuje charakterystyczn¹ zmiennoœæ dobow¹ z minimum przypadaj¹cym na godziny po³udniowe. Zarówno
latem, jak i zim¹ obserwowany stosunek NO2/NO jest wiêkszy ni¿ obliczony. W czerwcu stwierdzono
najmniejsze wartoœci obliczonego stosunku NO2/NO, którego œrednia o godzinie 12:00 wynosi³a 0.0407 i by³a
a¿ 176 razy mniejsza ni¿ wartoœæ NO2/NO wyznaczona eksperymentalnie. Wskazuje to na du¿e znaczenie
reakcji utleniania NO do NO2 z udzia³em lotnych zwi¹zków organicznych (VOC) i/lub tlenku wêgla.
S³owa kluczowe: fotoliza NO2, titracja NO, sta³e szybkoœci reakcji, stosunek NO2/NO, fotochemia troposfery,
ozon troposferyczny
Diurnal and Seasonal Variations in the NO2 Photolysis Rate Constant... 1037

Miros³aw WYSZKOWSKI1
and Maja RADZIEMSKA
CONTENT OF NITROGEN COMPOUNDS
IN SOIL POLLUTED WITH CHROMIUM(III)
AND CHROMIUM(VI) AFTER APPLICATION
OF COMPOST, ZEOLITE AND CALCIUM OXIDE
ZAWARTOŒÆ ZWI¥ZKÓW AZOTOWYCH
W GLEBIE ZANIECZYSZCZONEJ CHROMEM(III) I CHROMEM(VI)
PO APLIKACJI KOMPOSTU, ZEOLITU I TLENKU WAPNIA
Abstract: The present study has been undertaken in order to determine the influence of tri- and hexavalent
chromium compounds – 25, 50, 100 and 150 mg � kg–1
of soil on the concentration of nitrogen compounds in
soil after crop harvest, and the effectiveness of neutralizing substances, such as compost, zeolite and calcium
oxide, on alleviating results of chromium pollution. Soil contamination with chromium(III) and chromium(VI)
significantly modified the content of nitrogen compounds in soil after plant harvests. Under the influence of
trivalent chromium, in a series lacking any neutralising substances, the total nitrogen content decreased while
the ammonia nitrogen level rose after plant harvest. Chromium(VI) had a similar influence on N-NH4
+. The
neutralising substances added to soil, such as compost, zeolite and calcium oxide had a significant effect on
the content of total nitrogen in soil. Calcium oxide in the objects polluted with chromium(III) and
chromium(VI) caused a significant decrease in the content of N-total in soil. Compost, zeolite and calcium
oxide caused an increase in the average content of N-NO3
–in soil, with the effect being stronger in post
polluted with chromium(VI) than with chromium(III). As for chromium(VI), the content of N-NO3
–was most
strongly affected by calcium oxide added as a soil amending substances. All the tested neutralising substances
had a weaker influence on the content of N-NH4
+in soil.
Keywords: chromium(III), chromium(VI), soil, compost, zeolite, CaO, N-NH4
+, N-NO3
–
Contamination of the natural environment with xenobiotics, including heavy metals,
leads to modifications of the basic physiochemical properties of soil. Chromium is one
of the heavy metals that can appear excessively in the environment due to human
activity. Various derivatives of this element are emitted to the nature, where they
undergo further transformations, creating a wide range of chemical and physical forms
[1]. The most widespread in nature are chromium compounds which have an oxidation
E C O L O G I C A L C H E M I S T R Y A N D E N G I N E E R I N G A
Vol. 16, No. 8 2009
1Department of Environmental Chemistry, University of Warmia and Mazury, pl. £ódzki 4, 10–727
Olsztyn, Poland, phone 89 523 35 66; email: [email protected]
state of +3 or +6. These compounds differ from each other in the chemical properties as
well as chemical and biological reactivity [2]. Research on reducing the effect of
chromium on soils or plants, which are an intermediary link in the trophic chain
between sources of chromium pollution and humans, seems important in all scientific
disciplines connected with nature conservation.
Thus, the present study has been undertaken in order to determine the influence of
tri- and hexavalent chromium compounds on the concentration of nitrogen compounds
in soil after crop harvest, and the effectiveness of neutralizing substances, such as
compost, zeolite and calcium oxide, on alleviating results of chromium pollution.
Material and methods
The experimental part of the study was conducted as a series of pot trials established
in a greenhouse belonging to the University of Warmia and Mazury in Olsztyn. The soil
used for the trials had a grain size distribution of light loamy sand and the following
properties: pHKCl 4.8, hydrolytic acidity (HA) – 33.75 mmol (H+) · kg
–1, exchangeable
base cations (EBC) – 62.20 mmol(+) · kg–1
, cation exchange capacity (CEC) – 95.95
mmol(+) · kg–1
; base saturation with base cations (BS) – 64.8 %, content of Corg – 7.13
g · kg–1
, content of available phosphorus 46.6 mg · kg–1
, potassium 8.2 mg · kg–1
, and
magnesium 33.9 mg · kg–1
, content of total nitrogen 0.27 mg · kg–1
, N-NH4
+16.20
mg · kg–1
, and N-NO3
–3.52 mg · kg
–1. Before being placed in polyethylene pots, each
holding 9.5 kg, soil was amended with neutralising substances, such as compost and
zeolite in the amount 3 % relative to the soil mass and calcium oxide in the amount
equal 1 hydrolytic acidity (HA). Additionally, the following quantities of basic macro-
and micronutrients were added to soil: N-110 [CO(NH2)2 + (NH4)6 Mo7O24 � 4H2O +
(NH4)2HO4], P-50 [(NH4)2HPO4], K-110 [KCl + KCr(SO4)2 � 12H2O + K2Cr2O7],
Mg-50 [MgSO4 � 7H2O], B-0.33 [H3BO3], Mn-5 [MnCl2 � 4H2O], Mo-5 [(NH4)6Mo7O24 ×
× 4H2O] mg · kg–1
soil. Soil was artificially polluted with aqueous solutions of
chromium(III) as KCr(SO4)2 · 12H2O and chromium(VI) as K2Cr2O7, in the following
rates: 0, 25, 50, 100 and 150 mg Cr · kg–1
of soil. Two crops were grown: spring barley
(Hordeum vulgare L.) cv. Ortega (main crop) and maize (Zea mays L.) cv. Fripon
(aftercrop). The sowing density of barley was 15, while that of maize was 8 plants per
pot. During the growth of the crops, the soil moisture content was maintained at 60 %
capillary water capacity. Spring barley was harvested during the heading phase and
maize was collected in the intensive stem elongation phase, ie on days 56 and 67 of
vegetative growth, respectively. Soil material was sampled during the maize harvest.
Soil samples were tested to determine total nitrogen content with Kjeldahl’s method
in concentrated sulphuric(VI) acid and hydrogen peroxide as a catalyser [3], N-NH4
+by
colorimetric method with Nessler’s reagent [4], N-NO3
–by colorimetric method using
phenoldisulfonic acid [4]. The results of the determinations were processed statistically
with an aid of Statistica software programme [5], applying three-factor analysis of
variance ANOVA. Besides, Pearson’s simple correlation coefficients were used to test
the relationships between soil pollution with chromium(III) and chromium(VI) versus
the content of nitrogen compounds in soil.
1040 Miros³aw Wyszkowski and Maja Radziemska
Results and discussion
Nitrogen which enters soil undergoes complex and dynamic transformations. Its
chemical form and amount present in soil depends on a number of factors including
climatic conditions, content of organic matter, mineral fertilization and man-made
conditions [6–9]. When present in soil in excessive amounts, heavy metals can retard
mineralization of organic compounds, which are a source of nitrogen [10]. In the
present pot experiment, soil contamination with chromium(III) and chromium(VI)
significantly modified the content of nitrogen compounds in soil after spring barley and
maize harvests. In the series without neutralising substances, soil from the objects
polluted with hexavalent chromium rather than trivalent chromium contained more total
nitrogen (7 % more on average) (Table 1). Higher rates of trivalent chromium had a
negative effect on the total nitrogen content in analysed soil (r = –0.967), with the
highest dose of Cr(III), ie 150 mg � kg–1
soil, depressing the concentration of N-total by
36 % relative to the control series (no pollution). The effect of Cr(VI) on the
concentration of nitrate(V) nitrogen in the analysed soil was less unambiguous.
Microbiological and chemical reactions involved in the mineralization processes of
organic nitrogen forms generate mineral forms of this element: ammonium cation NH4
+
and nitrate anion NO3
–[11]. In soil, these two ions are the primary source of nitrogen
for plants [12]. Under the soil and climatic conditions occurring in Poland, N-NH4
+is
typically the dominant form of mineral nitrogen [6, 13]. Mineralization of organic
nitrogen bonds depends on the decomposition of organic soil matter components, C:N
ratio and moisture within the soil profile [14, 15]. The process is made possible by
various groups of soil borne microorganisms, which produce enzymes involved in
deamination of organic nitrogen compounds [16, 17]. In a study performed by
Wyszkowska [18], hexavalent chromium strongly affected transformations of organic
and mineral forms of nitrogen in soil, inhibiting the processes of ammonification and
nitrification. According to Rudnicki and Galezewski [19], growing plants take up
nitrogen mainly in its nitrate form, thus depleting nitrogen supply in soil. In the present
experiment, increasing rates of tri- and hexavalent chromium in the series with
unamended soil positively shaped the content of N-NH4
+in analysed soil. In the series
with Cr(III), the rate of 150 mg � kg–1
had the strongest effect, doubling the
concentration of N-NH4
+. Hexavalent chromium had a positive effect on the content of
ammonia nitrogen, initially raising its concentration in soil and later maintaining it on
an approximately same level. In the series without neutralising substances, under the
influence of the lowest Cr(VI) rate, ie 25 mg � kg–1
soil, ammonia nitrogen was
observed to have increased by 51 %. In contrast, the highest dose of hexavalent
chromium (150 mg � kg–1
) resulted in a nearly two-fold decrease in the concentration of
N-NO3
–versus the control.
The concentration of nitrogen compounds in soil was also affected by the
neutralising substances such as compost, zeolite and calcium oxide (Table 1). The
strongest negative effect on the average total nitrogen content in soil after crop harvests
was produced by calcium oxide, both in the tri- and hexavalent trials. Under the
influence of this substance, the average total nitrogen content fell by 23 and 51 %,
Content of Nitrogen Compounds in Soil Polluted with Chromium(III) and Chromium(VI)... 1041
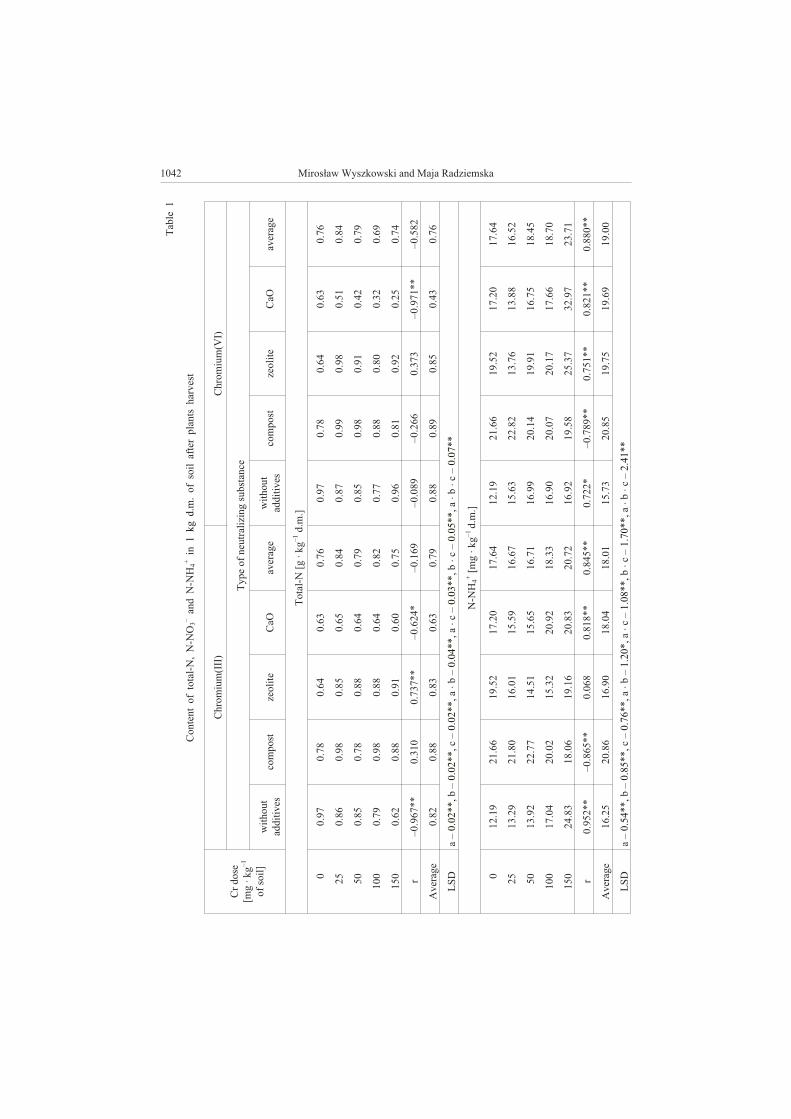
1042 Miros³aw Wyszkowski and Maja RadziemskaT
able
1
Conte
nt
of
tota
l-N
,N
-N
O3
–and
N-N
H4
+in
1kg
d.m
.of
soil
afte
rpla
nts
harvest
Cr
dose
[m
g·kg
–1
of
soil
]
Chrom
ium
(III)
Chrom
ium
(V
I)
Type
of
neutr
ali
zin
gsubsta
nce
wit
hout
addit
ives
com
post
zeoli
teC
aO
average
wit
hout
addit
ives
com
post
zeoli
teC
aO
average
Tota
l-N
[g
·kg
–1
d.m
.]
00.9
70.7
80.6
40.6
30.7
60.9
70.7
80.6
40.6
30.7
6
25
0.8
60.9
80.8
50.6
50.8
40.8
70.9
90.9
80.5
10.8
4
50
0.8
50.7
80.8
80.6
40.7
90.8
50.9
80.9
10.4
20.7
9
100
0.7
90.9
80.8
80.6
40.8
20.7
70.8
80.8
00.3
20.6
9
150
0.6
20.8
80.9
10.6
00.7
50.9
60.8
10.9
20.2
50.7
4
r–0.9
67**
0.3
10
0.7
37**
–0.6
24*
–0.1
69
–0.0
89
–0.2
66
0.3
73
–0.9
71**
–0.5
82
Average
0.8
20.8
80.8
30.6
30.7
90.8
80.8
90.8
50.4
30.7
6
LS
Da
–0.0
2**,
b–
0.0
2**,
c–
0.0
2**,
a�b
–0.0
4**,a
�c
–0.0
3**,b
�c
–0.0
5**,
a�b
�c
–0.0
7**
N-N
H4
+[m
g·kg
–1d.m
.]
012.1
921.6
619.5
217.2
017.6
412.1
921.6
619.5
217.2
017.6
4
25
13.2
921.8
016.0
115.5
916.6
715.6
322.8
213.7
613.8
816.5
2
50
13.9
222.7
714.5
115.6
516.7
116.9
920.1
419.9
116.7
518.4
5
100
17.0
420.0
215.3
220.9
218.3
316.9
020.0
720.1
717.6
618.7
0
150
24.8
318.0
619.1
620.8
320.7
216.9
219.5
825.3
732.9
723.7
1
r0.9
52**
–0.8
65**
0.0
68
0.8
18**
0.8
45**
0.7
22*
–0.7
89**
0.7
51**
0.8
21**
0.8
80**
Average
16.2
520.8
616.9
018.0
418.0
115.7
320.8
519.7
519.6
919.0
0
LS
Da
–0.5
4**,
b–
0.8
5**,
c–
0.7
6**,
a�b
–1.2
0*,
a�c
–1.0
8**,
b�c
–1.7
0**,
a�b
�c
–2.4
1**
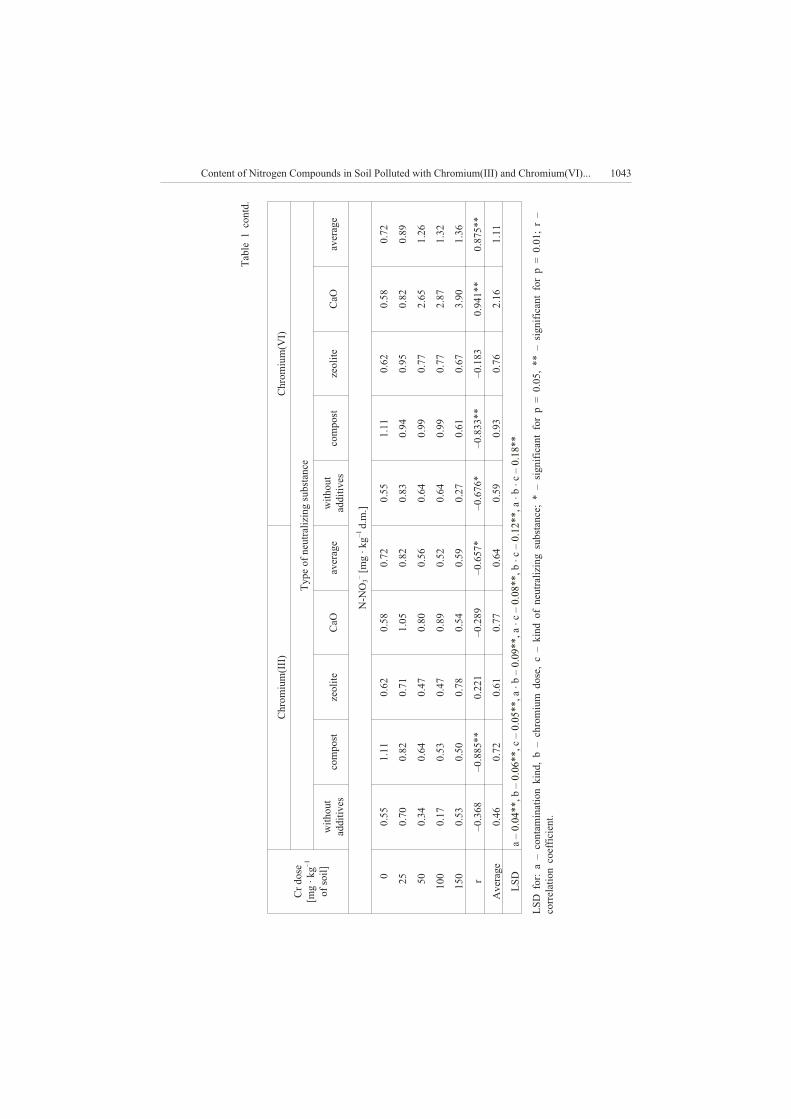
Content of Nitrogen Compounds in Soil Polluted with Chromium(III) and Chromium(VI)... 1043
Cr
dose
[m
g·kg
–1
of
soil
]
Chrom
ium
(III)
Chrom
ium
(V
I)
Type
of
neutr
ali
zin
gsubsta
nce
wit
hout
addit
ives
com
post
zeoli
teC
aO
average
wit
hout
addit
ives
com
post
zeoli
teC
aO
average
N-N
O3
–[m
g·kg
–1d.m
.]
00.5
51.1
10.6
20.5
80.7
20.5
51.1
10.6
20.5
80.7
2
25
0.7
00.8
20.7
11.0
50.8
20.8
30.9
40.9
50.8
20.8
9
50
0.3
40.6
40.4
70.8
00.5
60.6
40.9
90.7
72.6
51.2
6
100
0.1
70.5
30.4
70.8
90.5
20.6
40.9
90.7
72.8
71.3
2
150
0.5
30.5
00.7
80.5
40.5
90.2
70.6
10.6
73.9
01.3
6
r–0.3
68
–0.8
85**
0.2
21
–0.2
89
–0.6
57*
–0.6
76*
–0.8
33**
–0.1
83
0.9
41**
0.8
75**
Average
0.4
60.7
20.6
10.7
70.6
40.5
90.9
30.7
62.1
61.1
1
LS
Da
–0.0
4**,
b–
0.0
6**,
c–
0.0
5**,
a�b
–0.0
9**,a
�c
–0.0
8**,b
�c
–0.1
2**,
a�b
�c
–0.1
8**
LS
Dfor:
a–
conta
min
ati
on
kin
d,
b–
chrom
ium
dose,
c–
kin
dof
neutr
ali
zin
gsubsta
nce;
*–
sig
nif
icant
for
p=
0.0
5,
**
–sig
nif
icant
for
p=
0.0
1;
r–
correla
tion
coeffic
ient.
Table
1contd
.
respectively, relative to the control variant (unamended soil). When chromium(III) was
tested as a pollutant, the total nitrogen content was significantly affected by compost, as
it increased by several per cent compared with the control (no soil improving
substances). The level of ammonia nitrogen was most significantly influenced by the
introduction of compost, both to tri- and hexavalent chromium polluted pots, where this
neutraliser increased the average N-NH4
+by 28 and 33 %, respectively, versus the
control without any neutralising substances. In the series with hexavalent chromium,
zeolite and calcium oxide produced weaker effect. The application of compost, zeolite
and calcium oxide to soil under spring barley and maize increased the content of nitrate
nitrogen, with the rise being higher in objects polluted with Cr(VI) versus to pots with
Cr(III). When soil was contaminated with hexavalent chromium, the content of N-NO3
–
was most strongly affected by calcium oxide added to soil, which raised the amount of
this form of nitrogen by nearly four-fold compared with the control. Compost added to
soil produced weaker influence on the analysed properties of soil. Application of
composts improves physical, chemical and biological properties of soil [20], but can
also be effective in reducing the negative influence of chromium on the content of
nitrogen compounds, which has been confirmed by the present experiment. In another
experiment, Wyszkowski and Zió³kowska [21, 22] concluded that soil liming caused
a decrease in the amount of ammonia nitrogen.
Conclusions
1. Under the influence of trivalent chromium, in a series lacking any neutralising
substances, the total nitrogen content decreased while the ammonia nitrogen level rose
after plant harvest. Chromium(VI) had a similar influence on N-NH4
+.
2. The neutralising substances added to soil, such as compost, zeolite and calcium
oxide had a significant effect on the content of total nitrogen in soil.
3. Calcium oxide in the objects polluted with chromium(III) and chromium(VI)
caused a significant decrease in the content of N-total in soil.
4. Compost, zeolite and calcium oxide caused an increase in the average content of
N-NO3
–in soil, with the effect being stronger in post polluted with chromium(VI) than
with chromium(III). As for chromium(VI), the content of N-NO3
–was most strongly
affected by calcium oxide added as a soil amending substances. All the tested
neutralising substances had a weaker influence on the content of N-NH4
+in soil.
Acknowledgements
The study has been performed as part of research funded by the Polish Ministry of Science and Higher
Education No. N N305 1059 33.
References
[1] Richard F.C. and Bourg A.C.M.: Water Res. 1991, 25(7), 807–816.
[2] Shupac S.I.: Environ. Health Perspect. 1991, 92, 7–11.
[3] Bremner J.M.: Amer. Soc. Agron. 1965, 2, 1149–1178.
1044 Miros³aw Wyszkowski and Maja Radziemska
[4] Panak H. (ed.): Przewodnik metodyczny do æwiczeñ z chemii rolnej. Wyd. ART., Olsztyn 1997, 242 pp.
[5] StatSoft, Inc.: STATISTICA (data analysis software system), version 8.0. www.statsoft.com, 2007.
[6] Czêpiñska-Kamiñska D., Rutkowski A. and Zakrzewski S.: Roczn. Glebozn. 1999, 50(4), 47–56.
[7] Scholefield D., Lockyer D.R. Whitehead D.C. and Tyson K.C.: Plant Soil 1991, 132, 165–171.
[8] Fotyma E.: Zesz. Probl. Post. Nauk Roln. 1996, 440, 89–100.
[9] Czeka³a J.: Zesz. Probl. Post. Nauk. Roln. 2003, 493, 585–590.
[10] Benbi D.K., Richter J., Vermoesen A. and Van-Cleemput O.: Proc. of the 8th
nitrogen workshop held at
the University of Ghent, 5–8 September 1996, 17–22.
[11] Sapek B.: Mat. Inf., Wyd. IMUZ 1995, 30, 31 pp.
[12] Fotyma E., Fotyma M. and Pietruch: Nawozy Nawo¿. 2005, 2(23), 39–48.
[13] £abêtowicz J. and Rutkowska B.: Zesz. Probl. Post. Nauk Roln. 1996, 440, 224–229.
[14] Gotkiewicz J. and Gotkiewicz M.: Wiad. IMUZ 1991, 77, 59–76.
[15] Paul E.A. and Clark F.E.: Mikrobiologia i biochemia gleb, Wyd. UMCS, Lublin 2000, 400 pp.
[16] Barabasz W.: Post. Mikrobiol. 1992, 31, 3–33.
[17] Brzeziñska M., Stêpniewska Z. and Stêpniewski W.: Soil Biol. Biochem. 1998, 30(13), 1783–1790.
[18] Wyszkowska J.: Rozprawy i monografie, Wyd. UWM, Olsztyn 2002, 134 pp.
[19] Rudnicki F. and Ga³êzewski L.: Roczn. AR Poznañ 2006, 66, 323–329
[20] Szulc W., Rutkowska B., £abêtowicz J. and O¿arowski G.: Zesz. Probl. Post. Nauk Roln. 2003, 494,
445–451.
[21] Wyszkowski M. and Zió³kowska A.: Zesz. Probl. Post. Nauk. Roln. 2006, 513, 563–573.
[22] Wyszkowski M. and Zió³kowska A.: Ochr. Œrodow. Zasob. Natur. 2007, 31, 154–159.
ZAWARTOŒÆ ZWI¥ZKÓW AZOTOWYCH
W GLEBIE ZANIECZYSZCZONEJ CHROMEM(III) I CHROMEM(VI)
PO APLIKACJI KOMPOSTU, ZEOLITU I TLENKU WAPNIA
Katedra Chemii Œrodowiska
Uniwersytet Warmiñsko-Mazurski w Olsztynie
Abstrakt: Celem przeprowadzonych badañ by³o okreœlenie wp³ywu wzrastaj¹cego zanieczyszczenia zwi¹z-
kami chromu(III) i chromu(VI) – 25, 50, 100, 150 mg � kg–1
gleby oraz kompostu, zeolitu i tlenku wapnia na
zawartoœæ zwi¹zków azotowych w glebie po zbiorze jêczmienia jarego i kukurydzy. Zanieczyszczenie
chromem(III) i chromem(VI) znacz¹co modyfikowa³o zawartoœæ zwi¹zków azotowych w glebach po zbiorze
roœlin. Pod wp³ywem chromu trójwartoœciowego w serii bez dodatków ³agodz¹cych nast¹pi³o zmniejszenie
zawartoœci N-ogólnego, natomiast zwiêkszenie stê¿enia N-amonowego w glebie po zbiorze roœlin. Podobny
wp³yw mia³ chrom(VI) w przypadku N-NH4
+. Zastosowane dodatki neutralizuj¹ce w postaci kompostu,
zeolitu i tlenku wapnia mia³y znacz¹cy wp³yw na zawartoœæ badanych form azotu w glebie. Tlenek wapnia
w obiektach z chromem(III) i chromem(VI) wywo³a³ znacz¹ce zmniejszenie zawartoœci N-ogólnego w glebie.
Kompost, zeolit i tlenek wapnia spowodowa³ zwiêkszenie œredniej zawartoœci N-NO3
–w glebie, przy czym
dzia³anie to by³o wiêksze w wazonach z chromem(VI) ni¿ w obiektach z chromem(III). W przypadku
chromu(VI) na zawartoϾ N-NO3
–najsilniej wp³ywa³ dodatek do gleby tlenku wapnia. Zastosowane substan-
cje najs³abiej dzia³a³y na zawartoœæ N-NH4
+w glebie.
S³owa kluczowe: chrom(III), chrom(VI), gleba, kompost, zeolit, CaO, N-NH4
+, N-NO3
–
Content of Nitrogen Compounds in Soil Polluted with Chromium(III) and Chromium(VI)... 1045

Miros³aw WYSZKOWSKI1, Maja RADZIEMSKA
and Veranika SIVITSKAYA
EFFECT OF COMPOST, BENTONITE,
ZEOLITE AND CALCIUM OXIDE
ON MINERAL NITROGEN CONTENT
IN NICKEL CONTAMINATED SOIL
WP£YW KOMPOSTU, BENTONITU, ZEOLITU I TLENKU WAPNIA
NA ZAWARTOή AZOTU MINERALNEGO
W GLEBIE ZANIECZYSZCZONEJ NIKLEM
Abstract: The purpose of this study has been to determine the effect of compost, bentonite, zeolite and
calcium oxide on the concentration of nitrogen in nickel contaminated soil (0, 100, 200 and 300 mg Ni � kg–1
of soil). The level of mineral nitrogen in soil depended on the soil contamination with nickel, addition of
pollution neutralizing substances and crop species. The effect of nickel on the content of mineral nitrogen in
soil was closely connected with the crop species. In the series of trials without substances alleviating nickel
contamination, the metal pollution depressed the share and content of N-NO3
–in mineral nitrogen in soil
under oats, but raised its concentration and percentage in soil under yellow lupine. The effect of nickel was
much stronger in soil under yellow lupine than under oats. Nickel had an adverse effect on the content of
N-NH4
+in soil under yellow lupine. Application of bentonite, zeolite and calcium oxide limited the content of
ammonia nitrogen in soil, as compared with the average concentration from the unamended series. Bentonite
had the strongest effect on the content of N-NH4
+in soil under oats, while in soil under yellow lupine zeolite
and calcium oxide were the most effective. The neutralising substances added to soil had a contrary influence
on the content of nitrate(V) nitrogen when compared with that produced on ammonia nitrogen. They all
favoured increased concentration of this form of nitrogen in soil. The strongest effect on the average content
of N-NO3
–was produced by bentonite. Bentonite, zeolite and calcium oxide resulted in increased ratios of
nitrate nitrogen in total mineral nitrogen in soil, with bentonite producing a stronger effect in soil under oats
while zeolite and calcium oxide being more effective in soil under yellow lupine. Zeolite and calcium oxide
had a stronger effect on the ratio of N-NO3
–in soil under yellow lupine than in soil under oats. Compost
produced similar results, but only in soil under yellow lupine.
Keywords: contamination, nickel, compost, bentonite, zeolite, calcium oxide, soil, mineral nitrogen
Under the soil and climatic conditions prevailing in Poland, nitrogen is one of the
major nutrients essential for the proper growth and development of crops. The element
plays a critical role in soil fertility and volume of crop yields [1]. Atmosphere is the
E C O L O G I C A L C H E M I S T R Y A N D E N G I N E E R I N G A
Vol. 16, No. 8 2009
1Department of Environmental Chemistry, University of Warmia and Mazury, pl. £ódzki 4, 10–727
Olsztyn, Poland, phone 89 523 35 66; email: [email protected]
main source of nitrogen, which, bound either biologically or chemically, enters soils,
where it undergoes various transformations [2]. Plants take up mineral nitrogen as NH4
+
and NO3
–ions [3]. The rate of releasing mineral nitrogen in soil depends on
environmental conditions and varies between years and different periods of the
vegetative season [4]. The most important source of nitrogen for the crops grown in
Poland is mineral fertilization, and the way it is utilized depends on crop species,
fertilization rates and techniques as well as soil and climatic conditions [5]. Crops use
up to 50–70 % of nitrogen from mineral fertilizers but much less, about 30 %, from
organic fertilizers [6]. Organic compounds from organic fertilizers undergo mineral-
ization, which results in the generation of ammonia nitrogen NH4
+; mineral fertilizers
are a source of nitrogen in the form of NH4
+and NO3
–ions. Through nitrification, NH4
+
is transformed to NO3
–[7]. These mineral forms are a source of nitrogen for plants, but
when taken up in excess can disturb their homeostasis due to the excessive accumula-
tion of nitrates(V) compounded by the limited content of total nitrogen, proteins, free
amino acids and sugars in plant tissues [8]. The forms of nitrogen which have not been
absorbed by plants, particularly nitrates(V), can migrate downwards through the soil
profile and threaten the soil environment, including soil and ground waters [9]. The
content of mineral nitrogen in soil can fluctuate depending on a number of factors such
as, for example, trace elements in soil, including nickel. The effect of nickel can be
inhibited by adding to soil various substances, eg post-production waste. However,
application of such soil supplements can have beneficial as well as adverse influence on
natural environment, including soil, or on the growth and development of crops [10].
The purpose of this study has been to determine the effect of compost, bentonite,
zeolite and calcium oxide on the concentration of nitrogen in nickel contaminated soil.
Material and methods
The experiment has been conducted in a greenhouse belonging to the University of
Warmia and Mazury in Olsztyn. The trials were established in polyethylene pots
containing 9.5 kg of soil of the grain size distribution corresponding to loamy sand. Soil
was polluted with nickel in the following amounts: 0, 100, 200 and 300 mg Ni � kg–1
soil. The following substances were added to soil to alleviate the effects of nickel
pollution: compost (3 % of soil mass), bentonite and zeolite (2 % of soil mass) and
calcium oxide (60 %) in the amount equal 1 hydrolytic acidity (HA). In order to ensure
proper nourishment of the crops, basic nutrients were added to all the pots in the
following quantities [mg � kg–1
of soil]: N-150 (oats) and 25 (yellow lupine) [CO(NH2)2
+ (NH4)6Mo7O24 � 4H2O], P-30 [KH2PO4]; K-75 [KH2PO4 + KCl], Mg-50 [MgSO4 ×
× 7H2O], Mn-5 [MnCl2 � 4H2O], Mo-5 [(NH4)6Mo7O24 � 4H2O], B-0.33 [H3BO3].
Nickel was introduced to soil as NiCl2 � 6H2O. The effect of nickel and neutralising
substances was tested on oats (Avena sativa L.) cv. Borowiak and yellow lupine
(Lupinus luteus L.) cv. Mister. The sowing density of oats was 15 plants per pot and that
of yellow lupine – 8 plants per pot. During the plants’ growing season, the soil moisture
content was maintained at 60 % of capillary water capacity. The crops were harvested
during the inflorescence stage, after 58 days of vegetative growth.
1048 Miros³aw Wyszkowski et al
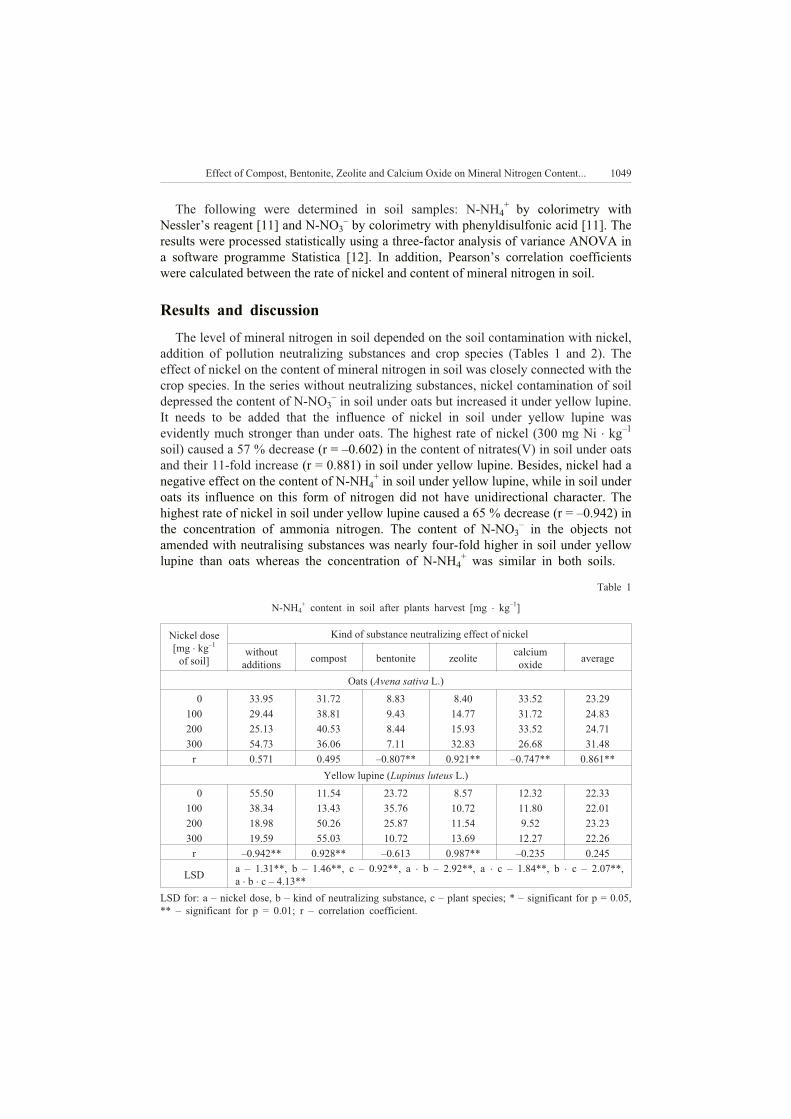
The following were determined in soil samples: N-NH4
+by colorimetry with
Nessler’s reagent [11] and N-NO3
–by colorimetry with phenyldisulfonic acid [11]. The
results were processed statistically using a three-factor analysis of variance ANOVA in
a software programme Statistica [12]. In addition, Pearson’s correlation coefficients
were calculated between the rate of nickel and content of mineral nitrogen in soil.
Results and discussion
The level of mineral nitrogen in soil depended on the soil contamination with nickel,
addition of pollution neutralizing substances and crop species (Tables 1 and 2). The
effect of nickel on the content of mineral nitrogen in soil was closely connected with the
crop species. In the series without neutralizing substances, nickel contamination of soil
depressed the content of N-NO3
–in soil under oats but increased it under yellow lupine.
It needs to be added that the influence of nickel in soil under yellow lupine was
evidently much stronger than under oats. The highest rate of nickel (300 mg Ni � kg–1
soil) caused a 57 % decrease (r = –0.602) in the content of nitrates(V) in soil under oats
and their 11-fold increase (r = 0.881) in soil under yellow lupine. Besides, nickel had a
negative effect on the content of N-NH4
+in soil under yellow lupine, while in soil under
oats its influence on this form of nitrogen did not have unidirectional character. The
highest rate of nickel in soil under yellow lupine caused a 65 % decrease (r = –0.942) in
the concentration of ammonia nitrogen. The content of N-NO3
–in the objects not
amended with neutralising substances was nearly four-fold higher in soil under yellow
lupine than oats whereas the concentration of N-NH4
+was similar in both soils.
Table 1
N-NH4
+content in soil after plants harvest [mg � kg
–1]
Nickel dose
[mg � kg–1
of soil]
Kind of substance neutralizing effect of nickel
without
additionscompost bentonite zeolite
calcium
oxideaverage
Oats (Avena sativa L.)
0 33.95 31.72 8.83 8.40 33.52 23.29
100 29.44 38.81 9.43 14.77 31.72 24.83
200 25.13 40.53 8.44 15.93 33.52 24.71
300 54.73 36.06 7.11 32.83 26.68 31.48
r 0.571 0.495 –0.807** 0.921** –0.747** 0.861**
Yellow lupine (Lupinus luteus L.)
0 55.50 11.54 23.72 8.57 12.32 22.33
100 38.34 13.43 35.76 10.72 11.80 22.01
200 18.98 50.26 25.87 11.54 9.52 23.23
300 19.59 55.03 10.72 13.69 12.27 22.26
r –0.942** 0.928** –0.613 0.987** –0.235 0.245
LSDa – 1.31**, b – 1.46**, c – 0.92**, a � b – 2.92**, a � c – 1.84**, b � c – 2.07**,
a � b � c – 4.13**
LSD for: a – nickel dose, b – kind of neutralizing substance, c – plant species; * – significant for p = 0.05,
** – significant for p = 0.01; r – correlation coefficient.
Effect of Compost, Bentonite, Zeolite and Calcium Oxide on Mineral Nitrogen Content... 1049
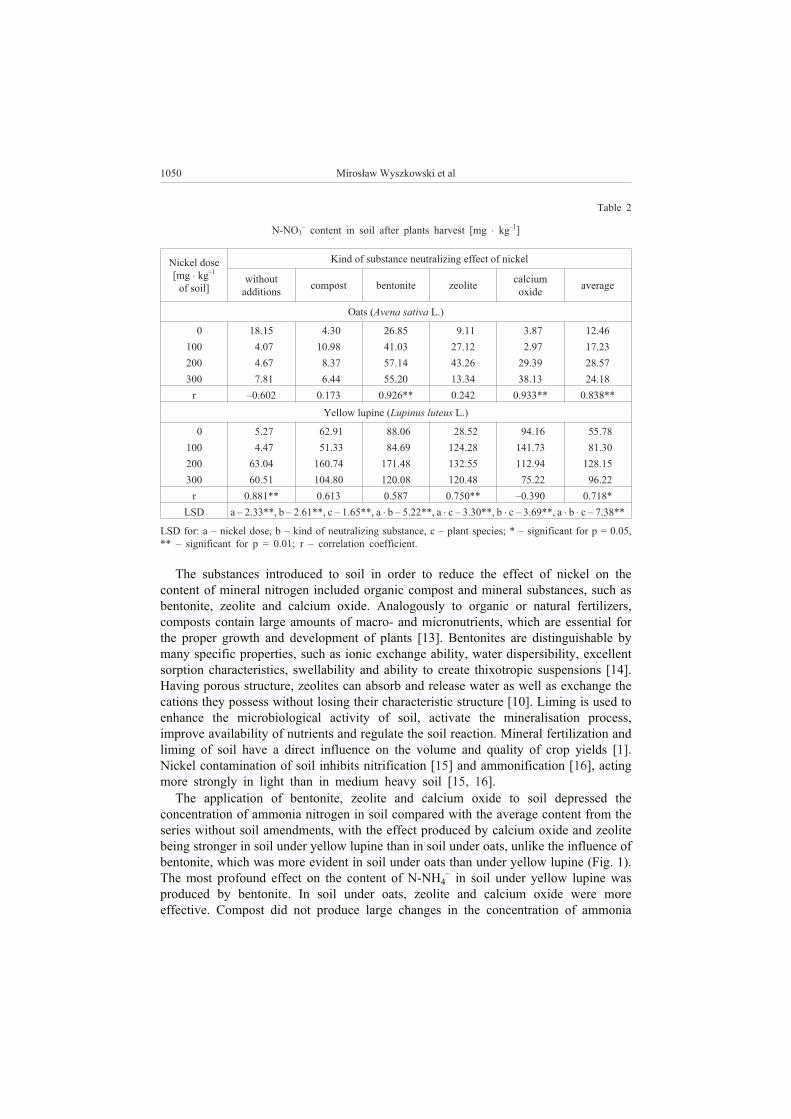
Table 2
N-NO3
–content in soil after plants harvest [mg � kg
–1]
Nickel dose
[mg � kg–1
of soil]
Kind of substance neutralizing effect of nickel
without
additionscompost bentonite zeolite
calcium
oxideaverage
Oats (Avena sativa L.)
0 18.15 4.30 26.85 9.11 3.87 12.46
100 4.07 10.98 41.03 27.12 2.97 17.23
200 4.67 8.37 57.14 43.26 29.39 28.57
300 7.81 6.44 55.20 13.34 38.13 24.18
r –0.602 0.173 0.926** 0.242 0.933** 0.838**
Yellow lupine (Lupinus luteus L.)
0 5.27 62.91 88.06 28.52 94.16 55.78
100 4.47 51.33 84.69 124.28 141.73 81.30
200 63.04 160.74 171.48 132.55 112.94 128.15
300 60.51 104.80 120.08 120.48 75.22 96.22
r 0.881** 0.613 0.587 0.750** –0.390 0.718*
LSD a – 2.33**, b – 2.61**, c – 1.65**, a � b – 5.22**, a � c – 3.30**, b � c – 3.69**, a � b � c – 7.38**
LSD for: a – nickel dose, b – kind of neutralizing substance, c – plant species; * – significant for p = 0.05,
** – significant for p = 0.01; r – correlation coefficient.
The substances introduced to soil in order to reduce the effect of nickel on the
content of mineral nitrogen included organic compost and mineral substances, such as
bentonite, zeolite and calcium oxide. Analogously to organic or natural fertilizers,
composts contain large amounts of macro- and micronutrients, which are essential for
the proper growth and development of plants [13]. Bentonites are distinguishable by
many specific properties, such as ionic exchange ability, water dispersibility, excellent
sorption characteristics, swellability and ability to create thixotropic suspensions [14].
Having porous structure, zeolites can absorb and release water as well as exchange the
cations they possess without losing their characteristic structure [10]. Liming is used to
enhance the microbiological activity of soil, activate the mineralisation process,
improve availability of nutrients and regulate the soil reaction. Mineral fertilization and
liming of soil have a direct influence on the volume and quality of crop yields [1].
Nickel contamination of soil inhibits nitrification [15] and ammonification [16], acting
more strongly in light than in medium heavy soil [15, 16].
The application of bentonite, zeolite and calcium oxide to soil depressed the
concentration of ammonia nitrogen in soil compared with the average content from the
series without soil amendments, with the effect produced by calcium oxide and zeolite
being stronger in soil under yellow lupine than in soil under oats, unlike the influence of
bentonite, which was more evident in soil under oats than under yellow lupine (Fig. 1).
The most profound effect on the content of N-NH4
–in soil under yellow lupine was
produced by bentonite. In soil under oats, zeolite and calcium oxide were more
effective. Compost did not produce large changes in the concentration of ammonia
1050 Miros³aw Wyszkowski et al
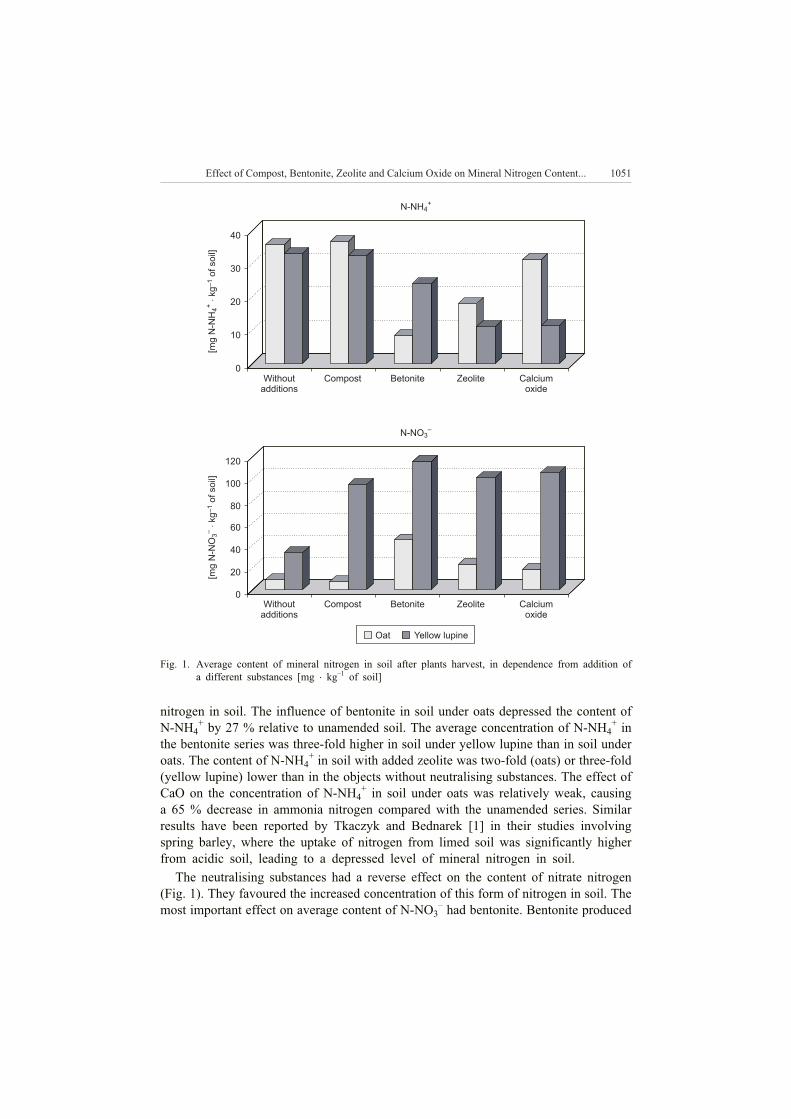
nitrogen in soil. The influence of bentonite in soil under oats depressed the content of
N-NH4
+by 27 % relative to unamended soil. The average concentration of N-NH4
+in
the bentonite series was three-fold higher in soil under yellow lupine than in soil under
oats. The content of N-NH4
+in soil with added zeolite was two-fold (oats) or three-fold
(yellow lupine) lower than in the objects without neutralising substances. The effect of
CaO on the concentration of N-NH4
+in soil under oats was relatively weak, causing
a 65 % decrease in ammonia nitrogen compared with the unamended series. Similar
results have been reported by Tkaczyk and Bednarek [1] in their studies involving
spring barley, where the uptake of nitrogen from limed soil was significantly higher
from acidic soil, leading to a depressed level of mineral nitrogen in soil.
The neutralising substances had a reverse effect on the content of nitrate nitrogen
(Fig. 1). They favoured the increased concentration of this form of nitrogen in soil. The
most important effect on average content of N-NO3
–had bentonite. Bentonite produced
Effect of Compost, Bentonite, Zeolite and Calcium Oxide on Mineral Nitrogen Content... 1051
120
100
80
60
40
40
30
20
10
0
20
0
Oat Yellow lupine
Without
additions
Without
additions
Compost
Compost
Betonite
Betonite
Zeolite
Zeolite
Calcium
oxide
Calcium
oxide
N-NO3
–
N-NH4
+
[mg
kg
of
soil]
�
–1
N-N
O3
–[m
gkg
ofso
il]
�
–1
N-N
H4
+
Fig. 1. Average content of mineral nitrogen in soil after plants harvest, in dependence from addition of
a different substances [mg � kg–1
of soil]
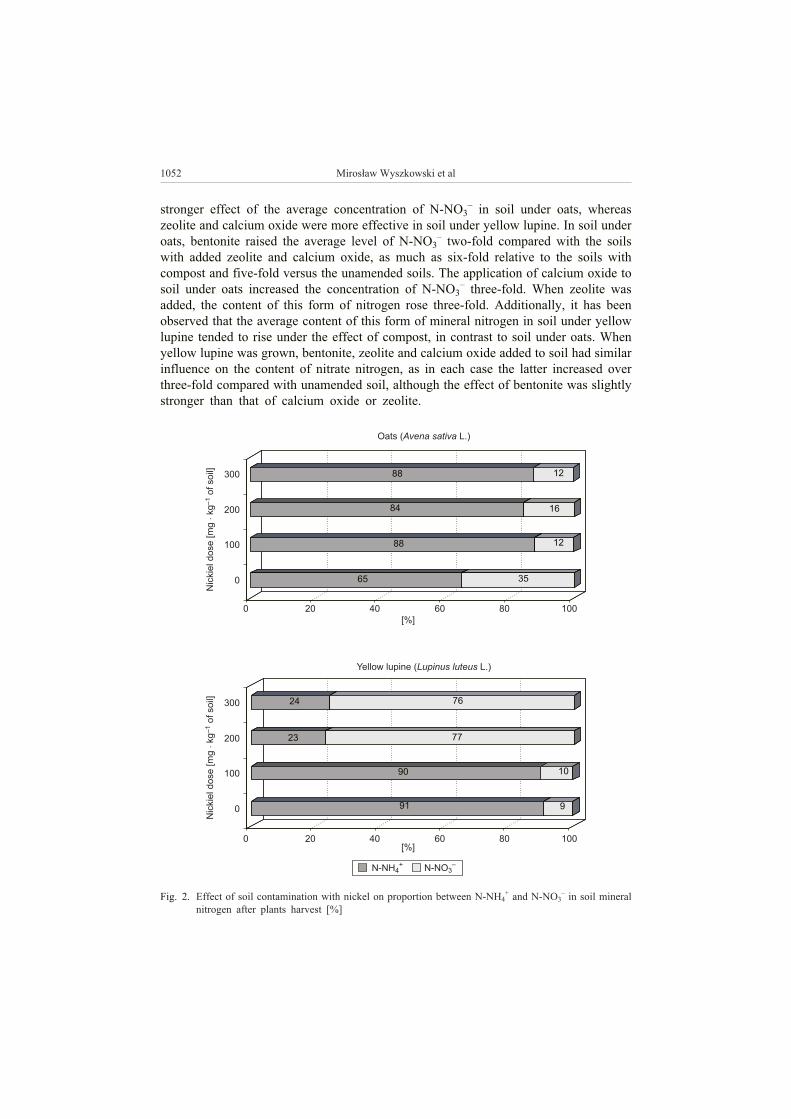
stronger effect of the average concentration of N-NO3
–in soil under oats, whereas
zeolite and calcium oxide were more effective in soil under yellow lupine. In soil under
oats, bentonite raised the average level of N-NO3
–two-fold compared with the soils
with added zeolite and calcium oxide, as much as six-fold relative to the soils with
compost and five-fold versus the unamended soils. The application of calcium oxide to
soil under oats increased the concentration of N-NO3
–three-fold. When zeolite was
added, the content of this form of nitrogen rose three-fold. Additionally, it has been
observed that the average content of this form of mineral nitrogen in soil under yellow
lupine tended to rise under the effect of compost, in contrast to soil under oats. When
yellow lupine was grown, bentonite, zeolite and calcium oxide added to soil had similar
influence on the content of nitrate nitrogen, as in each case the latter increased over
three-fold compared with unamended soil, although the effect of bentonite was slightly
stronger than that of calcium oxide or zeolite.
1052 Miros³aw Wyszkowski et al
65 35
88 12
84 16
88 12
91 9
90 10
23 77
24 76
Nic
kie
ld
ose
[mg
kg
of
so
il]
�
–1
Nic
kie
ld
ose
[mg
kg
of
so
il]
�
–1
300
300
200
200
100
100
0
0
0
0
20
20
40
40
60
60
80
80
100
100
[%]
[%]
Oats ( L.)Avena sativa
Yellow lupine ( L.)Lupinus luteus
N-NH4
+N-NO3
–
Fig. 2. Effect of soil contamination with nickel on proportion between N-NH4
+and N-NO3
–in soil mineral
nitrogen after plants harvest [%]
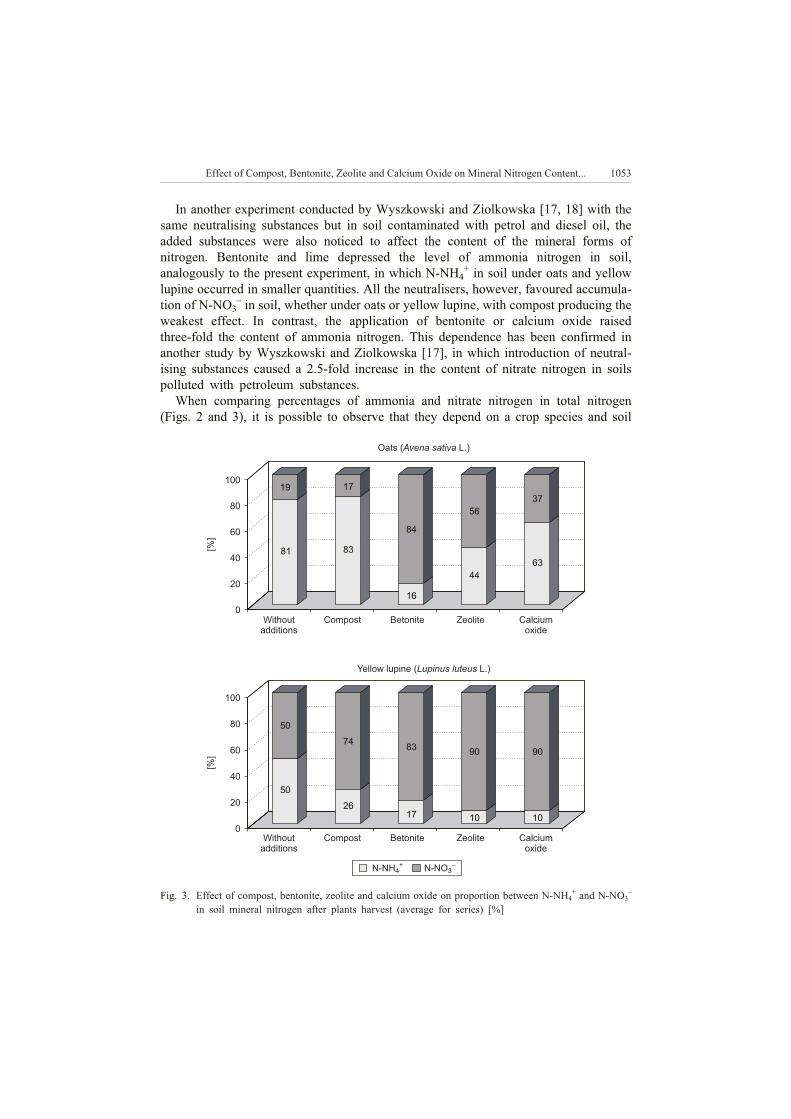
In another experiment conducted by Wyszkowski and Ziolkowska [17, 18] with the
same neutralising substances but in soil contaminated with petrol and diesel oil, the
added substances were also noticed to affect the content of the mineral forms of
nitrogen. Bentonite and lime depressed the level of ammonia nitrogen in soil,
analogously to the present experiment, in which N-NH4
+in soil under oats and yellow
lupine occurred in smaller quantities. All the neutralisers, however, favoured accumula-
tion of N-NO3
–in soil, whether under oats or yellow lupine, with compost producing the
weakest effect. In contrast, the application of bentonite or calcium oxide raised
three-fold the content of ammonia nitrogen. This dependence has been confirmed in
another study by Wyszkowski and Ziolkowska [17], in which introduction of neutral-
ising substances caused a 2.5-fold increase in the content of nitrate nitrogen in soils
polluted with petroleum substances.
When comparing percentages of ammonia and nitrate nitrogen in total nitrogen
(Figs. 2 and 3), it is possible to observe that they depend on a crop species and soil
Effect of Compost, Bentonite, Zeolite and Calcium Oxide on Mineral Nitrogen Content... 1053
81
19
83
17
16
84
44
56
63
37
50
50
26
74
17
83
10
90 90
Oats ( L.)Avena sativa
Yellow lupine ( L.)Lupinus luteus
N-NH4
+N-NO3
–
100
100
80
80
60
60
40
40
20
20
0
0
Without
additions
Without
additions
Compost
Compost
Betonite
Betonite
Zeolite
Zeolite
Calcium
oxide
Calcium
oxide
10
[%]
[%]
Fig. 3. Effect of compost, bentonite, zeolite and calcium oxide on proportion between N-NH4
+and N-NO3
–
in soil mineral nitrogen after plants harvest (average for series) [%]
amending substances. It is very important to know the percentage of nitrate nitrogen in
total mineral nitrogen present in soil as it is N-NO3
–that functions as the main source of
nitrogen available to plants. In unamended soil, ammonia nitrogen was on average
four-fold more abundant but in soil under lupine the ratio between both forms of
nitrogen was approximately 50/50. These observations seem to be verified by a study
reported by Rudnicki and Galezewski [19]. Oats seriously depleted the soil supply of
nitrogen, although the crop took up nitrate more readily than ammonia nitrogen forms.
It should be added that under the influence of nickel contamination, the ratio of
ammonia nitrogen in soil under oats tended to rise (Fig. 2). Reverse relationships
occurred in soil under lupine polluted with 200 and 300 mg Ni � kg–1
. Adding compost
to soil which was then sown with oats did not modify these values, but when yellow
lupine was grown the share of nitrate nitrogen increased (Fig. 3). The application of
bentonite to soil under both oats and yellow lupine, under nearly identical conditions,
increased the percentage of N-NO3
–while depressing that of N-NH4
+relative to
unamended soil (N-NH4
+fell from 81 or 50 % to 16 and 17 %, respectively) The effect
of zeolite and calcium oxide to soil under yellow lupine was similar, increasing the
share of N-NO3
–to 90 % of total mineral nitrogen in soil, at the expense of N-NH4
+.
When zeolite and calcium oxide were added to soil under oats the ammonia nitrogen
decreased relative to unamended soil, particularly when zeolite was added to soil,
although the overall range of modifications was smaller than in soil under oats. Pecio et
al [9] reported that in their experiment the nitrate of nitrogen constituted around 65 % of
the total mineral nitrogen content in the profile of soil which was amended with
farmyard manure under corn and around 80 % in objects without FYM in dry years. In
the present experiment, the share of nitrate nitrogen under the effect of compost reached
17 % when oats was grown and 74 % under yellow lupine.
Conclusions
1. In the series of trials without substances alleviating nickel contamination, the
metal pollution depressed the share and content of N-NO3
–in mineral nitrogen in soil
under oats, but raised its concentration and percentage in soil under yellow lupine. The
effect of nickel was much stronger in soil under yellow lupine than under oats. Nickel
had an adverse effect on the content of N-NH4
+in soil under yellow lupine.
2. Application of bentonite, zeolite and calcium oxide limited the content of
ammonia nitrogen in soil, as compared with the average concentration from the
unamended series. Bentonite had the strongest effect on the content of N-NH4
+in soil
under oats, while in soil under yellow lupine zeolite and calcium oxide were the most
effective.
3. The neutralising substances added to soil had a contrary influence on the content
of nitrate nitrogen when compared with that produced on ammonia nitrogen. They all
favoured increased concentration of this form of nitrogen in soil. The strongest effect on
the average content of N-NO3
–was produced by bentonite.
4. Bentonite, zeolite and calcium oxide resulted in increased ratios of nitrate nitrogen
in total mineral nitrogen in soil, with bentonite producing a stronger effect in soil under
1054 Miros³aw Wyszkowski et al
oats while zeolite and calcium oxide being more effective in soil under yellow lupine.
Zeolite and calcium oxide had a stronger effect on the ratio of N-NO3
–in soil under
yellow lupine than in soil under oats. Compost produced similar results, but only in soil
under yellow lupine.
References
[1] Tkaczyk P. and Bednarek W.: Zesz. Probl. Post. Nauk Roln. 2006, 513, 485–491.
[2] Szczepaniak W. and Musolf R.: Agrotechnika 2005, 10, 4–8.
[3] Micha³ojæ Z.M.: Zesz. Probl. Post. Nauk Roln. 2006, 513, 277–283.
[4] Orzechowski M.: Zesz. Probl. Post. Nauk Roln. 2006, 513, 285–292.
[5] Sosulski T., Mercik S. and Szara E.: Ann. UMSC., Sec. E 2004, 59(2), 589–597.
[6] Mercik S., £abêtowicz J., Sosulski T. and Stêpieñ W.: Nawozy Nawo¿. 2002, IV, 1(10), 228–237.
[7] Sosulski T. and £abêtowicz J.: Zesz. Probl. Post. Nauk Roln. 2006, 513, 423–432.
[8] Jasiewicz Cz., Antonowicz J. and Baran A.: Zesz. Probl. Post. Nauk Roln. 2006, 513, 149–159.
[9] Pecio A., Rutkowska A. and Leszczyñska D.: Fragm. Agronom. 2005, 1(85), 214–224.
[10] Rumpel J.: Zesz. Probl. Post. Nauk Roln. 1998, 461, 47–66.
[11] Panak H. (ed.): Przewodnik metodyczny do æwiczeñ z chemii rolnej. Wyd. ART., Olsztyn 1997, 242 pp.
[12] StatSoft, Inc.: STATISTICA (data analysis software system), version 8.0. www.statsoft.com, 2007.
[13] Filipek-Mazur B. and Gondek K.: Zesz. Probl. Post. Nauk Roln. 2006, 512, 111–120.
[14] Wyszomirski P. and Lewicka E.: Gospod. Surowcami Mineral. 2005, 21(3), 5–19.
[15] Wyszkowska J., Kucharski J. and Boros E.: Polish J. Natur. Sci. 2006, 20(1), 111–120.
[16] Wyszkowska J., Boros E. and Kucharski J.: Polish J. Natur. Sci. 2007, 22(3), 382–394.
[17] Wyszkowski M. and Zió³kowska A.: Zesz. Probl. Post. Nauk Roln. 2006, 513, 563–573.
[18] Wyszkowski M. and Zió³kowska A.: Ochr. Œrodow. Zasob. Natural. 2007, 31, 154–159.
[19] Rudnicki F. and Ga³êzewski L.: Rocz. Akad. Roln. Poznañ, Roln. 2006, 66, 323–329.
WP£YW KOMPOSTU, BENTONITU, ZEOLITU I TLENKU WAPNIA
NA ZAWARTOή AZOTU MINERALNEGO W GLEBIE ZANIECZYSZCZONEJ NIKLEM
Katedra Chemii Œrodowiska
Uniwersytet Warmiñsko-Mazurski w Olsztynie
Abstrakt: Celem badañ by³o okreœlenie oddzia³ywania kompostu, bentonitu, zeolitu i tlenku wapnia na
zawartoœæ azotu mineralnego w glebie zanieczyszczonej niklem (0, 100, 200 i 300 mg Ni � kg–1
gleby).
Zawartoœæ azotu mineralnego w glebie by³a uzale¿niona od zanieczyszczenia gleby niklem, dodatku
substancji ³agodz¹cych i gatunku roœliny. Wp³yw niklu na zawartoœæ azotu mineralnego w glebie by³ œciœle
zwi¹zany z gatunkiem roœlin. W serii bez dodatków ³agodz¹cych zanieczyszczenie gleby niklem wywo³a³o
zmniejszenie zawartoœci i udzia³u N-NO3
–w azocie mineralnym gleby spod owsa oraz zwiêkszenie jego
zawartoœci i udzia³u w glebie spod ³ubinu ¿ó³tego. Wp³yw w glebie spod ³ubinu ¿ó³tego by³ znacznie wiêkszy
ni¿ w glebie spod owsa. Nikiel oddzia³ywa³ negatywnie na zawartoœæ N-NH4
+w glebie spod ³ubinu ¿ó³tego.
Aplikacja bentonitu, zeolitu i tlenku wapnia do gleby ograniczy³a zawartoœæ azotu amonowego w glebie,
w porównaniu do œredniej z serii bez dodatków. Najsilniej na zawartoœæ N-NH4
+w glebie spod owsa dzia³a³
bentonit, a w glebie spod ³ubinu ¿ó³tego zeolit i tlenek wapnia. Zastosowane substancje mia³y odwrotny
wp³yw na zawartoœæ azotu azotanowego(V) ni¿ azotu amonowego w glebie. Sprzyja³y one zwiêkszeniu
zawartoœci tej formy azotu w glebie. Najwiêkszy wp³yw na œredni¹ zawartoœæ N-NO3
–mia³ bentonit. Bentonit,
zeolit i tlenek wapnia wywo³a³y zwiêkszenie udzia³u azotu azotanowego w azocie mineralnym gleby, przy
czym bentonit dzia³a³ silniej w glebie spod owsa, a zeolit i tlenek wapnia w glebie spod ³ubinu ¿ó³tego. Zeolit
i tlenek wapnia mia³y wiêkszy wp³yw na udzia³ N-NO3
–w glebie spod ³ubinu ¿ó³tego ni¿ w glebie spod owsa.
Podobny wp³yw mia³ kompost, ale tylko w glebie spod ³ubinu ¿ó³tego.
S³owa kluczowe: zanieczyszczenie, nikiel, kompost, bentonit, zeolit, tlenek wapnia, gleba, azot mineralny
Effect of Compost, Bentonite, Zeolite and Calcium Oxide on Mineral Nitrogen Content... 1055

Miros³aw WYSZKOWSKI1
and Agnieszka ZIÓ£KOWSKA
RELATIONSHIPS BETWEEN PETROL
AND DIESEL OIL CONTAMINATION
VERSUS MINERAL NITROGEN CONTENT
IN SOIL FOLLOWING APPLICATION
OF COMPOST, BENTONITE AND CALCIUM OXIDE
RELACJE MIÊDZY ZANIECZYSZCZENIEM BENZYN¥
I OLEJEM NAPÊDOWYM A ZAWARTOŒCI¥ AZOTU MINERALNEGO
W GLEBIE PO APLIKACJI KOMPOSTU,
BENTONITU I TLENKU WAPNIA
Abstarct: A study has been conducted to identify the effect of soil pollution with petrol and diesel oil on the
content of N-NH4
+and N-NO3
–in soil treated with compost, bentonite and CaO as the substances neutralising
the influence of petroleum substances. Soil pollution with petroleum substances as well as introduction of
substances neutralising the effect of petrol and diesel strongly modified the content of ammonia and nitrate
nitrogen in soil after crop harvest. The effect of petroleum substances on soil properties was dependent on the
rate of pollutants. In a series without neutralising substances, petrol or diesel oil pollution up to the rate of 2.5
or 5 cm3
� kg–1
of soil, in contrast to the highest rate (10 cm3
� kg–1
), caused a very high and significant
increase in the content of ammonia nitrogen in the analysed soil. Petroleum substances raised the ratio of
ammonia nitrogen in soil to the detriment of the level of N-NO3
–compared with the variant free from
contamination. Bentonite and calcium oxide produced an evidently stronger effect on soil properties than
compost, typically increasing the concentration of N-NO3
–; in addition, they contributed to a decline in the
content of N-NH4
+; CaO produced such effect in the series polluted with petrol while compost and bentonite
were effective in objects contaminated with diesel oil. Bentonite and CaO caused a significant decrease in the
ratio of N-NH4
+or a decrease in the ratio of N-NH4
+in soil in the objects polluted with petrol and diesel oil as
compared with the series without such neutralising substances. Compost produced a similar effect in pots
polluted with diesel oil.
Keywords: petrol, diesel oil, soil, compost, bentonite, CaO, N-NH4
+, N-NO3
–
The issues related to environmental pollution caused by nitrogen compounds have
become very important in many countries around the world, in Europe and in Poland. It
seems that nitrogen entering aqueous environment (particularly closed water bodies)
E C O L O G I C A L C H E M I S T R Y A N D E N G I N E E R I N G A
Vol. 16, No. 8 2009
1Department of Environmental Chemistry, University of Warmia and Mazury, pl. £ódzki 4, 10–727
Olsztyn, Poland, phone 89 523 35 66; email: [email protected]
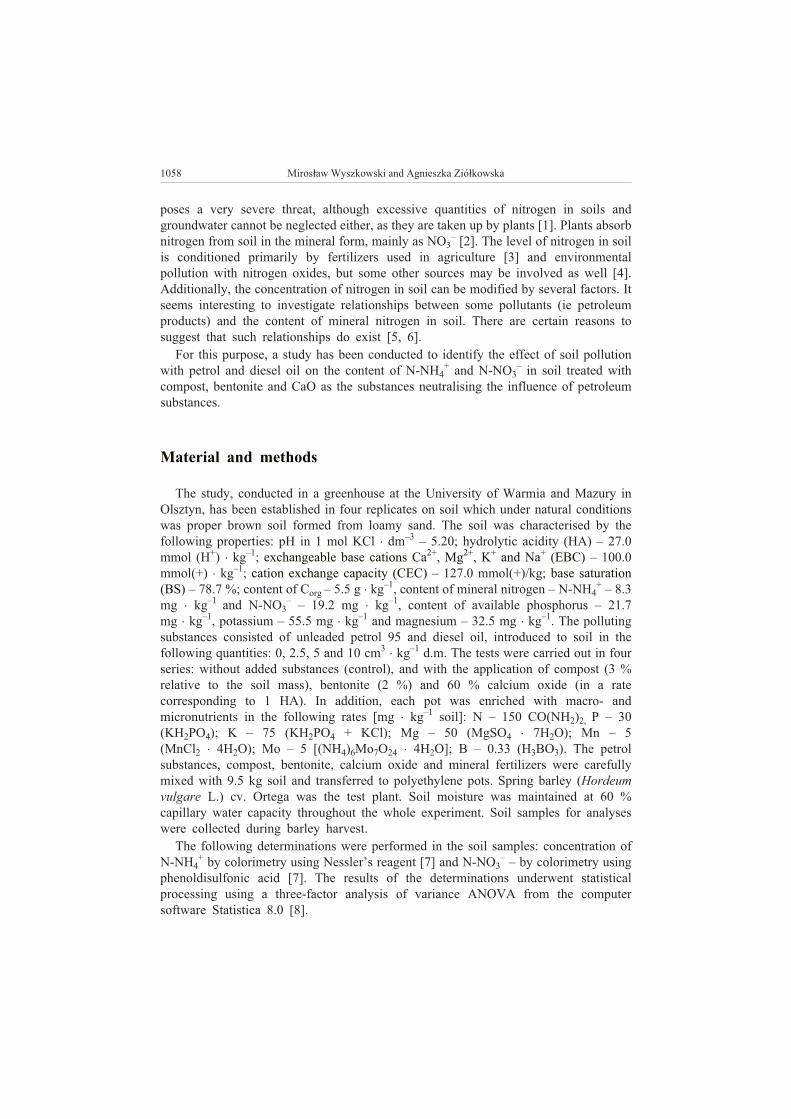
poses a very severe threat, although excessive quantities of nitrogen in soils and
groundwater cannot be neglected either, as they are taken up by plants [1]. Plants absorb
nitrogen from soil in the mineral form, mainly as NO3
–[2]. The level of nitrogen in soil
is conditioned primarily by fertilizers used in agriculture [3] and environmental
pollution with nitrogen oxides, but some other sources may be involved as well [4].
Additionally, the concentration of nitrogen in soil can be modified by several factors. It
seems interesting to investigate relationships between some pollutants (ie petroleum
products) and the content of mineral nitrogen in soil. There are certain reasons to
suggest that such relationships do exist [5, 6].
For this purpose, a study has been conducted to identify the effect of soil pollution
with petrol and diesel oil on the content of N-NH4
+and N-NO3
–in soil treated with
compost, bentonite and CaO as the substances neutralising the influence of petroleum
substances.
Material and methods
The study, conducted in a greenhouse at the University of Warmia and Mazury in
Olsztyn, has been established in four replicates on soil which under natural conditions
was proper brown soil formed from loamy sand. The soil was characterised by the
following properties: pH in 1 mol KCl � dm–3
– 5.20; hydrolytic acidity (HA) – 27.0
mmol (H+) � kg
–1; exchangeable base cations Ca
2+, Mg
2+, K
+and Na
+(EBC) – 100.0
mmol(+) � kg–1
; cation exchange capacity (CEC) – 127.0 mmol(+)/kg; base saturation
(BS) – 78.7 %; content of Corg – 5.5 g � kg–1
, content of mineral nitrogen – N-NH4
+– 8.3
mg � kg–1
and N-NO3
–– 19.2 mg � kg
–1, content of available phosphorus – 21.7
mg � kg–1
, potassium – 55.5 mg � kg–1
and magnesium – 32.5 mg � kg–1
. The polluting
substances consisted of unleaded petrol 95 and diesel oil, introduced to soil in the
following quantities: 0, 2.5, 5 and 10 cm3
� kg–1
d.m. The tests were carried out in four
series: without added substances (control), and with the application of compost (3 %
relative to the soil mass), bentonite (2 %) and 60 % calcium oxide (in a rate
corresponding to 1 HA). In addition, each pot was enriched with macro- and
micronutrients in the following rates [mg � kg–1
soil]: N – 150 CO(NH2)2, P – 30
(KH2PO4); K – 75 (KH2PO4 + KCl); Mg – 50 (MgSO4 � 7H2O); Mn – 5
(MnCl2 � 4H2O); Mo – 5 [(NH4)6Mo7O24 � 4H2O]; B – 0.33 (H3BO3). The petrol
substances, compost, bentonite, calcium oxide and mineral fertilizers were carefully
mixed with 9.5 kg soil and transferred to polyethylene pots. Spring barley (Hordeum
vulgare L.) cv. Ortega was the test plant. Soil moisture was maintained at 60 %
capillary water capacity throughout the whole experiment. Soil samples for analyses
were collected during barley harvest.
The following determinations were performed in the soil samples: concentration of
N-NH4
+by colorimetry using Nessler’s reagent [7] and N-NO3
–– by colorimetry using
phenoldisulfonic acid [7]. The results of the determinations underwent statistical
processing using a three-factor analysis of variance ANOVA from the computer
software Statistica 8.0 [8].
1058 Miros³aw Wyszkowski and Agnieszka Zió³kowska
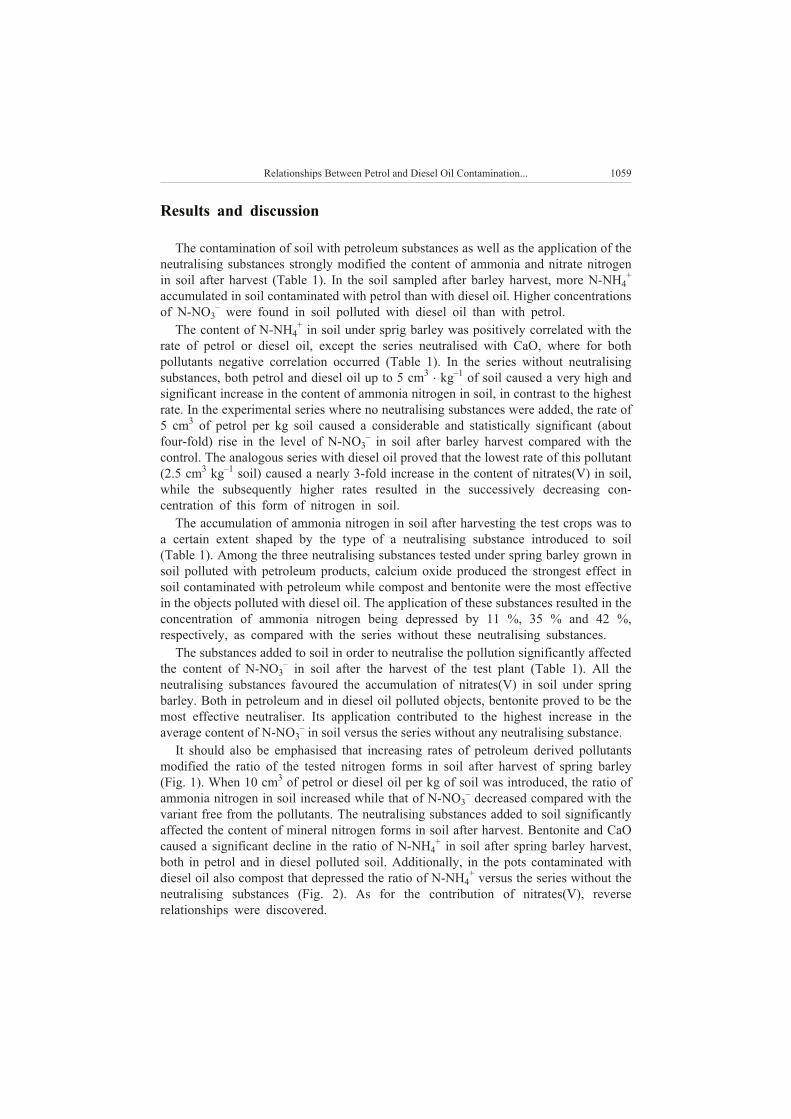
Results and discussion
The contamination of soil with petroleum substances as well as the application of the
neutralising substances strongly modified the content of ammonia and nitrate nitrogen
in soil after harvest (Table 1). In the soil sampled after barley harvest, more N-NH4
+
accumulated in soil contaminated with petrol than with diesel oil. Higher concentrations
of N-NO3
–were found in soil polluted with diesel oil than with petrol.
The content of N-NH4
+in soil under sprig barley was positively correlated with the
rate of petrol or diesel oil, except the series neutralised with CaO, where for both
pollutants negative correlation occurred (Table 1). In the series without neutralising
substances, both petrol and diesel oil up to 5 cm3
� kg–1
of soil caused a very high and
significant increase in the content of ammonia nitrogen in soil, in contrast to the highest
rate. In the experimental series where no neutralising substances were added, the rate of
5 cm3
of petrol per kg soil caused a considerable and statistically significant (about
four-fold) rise in the level of N-NO3
–in soil after barley harvest compared with the
control. The analogous series with diesel oil proved that the lowest rate of this pollutant
(2.5 cm3
kg–1
soil) caused a nearly 3-fold increase in the content of nitrates(V) in soil,
while the subsequently higher rates resulted in the successively decreasing con-
centration of this form of nitrogen in soil.
The accumulation of ammonia nitrogen in soil after harvesting the test crops was to
a certain extent shaped by the type of a neutralising substance introduced to soil
(Table 1). Among the three neutralising substances tested under spring barley grown in
soil polluted with petroleum products, calcium oxide produced the strongest effect in
soil contaminated with petroleum while compost and bentonite were the most effective
in the objects polluted with diesel oil. The application of these substances resulted in the
concentration of ammonia nitrogen being depressed by 11 %, 35 % and 42 %,
respectively, as compared with the series without these neutralising substances.
The substances added to soil in order to neutralise the pollution significantly affected
the content of N-NO3
–in soil after the harvest of the test plant (Table 1). All the
neutralising substances favoured the accumulation of nitrates(V) in soil under spring
barley. Both in petroleum and in diesel oil polluted objects, bentonite proved to be the
most effective neutraliser. Its application contributed to the highest increase in the
average content of N-NO3
–in soil versus the series without any neutralising substance.
It should also be emphasised that increasing rates of petroleum derived pollutants
modified the ratio of the tested nitrogen forms in soil after harvest of spring barley
(Fig. 1). When 10 cm3
of petrol or diesel oil per kg of soil was introduced, the ratio of
ammonia nitrogen in soil increased while that of N-NO3
–decreased compared with the
variant free from the pollutants. The neutralising substances added to soil significantly
affected the content of mineral nitrogen forms in soil after harvest. Bentonite and CaO
caused a significant decline in the ratio of N-NH4
+in soil after spring barley harvest,
both in petrol and in diesel polluted soil. Additionally, in the pots contaminated with
diesel oil also compost that depressed the ratio of N-NH4
+versus the series without the
neutralising substances (Fig. 2). As for the contribution of nitrates(V), reverse
relationships were discovered.
Relationships Between Petrol and Diesel Oil Contamination... 1059
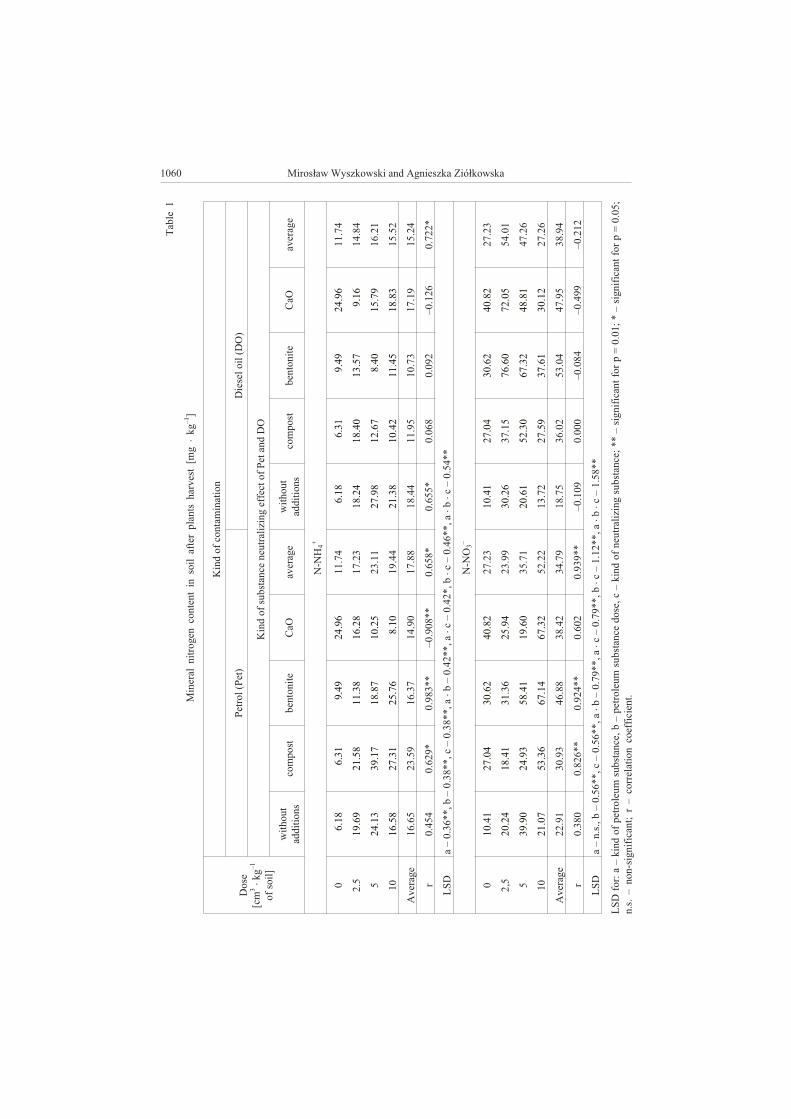
1060 Miros³aw Wyszkowski and Agnieszka Zió³kowskaT
able
1
Min
eral
nit
rogen
conte
nt
insoil
afte
rpla
nts
harvest
[m
g�
kg
–1]
Dose
[cm
3�kg
–1
of
soil
]
Kin
dof
conta
min
ati
on
Petr
ol
(P
et)
Die
sel
oil
(D
O)
Kin
dof
substa
nce
neutr
ali
zin
geffect
of
Pet
and
DO
wit
hout
addit
ions
com
post
bento
nit
eC
aO
average
wit
hout
addit
ions
com
post
bento
nit
eC
aO
average
N-N
H4
+
06.1
86.3
19.4
924.9
611.7
46.1
86.3
19.4
924.9
611.7
4
2.5
19.6
921.5
811.3
816.2
817.2
318.2
418.4
013.5
79.1
614.8
4
524.1
339.1
718.8
710.2
523.1
127.9
812.6
78.4
015.7
916.2
1
10
16.5
827.3
125.7
68.1
019.4
421.3
810.4
211.4
518.8
315.5
2
Average
16.6
523.5
916.3
714.9
017.8
818.4
411.9
510.7
317.1
915.2
4
r0.4
54
0.6
29*
0.9
83**
–0.9
08**
0.6
58*
0.6
55*
0.0
68
0.0
92
–0.1
26
0.7
22*
LS
Da
–0.3
6**,b
–0.3
8**,c
–0.3
8**,a
�b
–0.4
2**,a
�c
–0.4
2*,b
�c
–0.4
6**,a
�b
�c
–0.5
4**
N-N
O3
–
010.4
127.0
430.6
240.8
227.2
310.4
127.0
430.6
240.8
227.2
3
2,5
20.2
418.4
131.3
625.9
423.9
930.2
637.1
576.6
072.0
554.0
1
539.9
024.9
358.4
119.6
035.7
120.6
152.3
067.3
248.8
147.2
6
10
21.0
753.3
667.1
467.3
252.2
213.7
227.5
937.6
130.1
227.2
6
Average
22.9
130.9
346.8
838.4
234.7
918.7
536.0
253.0
447.9
538.9
4
r0.3
80
0.8
26**
0.9
24**
0.6
02
0.9
39**
–0.1
09
0.0
00
–0.0
84
–0.4
99
–0.2
12
LS
Da
–n.s
.,b
–0.5
6**,c
–0.5
6**,a
�b
–0.7
9**,a
�c
–0.7
9**,b
�c
–1.1
2**,
a�b
�c
–1.5
8**
LS
Dfor:
a–
kin
dof
petr
ole
um
substa
nce,
b–
petr
ole
um
substa
nce
dose,
c–
kin
dof
neutr
ali
zin
gsubsta
nce;
**
–sig
nif
icant
for
p=
0.0
1;
*–
sig
nif
icant
for
p=
0.0
5;
n.s
.–
non-sig
nif
icant;
r–
correla
tion
coeffic
ient.
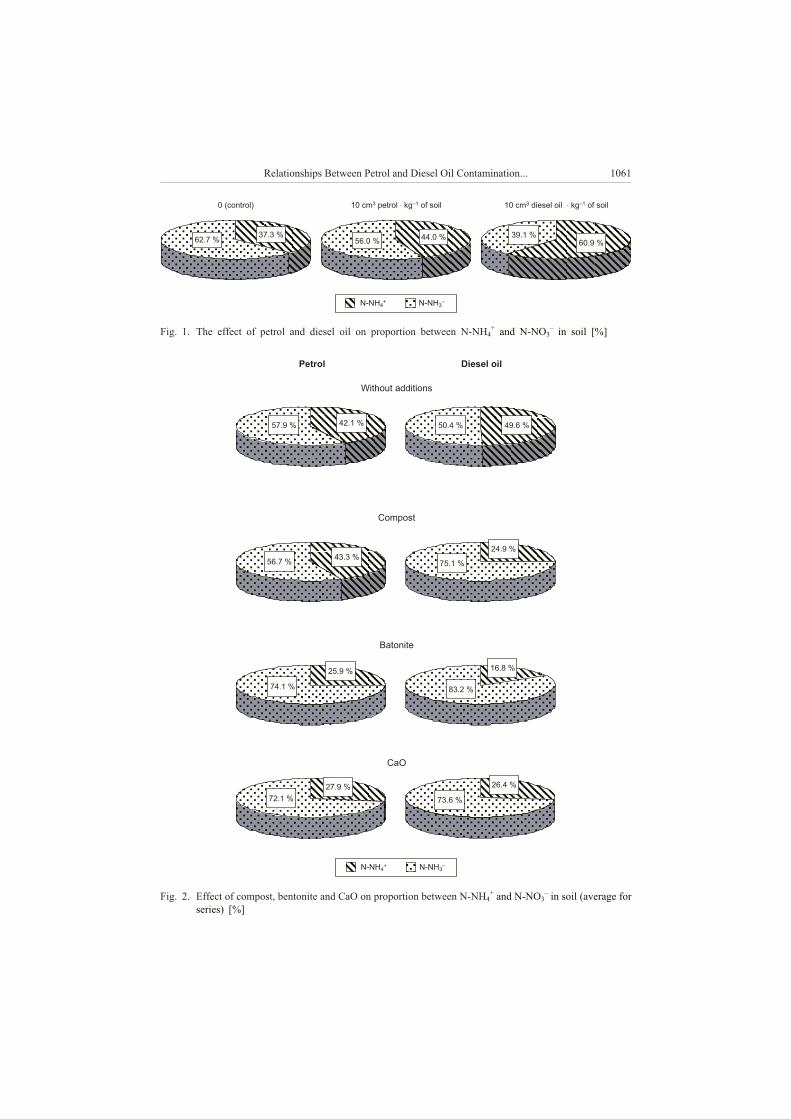
Relationships Between Petrol and Diesel Oil Contamination... 1061
62.7 %37.3 %
56.0 %44.0 % 39.1 %
60.9 %
0 (control) 10 cm petrol kg of soil3 –1� 10 cm diesel oil kg of soil3 –1
�
N-NH4+ N-NH3
–
Fig. 1. The effect of petrol and diesel oil on proportion between N-NH4
+and N-NO3
–in soil [%]
N-NH4+ N-NH3
–
57.9 % 42.1 % 50.4 % 49.6 %
56.7 %43.3 %
75.1 %
24.9 %
74.1 %
25.9 %
83.2 %
16.8 %
72.1 %
27.9 %
73.6 %
26.4 %
Petrol Diesel oil
Without additions
Compost
Batonite
CaO
Fig. 2. Effect of compost, bentonite and CaO on proportion between N-NH4
+and N-NO3
–in soil (average for
series) [%]
Nitrogen plays an important role in degradation of hydrocarbons in soil. Particularly
important influence on the rate of degradation is produced by ammonia nitrogen [9]. As
a result, its concentration in polluted soils may be depressed, which has been confirmed
in the authors’ own research when the highest level of contamination with petroleum
substances was examined. Positive correlation between the degree of soil pollution with
diesel oil and the concentration of N-NH4
+and N-NO3
–in soil has also been indicated
by Dimitrov and Markov [10]. Such observations are in accord with the effect produced
by lower rates of the petroleum pollutants observed in the authors’ own study. Similar
results were obtained our earlier experiments [5, 6]. In contrast, Rivera-Espinoza and
Dendooven [11] demonstrated that diesel oil did not have significant influence on the
content of mineral nitrogen forms in soil, but these two researchers tested very low rates
of pollution (4 g C � kg–1
soil). Initially, they were even able to observe a slight increase
in the content of N-NO3
–in soil, although later its level was similar to that determined
in unpolluted objects and after 100 days from the establishment of the experiment both
forms of nitrogen (and N-NO3
–particularly) increased significantly. Obire and
Nwaubeta [12] found out that the total nitrogen concentration fell in soil polluted with
petroleum-derived substances, although the latter had no effect on the concentrations of
ammonia and nitrate nitrogen. Deni and Pennickx [13] proved that by introducing
hydrocarbons in the amount of 4 g C � kg–1
soil it was possible to stimulate nitrogen
immobilization. Petroleum substances inhibit processes of nitrification [14, 15],
especially when leaded or unleaded petrol is nitrified [15] and can limit ammonification
[15].
Application of different substances to soil affects soil properties that have been
modified by petroleum or diesel oil. Organic substance, which increases sorption of
petroleum substances while simultaneously limiting their effect on the biological life of
soil [16] and nitrogen metabolism in soil, is of special importance in this respect. In the
previous studies by Wyszkowski and Zió³kowska [5, 6], bentonite, calcium oxide and
partly compost caused a significant decrease in the content of N-NH4
+in soil, especially
in objects polluted with diesel oil. Bentonite, calcium oxide and compost created
favourable conditions for accumulation of N-NO3
–in petrol polluted soil whereas
bentonite and calcium oxide produced similar effects in pots contaminated with diesel
oil. Introduction of petroleum-based substances as well as substances neutralising the
pollution caused an increase in the ratio of N-NO3
–to N-mineral.
Conclusions
1. Soil pollution with petroleum substances as well as introduction of substances
neutralising the effect of petrol and diesel strongly modified the content of ammonia
and nitrate nitrogen in soil after crop harvest.
2. The effect of petroleum substances on soil properties was dependent on the rate of
pollutants. In a series without neutralising substances, petrol or diesel oil pollution up to
the rate of 2.5 or 5 cm3
� kg–1
of soil, in contrast to the highest rate (10 cm3
� kg–1
),
caused a very high and significant increase in the content of ammonia nitrogen in the
analysed soil.
1062 Miros³aw Wyszkowski and Agnieszka Zió³kowska
3. Petroleum substances raised the ratio of ammonia nitrogen in soil to the detriment
of the level of N-NO3
–compared with the variant free from contamination.
4. Bentonite and calcium oxide produced an evidently stronger effect on soil
properties than compost, typically increasing the concentration of N-NO3
–; in addition,
they contributed to a decline in the content of N-NH4
+; CaO produced such effect in the
series polluted with petrol while compost and bentonite were effective in objects
contaminated with diesel oil.
5. Bentonite and CaO caused a significant decrease in the ratio of N-NH4
+or
a decrease in the ratio of N-NH4
+in soil in the objects polluted with petrol and diesel oil
as compared with the series without such neutralising substances. Compost produced
a similar effect in pots polluted with diesel oil.
Acknowledgements
The study has been performed as part of own research funded by the Polish Ministry of Science and
Higher Education No. 2P06S01628.
References
[1] Pecio A., Rutkowska A. and Leszczyñska D.: Fragm. Agron. 2005, XXII, 1(85), 214–225.
[2] Micha³ojæ Z.M.: Zesz. Probl. Post. Nauk Roln. 2006, 513, 277–283.
[3] £abêtowicz J. and Rutkowska B.: Zesz. Probl. Post. Nauk Roln. 1996, 440, 223–229.
[4] Czeka³a J.: Zesz. Probl. Post. Nauk Roln. 2003, 493, 585–590.
[5] Wyszkowski M. and Zió³kowska A.: Zesz. Probl. Post. Nauk Roln. 2006, 513, 563–573.
[6] Wyszkowski M. and Zió³kowska A.: Ochr. Œrodow. Zasob. Natural. 2007, 31, 154–159.
[7] Panak H. (ed.): Przewodnik metodyczny do æwiczeñ z chemii rolnej. Wyd. ART., Olsztyn 1997, 242 pp.
[8] StatSoft, Inc.: STATISTICA (data analysis software system), version 8.0. www.statsoft.com, 2007.
[9] Brook T.R., Stiver W.H. and Zytner R.G.: Soil Sediment Contam. 2001, 10(5), 539–553.
[10] Dimitrov D.N. and Markov E.: Pochvoznanie, Agrokhimiya, Ekologiya 2000, 35(3), 3–8.
[11] Rivera-Espinoza Y. and Dendooven L.: Chemosphere 2004, 54(3), 379–386.
[12] Obire O. and Nwaubeta O.J.: Appl. Sci. Environ. Manage. 2002, 6(1), 39–44.
[13] Deni J. and Penninckx M.J.: Appl. Environ. Microbiol. 1999, 65, 4008–4013.
[14] Amadi A., Abbey S.D. and Nma A.: Water, Air, Soil, Pollut. 1996, 86, 1–11.
[15] Kucharski J., Jastrzêbska E. and Wyszkowska J.: Acta Agrar. et Silv., Ser. Agraria 2004, XLII,
249–255.
[16] Ma³achowska-Jutsz A., Mrozowska J., Kozielska M. and Miksch K.: Biotechnologia 1997, 1(36), 79–91.
RELACJE MIÊDZY ZANIECZYSZCZENIEM BENZYN¥ I OLEJEM NAPÊDOWYM
A ZAWARTOŒCI¥ AZOTU MINERALNEGO W GLEBIE
PO APLIKACJI KOMPOSTU, BENTONITU I TLENKU WAPNIA
Katedra Chemii Œrodowiska
Uniwersytet Warmiñsko-Mazurski w Olsztynie
Abstrakt: Celem badañ by³o okreœlenie oddzia³ywania zanieczyszczenia gleby benzyn¹ i olejem napêdowym
na zawartoϾ N-NH4
+i N-NO3
–w glebie w warunkach zastosowania kompostu, bentonitu i CaO, jako
substancji ³agodz¹cych wp³yw substancji ropopochodnych. Zanieczyszczenie gleby substancjami ropopo-
chodnymi oraz zastosowanie dodatków ³agodz¹cych wp³yw benzyny i oleju napêdowego silnie modyfikowa³o
zawartoœæ azotu amonowego i azotanowego w glebie po zbiorze roœlin Oddzia³ywanie substancji ropopo-
chodnych na w³aœciwoœci gleby zale¿a³o od ich dawki. W serii bez dodatków ³agodz¹cych, zanieczyszczenie
Relationships Between Petrol and Diesel Oil Contamination... 1063
benzyn¹ i olejem napêdowym do dawki 2,5 lub 5 cm3
� kg–1
gleby, w odró¿nieniu od dawki najwiêkszej
(10 cm3
� kg–1
) powodowa³o bardzo du¿y i znacz¹cy wzrost zawartoœci azotu amonowego w badanej glebie.
Najwiêksza dawka substancji ropopochodnych dzia³a³a zdecydowanie ujemnie. Substancje ropopochodne
zwiêkszy³y udzia³ azotu amonowego w glebie, kosztem N-NO3
–, w porównaniu do wariantu bez zanie-
czyszczeñ. Bentonit i tlenek wapnia zdecydowanie silniej wp³ywa³y na w³aœciwoœci gleby ni¿ kompost,
powoduj¹c na ogó³ wzrost zawartoœci: N-NO3
–, przyczyni³y siê tak¿e do zmniejszenia zawartoœci N-NH4
+:
CaO – w serii z benzyn¹ oraz kompost i bentonit w obiektach zanieczyszczonych olejem napêdowym.
Bentonit i CaO wywo³a³y znaczne zmniejszenie udzia³u N-NH4
+oraz zmniejszenie udzia³u w N-NH4
+glebie
w obiektach z benzyn¹ i olejem napêdowym, w porównaniu do serii bez dodatków. W wazonach
zanieczyszczonych olejem napêdowym podobny wp³yw mia³ tak¿e kompost.
S³owa kluczowe: benzyna, olej napêdowy, gleba, kompost, bentonit, CaO, N-NH4
+, N-NO3
–
1064 Miros³aw Wyszkowski and Agnieszka Zió³kowska
Krystyna ZARZECKA1, Marek GUGA£A
1
and Iwona MYSTKOWSKA1
EFFECT OF AGRICULTURAL TREATMENTS
ON THE CONTENT OF TOTAL AND PROTEIN NITROGEN
IN POTATO TUBERS
WP£YW ZABIEGÓW AGROTECHNICZNYCH
NA ZAWARTOŒÆ AZOTU OGÓLNEGO I BIA£KOWEGO
W BULWACH ZIEMNIAKA
Abstract: The research was conducted in the years 2002–2004 in Agricultural Experimental Station Zawady.
The experiment was set on the soil of the rye very good complex in three replications. The aim of the present
paper was to determine the effect of soil tillage and weed control methods using herbicides on the content of
total nitrogen and protein nitrogen in the edible potato tubers. The weeding chemical agents used in the potato
treatment increased the total nitrogen content and protein nitrogen content in the tubers, as compared with the
control. The statistical analysis also revealed a significant effect of the soil tillage and meteorological
conditions over the experimental years on the parameters investigated.
Keywords: potato, herbicides, tillage systems, total nitrogen, protein nitrogen
Potato plays a very significant role in human diet. As a result, an impact of plant
protection agents, on potato quality characteristic in an important issue [1]. According
to many authors, the content of particular macroelements in potato tubers is determined
by cultivar properties [2–4], agrotechnical factors [5–8] and climatic conditions during
the potato growing period [9–11]. According to Mazurczyk [2] and Mazurczyk and Lis
[12], the content of total and protein nitrogen in tubers depends on less stabile
characteristics, tightly connected with climate conditions during the vegetation. When it
comes to the influence of herbicides on the quality of the crop, their opinion diverge [6,
7, 13]. That is why, the aim of the experiments was to define the influence of some
herbicides and their mixtures and soil tillage on the total and protein nitrogen in potato
tubers.
E C O L O G I C A L C H E M I S T R Y A N D E N G I N E E R I N G A
Vol. 16, No. 8 2009
1Department of Plant Cultivation, University of Podlasie, ul. B. Prusa 14, 08–110 Siedlce, Poland, phone
25 643 12 37, email: [email protected], [email protected], [email protected]
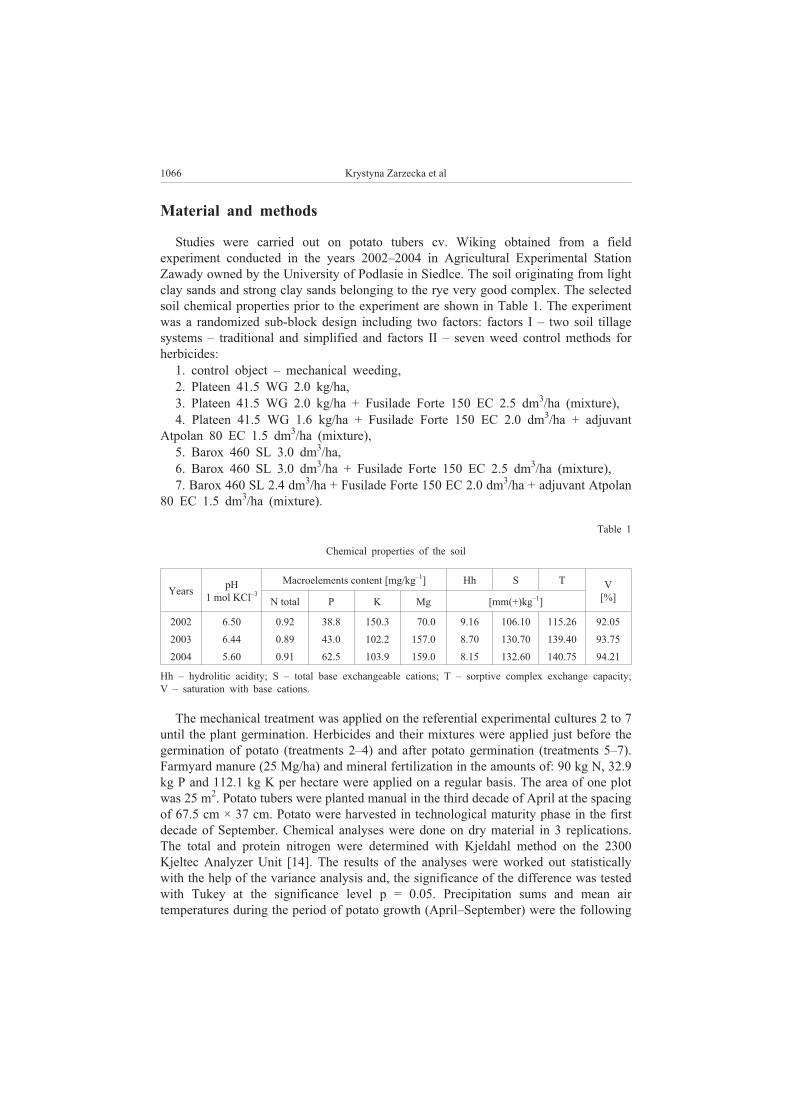
Material and methods
Studies were carried out on potato tubers cv. Wiking obtained from a field
experiment conducted in the years 2002–2004 in Agricultural Experimental Station
Zawady owned by the University of Podlasie in Siedlce. The soil originating from light
clay sands and strong clay sands belonging to the rye very good complex. The selected
soil chemical properties prior to the experiment are shown in Table 1. The experiment
was a randomized sub-block design including two factors: factors I – two soil tillage
systems – traditional and simplified and factors II – seven weed control methods for
herbicides:
1. control object – mechanical weeding,
2. Plateen 41.5 WG 2.0 kg/ha,
3. Plateen 41.5 WG 2.0 kg/ha + Fusilade Forte 150 EC 2.5 dm3/ha (mixture),
4. Plateen 41.5 WG 1.6 kg/ha + Fusilade Forte 150 EC 2.0 dm3/ha + adjuvant
Atpolan 80 EC 1.5 dm3/ha (mixture),
5. Barox 460 SL 3.0 dm3/ha,
6. Barox 460 SL 3.0 dm3/ha + Fusilade Forte 150 EC 2.5 dm
3/ha (mixture),
7. Barox 460 SL 2.4 dm3/ha + Fusilade Forte 150 EC 2.0 dm
3/ha + adjuvant Atpolan
80 EC 1.5 dm3/ha (mixture).
Table 1
Chemical properties of the soil
YearspH
1 mol KCl–3
Macroelements content [mg/kg–1
] Hh S TV
[%]N total P K Mg [mm(+)kg
–1]
2002 6.50 0.92 38.8 150.3 70.0 9.16 106.10 115.26 92.05
2003 6.44 0.89 43.0 102.2 157.0 8.70 130.70 139.40 93.75
2004 5.60 0.91 62.5 103.9 159.0 8.15 132.60 140.75 94.21
Hh – hydrolitic acidity; S – total base exchangeable cations; T – sorptive complex exchange capacity;
V – saturation with base cations.
The mechanical treatment was applied on the referential experimental cultures 2 to 7
until the plant germination. Herbicides and their mixtures were applied just before the
germination of potato (treatments 2–4) and after potato germination (treatments 5–7).
Farmyard manure (25 Mg/ha) and mineral fertilization in the amounts of: 90 kg N, 32.9
kg P and 112.1 kg K per hectare were applied on a regular basis. The area of one plot
was 25 m2. Potato tubers were planted manual in the third decade of April at the spacing
of 67.5 cm × 37 cm. Potato were harvested in technological maturity phase in the first
decade of September. Chemical analyses were done on dry material in 3 replications.
The total and protein nitrogen were determined with Kjeldahl method on the 2300
Kjeltec Analyzer Unit [14]. The results of the analyses were worked out statistically
with the help of the variance analysis and, the significance of the difference was tested
with Tukey at the significance level p = 0.05. Precipitation sums and mean air
temperatures during the period of potato growth (April–September) were the following
1066 Krystyna Zarzecka et al
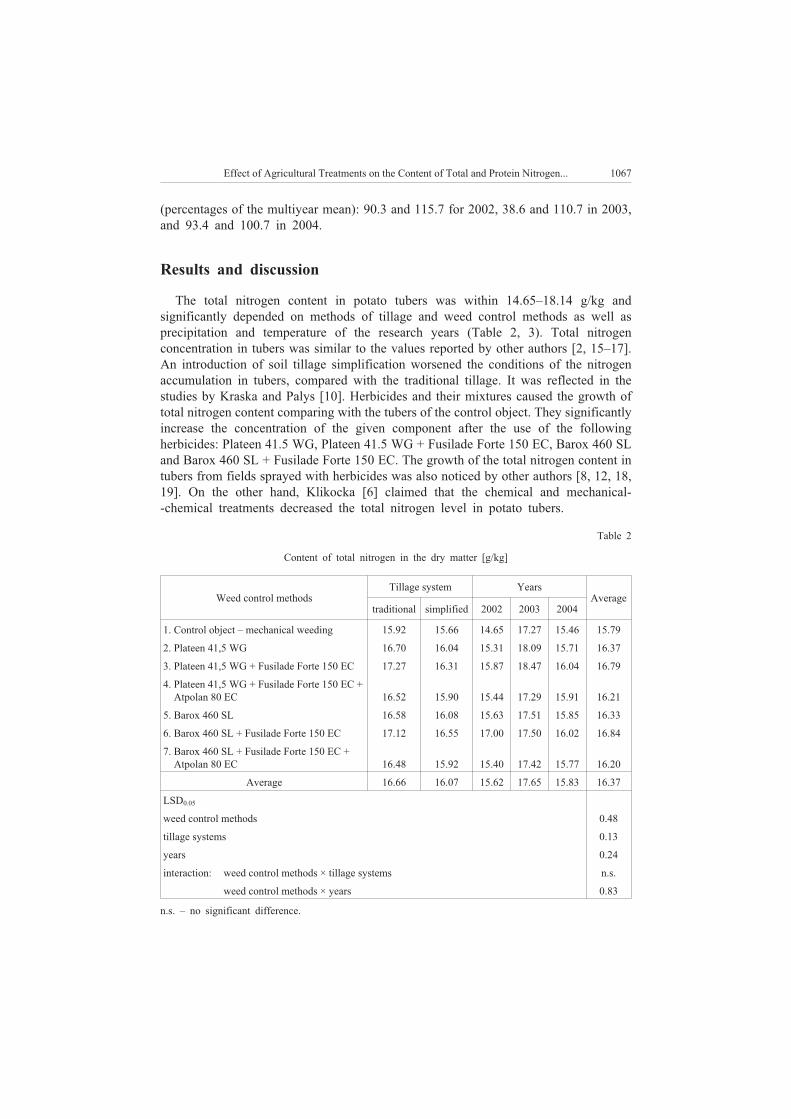
(percentages of the multiyear mean): 90.3 and 115.7 for 2002, 38.6 and 110.7 in 2003,
and 93.4 and 100.7 in 2004.
Results and discussion
The total nitrogen content in potato tubers was within 14.65–18.14 g/kg and
significantly depended on methods of tillage and weed control methods as well as
precipitation and temperature of the research years (Table 2, 3). Total nitrogen
concentration in tubers was similar to the values reported by other authors [2, 15–17].
An introduction of soil tillage simplification worsened the conditions of the nitrogen
accumulation in tubers, compared with the traditional tillage. It was reflected in the
studies by Kraska and Palys [10]. Herbicides and their mixtures caused the growth of
total nitrogen content comparing with the tubers of the control object. They significantly
increase the concentration of the given component after the use of the following
herbicides: Plateen 41.5 WG, Plateen 41.5 WG + Fusilade Forte 150 EC, Barox 460 SL
and Barox 460 SL + Fusilade Forte 150 EC. The growth of the total nitrogen content in
tubers from fields sprayed with herbicides was also noticed by other authors [8, 12, 18,
19]. On the other hand, Klikocka [6] claimed that the chemical and mechanical-
-chemical treatments decreased the total nitrogen level in potato tubers.
Table 2
Content of total nitrogen in the dry matter [g/kg]
Weed control methods
Tillage system Years
Average
traditional simplified 2002 2003 2004
1. Control object – mechanical weeding 15.92 15.66 14.65 17.27 15.46 15.79
2. Plateen 41,5 WG 16.70 16.04 15.31 18.09 15.71 16.37
3. Plateen 41,5 WG + Fusilade Forte 150 EC 17.27 16.31 15.87 18.47 16.04 16.79
4. Plateen 41,5 WG + Fusilade Forte 150 EC +
4. Atpolan 80 EC 16.52 15.90 15.44 17.29 15.91 16.21
5. Barox 460 SL 16.58 16.08 15.63 17.51 15.85 16.33
6. Barox 460 SL + Fusilade Forte 150 EC 17.12 16.55 17.00 17.50 16.02 16.84
7. Barox 460 SL + Fusilade Forte 150 EC +
7. Atpolan 80 EC 16.48 15.92 15.40 17.42 15.77 16.20
Average 16.66 16.07 15.62 17.65 15.83 16.37
LSD0.05
weed control methods 0.48
tillage systems 0.13
years 0.24
interaction: weed control methods × tillage systems n.s.
weed control methods × years 0.83
n.s. – no significant difference.
Effect of Agricultural Treatments on the Content of Total and Protein Nitrogen... 1067
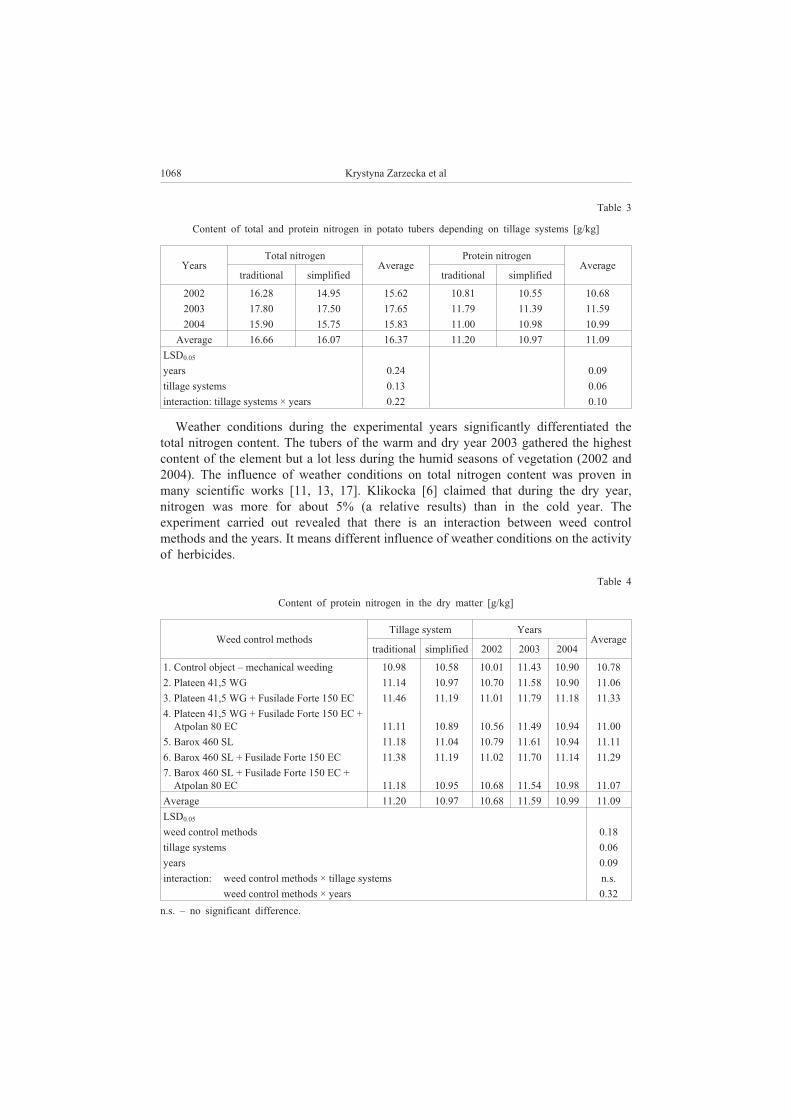
Table 3
Content of total and protein nitrogen in potato tubers depending on tillage systems [g/kg]
Years
Total nitrogen
Average
Protein nitrogen
Average
traditional simplified traditional simplified
2002 16.28 14.95 15.62 10.81 10.55 10.68
2003 17.80 17.50 17.65 11.79 11.39 11.59
2004 15.90 15.75 15.83 11.00 10.98 10.99
Average 16.66 16.07 16.37 11.20 10.97 11.09
LSD0.05
years 0.24 0.09
tillage systems 0.13 0.06
interaction: tillage systems × years 0.22 0.10
Weather conditions during the experimental years significantly differentiated the
total nitrogen content. The tubers of the warm and dry year 2003 gathered the highest
content of the element but a lot less during the humid seasons of vegetation (2002 and
2004). The influence of weather conditions on total nitrogen content was proven in
many scientific works [11, 13, 17]. Klikocka [6] claimed that during the dry year,
nitrogen was more for about 5% (a relative results) than in the cold year. The
experiment carried out revealed that there is an interaction between weed control
methods and the years. It means different influence of weather conditions on the activity
of herbicides.
Table 4
Content of protein nitrogen in the dry matter [g/kg]
Weed control methods
Tillage system Years
Average
traditional simplified 2002 2003 2004
1. Control object – mechanical weeding 10.98 10.58 10.01 11.43 10.90 10.78
2. Plateen 41,5 WG 11.14 10.97 10.70 11.58 10.90 11.06
3. Plateen 41,5 WG + Fusilade Forte 150 EC 11.46 11.19 11.01 11.79 11.18 11.33
4. Plateen 41,5 WG + Fusilade Forte 150 EC +
4. Atpolan 80 EC 11.11 10.89 10.56 11.49 10.94 11.00
5. Barox 460 SL 11.18 11.04 10.79 11.61 10.94 11.11
6. Barox 460 SL + Fusilade Forte 150 EC 11.38 11.19 11.02 11.70 11.14 11.29
7. Barox 460 SL + Fusilade Forte 150 EC +
7. Atpolan 80 EC 11.18 10.95 10.68 11.54 10.98 11.07
Average 11.20 10.97 10.68 11.59 10.99 11.09
LSD0.05
weed control methods 0.18
tillage systems 0.06
years 0.09
interaction: weed control methods × tillage systems n.s.
weed control methods × years 0.32
n.s. – no significant difference.
1068 Krystyna Zarzecka et al
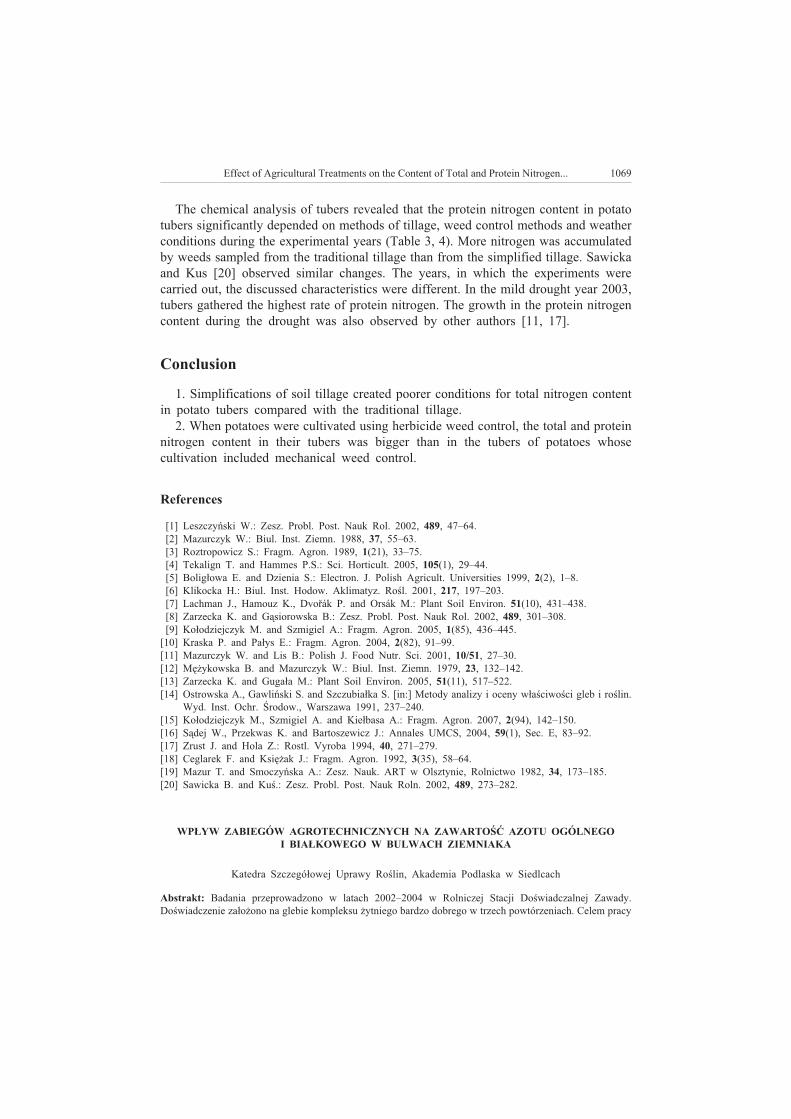
The chemical analysis of tubers revealed that the protein nitrogen content in potato
tubers significantly depended on methods of tillage, weed control methods and weather
conditions during the experimental years (Table 3, 4). More nitrogen was accumulated
by weeds sampled from the traditional tillage than from the simplified tillage. Sawicka
and Kus [20] observed similar changes. The years, in which the experiments were
carried out, the discussed characteristics were different. In the mild drought year 2003,
tubers gathered the highest rate of protein nitrogen. The growth in the protein nitrogen
content during the drought was also observed by other authors [11, 17].
Conclusion
1. Simplifications of soil tillage created poorer conditions for total nitrogen content
in potato tubers compared with the traditional tillage.
2. When potatoes were cultivated using herbicide weed control, the total and protein
nitrogen content in their tubers was bigger than in the tubers of potatoes whose
cultivation included mechanical weed control.
References
[1] Leszczyñski W.: Zesz. Probl. Post. Nauk Rol. 2002, 489, 47–64.
[2] Mazurczyk W.: Biul. Inst. Ziemn. 1988, 37, 55–63.
[3] Roztropowicz S.: Fragm. Agron. 1989, 1(21), 33–75.
[4] Tekalign T. and Hammes P.S.: Sci. Horticult. 2005, 105(1), 29–44.
[5] Bolig³owa E. and Dzienia S.: Electron. J. Polish Agricult. Universities 1999, 2(2), 1–8.
[6] Klikocka H.: Biul. Inst. Hodow. Aklimatyz. Roœl. 2001, 217, 197–203.
[7] Lachman J., Hamouz K., Dvoøák P. and Orsák M.: Plant Soil Environ. 51(10), 431–438.
[8] Zarzecka K. and G¹siorowska B.: Zesz. Probl. Post. Nauk Rol. 2002, 489, 301–308.
[9] Ko³odziejczyk M. and Szmigiel A.: Fragm. Agron. 2005, 1(85), 436–445.
[10] Kraska P. and Pa³ys E.: Fragm. Agron. 2004, 2(82), 91–99.
[11] Mazurczyk W. and Lis B.: Polish J. Food Nutr. Sci. 2001, 10/51, 27–30.
[12] Mê¿ykowska B. and Mazurczyk W.: Biul. Inst. Ziemn. 1979, 23, 132–142.
[13] Zarzecka K. and Guga³a M.: Plant Soil Environ. 2005, 51(11), 517–522.
[14] Ostrowska A., Gawliñski S. and Szczubia³ka S. [in:] Metody analizy i oceny w³aœciwoœci gleb i roœlin.
Wyd. Inst. Ochr. Œrodow., Warszawa 1991, 237–240.
[15] Ko³odziejczyk M., Szmigiel A. and Kie³basa A.: Fragm. Agron. 2007, 2(94), 142–150.
[16] S¹dej W., Przekwas K. and Bartoszewicz J.: Annales UMCS, 2004, 59(1), Sec. E, 83–92.
[17] Zrust J. and Hola Z.: Rostl. Vyroba 1994, 40, 271–279.
[18] Ceglarek F. and Ksiê¿ak J.: Fragm. Agron. 1992, 3(35), 58–64.
[19] Mazur T. and Smoczyñska A.: Zesz. Nauk. ART w Olsztynie, Rolnictwo 1982, 34, 173–185.
[20] Sawicka B. and Kuœ.: Zesz. Probl. Post. Nauk Roln. 2002, 489, 273–282.
WP£YW ZABIEGÓW AGROTECHNICZNYCH NA ZAWARTOŒÆ AZOTU OGÓLNEGO
I BIA£KOWEGO W BULWACH ZIEMNIAKA
Katedra Szczegó³owej Uprawy Roœlin, Akademia Podlaska w Siedlcach
Abstrakt: Badania przeprowadzono w latach 2002–2004 w Rolniczej Stacji Doœwiadczalnej Zawady.
Doœwiadczenie za³o¿ono na glebie kompleksu ¿ytniego bardzo dobrego w trzech powtórzeniach. Celem pracy
Effect of Agricultural Treatments on the Content of Total and Protein Nitrogen... 1069

by³o okreœlenie wp³ywu sposobów uprawy roli i sposobów odchwaszczania z zastosowaniem herbicydów na
zawartoœæ azotu ogólnego i bia³kowego w bulwach ziemniaka jadalnego. Chemiczne œrodki chwastobójcze
zastosowane w pielêgnacji ziemniaka znacznie zwiêksza³y zawartoœæ azotu ogólnego i bia³kowego w po-
równaniu do bulw z obiektu kontrolnego. Analiza statystyczna wykaza³a równie¿ znaczny wp³yw sposobów
uprawy roli i warunków meteorologicznych w latach prowadzenia badañ na omawiane cechy.
S³owa kluczowe: ziemniak, herbicydy, sposoby uprawy roli, azot ogólny, azot bia³kowy
1070 Krystyna Zarzecka et al

Varia

INVITATION FOR ECOPOLE ’09 CONFERENCE
CHEMICAL SUBSTANCES IN ENVIRONMENT
We have the honour to invite you to take part in the 18th annual Central European
Conference ECOpole ’09, which will be held in 14–17 X 2009 (Thursday–Saturday) on
Wilhelms Hill at Uroczysko in Piechowice, PL.
The Conference Programme includes oral presentations and posters and will be
divided into five sections:
– SI Chemical Pollution of Natural Environment and its Monitoring;
– SII Environment Friendly Production and Use of Energy;
– SIII Risk, Crisis and Security Management;
– SIV Forum of Young Scientists and Environmental Education;
– SV Impact of Environment Pollution on Food and Human Health.
On the first day the debates of sections SI and SII will take place. The second day
will be started with an ecological excursion. Afterwards the plenary Session with
lectures on environmental education as well as grants within the EU Programmes
and presentation of EU Centres of Excellence will be held. Then the Forum of Young
Scientists – the presentation (lectures and posters) of young scientists work will take
place.
The main topic of the third day is the influence of environment quality on the human
health.
During the Conference an exhibition of publications concerned with conference
topics will be also organised.
The Conference language is English.
Contributions to the Conference will be published as:
– abstracts on the CD-ROM (0.5 page of A4 paper sheet format)
– extended abstracts (4–6 pages) in the semi-annual Proceedings of ECOpole;
full papers will be published in successive issues of the Ecological Chemistry and
Engineering/Chemia i In¿ynieria Ekologiczna (Ecol. Chem. Eng.).
Additional information one could find on the Conference website:
ecopole.uni.opole.pl
The deadline for sending the Abstracts is 31.08.2009 and for the Extended Abstracts:
1.10.2009. The actualised list (and the Abstracts) of the Conference contributions
accepted for presentation by the Scientific Board, one will find (starting from
15.07.2009) on the Conference website.
The papers must be prepared according to the Guide for Authors on Submission of
Manuscripts to the Journal.
The Conference fee is 300 � (covering hotel, meals and transportation during the
Conference). It could be reduced (to 170 �) for young people actively participating in
the Forum of Young Scientists. But the colleague has to deliver earlier the Extended
Abstract (4-6 pages) of his/her contribution (deadline is on 15.08.2009), and a recom-
mendation of his/her Professor.
Fees transferred after 15.09.2009 are 10% higher.
At the Reception Desk each participant will obtain a CD-ROM with abstracts of the
Conference contributions as well as Conference Programme (the Programme will be
also published on the Conference website).
Further information is available from:
Dr hab. Maria Wac³awek, prof. UO
Chairperson of the Organising Committee
of ECOpole ’09 Conference
University of Opole
email: [email protected]
tel. +48 77 455 91 49 and +48 77 401 60 42
fax +48 77 401 60 51
1074 Varia
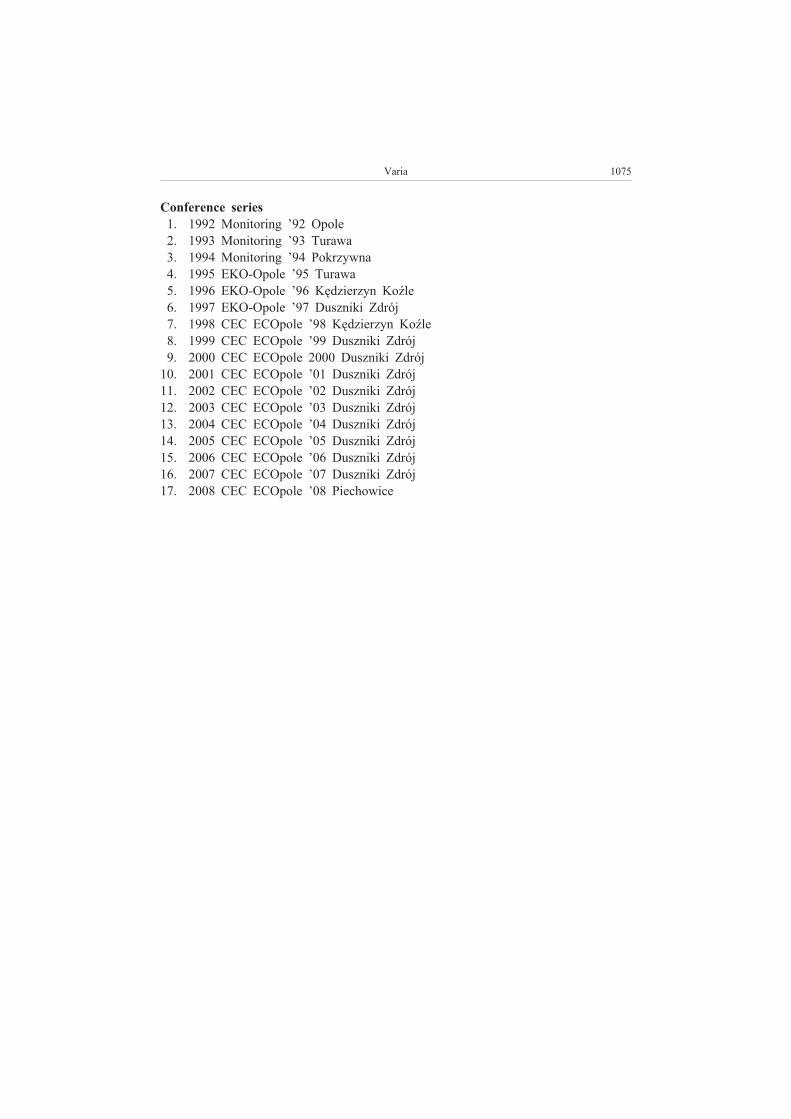
Conference series
1. 1992 Monitoring ’92 Opole
2. 1993 Monitoring ’93 Turawa
3. 1994 Monitoring ’94 Pokrzywna
4. 1995 EKO-Opole ’95 Turawa
5. 1996 EKO-Opole ’96 Kêdzierzyn KoŸle
6. 1997 EKO-Opole ’97 Duszniki Zdrój
7. 1998 CEC ECOpole ’98 Kêdzierzyn KoŸle
8. 1999 CEC ECOpole ’99 Duszniki Zdrój
9. 2000 CEC ECOpole 2000 Duszniki Zdrój
10. 2001 CEC ECOpole ’01 Duszniki Zdrój
11. 2002 CEC ECOpole ’02 Duszniki Zdrój
12. 2003 CEC ECOpole ’03 Duszniki Zdrój
13. 2004 CEC ECOpole ’04 Duszniki Zdrój
14. 2005 CEC ECOpole ’05 Duszniki Zdrój
15. 2006 CEC ECOpole ’06 Duszniki Zdrój
16. 2007 CEC ECOpole ’07 Duszniki Zdrój
17. 2008 CEC ECOpole ’08 Piechowice
Varia 1075
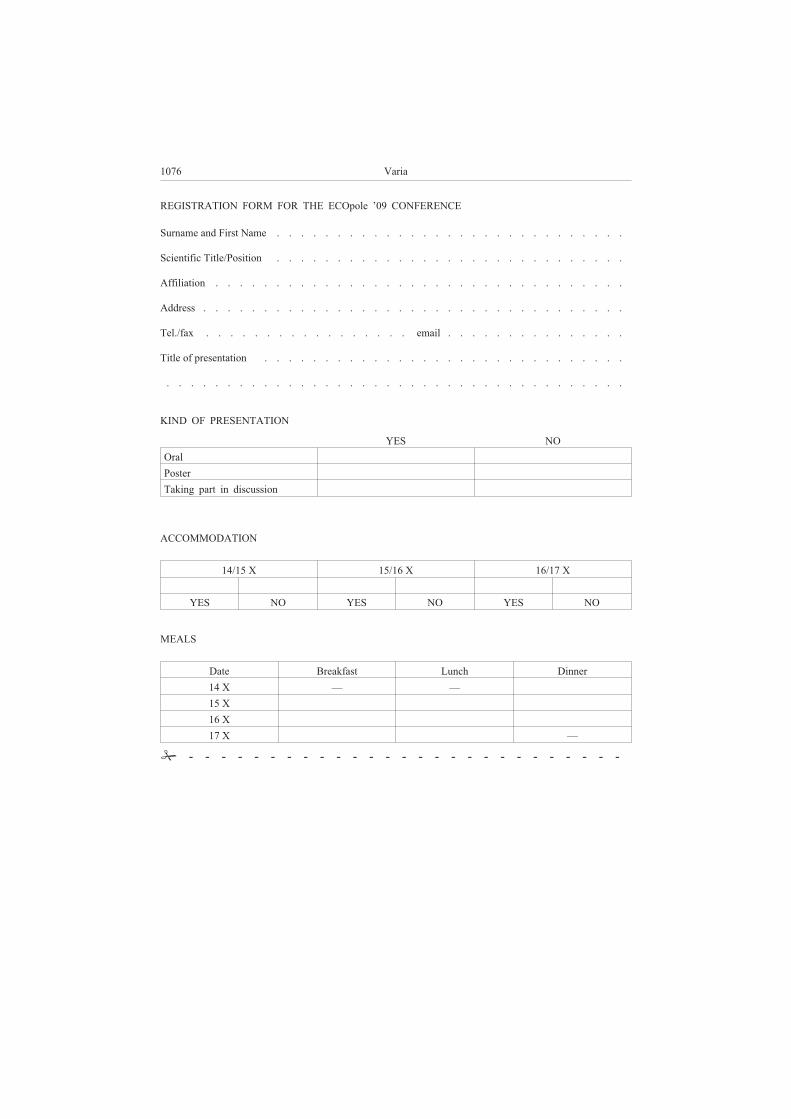
REGISTRATION FORM FOR THE ECOpole ’09 CONFERENCE
Surname and First Name . . . . . . . . . . . . . . . . . . . . . . . . . . . . .
Scientific Title/Position . . . . . . . . . . . . . . . . . . . . . . . . . . . . .
Affiliation . . . . . . . . . . . . . . . . . . . . . . . . . . . . . . . . . .
Address . . . . . . . . . . . . . . . . . . . . . . . . . . . . . . . . . . .
Tel./fax . . . . . . . . . . . . . . . . . email . . . . . . . . . . . . . . .
Title of presentation . . . . . . . . . . . . . . . . . . . . . . . . . . . . . .
. . . . . . . . . . . . . . . . . . . . . . . . . . . . . . . . . . . . . .
KIND OF PRESENTATION
YES NO
Oral
Poster
Taking part in discussion
ACCOMMODATION
14/15 X 15/16 X 16/17 X
YES NO YES NO YES NO
MEALS
Date Breakfast Lunch Dinner
14 X — —
15 X
16 X
17 X —
� - - - - - - - - - - - - - - - - - - - - - - - - - - -
1076 Varia
ZAPRASZAMY
DO UDZIA£U W ŒRODKOWOEUROPEJSKIEJ KONFERENCJI
ECOpole ’09
w dniach 14–17 X 2009
SUBSTANCJE CHEMICZNE
W ŒRODOWISKU PRZYRODNICZYM
Bêdzie to osiemnasta z rzêdu konferencja poœwiêcona badaniom podstawowym oraz
dzia³aniom praktycznym dotycz¹ca ró¿nych aspektów ochrony œrodowiska przyrodni-
czego. Odbêdzie siê ona w oœrodku „Uroczysko” na Wzgórzu Wilhelma w Piechowicach.
Doroczne konferencje ECOpole maj¹ charakter miêdzynarodowy i za takie s¹ uznane
przez Ministerstwo Nauki i Szkolnictwa Wy¿szego.
Obrady konferencji ECOpole ’09 bêd¹ zgrupowane w piêciu sekcjach:
– SI Chemiczne substancje w œrodowisku przyrodniczym oraz ich monitoring;
– SII Odnawialne Ÿród³a energii i jej oszczêdne pozyskiwanie oraz u¿ytkowanie;
– SIII Zarz¹dzanie œrodowiskiem w warunkach kryzysowych;
– SIV Forum M³odych (FM) i Edukacja proœrodowiskowa;
– SV Wp³yw zanieczyszczeñ œrodowiska oraz ¿ywnoœci na zdrowie ludzi.
Materia³y konferencyjne bêd¹ opublikowane w postaci:
– abstraktów (0,5 strony formatu A4) na CD-ROM-ie;
– rozszerzonych streszczeñ o objêtoœci 4-6 stron w pó³roczniku Proceedings of
ECOpole;
– artyku³ów: w abstraktowanych czasopismach: Ecological Chemistry and Engineer-
ing/Chemia i In¿ynieria Ekologiczna (Ecol. Chem. Eng.) oraz niektórych w pó³rocz-
niku Chemia – Dydaktyka – Ekologia – Metrologia.
Termin nadsy³ania angielskiego i polskiego streszczenia o objêtoœci 0,5–1,0 stro-
ny (wersja cyfrowa + wydruk) planowanych wyst¹pieñ up³ywa w dniu 31 sierpnia
2009 r. Lista prac zakwalifikowanych przez Radê Naukow¹ Konferencji do prezentacji
bêdzie sukcesywnie publikowana od 15 lipca 2009 r. na stronie webowej konferencji
ecopole.uni.opole.pl
Aby praca (dotyczy to tak¿e streszczenia, które powinno mieæ tytu³ w jêzyku polskim
i angielskim, s³owa kluczowe w obydwu jêzykach) przedstawiona w czasie konferencji
mog³a byæ opublikowana, jej tekst winien byæ przygotowany zgodnie z wymaganiami
stawianymi artyku³om drukowanym w czasopiœmie Ecological Chemistry and Engine-
ering, które jest dostêpne w wielu bibliotekach naukowych w Polsce i zagranic¹. S¹ one
takie same dla prac drukowanych w pó³roczniku Chemia – Dydaktyka – Ekologia – Me-
trologia. Zalecenia te s¹ równie¿ umieszczone na stronie webowej konferencji.
Koszt uczestnictwa w ca³ej konferencji wynosi 1000 z³ i pokrywa op³atê za udzia³,
koszt noclegów i wy¿ywienia oraz rocznej prenumeraty Ecol. Chem. Eng. (razem blisko
2000 ss.) ³¹cznie z materia³ami Konferencji. Jest mo¿liwoœæ udzia³u tylko w jednym
wybranym przez siebie dniu, wówczas op³ata wyniesie 650 z³ i bêdzie upowa¿nia³a do
uzyskania wszystkich materia³ów konferencyjnych, jednego noclegu i trzech posi³ków
(œniadanie, obiad, kolacja), natomiast osoby zainteresowane udzia³em w dwóch dniach,
tj. w pierwszym i drugim lub drugim i trzecim, winny wnieœæ op³atê w wysokoœci
800 z³. Op³ata dla magistrantów i doktorantów oraz m³odych doktorów bior¹cych aktyw-
ny udzia³ w Forum M³odych mo¿e byæ zmniejszona do 600 z³, przy zachowaniu takich
samych œwiadczeñ. Osoby te winny dodatkowo dostarczyæ: rozszerzone streszczenia
(4–6 stron) swoich wyst¹pieñ (do 15.08.2009 r.). Jest tak¿e wymagana opinia opiekuna
naukowego. Sprawy te bêd¹ rozpatrywane indywidualnie przez Radê Naukow¹ oraz
Komitet Organizacyjny Konferencji. Cz³onkowie Towarzystwa Chemii i In¿ynierii
Ekologicznej i Polskiego Towarzystwa Chemicznego (z op³aconymi na bie¿¹co sk³ad-
kami) maj¹ prawo do obni¿onej op³aty konferencyjnej o 25 z³. Op³aty wnoszone po
dniu 15 wrzeœnia 2009 r. s¹ wiêksze o 10% od kwot podanych powy¿ej. Wszystkie
wp³aty winne byæ dokonane na konto w Banku Œl¹skim:
BSK O/Opole Nr 65 1050 1504 1000 0005 0044 3825
i mieæ dopisek ECOpole ’09 oraz nazwisko uczestnika konferencji.
Po konferencji zostan¹ wydane 4–6-stronicowe rozszerzone streszczenia wyst¹pieñ
w pó³roczniku Proceedings of ECOpole. Artyku³y te winny byæ przes³ane do 1 paŸ-
dziernika 2009 r. Wszystkie nadsy³ane prace podlegaj¹ zwyk³ej procedurze recenzyj-
nej. Wszystkie streszczenia oraz program Konferencji zostan¹ wydane na CD-ROM-ie,
który otrzyma ka¿dy z uczestników podczas rejestracji. Program bêdzie tak¿e umiesz-
czony na stronie webowej konferencji.
Za Komitet Organizacyjny
dr hab. in¿. Maria Wac³awek, prof. UO
Wszelkie uwagi i zapytania mo¿na kierowaæ na adres:
tel. 077 401 60 42
tel. 077 455 91 49
fax 077 401 60 51
1078 Varia
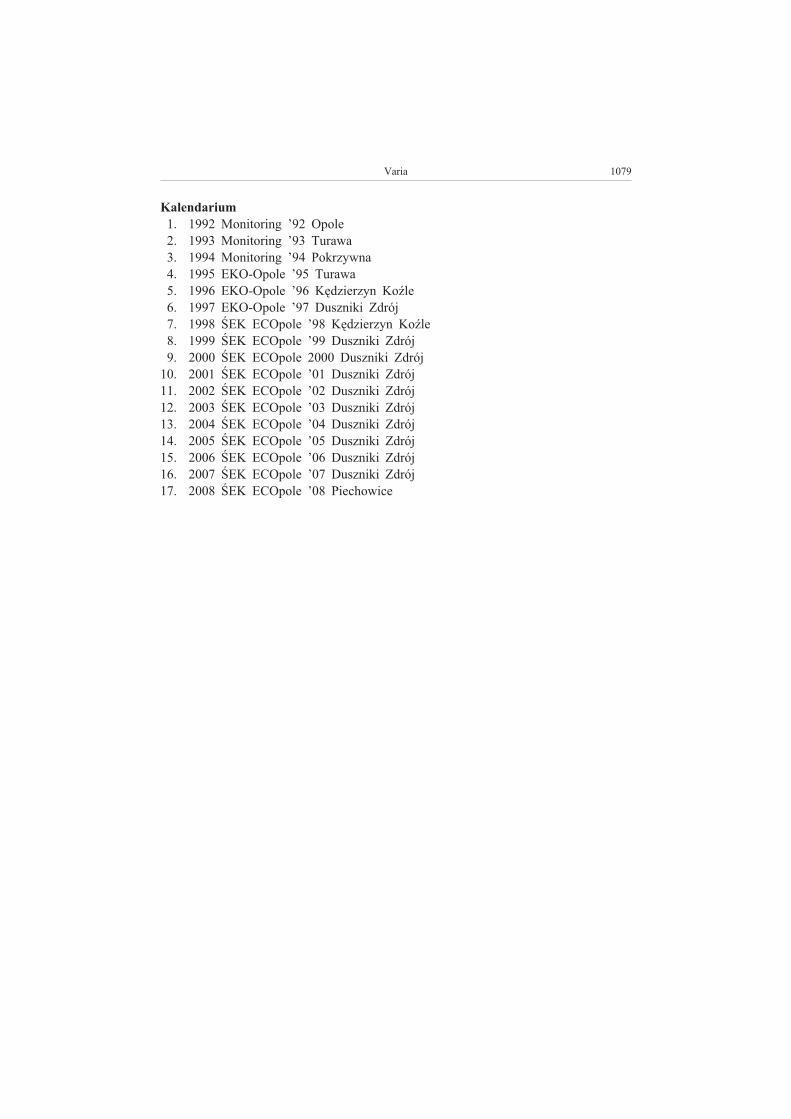
Kalendarium
1. 1992 Monitoring ’92 Opole
2. 1993 Monitoring ’93 Turawa
3. 1994 Monitoring ’94 Pokrzywna
4. 1995 EKO-Opole ’95 Turawa
5. 1996 EKO-Opole ’96 Kêdzierzyn KoŸle
6. 1997 EKO-Opole ’97 Duszniki Zdrój
7. 1998 ŒEK ECOpole ’98 Kêdzierzyn KoŸle
8. 1999 ŒEK ECOpole ’99 Duszniki Zdrój
9. 2000 ŒEK ECOpole 2000 Duszniki Zdrój
10. 2001 ŒEK ECOpole ’01 Duszniki Zdrój
11. 2002 ŒEK ECOpole ’02 Duszniki Zdrój
12. 2003 ŒEK ECOpole ’03 Duszniki Zdrój
13. 2004 ŒEK ECOpole ’04 Duszniki Zdrój
14. 2005 ŒEK ECOpole ’05 Duszniki Zdrój
15. 2006 ŒEK ECOpole ’06 Duszniki Zdrój
16. 2007 ŒEK ECOpole ’07 Duszniki Zdrój
17. 2008 ŒEK ECOpole ’08 Piechowice
Varia 1079
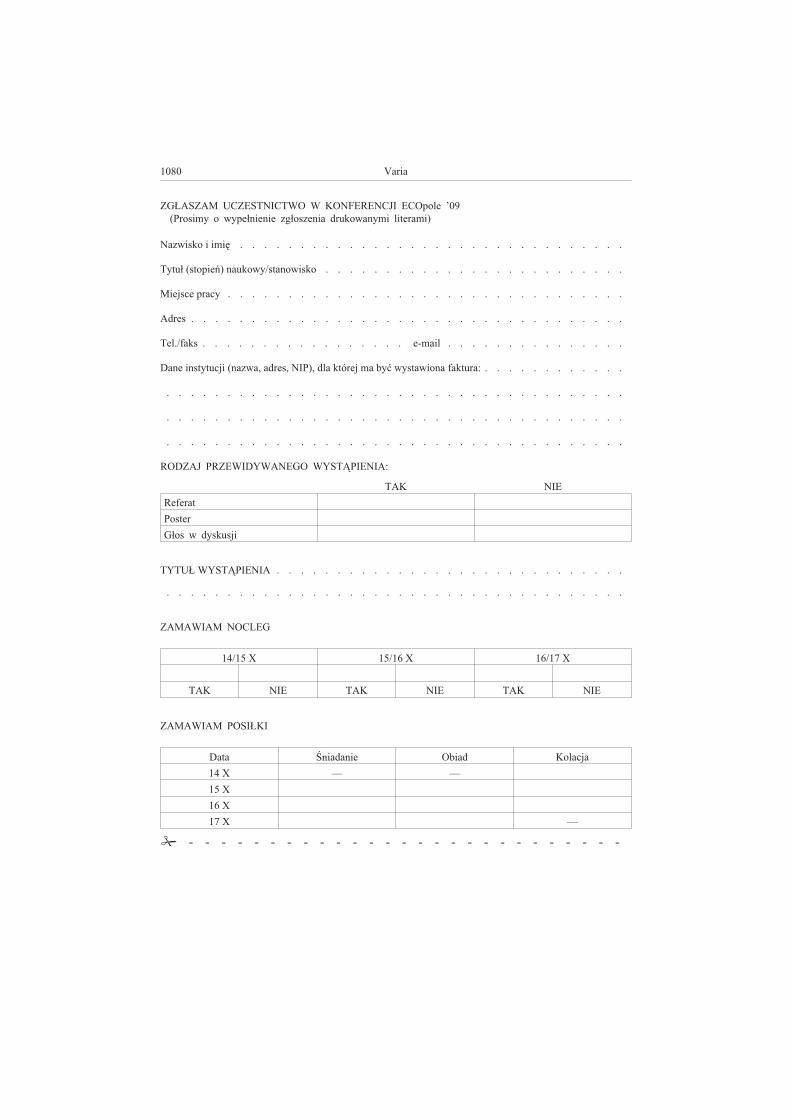
ZG£ASZAM UCZESTNICTWO W KONFERENCJI ECOpole ’09
(Prosimy o wype³nienie zg³oszenia drukowanymi literami)
Nazwisko i imiê . . . . . . . . . . . . . . . . . . . . . . . . . . . . . . . .
Tytu³ (stopieñ) naukowy/stanowisko . . . . . . . . . . . . . . . . . . . . . . . . .
Miejsce pracy . . . . . . . . . . . . . . . . . . . . . . . . . . . . . . . . .
Adres . . . . . . . . . . . . . . . . . . . . . . . . . . . . . . . . . . . .
Tel./faks . . . . . . . . . . . . . . . . . e-mail . . . . . . . . . . . . . . .
Dane instytucji (nazwa, adres, NIP), dla której ma byæ wystawiona faktura: . . . . . . . . . . . .
. . . . . . . . . . . . . . . . . . . . . . . . . . . . . . . . . . . . . .
. . . . . . . . . . . . . . . . . . . . . . . . . . . . . . . . . . . . . .
. . . . . . . . . . . . . . . . . . . . . . . . . . . . . . . . . . . . . .
RODZAJ PRZEWIDYWANEGO WYST¥PIENIA:
TAK NIE
Referat
Poster
G³os w dyskusji
TYTU£ WYST¥PIENIA . . . . . . . . . . . . . . . . . . . . . . . . . . . . .
. . . . . . . . . . . . . . . . . . . . . . . . . . . . . . . . . . . . . .
ZAMAWIAM NOCLEG
14/15 X 15/16 X 16/17 X
TAK NIE TAK NIE TAK NIE
ZAMAWIAM POSI£KI
Data Œniadanie Obiad Kolacja
14 X — —
15 X
16 X
17 X —
� - - - - - - - - - - - - - - - - - - - - - - - - - - -
1080 Varia
15th
International Conference on Heavy Metals
in the Environment
September 19–23, 2010
Gdañsk, Poland
Organized by
Chemical Faculty, Gdañsk University of Technology (GUT)
together with
Committee on Analytical Chemistry of the Polish Academy Sciences (PAS)
15th
ICHMET – is a continuation of a series of highly successful conferences that
have been held in major cities of the world since 1975. These conferences typically
draw 500–1000 participants from countries in many parts of the world. Well over 5000
scientists have taken part in this series of conferences including most leaders in the
field. Apart from the city’s natural beauty, Gdansk is logical choice for the 15th
Conference to highlight the outstanding work that is being done on heavy metals in
central Europe. The venue for the meeting will be the Gdansk University of Technology
(GUT) which features many tourist attractions.
The Conference will include a number of invited lectures treating frontier topics
prepared by specialist with international reputation, oral presentation and poster
sessions. ICHMET welcomes contributions on all aspects of any heavy metal in the
environment. All presentation will be connected with such topics as:
– Risk assessment and risk management pertaining to toxic metals in the environ-
ment
– Susceptibility and protection of children from toxic metals in their environment
– Measurement and exposure assessment
– Biomarkers of exposure and effects of heavy metals
– Gene-environment-metal interactions
– Trend tracking/analysis of heavy metal data – spatial and temporal
– Risk communication pertaining to heavy metals
– Life cycle analysis for metalliferous consumer products
– Soil quality criteria
– Remediation technologies
– Control strategies for heavy metal emissions and deposition
– Metal mixtures – mechanistic and epidemiological studies
– Nutrient-metal interactions
– Advancements in analytical tools (procedures and measurement devices)
15 ICHMETth
– Toxicology of heavy metals, from cellular and genomic to ecosystem levels
– Heavy metals in foods
– Impact of global change on heavy metal cycle
For further information on the conference, please contact:
Professor Jacek Namieœnik (Conference Chairman)
Gdansk University of Technology,
Chemical Faculty, Department of Analytical Chemistry
G. Narutowicza 11/12, 80–233 Gdansk, (Poland),
e-mail: [email protected]
homepage: http://www.pg.gda.pl/chem/ichmet/
1082 Varia
GUIDE FOR AUTHORS
ON SUBMISSION OF MANUSCRIPTS
A digital version of the Manuscript addressed –
Professor Witold Wac³awek
Editorial Office of monthly Ecological Chemistry and Engineering
(Ecol. Chem. Eng.)
Uniwersytet Opolski
ul. Oleska 48, 45–951 Opole, Poland
Tel. +48 77 452 71 34, fax +48 77 455 91 49,
Email – [email protected]
should be sent by email to the Editorial Office Secretariat – [email protected]
The Editor assumes, that an author submitting a paper for publication has been autho-
rised to do that. It is understood the paper submitted to be original and unpublished
work, and is not being considered for publication by another journal. After printing, the
copyright of the paper is transferred to Towarzystwo Chemii i In¿ynierii Ekologicznej
(Society for Ecological Chemistry and Engineering). In preparation of the manuscript
please follow the general outline of papers published in the most recent issues of Ecol.
Chem. Eng., a sample copy can be sent, if requested.
Papers submitted are supposed to be written in English language and should include
a summary and keywords, if possible also in Polish language. If not then the Polish
summary and keywords will be provided by the Editorial Office. All authors are re-
quested to inform of their current addresses, phone and fax numbers and their email
addresses.
It is urged to follow the units recommended by the Systéme Internationale d’Unites
(SI). Graph axis labels and table captions must include the quantity units. The use of the
following commonly applied expressions is recommended: mass – m/kg, time – t/s or
t/min, current intensity – I/A; thermodynamic temperature – T/K, Celsius scale tempera-
ture – t/°C or �/°C (if both time and Celsius scale units need to be used, the symbol
�/°C for temperature is to be taken) etc.
Symbols recommended by the International Union of Pure and Applied Chemistry
(Pure and Appl. Chem., 1979, 51, 1–41) are to be followed.
Graphics (drawings, plots) should also be supplied in the form of digital vector –
type files, e.g. Corel-Draw, Grapher for Windows or at least in a bitmap format
(TIF, PCK, BMP). In the case of any query please feel free to contact with the Editorial
Office.
Footnotes, tables and graphs should be prepared as separate files.
References cited chronologically should follow the examples given below:
[l] Kowalski J. and Malinowski A.: Polish J. Chem. 1990, 40(3), 2080–2085.
[2] Nowak S: Chemia nieorganiczna, WNT, Warszawa 1990.
[3] Bruns I., Sutter K., Neumann D. and Krauss G.-J.: Glutathione accumulation –
a specific response of mosses to heavy metal stress, [in:] Sulfur Nutrition and Sulfur
Assimilation in Higher Plants, P. Haupt (ed.), Bern, Switzerland 2000, 389–391.
Journal titles should preferably follow the Chem. Abst. Service recommended abbre-
viations.
Receipt of a paper submitted for publication will be acknowledged by email. If no
acknowledgement has been received, please check it with the Editorial Office by email,
fax, letter or phone.
1084 Varia
ZALECENIA DOTYCZ¥CE PRZYGOTOWANIA
MANUSKRYPTÓW
Praca przeznaczona do druku w miesiêczniku Ecological Chemistry and Engineering
A/Chemia i In¿ynieria Ekologiczna A powinna byæ przes³ana na adres Redakcji:
Profesor Witold Wac³awek
Redakcja Ecological Chemistry and Engineering
Uniwersytet Opolski
ul. Oleska 48, 45–951 Opole
tel. 077 401 60 42, fax 077 455 91 49
email: [email protected]
w postaci cyfrowej w formacie Microsoft Word (ver. 7.0 dla Windows) emailem
([email protected]) lub na dyskietce.
Redakcja przyjmuje, ¿e przesy³aj¹c artyku³ do druku autor w ten sposób oœwiadcza,
¿e jest upowa¿niony do tego oraz zapewnia, ¿e artyku³ ten jest oryginalny i nie by³
wczeœniej drukowany gdzie indziej i nie jest wys³any do druku gdzie indziej oraz, ¿e po
jego wydrukowaniu copyright do tego artyku³u uzyskuje Towarzystwo Chemii i In¿y-
nierii Ekologicznej.
W przygotowaniu manuskryptu nale¿y przede wszystkim wzorowaæ siê na postaci
najnowszych artyku³ów opublikowanych w Ecological Chemistry and Engineering, na
przyk³ad zamieszczanych na stronie webowej Towarzystwa: http://tchie.uni.opole.pl/
tchie/index.php?option=content&pcontent=1&task=view&id=49&Itemid=76
Prace przesy³ane do publikacji winny byæ napisane w jêzyku angielskim oraz zaopa-
trzone w streszczenia oraz s³owa kluczowe w jêzyku angielskim oraz polskim.
Zalecamy, a¿eby artyku³ zawiera³ adresy i emaile oraz numery telefonów i faksów
wszystkich autorów danej pracy, szczególnie g³ównego autora, którego nazwisko wy-
ró¿niamy gwiazdk¹.
Usilnie prosimy o stosowanie uk³adu jednostek SI. Zwracamy uwagê, ¿e osie wykre-
sów oraz g³ówki tabel powinny bezwzglêdnie zawieraæ jednostki stosownej wielkoœci.
Polecamy symbolikê zalecan¹ przez PTChem (Symbole i terminologia wielkoœci i jed-
nostek stosowanych w chemii fizycznej, Ossolineum, Wroc³aw 1989; Pure Appl. Chem.
1979, 51, 1–41). Materia³ graficzny (rysunki, wykresy), obok wersji na papierze, powi-
nien równie¿ byæ dostarczony w postaci cyfrowych plików wektorowych, np. za po-
moc¹ programu: CorelDraw wersja 3.0–8.0, Grafer dla Windows lub przynajmniej bito-
we (TIF, PCX, BMP). W przypadku trudnoœci z wype³nieniem tego warunku Redakcja
zapewnia odp³atne wykonanie materia³u graficznego na podstawie dostarczonego szki-
cu, bli¿sze informacje mo¿na uzyskaæ telefonicznie 077 401 60 42.
Przypisy i tabele podobnie jak rysunki zapisujemy jako osobne pliki.
Literaturê prosimy zamieszczaæ wg poni¿szych przyk³adów:
[1] Kowalski J. and Malinowski A.: Polish J. Chem. 1990, 40, 2080–2085.
[2] Nowak S.: Chemia nieorganiczna, WNT, Warszawa 1990.
[3] Bruns I., Sutter K., Neumann D. and Krauss G.-J.: Glutathione accumulation –
a specific response of mosses to heavy metal stress, [in:] Sulfur Nutrition and Sulfur
Assimilation in Higher Plants, P. Haupt (ed.), Bern, Switzerland 2000, 389–391.
Tytu³y czasopism nale¿y skracaæ zgodnie z zasadami przyjêtymi przez amerykañsk¹
Chemical Abstracts Service. Autor mo¿e, je¿eli uwa¿a to za wskazane, podawaæ te¿
tytu³ cytowanych artyku³ów z czasopism, który bêdzie sk³adany kursyw¹ oraz numer
zeszytu danego woluminu (w nawiasie, po numerze woluminu).
Redakcja potwierdza emailem otrzymanie artyku³u do druku. W przypadku braku
potwierdzenia prosimy o interwencjê: emailem, faksem, listem lub telefonicznie.
1086 Varia
REDAKTOR TECHNICZNY
Halina Szczegot
SK£AD KOMPUTEROWY
Jolanta Brodziak
PROJEKT OK£ADKI
Marian Wojewoda
Druk: „Drukarnia Smolarski”, Józef Smolarski, 45–326 Opole, ul. Sandomierska 1. Objêtoœæ: ark. wyd. 15,00,
ark. druk. 12,50.